
the Creative Commons Attribution 4.0 License.
the Creative Commons Attribution 4.0 License.
 | 29 May 2026
The impact of essential climate variables on respiration rates in subpolar and polar planktonic foraminifera
Diane V. Armitage
Nicolaas Glock
Thomas L. Weiss
Mohamed M. Ezat
Adele Westgård
Freya E. Sykes
Julie Meilland
Elwyn de la Vega
Alessio Fabbrini
Tali L. Babila
Audrey Morley
This study investigates the impact of Essential Climate Variables (ECVs) on the respiration rate of polar planktonic foraminifera Neogloboquadrina pachyderma and subpolar Turborotalita quinqueloba and Neogloboquadrina incompta to advance our understanding of foraminifera physiology and geochemical proxy interpretation for species living in understudied subpolar and polar environments. Respiration rates were measured on a total of 158 specimens collected during two field campaigns to the Nordic Seas. To size-normalise respiration rates, we measured cavity volume and maximum diameter using x-ray microcomputed tomography (micro-CT) ( = (0.56 (max Ø) − 0.38)). Our results show that the physiological response of foraminifera sharing overlapping environments is diverse, with N. pachyderma exhibiting remarkable stability over large gradients in temperature, salinity, carbonate chemistry, dissolved oxygen and nutrients. Conversely, N. incompta and T. quinqueloba have a much stronger thermal response. The difference between species is best described by their respective Q10 (the factor by which the rate of respiration changes with a 10 °C increase in temperature) values of 1.48 for N. pachyderma and 3.69 and 4.43 for N. incompta and T. quinqueloba, respectively. We also find a significant relationship between biovolume and respiration rate when rates are normalized to 4 °C (log10 Rbiovolume=0.40 (log10 biovolume) − 0.80)) for all three species analysed here, which is consistent with marine protists globally. We conclude that respiration is unlikely to influence geochemical proxies and therefore past climate reconstructions derived from N. pachyderma, however, this may not apply to N. incompta and T. quinqueloba.
- Article
(7387 KB) - Full-text XML
-
Supplement
(804 KB) - BibTeX
- EndNote


Planktonic foraminifera are relatively eurythermal and inhabit a wide range of temperatures and environments while maintaining species-specific temperature preferences (Chaabane et al., 2024). Accordingly, many species can be found across large temperature gradients exceeding 10 °C, and yet, studies focussing on temperate and tropical species have found a strong influence of temperature and cell volume on respiration and growth rate indicating a strong influence of changing environments on foraminifera physiology (Rink et al., 1998; Lombard et al., 2009; Burke et al., 2025). However, little is known about how subpolar and polar planktonic foraminifera respiration responds to temperatures below 10 °C and other Essential Climate Variables (ECVs) such as salinity, carbonate chemistry, and nutrients. Specifically, there are no observations of the physiological processes underlying the growth and response of these species to environmental stressors such as modern Polar Amplification (the faster warming of the high latitudes relative to the global mean) (Serreze and Barry, 2011; Rantanen et al., 2022). Critically, this gap in our knowledge limits our understanding of how foraminifera will adapt to rapid environmental change and our ability to predict the future resilience of these ecosystems.
Respiration also significantly influences foraminiferal test chemistry by modifying the seawater chemistry in the microenvironment surrounding the test (Schiebel and Hemleben, 2017). For example, increased respiration has been shown to alter carbon isotope (δ13C) values (used in reconstructing past changes in water mass properties or productivity) (Spero and Lea, 1993, 1996) and ratios (for inferring past sea surface or bottom water temperatures) (Rink et al., 1998; Köhler-Rink and Kühl, 2001; Eggins et al., 2004). Respiration influences these proxies because O2 consumption lowers the pH in the diffusive boundary layer, which in turn alters the carbonate chemistry transported to the site of calcification (Wolf-Gladrow et al., 1999; de Nooijer et al., 2014). This raises concerns about non-thermal factors that may alter foraminiferal geochemistry and affect the reliability of temperature reconstructions. Investigating how respiration in polar and subpolar species responds to temperature and other ECVs is thus key to evaluating whether such physiological processes may introduce uncertainties into geochemical proxies recorded in their tests.
Within the polar oceans, Neogloboquadrina pachyderma is the dominant planktonic foraminifera species (Al-Sabouni et al., 2007; Husum and Hald, 2012; Chaabane et al., 2024), making up more than 90 % of the total assemblages in waters < 4 °C (Spindler, 1996; Greco et al., 2019; Bertlich et al., 2021) and up to 23 % of the calcium carbonate CaCO3 flux to the sediments north of 50° (Tell et al., 2022). Neogloboquadrina pachyderma maintains a unique adaptation to these extremely cold and diverse environments including low temperatures (−2 to + 12 °C) and large gradients in salinity (∼ 30–35 psu) including brine channels with salinities of up to 80 psu, and pH (7.8–8.8) (e.g., Spindler and Dieckmann, 1986; Manno et al., 2012; Bertlich et al., 2021; Zamelczyk et al., 2021; Westgård et al., 2023). The closely related foraminiferal species Neogloboquadrina incompta typically inhabits subpolar surface waters (relative abundance > 50 %) where sea surface temperatures (SSTs) range between 10 and 18 °C. The largest abundances of N. incompta occur at salinities ranging between 31 and 35 psu (Greco et al., 2020). Turborotalita quinqueloba is most abundant in subpolar waters of the West Spitzbergen Current (Volkmann, 2000) and the Barents Sea with recent studies in that area reporting maximum relative abundances of 26 % (Meilland et al., 2020; Anglada-Ortiz et al., 2025). Its maximum abundance occurs at a salinity of 35 psu (Natland, 1938). T. quinqueloba is typically associated with mid to high latitude ecosystems at temperatures between 1 and 21 °C but predominates at temperatures colder than 12 °C (Bé and Tolderlund, 1971), however, it has been found on the Great Barrier Reef and in the Arabian Sea at temperatures as high as 29.5 °C (Darling et al., 2000; Seears et al., 2012).
The objective of this study is to measure the respiration rates of polar (N. pachyderma) and sub-polar (N. incompta and T. quinqueloba) foraminifera to assess the relationship between respiration and ECVs (e.g., temperature, salinity, pH, dissolved oxygen, alkalinity, and the saturation state of calcite in seawater (ΩCa), including nutrients (Silicate (SiO2), Dissolved Inorganic Carbon (DIC), Phosphate (PO), and Total Organic Nitrogen (TON)) for these species. This will allow us to test the hypothesis that temperature has a direct effect on respiration rates as observed in temperate and tropical species (Lombard et al., 2009). Similarly, we will test the physiological dependence of external pH and carbonate chemistry on respiration rates in non-spinose planktonic foraminifera species, which is hypothesized to be reduced due to higher energy requirements of calcification under low pH conditions (Davis et al., 2017). Although earlier research on nutrients such as PO and SiO2 found they are not directly utilised by foraminifera, with their primary effects instead arising through impacts on primary productivity (Schiebel et al., 2001), more recent research on benthic foraminifera has found that PO can be accumulated for energy metabolism, pH regulation, and osmoregulation (Glock et al., 2020, 2025), a capacity that may likewise occur in planktonic foraminifera. Including these variables therefore allows us to explore potential indirect effects and assess whether environmental variability contributes to physiological stress or metabolic shifts which could be demonstrated through changes in respiration. The results will allow us to assess the importance of respiration for polar and subpolar planktonic foraminifera and thereby further our understanding on their ability to adapt to rapid environmental change. In addition, our results will allow us to review the importance and implications of respiration for geochemical proxies measured in these three species.
Determining the response of respiration to temperature requires accurate measurements of individual foraminiferal respiration under controlled settings. Recent advancements in micro-sensor periphery technology, particularly the nano-respiration and rosette methodology developed by Unisense (Lopes et al., 2005; Nielsen et al., 2007), have significantly improved the reproducibility required to detect extremely low respiration rates encountered in smaller sized planktonic foraminifera species e.g. <200 µm living in polar and subpolar environments. The automated rosette allows for more repetition due to faster analysis time compared to traditional manual profiling and enhanced throughput which minimises stress on specimens during experimentation. In addition, the precise determination of internal foraminiferal biovolume is required for size normalisation, since cell size may correlate positively with respiration as in both benthic (Hannah et al., 1994; Geslin et al., 2011) and other planktonic foraminifera (Burke et al., 2025). Methods for accurately estimating biovolume vary in the literature, often relying on geometric approximations (e.g. Hannah et al., 1994; Cesbron et al., 2016; Geslin et al., 2011; Maciute et al., 2023), however, the use of high-resolution micro-CT scanning (Burke et al., 2020) provides a more accurate means to assess internal volume and will enable us to refine the metabolic relationships between size and respiration rate.
2.1 Sample collection and processing
Living specimens of N. pachyderma, N. incompta, and T. quinqueloba analysed in this study were obtained during two oceanographic cruises on the RV Celtic Explorer in July/August 2023 (CE23011) and on the RV Helmer Hansen (ARCLIM-24-1) in June 2024 (Table 1 and Fig. 1). Plankton samples were collected using 100 µm vertical-closing HydroBios multinets and 63 µm vertical-closing WP2 nets, respectively. Seawater samples were collected with Niskin bottles attached to a CTD profiler and filtered using a vacuum pump with 0.2 µm Whatmann filters Type G/C and refrigerated. Live foraminifera were picked directly from the plankton net samples and transferred into a petri dish for an initial bath to remove debris and algae attached to the foraminifera. For the first set of experiments in 2023, a small brush and a dissecting microscope were used to select and transfer living specimens into culture wells (CE23011), placed in an incubator set to the towed environment of the samples, and allowed to rest for at least 12 h and no longer than 24 h before respiration rate measurements were performed on board (CE23011). Foraminifera were not fed prior to respiration measurements to be consistent with common practice on similar planktonic foraminifera respiration studies (Davis et al., 2017; Rink et al., 1998; Burke et al., 2025; Lombard et al., 2009).
For the second set of experiments performed in 2024, all collected specimens were transferred from the initial bath into 75 mL culture bottles and placed into a cold room set at 8 °C during the cruise. After the initial 24 h resting period, the foraminifera were fed 40 µL of a live diatom solution, a self-replicating food source. Subsequently, culture bottles were transferred into incubators set at experimental temperatures of 2, 5, 8 and 13 °C for at least 48 h before flux measurements were performed in the Culturing Laboratory at UiT, The Arctic University of Norway. An additional feeding of algae (Nannochloropsis sp.) took place 7 d after sampling. All experiments in 2024 were carried out within 11 d of sampling.
Table 1Metadata, ecological and carbonate chemistry data for analysed samples. “NA” indicates no data collected at these stations.
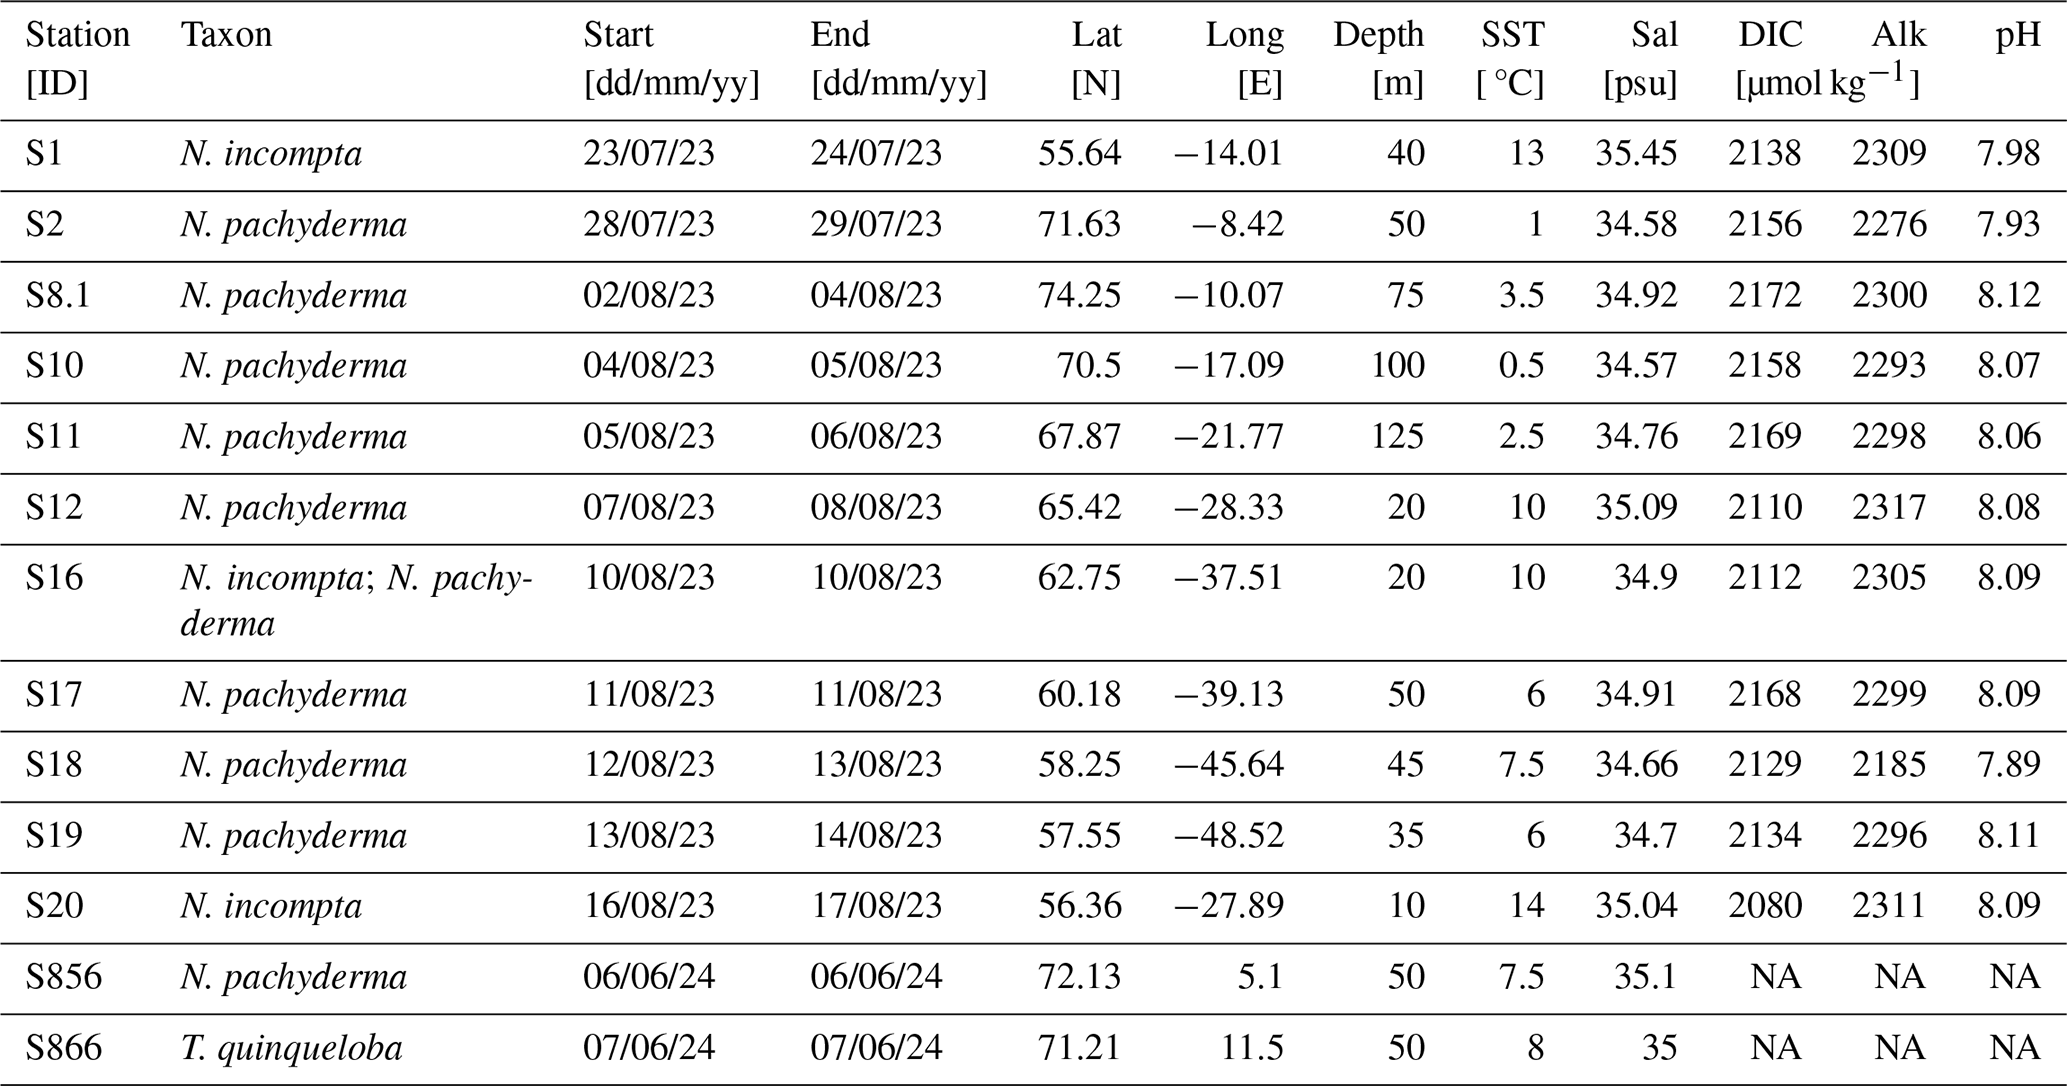
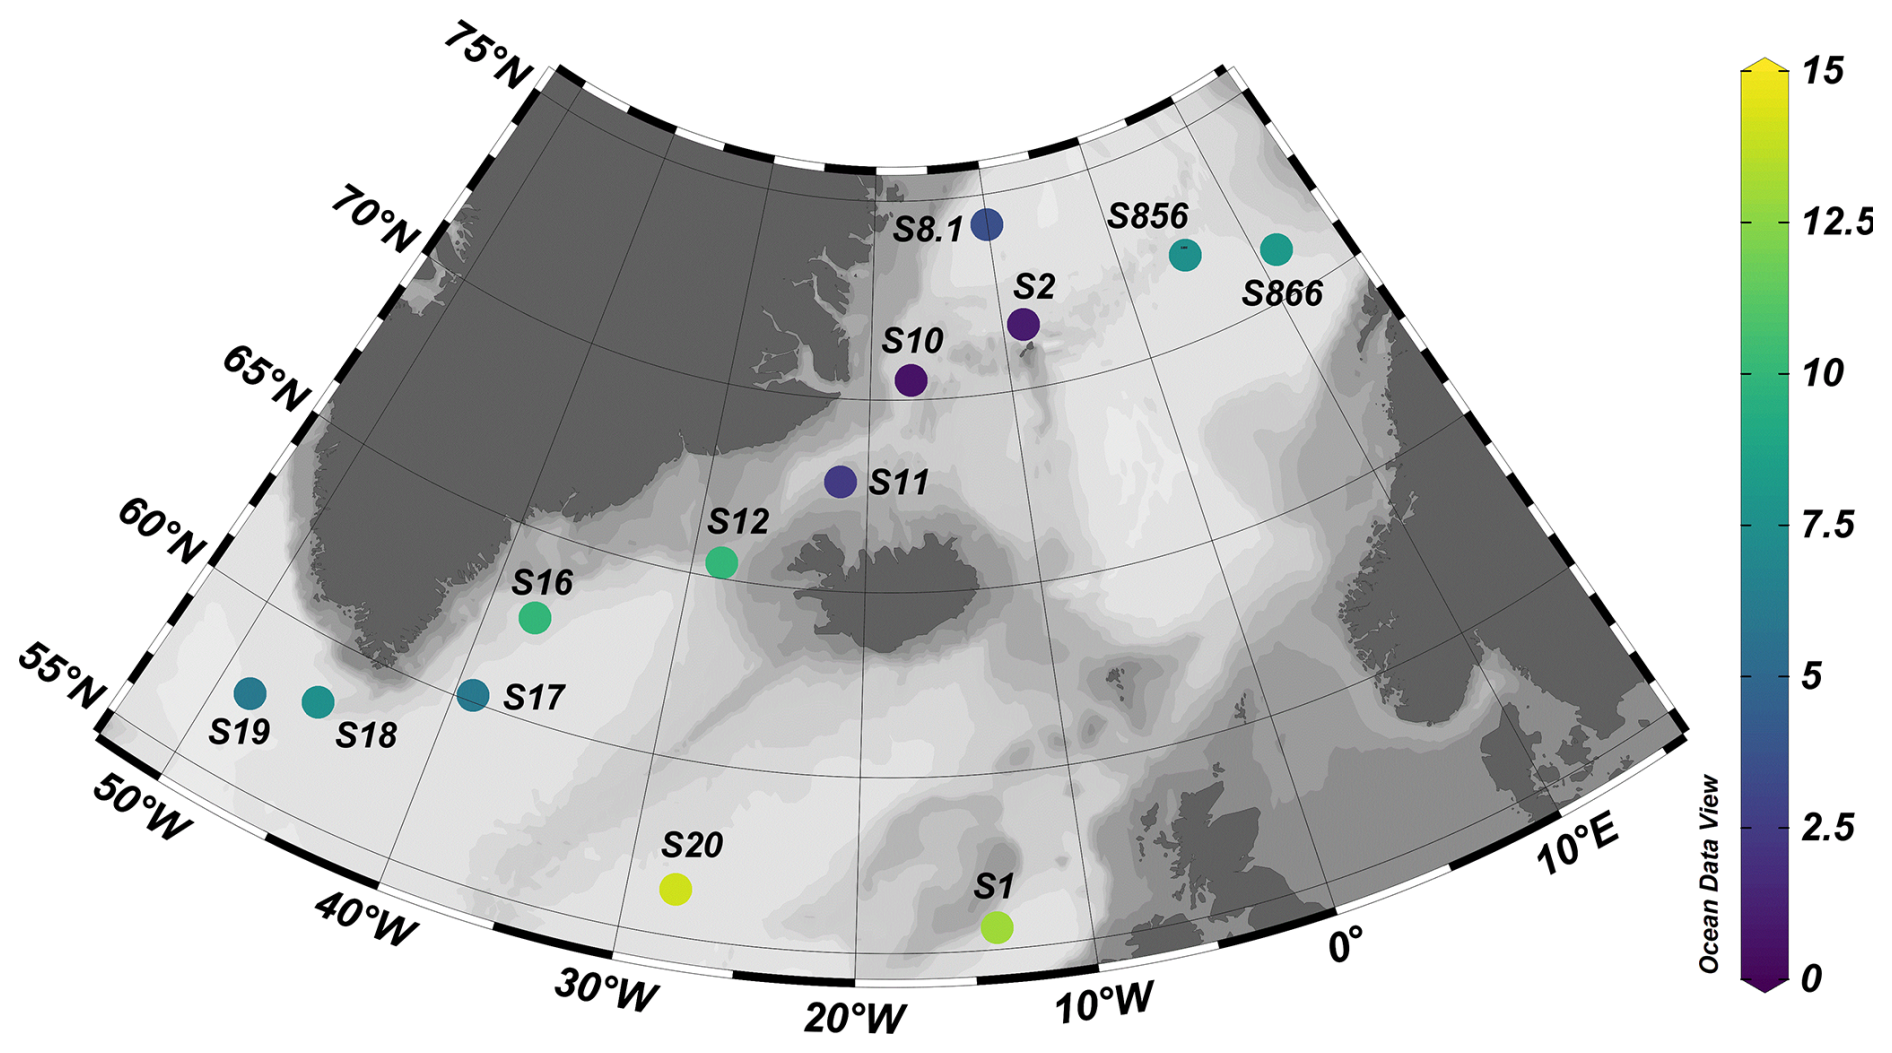
Figure 1Image showing the station locations for cruise CE23011 on the RV Celtic Explorer (2023). Stations S856 and S866 are the sampling sites for ARCLIM-24-1 cruise on the RV Helmer Hansen (2024). Map created using ODV (Schlitzer, 2022). Site symbol colour represents the ocean temperature at the tow depth of the sample site.
2.2 Carbonate Chemistry
Total alkalinity of seawater samples was determined onboard cruise CE23011 using an Apollo SciTech AS-ALK3 Total Alkalinity Titrator. This instrument operates on the principle of Gran titration, whereby approximately 0.1 M hydrochloric acid is incrementally added to 20 mL aliquots of seawater maintained at 20 °C. The resulting titration curve is used to construct a Gran function from which total alkalinity is calculated. The pH measurements were conducted using an Orion 8302BNUMD Ross Ultra pH/ATC Triode probe, which was calibrated daily using Thermo Scientific buffer solutions at pH 4.01, 7.00, and 10.01. The concentration of the titrant (HCl) was standardised by titrating Certified Reference Material (CRM) Batch 208 for Oceanic CO2 analysis, prepared by Dr. Andrew Dickson (Scripps Institution of Oceanography), a minimum of three times. Calibration was repeated until the relative standard deviation (RSD) of the calculated HCl concentration from at least two titrations was below 0.01 %. CRM Batch 208 was also used as a quality control standard, analysed approximately every fifth sample. When treated as a sample, Batch 208 yielded a standard deviation of 7.69 µmol kg−1 and an RSD of 0.35 %. Replicate analyses were performed on every second sample, with an average difference of 8.43 µmol kg−1 and a relative average difference of 0.37 %. Following titration, alkalinity values were converted from µmol L−1 to µmol kg−1 using the equation of state and subsequently corrected for instrumental drift using Batch 208.
DIC samples of seawater were collected in 500 mL glass bottles and poisoned on board with 0.2 mL mercuric chloride. DIC concentrations were measured with an LI-5350A DIC analyser coupled with an LI-850 infrared gas analyser. Briefly, 1.5 mL aliquots of seawater were acidified to convert all DIC to CO2 gas, which was then quantified by the gas analyser. Calibration of the DIC analyser was performed at the beginning and end of each analytical batch (comprising eight sample triplicates) using Batch 208 in triplicate volumes of 1.2, 1.5, and 1.8 mL. Additional triplicate analyses of Batch 208 were conducted after each batch of eight sample triplicates to monitor instrument performance. Standard deviation of averages for Batch 208 triplicates was 1.35 µmol kg−1 across all sample runs. Carbonate system parameters, including Δ[CO3], were calculated from measured alkalinity and DIC using CO2sys version 25b06 (Lewis and Wallace, 1998). We used the equilibrium constants of Lueker et al. (2000), the KSO4 constant from Dickson, total boron from Uppström (1974), the KF from Dickson and Riley (1979), and default values for PO and SiO2 of 0 mol kg−1.
2.3 Oxygen measurements
During CE23011, we performed single-specimen respiration measurements on board the RV Celtic Explorer within 24 h of collection, using the same (filtered) seawater and temperature as foraminifera were collected in. Given the large latitudinal gradient of the survey (e.g., 55–74° N), this allowed us to perform measurements over a large gradient for most ECVs analysed here. The following year, we collected foraminifera from a single station. We incubated them at different temperatures in the laboratory at UiT before performing respiration measurements in a temperature-controlled laboratory setting. This dual approach allowed us to evaluate the importance of food, rest and setting (ship vs lab) for the reproducibility of the results.
Measurements on single foraminifera were performed using the NanoRespiration system developed by Unisense™. It includes the Unisense MicroProfiling System coupled with a micro-rosette of seven fused glass capillaries (Ø = 0.68 mm, length = 3 ± 0.2 mm), a rosette holder and a metal frame which allows exact positioning and movement of the microsensor tip into the glass capillary (see Fig. 2 for set-up diagram). Oxygen profiles were measured using Clark-type microsensors of 50 µm tip diameter with guard cathodes (Revsbech, 1989), a fx-6 UniAMP multi-channel amplifier, and SensorTrace PRO v1.9 software from Unisense™. Each sensor was calibrated prior to each experiment using a 0 % oxygen solution using either the premade ascorbate solution prepared by Unisense™ or dissolving Sodium Sulphite PryoScience™ capsules in 50 mL of distilled water and a 100 % oxygenated seawater solution using filtered seawater and an aquarium pump.
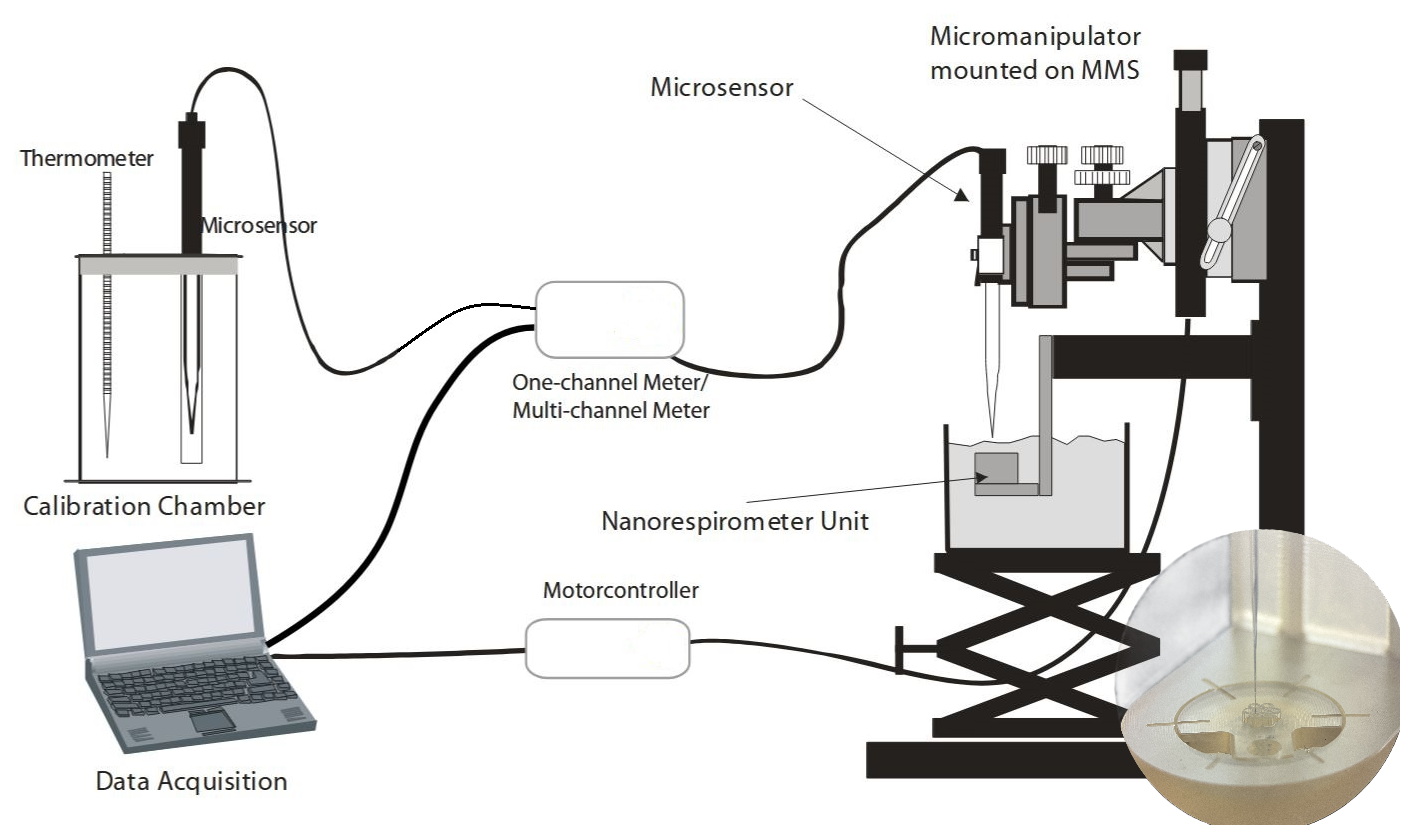
Figure 2Diagram adapted from Unisense (2025) showing the nano respiration set-up used to measure oxygen gradients on single foraminifera. The image on the bottom right shows a close-up of the Nanorespirometer Unit (e.g., rosette) and microsensor entering one of the glass capillaries.
Prior to analysis each glass capillary of the sample rosette was flushed with DI water and placed into an ultrasonic bath for 30 s. Once cleaned and DI water removed, the rosette was placed into a Petri dish filled with filtered seawater set at the precise temperature of incubation for each experiment. All glass capillaries were flushed with filtered seawater carefully removing any remaining bubbles in each capillary. Then, one living foraminifera (colourful, pseudopodia present) was placed per capillary, keeping one well empty as a control. The room temperature was maintained within 5 °C of the experiment temperature to avoid large fluctuations for the foraminifera during transfer from the incubator into the rosette. Once the transfer was complete, the loaded sample rosette was placed into the rosette holder and submerged in a jacketed beaker filled with filtered seawater at the exact temperature chosen for the experiment. Temperature was maintained to within 0.1 °C using a Julabo circulator, circulating antifreeze into the jacket of the beaker. Foraminifera in the submerged rosette were acclimatised for 45–60 min. Seawater in the beaker was constantly agitated with air using an aquarium pump to maintain fully oxygenated seawater above the capillaries. Once acclimatised the position of the sensor was calibrated using a micromanipulator, a PC-controlled motor unit (Woelfel et al., 2009) and a mounted dissecting microscope to ensure the sensor enters each capillary opening. Oxygen profiles were set to begin 400 µm above and end 2000 µm inside each capillary, with step sizes of 200 µm. Measurements at each depth were performed after allowing the sensor to equilibrate for 5 s, and each profile was repeated three times. The oxygen gradient in each capillary was measured using the average slope between 800 and 2000 µm inside the capillary for each triplicate measurement to determine individual respiration rate (IRR) measurements (Maciute et al., 2023) using Fick's first law of diffusion × where D is the oxygen diffusion coefficient at a given temperature (Broecker and Peng, 1974), and is the measured oxygen gradient inside the capillary tube. We
report respiration rates as the mean ±1σ standard deviation based on triplicate measurements (n=3), which reflects the experimental precision of the assay. To account for background respiration, one capillary in each rosette was maintained as a blank, containing only seawater without any foraminifera. Blank correction was applied to each measurement, and only values exceeding the limit of quantification (LOQ) were retained. The LOQ is derived from the variability of blanks and therefore accounts for background analytical uncertainty at low signal levels. Additional tests were conducted using dead foraminifera specimens that had been previously dehydrated to assess background respiration in the absence of metabolic activity. Five dead specimens were tested, yielding an average respiration rate of 17.00 ± 5.83 pmol O2 h−1 ind−1 , which is indistinguishable from the average procedural blank.
2.4 Maximum diameter and cell volume reconstructions
Determining biovolumes using X-ray microcomputed tomography (micro-CT) scanning for all individuals included in this study (n=158) was not feasible. We therefore opted to establish a robust empirical relationship between maximum diameter and cube root cavity volume for T. quinqueloba, N. pachyderma, and N. incompta, as previously suggested by Burke et al. (2020). Since the three species investigated exhibit similar low trochospiral coiling morphologies (Darling et al., 2006; El Bani Altuna et al., 2018; Pearson and Kucera, 2018), they are suited for this joint methodology and analysis. For micro-CT analysis tests were glued to a Kapton tube using a mix of tragacanth gum and MQ water (Milli-Q water – ultra pure laboratory water produced by a Milli-Q purification system), following a modified protocol from Coletti et al. (2018), Siccha et al. (2023) and Fabbrini et al. (2025). The Kapton tube was placed on a sample holder and scanned with the ZEISS Xradia 620 Versa, at the University of Galway.
The sample holder was placed between the X-ray source with a source-to-detector distance of 58 mm (Source-Rotation Axis distance: −20 mm; Detector-Rotation Axis distance 38 mm), providing a voxel resolution of 240 nm per pixel using the 20× objective magnification in binning 1 mode. The instrument was operated at 120 kV and 17.5 W, employing no energy filter to optimise transmission and the contrast-to-noise ratio. A total of 1601 radiographs were acquired over a 360° sample rotation range with an exposure time of 10 s per radiograph. The raw transmission images (.txrm) were reconstructed for each specimen using a commercial image reconstruction software package (ZEISS XMReconstructor) (ZEISS, 2024), which employs a filtered back-projection algorithm to generate the final reconstructed and corrected three-dimensional file. The final reconstructed files (.txm) were then exported as a stack of .tif image files for further study.
In addition, each foraminifer was imaged immediately after oxygen profiling using a Moticam X5 Plus (Motic Instruments Inc., 2024) Wi-Fi camera mounted on a Zeiss Stemi 395 and the Motic Images Plus 3.1 ML software. After calibration, this software was used to measure the maximum diameter of the foraminifera in µm, completed under 64× magnification. The maximum diameter refers to the longest straight line that passes through the widest part of the foraminifera, typically measured through the final chamber (Fig. 4).
2.5 Biometry
The exported micro-CT image stacks were segmented using the software Amira 3D Pro (Stalling et al., 2005). Manual thresholding was applied to isolate the tests and background, and the paintbrush tool was used to remove infilling or extraneous particles, such as cytoplasm. The segmented tests were rendered as volumes using the watershed algorithm. The maximum diameter was measured for all specimens using the measurement tool on the 3D volume rendering of the test in the same orientation as the optical microscope. The internal voids of all chambers were then isolated and rendered as a separate volume using the “Ambient Occlusion” function in Amira 3D Pro, which filled the negative volume virtually (Baum and Titschack, 2016; Titschack et al., 2018). The internal volume of the combined chambers and of the pores within the test wall (Fig. 4) was then measured using the label analysis function in Amira (Kiss et al., 2023).
Respiration rates were analysed in two ways. First, we used cell volume to size-normalise respiration rates and evaluate the response of the specimens to changes in temperature and other essential climate variables. A common way to estimate the influence of temperature on a physiological rate is the use of the Q10 value, which quantifies the rate increase for a 10 °C increase. Q10 was calculated following Eq. (1) (adapted from Schmidt-Nielsen, 1997):
Where R2 is the respiration rate at the higher temperature, R1 is the respiration rate at the lower temperature, T1 is the lower temperature, and T2 is the higher temperature. It is essential to recognise that, although the use of a Q10 is a convenient measure, it varies as a function of the temperature range being considered (Lombard et al., 2009). For example, when calculating the Q10 value for N. pachyderma, we excluded the lab-based experiment because it included temperatures outside of this species' typical habitat range.
Secondly, we normalised respiration rates to 4, 15 and 24 °C to evaluate the influence of cell volume on respiration rates. 24 °C was chosen to facilitate comparative analysis with previous work, particularly that of Lombard et al. (2009), thereby enabling meaningful contextual interpretation of the current dataset. 15 °C represented a thermal midpoint across all experiments, minimising physiological deviation and ensuring that species were assessed under temperatures approximating their average environmental exposure. 4 °C served as the low-temperature condition, selected for its relevance for N. pachyderma, the focal species of this investigation. Using a Q10 value of 3.18 from Lombard et al. (2009), and Q10 values derived for N. pachyderma, N. incompta and T. quinqueloba in this study (see Table 4) following Eq. (2):
Where Rχ is the respiration rate at X °C,Rt is the respiration rate at the measured temperature, and t is the measured temperature.
3.1 Cell volume reconstructions
Cavity volume and maximum diameter using micro-CT scans were assessed for a subset of 39 specimens (23.5 %).These include 19 new specimens from this study (e.g., N. pachyderma (n=7), N. incompta (n=5), and T. quinqueloba (n=7) and the reanalysis of 20 .tiff stacks of scanned N. pachyderma (n=9), N. incompta (n= 8) and T. quinqueloba (n=3) previously published in Burke et al. (2020). An independent paired student t-test comparing the maximum diameters reported in Burke et al. (2020) and the measurements of the same scans using Amira in the current study had a p-value of < 0.01, (95 % Confidence Interval (C.I.) [1.65–7.44 µm]) meaning there is a 0.61 % to 2.75 % difference between measurements reported in Burke et al. (2020) and reported here for the same foraminifera.
Table 2Summary of maximum diameter and cube root volume measurements of the 39 specimens that were scanned for volume reconstructions.
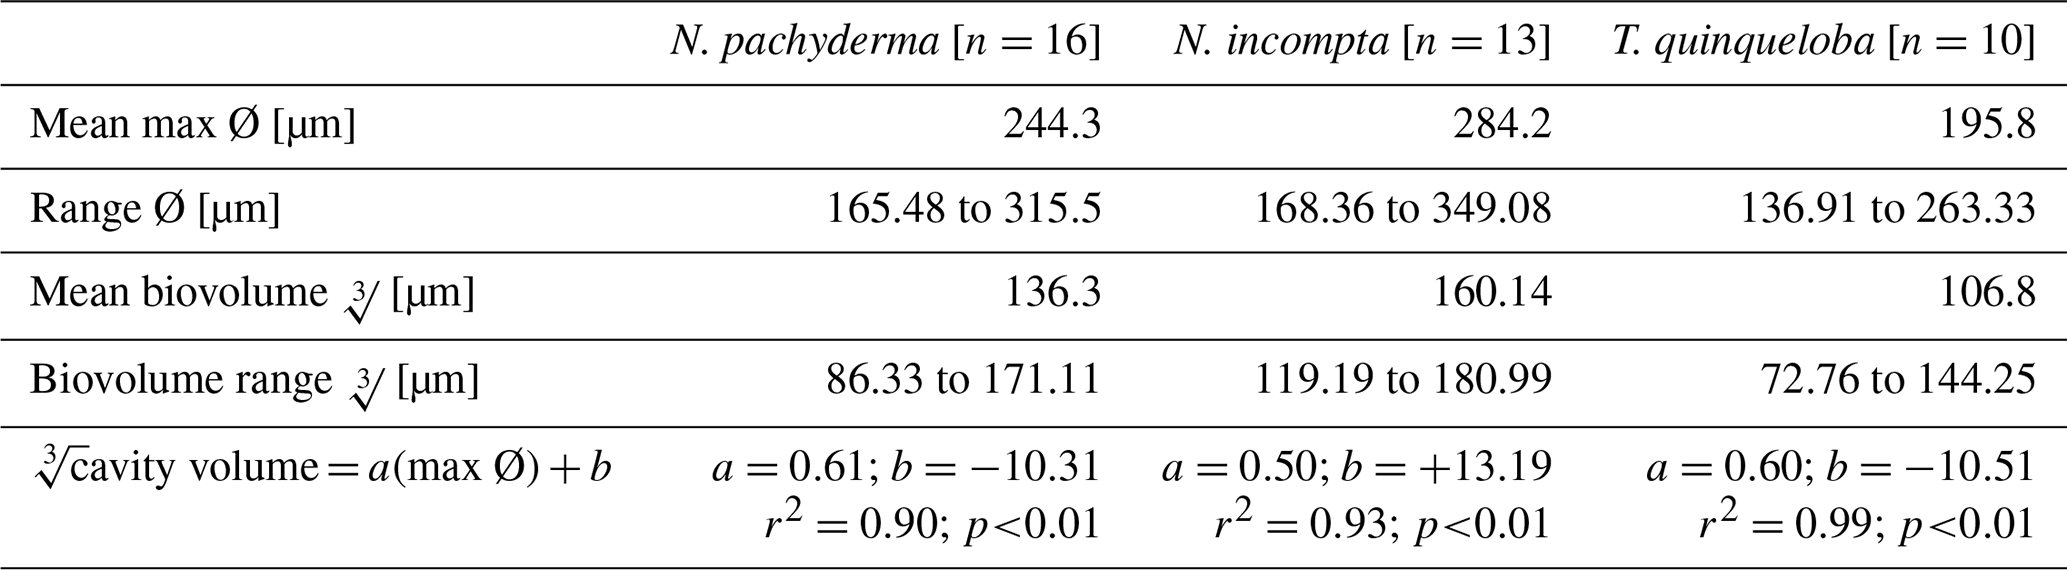
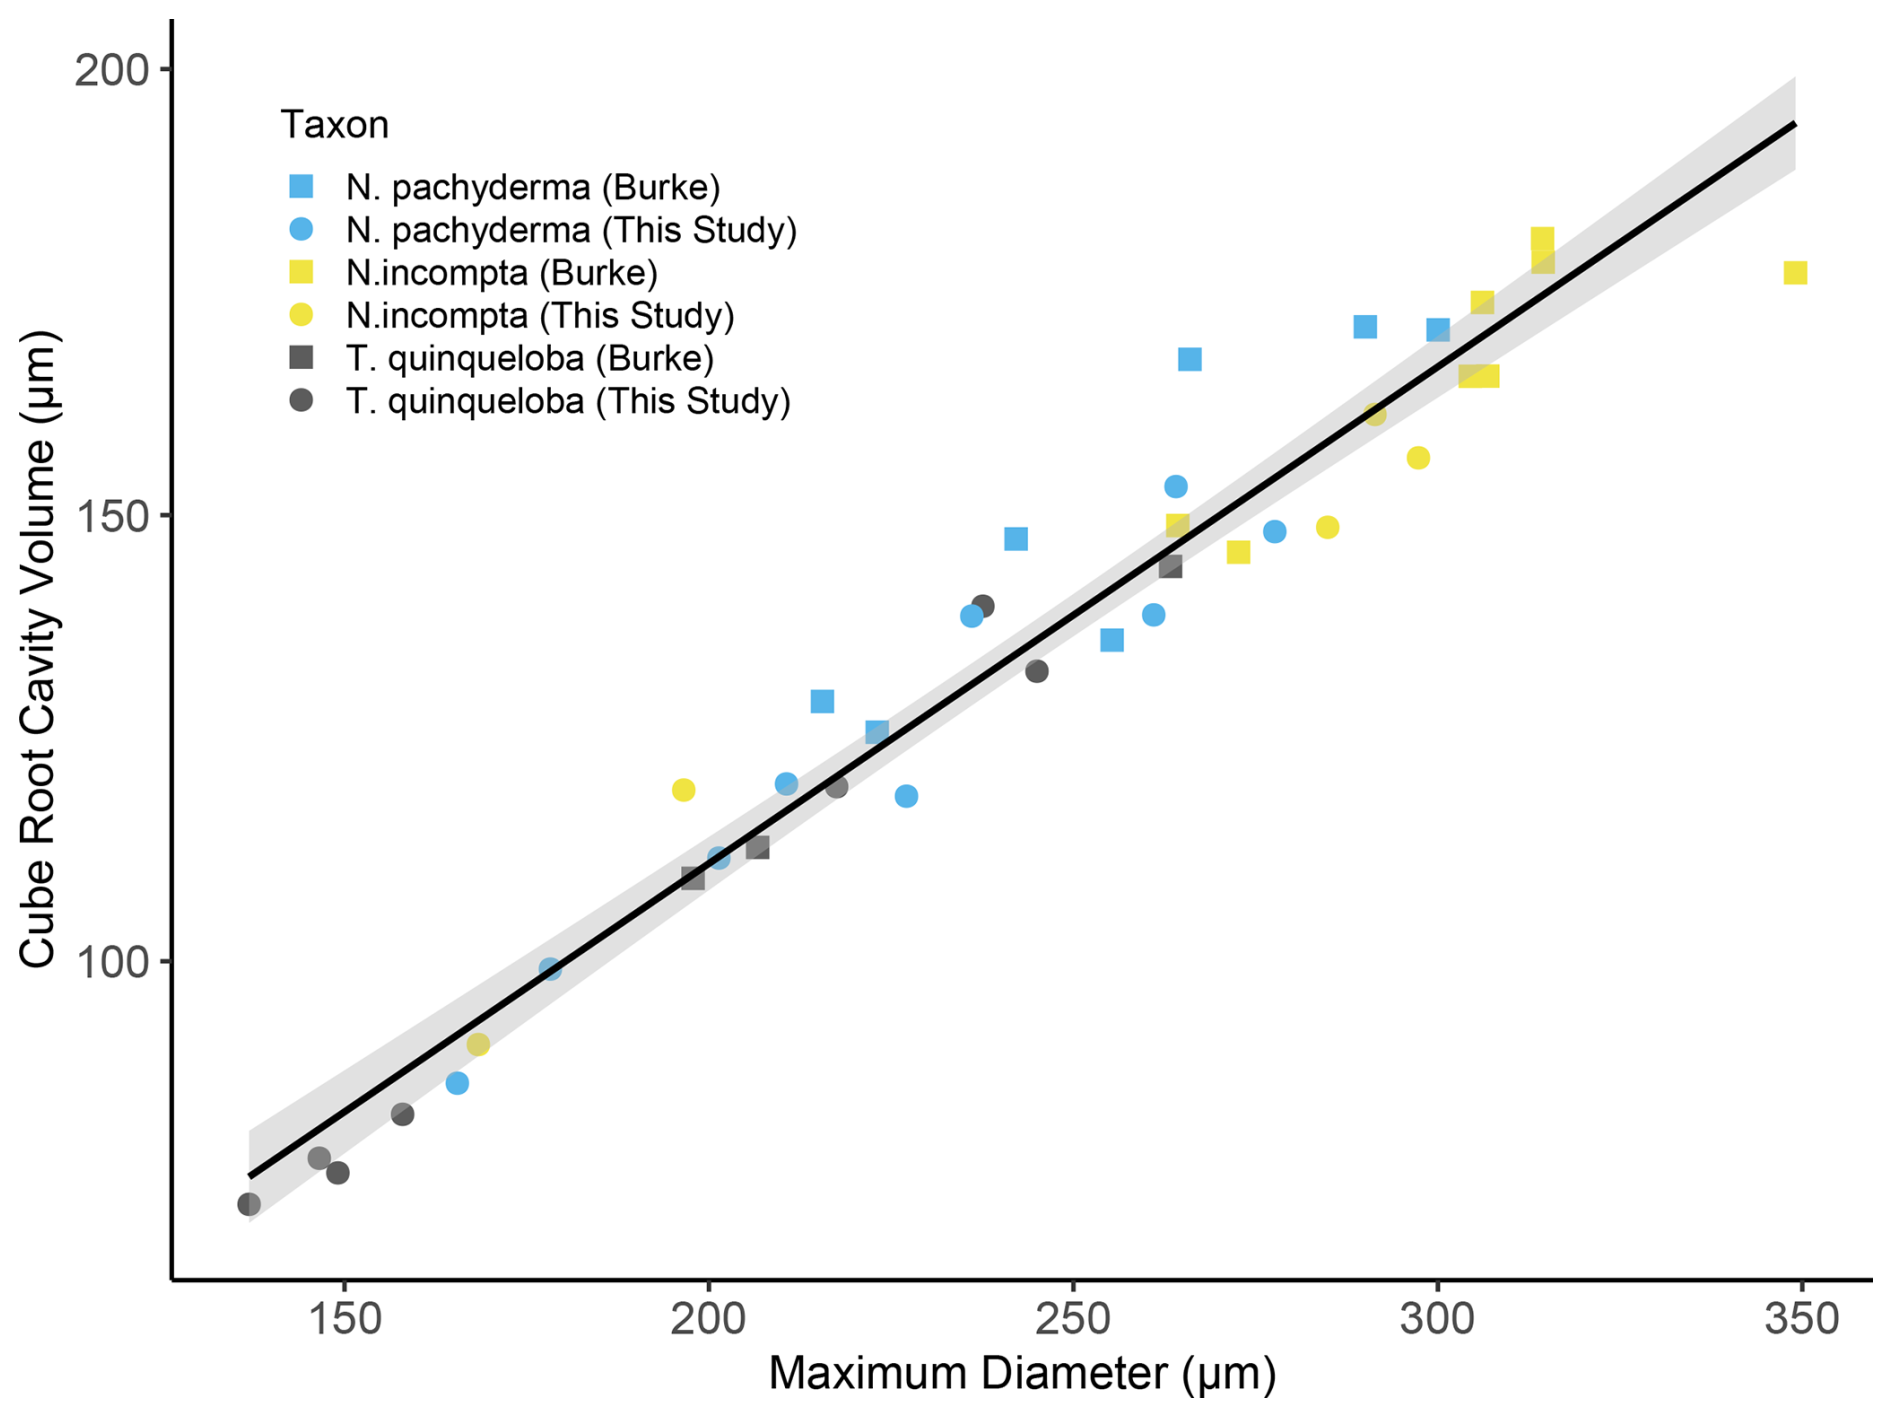
Figure 3Combined max Ø (µm) vs (µm) for N. pachyderma, N. incompta and T. quinqueloba showing trendline, slope and r2 value. The source data for this figure is available in Table S8.
The relationship between the max Ø (µm) and for all 39 specimens analysed here (Fig. 3) follows Eq. (3):
n=39, r2=0.95, p<0.01. For species-specific equations, please see Table 2. Volume reconstructions performed in this study are significantly smaller than previous estimates that are based on the assumption that the cavity volume corresponds to 75 % of the closest geometric shape (e.g., sphere for species analysed) that can be fitted around the maximum diameter of the foraminifera (e.g., Hannah et al., 1994; Geslin et al., 2011; Cesbron et al., 2016; Maciute et al., 2023). A comparison of both techniques shows that using 75 % of a sphere to estimate cavity volume overestimates actual biovolume by 47 ± 7.37 %. Specifically, for each of the species analysed, the relationship between the volume of a sphere based on the max Ø (µm) and micro-CT-based cavity volume reconstructions was 35.36 ± 4.57 % for N. pachyderma, 33.21 ± 6.09 % for N. incompta and 37.69 ± 5.67 % for T. quinqueloba. We also note that the protocol for analysing cavity volumes used in this study led to significantly smaller cavity volumes (28 % difference, paired t-test p>0.01) when compared to Burke et al. (2020).
The main difference between methods is that we used the ambient occlusion function in Amira (Titschack et al., 2018), which allows the segmentation of the test and measurements of its internal volume, excluding the test wall, while in Burke et al. (2020) external meshes were imported into MeshLab software, where they were resurfaced and replaced with watertight “wrap” mesh, which closes all apertures and pores, allowing the interment of the cavity volume of the entire test by subtracting the CaCO3 volume from the wrap volume. This method appears to overestimate cavity volumes, since the reported cavity volumes exceed the volume of a sphere fitted to the maximum diameter of each test by a mean of 115 ± 27 % for N. incompta, 137 ± 20 % for N. pachyderma and 179 ± 6 % for T. quinqueloba.
In this study, we define the term “test biovolume” as the internal cavity volume bound by the calcite test, representing the space theoretically occupied by living cytoplasm in planktonic foraminifera. While cytoplasmic density and space occupancy may vary within chambers, this metric captures the maximum possible total living volume of the cell inside its test rather than carbon-equivalent biomass. In our definition, test biovolume is thus confined to the interior volume of the test and does not capture the “catchment volume” or the rhizopodial network which can increase the effective cell volume by several orders of magnitude compared to the test alone (Gaskell et al., 2019). We choose not to scale reported biovolumes at 75 % of the test biovolume (as in Burke et al., 2025) because the majority of specimens analysed in this study exhibited full chambers prior to measurements. Furthermore, we note that the suggested 75 % method arose from the limitations of estimating biovolumes from total test volumes that included the test (e.g., Hannah et al., 1994). Now, using micro-CT internal volume reconstructions we have more advanced tools to directly measure the cavity volume. Finally, there is no empirical evidence that supports a 75 % cell occupancy of the cavity volume for asymbiotic planktonic foraminifera, nor does a validated technique exist that would allow us to measure it.
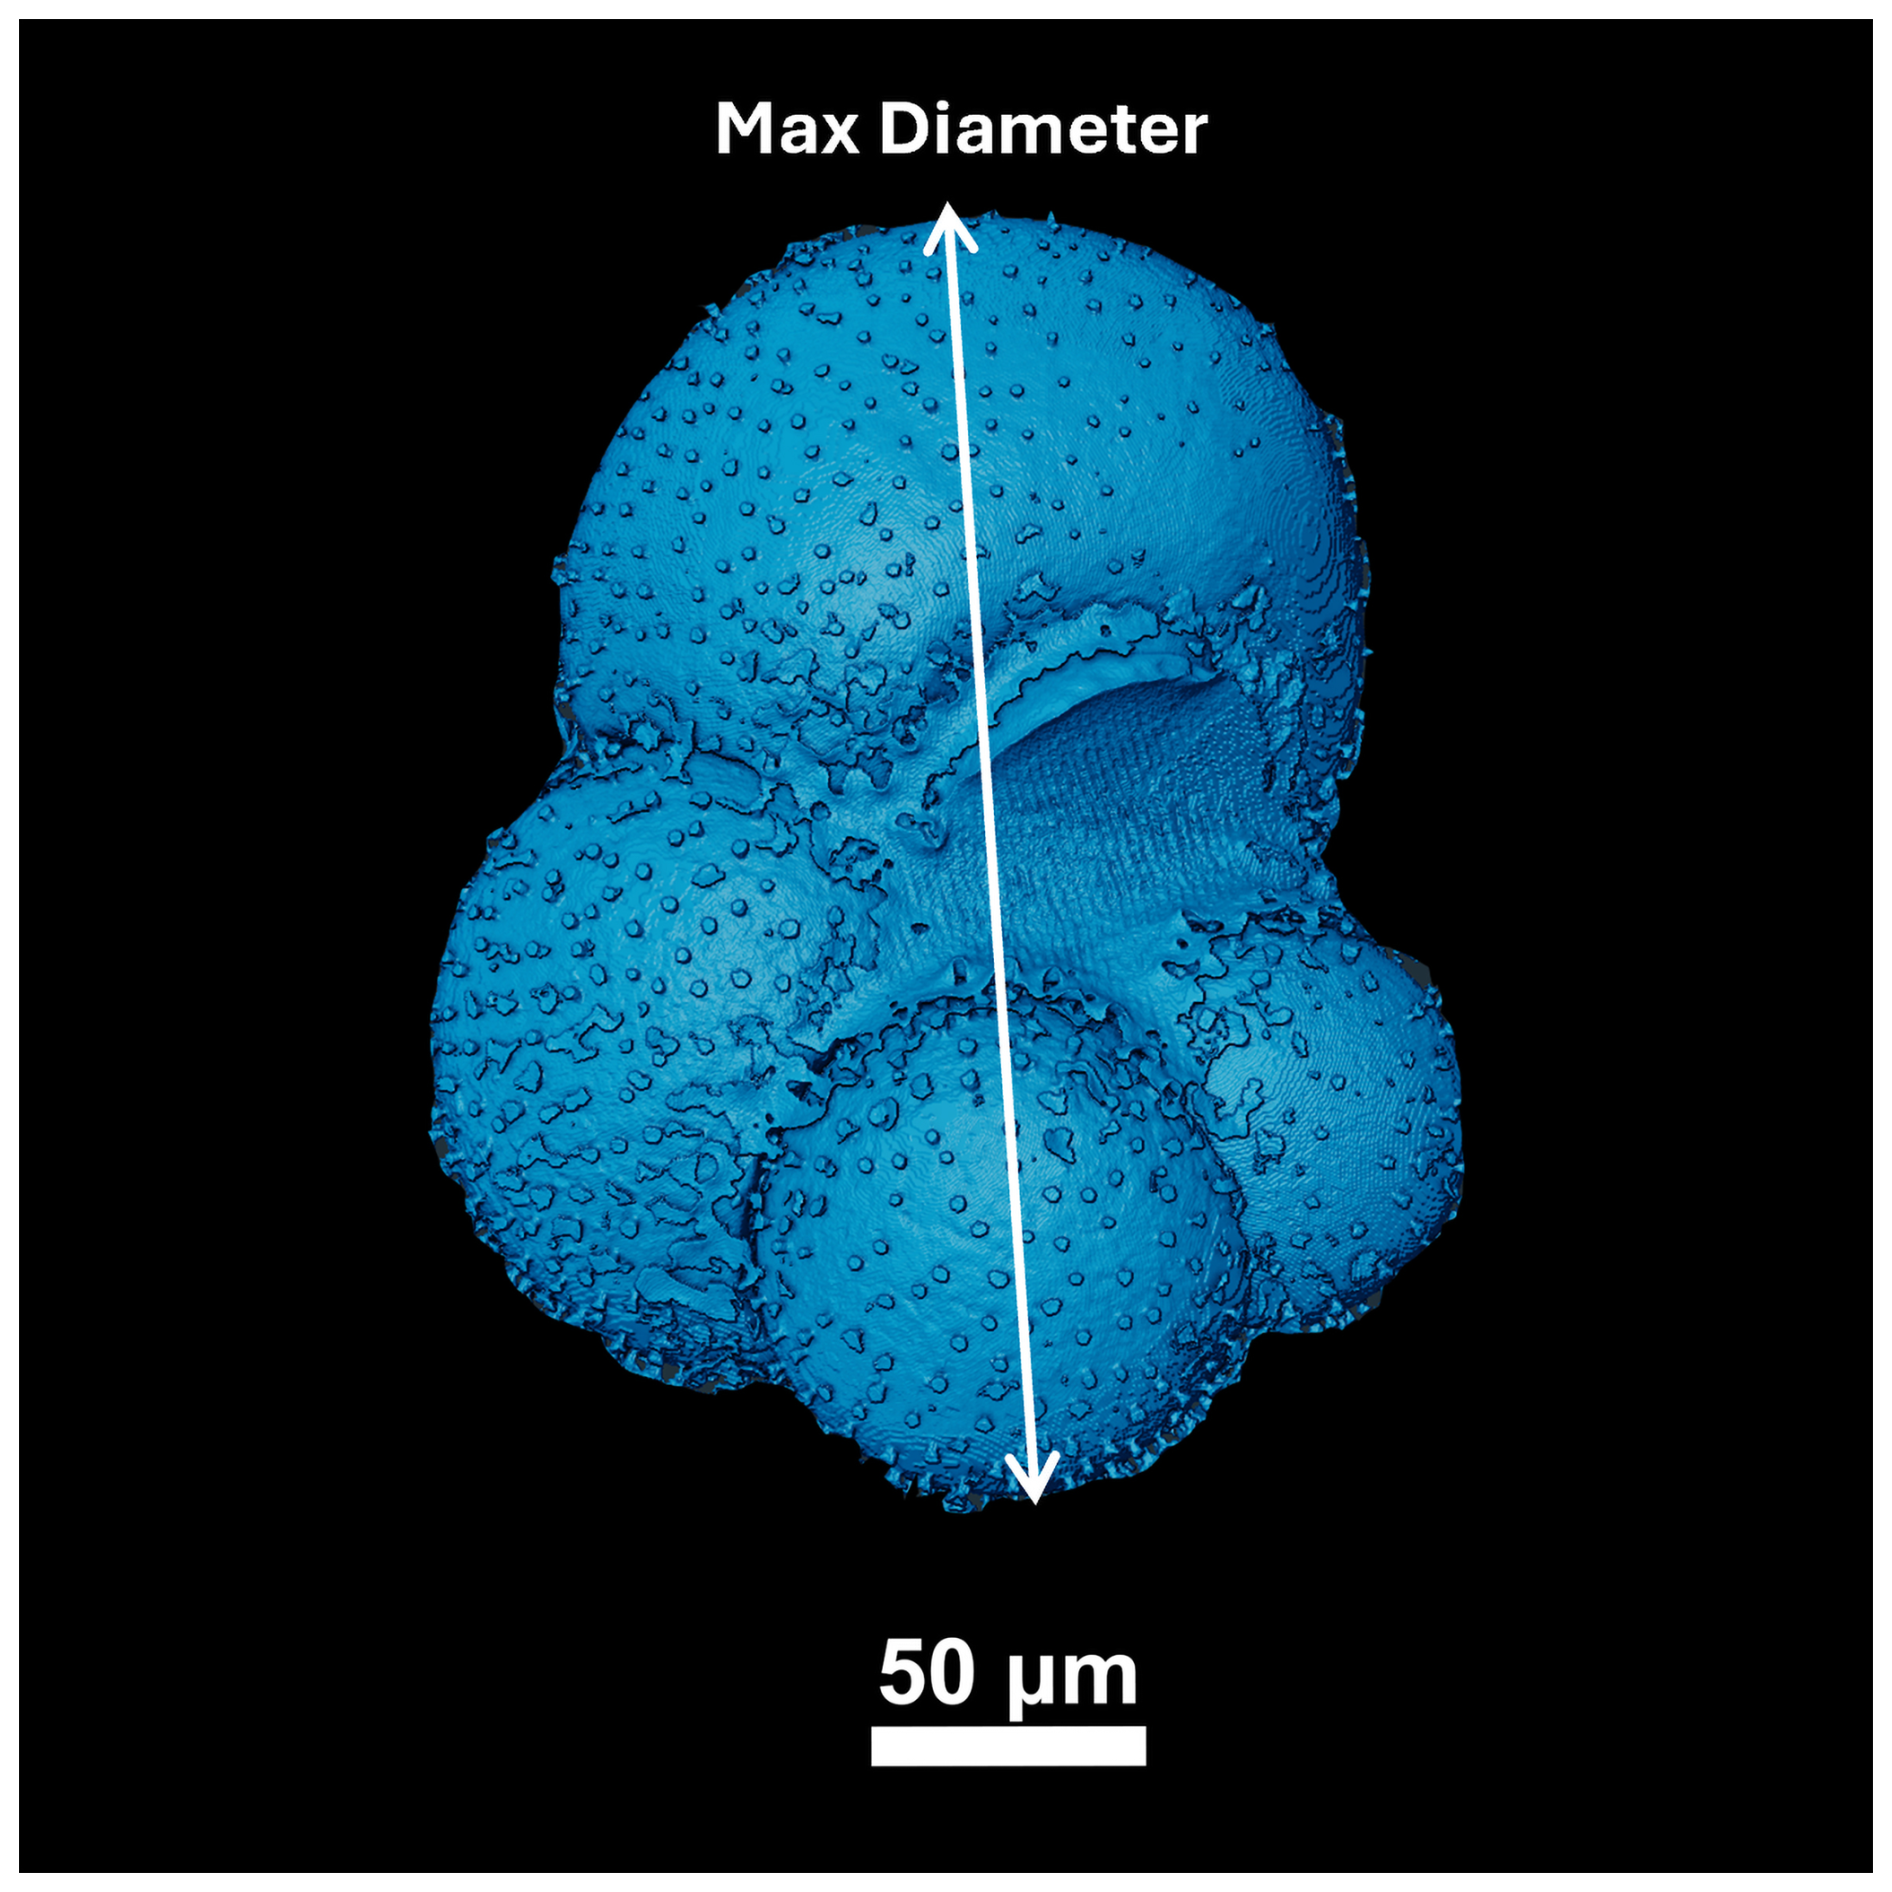
Figure 4Example of volume rendering of a specimen of N. pachyderma selected for 3D volume analysis in Amira 3D Pro. This figure shows the internal voids of the chambers, porosity, and the white line indicates the maximum diameter (Max Diameter) for this specimen. Scale bar 50 µm.
3.2 Respiration Rates
Here we use the multispecies relationship between (µm) and max Ø (µm) defined in Sect. 3.1. to Size-Normalise the Respiration rates (SNR) for each individual specimen using Eq. (4)
Where the average was determined by taking the average for each species. For the ship-based CE23011 cruise dataset from 2023, we recorded mean size-normalised respiration rates of 59.22 pmol O2 h−1 ind−1 µm−1 (95 % C.I. [53.32–65.13]) for N. pachyderma over a temperature gradient of 9.5 °C measured between 0.5–10 °C. For N. incompta we record higher mean size-normalised respiration rates of 198.99 pmol h−1 ind−1 µm−1 with a larger variability (95 % C.I. [169.48–228.50]) analysed over a smaller temperature gradient of 4 °C measured between 10 °C and 14 °C. For the laboratory-based dataset (Tromsø 2024), the mean size-normalised respiration rates for N. pachyderma were comparable to the ship-based data (e.g., 62.71 pmol O2 h−1 ind−1 µm−1 (95 % CI: [57.45, 67.97])). Mean size-normalised respiration rates for T. quinqueloba, are also low at 45.75 pmol O2 h−1 ind−1 µm−1 with low variability (95 % CI: [31.99, 59.50]) over a temperature gradient of 11 °C measured between 2–13 °C for both species. While early studies by Hemleben et al. (1989) and Stangeew (2001) noted the possible presence of symbionts in T. quinqueloba, these studies did not present direct evidence, and subsequent studies have found no indication of active photosymbiosis (e.g., Takagi et al., 2019; Hoogakker et al., 2022; Kanbur, 2025). Consistent with this, visual inspections of each specimen using a Zeiss Axio Vert.A1 with transmitted light settings confirmed that none of the specimens analysed in this study bore symbionts. Thus, calculated respiration rates were not adjusted for photosynthesis as in Lombard et al. (2009) for O. universa, G. ruber and G. siphonifera.
The sensitivity of size-normalised respiration rates and temperature for tropical and subtropical planktonic foraminifera is best described by an exponential or Arrhenius relationship, rather than a simple linear one (Lombard et al., 2009). We therefore plot the log, size-normalised respiration rates against temperature for our analysis, as temperatures are well established to scale logarithmically with respiration rates (e.g. Burke et al., 2025; Lombard et al., 2009). Conversely, empirically supported functional relationships are not currently available for the other environmental variables measured in this study. The log10 size-normalised respiration rates (pmol O2 h−1 ind−1 µm−1) against temperature are shown in Fig. 5a for all species. For all other essential climate variables such as, pH, salinity, alkalinity, ΩCa, dissolved oxygen (Fig. 5), SiO2 (µmol kg−1), Dissolved Inorganic Carbon, PO (µmol kg−1), and Total Organic Nitrogen (µmol kg−1), size-normalised respiration rates are shown in Figs. 5b–f and 6.
In Table 3 we report correlation statistics for each variable and show that there is no significant correlation between respiration rates of N. pachyderma and any of the ECVs measured here. However, strong covariance between ECVs in the modern ocean may obscure biological responses of N. pachyderma and N. incompta to complex environmental gradients. Consequently, we conducted a suite of multivariate analyses to evaluate whether size-normalised respiration rates respond to combined environmental gradients or individual variables. Principal component analysis (PCA) of the complete ECVs dataset relevant for each species revealed structured environmental axes, with PC1–PC4 capturing 99 % of environmental variance for the N. pachyderma dataset and PC1–PC2 capturing 100 % of variance for the N. incompta dataset (Supplement Table S2). Evaluation of the PCA loadings (Table S3) indicates that these principal components correspond to coherent environmental gradients rather than isolated variables. For example, in the N. pachyderma dataset, PC1 primarily reflects a water-mass and nutrient gradient, characterized by strong positive loadings of nutrients (PO, TON, SiO2) and DIC and negative contributions from temperature and oxygen, consistent with colder nutrient-rich waters. PC2 is dominated by carbonate chemistry variables, including alkalinity, pH, and calcite saturation state (ΩCa), reflecting variability in the carbonate system. PC3 and PC4 capture secondary productivity-related signals, largely associated with fluorescence, oxygen, and temperature. Despite four clear multivariate gradients, size-normalised respiration rates for N. pachyderma do not show a significant relationship with any of the four principal components (all p>0.1, and scatterplots of size-normalised respiration rates across PC1–PC4 space are not significantly different from zero (Fig S1). Principal Component Regression explained 0 % of respiration variance (adjusted ) with all PC slopes non-significant (p>0.01) (Table S4). Partial least squares regression similarly showed minimal predictive skill (y-variance ≤ 25.5 %; RMSEP comparable to the raw standard deviation; all 95 % coefficient intervals overlapping zero; Table S5). Redundancy analysis detected a statistically significant constrained fraction (p=0.001), but this accounted for only 37.02 % of variance and did not improve performance relative to null models (Table S7). These results indicate that respiration remained invariant across the full multivariate environmental space sampled, supporting physiological robustness rather than the masking of univariate relationships by collinearity.
For N. incompta we have a more limited dataset measured over a narrower range in environmental gradients. Here we find significant linear correlations notable for temperature, SiO2, salinity, fluorescence, dissolved O2, pH and ΩCa (Table 3, Table S1). Furthermore, size-normalised respiration rates for N. incompta were significantly correlated to the environmental gradients represented by both PC1 and PC2 using Principal Component Analysis (p<0.01; see also Table S4 and Fig. S2). PLSR results were consistent, with 75.3 % of Y-variance explained and coefficient intervals not overlapping zero (Tables S5, S7). Redundancy analysis also identified a strong environmental signal (78.6 % constrained variance; p<0.001; Table S6). This suggests that unlike N. pachyderma size-normalised respiration rates in N. incompta are sensitive to integrated environmental structure. These contrasting responses suggest fundamental differences in metabolic plasticity between the two species.
Correlation statistics between log10 size-normalised respiration and temperature and Q10 values are reported in Table 4 for all species. We find that temperature accounts for a greater proportion of the variance in respiration for N. incompta (r2=0.37) and T. quinqueloba (r2=0.72) than for N. pachyderma (r2=0.07). The sensitivity to temperature is explained by the Q10 values determined for each species. N. pachyderma exhibits a low Q10 of 1.48 between 0.5 and 10 °C. In contrast, N. incompta and T. quinqueloba demonstrate a much higher Q10 of 3.69 and 4.43 over 10–14 and 2–13 °C, respectively. We caveat that Q10 values for N. incompta are only tentative due to the small temperature gradient (e.g., ΔT=4 °C) covered in this dataset. Specifically, the assumptions required for calculating Q10 are not fully met for this species, and any resulting Q10 values should be interpreted with caution as a preliminary result that needs to be confirmed over a larger temperature gradient (e.g. ΔT=10 °C).
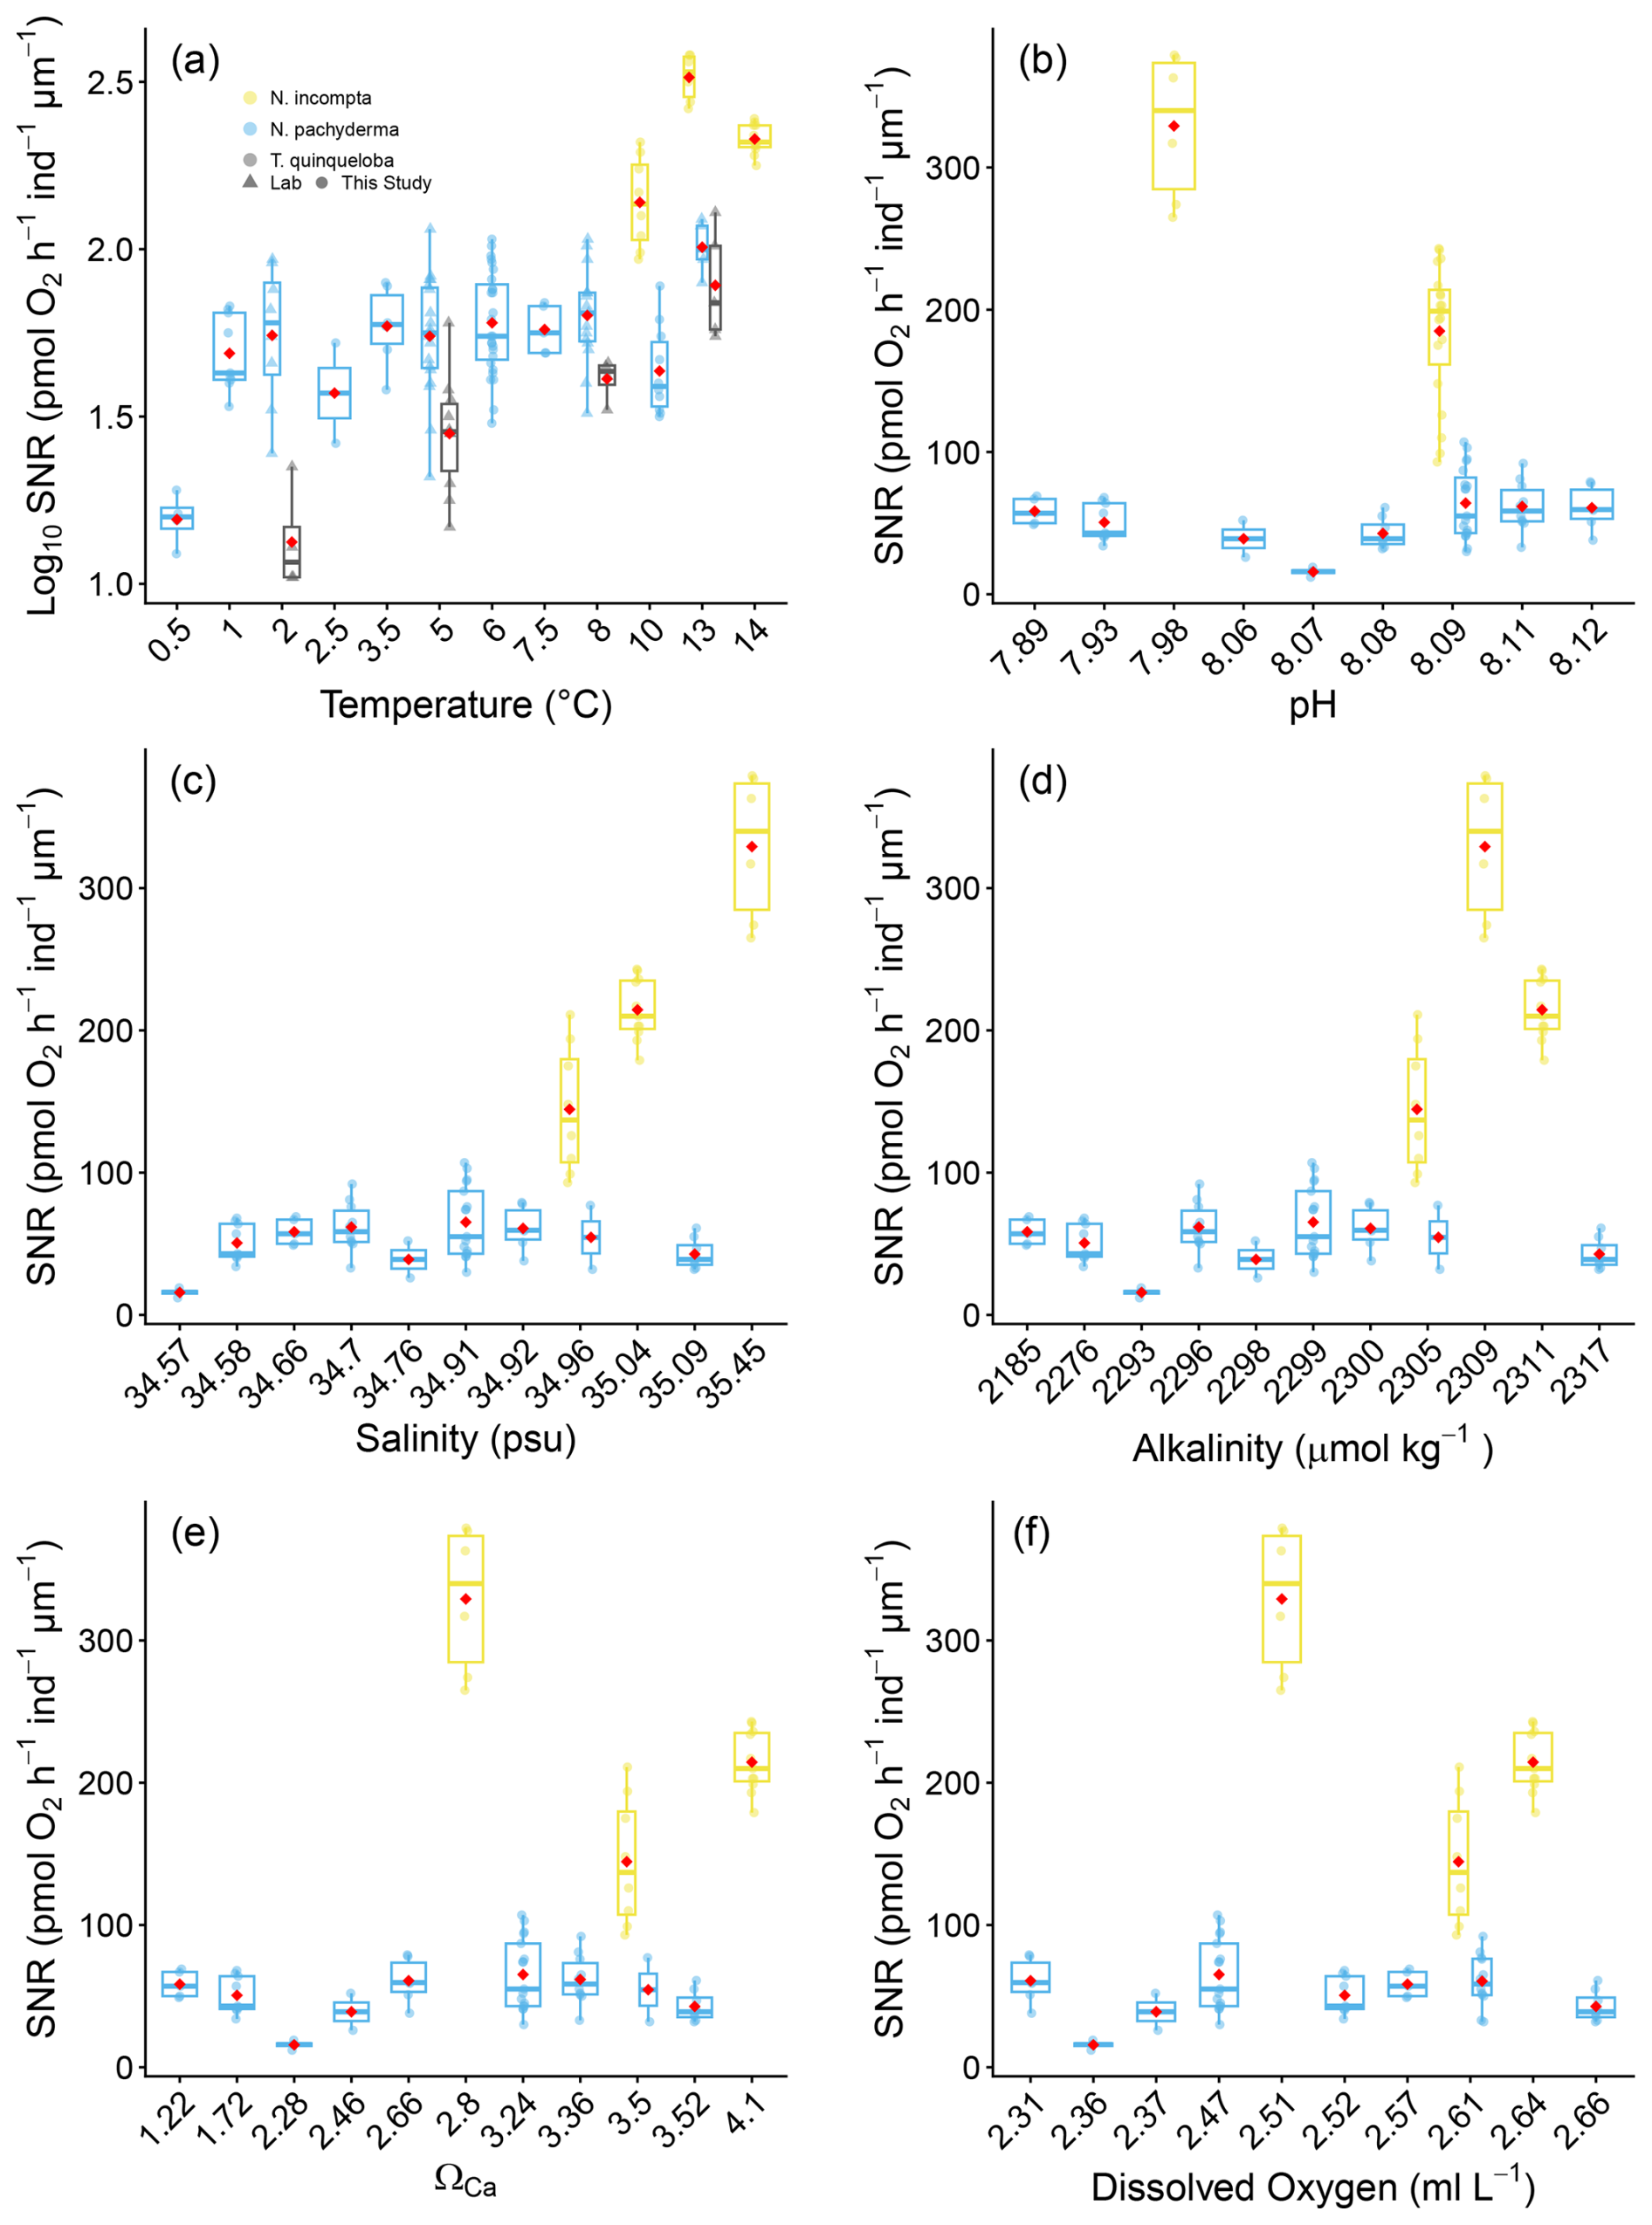
Figure 5Box and whisker plots of the effect of essential climate variables on Size Normalised Respiration (SNR) based on (pmol O2 h−1 ind−1 µm−1) in N. pachyderma, N. incompta and T. quinqueloba (a) Temperature °C and (b) pH; (c) Salinity (psu) and (d) Alkalinity (µmol kg−1); (e) ΩCa and (f) Dissolved Oxygen (mL L−1). Boxes extend from the data's lower to upper quartile values, with a line at the median. Whiskers indicate 1.5 times the interquartile distance. Red dots mark the mean. log10 Size normalised respiration and laboratory data are only available for (a). The source data for this figure is available in Tables S9 and S10.
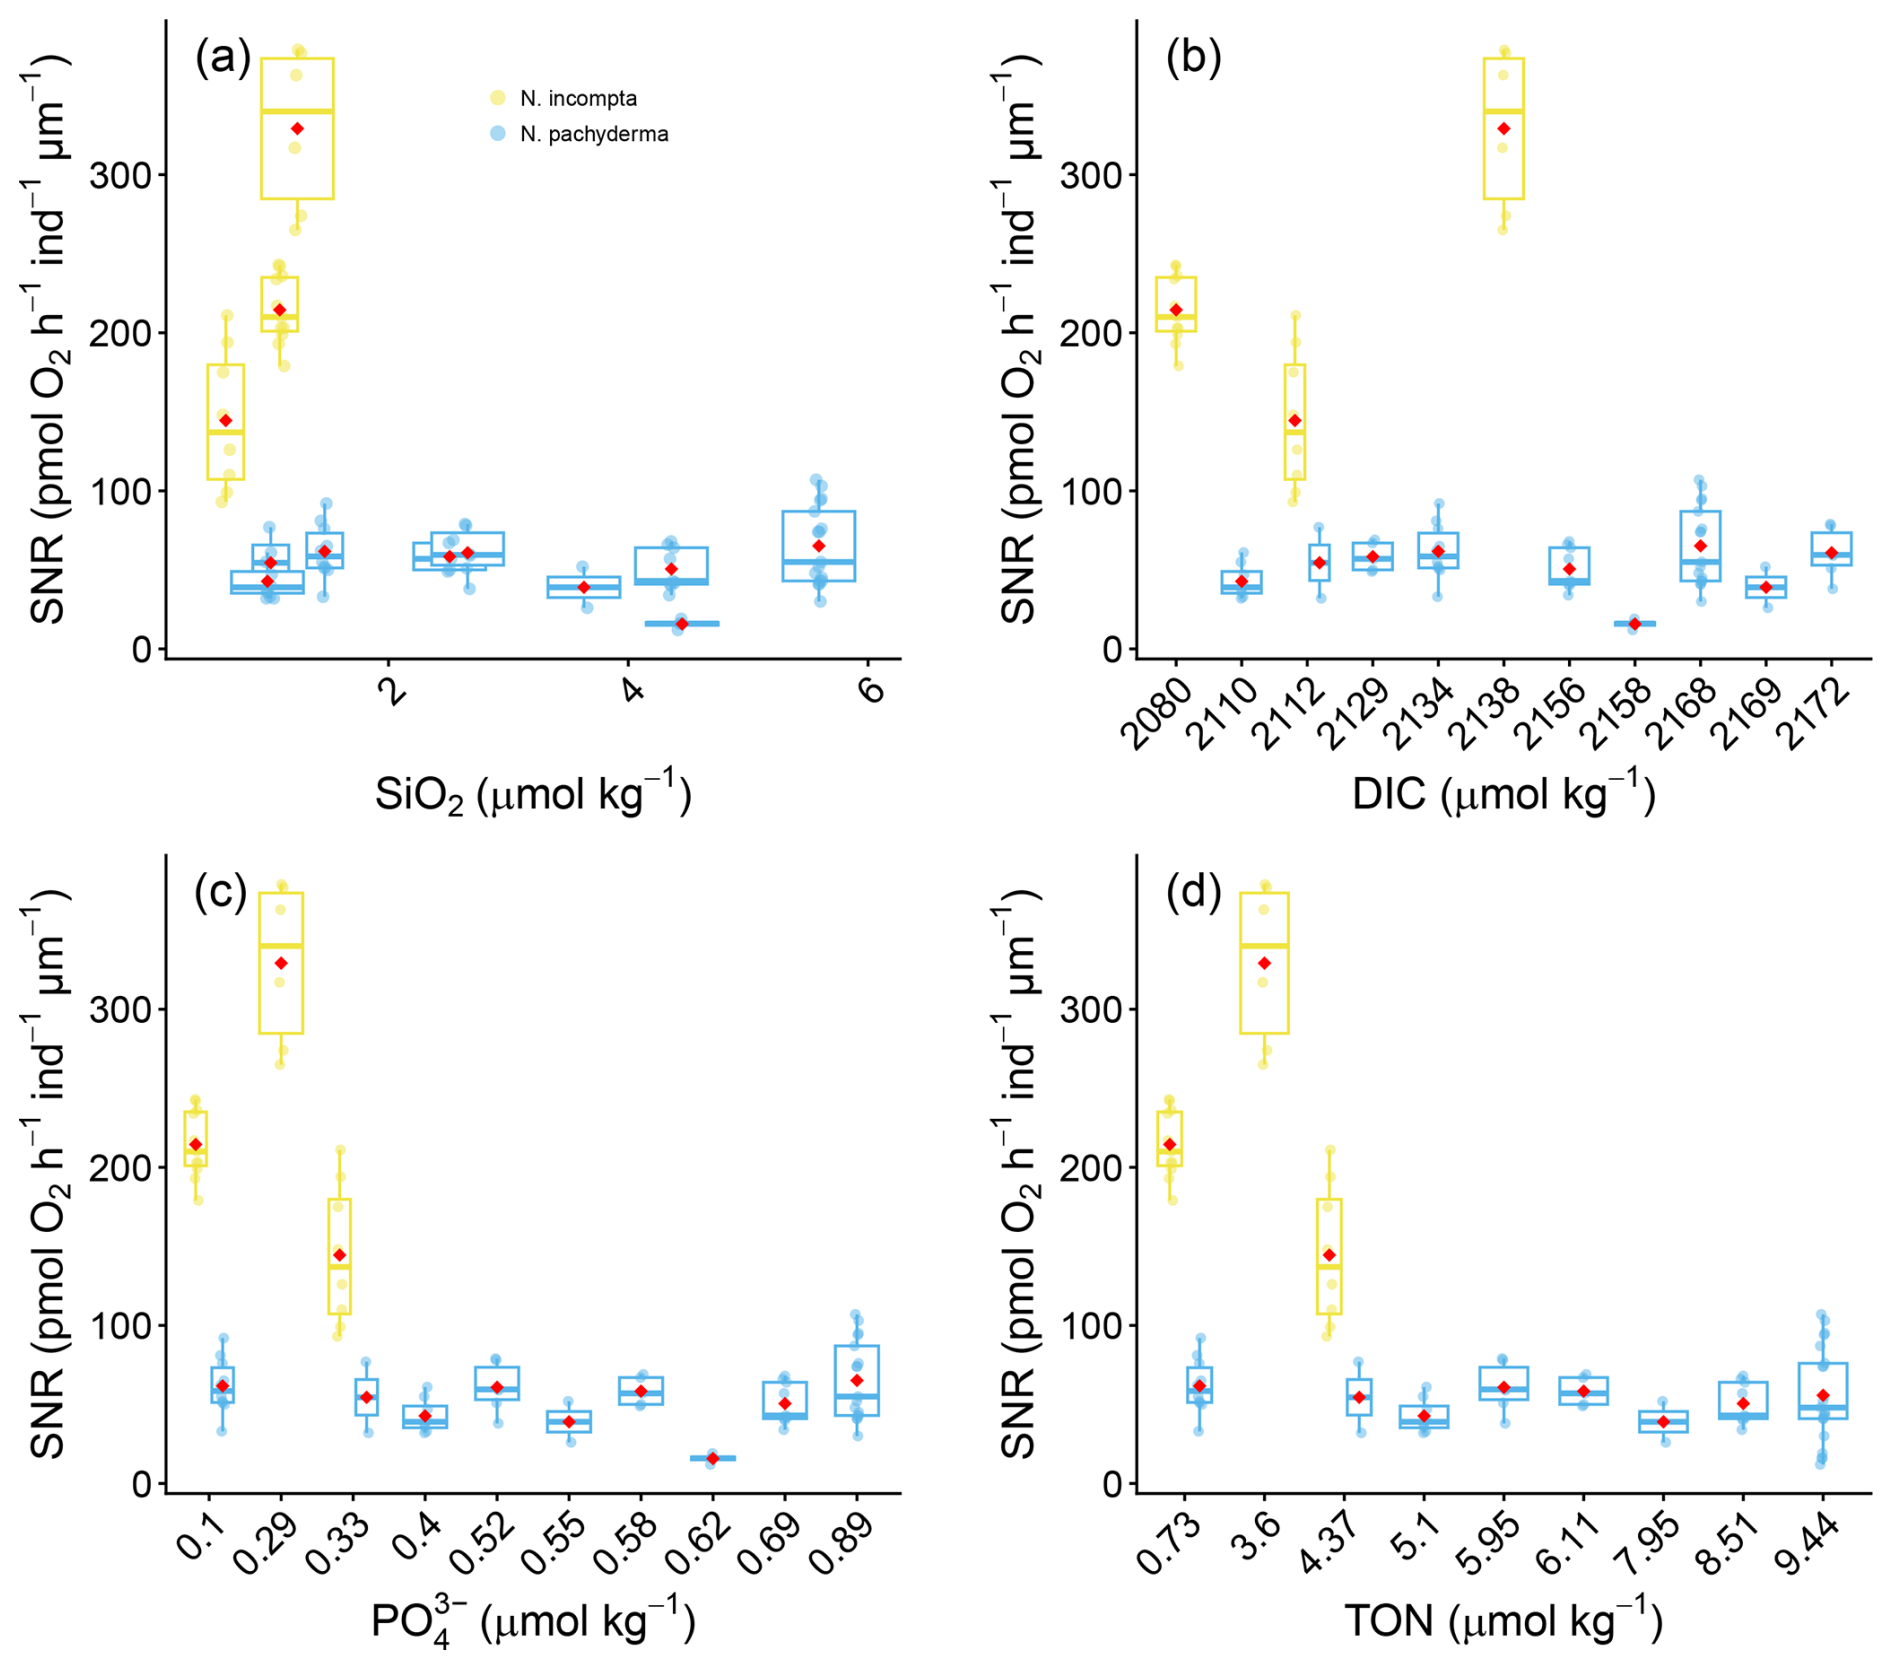
Figure 6Box and whisker plots of the effect of nutrients on Size Normalised Respiration (SNR) based on (pmol O2 h−1 ind−1 µm−1) in N. pachyderma and N. incompta. (a) SiO2 (µmol kg−1) and (b) Dissolved Inorganic Carbon (µmol kg−1); (c) PO (µmol kg−1) and TON (µmol kg−1). Boxes extend from the lower to upper quartile values of the data, with a line at the median. Whiskers indicate 1.5 times the inter-quartile distance. The red dots mark the means. The source data for this figure is available in Table S9 and S10.
Table 3Quantification of the correlations between size-normalised respiration and essential climate variables and nutrients in N. pachyderma and N. incompta measured in situ, during expedition CE23011.
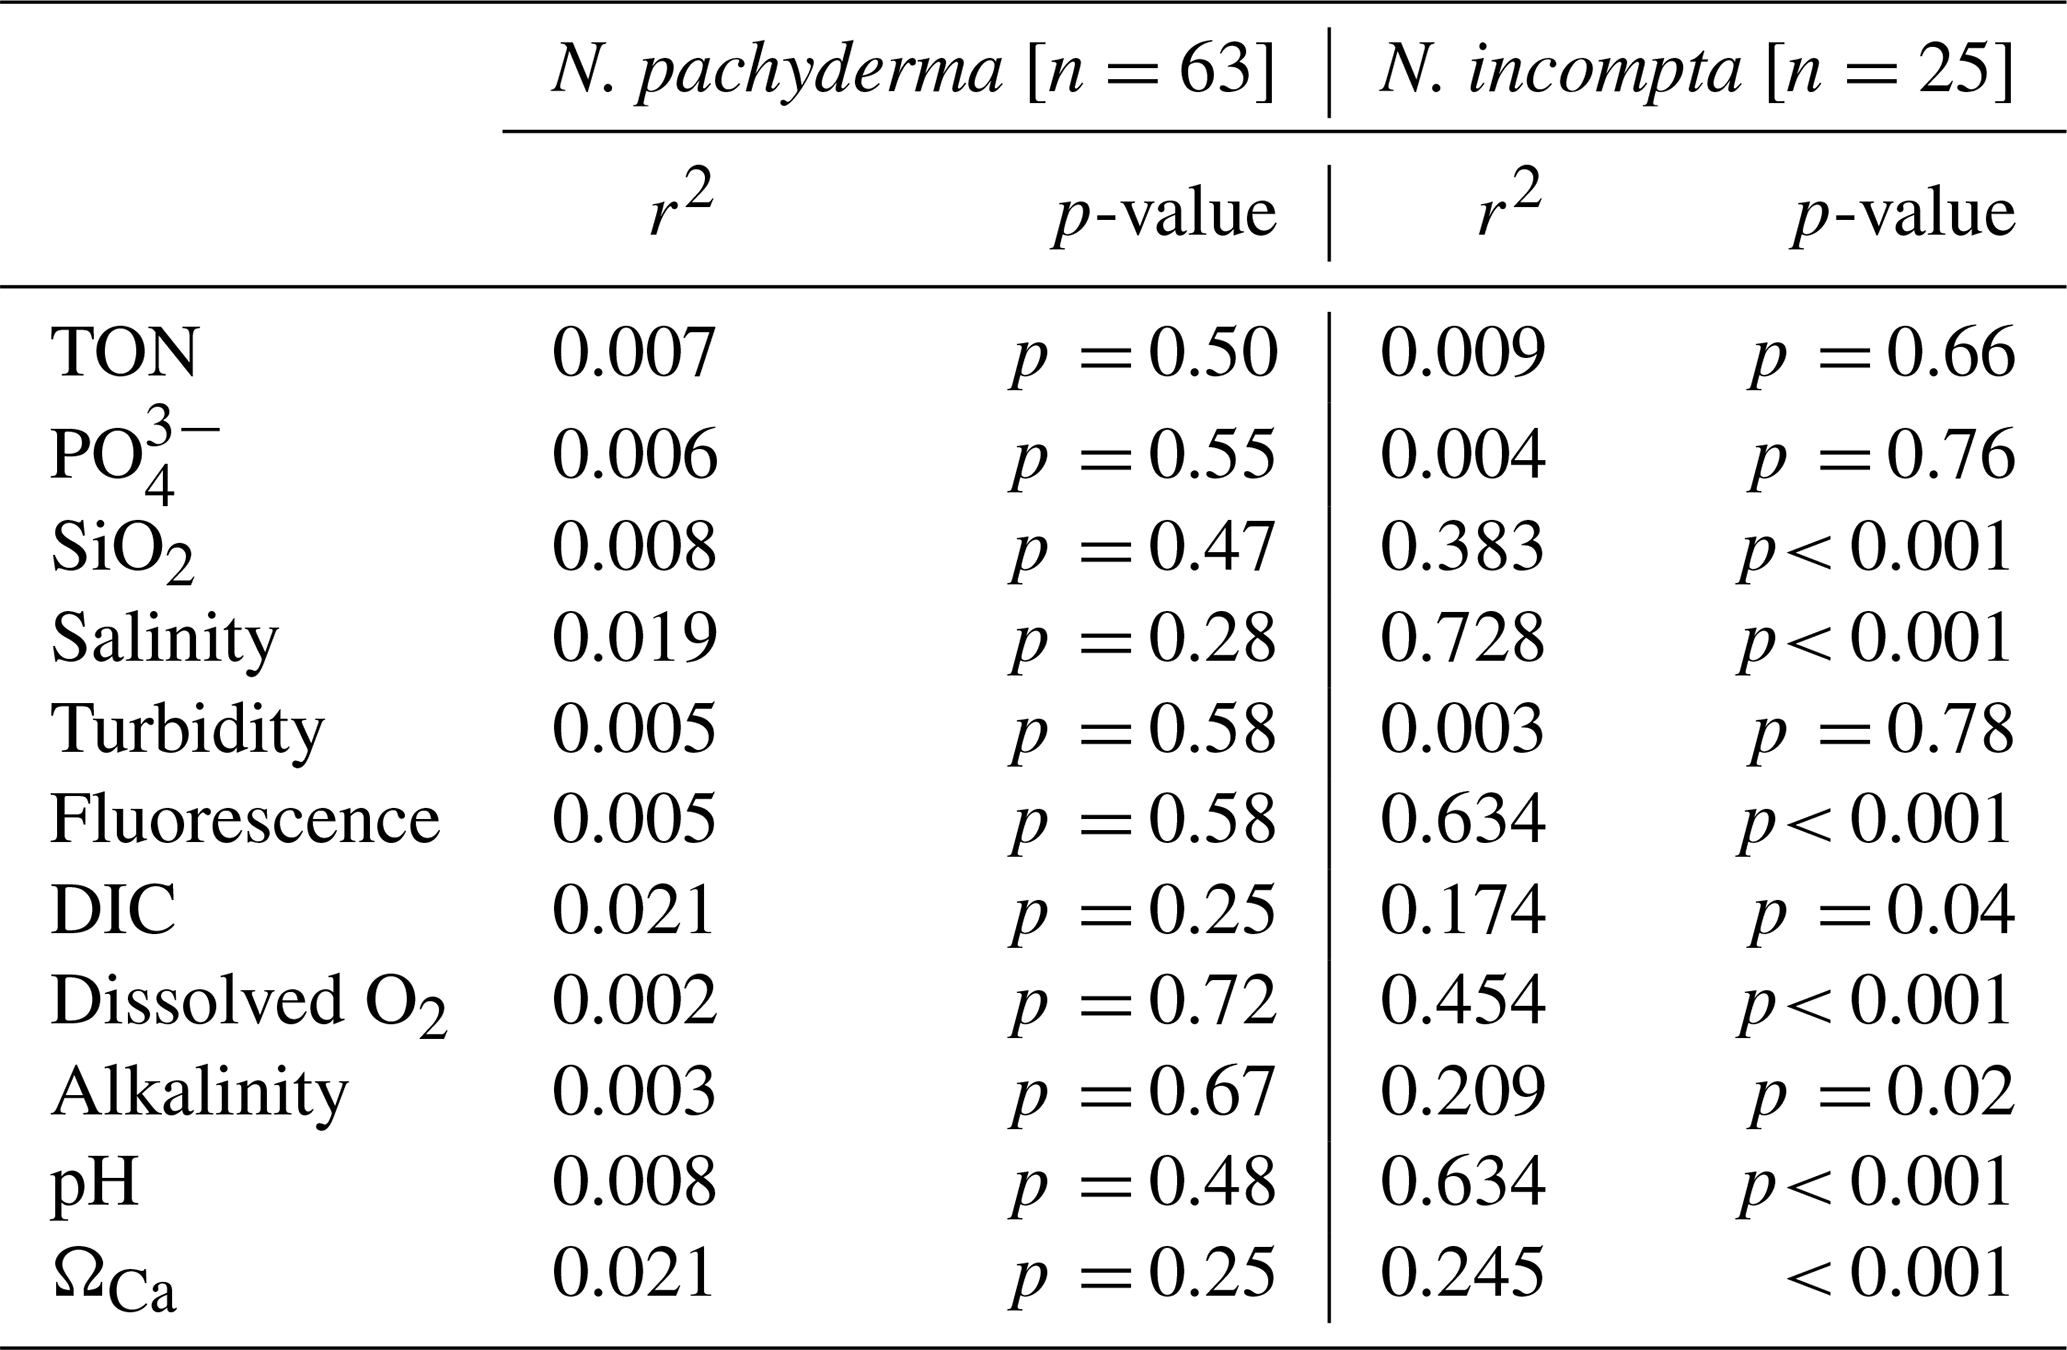
Table 4Quantification of the correlations and Q10 between log10 size-normalised respiration and temperature in N. pachyderma, N. incompta and T. quinqueloba for in-situ (2023) and laboratory (2024) measured respiration.

3.3 Comparison to previously published respiration rates on planktonic foraminifera
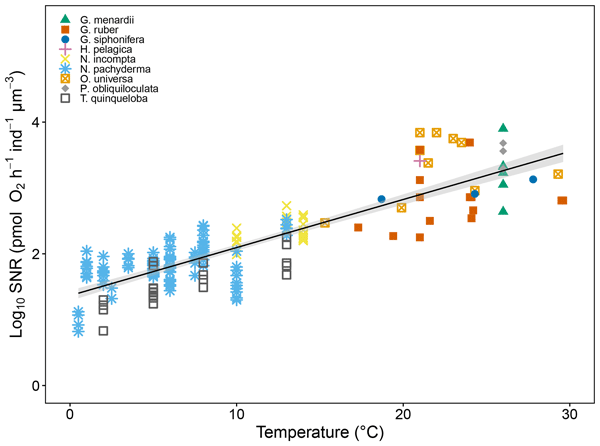
To quantify the effect of temperature on size-normalised respiration rates, we combined our dataset with previous studies carried out by Lombard et al. (2009) on Orbulina universa, Globigerinoides ruber and Globigerinella siphonifera, by Rink et al. (1998) on O. universa and Burke et al. (2025) on Globorotalia menardii, Pulleniatina obliquiloculata, Hastigerina pelagica, O. universa and G. ruber (Fig. 7). Test biovolumes for N. pachyderma, N. incompta and T. quinqueloba were computed using the relationship between cavity volume and maximum diameter (Fig. 3) derived in this study. We compare our results to previous studies by using biovolumes reported in Burke et al. (2025). This ensures a like-for-like comparison across studies. Results show that the respiration rates of all planktonic foraminifera included here follow Eq. (5):
Where Rbiovolume is the respiration rate normalised by biovolume (instead of , and t is the temperature at which the respiration rate was measured (r2=0.72, n=196 and p<0.001). We found that when normalised to 4, 15 and 24 °C (Fig. 8), respiration rates scale positively with biovolume across all datasets. The relationships are best described by linear regression following:
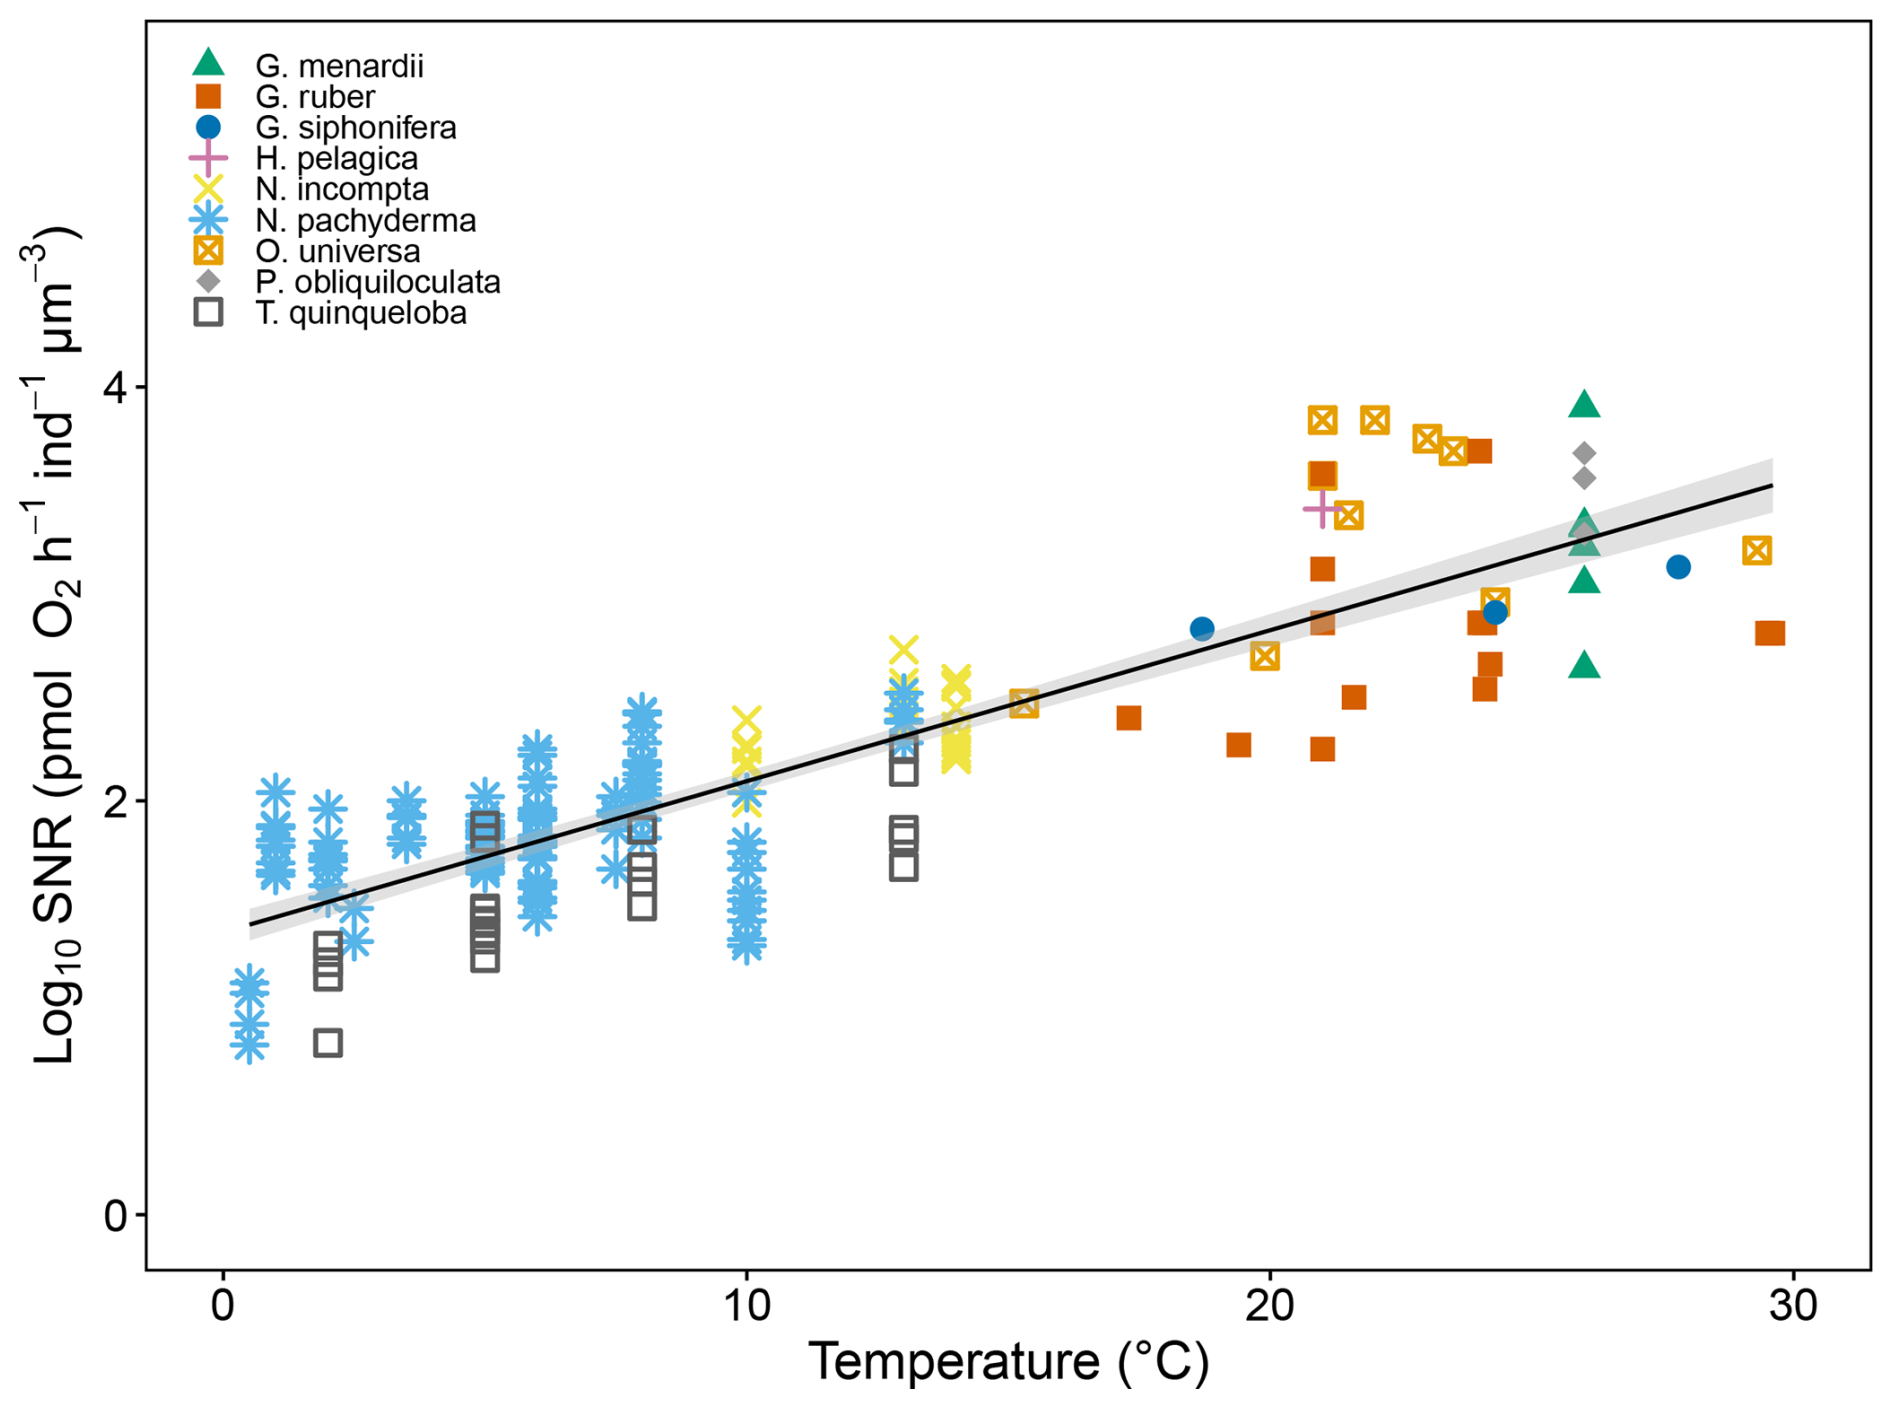
Figure 7The effect of temperature (°C) on log10 size-normalised respiration rate (pmol O2 h−1 ind−1 µm−3) in this study and previously published data (Rink et al., 1998; Lombard et al., 2009 and Burke et al., 2025). The grey shaded regions represent the 95 % confidence interval of the regression model. The source data for this figure is available in Table S11.
The relationships described by Eq. (6) across different temperatures are:
Where Rx=log 10 respiration rate normalised to x °C and BV = log10 Biovolume (µm3). The steepest slope occurs when normalizing to 24 °C (R24 = 0.68 ± 0.05), followed by 15 °C (R15 = 0.57 ± 0.04), and 4 °C (R4 = 0.40 ± 0.03). R2 values range between 0.42 and 0.55, indicating that while biovolume is a significant predictor of respiration, other biological or environmental factors likely contribute to the observed variability. Nevertheless, the consistent significance (p<0.01) across all regressions underscores the robustness of the biovolume-respiration relationship.
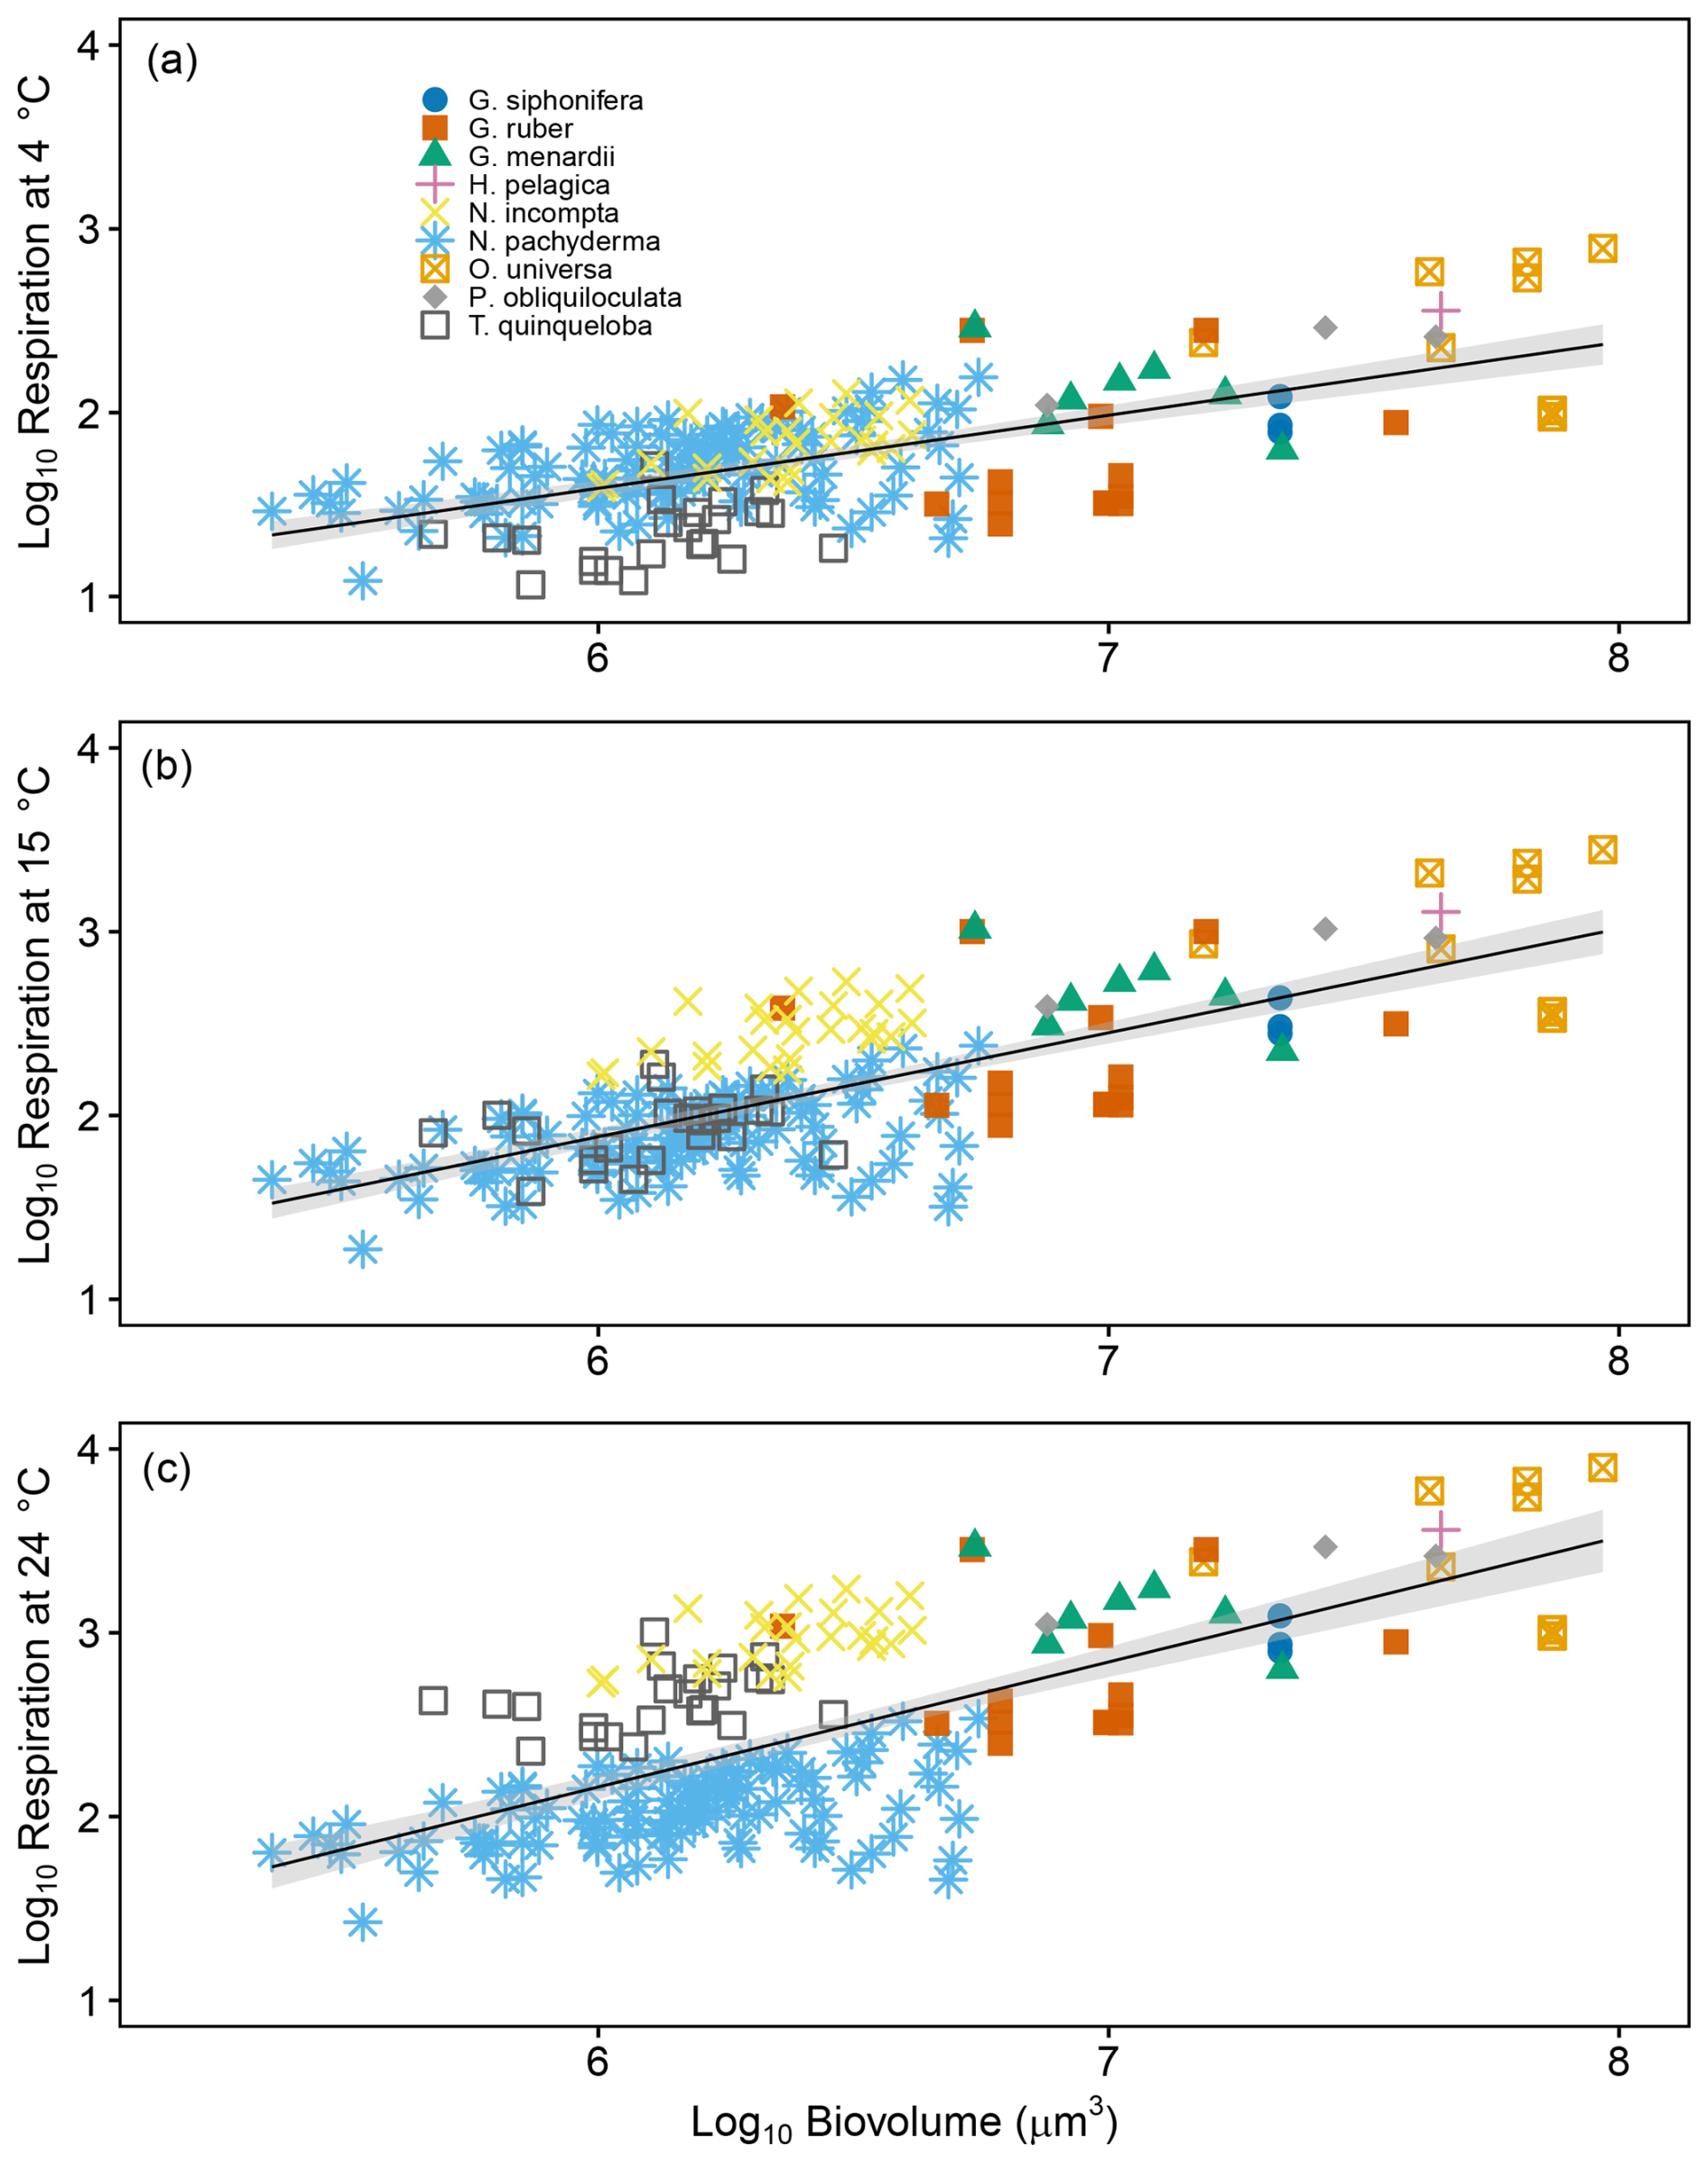
Figure 8Scaling of individual planktonic respiration rates as a function of estimated biovolume with respiration normalised either using species-specific Q10s established in this study or a uniform Q10 of 3.18 from Lombard et al. (2009). Data includes previously published sources (Rink et al., 1998; Lombard et al., 2009 and Burke et al., 2025). Panels show normalisation to (a) 4 °C, (b) 15 °C and (c) 24 °C. Grey shaded regions represent the 95 % confidence intervals of the regression models. The source data for this figure is available in Table S12.
4.1 Respiration Rates and Environmental Stability
One of the most striking findings of this study is the metabolic stability of N. pachyderma across a wide range of ECVs and nutrients. Respiration rates in N. pachyderma are stable across pH (7.89–8.12), salinity (34.57–35.09 psu), dissolved oxygen (2.31–2.66 mL L−1), alkalinity (2185–2317 µmol kg−1), and ΩCa (1.22–3.52) as well as nutrients (Fig. 6). This physiological resilience suggests that the polar genotype of N. pachyderma (Type I in Darling et al., 2004) evolved to adapt to the extreme and variable environment of the Arctic Ocean. We did not genotype the specimens in this study. However, Darling et al. (2004 and 2007) found only one genotype of N. pachyderma (e.g., Type I) in the subpolar North Atlantic/Arctic Ocean, which was also confirmed by Bird et al. (2025). Only when exposed to temperatures outside of its habitat range in the laboratory (e.g., 13 °C), we recorded a small but significant increase in respiration rate.
The low thermal sensitivity of N. pachyderma, is reflected in a Q10 value of 1.48 (Table 4) across the 0.5 to 10 °C range (based on ship-based data) and suggests a successful physiological adaptation to cold environments. Low Q10 values have been interpreted as characteristic of the optimal temperature range of a species in its natural habitat (Wieser, 1973). This suggests that N. pachyderma (Type I) functions at its metabolic optimum in present-day Arctic conditions. Notably, respiration rates do not decline at the low temperatures measured, unlike in other species, which often exhibit constrained metabolic activity under extreme cold conditions.
Molecular evidence presented by Darling et al. (2004, 2007) suggests that the N. pachyderma population presently living at high northern latitudes became isolated during the onset of Northern Hemisphere Glaciations, between 1.8 and 1.5 million years ago, a period marked by the expansion of the polar ice sheets and the establishment of persistently cold oceanic conditions. Furthermore, Kucera and Kennett (2002) proposed that the species-specific cold-water affinity of N. pachyderma may have evolved in response to the onset of the 100 000-year glacial-interglacial climate cycles during the Middle Pleistocene. Furthermore, an increase in N. pachyderma test sizes over the last 1.1 million years may represent an adaptive response to cold environments of the Quaternary (Huber et al., 2000). The current polar affinity of N. pachyderma may thus represent an evolutionary legacy of this climatic transition.
While we did not genotype T. quinqueloba, it is likely that our specimens belong to one of the two Arctic-associated genotypes, with type IIa occurring in both the subpolar Arctic and subpolar Antarctic, and type IIb restricted to the subpolar Arctic (Darling et al., 2000). T. quinqueloba displayed a high Q10 value of 4.43 in our experiments, indicating a strong temperature dependence that may influence its metabolic performance, growth, and survival (Mundim et al., 2020). This contrasts with the lower Q10 of 1.48 observed in N. pachyderma, highlighting clear interspecific differences in thermal sensitivity. T. quinqueloba is a spinose species, however its ecology and physiology differ markedly from symbiont-bearing tropical taxa for which elevated Q10 values have been reported previously (Lombard et al., 2009). Although preliminary, the relatively high Q10 observed for the non-spinose N. incompta suggests that spine presence or absence does not reliably predict thermal sensitivity. Instead, we posit that temperature responses are species-specific, reflecting distinct ecological strategies rather than broad morphological categories. Such species-level differences likely contribute to the latitudinal partitioning of planktonic foraminiferal assemblages, with taxa occupying thermal niches that reflect their individual physiological tolerances (Bé and Tolderlund, 1971; Ying et al., 2023).
4.2 Volume Scaling and Metabolic Allometry
While a positive log-log relationship between biomass, weight or volume and respiration is usually observed in micro/meiofauna (e.g. Fenchel and Finlay, 1983; Gerlach et al., 1985; Moens et al., 1999; Moodley et al., 2008), mixed results have been reported for this relationship in foraminifera. Some studies have found a positive correlation (Bradshaw, 1961; Geslin et al., 2011; Maciute et al., 2023), while others have not (Hannah et al., 1994; Nomaki et al., 2007). However, neither Hannah et al. (1994) nor Nomaki et al. (2007) use micro-CT scanning to estimate biovolumes. Nomaki et al. (2007) used the relationship between test size and organic content (Altenbach, 1987), while Hannah et al. (1994) used 75 % of the best-fitting geometric shape to estimate total internal test volume, a methodology with potential issues as suggested in Sect. 3.1. above. Our results showed a positive linear correlation between respiration and biovolume (Fig. 8) across the polar and subpolar populations of N. pachyderma, N. incompta, and T. quinqueloba, consistent with pelagic foraminiferal species exclusively growing in warmer subtropical and tropical oceans (Burke et al., 2025; Lombard et al., 2009 and Rink et al., 1998). This supports earlier findings that body size is a significant determinant of metabolic rate in foraminifera (Rink et al., 1998; Geslin et al., 2011).
Furthermore, our analysis (Fig. 8) reveals a consistent and positive scaling relationship between biovolume and respiration rates across all temperature normalisations (4, 15, and 24 °C). This demonstrates that within a species, larger planktonic foraminifera exhibit higher metabolic rates, even when respiration is normalised to account for temperature effects using both species-specific and uniform Q10 values (Table 4). Comparison of respiration–biovolume relationships for N. pachyderma and N. incompta in Fig. 8a (4 °C) and Fig. 8b (15 °C) indicates that N. incompta surpasses N. pachyderma at the higher temperature of 15 °C, showing a crossover between 4 and 15 °C that reflects the point at which the relative size-normalised respiration of the two species changes under temperature normalisation. This intersection suggests a potential physiological tipping point below 15 °C, where the metabolic efficiency of N. pachyderma begins to exceed that of N. incompta. This aligns with observed shifts in assemblage dominance across temperature gradients, with N. pachyderma prevailing in colder polar waters and N. incompta in subpolar to temperate regions (Bé and Hutson, 1977; Al-Sabouni et al., 2007; Husum and Hald, 2012; Chaabane et al., 2024). These differences likely reflect species-specific thermal sensitivities that could play a role in defining their biogeographic boundaries. It also highlights the value of using species-specific Q10 values to resolve fine-scale metabolic differences that may underlie broader ecological patterns.
Our results are broadly consistent with Kleiber's Law, which predicts sublinear scaling of metabolic rate with body size (Kleiber, 1932). We observed positive, sublinear relationships between respiration and biovolume across all temperature-normalised datasets, with slopes increasing from 0.40 at 4 °C to 0.68 at 24 °C. While Kleiber's canonical exponent is not fully met, the trend supports the principle that larger foraminifera have higher, but less-than-proportional, metabolic rates. Interestingly, DeLong et al. (2010) showed that metabolic scaling varies across evolutionary transitions – being super linear in prokaryotes, linear in protists, and sublinear in metazoans. The position of foraminiferal scaling within this framework should be interpreted cautiously, as cross-study comparisons involve heterogeneous datasets and methodologies. However, the pattern raises the possibility that planktonic foraminifera may exhibit metabolic behaviour intermediate between protists (which they are) and metazoans, potentially reflecting their large cell size that overlaps with the size of small metazoans, structural complexity, calcification, or ecological specialisation. This remains a hypothesis that warrants further targeted investigation.
4.3 Proxy Reliability
A central concern for proxy-based climate reconstructions is the potential impact of physiological processes on test geochemistry (Pérez-Huerta and Andrus, 2010). Variations in calcification and respiration rate in non-spinose species can alter pH and carbonate chemistry in the foraminiferal microenvironment, potentially affecting , δ11B, δ18O and δ13C values in (Wolf-Gladrow et al., 1999; Zeebe and Sanyal, 2002). However, our data show that respiration in N. pachyderma remains stable across both temperature and pH gradients typically encountered in its natural range (Fig. 5). Respiration rates are also consistent and stable across a large range of other ECVs measured, suggesting that respiration is unlikely to introduce significant uncertainties into geochemical-based palaeotemperature reconstructions for this species. These results also agree well with the recent δ11B–pH calibration for N. pachyderma that shows δ11B values for this species are consistently offset from seawater borate (de la Vega et al., 2025). Consequently, our findings alleviate concerns about physiological confounding due to respiration. However, this may not be the case for N. incompta and T. quinqueloba. The elevated Q10 values for these two species may call for the development of species-specific calibration equations that consider the influence of respiration for accurate proxy application. Whether genotype could have implications for accurate proxy applications is dependent on the species with both N. pachyderma and N. incompta only having one genotype (Type I) found in the Arctic/North Atlantic while T. quinqueloba has two genotypes (Type IIa and Type IIb) (Darling et al., 2000; Darling et al., 2006).
4.4 Conclusions
By avoiding overestimation biases inherent in geometric models, micro-CT-derived biovolumes strengthen the foundation for future studies on respiration in foraminifera. These methodological improvements enhance the accuracy of single-specimen respiration rate assessments and facilitate more accurate interspecies comparisons. Furthermore, our study demonstrates that there is no significant relationship between respiration and temperature or other ECVs (salinity, pH, dissolved oxygen, alkalinity, and ΩCa) or nutrients (SiO2, DIC, PO, and TON) in N. pachyderma, suggesting this polar species has a strong thermal resistance and is well adapted to its unique environment. On the other hand, T. quinqueloba and N. incompta exhibit a statistically significant relationship between respiration and temperature, demonstrating large physiological diversity among planktonic foraminifera inhabiting overlapping climate zones. Additionally, we demonstrate a strong relationship between biovolume and respiration rate, underscoring the importance of size grading when using proxies. We conclude that for N. pachyderma respiration is unlikely to influence geochemical climate proxies.
All data needed to evaluate the conclusions in the paper are presented in the paper and/or the Supplement.
The supplement related to this article is available online at https://doi.org/10.5194/bg-23-3655-2026-supplement.
DVA carried out respiration measurements at UiT and carried out micro-CT scanning at the University of Galway. In addition, she compiled and analysed all datasets and wrote the original draft of the manuscript. AM conceptualized the project, acquired funding, designed and carried out respiration experiments on board the Celtic Explorer (CE23011) as well as in the laboratory at UiT. In addition, she supervised DVA in all data analysis and writing of the original draft. NG supported method development, experimental design, and respiration measurements during CE23011 and contributed to the final version of this manuscript. TLW and EdlV performed Alkalinity and DIC measurements on board CE23011 and at the Marine Institute and contributed to the final version of this manuscript. In addition, TLW supported DVA with micro-CT scanning and analysis of images using AMIRA. MME was the chief scientist on the ARCLIM-24-1 cruise on the RV Helmer Hansen, supported the collection of live foraminifera, provided culturing facilities, and contributed to the final version of this manuscript. AW, FES and AF supported the collection of live foraminifera during both expeditions and contributed to the final version of this manuscript. In addition, AF supported DVA with micro-CT scanning and analysis of images using AMIRA. JM provided support in collection and culturing of live foraminifera during both expeditions and contributed to the final version of this manuscript. TLB contributed to discussions on the initial conceptualization of the experimental design and method development of the nano-respiration system.
The contact author has declared that none of the authors has any competing interests.
Publisher's note: Copernicus Publications remains neutral with regard to jurisdictional claims made in the text, published maps, institutional affiliations, or any other geographical representation in this paper. The authors bear the ultimate responsibility for providing appropriate place names. Views expressed in the text are those of the authors and do not necessarily reflect the views of the publisher.
We gratefully acknowledge the support of the crew on the RV Celtic Explorer sailing under Master Anthony Hobin and the crew of the R/V Helmer Hanssen.
A.M. acknowledges funding by Research Ireland and the Geological Survey of Ireland under the SFI Frontiers for the Future Programme 21/FFP-P/10261 and Grant in Aid funding from the Marine Institute for research expedition CE23011 on the RV Celtic Explorer. N.G. acknowledges funding from the Deutsche Forschungsgesellschaft (DFG) under grant number GL 999/3-1. M.M.E, F.S and A.W. acknowledge funding from the ARCLIM project, a Tromsø Research Foundation (TFS) starting grant project, with grant number: A31720.
This paper was edited by Chiara Borrelli and reviewed by Adam Woodhouse and one anonymous referee.
Al-Sabouni, N., Kucera, M., and Schmidt, D. N.: Vertical niche separation control of diversity and size disparity in planktonic foraminifera, Mar. Micropaleontol., 63, 75–90, https://doi.org/10.1016/j.marmicro.2006.11.002, 2007.
Altenbach, A. V.: The measurement of organic carbon in foraminifera, J. Foramin. Res., 17, 106–109, https://doi.org/10.2113/gsjfr.17.2.106, 1987.
Anglada-Ortiz, G., Rasmussen, T. L., Chierici, M., Fransson, A., Ziveri, P., Thomsen, E., Zamelczyk, K., Meilland, J., Ezat, M. M., and Garcia-Orellana, J.: Changes in Planktic Foraminiferal Distribution, Productivity, and Preservation in the Barents Sea During the Last Three Millennia, Paleoceanography and Paleoclimatology, 40, e2024PA004989, https://doi.org/10.1029/2024PA004989, 2025.
Baum, D. and Titschack, J.: Cavity and Pore Segmentation in 3D Images with Ambient Occlusion, EuroVis '16: Proceedings of the Eurographics/IEEE VGTC Conference on Visualization: Short Papers, 113–117, https://dl.acm.org/doi/abs/10.5555/3058878.3058902 (last access: 22 May 2026), 2016
Bé, A. W. and Hutson, W. H.: Ecology of planktonic foraminifera and biogeographic patterns of life and fossil assemblages in the Indian Ocean, Micropaleontology, 23, 369–414, https://doi.org/10.2307/1485406, 1977.
Bé, A. W. and Tolderlund, D. S.: Distribution and ecology of living planktonic foraminifera in surface waters of the Atlantic and Indian Oceans, in: The Micropalentology of the Oceans, edited by: Funnel, B. M. and Riedel, W. R., Cambridge University Press, London, 105–149, ISBN 0521076420, 1971.
Bertlich, J., Gussone, N., Berndt, J., Arlinghaus, H. F., and Dieckmann, G. S.: Salinity effects on cultured Neogloboquadrina pachyderma (sinistral) from high latitudes: new paleoenvironmental insights, Geo-Mar. Lett., 41, 2, https://doi.org/10.1007/s00367-020-00677-1, 2021.
Bird, C., Darling, K., Thiessen, R., and Pieńkowski, A. J.: The microbiome of the Arctic planktonic foraminifera Neogloboquadrina pachyderma is composed of fermenting and carbohydrate-degrading bacteria and an intracellular diatom chloroplast store, Biogeosciences, 22, 4545–4577, https://doi.org/10.5194/bg-22-4545-2025, 2025.
Bradshaw, J. S.: Laboratory experiments on the ecology of foraminifera, Cushman Found Foram. Res., Contr., 12, 87–106, 1961.
Broecker, W. S. and Peng, T.-H.: Gas exchange rates between air and sea, Tellus A, 26, 21–35, https://doi.org/10.3402/tellusa.v26i1-2.9733, 1974.
Burke, J. E., Renema, W., Schiebel, R., and Hull, P. M.: Three-dimensional analysis of inter-and intraspecific variation in ontogenetic growth trajectories of planktonic foraminifera, Mar. Micropaleontol., 155, 101794, https://doi.org/10.1016/j.marmicro.2019.101794, 2020.
Burke, J. E., Elder, L. E., Maas, A. E., Gaskell, D. E., Clark, E. G., Hsiang, A. Y., Foster, G. L., and Hull, P. M.: Physiological and morphological scaling enables gigantism in pelagic protists, Limnol. Oceanogr., 70, 461–476, https://doi.org/10.1002/lno.12770, 2025.
Cesbron, F., Geslin, E., Jorissen, F. J., Delgard, M. L., Charrieau, L., Deflandre, B., Jézéquel, D., Anschutz, P., and Metzger, E.: Vertical distribution and respiration rates of benthic foraminifera: Contribution to aerobic remineralization in intertidal mudflats covered by Zostera noltei meadows, Estuar. Coast. Shelf S., 179, 23–38, https://doi.org/10.1016/j.ecss.2015.12.005, 2016.
Chaabane, S., de Garidel-Thoron, T., Meilland, J., Sulpis, O., Chalk, T. B., Brummer, G.-J. A., Mortyn, P. G., Giraud, X., Howa, H., Casajus, N., Kuroyanagi, A., Beaugrand, G., and Schiebel, R.: Migrating is not enough for modern planktonic foraminifera in a changing ocean, Nature, 636, 390–396, https://doi.org/10.1038/s41586-024-08191-5, 2024.
Coletti, G., Stainbank, S., Fabbrini, A., Spezzaferri, S., Foubert, A., Kroon, D., and Betzler, C.: Biostratigraphy of large benthic foraminifera from Hole U1468A (Maldives): a CT-scan taxonomic approach, Swiss J. Geosci., 111, 523–536, https://doi.org/10.1007/s00015-018-0306-7, 2018.
Darling, K. F., Wade, C. M., Stewart, I. A., Kroon, D., Dingle, R., and Brown, A. J. L.: Molecular evidence for genetic mixing of Arctic and Antarctic subpolar populations of planktonic foraminifers, Nature, 405, 43–47, https://doi.org/10.1038/35011002, 2000.
Darling, K. F., Kucera, M., Pudsey, C. J., and Wade, C. M.: Molecular evidence links cryptic diversification in polar planktonic protists to Quaternary climate dynamics, P. Natl. Acad. Sci. USA, 101, 7657–7662, https://doi.org/10.1073/pnas.0402401101, 2004.
Darling, K. F., Kucera, M., Kroon, D., and Wade, C. M.: A resolution for the coiling direction paradox in Neogloboquadrina pachyderma, Paleoceanography, 21, PA2011, https://doi.org/10.1029/2005PA001189, 2006.
Darling, K. F., Kucera, M., and Wade, C. M.: Global molecular phylogeography reveals persistent Arctic circumpolar isolation in a marine planktonic protist, P. Natl. Acad. Sci. USA, 104, 5002–5007, https://doi.org/10.1073/pnas.0700520104, 2007.
Davis, C. V., Rivest, E. B., Hill, T. M., Gaylord, B., Russell, A. D., and Sanford, E.: Ocean acidification compromises a planktic calcifier with implications for global carbon cycling, Scientific reports, 7, 2225, https://doi.org/10.1038/s41598-017-01530-9, 2017.
de la Vega, E., Raitzsch, M., Foster, G. L., Bijma, J., Ninnemann, U. S., Kucera, M., Babila, T. L., Crumpton Banks, J., Ezat, M. M., and Morley, A.: A δ11B-pH calibration for the high-latitude foraminifera species Neogloboquadrina pachyderma and Neogloboquadrina incompta, Biogeosciences, 22, 6765–6785, https://doi.org/10.5194/bg-22-6765-2025, 2025.
DeLong, J. P., Okie, J. G., Moses, M. E., Sibly, R. M., and Brown, J. H.: Shifts in metabolic scaling, production, and efficiency across major evolutionary transitions of life, P. Natl. Acad. Sci. USA, 107, 12941–12945, https://doi.org/10.1073/pnas.1007783107, 2010.
de Nooijer, L. J., Spero, H. J., Erez, J., Bijma, J., and Reichart, G. J.: Biomineralization in perforate foraminifera, Earth-Sci. Rev., 135, 48–58, https://doi.org/10.1016/j.earscirev.2014.03.013, 2014.
Dickson, A. G. and Riley, J. P.: The estimation of acid dissociation constants in seawater media from potentiometric titrations with strong base. I. The ionic product of water – Kw, Mar. Chem., 7, 89–99, https://doi.org/10.1016/0304-4203(79)90001-X, 1979.
Eggins, S. M., Sadekov, A., and De Deckker, P.: Modulation and daily banding of in Orbulina universa tests by symbiont photosynthesis and respiration: a complication for seawater thermometry?, Earth Planet. Sci. Lett., 225, 411–419, https://doi.org/10.1016/j.epsl.2004.06.019, 2004.
El Bani Altuna, N., Pieńkowski, A. J., Eynaud, F., and Thiessen, R.: The morphotypes of Neogloboquadrina pachyderma: Isotopic signature and distribution patterns in the Canadian Arctic Archipelago and adjacent regions, Mar. Micropaleontol., 142, 13–24, https://doi.org/10.1016/j.marmicro.2018.05.004, 2018.
Fabbrini, A., Pearson, P. N., Brombacher, A., Iacoviello, F., Ezard, T. H. G., and Wade, B. S.: Morphology of Pulleniatina (planktonic foraminifera) from optical microscopy, micro-CT, and SEM investigations, J. Micropalaeontol., 44, 213–235, https://doi.org/10.5194/jm-44-213-2025, 2025.
Fenchel, T. and Finlay, B. J.: Respiration rates in heterotrophic, free-living protozoa, Microb. Ecol., 9, 99–122, https://doi.org/10.1007/BF02015125, 1983.
Gaskell, D. E., Ohman, M. D., and Hull, P. M.: Zooglider-based measurements of planktonic foraminifera in the California Current System, J. Foramin. Res., 49, 390–404, https://doi.org/10.2113/gsjfr.49.4.390, 2019
Gerlach, S. A., Hahn, A. E., and Schrage, M.: Size spectra of benthic biomass and metabolism, Mar. Ecol. Prog. Ser., 26, 161–173, http://www.jstor.org/stable/24817617 (last access: 22 May 2026), 1985.
Geslin, E., Risgaard-Petersen, N., Lombard, F., Metzger, E., Langlet, D., and Jorissen, F.: Oxygen respiration rates of benthic foraminifera as measured with oxygen microsensors, J. Exp. Mar. Biol. Ecol., 396, 108–114, https://doi.org/10.1016/j.jembe.2010.10.011, 2011.
Glock, N., Romero, D., Roy, A. S., Woehle, C., Dale, A. W., Schönfeld, J., Wein, T., Weissenbach, J., and Dagan, T.: A hidden sedimentary phosphate pool inside benthic foraminifera from the Peruvian upwelling region might nucleate phosphogenesis, Geochim. Cosmochim. Ac., 289, 14–32, https://doi.org/10.1016/j.gca.2020.08.002, 2020.
Glock, N., Richirt, J., Woehle, C., Algar, C., Armstrong, M., Eichner, D., Firrincieli, H., Makabe, A., Govindankutty Menon, A., Ishitani, Y., Hackl, T., Hubert-Huard, R., Kienast, M., Milker, Y., Mutzberg, A., Ni, S., Okada, S., Rakshit, S., Schmiedl, G., Steiner, Z., Tame, A., Zhang, Z., and Nomaki, H.: Widespread occurrence and relevance of phosphate storage in foraminifera, Nature, 638, 1000–1006, https://doi.org/10.1038/s41586-024-08431-8, 2025.
Greco, M., Jonkers, L., Kretschmer, K., Bijma, J., and Kucera, M.: Depth habitat of the planktonic foraminifera Neogloboquadrina pachyderma in the northern high latitudes explained by sea-ice and chlorophyll concentrations, Biogeosciences, 16, 3425–3437, https://doi.org/10.5194/bg-16-3425-2019, 2019.
Greco, M., Meilland, J., Zamelczyk, K., Rasmussen, T. L., and Kučera, M.: The effect of an experimental decrease in salinity on the viability of the Subarctic planktonic foraminifera Neogloboquadrina incompta, Polar Res., 39, https://doi.org/10.33265/polar.v39.3842, 2020.
Hannah, F., Rogerson, R., and Laybourn-Parry, J.: Respiration rates and biovolumes of common benthic Foraminifera (Protozoa), J. Mar. Biol. Ass., 74, 301–312, https://doi.org/10.1017/S0025315400039345, 1994.
Hemleben, C., Spindler, M., and Anderson, O. R.: Taxonomy and Species Features, in: Modern Planktonic Foraminifera, edited by: Hemleben, C., Spindler, M., and Anderson, O. R., Springer, New York, NY, 8–32, https://doi.org/10.1007/978-1-4612-3544-6_2, 1989.
Hoogakker, B. A. A., Anderson, C., Paoloni, T., Stott, A., Grant, H., Keenan, P., Mahaffey, C., Blackbird, S., McClymont, E. L., Rickaby, R., Poulton, A., and Peck, V. L.: Planktonic foraminifera organic carbon isotopes as archives of upper ocean carbon cycling, Nat. Commun., 13, 4841, https://doi.org/10.1038/s41467-022-32480-0, 2022.
Huber, R., Meggers, H., Baumann, K.-H., Raymo, M. E., and Henrich, R.: Shell size variation of the planktonic foraminifer Neogloboquadrina pachyderma sin. in the Norwegian–Greenland Sea during the last 1.3 Myrs: implications for paleoceanographic reconstructions, Palaeogeogr. Palaeocl., 160, 193–212, https://doi.org/10.1016/S0031-0182(00)00066-3, 2000.
Husum, K. and Hald, M.: Arctic planktic foraminiferal assemblages: Implications for subsurface temperature reconstructions, Mar. Micropaleontol., 96–97, 38–47, https://doi.org/10.1016/j.marmicro.2012.07.001, 2012.
Kanbur, S.: Neglected small foraminifers of the Eastern Mediterranean and their paleoecological importance, J. Foramin. Res., 55, 218–232, https://doi.org/10.61551/gsjfr.55.2.218, 2025.
Kiss, P., Hudáčková, N., Titschack, J., Siccha, M. G. R., Heřmanová, Z., Silye, L., Ruman, A., Rybár, S., and Kučera, M.: Convergent evolution of spherical shells in Miocene planktonic foraminifera documents the parallel emergence of a complex character in response to environmental forcing, Paleobiology, 49, 454–470, https://doi.org/10.1017/pab.2022.48, 2023.
Kleiber, M.: Body size and metabolism, Hilgardia, 6, 315, https://ageconsearch.umn.edu/record/381981/files/v06n11p315.pdf (last access: 22 May 2026), 1932.
Köhler-Rink, S. and Kühl, M.: Microsensor studies of photosynthesis and respiration in the larger symbiont bearing foraminifera Amphistegina lobifera, and Amphisorus hemprichii, Ophelia, 55, 111–122, https://doi.org/10.1080/00785236.2001.10409478, 2001.
Kucera, M. and Kennett, J. P.: Causes and consequences of a middle Pleistocene origin of the modern planktonic foraminifer Neogloboquadrina pachyderma sinistral, Geology, 30, 539–542, https://doi.org/10.1130/0091-7613(2002)030<0539:CACOAM>2.0.CO;2. 2002.
Lewis, E. R. and Wallace, D. W. R.: Program developed for CO2 system calculations, Environmental System Science Data Infrastructure for a Virtual Ecosystem, ESS-Dive [software], https://doi.org/10.15485/1464255, 1998.
Lombard, F., Erez, J., Michel, E., and Labeyrie, L.: Temperature effect on respiration and photosynthesis of the symbiont-bearing planktonic foraminifera Globigerinoides ruber, Orbulina universa, and Globigerinella siphonifera, Limnology and Oceanography, 54, 210–218, https://doi.org/10.4319/lo.2009.54.1.0210, 2009.
Lopes, A. S., Larsen, L. H., Ramsing, N., Løvendahl, P., Raty, M., Peippo, J., Greve, T., and Callesen, H.: Respiration rates of individual bovine in vitro-produced embryos measured with a novel, non-invasive and highly sensitive microsensor system, Reproduction, 130, 669–679, https://doi.org/10.1530/rep.1.00703, 2005.
Lueker, T. J., Dickson, A. G., and Keeling, C. D.: Ocean pCO2 calculated from dissolved inorganic carbon, alkalinity, and equations for K1 and K2: validation based on laboratory measurements of CO2 in gas and seawater at equilibrium, Mar. Chem., 70, 105–119, https://doi.org/10.1016/S0304-4203(00)00022-0, 2000.
Maciute, A., Holovachov, O., Glud, R. N., Broman, E., Berg, P., Nascimento, F. J. A., and Bonaglia, S.: Reconciling the importance of meiofauna respiration for oxygen demand in muddy coastal sediments, Limnol. Oceanogr., 68, 1895–1905, https://doi.org/10.1002/lno.12393, 2023.
Manno, C., Morata, N., and Bellerby, R.: Effect of ocean acidification and temperature increase on the planktonic foraminifer Neogloboquadrina pachyderma (sinistral), Polar Biol., 35, 1311–1319, https://doi.org/10.1007/s00300-012-1174-7, 2012.
Meilland, J., Howa, H., Hulot, V., Demangel, I., Salaün, J., and Garlan, T.: Population dynamics of modern planktonic foraminifera in the western Barents Sea, Biogeosciences, 17, 1437–1450, https://doi.org/10.5194/bg-17-1437-2020, 2020.
Moens, T., Verbeeck, L., and Vincx, M.: Feeding biology of a predatory and a facultatively predatory nematode (Enoploides longispiculosus and Adoncholaimus fuscus), Mar. Biol., 134, 585–593, https://doi.org/10.1007/s002270050573, 1999.
Moodley, L., Steyaert, M., Epping, E., Middelburg, J.J., Vincx, M., van Avesaath, P., Moens, T., and Soetaert, K.: Biomass-specific respiration rates of benthic meiofauna: Demonstrating a novel oxygen micro-respiration system, J. Exp. Mar. Biol. Ecol., 357, 41–47, https://doi.org/10.1016/j.jembe.2007.12.025, 2008.
Motic Instruments Inc.: Moticam X5 Plus, https://moticeurope.com/en/moticam-x5-plus.html (last access: 22 May 2026), 2024.
Mundim, K. C., Baraldi, S., Machado, H. G., and Vieira, F. M.: Temperature coefficient (Q10) and its applications in biological systems: Beyond the Arrhenius theory, Ecol Model., 431, 109127, https://doi.org/10.1016/j.ecolmodel.2020.109127, 2020.
Natland, M. L.: New species of Foraminifera from off the West Coast of North America and from the later Tertiary of the Los Angeles basin. Bulletin of the Scripps Institution of Oceanography, Technical Series, 4, 137–164, https://babel.hathitrust.org/cgi/pt?id=coo.31924065366894&seq=5 (last access: 22 May 2026), 1938.
Nielsen, P., Larsen, L. H., Ramløv, H., and Hansen, B. W.: Respiration rates of subitaneous eggs from a marine calanoid copepod: monitored by nanorespirometry, J. Comp. Physiol. B, 177, 287–296, https://doi.org/10.1007/s00360-006-0128-1, 2007.
Nomaki, H., Yamaoka, A., Shirayama, Y., and Kitazato, H.: Deep-sea benthic foraminiferal respiration rates measured under laboratory conditions, J. Foramin. Res., 37, 281–286, https://doi.org/10.2113/gsjfr.37.4.281, 2007.
Pearson, P. N. and Kucera, M.: Taxonomy, biostratigraphy, and phylogeny of Oligocene Turborotalita, edited by: Wade, B. S., Olsson, R. K., Pearson, P. N., Huber, B. T., and Berggren, W. A., in: Atlas of Oligocene Planktonic Foraminifera, Cushman Foundation of Foraminiferal Research, Special Publication, No. 46, https://www.ucl.ac.uk/earth-sciences/sites/earth_sciences/files/Chapter_12.pdf (last access: 22 May 2026), 2018.
Pérez-Huerta, A. and Andrus, C. F. T.: Vital effects in the context of biomineralization, Seminarios de la Sociedad de Española de Mineralogía, 7, 35–45, https://www.semineral.es/websem/PdfServlet?mod=archivos&subMod=publicaciones&archivo=SEMINARIO_SEM_7_035.pdf (last access: 22 May 2026), 2010.
Rantanen, M., Karpechko, A. Y., Lipponen, A., Nordling, K., Hyvärinen, O., Ruosteenoja, K., Vihma, T., and Laaksonen, A.: The Arctic has warmed nearly four times faster than the globe since 1979, Commun. Earth Environ., 3, 168, https://doi.org/10.1038/s43247-022-00498-3, 2022.
Revsbech, N. P.: An oxygen microsensor with a guard cathode, Limnol. Oceanogr., 34, 474–478, https://doi.org/10.4319/lo.1989.34.2.0474, 1989.
Rink, S., Kühl, M., Bijma, J., and Spero, H. J.: Microsensor studies of photosynthesis and respiration in the symbiotic foraminifer Orbulina universa, Mar. Biol., 131, 583–595, https://doi.org/10.1007/s002270050350, 1998.
Schiebel, R. and Hemleben, C.: Planktic Foraminifers in the Modern Ocean, Springer Berlin/Heidelberg, Berlin, Heidelberg, Germany, https://doi.org/10.1007/978-3-662-50297-6, 2017.
Schiebel, R., Waniek, J., Bork, M., and Hemleben, C.: Planktic foraminiferal production stimulated by chlorophyll redistribution and entrainment of nutrients, Deep-Sea Res. Pt. I, 48, 721–740, https://doi.org/10.1016/S0967-0637(00)00065-0, 2001.
Schlitzer, R.: Ocean data view, https://odv.awi.de (last access: 1 September 2025), 2022.
Schmidt-Nielsen, K.: Animal Physiology: Adaptation and Environment, Cambridge University Press, 630 pp., ISBN 9780521570985, 1997.
Seears, H. A., Darling, K. F., and Wade, C. M.: Ecological partitioning and diversity in tropical planktonic foraminifera, BMC Evol. Biol., 12, 54, https://doi.org/10.1186/1471-2148-12-54, 2012.
Serreze, M. C. and Barry, R. G.: Processes and impacts of Arctic amplification: A research synthesis, Global Planet. Change, 77, 85–96, https://doi.org/10.1016/j.gloplacha.2011.03.004, 2011.
Siccha, M., Morard, R., Meilland, J., Iwasaki, S., Kucera, M., and Kimoto, K.: Collection of X-ray micro computed tomography images of shells of planktic foraminifera with curated taxonomy, Sci. Data, 10, 679, https://doi.org/10.1038/s41597-023-02498-0, 2023.
Spero, H. J. and Lea, D. W.: Intraspecific stable isotope variability in the planktic foraminifera Globigerinoides sacculifer: Results from laboratory experiments, Mar. Micropaleontol., 22, 221–234, https://doi.org/10.1016/0377-8398(93)90045-Y, 1993.
Spero, H. J. and Lea, D. W.: Experimental determination of stable isotope variability in Globigerina bulloides: implications for paleoceanographic reconstructions, Mar. Micropaleontol., 28, 231–246, https://doi.org/10.1016/0377-8398(96)00003-5, 1996.
Spindler, M.: On the salinity tolerance of the planktonic foraminifer Neogloboquadrina pachyderma from the Antarctic Sea Ice (17th Symposium on Polar Biology), Proceedings of the NIPR Symposium on Polar Biology, 9, 85–91, https://doi.org/10.15094/00005306, 1996.
Spindler, M. and Dieckmann, G. S.: Distribution and abundance of the planktic foraminifer Neogloboquadrina pachyderma in sea ice of the Weddell Sea (Antarctica), Polar Biol., 5, 185–191, https://doi.org/10.1007/BF00441699, 1986.
Stalling, D., Westerhoff, M., and Hege, H.-C.: Amira: A Highly Interactive System for Visual Data Analysis, in: Visualization Handbook, Elsevier, 749–767, https://doi.org/10.1016/B978-012387582-2/50040-X, 2005.
Stangeew, E.: Distribution and Isotopic Composition of Living Planktonic Foraminifera N. pachyderma (sinistral) and T. quinqueloba in the High Latitude North Atlantic, Kiel, University, Diss., https://macau.uni-kiel.de/servlets/MCRFileNodeServlet/dissertation_derivate_00000464/d464.pdf (last access: 22 May 2026), 2001.
Takagi, H., Kimoto, K., Fujiki, T., Saito, H., Schmidt, C., Kucera, M., and Moriya, K.: Characterizing photosymbiosis in modern planktonic foraminifera, Biogeosciences, 16, 3377–3396, https://doi.org/10.5194/bg-16-3377-2019, 2019.
Tell, F., Jonkers, L., Meilland, J., and Kucera, M.: Upper-ocean flux of biogenic calcite produced by the Arctic planktonic foraminifera Neogloboquadrina pachyderma, Biogeosciences, 19, 4903–4927, https://doi.org/10.5194/bg-19-4903-2022, 2022.
Titschack, J., Baum, D., Matsuyama, K., Boos, K., Färber, C., Kahl, W.-A., Ehrig, K., Meinel, D., Soriano, C., and Stock, S. R.: Ambient occlusion – A powerful algorithm to segment shell and skeletal intrapores in computed tomography data, Comput. Geosci., 115, 75–87, https://doi.org/10.1016/j.cageo.2018.03.007, 2018.
Unisense: Nanorespiration system manual, https://unisense.com/products/nanorespiration-system/ (last access: 22 May 2026), 2025.
Uppström, L. R.: The boron/chlorinity ratio of deep-sea water from the Pacific Ocean, Deep Sea Research A, 21, 161–162, https://doi.org/10.1016/0011-7471(74)90074-6, 1974.
Volkmann, R.: Planktic foraminifers in the outer Laptev Sea and the Fram Strait- Modern distribution and ecology, J. Foramin. Res., 30, 157–176, https://doi.org/10.2113/0300157, 2000.
Westgård, A., Ezat, M. M., Chalk, T. B., Chierici, M., Foster, G. L., and Meilland, J.: Large-scale culturing of Neogloboquadrina pachyderma, its growth in, and tolerance of, variable environmental conditions, J. Plankton Res., 45, 732–745, https://doi.org/10.1093/plankt/fbad034, 2023.
Wieser, W.: Temperature Relations of Ectotherms: A Speculative Review, in: Effects of Temperature on Ectothermic Organisms, edited by: Wieser, W., Springer Berlin Heidelberg, Berlin, Heidelberg, 1–23, https://doi.org/10.1007/978-3-642-65703-0_1, 1973.
Woelfel, J., Sørensen, K., Warkentin, M., Forster, S., Oren, A., and Schumann, R.: Oxygen evolution in a hypersaline crust: in situ photosynthesis quantification by microelectrode profiling and use of planar optode spots in incubation chambers, Aquat. Microb. Ecol., 56, 263–273, https://doi.org/10.3354/ame01326, 2009.
Wolf-Gladrow, D. A., Bijma, J., and Zeebe, R. E.: Model simulation of the carbonate chemistry in the microenvironment of symbiont bearing foraminifera, Mar. Chem., 64, 181–198, https://doi.org/10.1016/S0304-4203(98)00074-7, 1999.
Ying, R., Monteiro, F. M., Wilson, J. D., and Schmidt, D. N.: ForamEcoGEnIE 2.0: incorporating symbiosis and spine traits into a trait-based global planktic foraminiferal model, Geosci. Model Dev., 16, 813–832, https://doi.org/10.5194/gmd-16-813-2023, 2023.
Zamelczyk, K., Fransson, A., Chierici, M., Jones, E., Meilland, J., Anglada-Ortiz, G., and Lødemel, H. H.: Distribution and Abundances of Planktic Foraminifera and Shelled Pteropods During the Polar Night in the Sea-Ice Covered Northern Barents Sea, Front. Mar. Sci., 8, https://doi.org/10.3389/fmars.2021.644094, 2021.
Zeebe, R. E. and Sanyal, A.: Comparison of two potential strategies of planktonic foraminifera for house building: Mg2+ or H+ removal?, Geochim. Cosmochim. Ac., 66, 1159–1169, https://doi.org/10.1016/S0016-7037(01)00852-3, 2002.
ZEISS: Xradia VERSA 620 User Manual, https://www.zeiss.com (last access: 22 May 2026), 2024.