the Creative Commons Attribution 4.0 License.
the Creative Commons Attribution 4.0 License.
 | 16 Jun 2026
Surface area and Ω-aragonite oversaturation as controls of the runaway precipitation process in ocean alkalinity enhancement
Niels Suitner
Selene Varliero
Giulia Faucher
Philipp Suessle
Charly A. Moras
Ocean alkalinity enhancement (OAE) is a strategy for marine carbon dioxide removal that aims to increase the total alkalinity (TA) of seawater to sequester atmospheric CO2 in the form of dissolved inorganic carbon (DIC). An intense alkalinization of seawater resulting from OAE treatment could trigger a significant runaway carbonate precipitation process, which may lead to a loss of initially added TA, thereby limiting its efficiency. Even under natural background aragonite saturation states, a continuous yet barely detectable loss of TA is theoretically expected to occur in seawater. With the additional increase through OAE, time ranges to initiate an appreciable TA-loss process could be reduced significantly. Therefore, predicting the TA stability ranges might be a necessity for application scenarios. The main drivers of the precipitation process are (i) the aragonite saturation state of seawater and (ii) the available surface area for heterogeneous precipitation.
In this study, we refined the use of logistic functions to describe the temporal evolution of both drivers, with experimental datasets using natural seawater from the Raunefjorden (Bergen, Norway; Temp.: ∼11 °C, Sal.: ∼32.6). The observed patterns were then used to derive a process-based model for calculating TA-loss rates, focusing on the accelerated precipitation phase of the runaway process while considering saturation levels and available particle surface area. The formation of carbonate phases reduces seawater TA concentrations, inducing a delay or halting the TA-loss process. In addition, the sinking of precipitated particles decreases the potential for further precipitation by reducing the available surface area in the system. To assess the impact of particle sinking on TA-loss, their shape and size distribution were determined. Under the environmental conditions presented here, TA-loss rates could be reduced by up to 30 %–40 % due to the sinking of particles, after just one day.
Integrating the proposed concepts into ocean models could enhance the accuracy of predictions regarding the fate of added TA. Gaining insights into the evolution of the identified, seemingly stable TA levels can help prevent accelerated precipitation phases. Additionally, an understanding of particle sinking or dilution processes, reducing the available reactive particle surface area, is relevant to assess the efficacy and durability of OAE.
- Article
(4230 KB) - Full-text XML
-
Supplement
(3720 KB) - BibTeX
- EndNote


To mitigate climate change and reach net-zero greenhouse gas emissions by the end of the century, negative emission technologies (NETs) are necessary besides greenhouse gas emission reduction (UNFCCC, 2015) considering the slow change in the development of the energy infrastructure, lifestyle of humanity, and national goals for economic growth (Fuss et al., 2018; Iyer et al., 2015; Sers and Victor, 2018). Various carbon dioxide removal (CDR) technologies have been proposed to help achieve the necessary negative emission trajectories (Hartmann et al., 2013; IPCC, 2023; Minx et al., 2018; Rogelj et al., 2018). Among these, ocean alkalinity enhancement (OAE) is a promising CDR method (Harvey, 2008; Ilyina et al., 2013; Kheshgi, 1995; Rau and Caldeira, 1999), with the potential to geochemically sequester 3–30 Gt CO2 yr−1 (Oschlies et al., 2023; Renforth and Henderson, 2017).
Enhancing total alkalinity (TA) could be achieved by two approaches: (1) a non-CO2-equilibrated (neq) or (2) a CO2-equilibrated (eq) (Schulz et al., 2023). Through the neq approach, alkaline materials, such as silicate or hydroxide-based mineral phases, could be introduced to seawater in the form of solids or solutions, allowing longer-term CO2 equilibration with the atmosphere through ingassing of atmospheric CO2. In the eq approach, already partially pre-CO2-equilibrated solutions or carbonate-based substances could be released into seawater. Neq TA addition strategies induce greater variations in the affected carbonate system, resulting in drastically reduced pCO2 and a rapid increase in pH values. While an eq TA addition results in less severe changes in ocean chemistry, it is less efficient in generating carbon sequestration potential (Schulz et al., 2023; Suitner et al., 2024).
Depending on the introduced alkalinization method (see Eisaman et al., 2023) and the magnitude of treatment, induced changes in the carbonate system could lead to adverse effects on biota (e.g. Faucher et al., 2025; Ferderer et al., 2022; Gately et al., 2023; Goldenberg et al., 2024; Marín-Samper et al., 2024; Sánchez et al., 2024; Xin et al., 2024) or in case of persistent oversaturation, result in the precipitation of secondary mineral phases and therefore a loss of the introduced TA (Ilyina et al., 2013; Schulz et al., 2023). The process of TA leakage as a consequence of OAE was recently described by several studies (see Fuhr et al., 2022; Hartmann et al., 2023; Moras et al., 2022; Pan et al., 2021; Ringham et al., 2024; Suitner et al., 2024; Varliero et al., 2024). Within these laboratory-based studies, self-sustaining runaway carbonate precipitation processes led to a significant decrease in the added TA, which could even result in a net-loss of TA. TA stability ranges, and the evolution of the precipitation process depend on the specific local environmental conditions such as temperature, salinity, aragonite saturation state (Ωar), or suspended particle load of the treated water mass (Moras et al., 2024).
This study aims to demonstrate a general capability to predict and parametrize the temporal evolution of a triggered runaway carbonate precipitation process during OAE approaches, using quantifiable and measurable parameters. Stability ranges for the permanence of introduced TA additions were derived from these parametrizations, enabling the prevention of secondary mineral formation and the optimization of future OAE application scenarios.
Suitner et al. (2024) demonstrated the potential of inverse logistic functions to describe the temporal evolution of TA loss during the runaway carbonate formation phase (see Fig. 1). Building on this concept, this study presents a proof-of-concept mechanistic kinetic framework that combines empirically derived rate equations with measurable parameters (such as carbonate saturation state and particle surface area) to reconstruct the temporal evolution of the TA loss and identify the main drivers of the process. The resulting parameterization is currently only calibrated to the experimental dataset and does not yet include additional environmental controls such as temperature, salinity, or suspended particles, but it provides a transferable calculation scheme that could later be implemented in predictive ocean models simulating OAE addition scenarios, as discussed by He and Tyka (2023), Ou et al. (2025), Schwinger et al. (2024), and Zhou et al. (2024).
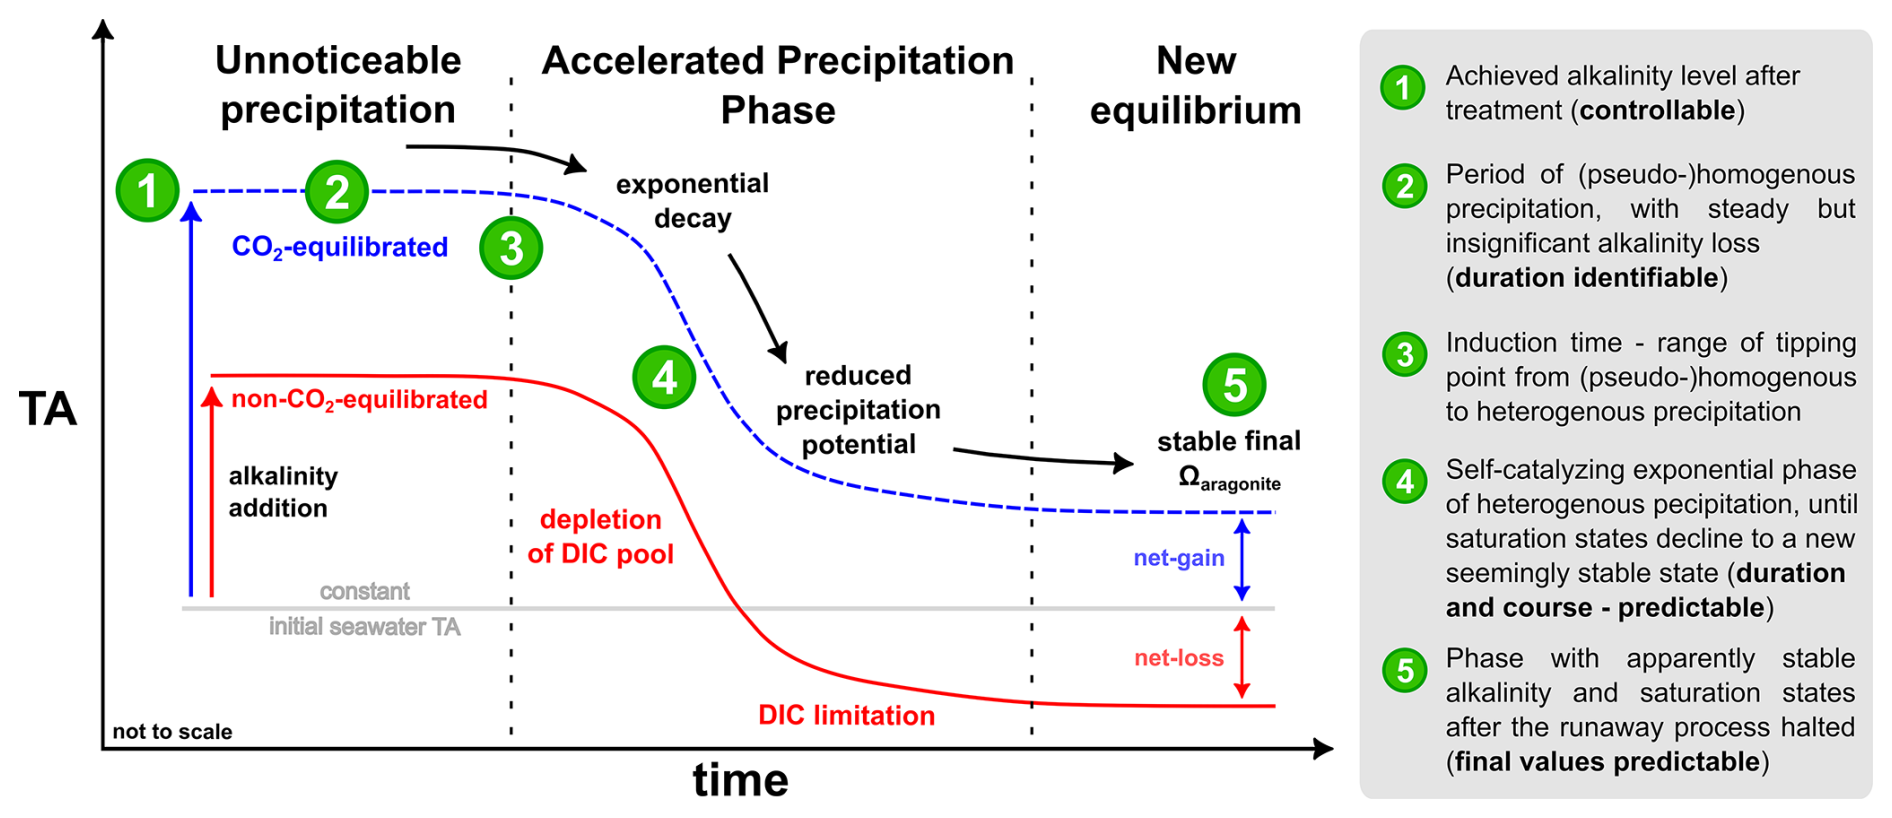
Figure 1Modified conceptual scheme of a runaway carbonate precipitation process following liquid TA addition after Fig. 9 in Suitner et al. (2024) (not to scale).
The application of OAE may exceed critical levels for carbonate precipitation. For open ocean scenarios the rapid initiation of mixing processes would efficiently reduce the potential for secondary carbonate formation. Nevertheless, runaway carbonate formation may occur within enclosed geographic locations with physical features such as bays, estuaries, or lagoons. In addition, thermohaline layering (Bialik et al., 2022) or high sediment load (Wurgaft et al., 2016, 2021) might create conditions that lead to TA-loss processes.
To sustain a triggered runaway carbonate formation (Fig. 1), it is necessary to retain the precipitates in the system. Removal of these particles reduces the potential for continuous heterogeneous precipitation, thereby slowing down or halting the process. In this study, the empirically determined TA-loss rates were used to derive the quantity of precipitated particles. By identifying the particle sizes, shapes, densities, and sinking velocities, their potential residence times in the water column were estimated. Furthermore, we evaluated whether the formation of secondary minerals can supply sufficient surface area for a continuous detectable heterogeneous runaway process in an open-water body and whether the process would be interrupted or attenuated by removing particles due to their descent into deeper layers.
2.1 Overview of experimental setups
All data analyzed in the present study derive from TA-gradient experiments described in Suitner et al. (2024). During a field study from May to July 2022, natural seawater was collected at the Espeland marine station (Raunefjorden, Bergen, Norway; 60.27° N, 5.20° E). Within 20–25 d lasting TA-gradient approaches, 250 mL polystyrene cell culture bottles were filled with “filtered” (mesh size 0.2 µm) or “unfiltered” (mesh size 50 µm) natural seawater (TA µmol kg−1, DIC µmol kg−1, pH , Ωar 2.8±0.4 and Sal. ) and incubated in a PMMA flow-through incubation box, mimicking the natural light and temperature conditions (10–16 °C). Each TA level was distributed among 3–4 bottles to allow sequential sampling while minimizing head-space. TA was either increased with a 0.5 M NaOH (neq) or with a mix of 0.4 M NaHCO3 and 0.2 M Na2CO3 (eq) stock solutions to maintain ambient pCO2 levels (∼420 µatm). TA, pH, salinity, conductivity and temperature were measured using a Metrohm 888 Titrando (0.02 M HCl titration) and a WTW MultiLine® multimeter. An overview of the experimental setup is given in Table 1; full methodological details are provided in the Supplement.
Table 1Overview of the experimental design of Raunefjorden precipitation experiments.
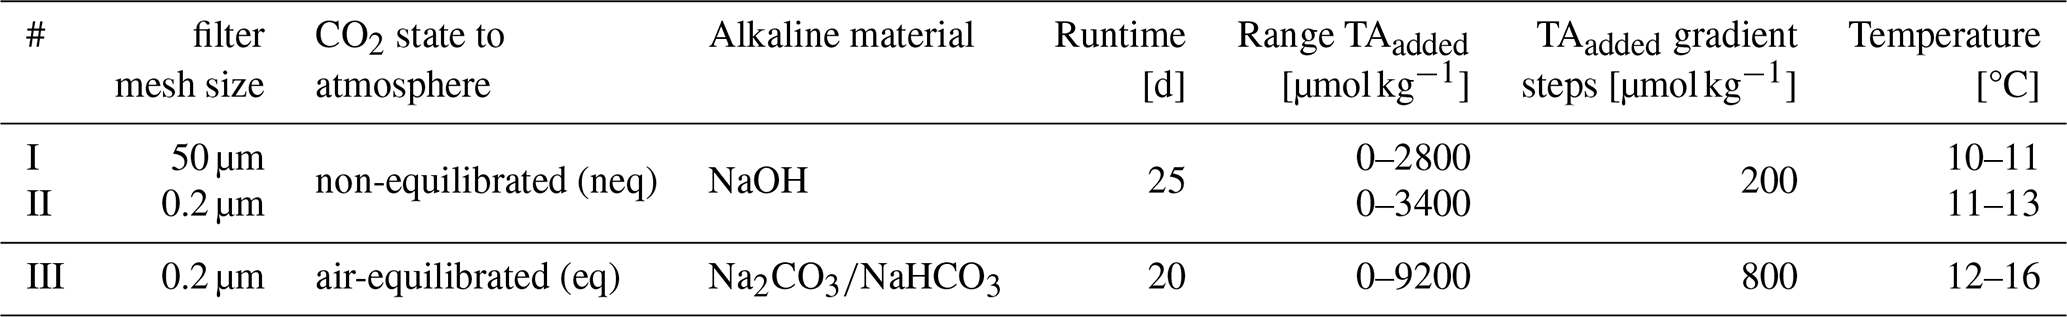
The precipitated particles of three selected filters (0.2 µm PC), collected during incubation experiments within previous campaigns published in Suitner et al. (2024) (neq ΔTA2600 and ΔTA2800, Raunefjorden) and Hartmann et al. (2023) (neq ΔTA2400, Gran Canaria) were used to analyze particle sizes, morphology and their sinking velocities. Similar to the Raunefjorden, the filters from the Gran Canaria experiment were obtained from a TA-gradient experiment, conducted in local oligotrophic seawater (TA µmol kg−1, DIC µmol kg−1, pH , Ωar 4.4±0.3, Sal. ∼36.6 Temp. ∼23 °C), designed to assess the stability of alkalinization approaches (see Supplement for further details). Incubations during the Gran Canarian campaign ran for 4 d and followed the same analytical protocol as the Norwegian series introduced above. A detailed description of the Gran Canaria setup is provided in the Supplement.
2.2 Curve fitting of the TA and Ωar evolution
Building on Suitner et al. (2024), the numerical curve fit model used to describe the temporal development of TA and Ωar, was refined through the incorporation of observed TA-loss rates as an input factor, to provide continuous functions as a basis for further model calculations. The curve fit model utilized the consistent tendency of all observed runaway precipitation processes to follow inverse logistic trends in form of:
for the temporal evolution of TA and Ωar. The coefficients d and a are defined by the achieved level of TA after the addition d and the final reached value after the runaway process halted a. Since these factors are predefined by the experimental setup, the curve fit model only numerically parameterizes the two coefficients b and c. Coefficient b represents the “induction time”, or the time required for CaCO3 precipitation to become detectable in the TA measurements, depicted by the horizontal translation along the x axis, while c denotes the timespan between start and end of an accelerated precipitation phase (APP). See Fig. 2 for a visual impression of the influence of iterations of each coefficient.
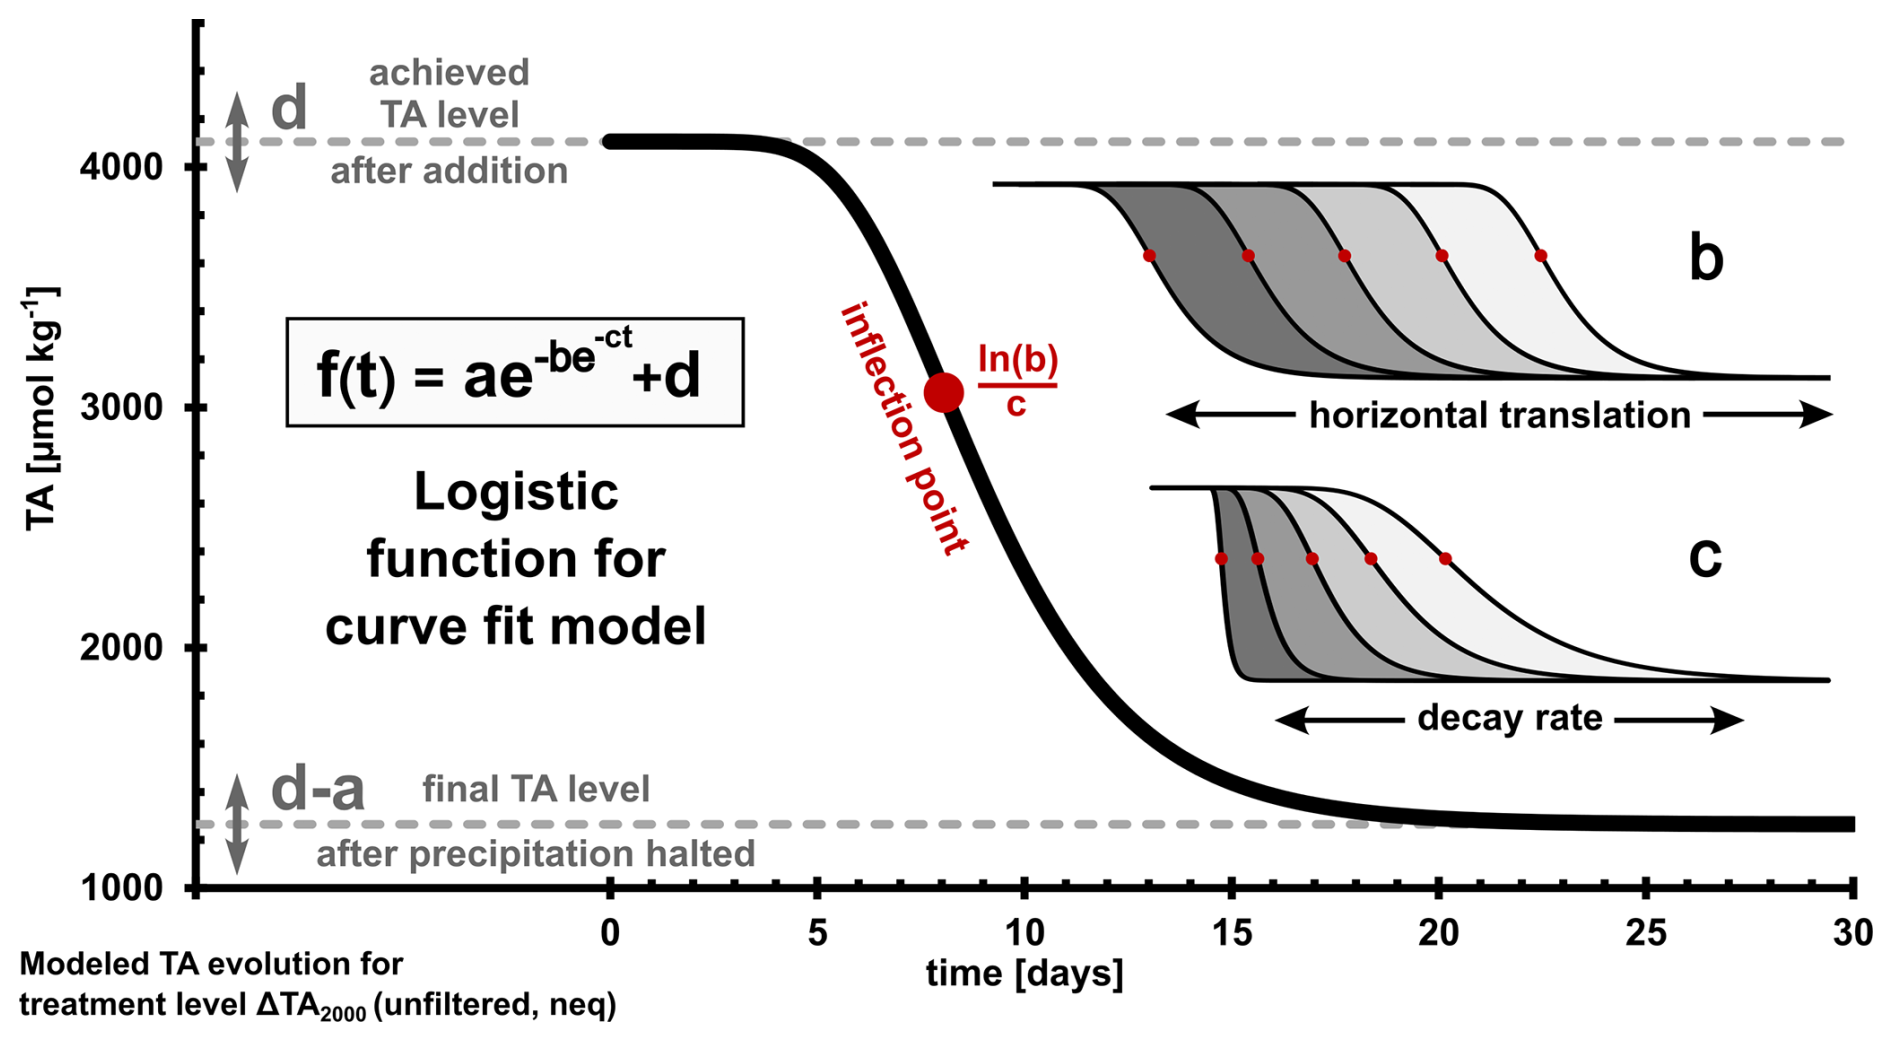
Figure 2Overview and iterations of each coefficient a–d of the applied inverse logistic function for the numerical curve fitting; the inflection point is defined by ; for further characteristics see Tjørve and Tjørve (2017).
2.3 Empirical rate law and determination of loss rates
A simple empirical rate law was used to evaluate the precipitation rates R [] (see e.g., Inskeep and Bloom, 1985; Morse et al., 2007; Zhong and Mucci, 1989):
The experimental precipitation rates were then fitted to the logarithmic form of Eq. (2) to determine the coefficients k (rate constant) and n (empirical reaction order):
To correct for the variable surface area, r [µmol h−1] was normalized for the assumed available active mineral surface area (A in [m2]) (adapted from Sjöberg, 1976).
As the gradient approaches could not provide a sufficient amount of precipitates to determine their surface area, a one-week side experiment was conducted to estimate the mineral surface area generated during the runaway precipitation process. By adding 3.8 mmol NaOH and 7.0 mmol NaHCO3 to 40 L of 0.2 µm filtered natural seawater (salinity 33) at 23 °C, around 5 g of aragonite precipitates were generated to provide material for a BET surface area measurement. Using N2 adsorption (Brunauer et al., 1938), with a Quantachrome autosorb iQ at the University of Hamburg, a surface area of 2.283±0.018 m2 g−1 was determined. By the assumption that the surface area is constant for all precipitates and that the entire lost TA is transformed into aragonite particles, the experimentally determined TA-loss was used to calculate the surface area after each timestep, therefore allowing to correct the precipitation rates.
2.4 Particle analysis
Three samples of precipitates, filtered through a 0.2 µm (PC) filter from the incubation experiments conducted on Gran Canaria and in the Raunefjorden (see Sect. 2.1), were analyzed using a scanning electron microscope (SEM; Hitachi TM4000 Plus Tabletop Microscope, University of Hamburg) to determine the morphology, size, and relative abundance of the precipitated material. Length, width and shape of each particle were specified by manual examination.
When sufficient precipitated material remained following SEM analysis, sinking velocities were determined from the residual filter material using a FlowCam (Fluid Imaging Technologies Inc., Scarborough, United States). A detailed description of the setup is provided in Suessle et al. (2025) and references therein.
3.1 Numerical logistic curve-fittings
Three OAE gradient approaches by Suitner et al. (2024) were examined to test the stability of TA and to generate refined numerical logistic curve fittings of the temporal development of TA and Ωar (Figs. 3, S4 and S5 in the Supplement). The coefficients b and c (see Fig. 2) were determined by numerical interpolation to optimize the fit to Eq. (1) and its derivative. Therefore, the shown functions were optimized to describe the temporal evolution, while also including the rate loss changes, which allowed an improved description of the runaway process in comparison to the approaches in previous studies. Outlying data points displaying an anomalous increase or stagnation in values in the filtered approaches were removed from curve-fitting calculations (for details see Sect. 3.2 and Supplement). For each treatment, continuous differentiable functions to describe and analyze the runaway carbonate precipitation process during OAE approaches were generated. To illustrate the described processes and trends, the unfiltered neq approach was selected as an example (Fig. 3). The plots for the filtered approaches are provided in the Supplement (Figs. S4–S6).
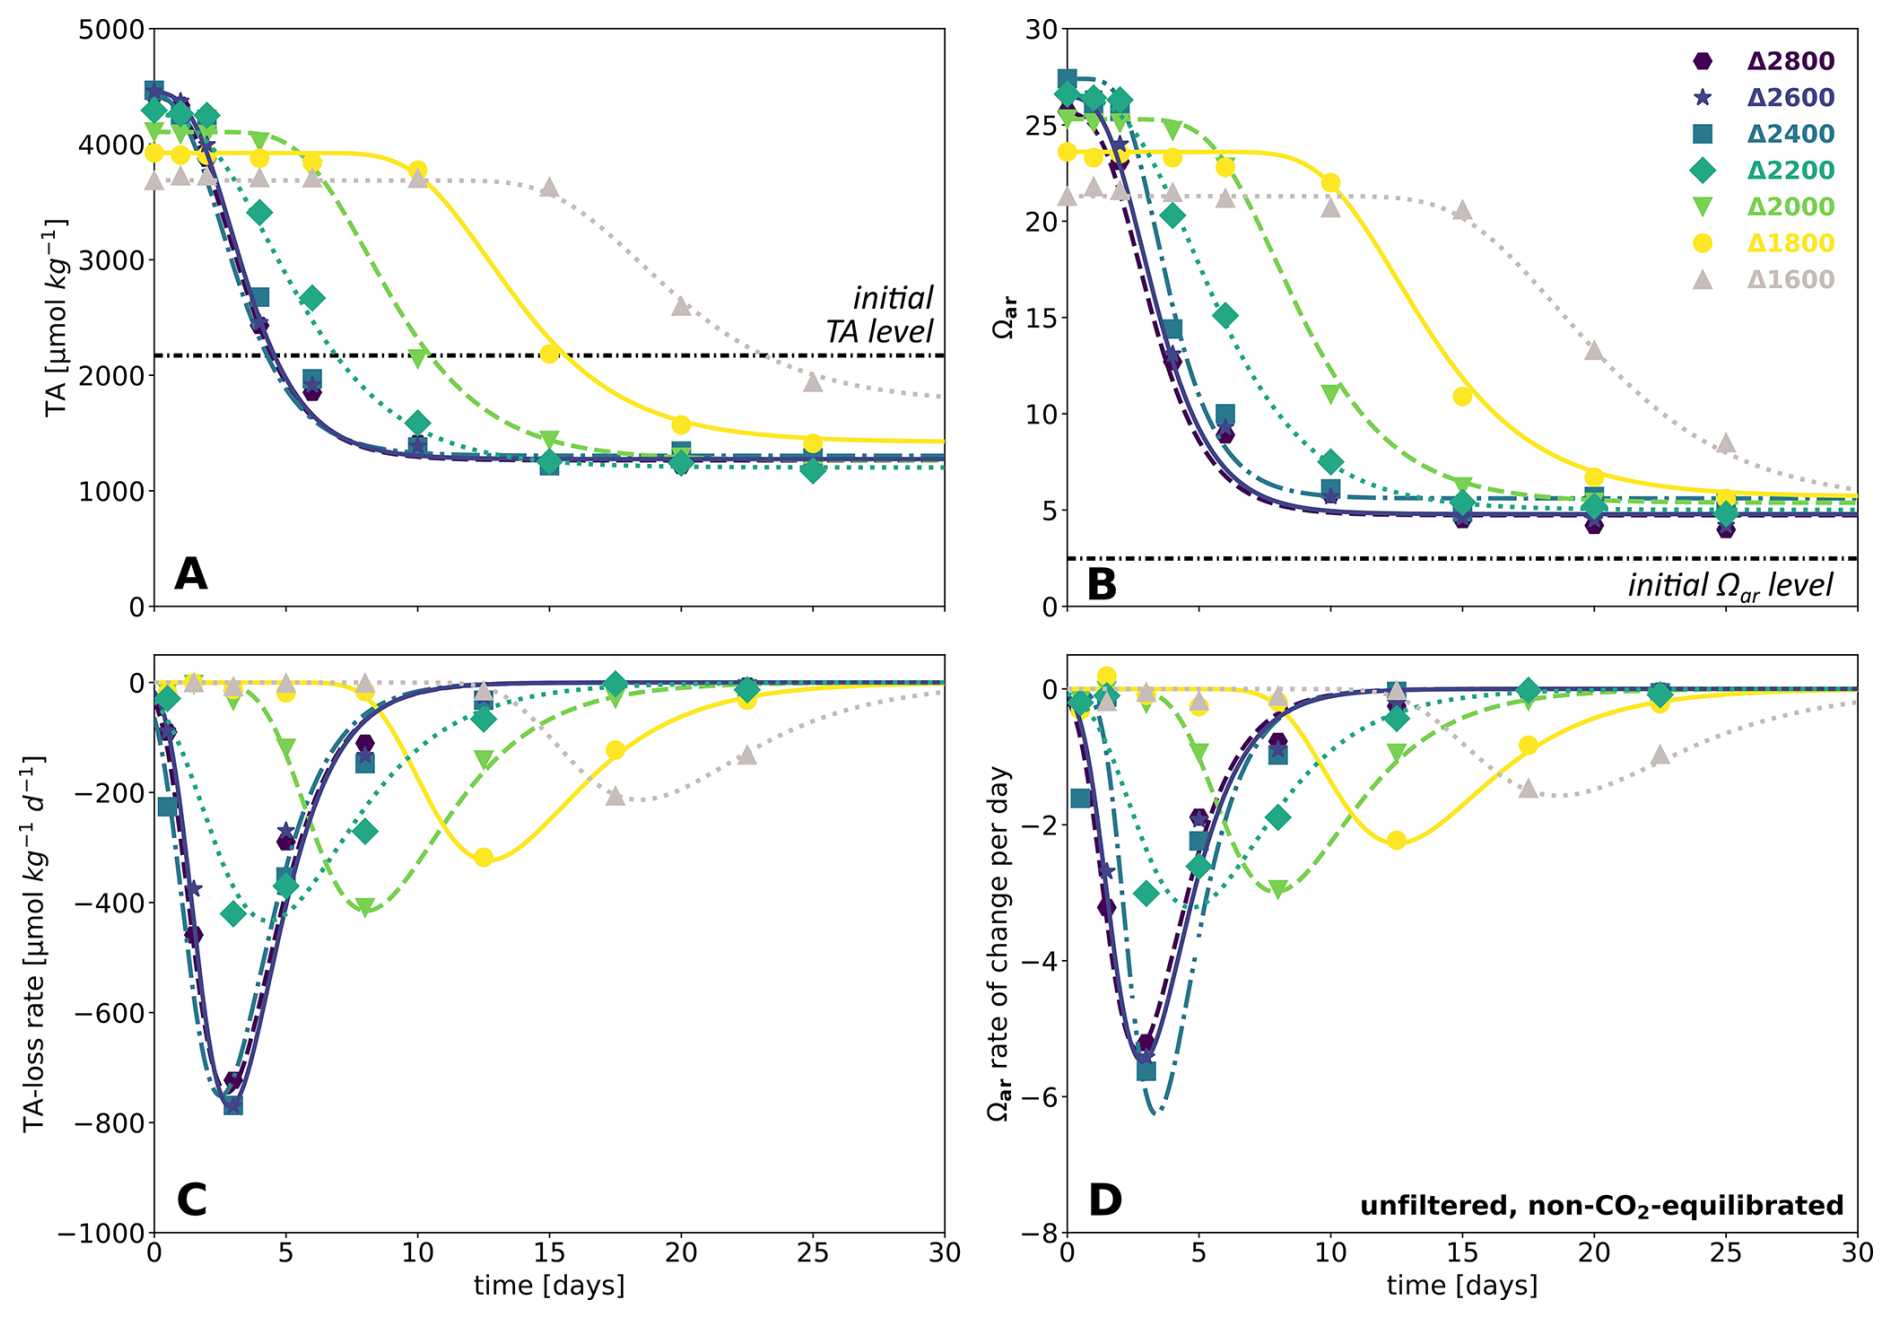
Figure 3Results of the numerical curve fits – for the unfiltered neq approach, TA evolution over time (A), Ωar evolution over time (B), TA-loss rate over time (C), Ωar rate of change over time (D). Line plots: curve-fitted continuous functions, markers: measured data points, for related diagrams for filtered approaches see Figs. S4–S6.
For the unfiltered neq experiment (Fig. 3), treatment levels ΔTA1600 and higher entered into an APP after exceeding critical TA levels to initiate the runaway carbonate precipitation process. Treatments levels ΔTA2400–2600 exhibited a buffering as a consequence of magnesium hydroxide precipitation (see Badjatya et al., 2022; Ringham et al., 2024; Suitner et al., 2024; Varliero et al., 2024), which prevented an increase above ∼4470 µmol kg−1 in TA and ∼27.4 in Ωar. The buffering effects were not recognized within the fitting procedure and the first data point (after ∼3 min runtime) of each treatment level was set as the baseline.
The continuous logistic curve-fits allow the estimation of the APP onset and duration. Parameter b correlates with the induction time, while c correlates with the APP timespan (see Figs. 4 and 5). Under the present conditions the regressions can be used as conversion equations for TA evolution. Related conversions and regressions are provided in the Supplement (Fig. S7).
3.2 Outliers
In the experimental series performed in the Raunefjorden, a systematic cessation of the precipitation process was observed in two of the three experimental setups. Precipitation arrested after 6 d, in the eq filtered approach (Fig. S1 in the Supplement) and after 8 d in the filtered neq approach (Fig. S2 in the Supplement). For all TA treatments that had already entered the accelerated precipitation phase, no further significant changes were detected in any measured parameter.
Each TA treatment level was distributed to three individual bottles to minimize headspace effects while providing sufficient volume for sampling. The bottles were sampled sequentially three to four times each, after which a fresh set of bottles was opened. Although both affected series were run concurrently, a logistical offset of two days separated their start times. All anomalies in the two independent series occurred between 24 and 28 June 2022, specifically in the second set of opened bottles, while the first and last sets of bottles displayed a regular precipitation pattern. This temporal clustering suggests that an external factor, such as water temperature, sunlight intensity, or a particular aspect of the sampling procedure, may have systematically influenced the affected reactor bottles. Repeated measurements with calibrated standards ruled out an analytical error, and the concurrent impact on both pH and TA confirms the reliability of the recorded values. Consequently, the two sampling days that exhibited these anomalies were excluded from the curve-fitting calculations. A comparison of the fits with and without these data points is shown in Figs. S1–S3 in the Supplement.
3.3 Induction time
By employing the logistic curve fits, the temporal evolution of each approach could be parameterized. To identify the temporal stability ranges and reflect the transition from stable to precipitation-dominated system modes, a criterion of 40 rate of change in TA was set. This rate provides a sufficiently high threshold to exclude a false detection due to natural variability or measurement errors, while still being low enough not to overlook a significant fraction of TA-loss (see Fig. S15 in the Supplement for varying criteria).
Based on this criterion, Fig. 4 illustrates the induction times for the APPs. The shaded ranges indicate extrapolated timeframes between subsequent measurements during which the initiation of the APP for each treatment was detected. The displayed regressions were calculated using the averaged times from two consecutive measurement days. For comparison, hollow markers represent predictions from the presented curve-fitted functions. The regressions of the induction times uniformly follow an inverse exponential trend of the type:
The employed data series covered a range of 25 d with progressively increasing induction times from 0 to 20 d for treatments reaching ∼4470 (ΔTA2400) to ∼3380 µmol kg−1 (ΔTA1200) in the filtered neq experiment and ∼11 200 (ΔTA9200) to ∼6500 µmol kg−1 (ΔTA4400) in the filtered eq experiment. Treatment levels above ΔTA2400 in the neq approaches exhibited an immediate onset of TA-loss due to the precipitation of secondary hydroxides and/or carbonate minerals, therefore, following the presented criterion, practically leading to their immediate entry into the APP process.
The same relationships and trends can also be applied using Ωar as a variable. While the neq approaches exhibited lower Ωar values (17.8–27.4) compared to the eq treatments (19.5–43.6), the onset of the APP in the neq experiments occurred significantly earlier. This indicates that Ωar is not the only decisive factor guiding the (pseudo-)homogeneous nucleation process, determining the induction time.
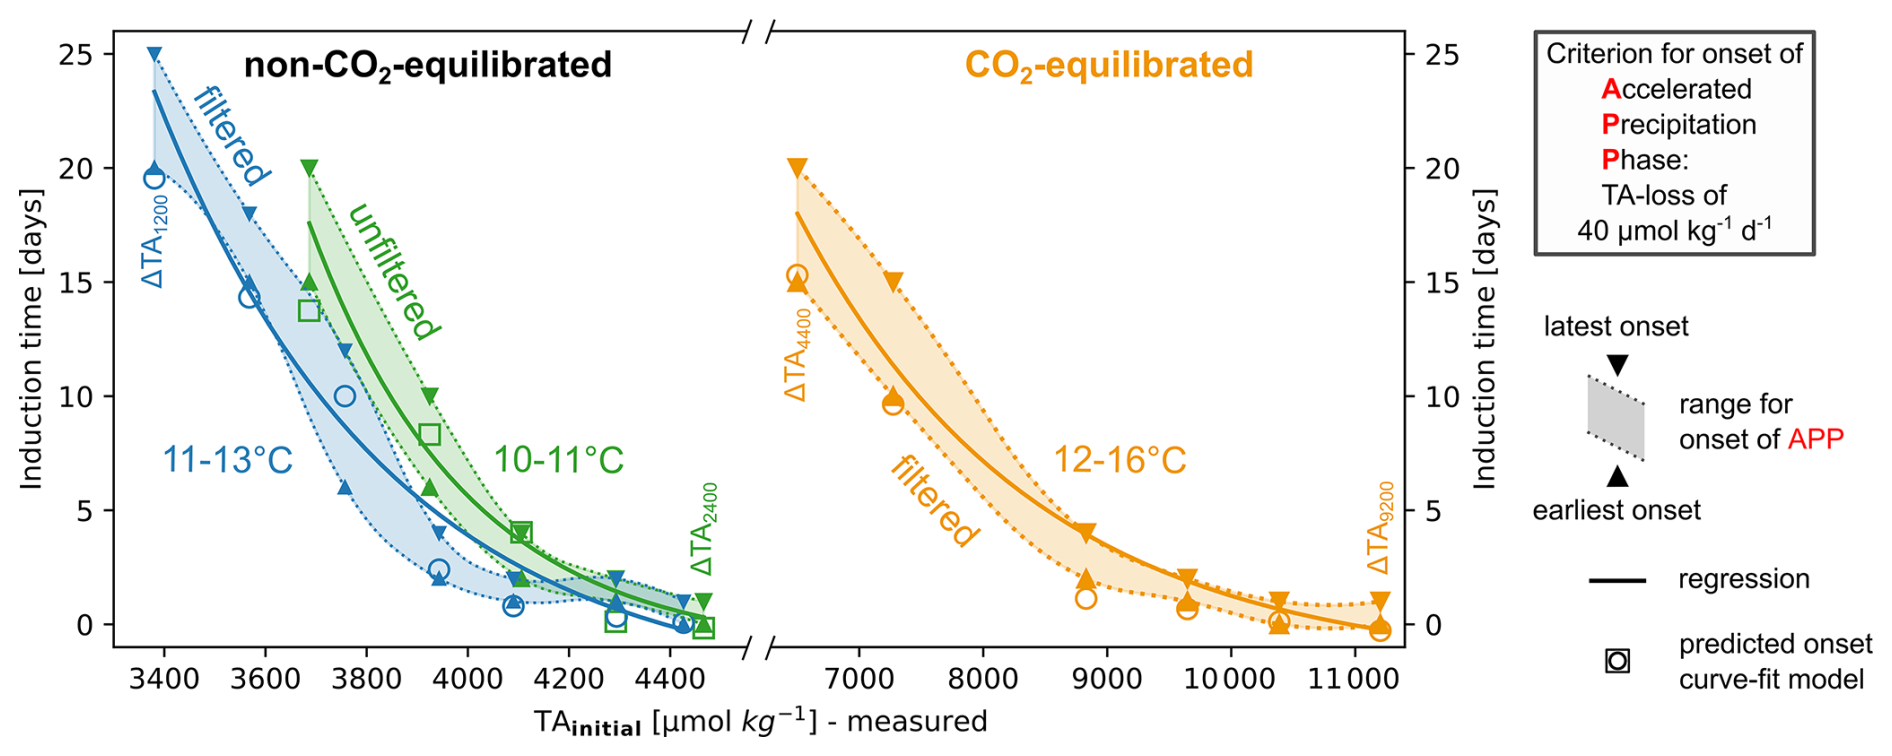
Figure 4Induction time for the onset of APP in relation to the initial TA addition level, based on the first detection of a TA-loss rate of 40 . Each pair of triangle markers represents two consecutive measurement days during which the set loss rate criterion was met; hollow markers: predicted induction times for each treatment level, based on the introduced curve-fit model. Exponential regression of average experimentally detected induction time, see Eq. (5) in Table 2 for related functions.
Table 2Regressions of induction times, see Fig. 4. Note that the use of the given equation should not be generalized, as it is only valid under the presented environmental conditions. Also be aware that the resulting predictions of induction times far out of the specified TA addition ranges might not be accurate.
3.4 Timespan of the APP
To describe the temporal evolution of TA and Ωar during the observed runaway processes for the present setups, coefficients a and d in Eq. (1) can be set, while b could be evaluated by empirical or modeled data. Consequently, only the duration of the APP represented by c needs to be estimated to enable the entire model description of the precipitation procedure. The discrete nature of sampling days with decreasing frequency of samplings towards the end of an experiment (up to 5 d) did not allow reliable empirical determinations of c. The displayed APP timespans in Fig. 5 were therefore determined by the predictions of the presented curve-fits (Fig. 3), based on the 40 TA-loss criterion to define the start and endpoint of the APPs. Figure 5 illustrates the related predicted timespans against the initially reached TA levels, categorized by the individual experimental setups. The neq APPs form distinct clusters for each approach, which again can be subdivided into treatments with and without the occurrence of immediate precipitation. Regardless of the initial TA enhancement level, treatments that exhibited an immediate decline due to Mg(OH)2 formation showcased almost identical APP spans (unfiltered ∼8.8 and filtered ∼5.9–7.4 d) within each approach. Although the neq treatments without Mg(OH)2 had the same starting conditions, the unfiltered experiments exhibited approximately 4 d longer APPs. In the eq approach, the APPs showed a continuous decrease as the initial TA addition levels increased, ranging from 5 to 11 d.
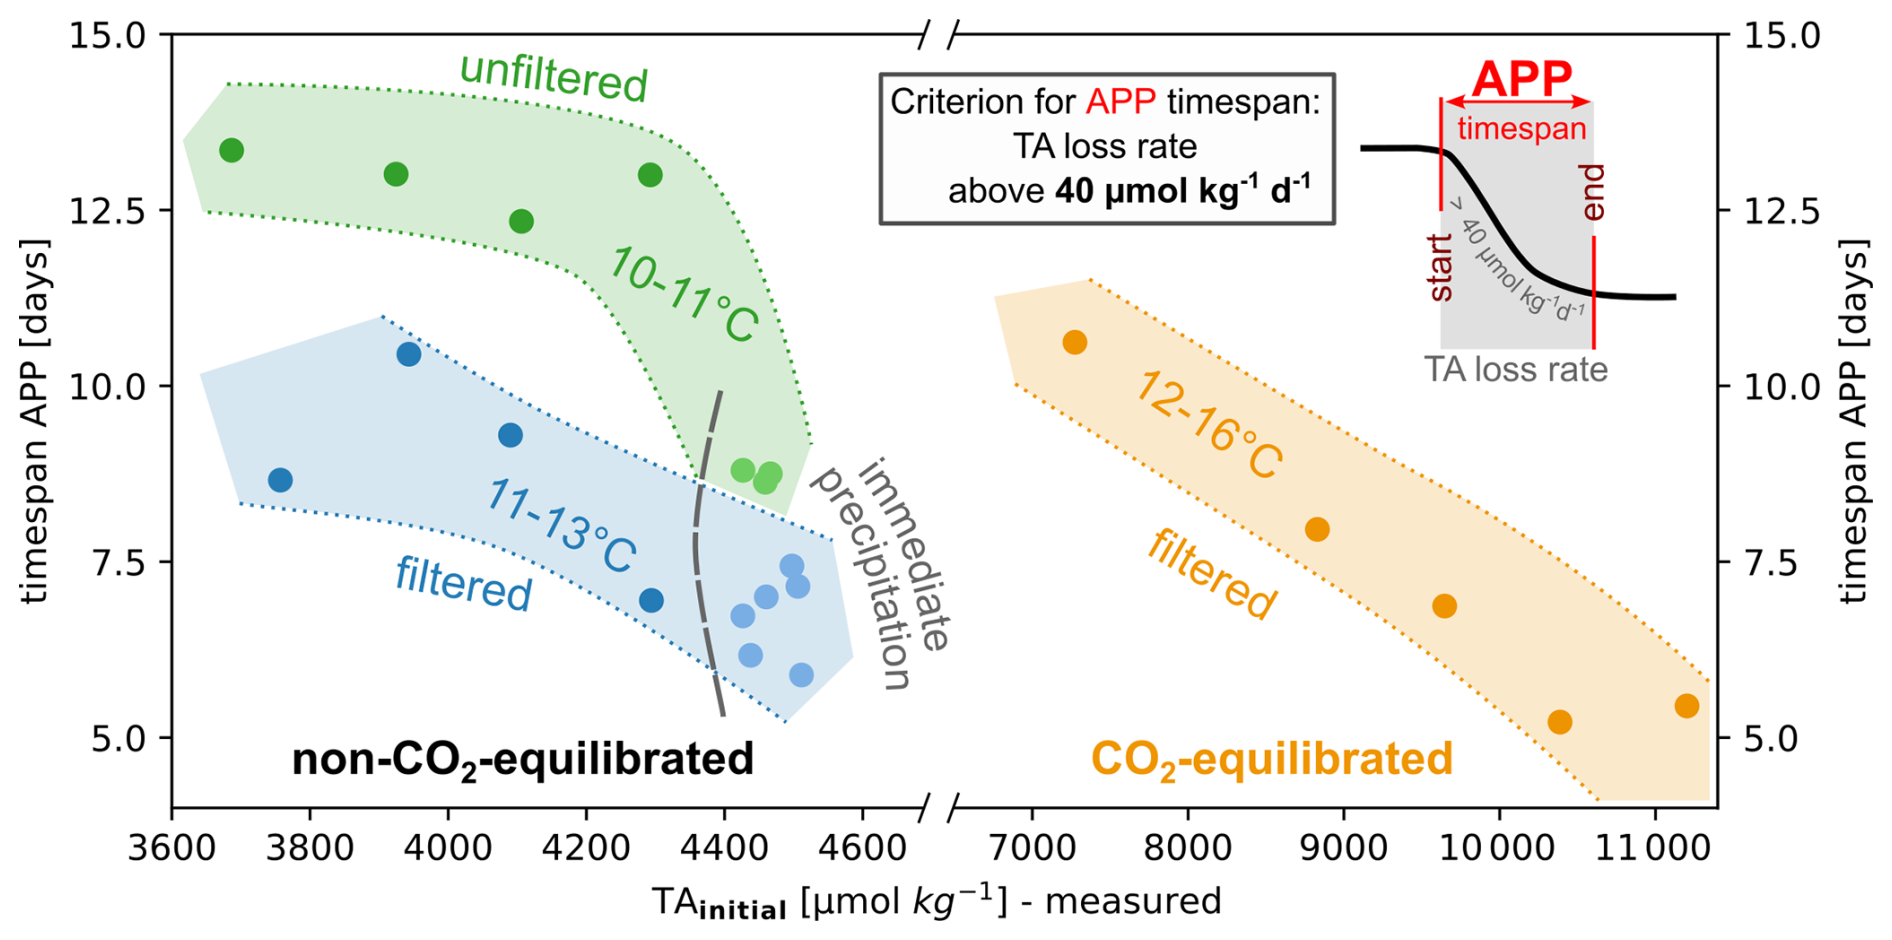
Figure 5Overview timespans of APP in relation to the initial TA addition level; determined by the outcomes of the presented numerical logistic curve-fitting. Presented timespans are based on the introduced TA-loss criterion (see Sect. 3.3), which was defined as period with rates above 40 µmol kg−1 TA-loss d−1; only treatments which reached the final stable stage were considered, neq treatments labeled with immediate precipitation showcased a loss of TA within the first 3 min of the experiment – most likely as a consequence of Mg(OH)2 formation.
3.5 Empirical rate equations
Additional insights into the reaction speed and the associated timespan of the APP can be obtained through analysis of empirical rate law equations. As an example, Fig. 6 illustrates the relationship between the logarithm of TA-loss rates normalized to the surface area and the aragonite saturation states for the unfiltered neq approach (see Figs. S8 and S9 in the Supplement for details on the filtered approaches), focusing on treatments that entered the APP. Throughout all experiments the logarithm of the surface area normalized precipitation rate R correlates with the log (Ωar−1), in accordance with similar observations reported in literature (e.g. Morse et al., 2007; Mucci and Morse, 1983; Zhong and Mucci, 1989). The parameters n and k in Eq. (2) were determined for each treatment level in this work, as outlined in Eqs. (2) to (4) (Sect. 2.3). Here, R represents the surface area normalized precipitation rate, and k denotes the rate constant.
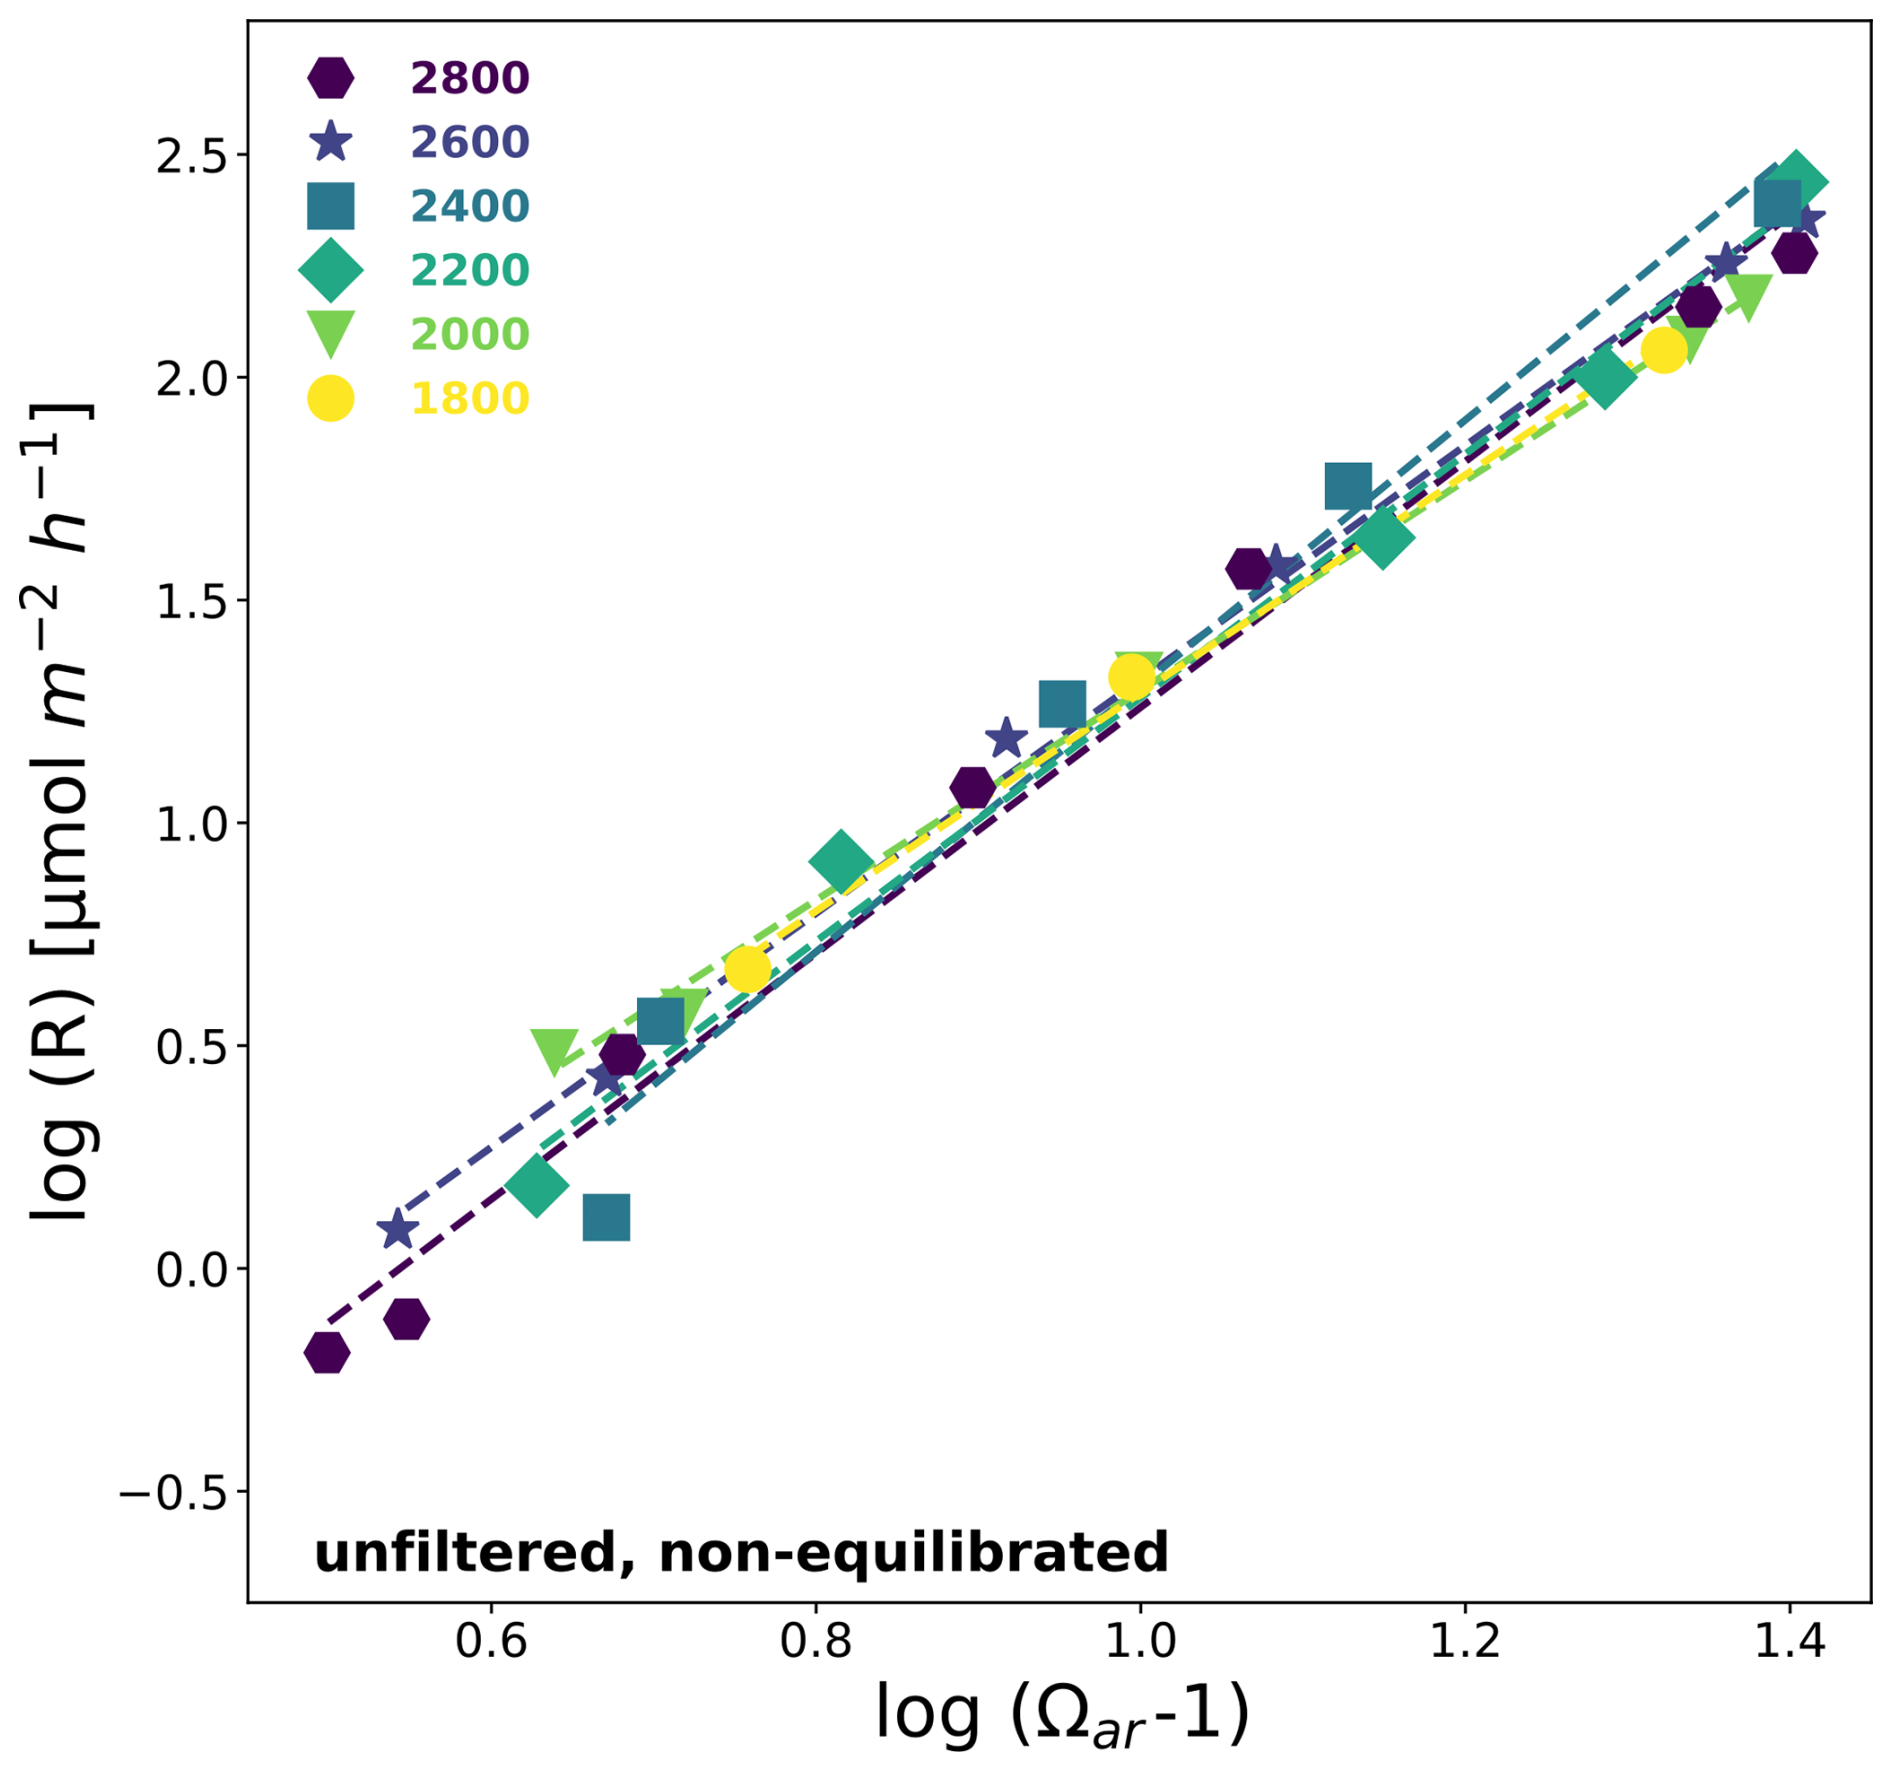
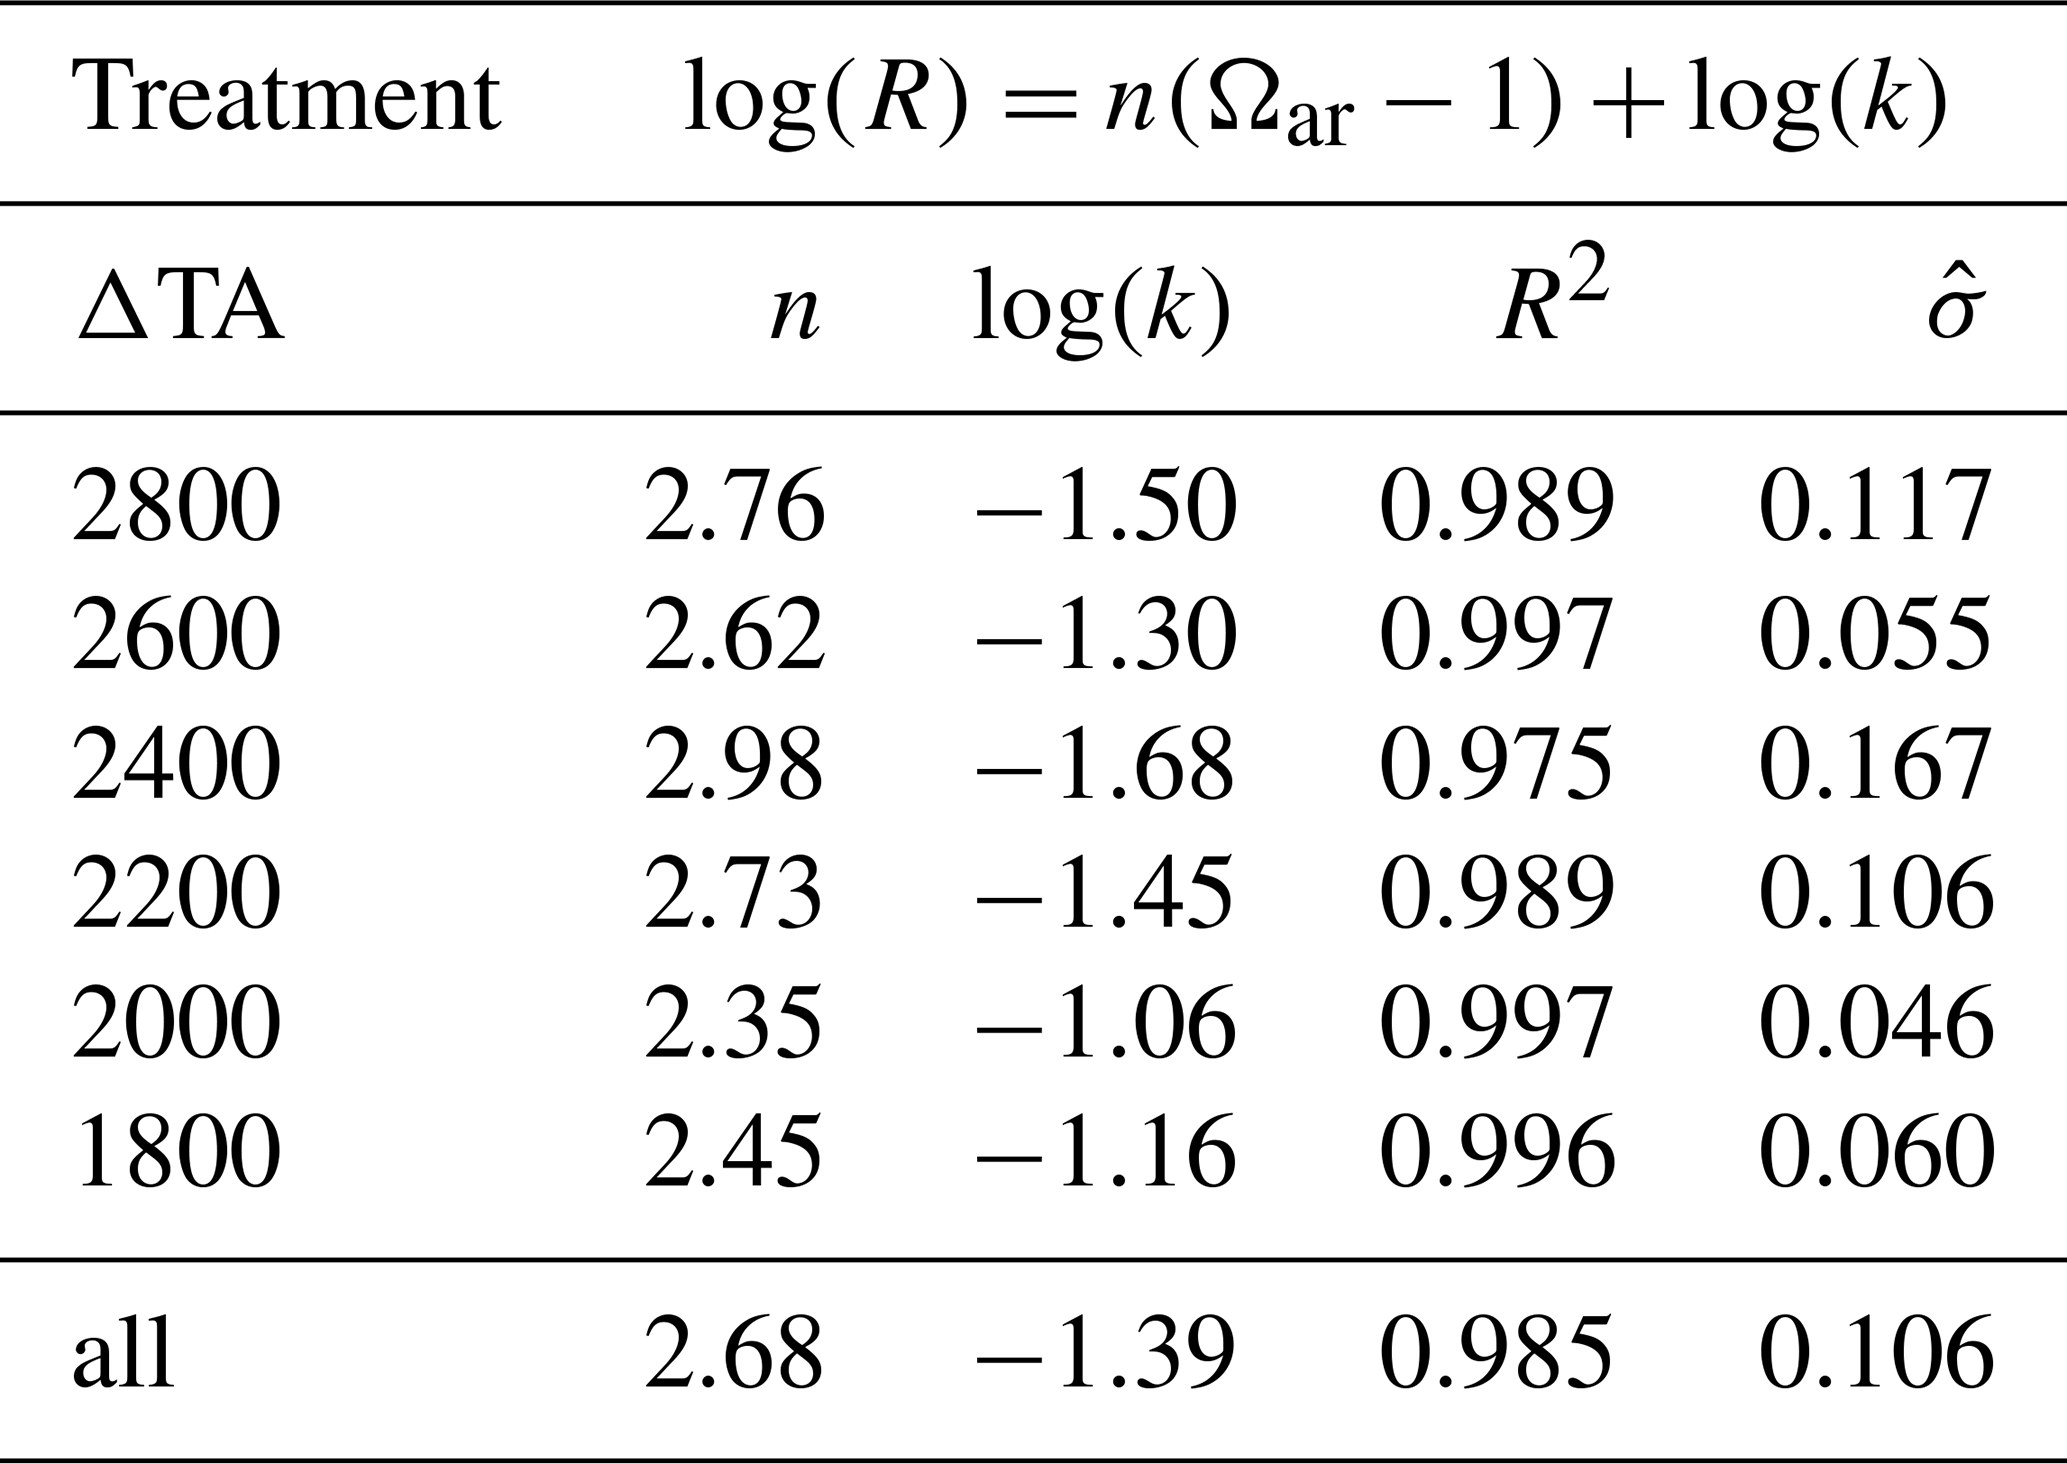
Figure 6Carbonate precipitation kinetics for unfiltered neq treatments that entered the APP; see Table 3 for related regressions and rate equations.
The values for n and log (k) derived from the linear regressions in the unfiltered neq treatments are provided in Table 3 (see Tables S6 and S7 in the Supplement for filtered experiments). These values demonstrate reasonable consistency in n and log (k) within each of the three separate experiments. Treatment levels influenced by the immediate formation of Mg(OH)2 as pH approached approximately 10.3 show minor deviations, the remaining treatment levels exhibit reaction orders (n) within a relatively narrow range of 2.45 to 2.73. In comparison, log (k) values ranged between 0.30–1.68, showcasing a higher variability.
Table 3Overview of coefficients and regressions of empirical rate equations for unfiltered neq treatments, also see Fig. 6 and Table S8 for cross-comparison of all treatments.
3.6 Evolution of particles and sinking speed
To assess the impact of secondary precipitated particles during OAE approaches, precipitated materials from the studies by Hartmann et al. (2023) and Suitner et al. (2024) were analyzed for shape, size, and sinking velocity. As qualitatively depicted in these studies, the aragonite precipitates manifest and evolve in a variety of forms and sizes, ranging from stem-like structures, followed by double-broccoli shapes and ultimately forming closed spheres (see Fig. 7).
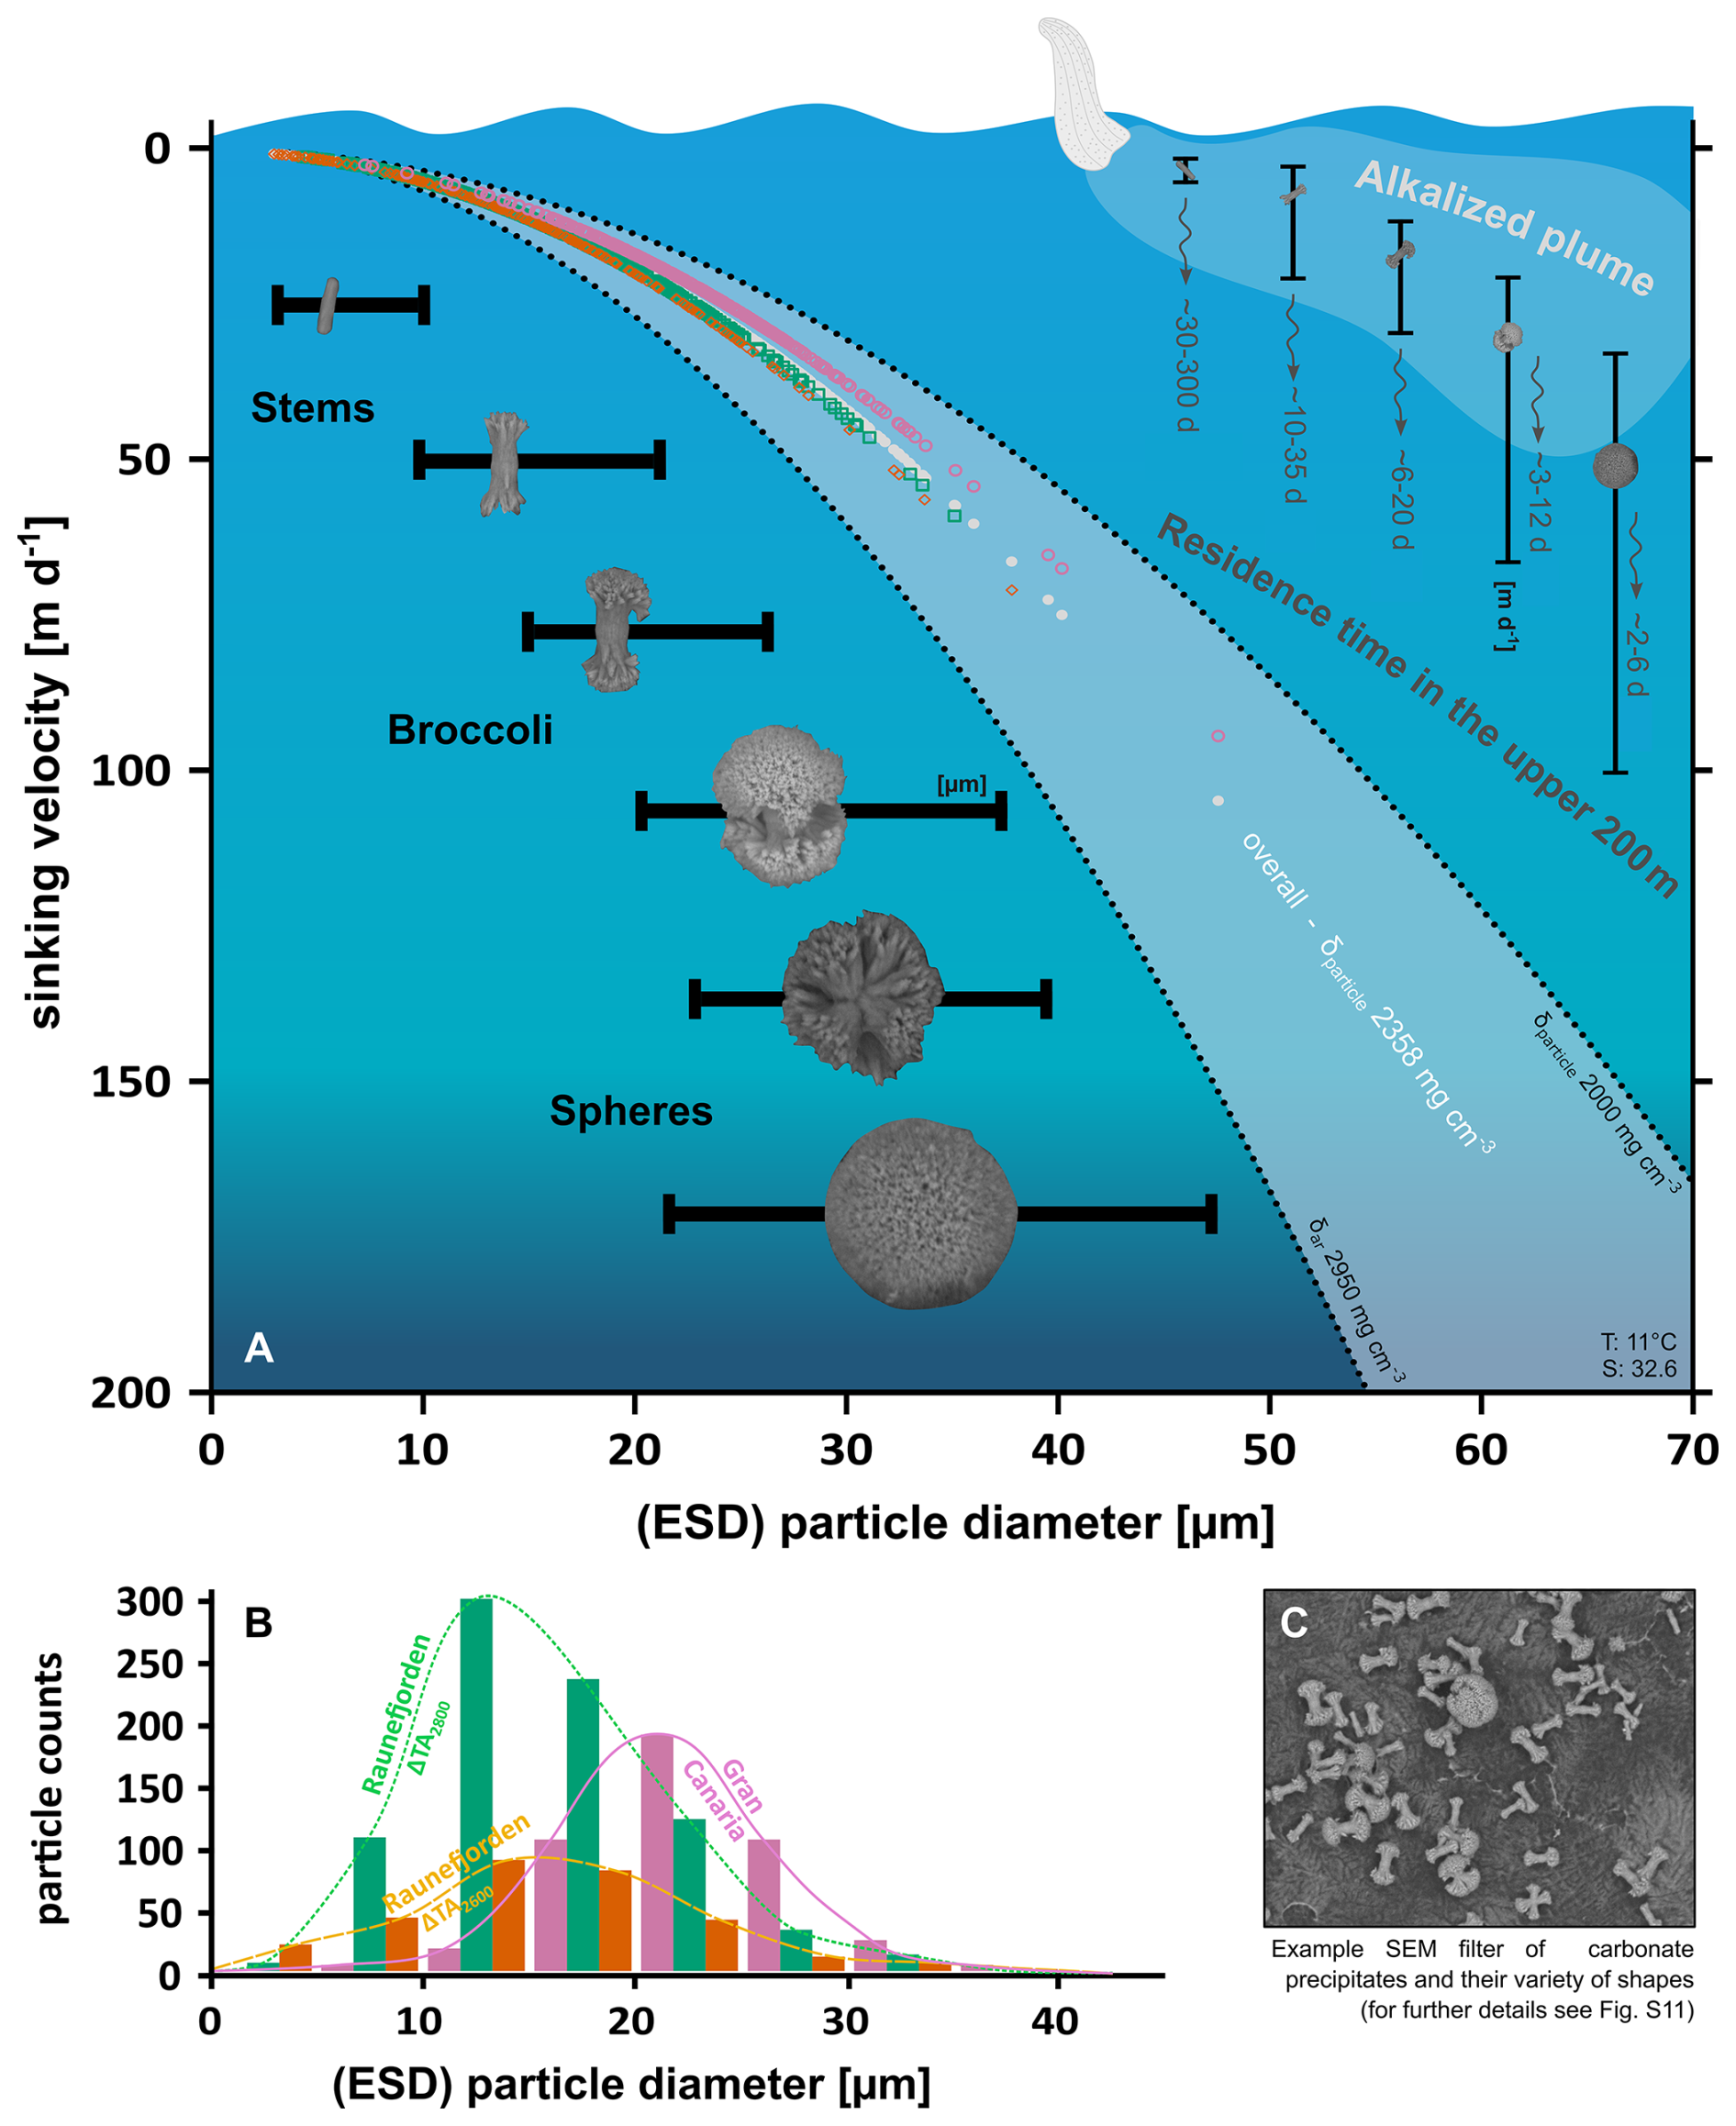
Figure 7(A) Calculated sinking velocities of particles (hollow markers) as a function of ESD for each treatment (green squares: neq unfiltered ΔTA2800 – Raunefjorden, Bergen; orange diamonds: neq unfiltered ΔTA2600 Raunefjorden, Bergen; pink circles: neq filtered ΔTA2400 Gran Canaria). ESD distribution of stem, broccoli and sphere shaped precipitates (horizontal) and their calculated mean residence time in the mixed layer (assumed to be 200 m), while neglecting particle growth processes (B) related particles counts in size fractions of 5 µm, also see Fig. S12 for length : width distribution (C) example section of a SEM filter (ΔTA2600 Raunefjorden), see Fig. S11 for complete set of all filters.
For this study the length and width distribution of 950 precipitated particles were determined by manual inspection of four overview SEM images (see Fig. S11 in the Supplement) from Gran Canaria samples (see Hartmann et al., 2023, for details; analyzed treatment level: ΔTA2400, filtered, neq, Temp. ∼23 °C, Sal. ∼36.5, runtime 4 d) and the Raunefjorden, Bergen (this study and Suitner et al., 2024, see Figs. 3 and 7 therein; analyzed treatment levels: ΔTA2800 and ΔTA2600, Temp. ∼11 °C, Sal. 32.6, runtime 25 d – highest unfiltered neq treatments). Results of this evaluation are provided in Fig. S12 in the Supplement. Length and width distributions of the formed particles follow distinct ratios, allowing the definition of three categories: (1) Stems , (2) Broccoli () and (3) Spheres . Note that this method also categorizes regularly shaped, multi-branched particles as spheres (see Fig. 7). Precipitates from the Gran Canarian campaign primarily comprised well-developed broccoli and spherical-shaped particles, whereas the samples from the Raunefjorden were characterized by less evolved stems and broccoli as the dominant components. Although the runtime for the Gran Canarian sample was considerably shorter (4 d) in comparison to the Raunefjorden (25 d), the ∼12 °C difference in temperature led to significantly higher precipitation rates and more developed shapes. The analyzed Raunefjorden samples originate from the same experiment and differ only in the initially added TA-level of 200 µmol kg−1. Even this minor difference in TA addition resulted in the presence of more evolved shapes in the higher treatment.
The gravitational sinking velocities of precipitated particles were measured using a FlowCam setup (see Bach et al., 2012, for technical details). Based on the concept of equivalent spherical diameters (ESD) the density of each particle was calculated, revealing a range from 1.54 to 3.18 g cm−3 for ESD sizes between 12 and 50 µm. The average density was determined to be 2.358 g cm−3. The discrepancy with the density of aragonite (∼2.95 g cm−3) may result from an overestimation of particle sizes in the calculation method, which relies on an inversion of Stokes' Law for the terminal sinking velocity of perfect spheres. However, most particles are non-spherical and contain numerous internal cavities within their structure (see Fig. S7), and their densities are therefore expected to be lower than those of pure aragonite. The determined particle density was then used to calculate the theoretical sinking velocities of the manually counted precipitated particles. To account for potential variability in particle density, Fig. 7 presents a range of sinking velocities of the counted precipitates.
Measured sinking velocities for precipitated particles within the aforementioned density range varied from ∼5 m d−1 (14 µm particle) to ∼47 m d−1 (41 µm particle). Recorded particles in the ESD range of 50–180 µm were not included in the calculations, as they were not observed within the same filter material that was analyzed by visual inspection. Discrepancies between measured and calculated values may reflect aggregation effects or technical limitations of the utilized FlowCam to track particles smaller than 3 µm (Bach et al., 2012).
Derived from the calculated sinking velocities, the residence times within the upper 200 m of the water column were determined. Accordingly, under idealized conditions, early precipitated stages, such as stems (<10 µm), could remain for a few months within the upper ocean layer, providing potential additional surfaces for an ongoing heterogeneous precipitation if a continuous local alkalinization is applied. In contrast, precipitates >30 µm would descend within days to deeper ocean layers, not affecting the precipitation behavior of continuous surface alkalinization attempts. Notice that sinking velocities are temperature and salinity dependent, and therefore would vary under different environmental conditions (see Fig. S13 in the Supplement).
4.1 General findings
By analyzing the experimental datasets provided by Suitner et al. (2024), this study demonstrates that the process of TA-loss during runaway carbonate precipitation follows quantifiable relationships. For the present study, the compiled concepts allowed the description of the principles guiding the entire runaway process. The obtained capability to predict TA-stability ranges, in terms of time and magnitude, might help prevent secondary mineral formation, thereby optimizing the assessments for OAE application scenarios. Furthermore, the simplicity of the logistic curve fit model, along with the demonstration that the carbonate precipitation follows simple rate law equations (see Morse et al., 2007; Mucci and Morse, 1983; Zhong and Mucci, 1989), might facilitate the straightforward integration of these fundamental mechanisms into ocean models like the studies by He and Tyka (2023), Ou et al. (2025), Schwinger et al. (2024), Wang et al. (2023) or Zhou et al. (2024). The relationships reported herein are specific to the experimental setup and the particular environmental conditions under which they were measured. Consequently, projections or models that apply the presented precipitation patterns and equations may not hold when conditions differ from those of the original study.
4.2 Nucleation and onset of accelerated precipitation phase
Previous studies examining the evolution of the runaway precipitation process in the context of OAE (Hartmann et al., 2023; Moras et al., 2022, 2024; Suitner et al., 2024) observed and described considerable periods with stable TA levels before the onset of the APP (see Fig. 1), depending on the TA and DIC levels.
In theory, even at natural background supersaturation levels in the ocean, (pseudo-)homogeneous precipitation is expected to occur at very slow rates, on timescales of thousands of years (Pytkowicz, 1965, 1973). Regardless, the nucleation and precipitation processes in ocean waters are suppressed by inhibitory species like Mg2+ (Berner, 1975; Pan et al., 2021; Pokrovsky, 1998), phosphate- (Burton and Walter, 1990) or dissolved organic matter (Chave and Suess, 1970; Kellock et al., 2022; Moras et al., 2024). Naturally occurring precipitation events in the ocean are associated with sporadic occurrences such as flash floods (Wurgaft et al., 2016, 2021) or observed during whiting events (Broecker and Takahashi, 1966; Bustos-Serrano et al., 2009; Morse et al., 2003), providing high degrees of (re)suspended sediments that catalyze a heterogeneous carbonate precipitation procedure.
To consider the persistent (pseudo-)homogeneous precipitation within typical natural seawater supersaturation ranges, the terminology concerning specific stability ranges of TA or timeframes for the onset of secondary carbonate formation should be refined. However, within typical observation times in the Earth system, the precipitation of secondary calcium carbonate in particle-free seawater solutions is expected to be suppressed to Ωar values of approximately 11.3 or below (derived from Eq. 4 in Marion et al., 2009, based on data by Morse and He, 1993, and Morse et al., 2007).
Nevertheless, even a 0.2 µm-filtered natural seawater contains around ∼109 particles per mL in the size range of 5–120 nm, already offering a total surface area of around 8 m2 m−3 (cf. Wells and Goldberg, 1992), potentially acting as a catalyst to initiate carbonate precipitation in alkalinity treated seawater. In the presence of surfaces for pseudo-homogeneous/ heterogeneous precipitation such as suspended sediments, colloids, organic matter or the introduced solid alkalinization substrates, Moras et al. (2022) reported an Ωar threshold of ∼5–7 for the observable onset of carbonate formation for the given runtime of the experiment. Potentially, the colloidal structure of Mg(OH)2 precipitates (see Badjatya et al., 2022), typically formed above pH values of ∼10.5 as a consequence of TA addition (cf. Eisaman et al., 2023; Haas, 1916; Kapp, 1928; Suitner et al., 2024; Varliero et al., 2024) could serve the same purpose and lower the threshold for carbonate precipitation. However, the redissolution of the formed Mg(OH)2 through the mixing and dilution processes, as described by Ringham et al. (2024), may inhibit this effect and would also allow much higher short-term pH and TA concentrations around an alkalinity injection site when using liquid stock solutions.
To characterize the transition from a state with negligible shifts in carbonate chemistry towards a phase primarily driven by carbonate formation, a practicable criterion of a 40 TA-loss was set to determine the start of the intensified precipitation stage (see Figs. 4 and 5). This criterion was also used to describe the induction time, which is the period before a measurable onset of secondary carbonate formation can be detected (Fig. 4). Since the induction time includes a fundamental uncertainty, it does not reflect an intrinsic property of the treated solution itself and relies on the detection capability of the experimental setup (Söhnel and Mullin, 1988) and might be chosen differently in future work (see Fig. S15 for varying criteria). While the selected criterion already depicts relatively high loss rates, it enables detectable changes, distinguishable from measurement uncertainties or natural variabilities. The overall emerging patterns related to the onset and duration of the APP nevertheless remained relatively consistent across different tested threshold values.
4.3 Predictability of the runaway process
The consistent patterns during the TA-loss within all three experimental setups allowed the introduction of continuous and differentiable functions for each treatment level, enabling further analysis to examine relevant factors guiding the runaway process. Fuhr et al. (2022) utilized a comparable inverted logistic function to model the process of secondary carbonate formation during olivine dissolution experiments in seawater. However, the model was not consistently applied to describe a runaway carbonate precipitation process nor used as a general predictive model to determine the stability ranges of the added TA in OAE approaches.
The characteristics of the logistic function applied in this study, facilitate the conversion of both empirically determined and hypothetical parameters, such as induction time, duration of the APP (Fig. 5), or the initial and final TA levels before and after the runaway process. The applicability of kinetic rate equations, combined with the ability to quantify the precipitation process, enables a description and prediction of the temporal evolution of the carbonate formation. This may facilitate the integration of the TA depletion procedure into various predictive modeling approaches. Although these statements currently apply only under the tested environmental conditions, they nonetheless suggest the general capability to assess a framework for guiding time and TA level ranges in OAE approaches. Since the logistic model is based on experimental data from bottle experiments, processes such as the removal of surface area due to the sinking of precipitated carbonate particles were not accounted for. See Sect. 4.6 for an approach to address this topic.
Under specified temperature and salinity conditions, as well as predefined TA/DIC levels after OAE treatment and an estimated final Ωar after the precipitation process stopped (typically ∼1.5–5.0, see Fuhr et al., 2022; Hartmann et al., 2023; Moras et al., 2022; Pan et al., 2021; Suitner et al., 2024), the resulting total TA-loss can be computed. This calculation follows the condition that the TA-loss reflects the ideal 2:1 TA:DIC ratio during carbonate mineral precipitation in seawater (Zeebe and Wolf-Gladrow, 2001). Given these assumptions, upper and lower limits of the logistic function (coefficients a and d, Eq. 1) can be determined. To characterize measures such as induction time (coefficient b) and the duration of the APP (coefficient c), it is necessary to acquire empirical data that account for the specific conditions of the deployment area. These data could either be provided by actual experiments or model predictions, based on a comprehensive database which accounts for broad ranges of TA, DIC, temperature, salinity, and practical available surface area, as well as inhibitory factors or potential effects of biota. To validate the predicted precipitation behavior, additional gradient experiments need to be conducted to better understand the geochemical reaction pathways.
4.4 Empirical rate equations using Ωar and particle surface area during APP
After passing the induction time to start the detectable carbonate formation process by (pseudo-/)homogeneous precipitation and overcoming the delaying inhibition effects (Marion et al., 2009; Morse and He, 1993; Schulz et al., 2023), the triggered heterogeneous precipitation can be described by basic empirical rate equations (Figs. 6, S8 and S9). These equations demonstrate the fundamental role of Ωar as a guiding factor for the precipitation process. The kinetics of carbonate formation remained relatively consistent across all treatment levels within each experimental approach (see Tables 3, S6 and S7). The observed consistent correlations between saturation states and surface area normalized precipitation rates indicate that the runaway carbonate formation processes during the present incubations followed the known kinetics of heterogeneous carbonate formation in seawater (cf. Morse et al., 2007; Zhong and Mucci, 1989).
Figure 8 illustrates the role of Ωar saturation states and generated particle surface area in guiding the TA-loss rates during the precipitation process. The black line represents the curve fit of TA-loss rates of the unfiltered neq ΔTA2000 approach; the experimentally determined rates are indicated by black triangles (also see Fig. 3C). Assuming that the entire lost TA was transformed into aragonite precipitates with a surface area of 2.283 m2 g−1 (see Sect. 2.3), the total generated particle surface area (PSA) could be determined (red, dash-dotted line). The overall expected TA-loss rate per m2 (brown, dashed line) was obtained by utilizing the empirical logistic curve fit for the temporal evolution of Ωar (Fig. 3B), normalizing it to 1 m2 surface area, and inserting it into the rate equation (Eq. 4). Given that the system initially exhibits a negligible degree of PSA, the relatively high precipitation potential by the Ωar saturation state does not result in a measurable TA-loss rate. Following the presented concept, the consistently high Ωar values led to a continuous (pseudo-/)homogeneous precipitation during the induction time, thus causing a rise in PSA until the system shifts to heterogeneous precipitation, and ultimately resulting in a detectable exponential runaway process. The interplay of precipitation potential by Ωar and the practical available surface area could therefore be determined as the primary factors guiding the actual observed TA-loss rates.
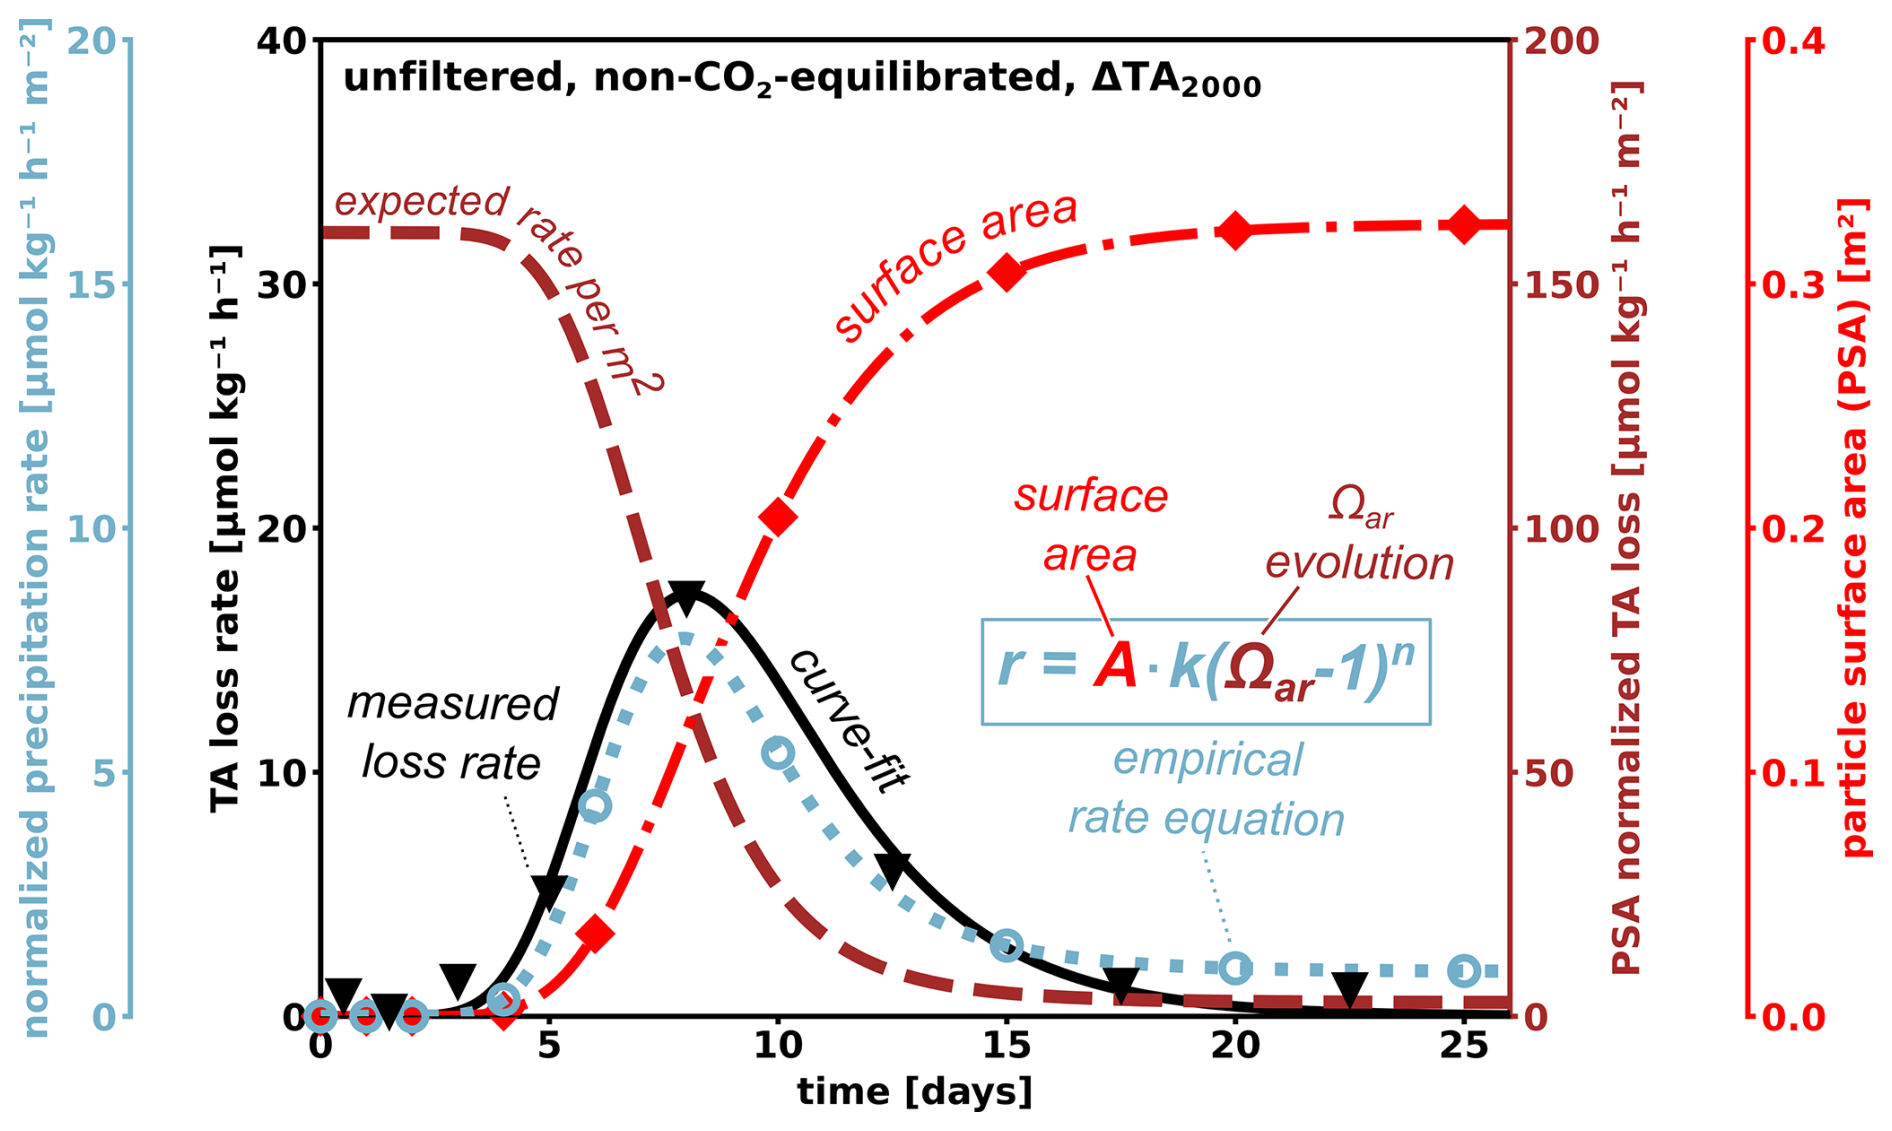
Figure 8Conceptual figure, illustrating the interplay of Ωar and particle surface area guiding the TA-loss rate evolution (dashed, brown). After TA injection high Ωar values provide a high potential for the formation of carbonates by heterogeneous precipitation. In the absence of existing particle surface area (red dash-dotted), (pseudo-/)homogenous precipitation would dominate the period until the start of the APP and the resulting runaway precipitation process. Observed TA-loss rates (black triangles) are therefore a combination of the available practical surface area and the precipitation potential by Ωar oversaturation. The related empirical rate equation (dotted, light blue) connects these two factors with the determined rate constant (k) and reaction order (n), tracing the shape and symmetry of the measured TA-loss rate. Hollow light-blue markers provide the output of the related empirical rate equations for each sampling day. While the potential to precipitate carbonates decreases with progressive precipitation, additional surface area is generated. Understanding how long particles remain in a critical zone to maintain a full-grown runaway process is therefore relevant for future considerations. The shown TA and loss rate data are taken from the empirical data sets for the neq unfiltered ΔTA2000 approach, see Fig. S14 for other treatments levels.
Within the uncertainties of the applied calculation steps and methods, the practical TA-loss rate could simply be described as the product of these two factors. To visualize this relationship, the dotted light blue line in Fig. 8 represents an empirical rate law equation that combines the shown PSA (red, dash-dotted line) and the surface normalized expected precipitation rate (brown, dashed line) with the determined rate constant (k) and reaction order (n) for the ΔTA2000 treatment (see Table 3). The shape of the resulting function traces the measured TA-loss rates (black triangles) within reasonable accuracy (see Fig. S14 in the Supplement for other treatments). Be aware that any kind of inhibition effect is incorporated in the underlying experimentally determined temporal TA evolution, which represents the basis for all shown parameters.
4.5 Could a runaway process be triggered in an open world context?
Mixing with untreated water around an injection point may lead to an efficient dilution below non-critical TA levels within seconds to minutes. Such a process would effectively prevent TA leakage, as described in this study, which assumes that the formed particles act as catalysts for future precipitation. This is supported by findings from a mesocosm experiment and corresponding side experiments, in which the presence of additional suspended aragonite particles accelerated TA-loss (Paul et al., 2025). In contrast, fresh seawater enhanced to the same TA-levels did not show any TA-loss within 10 d in their experiments. These observations suggest that free-floating particles in the water column can accelerate heterogeneous precipitation in a runaway style.
Precipitation events can be triggered naturally without additional treatment, especially for locations with already relatively high Ωar background levels, for example, due to high evaporation rates (Bialik et al., 2022) or high degrees of (re)suspended sediments present on carbonate platforms (Broecker and Takahashi, 1966; Bustos-Serrano et al., 2009; Morse et al., 2003), or close to river mouths (Wurgaft et al., 2016, 2021) providing additional PSA to catalyze precipitation events. Under inappropriate TA deployment circumstances, secondary mineral formation might be triggered locally around injection sites, within short timescales. Moras et al. (2022) suggested that visible APP starts around Ωar of 5. In the mostly particle-free waters of the Raunefjorden, this translates to a ΔTA of ∼245 and ∼580 µmol kg−1 during neq and eq OAE approaches, respectively. The induction time before the APP begins can be estimated using Eq. (5), based on the specified TA-loss criterion of 40 . For the aforementioned equilibrium configurations, the projected induction times would be 1074 and 143 d, respectively. However, the predicted induction times lie far outside the calibration ranges specified in this study and may therefore be inaccurate. Since these projected APP induction times fall within the suggested residence times of treated water in the upper ocean layers, it is necessary to conduct studies lasting at least as long as the projected timespans, depending on local environmental conditions.
Significantly shorter induction times were identified for subtropical conditions (Temp. ∼23 °C, Sal. ∼36 psu, TA ∼2400 µmol kg−1). Hartmann et al. (2023) described an onset of the precipitation after just 4 d for a 50 µm filtered neq incubation with initial values of 1050 µmol kg−1 for ΔTA and ∼15 for Ωar. Within the same setting, Paul et al. (2025) observed aragonite formation for a CO2 equilibrated setup with ΔTA ∼2300 µmol kg−1 and Ωar 9.74±0.15 in mesocosms after 21 d.
The upper end members of TA perturbations examined in this study (neq: ΔTA >2400 µmol kg−1; eq: ΔTA >9000 µmol kg−1) are not intended to represent realistic target background values for permanent open-world scenarios, as such values would need to remain biologically compatible over the long term. Rather, they represent short-lived, near-field conditions that may occur close to an injection site or in enclosed environments where dilution with untreated water is limited. The gradient approach used here therefore served as a controlled experimental framework to investigate the principles of secondary carbonate formation under extreme conditions. Although these small-scale incubations cannot fully reproduce natural systems, they provide a useful means to study the underlying processes in a well-defined setting.
4.6 Consequence of sinking particles removing surface area for carbonate formation
Because the TA-loss rate is proportional to the surface area of particles (Eq. 4), removal of particles due to sinking processes or dilution with untreated water would result in slower precipitation rates. Small, formed particles may remain in the upper layer for several months (Fig. 7), while medium-sized particles may leave the treated water within a couple of days, depending on temperature and salinity conditions (Figs. 7 and S13). Particles larger than 15 µm are expected to sink within one day under the environmental conditions of the Raunefjorden. If those particles were removed by sinking while they were still growing, it can be estimated that approximately 30 %–40 % of the available surface area would be removed from the upper 10 m of the water column within one day (also see Supplement). This would decrease the precipitation rate accordingly as surface area and formation rates are linearly proportional. In a natural open ocean environment, the formation and sinking of precipitates are likely to interact with the existing background of organic and inorganic particles. While any type of particles could potentially serve as nucleation sites, aggregation would increase the sinking speed. These processes were not included in the current model calculations but may be relevant under different conditions. In general, the abundance and sinking of particles need to be addressed if the stability or loss of is to be assessed with a high level of confidence.
Efficient dilution of the treated water parcels could therefore significantly reduce ongoing precipitation, especially if the onset of the APP is initiated within the first few seconds. For example, this could be the case in the wake of a ship, in OAE applications utilizing existing marine traffic to distribute TA throughout the world's oceans (Caserini et al., 2021). Particle-based alkalinization approaches would nevertheless temporarily introduce additional surface area until its complete dissolution, and may cause the shift into the APP (Hartmann et al., 2023).
TA leakage due to oversaturation sets a limit to the efficiency of OAE approaches. So far, the drivers of the process could not be quantified, preventing the implementation of TA-loss terms in applicability assessments for OAE. An induced runaway process follows predictable patterns that can be modeled using available surface area and aragonite oversaturation, identified as the main factors for the given environmental settings.
However, it is expected that parameterizations will systematically change along temperature and salinity gradients, as well as with naturally occurring variations in particle abundance and quality. The determination of their impact was not within the scope of this work; instead, this study aimed to provide a framework for how such needed parameterization can be achieved. Achieving a predictability of the induced TA-loss on a global scale would allow the identification of suitable locations for OAE or optimizing applications. Therefore, further research across salinity and temperature gradients would also enhance the predictive capabilities of ocean models. Runaway TA-loss processes, as described in this study, would be significantly altered under natural conditions by dilution and particle export processes. If sinking of particles and dilution with untreated water are considered, the limitations of laboratory bottle experiments become evident. Nevertheless, they contribute valuable parameterizations for model development. Field experiments are necessary to evaluate the validity of the presented theoretical model framework with respect to dilution and particle sinking processes.
Datasets have been made available via Zenodo: https://doi.org/10.5281/zenodo.20324920 (Suitner, 2026).
The supplement related to this article is available online at https://doi.org/10.5194/bg-23-3965-2026-supplement.
The idea for this work was conceived by NS, with contributions by JH and SV. NS, SV and PS performed the surface area- and sinking velocity/density measurements. NS interpreted the data with help from all co-authors. NS and JH wrote the text with contributions from all co-authors.
The authors have the following competing interests: Jens Hartmann is consulting the Planeteers GmbH.
Publisher's note: Copernicus Publications remains neutral with regard to jurisdictional claims made in the text, published maps, institutional affiliations, or any other geographical representation in this paper. The authors bear the ultimate responsibility for providing appropriate place names. Views expressed in the text are those of the authors and do not necessarily reflect the views of the publisher.
Peggy Bartsch (UHH), Carl Lim (UHH) and Julieta Schneider (GEOMAR) are thanked for supporting the preparation and execution of the experiments.
This research has been supported by the German Federal Ministry of Education and Research through the CDRmare projects RETAKE-1: grant no. 03F0895F and RETAKE-2: grant no. 03F0965F; EU Horizon 2020 (OceanNETs; grant no. 869357); the Deutsche Forschungsgemeinschaft (grant no. 390683824), under Germany's Excellence Strategy (EXC 2037, “CLICCS”; grant no. 390683824) contribution to the Center for Earth System Research and Sustainability (CEN) of the University of Hamburg, as well as the Ocean Alk-Align project funded by the Carbon to Sea Initiative.
This paper was edited by Steven Bouillon and reviewed by two anonymous referees.
Bach, L. T., Riebesell, U., Sett, S., Febiri, S., Rzepka, P., and Schulz, K. G.: An approach for particle sinking velocity measurements in the 3–400 µm size range and considerations on the effect of temperature on sinking rates, Mar. Biol., 159, 1853–1864, https://doi.org/10.1007/s00227-012-1945-2, 2012.
Badjatya, P., Akca, A. H., Fraga Alvarez, D. V., Chang, B., Ma, S., Pang, X., Wang, E., van Hinsberg, Q., Esposito, D. V., and Kawashima, S.: Carbon-negative cement manufacturing from seawater-derived magnesium feedstocks, P. Natl. Acad. Sci. USA, 119, e2114680119, https://doi.org/10.1073/pnas.2114680119, 2022.
Berner, R. A.: The role of magnesium in the crystal growth of calcite and aragonite from sea water, Geochim. Cosmochim. Ac., 39, 489–504, https://doi.org/10.1016/0016-7037(75)90102-7, 1975.
Bialik, O. M., Sisma-Ventura, G., Vogt-Vincent, N., Silverman, J., and Katz, T.: Role of oceanic abiotic carbonate precipitation in future atmospheric CO(2) regulation, Sci. Rep.-UK, 12, 15970, https://doi.org/10.1038/s41598-022-20446-7, 2022.
Broecker, W. S. and Takahashi, T.: Calcium carbonate precipitation on the Bahama Banks, J. Geophys. Res., 71, 1575–1602, https://doi.org/10.1029/JZ071i006p01575, 1966.
Brunauer, S., Emmett, P. H., and Teller, E.: Adsorption of gases in multimolecular layers, J. Am. Chem. Soc., 60, 309–319, 1938.
Burton, E. A. and Walter, L. M.: The role of pH in phosphate inhibition of calcite and aragonite precipitation rates in seawater, Geochim. Cosmochim. Ac., 54, 797–808, https://doi.org/10.1016/0016-7037(90)90374-T, 1990.
Bustos-Serrano, H., Morse, J. W., and Millero, F. J.: The formation of whitings on the Little Bahama Bank, Mar. Chem., 113, 1–8, https://doi.org/10.1016/j.marchem.2008.10.006, 2009.
Caserini, S., Pagano, D., Campo, F., Abbà, A., De Marco, S., Righi, D., Renforth, P., and Grosso, M.: Potential of Maritime Transport for Ocean Liming and Atmospheric CO2 Removal, Frontiers in Climate, 3, https://doi.org/10.3389/fclim.2021.575900, 2021.
Chave, K. E. and Suess, E.: Calcium Carbonate Saturation in Seawater: Effects of Dissolved Organic Matter, Limnol. Oceanogr., 15, 633–637, https://doi.org/10.4319/lo.1970.15.4.0633, 1970.
Eisaman, M. D., Geilert, S., Renforth, P., Bastianini, L., Campbell, J., Dale, A. W., Foteinis, S., Grasse, P., Hawrot, O., Löscher, C. R., Rau, G. H., and Rønning, J.: Assessing the technical aspects of ocean-alkalinity-enhancement approaches, in: Guide to Best Practices in Ocean Alkalinity Enhancement Research, edited by: Oschlies, A., Stevenson, A., Bach, L. T., Fennel, K., Rickaby, R. E. M., Satterfield, T., Webb, R., and Gattuso, J.-P., Copernicus Publications, State Planet, 2-oae2023, 3, https://doi.org/10.5194/sp-2-oae2023-3-2023, 2023.
Faucher, G., Haunost, M., Paul, A. J., Tietz, A. U. C., and Riebesell, U.: Growth response of Emiliania huxleyi to ocean alkalinity enhancement, Biogeosciences, 22, 405–415, https://doi.org/10.5194/bg-22-405-2025, 2025.
Ferderer, A., Chase, Z., Kennedy, F., Schulz, K. G., and Bach, L. T.: Assessing the influence of ocean alkalinity enhancement on a coastal phytoplankton community, Biogeosciences, 19, 5375–5399, https://doi.org/10.5194/bg-19-5375-2022, 2022.
Fuhr, M., Geilert, S., Schmidt, M., Liebetrau, V., Vogt, C., Ledwig, B., and Wallmann, K.: Kinetics of Olivine Weathering in Seawater: An Experimental Study, Frontiers in Climate, 4, https://doi.org/10.3389/fclim.2022.831587, 2022.
Fuss, S., Lamb, W. F., Callaghan, M. W., Hilaire, J., Creutzig, F., Amann, T., Beringer, T., de Oliveira Garcia, W., Hartmann, J., Khanna, T., Luderer, G., Nemet, G. F., Rogelj, J., Smith, P., Vicente, J. L. V., Wilcox, J., del Mar Zamora Dominguez, M., and Minx, J. C.: Negative emissions – Part 2: Costs, potentials and side effects, Environ. Res. Lett., 13, https://doi.org/10.1088/1748-9326/aabf9f, 2018.
Gately, J. A., Kim, S. M., Jin, B., Brzezinski, M. A., and Iglesias-Rodriguez, M. D.: Coccolithophores and diatoms resilient to ocean alkalinity enhancement: A glimpse of hope?, Science Advances, 9, eadg6066, https://doi.org/10.1126/sciadv.adg6066, 2023.
Goldenberg, S. U., Riebesell, U., Brüggemann, D., Börner, G., Sswat, M., Folkvord, A., Couret, M., Spjelkavik, S., Sánchez, N., Jaspers, C., and Moyano, M.: Early life stages of fish under ocean alkalinity enhancement in coastal plankton communities, Biogeosciences, 21, 4521–4532, https://doi.org/10.5194/bg-21-4521-2024, 2024.
Haas, A. R.: The Effect of the Addition of Alkali to Sea Water Upon the Hydrogen Ion Concentration, J. Biol. Chem., 26, 515–517, https://doi.org/10.1016/s0021-9258(18)87433-6, 1916.
Hartmann, J., West, A. J., Renforth, P., Köhler, P., De La Rocha, C. L., Wolf-Gladrow, D. A., Dürr, H. H., and Scheffran, J.: Enhanced chemical weathering as a geoengineering strategy to reduce atmospheric carbon dioxide, supply nutrients, and mitigate ocean acidification, Rev. Geophys., 51, 113–149, https://doi.org/10.1002/rog.20004, 2013.
Hartmann, J., Suitner, N., Lim, C., Schneider, J., Marín-Samper, L., Arístegui, J., Renforth, P., Taucher, J., and Riebesell, U.: Stability of alkalinity in ocean alkalinity enhancement (OAE) approaches – consequences for durability of CO2 storage, Biogeosciences, 20, 781–802, https://doi.org/10.5194/bg-20-781-2023, 2023.
Harvey, L. D. D.: Mitigating the atmospheric CO2 increase and ocean acidification by adding limestone powder to upwelling regions, J. Geophys. Res.-Oceans, 113, https://doi.org/10.1029/2007jc004373, 2008.
He, J. and Tyka, M. D.: Limits and CO2 equilibration of near-coast alkalinity enhancement, Biogeosciences, 20, 27–43, https://doi.org/10.5194/bg-20-27-2023, 2023.
Ilyina, T., Six, K. D., Segschneider, J., Maier-Reimer, E., Li, H., and Núñez-Riboni, I.: Global ocean biogeochemistry model HAMOCC: Model architecture and performance as component of the MPI-Earth system model in different CMIP5 experimental realizations, J. Adv. Model. Earth Sy., 5, 287–315, https://doi.org/10.1029/2012ms000178, 2013.
Inskeep, W. P. and Bloom, P. R.: An evaluation of rate equations for calcite precipitation kinetics at pCO2 less than 0.01 atm and pH greater than 8, Geochim. Cosmochim. Ac., 49, 2165–2180, https://doi.org/10.1016/0016-7037(85)90074-2, 1985.
IPCC: Technical Summary, in: Climate Change 2021 – The Physical Science Basis, 35–144, https://doi.org/10.1017/9781009157896.002, 2023.
Iyer, G., Hultman, N., Eom, J., McJeon, H., Patel, P., and Clarke, L.: Diffusion of low-carbon technologies and the feasibility of long-term climate targets, Technol. Forecast. Soc., 90, 103–118, https://doi.org/10.1016/j.techfore.2013.08.025, 2015.
Kapp, E. M.: The precipitation of calcium and magnesium from sea water by sodium hydroxide, Biol. Bull., 55, 453–458, 1928.
Kellock, C., Castillo Alvarez, M. C., Finch, A., Penkman, K., Kroger, R., Clog, M., and Allison, N.: Optimising a method for aragonite precipitation in simulated biogenic calcification media, PLoS One, 17, e0278627, https://doi.org/10.1371/journal.pone.0278627, 2022.
Kheshgi, H. S.: Sequestering atmospheric carbon dioxide by increasing ocean alkalinity, Energy, 20, 915–922., https://doi.org/10.1016/0360-5442(95)00035-F 1995.
Marín-Samper, L., Arístegui, J., Hernández-Hernández, N., Ortiz, J., Archer, S. D., Ludwig, A., and Riebesell, U.: Assessing the impact of CO2-equilibrated ocean alkalinity enhancement on microbial metabolic rates in an oligotrophic system, Biogeosciences, 21, 2859–2876, https://doi.org/10.5194/bg-21-2859-2024, 2024.
Marion, G. M., Millero, F. J., and Feistel, R.: Precipitation of solid phase calcium carbonates and their effect on application of seawater SA–T–P models, Ocean Sci., 5, 285–291, https://doi.org/10.5194/os-5-285-2009, 2009.
Minx, J. C., Lamb, W. F., Callaghan, M. W., Fuss, S., Hilaire, J., Creutzig, F., Amann, T., Beringer, T., de Oliveira Garcia, W., Hartmann, J., Khanna, T., Lenzi, D., Luderer, G., Nemet, G. F., Rogelj, J., Smith, P., Vicente Vicente, J. L., Wilcox, J., and del Mar Zamora Dominguez, M.: Negative emissions – Part 1: Research landscape and synthesis, Environ. Res. Lett., 13, https://doi.org/10.1088/1748-9326/aabf9b, 2018.
Moras, C. A., Bach, L. T., Cyronak, T., Joannes-Boyau, R., and Schulz, K. G.: Ocean alkalinity enhancement – avoiding runaway CaCO3 precipitation during quick and hydrated lime dissolution, Biogeosciences, 19, 3537–3557, https://doi.org/10.5194/bg-19-3537-2022, 2022.
Moras, C. A., Cyronak, T., Bach, L. T., Joannes-Boyau, R., and Schulz, K. G.: Effects of grain size and seawater salinity on magnesium hydroxide dissolution and secondary calcium carbonate precipitation kinetics: implications for ocean alkalinity enhancement, Biogeosciences, 21, 3463–3475, https://doi.org/10.5194/bg-21-3463-2024, 2024.
Morse, J. W. and He, S.: Influences of T, S and PCO2 on the pseudo-homogeneous precipitation of CaCO3 from seawater: implications for whiting formation, Mar. Chem., 41, 291–297., https://doi.org/10.1016/0304-4203(93)90261-L, 1993.
Morse, J. W., Gledhill, D. K., and Millero, F. J.: Caco3 precipitation kinetics in waters from the great Bahama bank, Geochim. Cosmochim. Ac., 67, 2819–2826, https://doi.org/10.1016/s0016-7037(03)00103-0, 2003.
Morse, J. W., Arvidson, R. S., and Lüttge, A.: Calcium carbonate formation and dissolution, Chem. Rev., 107, 342–381, https://doi.org/10.1021/cr050358j, 2007.
Mucci, A. and Morse, J. W.: The incorporation of and into calcite overgrowths: influences of growth rate and solution composition, Geochim. Cosmochim. Ac., 47, 217–233, https://doi.org/10.1016/0016-7037(83)90135-7, 1983.
Oschlies, A., Bach, L. T., Rickaby, R. E. M., Satterfield, T., Webb, R., and Gattuso, J.-P.: Climate targets, carbon dioxide removal, and the potential role of ocean alkalinity enhancement, in: Guide to Best Practices in Ocean Alkalinity Enhancement Research, edited by: Oschlies, A., Stevenson, A., Bach, L. T., Fennel, K., Rickaby, R. E. M., Satterfield, T., Webb, R., and Gattuso, J.-P., Copernicus Publications, State Planet, 2-oae2023, 1, https://doi.org/10.5194/sp-2-oae2023-1-2023, 2023.
Ou, Y., Xue, Z. G., and Hu, X.: A numerical assessment of ocean alkalinity enhancement efficiency on a river-dominated continental shelf – a case study in the northern Gulf of Mexico, Environ. Res. Lett., https://doi.org/10.1088/1748-9326/adaa8b, 2025.
Pan, Y., Li, Y., Ma, Q., He, H., Wang, S., Sun, Z., Cai, W.-J., Dong, B., Di, Y., Fu, W., and Chen, C.-T. A.: The role of in inhibiting CaCO3 precipitation from seawater, Mar. Chem., 237, https://doi.org/10.1016/j.marchem.2021.104036, 2021.
Paul, A. J., Haunost, M., Goldenberg, S. U., Hartmann, J., Sánchez, N., Schneider, J., Suitner, N., and Riebesell, U.: Ocean alkalinity enhancement in an open-ocean ecosystem: biogeochemical responses and carbon storage durability, Biogeosciences, 22, 2749–2766, https://doi.org/10.5194/bg-22-2749-2025, 2025.
Pokrovsky, O. S.: Precipitation of calcium and magnesium carbonates from homogeneous supersaturated solutions, J. Cryst. Growth, 186, 233–239, https://doi.org/10.1016/S0022-0248(97)00462-4, 1998.
Pytkowicz, R.: Calcium carbonate retention in supersaturated seawater, Am. J. Sci., 273, 515–522, https://doi.org/10.2475/ajs.273.6.515 1973.
Pytkowicz, R. M.: Rates of Inorganic Calcium Carbonate Nucleation, J. Geol., 73, 196–199, https://doi.org/10.1086/627056, 1965.
Rau, G. H. and Caldeira, K.: Enhanced carbonate dissolution as a means of sequestering carbon dioxide in the ocean, Energ. Convers. Manage., 40, 1803–1813, https://doi.org/10.1016/S0196-8904(99)00071-0, 1999.
Renforth, P. and Henderson, G.: Assessing ocean alkalinity for carbon sequestration, Rev. Geophys., 55, 636–674, https://doi.org/10.1002/2016rg000533, 2017.
Ringham, M. C., Hirtle, N., Shaw, C., Lu, X., Herndon, J., Carter, B. R., and Eisaman, M. D.: An assessment of ocean alkalinity enhancement using aqueous hydroxides: kinetics, efficiency, and precipitation thresholds, Biogeosciences, 21, 3551–3570, https://doi.org/10.5194/bg-21-3551-2024, 2024.
Rogelj, J., Popp, A., Calvin, K. V., Luderer, G., Emmerling, J., Gernaat, D., Fujimori, S., Strefler, J., Hasegawa, T., Marangoni, G., Krey, V., Kriegler, E., Riahi, K., van Vuuren, D. P., Doelman, J., Drouet, L., Edmonds, J., Fricko, O., Harmsen, M., Havlík, P., Humpenöder, F., Stehfest, E., and Tavoni, M.: Scenarios towards limiting global mean temperature increase below 1.5 °C, Nat. Clim. Change, 8, 325–332, https://doi.org/10.1038/s41558-018-0091-3, 2018.
Sánchez, N., Goldenberg, S. U., Brüggemann, D., Jaspers, C., Taucher, J., and Riebesell, U.: Plankton food web structure and productivity under ocean alkalinity enhancement, Sci. Adv., 10, eado0264, https://doi.org/10.1126/sciadv.ado0264, 2024.
Schulz, K. G., Bach, L. T., and Dickson, A. G.: Seawater carbonate chemistry considerations for ocean alkalinity enhancement research: theory, measurements, and calculations, in: Guide to Best Practices in Ocean Alkalinity Enhancement Research, edited by: Oschlies, A., Stevenson, A., Bach, L. T., Fennel, K., Rickaby, R. E. M., Satterfield, T., Webb, R., and Gattuso, J.-P., Copernicus Publications, State Planet, 2-oae2023, 2, https://doi.org/10.5194/sp-2-oae2023-2-2023, 2023.
Schwinger, J., Bourgeois, T., and Rickels, W.: On the emission-path dependency of the efficiency of ocean alkalinity enhancement, Environ. Res. Lett., 19, https://doi.org/10.1088/1748-9326/ad5a27, 2024.
Sers, M. R. and Victor, P. A.: The Energy-emissions Trap, Ecol. Econ., 151, 10–21, https://doi.org/10.1016/j.ecolecon.2018.04.004, 2018.
Sjöberg, E.: A fundamental equation for calcite dissolution kinetics, Geochim. Cosmochim. Ac., 40, 441–447, https://doi.org/10.1016/0016-7037(76)90009-0, 1976.
Söhnel, O. and Mullin, J. W.: Interpretation of crystallization induction periods, J. Colloid Interf. Sci., 123, 43–50, https://doi.org/10.1016/0021-9797(88)90219-6, 1988.
Suessle, P., Taucher, J., Goldenberg, S. U., Baumann, M., Spilling, K., Noche-Ferreira, A., Vanharanta, M., and Riebesell, U.: Particle fluxes by subtropical pelagic communities under ocean alkalinity enhancement, Biogeosciences, 22, 71–86, https://doi.org/10.5194/bg-22-71-2025, 2025.
Suitner, N.: Datasets for: Surface area and Ω-aragonite oversaturation as controls of the runaway precipitation process in ocean alkalinity enhancement, Zenodo [data set], https://doi.org/10.5281/zenodo.20324920, 2026.
Suitner, N., Faucher, G., Lim, C., Schneider, J., Moras, C. A., Riebesell, U., and Hartmann, J.: Ocean alkalinity enhancement approaches and the predictability of runaway precipitation processes: results of an experimental study to determine critical alkalinity ranges for safe and sustainable application scenarios, Biogeosciences, 21, 4587–4604, https://doi.org/10.5194/bg-21-4587-2024, 2024.
Tjørve, K. M. and Tjørve, E.: The use of Gompertz models in growth analyses, and new Gompertz-model approach: An addition to the Unified-Richards family, PLoS One, 12, e0178691, https://doi.org/10.1371/journal.pone.0178691, 2017.
UNFCCC: Report of the Conference of the Parties to the United Nations Framework Convention on Climate Change (21st Session, 2015: Paris), Retrived December, vol. 4, GE.16-01192(E), 2015.
Varliero, S., Buono, A., Caserini, S., Raos, G., and Macchi, P.: Chemical Aspect of Ocean Liming for CO2 Removal: Dissolution Kinetics of Calcium Hydroxide in Seawater, ACS Engineering Au, https://doi.org/10.1021/acsengineeringau.4c00008, 2024.
Wang, H., Pilcher, D. J., Kearney, K. A., Cross, J. N., Shugart, O. M., Eisaman, M. D., and Carter, B. R.: Simulated impact of ocean alkalinity enhancement on atmospheric CO2 removal in the Bering Sea, Earths Future, 11, https://doi.org/10.1029/2022EF002816, 2023.
Wells, M. L. and Goldberg, E. D.: Marine submicron particles, Mar. Chem., 40, 5–18, https://doi.org/10.1016/0304-4203(92)90045-C, 1992.
Wurgaft, E., Steiner, Z., Luz, B., and Lazar, B.: Evidence for inorganic precipitation of CaCO3 on suspended solids in the open water of the Red Sea, Mar. Chem., 186, 145–155, https://doi.org/10.1016/j.marchem.2016.09.006, 2016.
Wurgaft, E., Wang, Z. A., Churchill, J. H., Dellapenna, T., Song, S., Du, J., Ringham, M. C., Rivlin, T., and Lazar, B.: Particle Triggered Reactions as an Important Mechanism of Alkalinity and Inorganic Carbon Removal in River Plumes, Geophys. Res. Lett., 48, 277, https://doi.org/10.1029/2021gl093178, 2021.
Xin, X., Goldenberg, S. U., Taucher, J., Stuhr, A., Aristegui, J., and Riebesell, U.: Resilience of Phytoplankton and Microzooplankton Communities under Ocean Alkalinity Enhancement in the Oligotrophic Ocean, Environ. Sci. Technol., https://doi.org/10.1021/acs.est.4c09838, 2024.
Zeebe, R. and Wolf-Gladrow, D.: CO2 in Seawater: Equilibrium, Kinetics, Isotopes, Elsevier Oceanography Book Series, 65, Amsterdam, 361 pp., ISBN 0-444-50946-1, 2001.
Zhong, S. and Mucci, A.: Calcite and aragonite precipitation from seawater solutions of various salinities: Precipitation rates and overgrowth compositions, Chem. Geol., 78, 283–299, https://doi.org/10.1016/0009-2541(89)90064-8, 1989.
Zhou, M., Tyka, M. D., Ho, D. T., Yankovsky, E., Bachman, S., Nicholas, T., Karspeck, A. R., and Long, M. C.: Mapping the global variation in the efficiency of ocean alkalinity enhancement for carbon dioxide removal, Nat. Clim. Change, 1–7, https://doi.org/10.1038/s41558-024-02179-9, 2024.