the Creative Commons Attribution 4.0 License.
the Creative Commons Attribution 4.0 License.
 | 22 Jun 2026
Dissecting mesopelagic particulate organic carbon budgets in the North Atlantic: A mechanistic diagnosis and evaluation of PISCESv2_RC
M. Andrea Orihuela-García
Yohan Ruprich-Robert
Vladimir Lapin
Saskia Loosveldt Tomas
Raffaele Bernardello
Margarida Samsó-Cabré
Pierre-Antoine Bretonnière
Miguel Castrillo
Biogeochemical and physical processes in the mesopelagic layer regulate long-term carbon storage in the ocean interior. However, uncertainties in particulate organic carbon (POC) budgets limit quantitative understanding of the biological carbon pump and its representation in models. Here we analyse POC budgets simulated by the NEMO4–PISCESv2_RC model in the upper 1000 m of the North Atlantic over a climatological seasonal cycle, evaluating model performance and diagnosing the mechanisms that regulate POC export and transfer efficiency. Comparison with satellite, Argo-float, shipboard, and sediment-trap data indicates generally realistic POC stocks and fluxes. However, the model exhibits systematic biases, including (i) excessive diatom dominance at mid–high latitudes, (ii) compensation between too-low primary production and excessive epipelagic export in the subtropics, and (iii) underestimated mesopelagic POC stocks at mid and low latitudes. In the model, the mesopelagic POC supply driven by gravitational export and large detritus increases poleward, while winter–spring mixing supplies an additional 37 % in the subpolar region. Up to 60 % of mesopelagic POC supply is intercepted by zooplankton, yet most is recycled to detritus through fragmentation and trophic processing. This detrital loop modulates particle size, sinking speed, and degradation pathways, and is seasonally reinforced at mid–high latitudes. The lability of exported POC increases with latitude, whereas temperature-driven decay rates decrease with latitude. These opposing gradients result in maximal mesopelagic POC flux attenuation at midlatitudes, coincident with peak productivity. Small detritus plays a central role in the model, accounting for ∼ 55 % of mesopelagic POC decay and driving 33 %–50 % of vertical flux at 1000 m. These large modelled contributions reflect substantial biological supply and a pronounced vertical decline in lability, together favouring mesopelagic transfer of small POC. We propose POC budget analysis as a mechanistic framework for identifying structural biases and constraining inter-model spread in projections of the biological particulate carbon pump.
- Article
(6991 KB) - Full-text XML
-
Supplement
(2527 KB) - BibTeX
- EndNote


Through photosynthesis, phytoplankton fix inorganic carbon (C) into organic matter that fuels marine food webs (Lindeman, 1942). This organic matter flows in particulate form through trophic interactions between microbial primary producers (phytoplankton), their protist and metazoan predators (zooplankton), and detrital particles – collectively termed particulate organic carbon (POC). A fraction of primary production is released as dissolved organic carbon (DOC); in addition to being remineralised to dissolved inorganic carbon (DIC) and nutrients, DOC can re-enter the particulate pool via the microbial loop (Pomeroy, 1974).
A portion of surface POC escapes rapid recycling in the upper ocean and is transferred to depth via gravitational sinking and other transport mechanisms (Eppley and Peterson, 1979; Volk and Hoffert, 1985; Kwon et al., 2009; Boyd et al., 2019). Additional vertical fluxes include biogenic particulate inorganic carbon sinking (Honjo, 1980; Neukermans et al., 2023) and DOC transport (Jiao et al., 2010). The vertical transfer of biogenic carbon pools, and their gradual transformation to DIC and subsequent storage in the ocean interior, constitute the biological carbon pump (Volk and Hoffert, 1985; Marinov et al., 2008b; Legendre, 2024; Frenger et al., 2024). Here, we focus on its particulate organic component.
POC export to depth occurs through multiple pathways, including “passive” gravitational sinking (Volk and Hoffert, 1985), turbulent mixing and diffusion (Gardner et al., 1995; Bol et al., 2018), advection (Levy et al., 2013), and “active” transport by diel and seasonal zooplankton migrations (Jónasdóttir et al., 2015; Brun et al., 2019; Gorgues et al., 2019). Once in the mesopelagic, POC is transformed by zooplankton detritivory (Steinberg and Landry, 2016; Giering et al., 2014) and particle aggregation-disaggregation processes (Mayor et al., 2014; Takeuchi et al., 2019; Briggs et al., 2020), and ultimately removed through bacterial degradation (Belcher et al., 2016). As a result, the vertical POC flux is predominantly attenuated in the mesopelagic zone (∼ 100–1000 m; Martin et al., 1987). The balance between vertical transfer and remineralisation regulates carbon storage, nutrient regeneration (Weber et al., 2016; Rodgers et al., 2024), and sea-air CO2 exchange (Ricour et al., 2023), thereby influencing climate feedbacks (Kwon et al., 2009; Le Quéré et al., 2016).
POC spans a broad size spectrum, from hundred nm to mm (Stemmann and Boss, 2012). Large particles (> 100 µm), including phytodetrital aggregates and faecal pellets with their microbial colonisers (Kiørboe et al., 2003) dominate fast gravitational export due to their fast settling velocities in the order of tens to hundreds of m d−1 (Stemmann and Boss, 2012). In contrast, small particles (< 100 µm), which comprise > 85 % of the POC stock (Baker et al., 2017; Galí et al., 2022) are mostly suspended or sink slowly (< 10 m d−1). However, owing to their large standing stocks, small particles contribute substantially to non-gravitational export pathways, such as turbulent diffusion – the so-called “mixed layer pump (Giering et al., 2016; Lacour et al., 2019) – and advection (Alonso-González et al., 2009).
Particle size is linked to reactivity, reflecting variations in composition, age and bioavailability (Walker et al., 2016; Kharbush et al., 2020; Johnson et al., 2020). In surface waters, living organisms may dominate the POC pool, especially in productive settings (Gasol et al., 1997), whereas the proportion of detrital POC increases with depth. However, uncertainties in POC apportionment persist, especially in the mesopelagic zone (Galí et al., 2022; Koestner et al., 2024). As particles undergo biotic and abiotic transformations, their size, sinking velocity and reactivity may vary in concert along the water column. Slow-sinking detritus experiences longer residence times in the upper ocean and is more exposed to biological transformation. Therefore, sinking-reactivity models (Aumont et al., 2017) predict slow-sinking detritus to become refractory at shallower depths than fast-sinking detritus.
Observationally, POC export and mesopelagic transformation are difficult to quantify due to the intermittency (Berger and Wefer, 1990), seasonality (de Melo Viríssimo et al., 2024), and fine spatial scales (Bol et al., 2018; Briggs et al., 2020; Lacour et al., 2023) of POC export events. For instance, annual mean export estimates can carry uncertainties of up to ±60 % in strongly seasonal regions (Henson et al., 2015). Additional challenges arise from limited quantitative knowledge about mesopelagic bacteria and zooplankton activities (Arístegui et al., 2009; Hernández-León et al., 2019), missing or poorly quantified POC inputs (Boyd et al., 2019), biases in metabolic measurements (Burd et al., 2010), and temporal mismatches between POC inputs and losses (Uchimiya et al., 2018). Together, these limitations hinder closure of mesopelagic POC budgets using observations alone (Giering et al., 2014).
Despite recent advances in observing POC stocks (Claustre et al., 2021), export fluxes (Henson et al., 2024), and biological turnover rates (Bressac et al., 2024), comprehensive quantification of POC fluxes across regions and seasons remains elusive. Therefore, ocean biogeochemistry models are essential tools to mechanistically integrate physical transport, ecosystem structure and biogeochemical transformations (Fennel et al., 2022; Henson et al., 2022), enabling exploration of spatiotemporal scales and processes that are inaccessible to observations alone. Here, we investigate mesopelagic POC dynamics and budgets using the NEMO 4.0.4–PISCESv2_RC coupled model, focusing on the North Atlantic – a data-rich region with sharp biogeochemical gradients.
Compared to other models participating in the Coupled Model Intercomparison Project (CMIP) (Henson et al., 2022), PISCESv2_RC incorporates several distinctive features relevant to mesopelagic POC cycling: (i) a variable reactivity or reactivity continuum (RC) scheme (Boudreau and Ruddick, 1991) that simulates vertical changes in small and large POC reactivity (Aumont et al., 2017); (ii) explicit zooplankton detritivory through both phagotrophic particle ingestion and flux feeding; (iii) parameterisations for fragmentation of large detritus by mesozooplankton and bacterial processes; and (iv) abiotic aggregation-disaggregation dynamics that interconvert between DOC and detrital POC.
Future projections of productivity, export efficiency (EE), and transfer efficiency (TE) under climate change diverge widely in both magnitude and spatial patterns (Wilson et al., 2022; Doney et al., 2024; Wang and Fennel, 2024; Walker and Palevsky, 2025; Doléac et al., 2025). These discrepancies reflect differences in the representation of physical circulation and particle export, remineralisation, and food-web structure (e.g., Walker and Palevsky, 2025; Brabson et al., 2025). As PISCES underpins several CMIP model configurations, a detailed diagnosis of its detrital POC budgets in a relatively well-observed region like the North Atlantic is essential for interpreting inter-model spread and identifying structural and parametric biases relative to observations.
The objectives of this study are to:
-
Analyse the variability of modelled POC stocks and fluxes in the upper 1000 m of the North Atlantic, from subtropical to subpolar latitudes, and evaluate them against available observations from satellites, autonomous floats, shipboard surveys and sediment traps.
-
Quantify the budgets of small and large detrital POC in the dynamically consistent framework provided by NEMO–PISCESv2_RC, accounting for the full suite of simulated food-web and physicochemical process rates (sources and sinks) and various physical transport modes.
-
Dissect the mechanistic drivers of the biological particulate carbon pump across contrasting North Atlantic biogeochemical regimes and reveal their influence on the epipelagic export efficiency (EE) and mesopelagic transfer efficiency (TE) summary metrics.
2.1 Model configuration and simulation setup
We use the dynamical ocean model NEMO 4.0.4 (Nucleus for European Modelling of the Ocean; Madec, 2008), coupled with the sea-ice model SI3 (Vancoppenolle et al., 2009) and the biogeochemical model PISCESv2_RC (Pelagic-Interactions Scheme for Carbon and Ecosystem Studies; Aumont et al., 2015, 2017). Hereinafter, we will use the terms NEMO and PISCES to refer to NEMO 4.0.4 and the version of PISCESv2_RC released alongside it (Table 1). NEMO and PISCES are coupled through the Tracers in Ocean Paradigm (TOP) tracer manager (NEMO TOP Working Group, 2018), which performs advective and diffusive transports of both physical and biogeochemical tracers (see details in Supplement Sect. S1).
Table 1Abbreviations used in the text and their definitions.
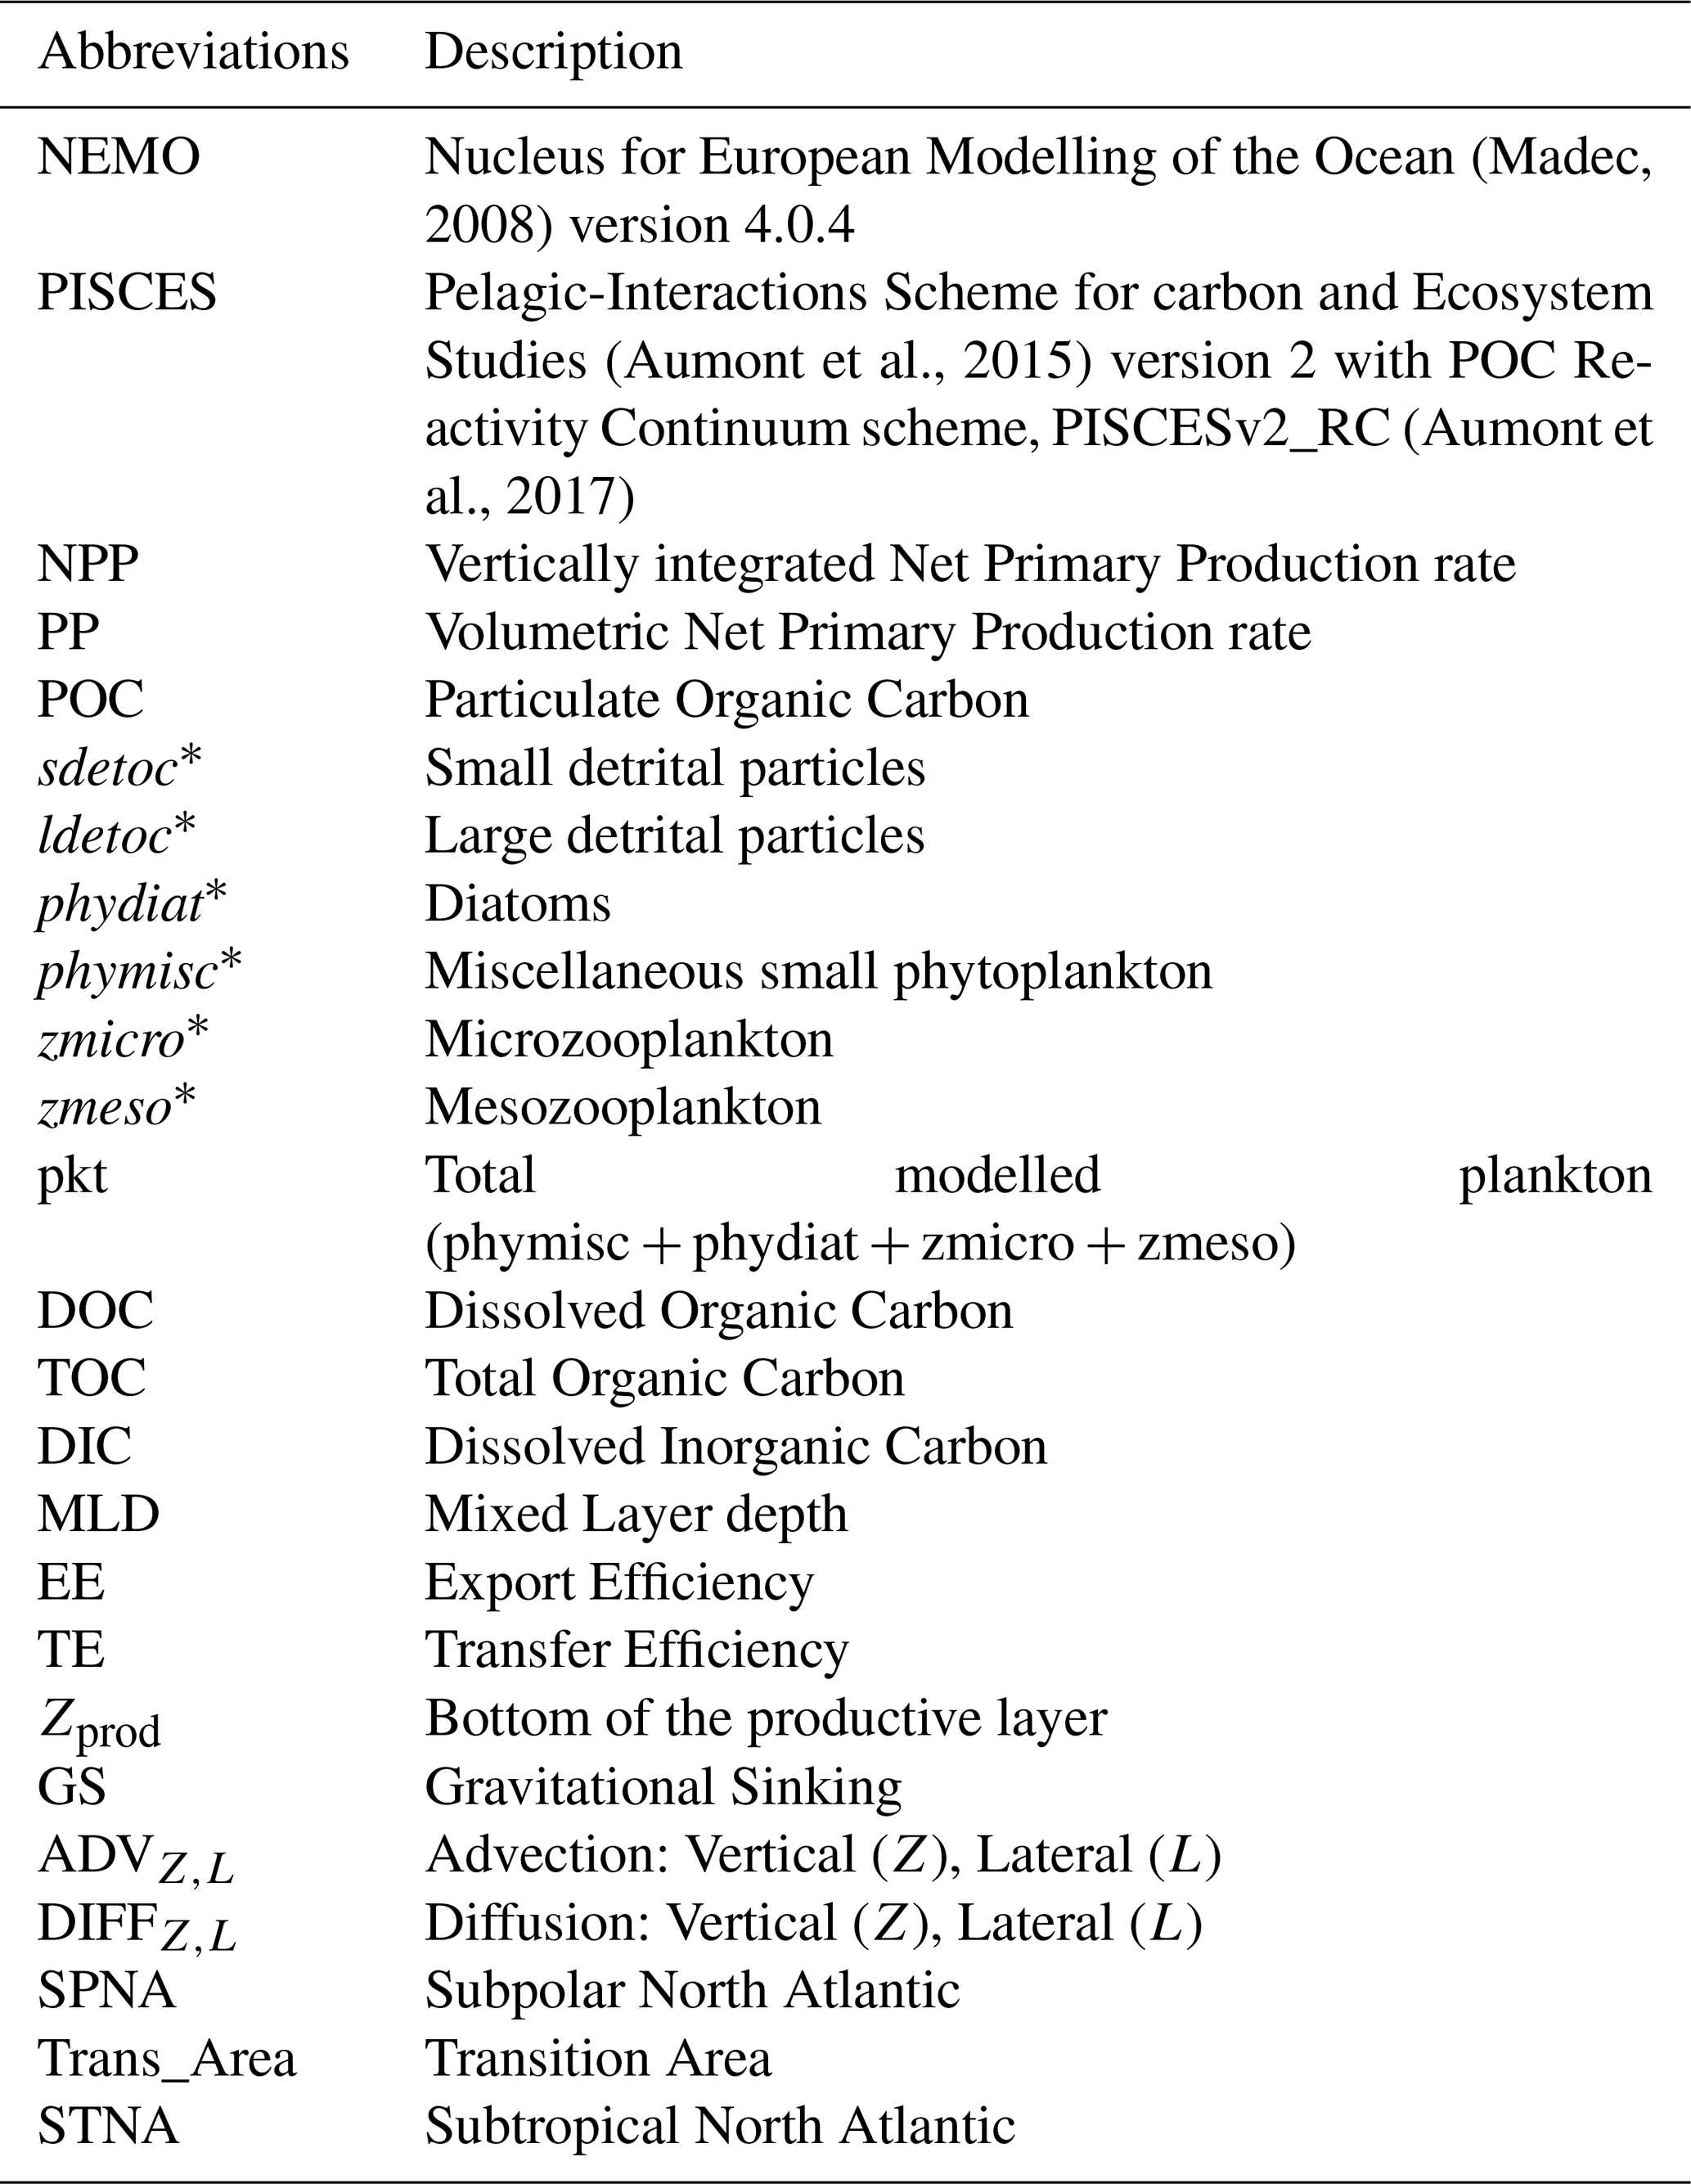
* Biogeochemical model tracer and fraction of POC.
Global simulations were run on the ORCA1L75 grid (∼ 1° horizontal resolution, 75 non-linear vertical levels) with a 45-minute time step for ocean dynamics and biogeochemistry. The simulation followed the Ocean Model Intercomparison Project protocol (OMIP-2; Tsujino et al., 2018) and was forced by the JRA-55 atmospheric reanalysis (Kobayashi et al., 2015). After initialisation, biogeochemistry was spun up for 1302 years under recurring circulation and fixed preindustrial atmospheric CO2. The subsequent transient simulation included rising atmospheric CO2 concentrations over 1850–2019. Only results from the final 1958–2019 forcing period are analysed here, focusing on the North Atlantic. For comparison with satellite products, a monthly climatology over 1998–2019 was used. Further details are given in Supplement Sect. S1.
2.2 Biogeochemical model description
PISCES simulates marine planktonic food webs and the biogeochemical cycling of key elements (carbon, nitrogen, phosphorus, silicon, and iron) using 24 tracers that represent living, detrital and inorganic compartments. Here we briefly describe the representation of POC cycling in the model, introducing tracer names in italics.
POC is represented by six tracers: two phytoplankton types – miscellaneous small phytoplankton (phymisc) and diatoms (phydiat); two zooplankton types – microzooplankton (zmicro) and mesozooplankton (zmeso); and two detrital pools – small (sdetoc) and large (ldetoc) particles. Of these, only detrital tracers sink, with fixed sinking velocities of 2 and 50 m d−1 for sdetoc and ldetoc, respectively. Phytoplankton growth depends on light availability and uptake of nitrate, ammonium, phosphate, dissolved iron and, for diatoms, silicate. Phytoplankton is lost through zooplankton grazing and linear and quadratic mortality terms, the latter representing aggregation upon bloom demise. Both zooplankton types prey on phytoplankton and sdetoc with different preferences. Mesozooplankton additionally predates on microzooplankton and consumes sdetoc and ldetoc via flux feeding.
Detritus is produced mainly through plankton mortality and zooplankton inefficient (“sloppy”) feeding, with partitioning between sdetoc and ldetoc depending on the organism and process involved. Detrital particles are degraded to DOC using the variable reactivity scheme of Aumont et al. (2017), which allows decay rate constants (k, d−1) to vary in space and time. This scheme prescribes a maximum k of 0.035 d−1 at 0 °C for freshly produced detritus in the upper mixed layer. With increasing depth, k decreases as sinking particles lose their most reactive components and become increasingly refractory. This decrease is not prescribed explicitly but emerges from the balance between particle sinking, the local supply of fresh detritus, and the progressive degradation of 15 lability classes implicitly represented by a gamma distribution. As a result, the vertical profile of k varies among regions, seasons, and detrital size classes. Detritus decay rates also increase as a power function of temperature, approximately doubling every 10 °C (Q10 of 1.9). Following PISCES terminology, degradation of sdetoc and ldetoc is referred to as remineralisation, although detrital POC is first converted to DOC before reaching dissolved inorganic carbon (DIC).
Mesozooplankton flux feeding and fragmentation are key features in PISCESv2 (Aumont et al., 2017). Given that the current parameterisation differs markedly from previous model versions (Gehlen et al., 2006), here we provide an updated description. At each time step, a variable fraction of mesozooplankton biomass engages in flux feeding. This fraction is diagnosed as the ratio of flux-feeding ingestion to total mesozooplankton ingestion. Flux feeding rates are calculated as the product of flux-feeding mesozooplankton biomass, a flux-feeding cross-section parameter, and the sinking flux of each detrital tracer (Supplement Sect. S1.2, Eq. S4). The flux-feeding parameter corresponds to a biomass-normalised area of 3 m2 (mol C)−1, roughly representative of temperate and subpolar flux feeders (Jackson, 1993; Stemmann et al., 2004b; Stukel et al., 2019).
Fragmentation of large detritus by mesozooplankton is expressed as a variable proportion of flux feeding rates, resulting in additional attenuation of ldetoc fluxes and transfer to sdetoc. The ratio between fragmentation and flux feeding increases, from 0.2 to around 2, as a function of the ratio of biogenic silica to ldetoc concentrations. This dependence is intended to represent the greater fragility of large detritus composed of diatom aggregates compared to more compact forms such as faecal pellets.
2.3 Detrital POC budgets
We diagnosed the full budgets of sdetoc and ldetoc by outputting all individual terms from their prognostic equations, including sources (production processes), sinks (consumption processes) and transports (Fig. 1). Transports include gravitational sinking and tridimensional advection and diffusion. Diffusion – equivalent to mixing – represents transport by subgrid scale ocean dynamics. Budgets were computed separately for the epipelagic and mesopelagic layer in three regions outlined in Fig. 2: the Subpolar North Atlantic (SPNA), the Transition Area (Trans_Area) and the Subtropical North Atlantic (STNA). The boundary between the two layers, Zprod, is defined as the depth at which the annual mean vertical profile of primary production (PP) falls below 1 % of its maximum. For each region, Zprod was fixed to ensure that budgets were computed over a consistent vertical domain over the seasonal cycle. The choice of a biome-specific Zprod, rather than a fixed reference depth, avoids conflating productive-layer structure with mesopelagic transfer when comparing regions. For instance, a uniform reference depth of 100 m would underestimate export in the SPNA, where substantial net POC removal occurs above 100 m, and overestimate export in the STNA, where photosynthetic production extends below 100 m (Palevsky and Doney, 2018, 2021; Wilson et al., 2022; Walker and Palevsky, 2025).
For a given region and layer, the budget equation takes the generic form
where Sources and Sinks represent vertically integrated rates averaged over each region. Transport terms, namely gravitational sinking (GS), advection (ADV) and diffusion (DIFF), are expressed as the divergence of the fluxes along the lateral and vertical directions. Divergence corresponds to the net difference between input and output fluxes through the domain boundaries, divided by the domain length in the corresponding direction. Hereafter, fluxes across a bounding surface are denoted by F followed by a subscript (e.g., FGS, FADV, FDIFF), whereas GS, DIFF and ADV denote the associated flux divergences. Subscripts Z and L indicate the vertical and lateral components, respectively (e.g., FADVZ, FADVL, DIFFZ, DIFFL).
We verified budget closure by comparing the simulated tracer tendency with the sum of all diagnosed source, sink and transport terms over each domain. Budgets were closed both over successive model time steps (within % error) and over monthly periods.
Below, we provide a qualitative representation of the detrital POC budgets (Eqs. 2 and 3). The full prognostic equations for sdetoc and ldetoc, explicitly showing their controlling parameters, are provided in Supplement Sect. S1.2 and Table S2.1, as these equations have been described previously by Aumont et al. (2015, 2017). Superscript numbers are used as labels to link terms to Table S2.1 and Fig. 1:
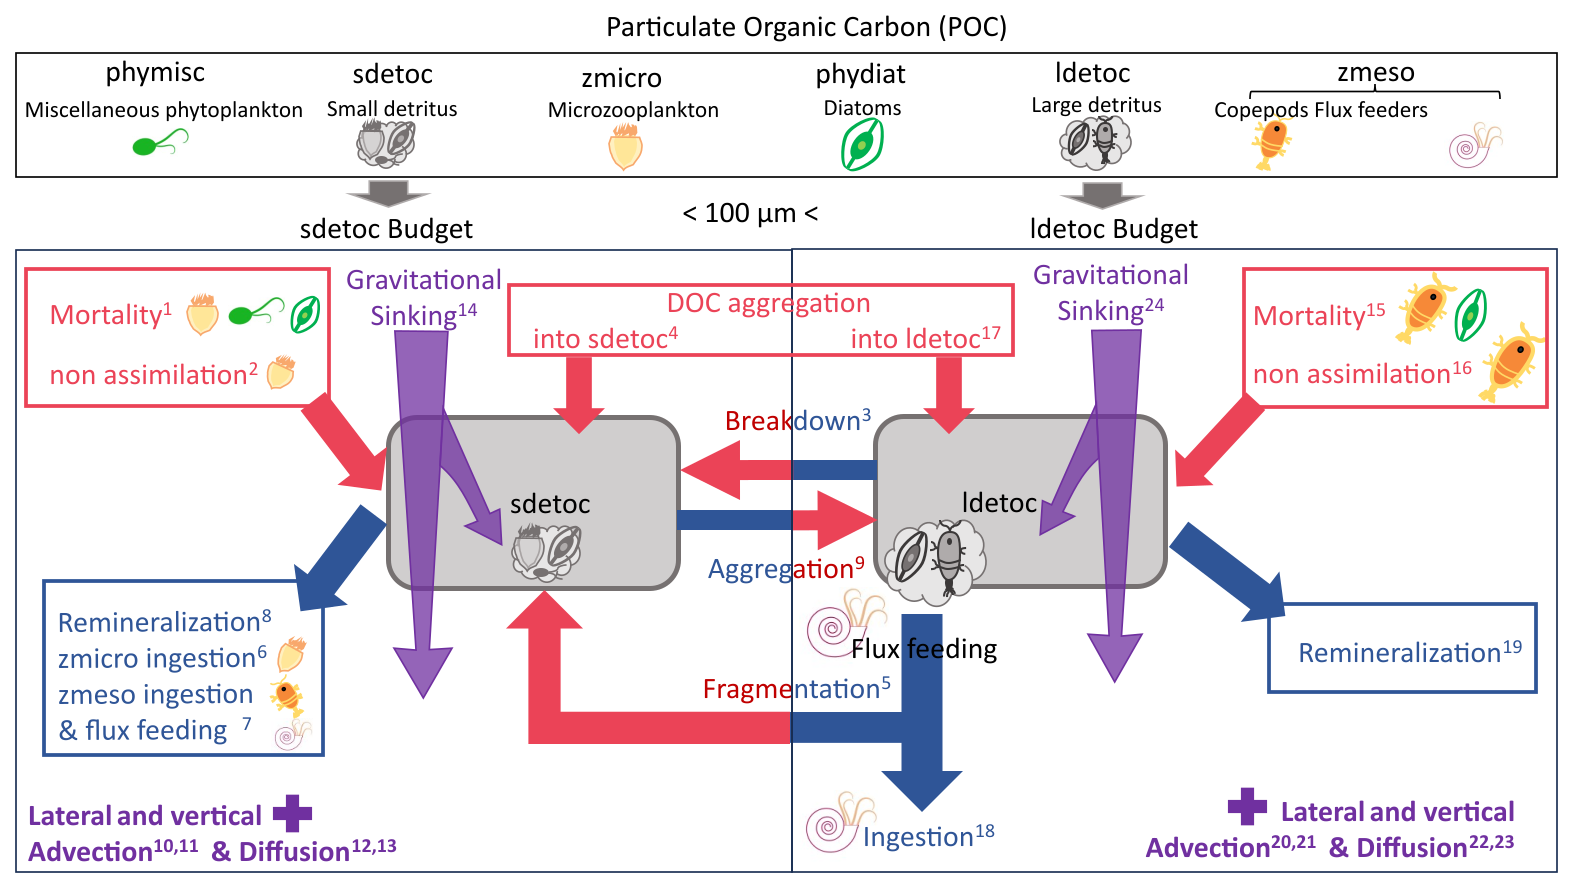
Figure 1Schematic of detrital POC dynamics and budgets in the PISCES model. Red arrows represent sources (production processes); blue arrows represent sinks (consumption processes). Purple arrows and tags represent the transport processes, which can supply or remove detritus from the budget. The top panel illustrates the six tracers that form POC in PISCES. Full budgets are analysed only for the detrital tracers (sdetoc and ldetoc), but all POC tracers are included in calculations of vertical non-gravitational fluxes and comparison to observational estimates.
For clarity, we lumped together some budget terms that are small and/or follow similar dynamics: (i) sdetoc consumption by phagotrophic ingestion and flux feeding; (ii) physical aggregation processes, and (iii) mortality terms. Finally, note that processes that interconvert between sdetoc and ldetoc appear in both budgets with opposite signs.
2.4 Export Efficiency (EE) and Transfer Efficiency (TE) metrics
We summarised spatial variations in vertical POC fluxes using three common metrics. Export efficiency (EE; Buesseler, 1998), also referred to as export ratio, is defined as the ratio between POC export flux through the bottom of the productive (epipelagic) layer and the net primary production rate integrated over that layer (NPP):
Transfer efficiency (TE; François et al., 2002) quantifies the fractional transfer of exported POC from the base of the productive layer to a deeper reference depth – in our case, the base of the mesopelagic layer (1000 m):
The product of EE and TE is the particulate carbon pump efficiency (Buesseler and Boyd, 2009) at 1000 m:
Vertical POC fluxes at the same two depths bounding the mesopelagic domain were also used to calculate Martin's b exponent (Martin et al., 1987), often referred to as the flux attenuation coefficient:
Stronger vertical attenuation of POC fluxes corresponds to lower TE and larger positive values of b. All metrics were calculated using annual-mean climatological fluxes for each region to avoid issues associated with non-steady-state seasonal dynamics (Giering et al., 2017) (see Sects. 3.4 and 4.3).
To assess differences in attenuation among POC pools, Eqs. (4)–(6) were applied both to detrital POC fluxes alone (gravitational, diffusive and advective fluxes of sdetoc and ldetoc) and to total POC fluxes, which additionally include the diffusive and advective vertical transports of plankton tracers.
2.5 Model evaluation
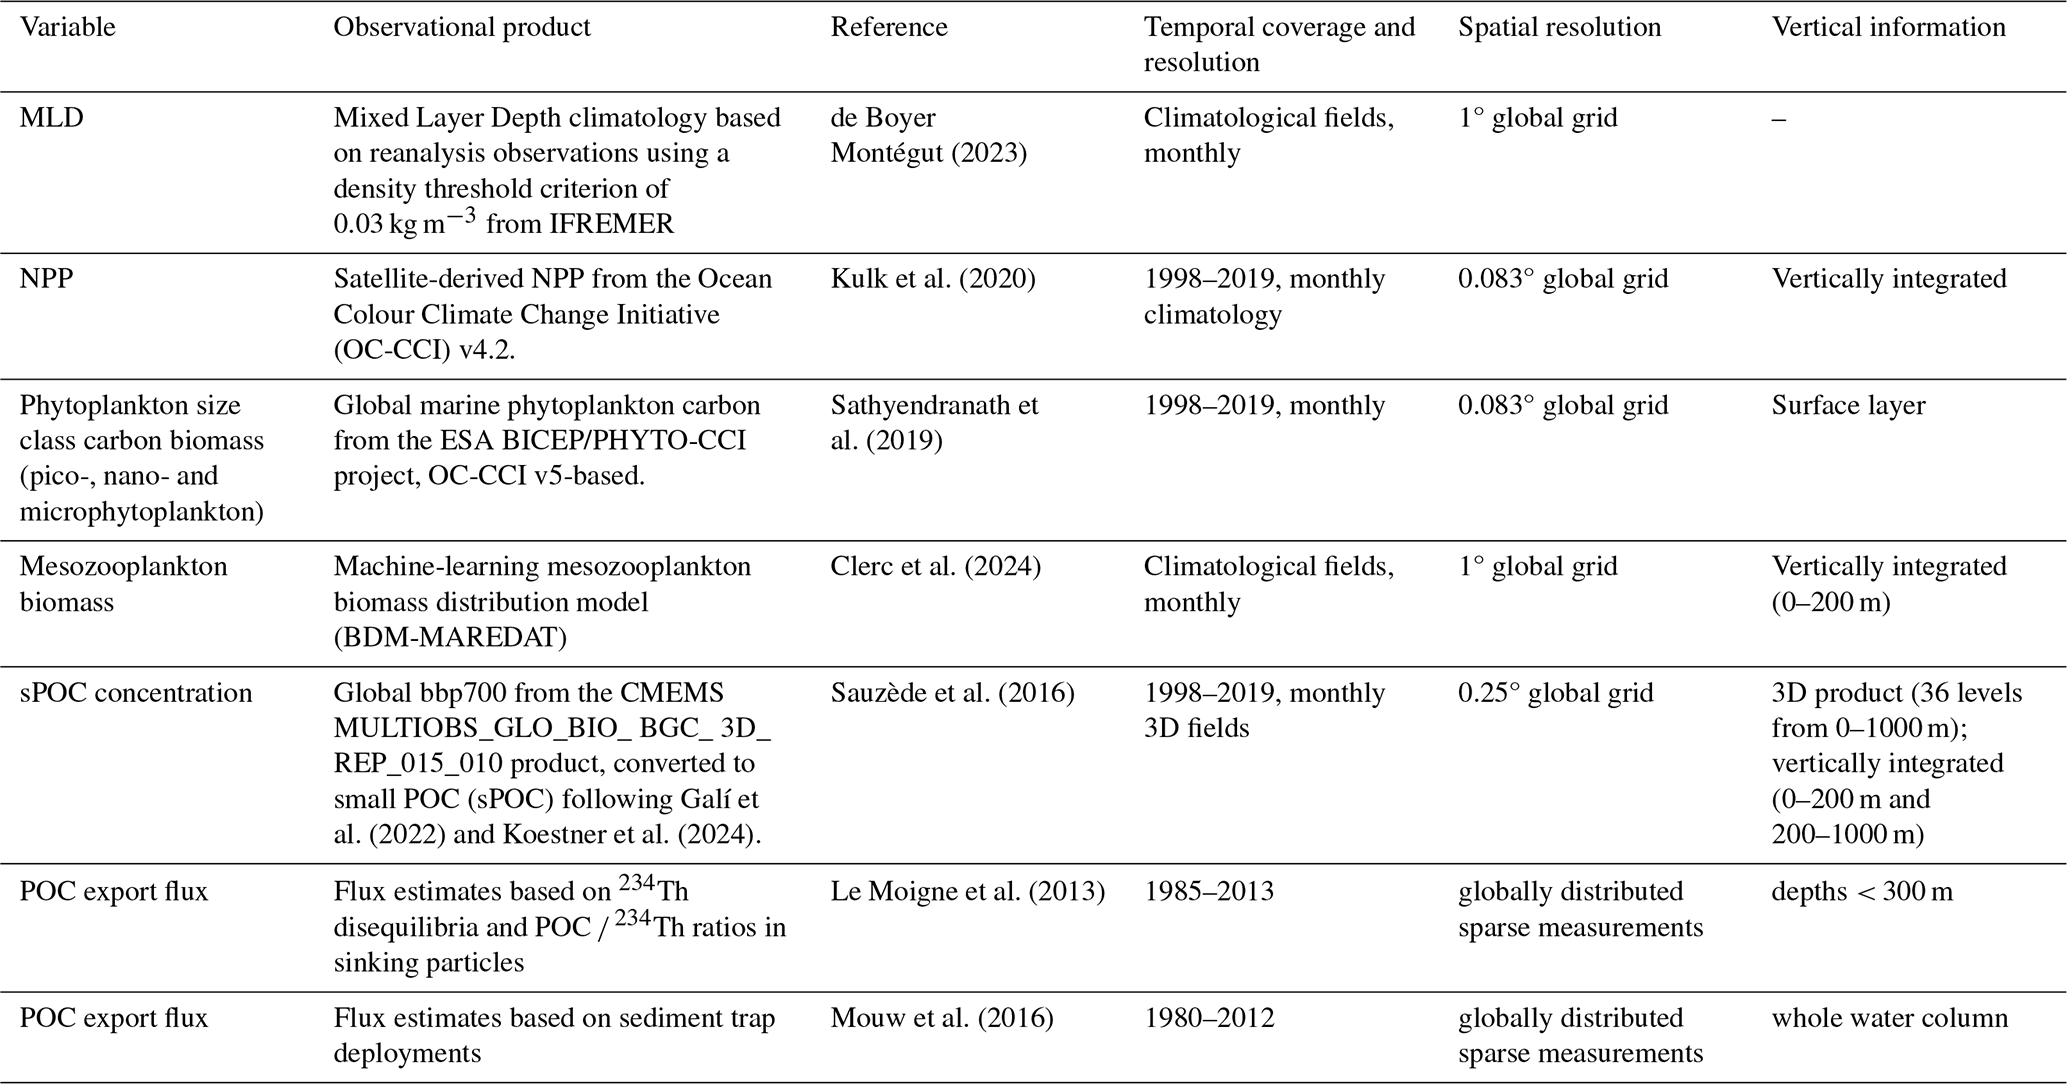
We evaluated model performance using gridded observational products for mixed layer depth (MLD), vertically integrated net primary production (NPP), phytoplankton carbon biomass, mesozooplankton carbon and small POC (sPOC) stocks, the latter assessed in both the epi- and mesopelagic layers. After regridding the observational products onto the model grid (ORCA1_L75), model skill was assessed using standard metrics applied to (i) spatial patterns of annual-mean fields (Fig. 2) and (ii) monthly climatological seasonal cycles averaged over each region (Fig. 3). Key characteristics and references for each observational dataset are summarised in Table 2. Further evaluation results, including skill metrics (Table S2.3) and seasonal maps comparing simulated and observed fields (Figs. S3.2–3.3), are presented in the Supplement Sect. S3.
While some simulated variables have a good correspondence in the observations – most notably MLD and NPP – other comparisons require simplifying assumptions, which are described here. First, modelled phytoplankton is evaluated using a satellite product that resolves three phytoplankton size classes. For this comparison, we assume that satellite microphytoplankton corresponds to model diatoms, and that the sum of pico- and nanophytoplankton corresponds to miscellaneous phytoplankton in the model. This group includes mostly haptophytes and cyanobacteria and, to some extent, dinoflagellates. Although this assumption introduces some uncertainty, it is broadly consistent with wide evidence from size-fractionated biomass measurements, ecophysiological studies, pigment signatures, and bio-optical data, all of which underpin satellite algorithms (Uitz et al., 2006, 2008) and model parameterisations. Second, we assume that the sPOC estimated from bio-optical data corresponds to the sum of four POC tracers with nominal sizes smaller than 100 µm: the two phytoplankton classes, microzooplankton, and small detritus, as previously discussed (Galí et al., 2022). Finally, mesozooplankton is evaluated using an observations-based machine learning product specifically developed for comparison with PISCES mesozooplankton fields (Clerc et al., 2024). No suitable gridded observational products were found for microzooplankton and large detrital POC concentrations.
In the case of sPOC, we used two estimates based on the same observational dataset. The approach of Galí et al. (2022), based on the variable ratio between POC and particulate backscattering, was used to estimate POC between 0–1000 m. For completeness, the method of Koestner et al. (2024), based on the relationship between POC, particulate backscattering and chlorophyll a, was used to estimate POC between the surface and the euphotic layer depth (below which gridded chlorophyll a data is not available). Hereafter, we refer to these sPOC estimates as G22 and K24, respectively. Additional details on these datasets are provided in Supplement Sect. S1.3.
Simulated export fluxes were evaluated separately using a subsampling approach designed to account for the sparse and uneven spatiotemporal coverage of the observations. Two complementary data compilations were used (Table 2): (i) Shallow POC export fluxes measured with the 234Th disequilibrium method, mostly at 100–150 m (Le Moigne et al., 2013); (ii) full water-column POC fluxes (Mouw et al., 2016), here restricted to sediment–trap estimates to avoid overlap with the 234Th dataset. Trap deployments longer than 1 month were discarded.
Table 2Descriptions of the gridded observational dataset used for the model evaluation.
In this section, an overview of model performance and simulated patterns (Sect. 3.1), is followed by more detailed descriptions of simulated POC dynamics, including vertical patterns in stocks, export and decay rates (Sect. 3.2), mesopelagic budgets of detrital POC at annual (Sect. 3.3) and monthly scales (Sect. 3.4), and POC export and transfer efficiency metrics (Sect. 3.5). The data provided in the following text and figures are available in two summary spreadsheets included in Supplement Sect. S4.
3.1 Model evaluation and overview of spatiotemporal patterns
3.1.1 Mixed Layer Depth (MLD)
Winter mixing depths decrease from the subpolar area (mean MLD of ∼ 240 m in March) to the Trans_Area (∼ 120 m in February) and the subtropical area (∼ 70 m in February). In the three regions, the spatially averaged monthly MLD from the simulation shows a strong temporal correlation with the observations (r> 0.95), low relative mean bias (RMB < 6 %) and realistic peak timing and amplitude (Fig. S3.1 and S3.2, Table S2.3).
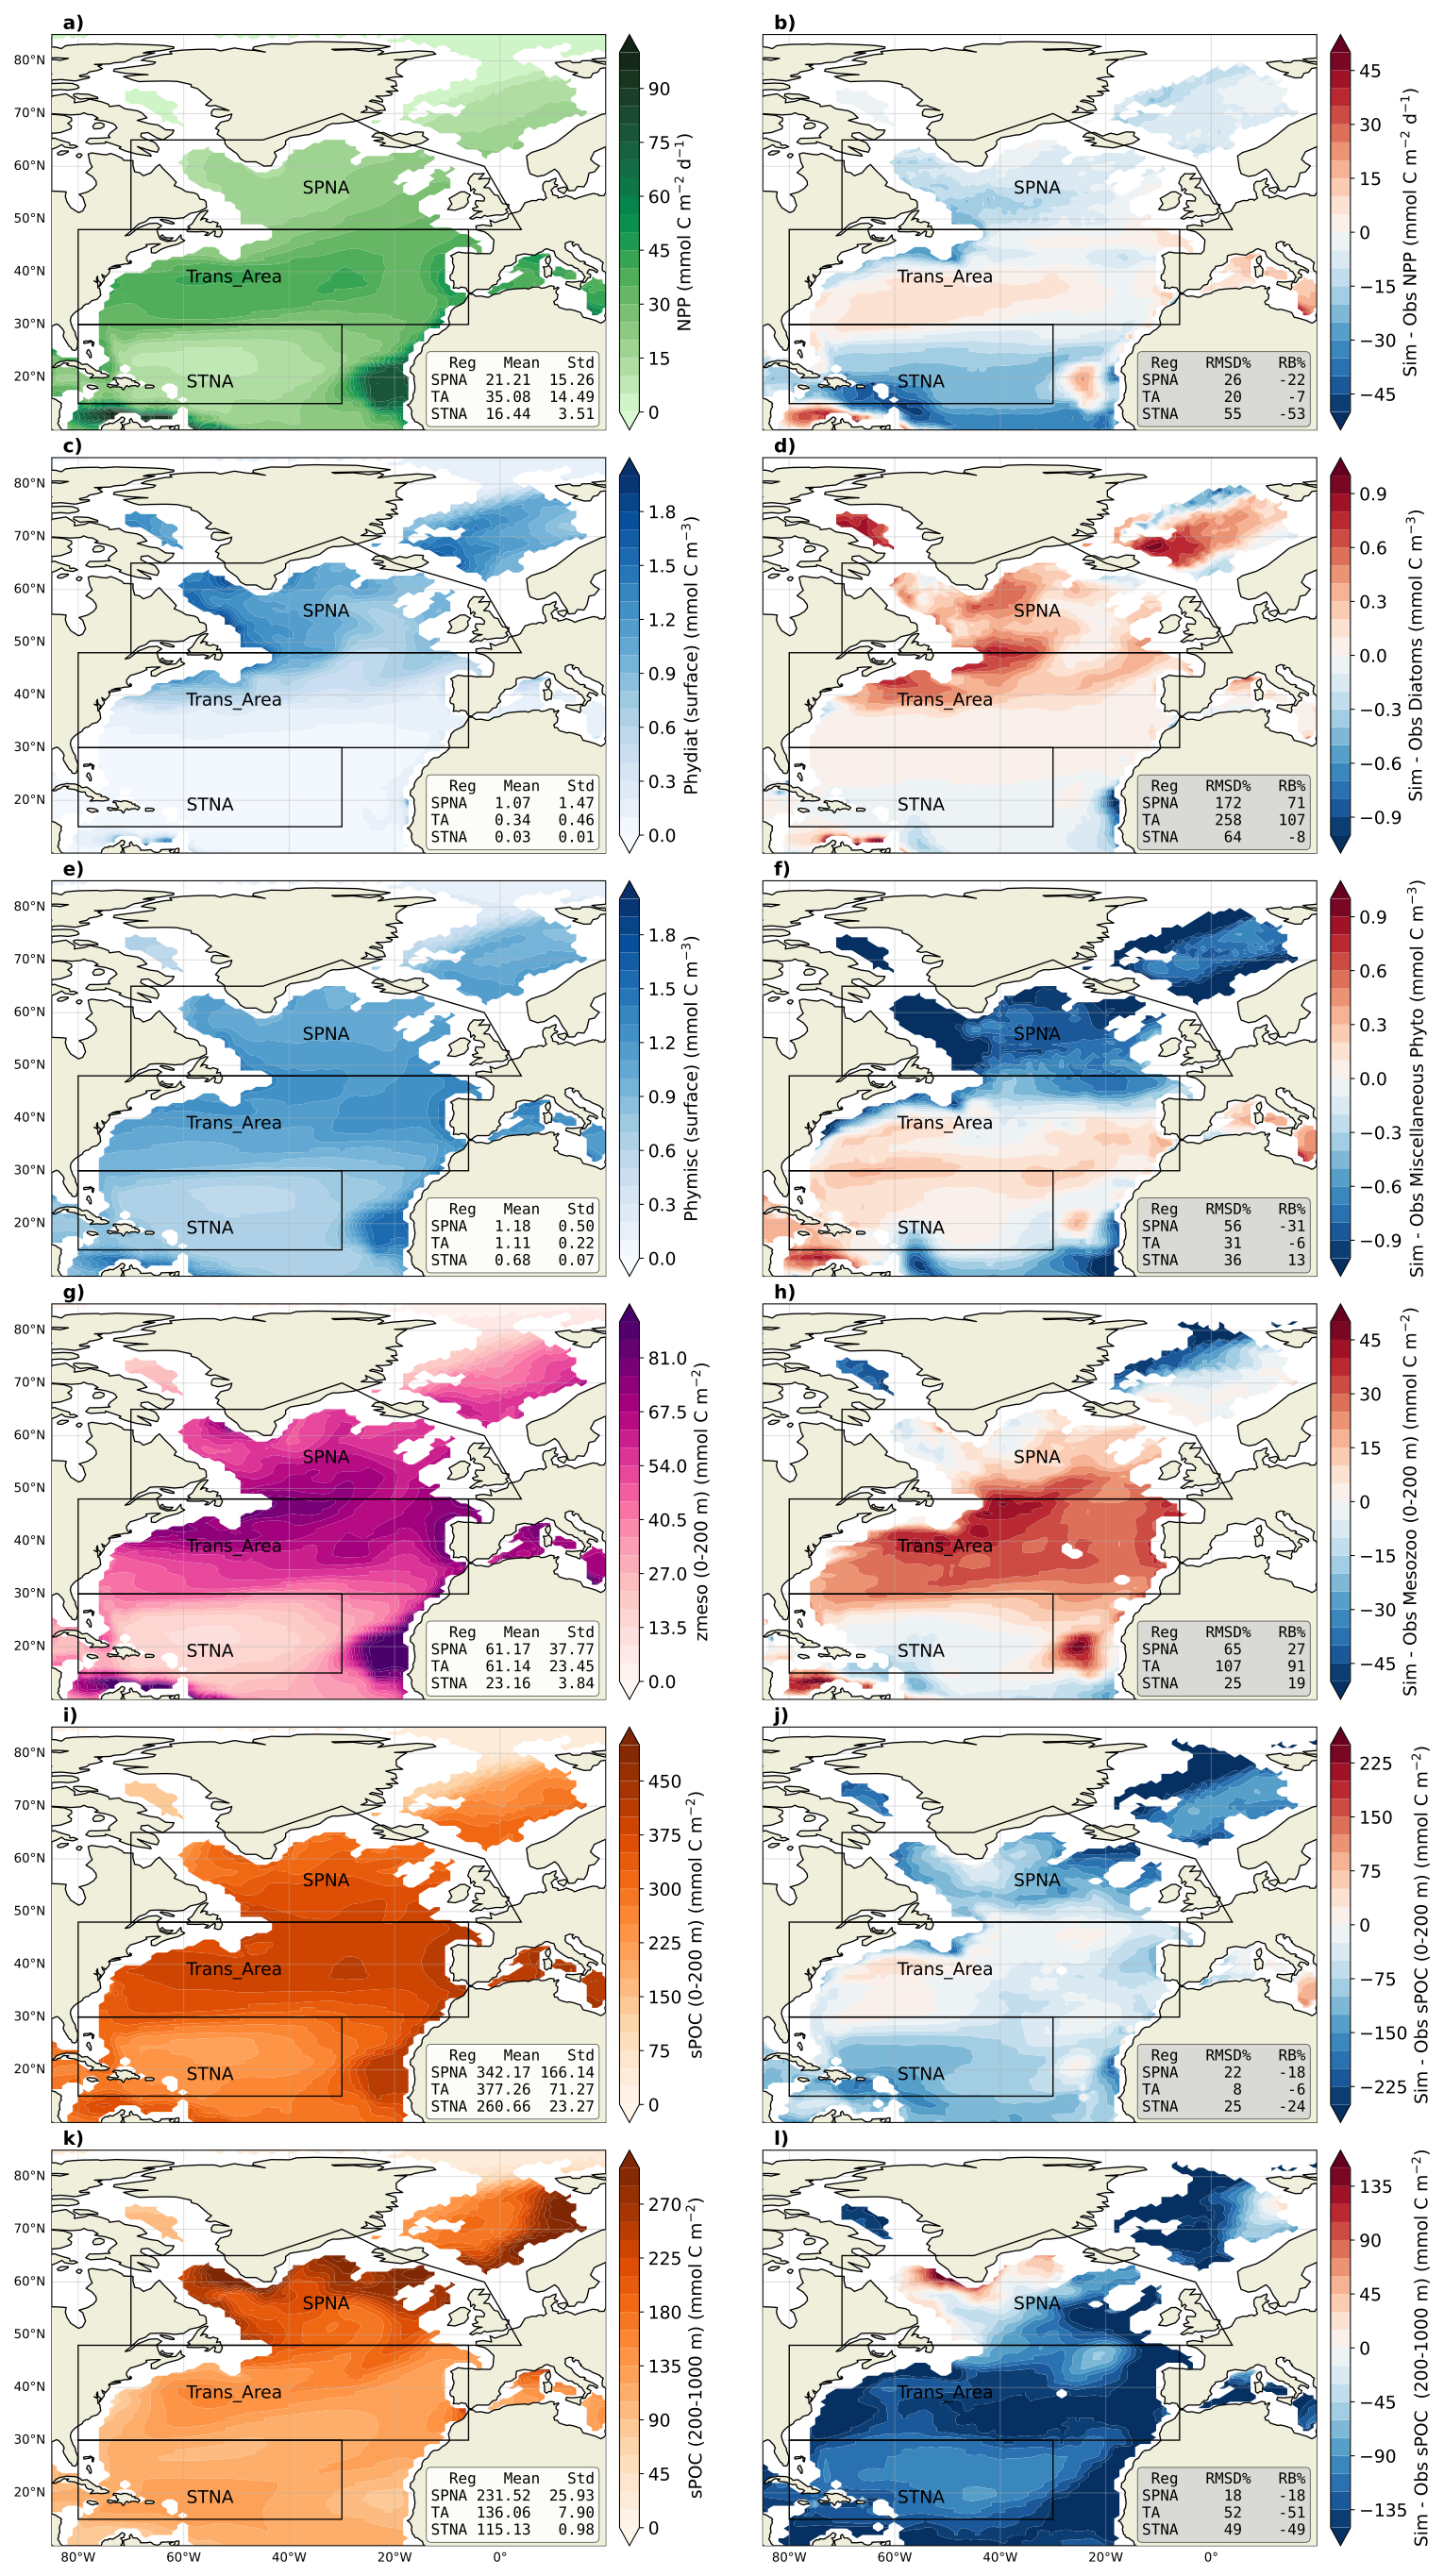
Figure 2The left column includes maps for the annual climatology of the five biogeochemical modelled variables evaluated in this study: NPP (a), surface carbon from phytoplankton biomass; diatoms (c) and miscellaneous phytoplankton (pico and nano-phytoplankton, e), carbon from mesozooplankton integrated over 0–200 m, (g) the small POC (particulate organic carbon, i) integrated over 0–200 m and (k) the small POC integrated over 200–1000 m. The right column shows the mean spatial bias of the simulated variables compared to observational datasets.
3.1.2 Net Primary Production (NPP)
The model reproduces the meridional NPP gradient, with the largest annual production in the Trans_Area (Fig. 2). In the SPNA and the Trans_Area, the seasonal cycles are well correlated with satellite estimates and capture the timing of the spring–summer production peak (Figs. 3a–b and S3). In the SPNA, however, NPP is systematically lower than satellite estimates year-round, with a −22 % mean deviation. The Trans_Area shows the smallest annual mean deviation (−7 %), which results from the compensation between moderate seasonal biases. In the STNA, the model underestimates NPP year-round and produces almost no seasonal variability, resulting in a weak temporal correlation with the satellite product (Fig. 3c).
3.1.3 Phytoplankton carbon biomass
Surface phytoplankton carbon is evaluated separately for diatoms (phydiat; Fig. 2c–d) and miscellaneous phytoplankton (phymisc; Fig. 2e–f). Modelled phydiat overestimates satellite microphytoplankton north of 40° N, whereas modelled phymisc underestimates satellite pico+nanophytoplankton in the SPNA and shows smaller deviations in the other regions. The opposite bias of the two simulated phytoplankton classes is also evident in seasonal patterns (Fig. 3d–f). As a result of these compensating biases, total phytoplankton presents −4 % relative bias year-round in the SPNA, 8 % in the Trans_Area and 13 % in STNA. Overall, the model reproduces the latitudinal shift from a strongly seasonal, diatom-rich regime in the SPNA to a weakly seasonal, small-phytoplankton-dominated regime in the STNA.
3.1.4 Mesozooplankton carbon biomass
Mesozooplankton carbon integrated over the upper 200 m displays annual mean patterns that resemble those of NPP and sPOC stocks (Fig. 2g–h). The relative mean bias is almost 30 % in the SPNA, about 90 % in the Trans_Area, and around 20 % in the STNA, similar to the results obtained by Clerc et al. (2024). Compared to the observational product, the model tends to exhibit a wider seasonal amplitude and, in the SPNA, a delayed peak, lagging diatoms by at least 1 month. In the observational product, mesozooplankton seasonality is better aligned with NPP, phytoplankton biomass and detrital stocks (Fig. 3a, d, g, j).
3.1.5 Small Particulate Organic Carbon (sPOC)
Annual mean sPOC stocks integrated over 0–200 m show similar large-scale patterns in the model and the G22 dataset (Fig. 2i–j), broadly resembling NPP patterns. The spatially averaged relative bias in the upper 200 m over the North Atlantic is −16 % (Fig. 2j), with smaller bias in the Trans_Area and stronger underestimation in the STNA (Fig. 3i). The 0–200 m sPOC seasonal cycles are closely phaselocked to NPP in the SPNA and Trans_Area and show a high temporal correlation with G22 (r=0.95 in SPNA and r = 0.97 in Trans_Area, both p < ), although the model overestimates the seasonal amplitude in the SPNA (Fig. 3g–h).
Between 200 and 1000 m, model performance degrades. The relative mean bias in mesopelagic sPOC reaches ∼ 50 % in the Trans_Area and STNA, with widespread underestimation across most of the North Atlantic. An exception occurs in the western SPNA, which moderates the regional SPNA bias to -18 %. The SPNA also exhibits the widest seasonal amplitude in mesopelagic sPOC, which is reasonably captured by the model (Fig. 3j).
Comparison with vertical profiles (Fig. 4) complements this analysis and suggests that the model (i) underestimates the vertical gradient of sPOC in the SPNA epipelagic, (ii) overestimates the sPOC attenuation gradient in the upper mesopelagic of the Trans_Area, and (iii) underestimates the subsurface biomass maximum in the STNA, and simulates it too deep in the water column.
For completeness, modelled sPOC was also compared with estimates obtained using the algorithm of Koestner et al. (2024) in the epipelagic layer (Supplement Sect. S1.3). K24 sPOC exhibits seasonal patterns similar to G22 but is systematically higher by around 200 mmol C m−2 (and up to ∼ 400 mmol C m−2 in the SPNA winter, Fig. 3), implying a stronger underestimation of epipelagic sPOC by the model. Comparison between G22 and K24 did not indicate systematic overperformance of either product (Fig. 13 in Koestner et al., 2024). Accordingly, and because G22 was specifically designed to provide consistent estimates across epi- and mesopelagic, here we retain it as the primary reference, while using the comparison with K24 to illustrate the range of algorithm-dependent observational uncertainty. A more thorough evaluation of uncertainties in the conversion from particulate backscattering to sPOC, which is beyond the scope of our study, could further refine these findings.
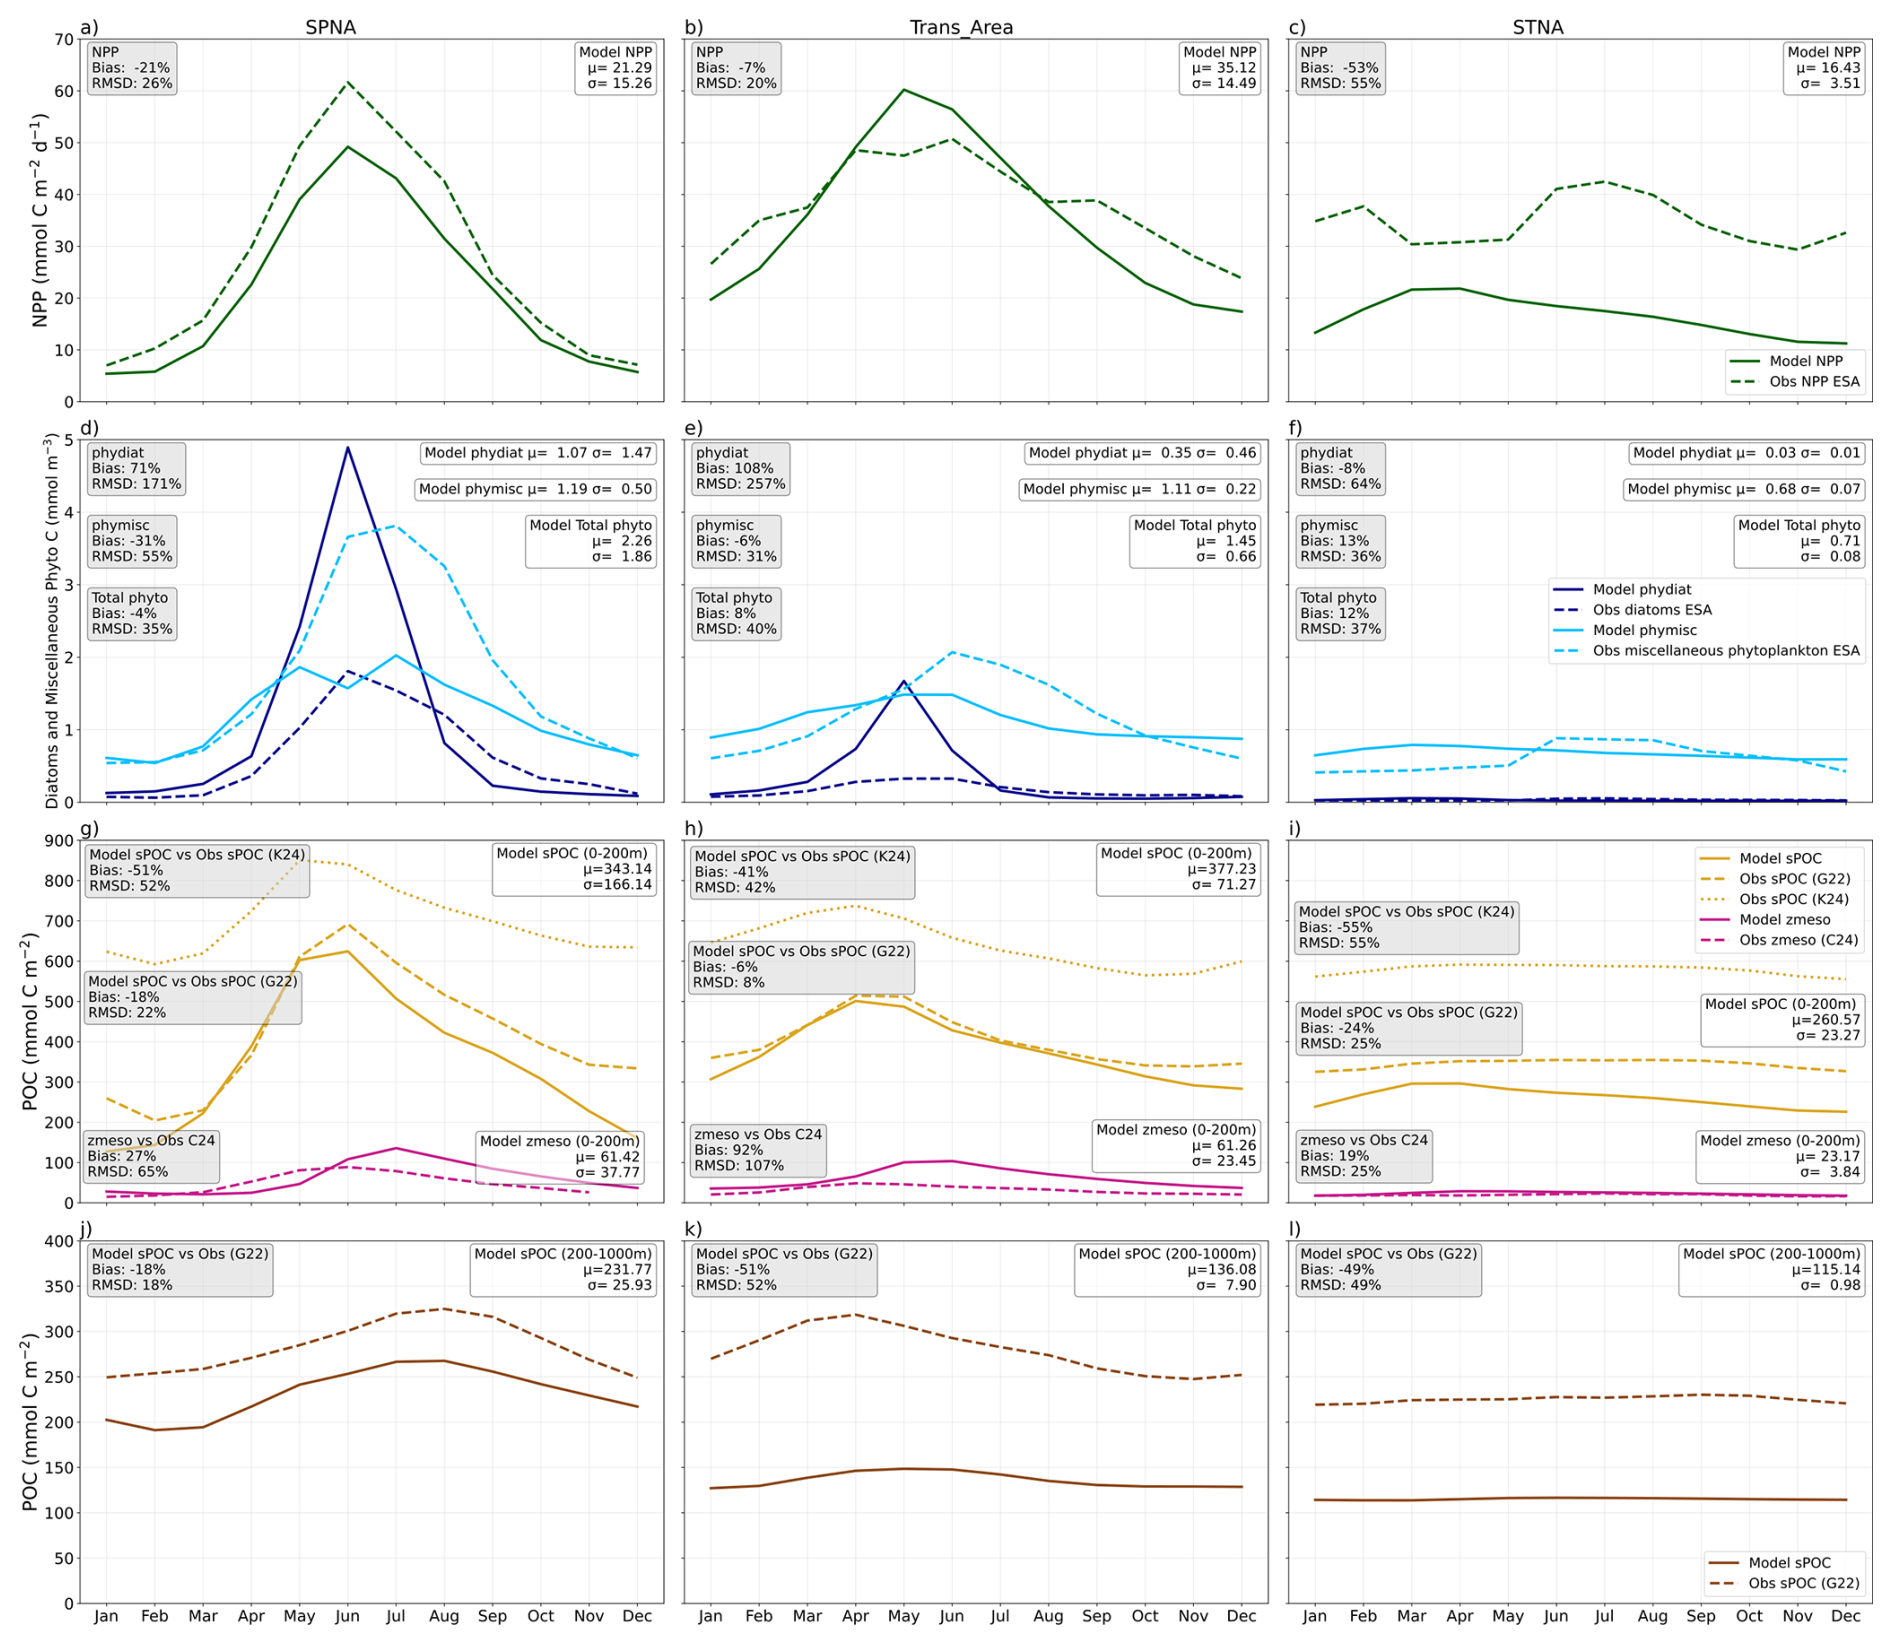
Figure 3Seasonal Cycle of the biogeochemical variables evaluated. Modelled variables are represented in solid lines, and the observations in dashed lines. Different colours represent different variables. Each column represents the three selected biomes: Subpolar North Atlantic (SPNA), Transitional Area (Trans_Area) and Subtropical North Atlantic (STNA). Each row shows a different seasonal cycle: NPP (a–c), Surface Carbon from phytoplankton (d–f, dark blue for diatoms and light blue for miscellaneous phytoplankton), Mesozooplankton (in pink) and Small Particulate Organic Carbon stock (sPOC- in yellow) over the 0–200 m depths (g–i) and sPOC stock over the 200–1000 m depths (in brown, j–l). Beige squares contain skill metrics model vs observations, and white squares include the mean and the standard deviation of the modelled variables.
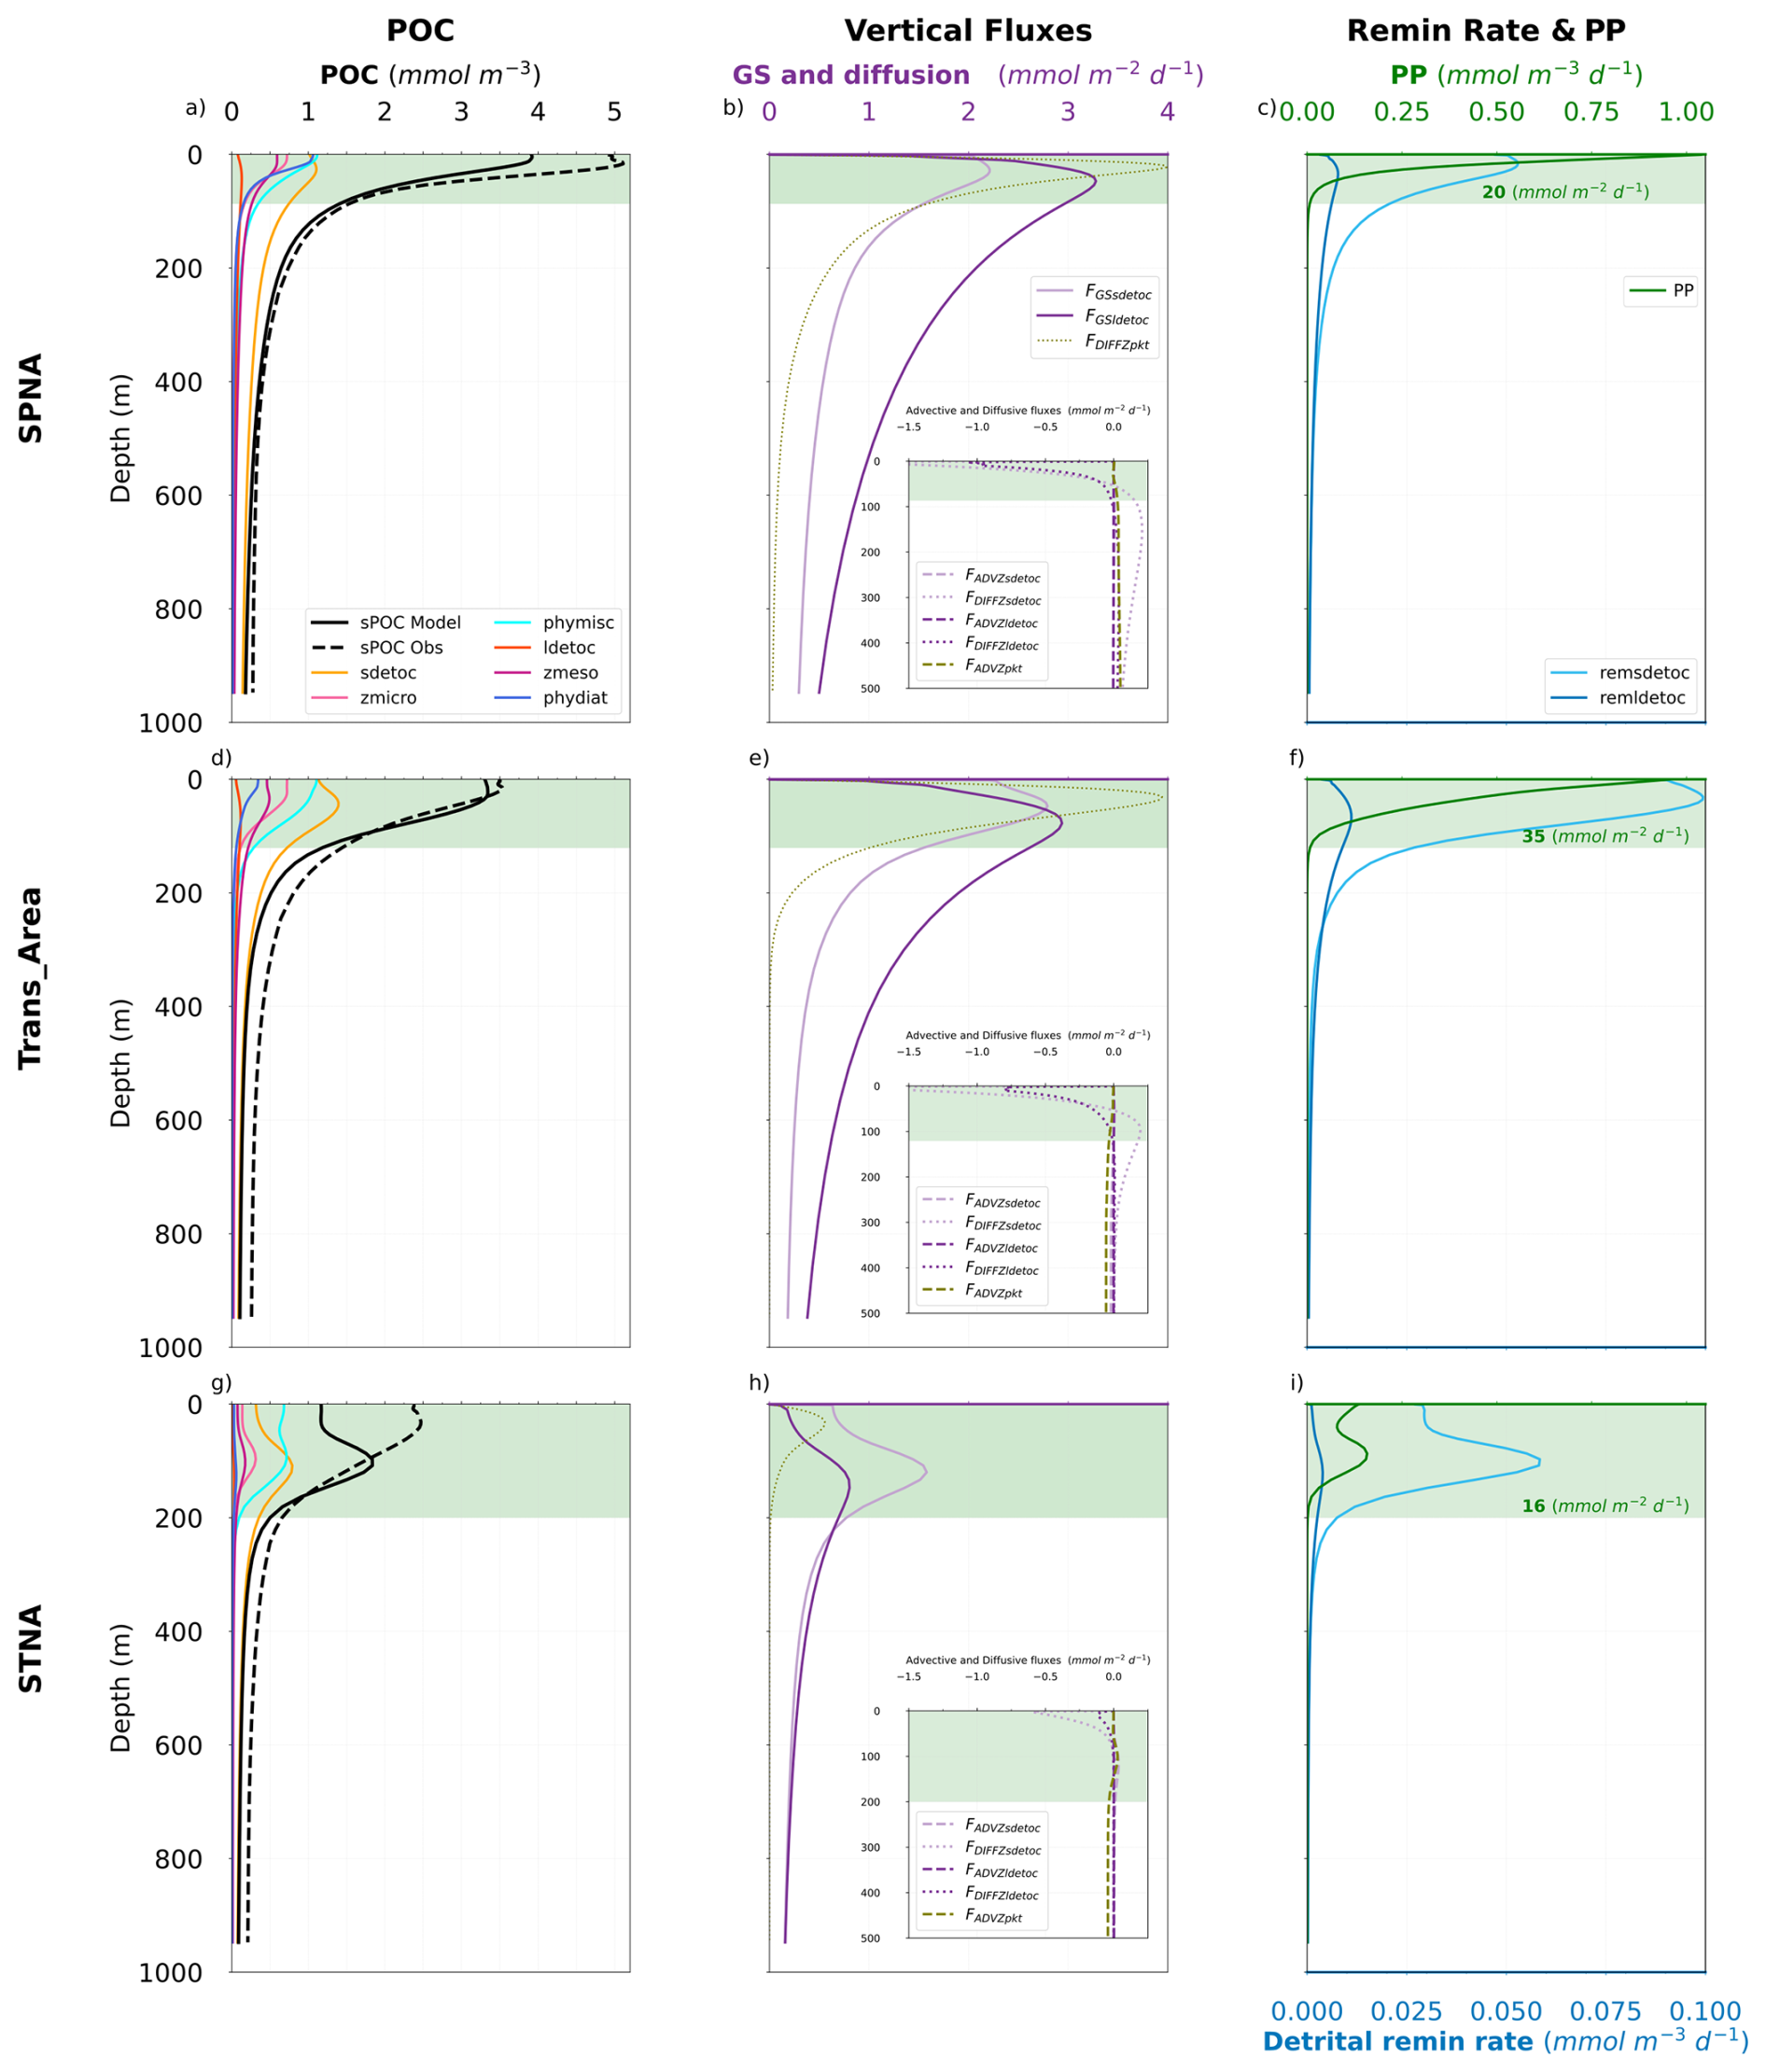
Figure 4Annual vertical profiles of different POC stocks (sPOC modelled and observed) and their components (first column). Vertical fluxes (second column) include gravitational sinking export fluxes only for sdetoc (FGSsdetoc, in solid light purple) and ldetoc (FGSldetoc, in solid dark purple), and advective (FADVZ), in dashed line style) and diffusive (FDIFFZ, in dotted line style) vertical fluxes for detritus (sdetoc in light purple, and ldetoc in dark purple) and phyto-zooplankton (pkt in light green). The insets at the lower left part of the subplots in the second column contain the diffusive and advective vertical fluxes of sdetoc and ldetoc, and the advective fluxes of pkt, since their magnitudes are not comparable to the detrital gravitational sinking export fluxes and the vertical diffusive flux of pkt. Remineralisation of detritus rate (remsdetoc and remldetoc) and Primary production (PP) (third column). Green rectangles in the right column represent the productive layer (defined in Sect. 2.4); numbers at their bottom indicate the vertically integrated annual mean primary production (NPP) in that layer. Rows correspond to the SPNA (a, b, c), Trans_Area (d, e, f) and STNA (g, h, i) study regions.
3.1.6 Export fluxes at 100 and 150 m depth
To evaluate modelled POC export, we compared the monthly climatology of total vertical fluxes with 234Th- and sediment trap-based estimates from the global compilations of Le Moigne (2013) and Mouw et al. (2016a). Based on the spatial distribution of the measurements, we focus on the entire subpolar North Atlantic (SPNA) and two specific study sites (Fig. 5a–b). The Porcupine Abyssal Plain (PAP) lies near the boundary between the SPNA and Trans_Area regions in the eastern Atlantic. The other study site is located near the Trans_Area–STNA boundary in the Sargasso Sea, and includes the merged datasets from the Bermuda Atlantic Time Series and the Oceanic Flux Program (BATS/OFP). In SPNA and PAP, measurements are available only from May through August in scattered years, whereas BATS/OFP measurements are available year-round between 1985 and 2013.
In the SPNA (Figs. 5c, 6), the model captures the observed order of magnitude of the observations, which are nevertheless extremely variable at both 100 and 150 m. This variability, combined with spatial and temporal sparseness, precludes drawing clear conclusions on model behaviour. At the PAP site, modelled fluxes exceed observations by about ∼ 70 % at 100 m but are in good agreement with measurements at 150 m (bias = −21 %, Fig. 5d). At BATS/OFP, where observations are available only at 150 m, the model reproduces the weak seasonality but shows a mean positive bias of ∼ 90 %, largely driven by winter-spring months (Fig. 5e).
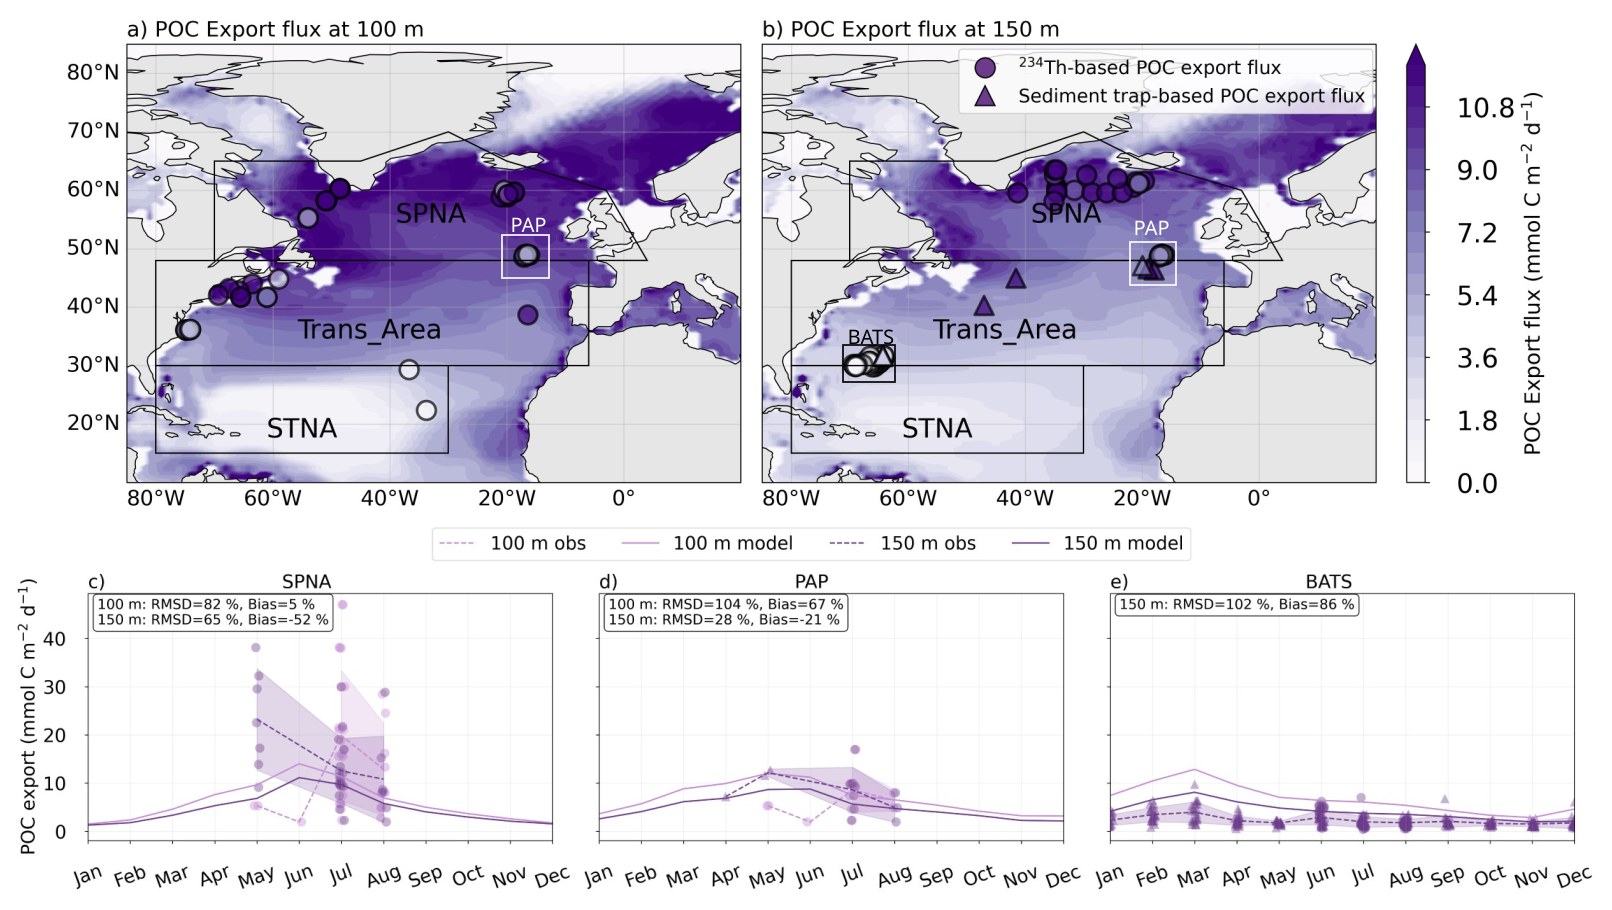
Figure 5Modelled annual mean (1998–2019) vertical sinking fluxes (gravitational, diffusive and advective) at 100 m (a) and 150 m (b) are compared with in situ measurement compilations. Circles indicate 234Th-based POC export flux, and triangles, sediment trap-based POC export flux. Modelled monthly climatologies (1998–2019) of the vertical sinking fluxes are extracted for SPNA (c), PAP (d) and BATS/OFP study sites (e) and compared with available observations. Light purple lines in (c)–(e) represent export fluxes at 100 m, and dark purple lines represent export at 150 m. Solid lines indicate modelled fluxes. Dashed lines and ribbons represent the monthly mean and standard deviation of the observations.
3.1.7 Water column export fluxes
To complete the export flux evaluation, we subsampled model output at the depth, year, month and location of data from Mouw et al. (2016a). We used data from the upper 4000 m in the North Atlantic, of which 61 % was obtained at BATS/OFP, and computed model skill metrics for both non-binned data (n=3388) and data binned by layer and region (n=12). These comparisons and their corresponding metrics are shown in Fig. 6, suggesting that the model captures water-column export fluxes with small overall bias across two orders of magnitude when the data are binned. Indeed, non-binned data show substantial scatter, especially for small flux values. Crucially, different conclusions are obtained depending on whether in situ measurements are matched to modelled sinking POC fluxes or to total downward fluxes (sinking, diffusion and advection). In the first case, the comparison suggests an overall tendency for model underestimation, whereas the second case suggests a slight tendency for overestimation in the shallowest depth bin. Data scarcity hampers assessment in the epipelagic SPNA and the upper 500 m of the Trans_Area.
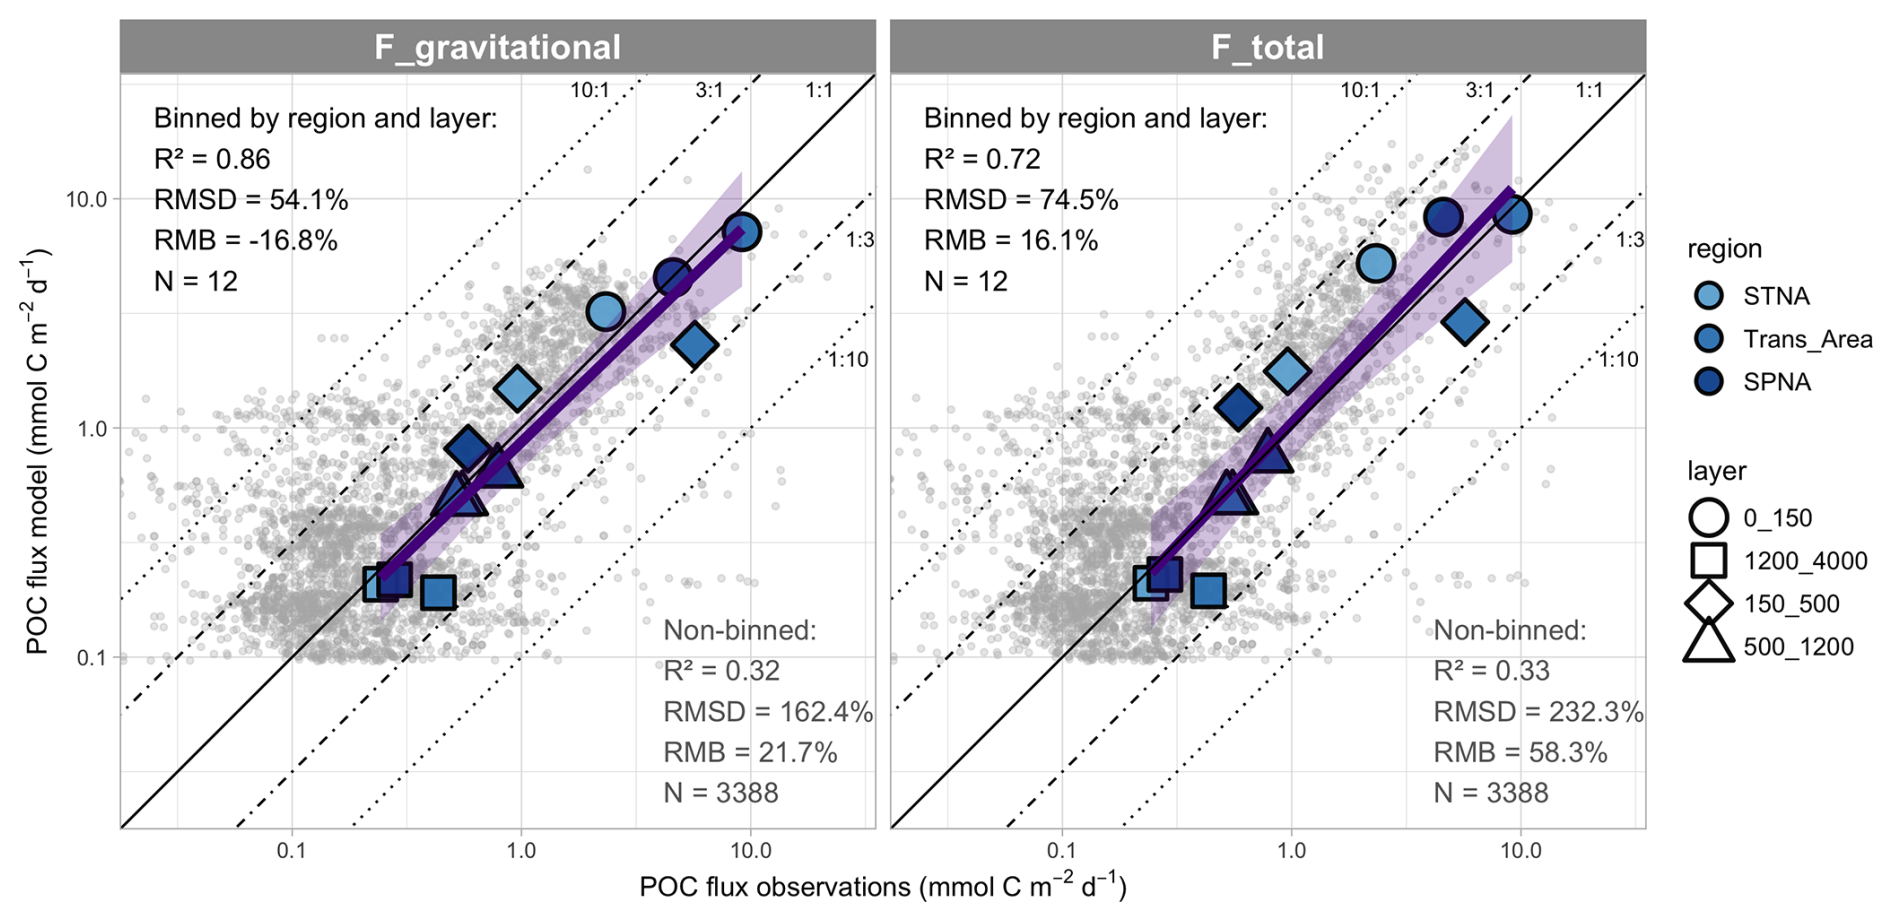
Figure 6Comparison between modelled export fluxes and a compilation of in situ sediment trap measurements from Mouw et al. (2016a). Collocated data are compared directly (non-binned dataset) and after computing regional and vertical bin averages. The corresponding skill metrics are shown, along with a linear regression on binned data (purple line and envelope showing SE of the fit). Diagonal lines with different model:observation ratios are shown as visual guides. The same in situ fluxes are compared to modelled POC gravitational fluxes (left) and total fluxes (right). For this comparison, we assigned data from BATS/OFP to the STNA and data from PAP to the Trans_Area (see text and Fig. 5). Vertical boundaries were chosen to optimise data abundance in each layer while deviating minimally from the standard definitions of Zprod and the mesopelagic layer.
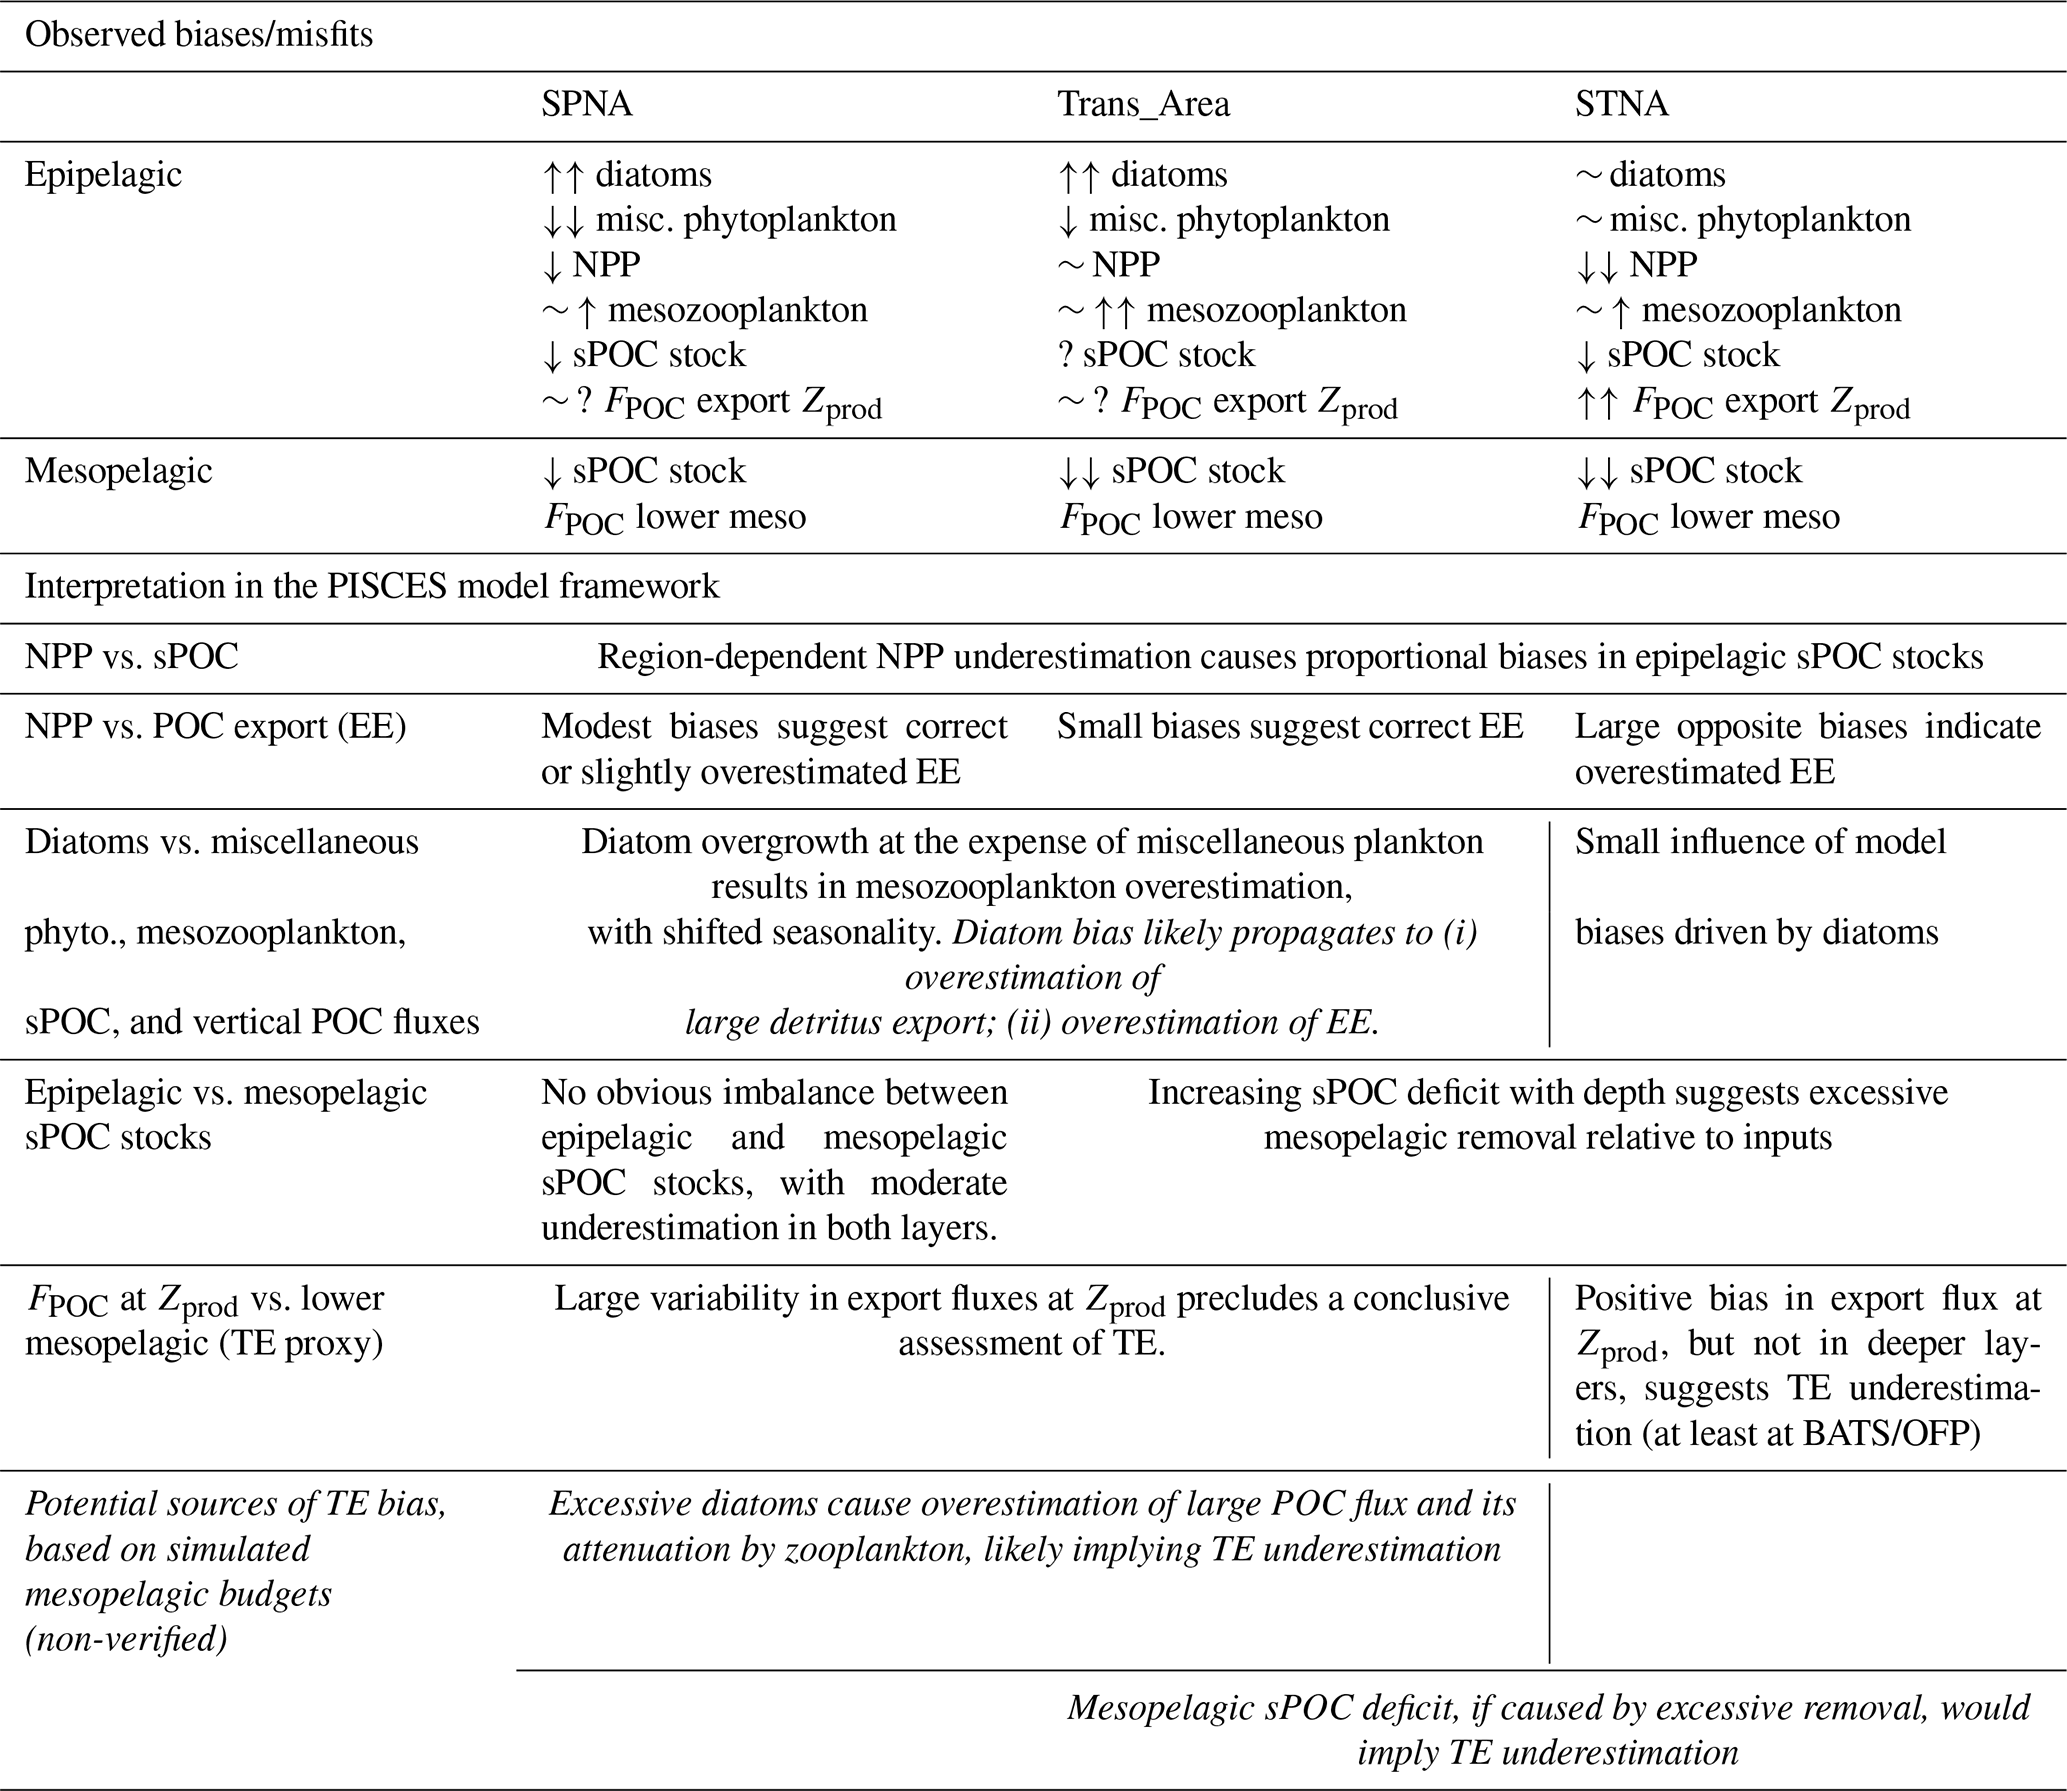
Table 3The upper part qualitatively summarises observed model biases or misfits. Arrows are used to indicate positive (↑) or negative (↓) model biases of large (2) or moderate (1) magnitude; indicates small bias, ∼ indicates temporal phase shift, and “?” indicates uncertain evaluation outcome usually due to data sparseness or too-large observational uncertainties. The lower part provides interpretations based on the comparison of various bias patterns. More speculative interpretations are highlighted in italics and are based on insights from the modelled mesopelagic budgets.
3.2 Simulated vertical profiles of POC pools and detrital POC decay
Evaluation results confirm that PISCES captures the main biogeochemical features of the North Atlantic basin, despite some season- and region-dependent biases (Table 3). To investigate how these patterns translate into POC vertical structure, this section documents the distribution of POC components and their corresponding fluxes and remineralisation processes from the epipelagic to the mesopelagic layer.
On an annual basis, total gravitational export at the base of the productive layer (Zprod) is similar in the transition and subpolar areas (3.9–4.3 mmol C m−2 d−1), and much lower in the subtropical area (1.3 mmol C m−2 d−1) (Fig. 4). In addition, a substantial amount of POC is exported through turbulent diffusion (vertical mixing) of plankton in the SPNA (1.4 mmol C m−2 d−1) and the Trans_Area (0.8 mmol C m−2 d−1). Smaller exports arise from the diffusion of detrital POC, especially sdetoc, while vertical advection of particles is negligible at the regional scale examined here.
Vertical flux profiles vary widely across regions and POC tracers (Fig. 4). Gravitational sdetoc fluxes attenuate rapidly in the upper mesopelagic and more slowly below ∼ 400 m. By contrast, ldetoc shows deeper flux maxima, greater penetration through the upper mesopelagic, and gradual attenuation throughout the mesopelagic. Consequently, the proportion of export fluxes carried by sdetoc increases with depth in the mesopelagic. Diffusive plankton fluxes attenuate at shallower depths than gravitational ones. Yet, their penetration deepens towards the SPNA, consistent with deeper mixing in winter (Figs. S1 and S2).
Small detritus is the most abundant POC fraction in the mesopelagic layer, where it accounts for 52 % (SPNA) to 70 % (STNA) of the POC pool. The ldetoc fraction usually is ≤ 10 % of total POC and smaller than total plankton (Fig. 4a, d, g).
Vertical profiles of detritus decay rates also vary by detritus type and region (Fig. 4c, f and i). The integrated decay rate of detritus (sdetoc + ldetoc) between the surface and 1000 m is highest in the Trans_Area (13.9 mmol C m−2 d−1) compared to the other areas (8.4–8.6 mmol C m−2 d−1), mirroring NPP patterns. Small detritus drive most of the detritus decay, with higher sdetoc contributions in the epipelagic (85 %–92 %) than in the mesopelagic (53 %–61 %). To characterise distinct regimes, we calculated the percentage of POC degradation occurring in the epipelagic layer relative to the 0–1000 m integral. In SPNA, 58 % (sdetoc) and 28 % (ldetoc) of decay occurs in the epipelagic, concurrent with low temperatures, strong ldetoc export and shallow Zprod. In contrast, the STNA shows 93 % (sdetoc) and 56 % (ldetoc) epipelagic decay, aligned with warm temperatures, reduced ldetoc export, and deep Zprod.
Detritus decay rates result from the product of tracer concentration and the degradation rate constant k, which varies with depth and temperature (Fig. 7; see also Sect. 2.2). For sdetoc, 0 °C-normalized k typically ranges 0.010–0.023 d−1 in the epipelagic and decreases sharply to ∼ 0.002 d−1 at 1000 m; for ldetoc, k typically ranges 0.027–0.035 d−1 in the epipelagic and 0.015–0.020 d−1 at 1000 m. Thus, in PISCES, sdetoc becomes refractory at shallower depths than ldetoc, explaining the limited change in sdetoc concentration and sinking flux below ∼ 400 m compared to ldetoc (Fig. 4).
While the change in reactivity is best described by 0 °C-normalized k, the actual in-situ rates are differently affected by temperature across regions and depths (Fig. 7), which here we quantify using the enhancement factor with respect to k at 0 °C. In the epipelagic, mean thermal enhancement factors are 1.7, 3.2 and 4.5 in the SPNA, Trans_Area and STNA, respectively. Smaller thermal enhancement factors (1.5–2.5) are found in the mesopelagic. Thus, temperature control on k exacerbates the vertical gradients in reactivity at low latitudes.
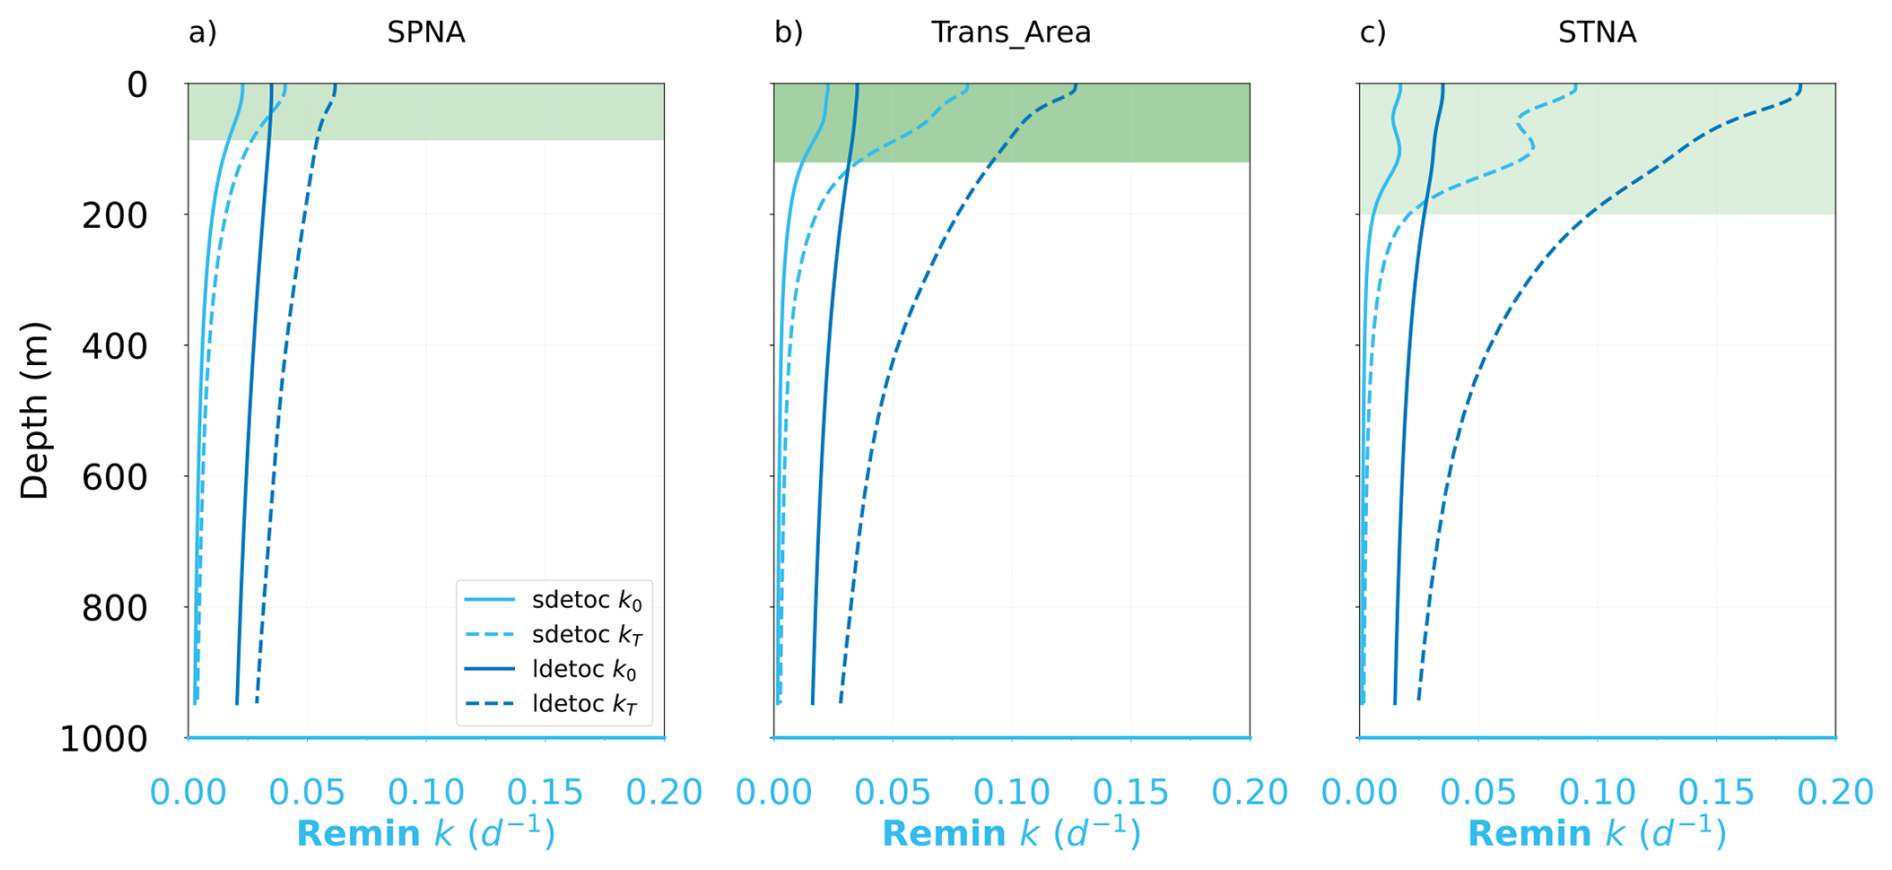
Figure 7Vertical profiles of the specific degradation rates of small and large detritus (sdetoc and ldetoc, respectively) at 0 degrees (k0) and at in situ temperature (kT) for the three regions.
3.3 Mesopelagic detrital POC budgets: annual-mean fluxes
Regional contrasts in POC vertical structure reflect distinct combinations of particle composition, export pathways, and remineralisation regimes (Figs. 4 and 7). To quantify how these differences arise in PISCES, we now examine the annual climatological budgets of detrital POC in the three regions of interest. We place particular emphasis on how regional differences in productive-layer depth, particle size structure, and export pathways shape mesopelagic budgets (Fig. 8).
For sdetoc, the relative contribution of gravitational inputs increases toward lower latitudes (Fig. 8a), from 36 % (SPNA) to 74 % (STNA). In contrast, the supply of sdetoc by the mesopelagic food web shows the opposite pattern and exceeds 50 % of total supply in the SPNA, driven primarily by mesozooplankton fragmentation of ldetoc (16 %), plankton mortalities (20 %), and microzooplankton non-assimilation (9 %). In the Trans_Area, plankton mortalities dominate biological supply (14 %), followed by non-assimilation (8 %), bacterial breakdown of ldetoc (7 %), and mesozooplankton fragmentation (6 %). In the STNA, bacterial breakdown of ldetoc (7 %) and abiotic DOC aggregation (12 %) contribute relatively more, whereas contributions from mortalities and microzooplankton non-assimilation are reduced. Removal of sdetoc is dominated by remineralisation in all regions (> 70 %), reaching 87 % in the STNA. Mesozooplankton removal via phagotrophic ingestion and flux feeding is also significant, peaking at 17 % in the Trans_Area, whereas microzooplankton removal remains minor (≤ 5 %).
For ldetoc, gravitational inputs dominate in all regions, with smaller contributions from plankton mortalities and mesozooplankton non-assimilation (Fig. 8b). As for sdetoc, the importance of these biological sources diminishes southward in favour of sinking. Removal of ldetoc is dominated by remineralisation, but at lower fractions (50 %–75 %) than sdetoc. In the SPNA, nearly half of ldetoc removal occurs through mesozooplankton flux feeding (30 %) and fragmentation into sdetoc (15 %). Mesozooplankton-mediated transformation rates decrease toward lower latitudes, especially fragmentation, which in the Trans_Area contributes half as much to sdetoc budgets as in the SPNA. Bacterial disaggregation of ldetoc is generally minor, reaching 7 % in the STNA.
Overall, both sdetoc- and ldetoc-specific processes jointly regulate the magnitude and evolution of regional detrital POC stocks in PISCES. Supply pathways are more heterogeneous for sdetoc, whereas removal pathways are more diverse for ldetoc. This asymmetry largely reflects ldetoc transformation by fragmentation and disaggregation processes, which act as sinks for ldetoc while simultaneously supplying sdetoc. The indirect contribution of plankton diffusion (mixing) also affects sdetoc differentially across regions (Fig. 4 b, e, i).
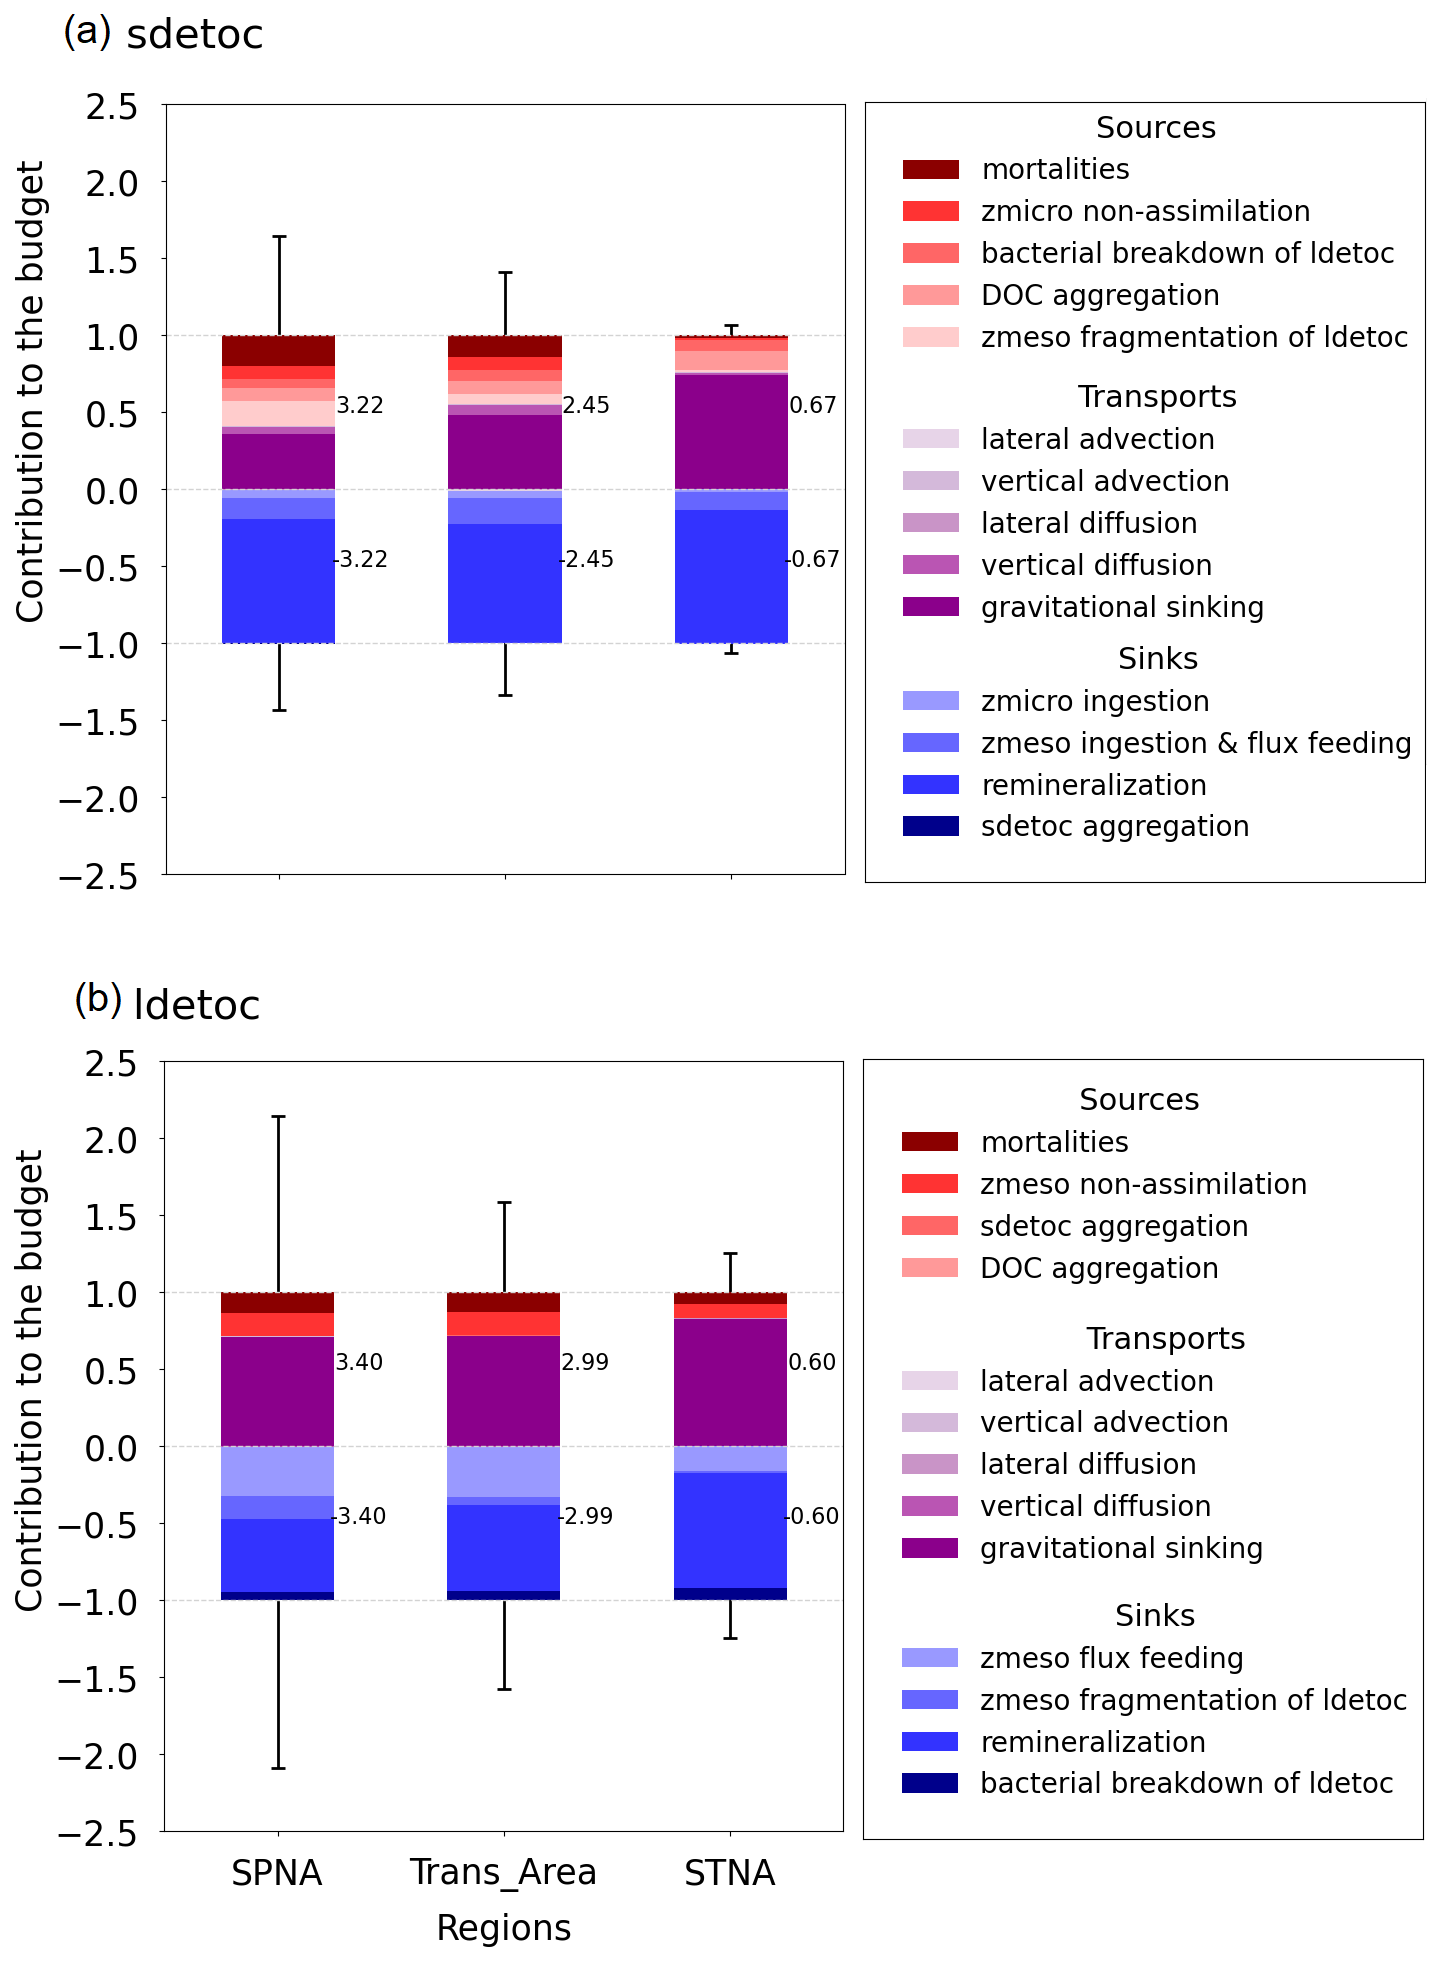
Figure 8Climatological annual budget of small (a) and large (b) detrital POC over the mesopelagic layer (Zprod−1000 m). To compare the contribution of each process across regions, the budget terms have been divided by the sum of the supply processes. Numbers on the right of each bar indicate the sum of the inputs (positive) and outputs (negative) for each detrital POC tracer. Vertical lines represent the temporal standard deviation of total monthly inputs and outputs after normalisation by the annual mean value.
3.4 Mesopelagic detrital POC budgets: seasonal cycle
Building on the annual-mean budgets presented in Sect. 3.3, we now examine how the processes controlling mesopelagic detrital POC vary over the seasonal cycle in PISCES. Monthly climatological budgets show that, consistent with the seasonality of physical forcing, temporal variability increases with latitude: it is minimal in the STNA but pronounced in the SPNA (Figs. 9, S5, S6 and vertical black lines in Fig. 8).
Gravitational sinking of large detritus during the high-latitude bloom and post-bloom period is the main seasonal event. The peak in gravitational ldetoc supply (June) is rapidly followed by maxima in ldetoc losses through remineralisation, mesozooplankton flux feeding and fragmentation. Enhanced mesozooplankton activity also generates secondary ldetoc sources via mortality and sloppy feeding. In contrast, sdetoc budgets exhibit a smoother seasonal succession, with sources shifting from mortalities and zooplankton non-assimilation in spring to ldetoc fragmentation in summer. Alongside dominant removal by remineralisation, sdetoc sinks transition gradually from microzooplankton ingestion to mesozooplankton ingestion and flux feeding through spring and summer.
Seasonal decomposition is also necessary to understand the role of vertical diffusive (mixing) fluxes and their contribution to detrital food webs. On an annual basis, vertical diffusion represents a significant net source of mesopelagic POC in the SPNA and the Trans_Area, whereas in the STNA, diffusive fluxes primarily redistribute POC within the epipelagic layer. Diffusive fluxes of POC are, however, largely driven by plankton and are therefore not included directly in detrital budgets. Instead, vertically mixed plankton enters detrital budgets through mortalities and sloppy feeding (Eqs. 1 and 2). In the SPNA, plankton diffusion supplies POC to the mesopelagic throughout the year and peaks in April (5 mmol m−2 d−1), when it is three times larger than total gravitational inputs (Supplement Sect. S4.2 file S4.2). Between December and April, when the MLD exceeds Zprod, the ratio between [mortalities + non-assimilation] and plankton diffusion is 0.70 ± 0.27. Between May and October, this ratio increases to 7.0 ± 5.1. Thus, detrainment of plankton from the epipelagic layer dominates detritus supply (largely as sdetoc) before the spring bloom, whereas biological processing of sdetoc derived from large detritus fragmentation dominates during the post-bloom season. Similar, though weaker, patterns of diffusive supply occur in the Trans_Area.
Direct diffusion of detritus is comparatively small, with the largest contribution occurring in the Trans_Area (7 %). In the SPNA, diffusive fluxes of detritus switch sign over the seasonal cycle (Fig. 9e), resulting in a weak net annual supply (Fig. 8a). In late autumn and early winter, mixed-layer deepening entrains mesopelagic detritus into the epipelagic layer, whereas in spring, re-stratification promotes detrainment of detrital POC from the epipelagic to the mesopelagic layer.
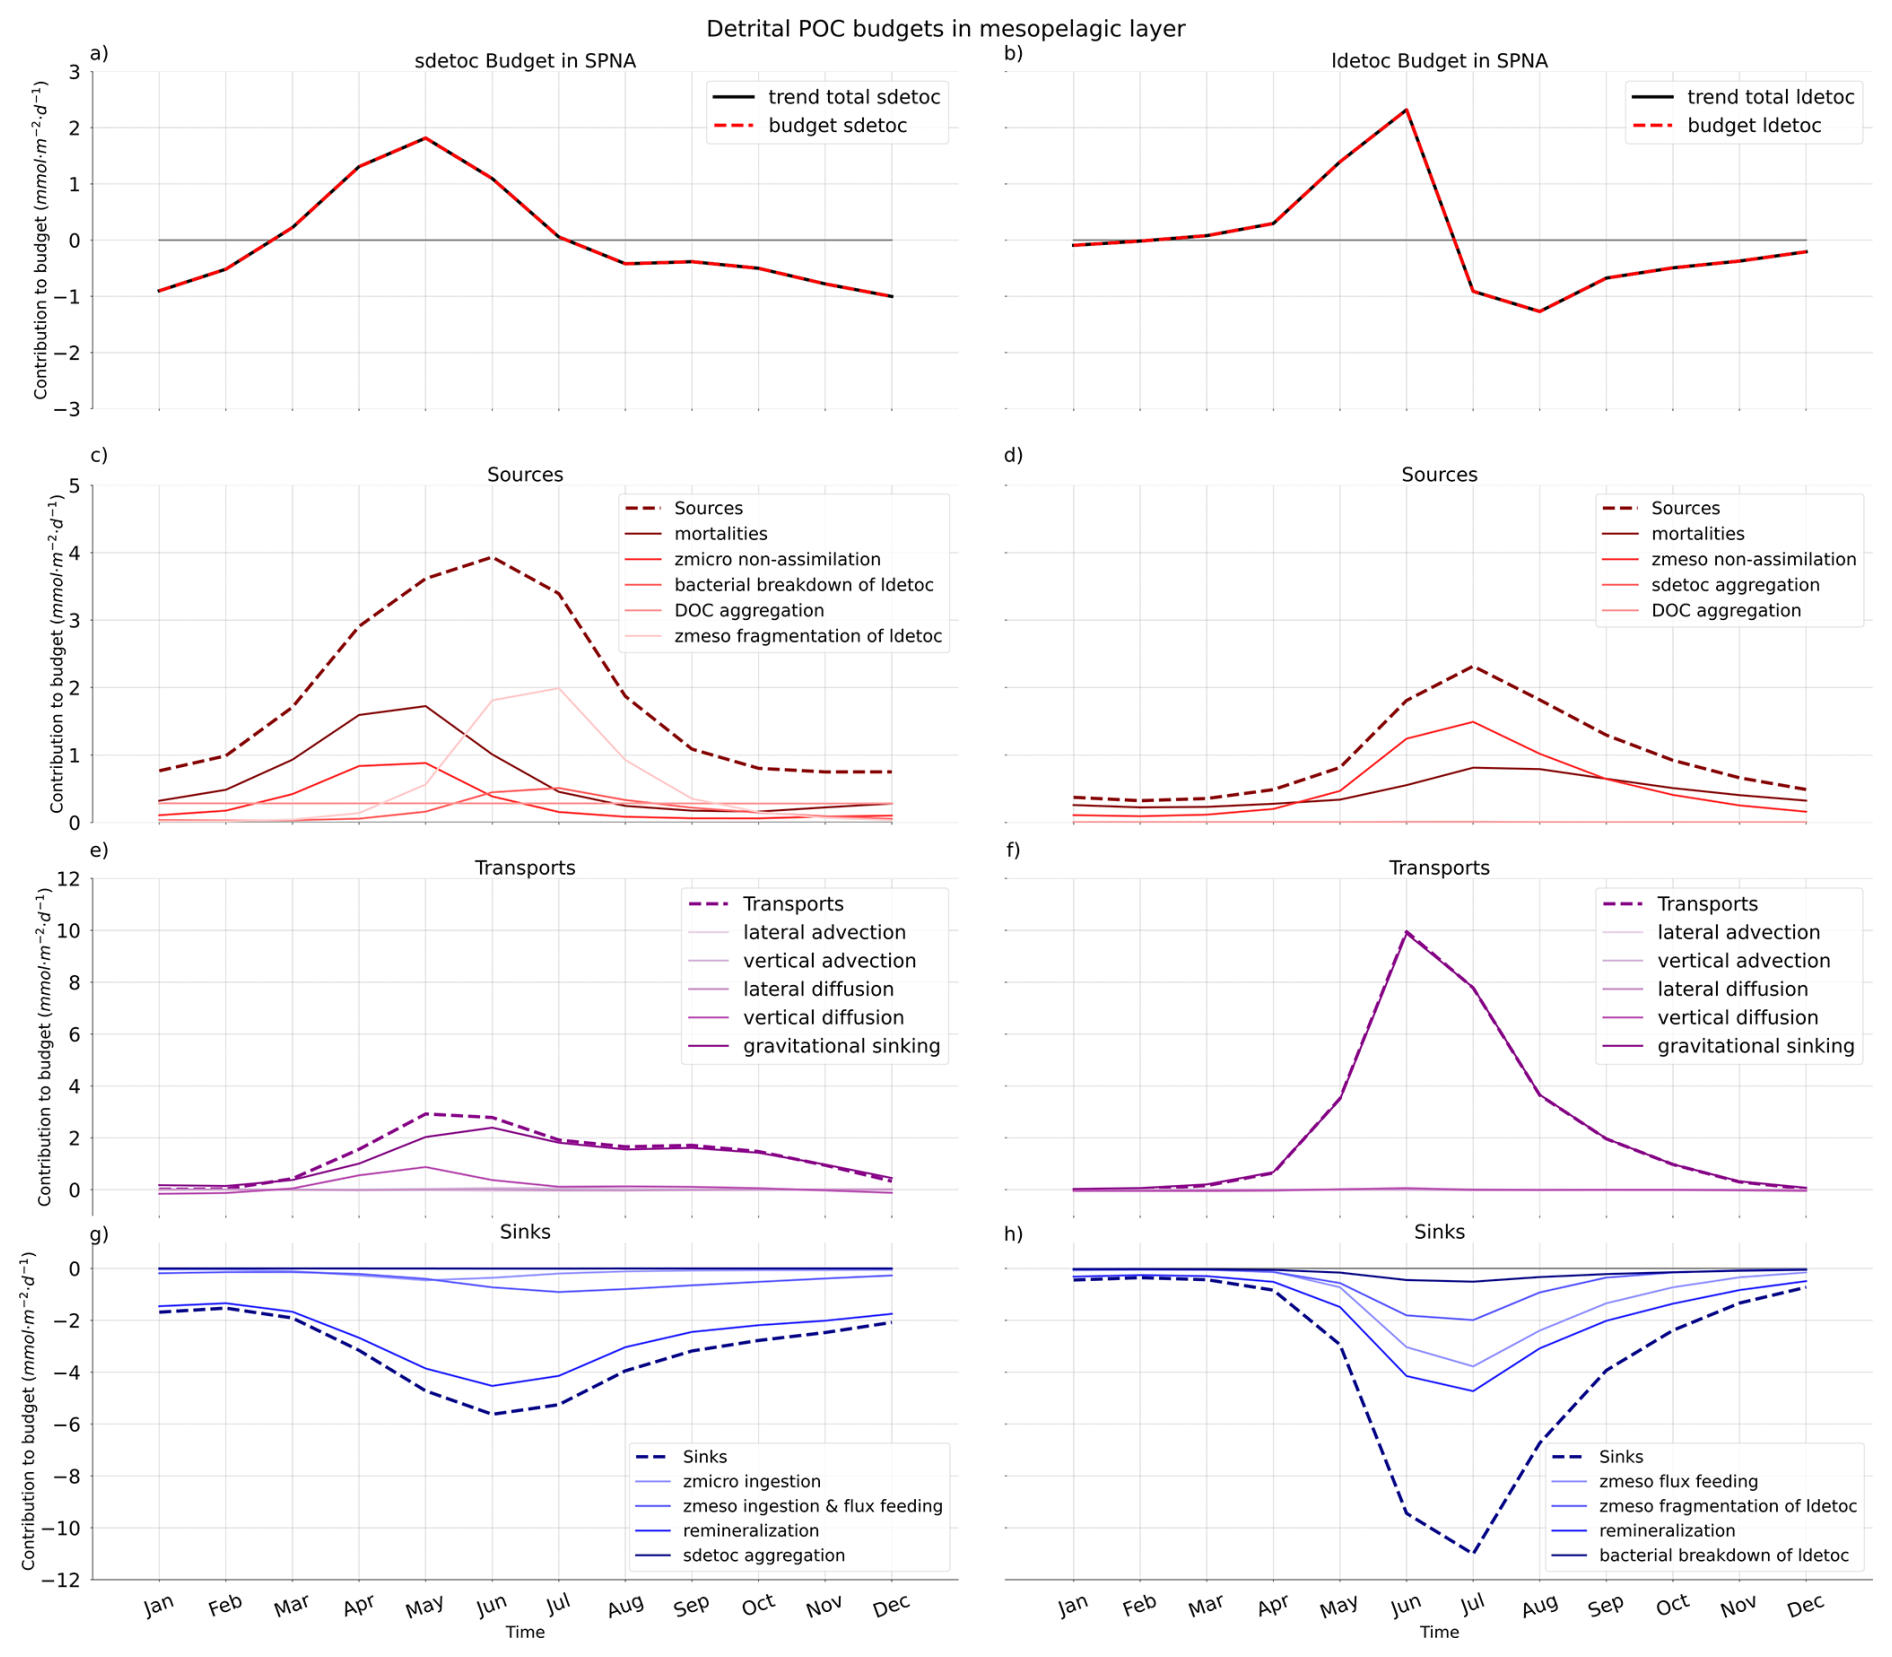
Figure 9Seasonal cycles of sdetoc (left) and ldetoc (right) budgets in the Subpolar North Atlantic (SPNA). Total tracer trends (a, b), sources (c, d), transports (e, f) and sinks (g, h) are shown separately. Note the different y-axis scales.
3.5 Export and transfer efficiency metrics
To synthesise the behaviour of the particulate C pump, we compare export and transfer efficiency metrics across regions (Fig. 10). Additionally, attenuation coefficients “b” (Martin et al., 1987) between Zprod and 1000 m are reported in Fig. 11. All metrics are based on annual mean fluxes.
Considering gravitational fluxes only, PISCES-simulated export efficiency (EE) decreases with latitude, from 21 % in the SPNA to 8 % in the STNA. In contrast, TE varies non-monotonically with latitude and is lowest in the Trans_Area (13 %), intermediate in the SPNA (17 %), and highest in the subtropical area (23 %). As a result, overall particulate C pump efficiency at 1000 m, expressed as EExTE, is highest in the subpolar area (3.6 %) and lower in the transition (1.5 %) and subtropical (1.8 %) areas.
Given the substantial contribution of non-gravitational fluxes in NEMO–PISCES, especially plankton diffusion (Fig. 4), we re-computed EE and TE for the total POC vertical flux, including gravitational, diffusive and advective components. In the subpolar and transition areas, diffusive plankton fluxes are comparable in magnitude to gravitational ones at Zprod but become negligible at 1000 m (Fig. 4). Therefore, their inclusion increases EE but decreases TE. In the SPNA, where the greatest non-gravitational fluxes occur, accounting for all vertical transport pathways increases EE by 8 % but reduces TE by 3 %, resulting in a modest increase in overall efficiency (EExTE) from 3.6 % to 4.0 %.
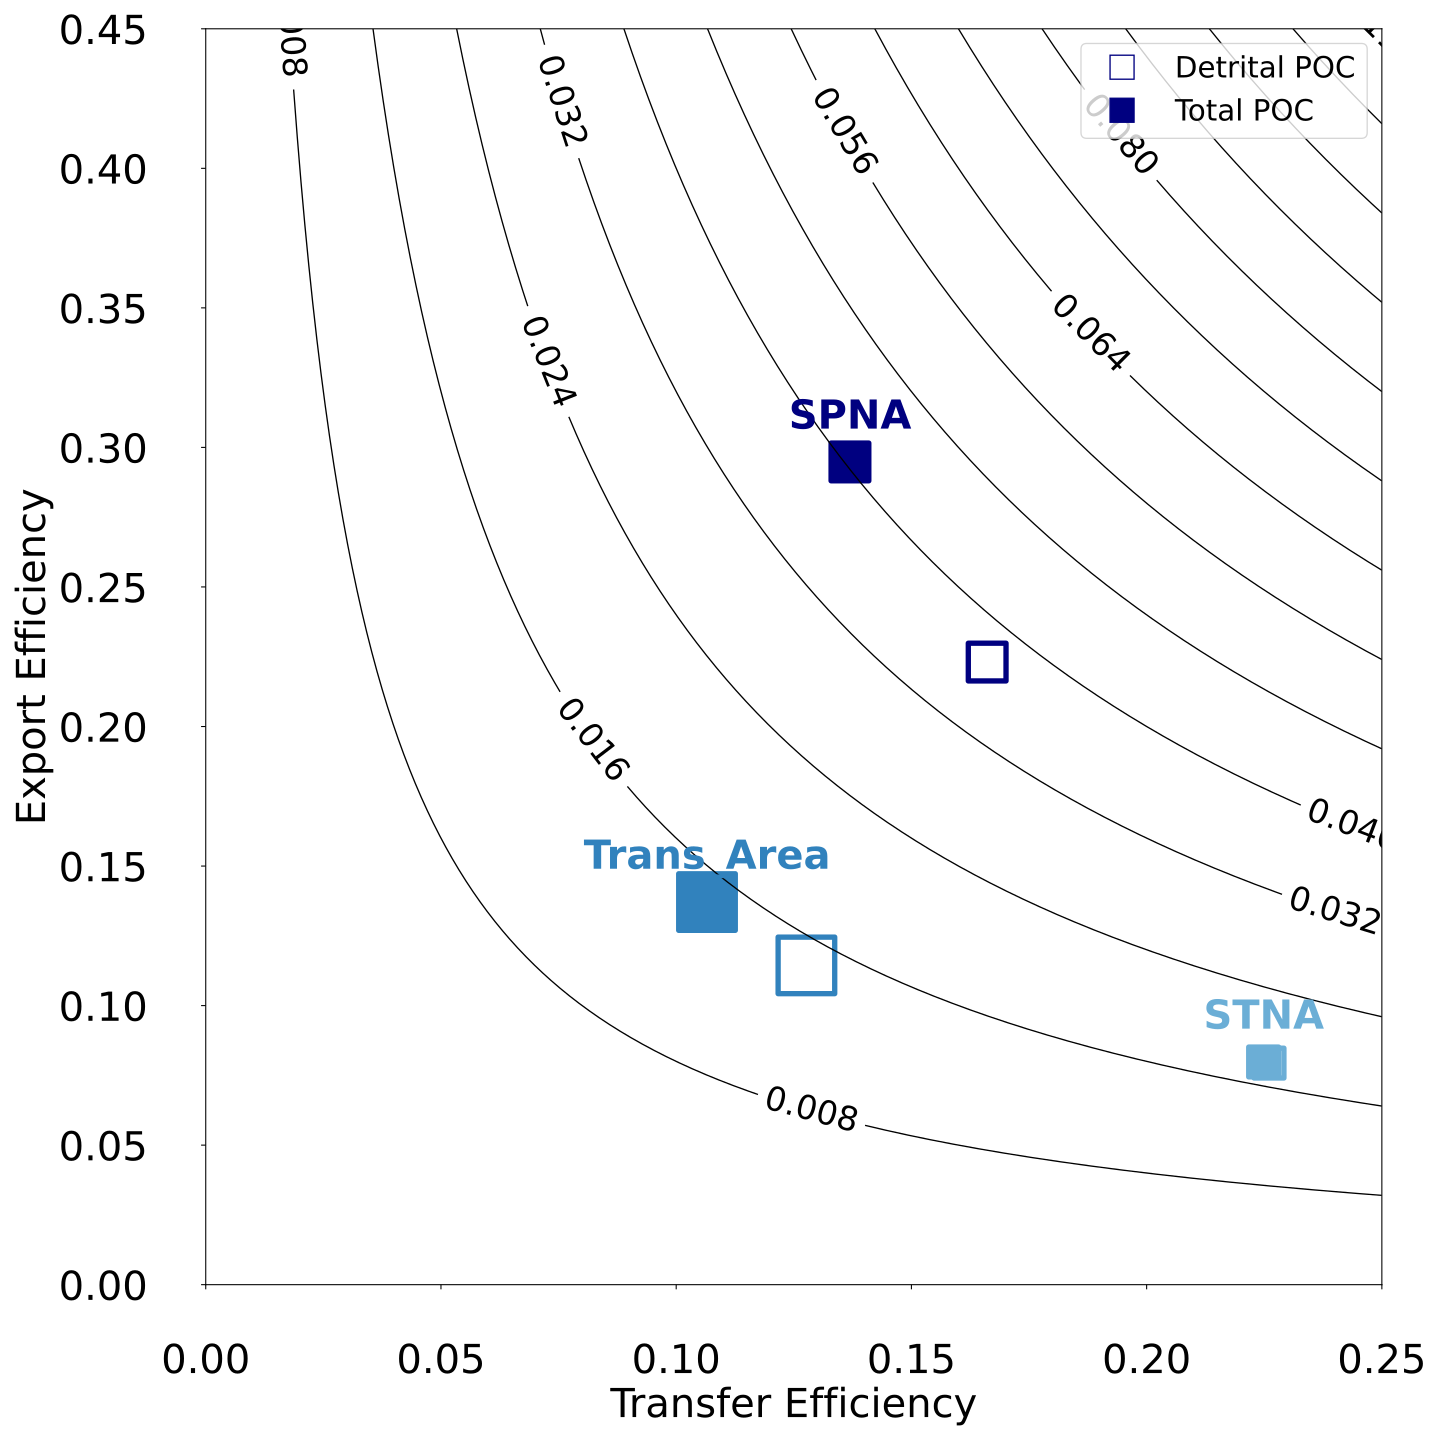
Figure 10Export Efficiency vs Transfer Efficiency metrics in the three regions of the North Atlantic. Empty and filled symbols indicate, respectively, if calculations account for only detrital POC or total POC (detritus and plankton). Note that the two symbols overlap in the STNA. Symbol size is proportional to the NPP of each region. The isolines represent overall particulate C pump efficiency at 1000 m calculated as EExTE. See Sect. 2.4 for details.
This study provides a comprehensive analysis of modelled POC dynamics in the upper 1000 m of the North Atlantic, linking regional and seasonal changes in primary production, POC stocks and export fluxes to the underlying mechanisms of detrital POC production, transport, transformation and decay. By comparing the simulation to available observations, our results shed light on how interactions between ecosystem structure and the physical environment together regulate epipelagic export and mesopelagic transformation of POC.
At the basin scale, and despite significant regional biases in some variables (Figs. 2–6), PISCES-simulated productivity and gravitational export fluxes are broadly consistent with observations and previous studies. As in satellite-based assessments (Henson et al., 2012; Siegel et al., 2023), maximum export fluxes (Fig. 5a, b) are displaced northward relative to NPP (Fig. 2a), reflecting regional differences in ecosystem structure and vertical mixing. Export efficiency increases toward subpolar waters (Fig. 10), concurrent with higher diatom abundance (Mouw et al., 2016) and an increasing contribution of fast-sinking large detritus (Fig. 11). Conversely, at lower latitudes, dominance of small organisms and detritus, together with warmer temperatures and deeper productive layers, enhances degradation within the epipelagic and limits export efficiency (Figs. 4d, 7c, 10). These large-scale patterns are consistent with early conceptual frameworks linking new production, community structure, and gravitational export (Eppley and Peterson, 1979), and ultimately reflect the joint influence of vertical mixing regimes (Sverdrup, 1953; Margalef, 1978) and temperature-dependent remineralisation (Cael and Follows, 2016).
Building on this context, the following sections examine in detail the biophysical controls on epipelagic export fluxes (Sect. 4.1), the interplay between zooplanktonic and bacterial cycling of mesopelagic POC (Sect. 4.2), and how modelled processes affect POC export and transfer efficiency metrics and relate to real-world observational constraints (Sect. 4.3). Since most POC fluxes and derived metrics cannot be comprehensively evaluated against gridded observational products, we compare them with sparse available observations whenever possible. To close the Discussion, we assess the limitations of the current PISCES model formulation, leveraging observed biases to outline potential pathways for improving the representation of mesopelagic POC cycling in models (Sect. 4.4).
4.1 POC inputs to the mesopelagic layer: POC sinking and vertical mixing
Evaluation against 234Th- and sediment trap–based estimates indicates that PISCES reproduces the order of magnitude and broad seasonality of epipelagic export fluxes in the North Atlantic, while exhibiting regionally distinct biases. In the SPNA and at PAP, model–data agreement generally improves with depth and toward summer. At BATS/OFP the model captures the weak seasonal cycle but overestimates export at 150 m, particularly in winter–spring. According to PISCES, large detritus drives 67 % of the gravitational flux at 100 m in the SPNA, exceeding the range (37 %–64 %) estimated in the western subpolar gyre by Wang and Fennel (2022). The latter study further suggests that the contribution of large detritus increases with depth, opposite to model estimates (Fig. 4). In the eastern subtropical Atlantic at 260 m, the contribution of slow-sinking (likely small) particles was > 60 % during most of the year (Alonso-González et al., 2010), roughly consistent with ∼ 50 % in PISCES at 200 m (Fig. 11). Model-data discrepancies possibly reflect a combination of observational uncertainties (Buesseler et al., 2007; Bishop et al., 2012) and limitations in how the model represents POC export using rigid relationships between size classes and sinking velocities (Jackson and Burd, 2015; Iversen and Lampitt, 2020; Cael et al., 2021)
Vertical gradients in simulated export are usually strongest near Zprod (Palevsky and Doney, 2018; Buesseler et al., 2020) implying intense flux attenuation in the lower epipelagic and upper mesopelagic layers. Thus, uncertainties in the mathematical representation of export and attenuation processes, together with small spatiotemporal mismatches between simulations and observations, can lead to substantial model-data deviations. Importantly, it remains unclear whether observational export estimates from sediment traps and the 234Th technique isolate gravitational sinking alone (Fig. 5) or can also account for downward transport by diffusion and advection (and, if so, how efficiently). We therefore interpret shallow export comparisons as quantitative consistency checks rather than direct validation (Aumont et al., 2017), and analyse mesopelagic POC inputs in terms of the total simulated downward POC flux, integrating gravitational sinking of detritus with diffusive and advective transport of both detrital and living particles.
Compared to gravitational fluxes, the transport of POC by vertical mixing has received little attention until recent years. Classical formulations of the biological pump have assumed vertical particle diffusion to be negligible at large scales (Martin et al., 1987), but oscillations in mixed layer depth can effectively entrain and detrain particles (Gardner et al., 1995). In models, these transports are diagnosed as diffusive fluxes, which our results show to be quantitatively relevant at large scales, in agreement with recent research (Bellacicco et al., 2025). In the NEMO-PISCES simulation (Fig. 4), POC diffusion amounts to 37 % (25 %) of annual gravitational fluxes in the SPNA (Trans_Area), in line with independent estimates. For instance, Dall'Olmo et al. (2016) inferred that the POC mixed-layer pump could represent ∼ 23 % of annual mean gravitational fluxes at high latitudes. Lacour et al. (2019) used biogeochemical Argo float profiles to quantify springtime net POC detrainment at 4.6 mmol C m−2 d−1 (55 mg C m−2 d−1) in the SPNA. Our corresponding estimate for March–May (4.3±1.1 mmol C m−2 d−1) is strikingly similar, despite relying on a fundamentally different approach.
Crucially, PISCES further suggests that over 85 % of this diffusive POC flux is associated with living plankton rather than detritus, reflecting the sharper vertical gradient of plankton biomass and their enhanced transport during convection events (Galí et al., 2026). Altogether, gravitational and diffusive export fluxes exhibit different seasonality and deliver to the mesopelagic layer distinct particle mixtures in terms of size, sinking speed, and composition. Differences in supplied POC entail different transformation pathways in the mesopelagic zone (Figs. 7–9 and 11), which are examined in the next section.
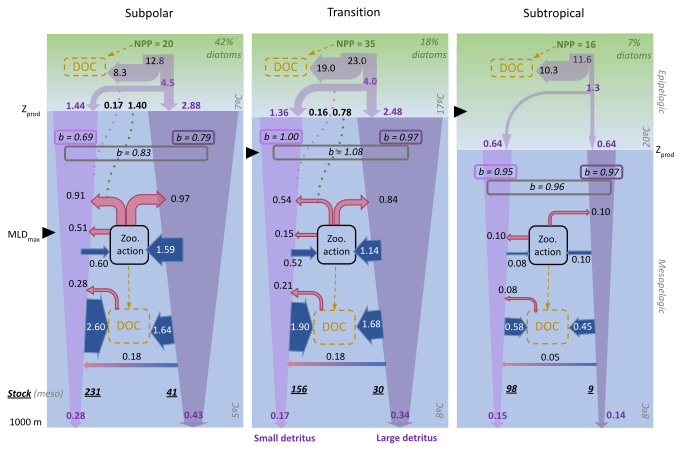
Figure 11Modelled annual budgets of detrital POC in the top km of the North Atlantic, focusing on mesopelagic transformations of small and large detritus. Epipelagic fluxes are shown more schematically, distinguishing the fraction of primary production (NPP) that flows through detrital particles and, within it, the fraction that results in gravitational (filled violet arrows) and diffusive (dotted purple lines) inputs to the mesopelagic layer. Additional particles enter the mesopelagic detrital pool via plankton vertical diffusion (dotted green lines) and subsequent conversion to detritus via mortality and zooplankton processing. Within the mesopelagic layer, blue and red arrows are used to distinguish sources and sinks, respectively, and violet arrows represent gravitational fluxes, whose narrowing represents flux attenuation. Arrow size is indicative of flux magnitude, but not to scale. All fluxes are in mmol C m−2 d−1, and, for simplicity, fluxes smaller than 0.05 have been omitted. The vertical attenuation coefficient “b” (Martin et al., 1987), computed between Zprod and 1000 m (boxed italic numbers, unitless), is shown separately for gravitational fluxes of small and large detritus and the gravitational + diffusive fluxes together. The mesopelagic vertically-integrated stocks, in mmol C m−2, are shown in bold italics. The modelled percentage of diatoms is indicated in green at the top of each panel: 42 % for SPNA, 18 % for Trans_Area and 7 % in the STNA.
4.2 Mesopelagic POC budgets: joint regulation by zooplankton and bacteria
Zooplankton plays a central role in detritus processing in PISCES: 50 %–60 % of the gravitational input flux transits through zooplankton at mid and high latitudes, compared to ∼ 20 % in the subtropical area (Figs. 8 and 11). Importantly, zooplankton processing does not equate to POC flux attenuation, as a substantial and variable fraction returns to the sinking detritus pool via fragmentation, faecal pellet production and mortality (Figs. 8 and 9). As a result, POC recirculates within a mesopelagic detrital loop before final removal, primarily through bacterial decomposition (Fig. 11). In this section, we examine how zooplankton transformations and microbial degradation jointly shape mesopelagic detritus budgets, and how these simulated rates compare with the limited available observations.
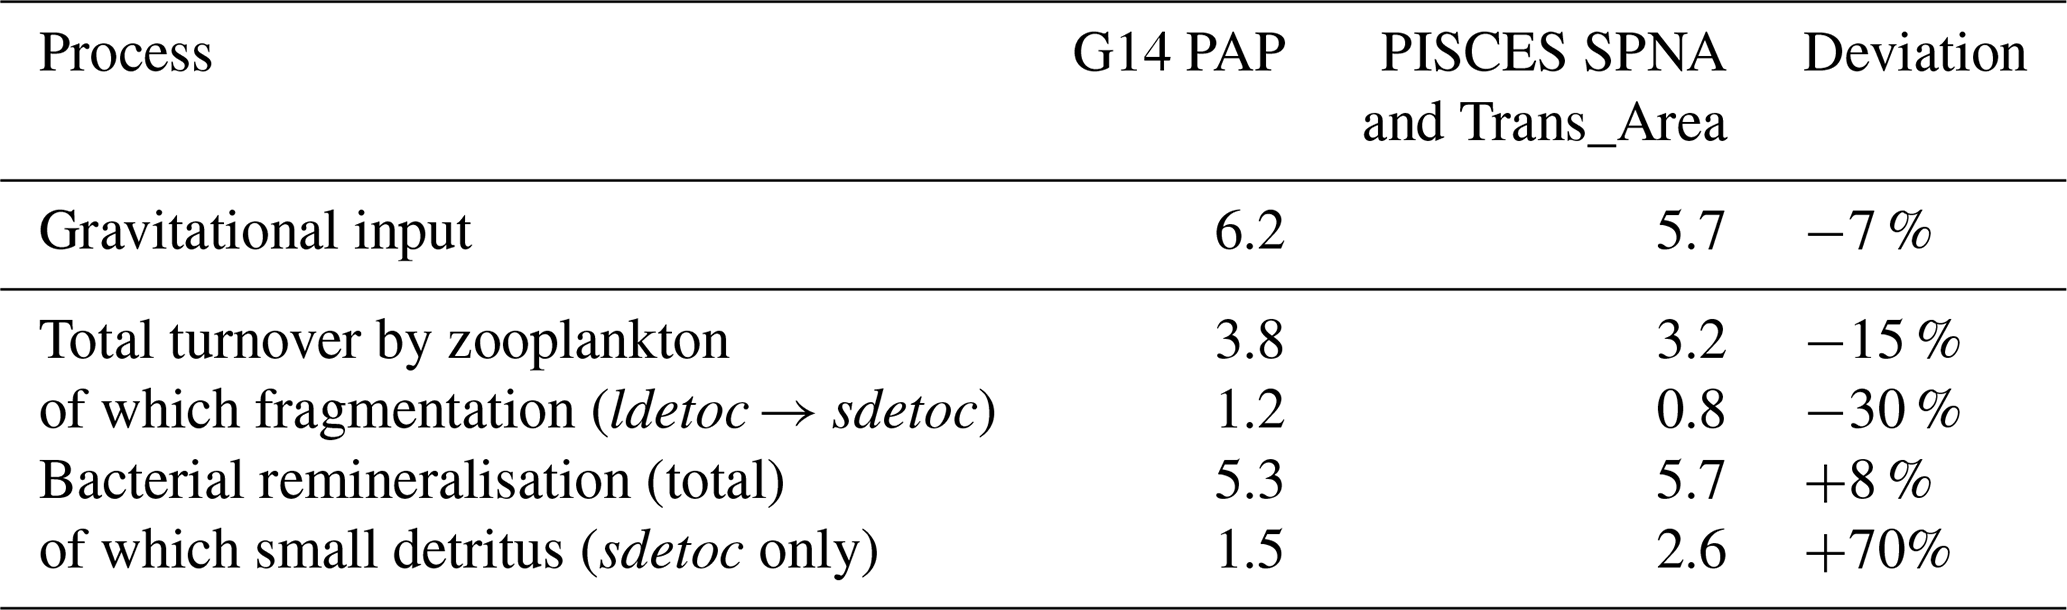
A stringent evaluation is provided by comparison with observations at the PAP site (see Fig. 2), where Giering et al. (2014) (G14) were able to constrain, within reasonable uncertainty, POC flux attenuation and mesopelagic metabolism. Using July–August PISCES means for the SPNA and the Trans_Area and acknowledging imperfect correspondence between model- and observations-derived rates, we find that PISCES reproduces within ±15 % the magnitude of gravitational inputs, total zooplankton detritivory and bacterial degradation (Table 4). However, the model overestimates large-detritus fragmentation and the contribution of small detritus to POC decay. This discrepancy may partly reflect differences in pool definitions, as suspended POC in G14 is not fully equivalent to PISCES sdetoc, which accounts for suspended and slow-sinking fractions (Galí et al., 2022). Overall, this comparison is reassuring regarding simulated flux magnitudes, and further work is warranted to explore POC dynamics at the PAP site.
In PISCES, flux feeding and fragmentation of large detritus by mesozooplankton critically influence the vertical transfer of gravitational fluxes (Fig. 8), consistent with previous assessments (Mayor et al., 2020). Seasonal export pulses enhance mesozooplankton biomass and the proportion of flux feeders (Sect. 2.2; Supplement file 1), progressively intensifying removal of large sinking aggregates by mesozooplankton as the season advances (Fig. 9). Fragmentation of ldetoc into sdetoc additionally slows sinking fluxes, favouring microzooplankton consumption and microbial degradation over vertical transfer. Together, these trophic feedbacks limit mesopelagic TE during peak export periods (Fig. 9).
Although the functional representation of mesozooplankton activities in PISCES reasonably captures the magnitude of some observed process rates (Table 4), it necessarily simplifies the diversity of mesopelagic zooplankton communities and feeding strategies. In particular, the model cannot explicitly resolve the wide range of behaviours spanning flux-feeding Rhizaria to particle-attached copepods and other taxa that interact with sinking particles in distinct ways (Stukel et al., 2019; Mayor et al., 2020; Lampitt et al., 2023; Laget et al., 2024). As a result, the diagnosed trophic feedbacks should be interpreted as an emergent, functional representation of zooplankton–particle interactions rather than a taxonomically explicit description of mesopelagic food-web dynamics.
Large-detritus fragmentation deserves particular attention, as PISCES was the only CMIP6 model that explicitly represented this process (Henson et al., 2022). Because the model prescribes enhanced fragmentation of silica-rich aggregates, fragmentation is maximal in the SPNA (Figs. 8 and 9; see also Fig. 3d). From May to July, zooplanktonic fragmentation accounts for 19 % of ldetoc flux attenuation in the SPNA, with bacterial disaggregation contributing an additional 5 %. By comparison, Briggs et al. (2020) attributed to fragmentation 49 ± 22 % of fast-sinking particle flux attenuation during intense export events in the SPNA and the Southern Ocean. This discrepancy likely reflects differences in process definitions and temporal averaging. In particular, the attenuation attributed to fragmentation by Briggs et al. (2020) better matches the 55 % of ldetoc attenuation explained by the sum of flux feeding, fragmentation and bacterial disaggregation in PISCES. Further observational (Briggs et al., 2020; Wang and Fennel, 2022) and modelling efforts are needed to constrain fragmentation rates and mechanisms.
Despite the prominent role of zooplankton, most flux attenuation in PISCES proceeds through microbial degradation (Figs. 8, 9 and 11). Owing to the variable reactivity formulation, slow-sinking particles are degraded at shallower depths than fast-sinking ones. Simulated remineralisation rate constants (Fig. 7) fall within the wide range of in situ estimates, although natural and methodological variability preclude a conclusive assessment (Benner and Amon, 2015 and references therein; Belcher et al., 2016 and references therein; García-Martín et al., 2021). A more robust assessment is obtained from vertically-integrated POC degradation rates. In the mesopelagic SPNA, decay rates in May–June (7 mmol C m−2 d−1) resemble the GEOVIDE cruise mean (6.5 mmol C m−2 d−1; Lemaitre et al. (2018), and summer estimates at PAP also agree within 10 % (Table 4). Unfortunately, we are not aware of suitable datasets in the STNA, where available estimates reflect the respiration of POC+DOC (e.g., Ono et al., 2001) and therefore exceed POC decay simulated by PISCES.
The contribution of different particle classes to community metabolism remains poorly constrained in both epipelagic (García-Martín et al., 2021) and mesopelagic waters (Table 4). In PISCES, fast-sinking aggregates retain higher intrinsic reactivity (Fig. 7), whereas the larger stock of small detritus compensates for its lower reactivity. As a result, both particle types support comparable fractions of mesopelagic metabolism across regions (Fig. 11). Perhaps counterintuitively, the strongest sdetoc removal, both in absolute (2.6 mmol C m−2 d−1) and relative terms (61 %), occurs in the subpolar area, fuelled by particle diffusion and ldetoc fragmentation inputs. Overall, these results reinforce the emerging view that suspended and slow-sinking particles play a central role in the mesopelagic carbon cycling (Alonso-González et al., 2010; Baker et al., 2017; García-Martín et al., 2021; Wang and Fennel, 2022; Baumas and Bizic, 2024).
Table 4Mesopelagic POC budgets: PISCES vs. data from Giering et al. (2014) at Porcupine Abyssal Plain (PAP, Jul-Aug). Data extracted from their Fig. 2 and converted to mmol C m−2 d−1. These budgets are not closed: some terms are omitted due to limited comparability, and a seasonal imbalance exists (at least in the model simulation).
4.3 Carbon pump efficiency metrics: from models to real-world measurements
In PISCES, annual EE increases from 8 % to 29 % between subtropical and subpolar waters (Fig. 10). As found by Mouw et al. (2016), this gradient mirrors the latitudinal increase in diatom abundance (Fig. 2), which in the model rises from 7 % to 42 % (Fig. 10). Although the modelled latitudinal EE gradient falls within the range of current estimates (Villa-Alfageme et al., 2016; Siegel et al., 2023), EE is likely overestimated at mid and high latitudes because diatoms are overrepresented (Figs. 2 and 3; Table 3). Improved representation of phytoplankton functional groups and size structure in models is key to better constrain biological carbon export.
Our results further underscore the importance of including non-gravitational POC fluxes in carbon pump assessments. Neglecting these fluxes, especially those driven by vertical mixing, can substantially underestimate total POC export at high latitudes (Figs. 4 and 11). These unaccounted fluxes bias EE and TE metrics (Fig. 10) and affect interpretations of mesopelagic food-web metabolism and its seasonality (Figs. 9, S5 and S6) (Dall'Olmo et al., 2016; Lacour et al., 2019). Current model intercomparison frameworks (e.g. CMIP) rely on simulated gravitational fluxes at standard depths (Palevsky and Doney, 2018; Henson et al., 2022; Wilson et al., 2022). Thus, our findings suggest that non-gravitational POC transports, which are internally simulated by models, should be included in standard model intercomparison metrics.
Compared to the mechanisms controlling EE (see Sect. 4.1), the factors regulating mesopelagic TE remain more controversial. Mechanistic interpretations have alternately emphasised lower lability of exported POC in subtropical areas, leading to a latitudinal decrease in TE (Henson et al., 2012; Guidi et al., 2015), or reduced organic matter decay in cold mesopelagic waters, leading to a latitudinal increase in TE (DeVries and Weber, 2017). In PISCES, mesopelagic TE does not vary monotonically from subtropical to subpolar waters, nor with the depth of the productive layer, but instead exhibits a minimum at midlatitudes (Fig. 10). Lowest TE coincides with highest productivity (Figs. 10 and 11), broadly consistent with the climatological patterns reported by Mouw et al. (2016). This relationship also resembles the opposite interannual trends in NPP and export relative to mesopelagic transfer, reported by Lomas et al. (2010) in the Sargasso Sea. Nevertheless, the occurrence of maximum TE in the STNA and intermediate TE in the SPNA indicates that mesopelagic transfer is not controlled by productivity or productive-layer depth alone. As we shall see, these patterns cannot be attributed to a single dominant factor.
Examination of the mechanisms driving mesopelagic TE in PISCES is informative because the model represents the interplay between variable POC reactivity and temperature-dependent decay rates (Fig. 7), as well as zooplankton detritivory. First, exported POC – especially sdetoc – is least reactive in the STNA, reflecting deeper and warmer Zprod (Fig. 4i), consistent with Henson et al. (2012) and Guidi et al. (2015). Second, mesopelagic POC decay rate constants also increase toward low latitudes, primarily due to temperature effects, consistent with Marsay et al. (2015) and DeVries and Weber (2017). Third, simulated detritivory rates decrease toward low latitudes (Fig. 11), but their relative importance peaks in the Trans_Area (Fig. 8), concurrent with the highest proportion of flux feeders (Supplement file S1). As a result of these interacting mechanisms, detritus turnover times with respect to both microbial and zooplanktonic removal (calculated as the quotient between stocks and removal rates; Fig. 11) are shortest in the Trans_Area, and much longer in the STNA. While these outcomes remain model-dependent and subject to known biases (Table 3), they help reconciling the lability- and temperature-based hypotheses, yielding a more nuanced understanding of mesopelagic TE variability (Marsay et al., 2015), and further highlight that zooplankton processes must be explicitly accounted for.
Previous studies showed that considering the seasonal cycle is key when linking EE and TE observations and models (Ceballos-Romero et al., 2016; de Melo Viríssimo et al., 2024). In this study, however, we refrain from reporting these metrics at intra-annual scale for the following reasons: (i) for EE, there is a regionally varying time lag between NPP, detritus accumulation, and export rates (Figs. 2–4); (ii) in the case of the TE metric, distortion arises from the gradual vertical propagation of sinking POC fluxes (Giering et al., 2017), and from the lagged response of food-web processes that drive flux attenuation. In the highly seasonal SPNA, for example, sources exceed sinks by 25 % in May, and sinks exceed sources by 23 % in August (Fig. 9). Much larger imbalances may occur when examining smaller regions and non-climatological data. In summary, seasonal departure from steady state is an inherent feature of model-simulated POC budgets (Oliver et al., 2025), and helps explain difficulties in interpreting short-term in situ measurements (Giering et al., 2017).
4.4 Study limitations and pathways for model improvement
In the previous sections, we have dissected the drivers of epipelagic export and mesopelagic POC budgets in PISCES. Here, we synthesise the resulting process-level understanding with the biases identified through model evaluation (Figs. 2–6) to provide a unified diagnosis of model performance across regions (Table 3) and outline pathways for model improvement.
In the subpolar area, simulated primary production and sPOC show small-to-moderate negative biases, while a clear bias in POC export cannot be identified (compare Figs. 5 and 6). Total phytoplankton biomass is reasonably simulated, but substantial positive biases in diatoms and mesozooplankton likely lead to an overestimation of large detritus export (Wang and Fennel, 2022). Correcting NPP underestimation would tend to increase sPOC stocks and exports. In contrast, correcting diatom overestimation would favour smaller classes of phytoplankton and detritus, lowering export efficiency. Addressing these opposing biases would likely improve model realism. In the mesopelagic SPNA, simulated sPOC stocks and export fluxes remain broadly consistent with what would be expected given epipelagic inputs (Table 3). The limited available observations of POC decay are reasonably reproduced (Lemaitre et al., 2018), but large detritus fragmentation may be underestimated (Briggs et al., 2020). Uncertainties in the model representation of fragmentation will be addressed through sensitivity analyses in forthcoming work (Orihuela-García et al., 2026).
In the midlatitude Trans_Area, epipelagic and mesopelagic biases differ in nature. Although diatoms are overrepresented at the expense of miscellaneous phytoplankton, NPP is accurately simulated, and no evident biases emerge in epipelagic sPOC stock and export fluxes, suggesting bias compensation. However, sPOC underestimation increases between epipelagic and upper mesopelagic waters, indicating excessive detritus removal. This is consistent with the overestimation of microbial POC degradation inferred from the comparison with PAP (Table 4) and would contribute to an underestimation of TE. Such a bias is not readily apparent from export flux comparisons alone, highlighting the value of evaluating models against diverse flux and stock datasets.
In the subtropical area, PISCES severely underestimates NPP, a bias that propagates to epipelagic sPOC stocks (Galí et al., 2022). Export production is instead overestimated, suggesting a strong positive bias in EE – at least according to BATS/OFP data at 150 m (Lomas et al., 2010). Below 500 m, POC fluxes are no longer overestimated (Fig. 6) despite the positive bias in shallow export (Fig. 5e). This suggests that mesopelagic TE is underestimated, consistent with the increasing underestimation of sPOC with depth, also found in the Trans_Area. Together, these results indicate offsetting biases between excessive EE in the epipelagic and insufficient TE in the mesopelagic. Increasing NPP would likely exacerbate the positive bias in shallow export. This bias would further propagate vertically if mesopelagic transfer were corrected upward. Thus, PISCES' representation of POC cycling in epi- and upper mesopelagic waters in oligotrophic areas may require revision.
Observed biases arise not only from model parameterisations but also from the omission of biological functional groups and/or processes. Several mechanisms known to influence mesopelagic carbon cycling are not explicitly represented in the model used here, including: zooplankton vertical migrations (Carr et al., 2008; Jónasdóttir et al., 2015; Gorgues et al., 2019); the diversity of zooplankton feeding strategies (Stemmann et al., 2004b, 2004a; Kiørboe, 2011; Mayor et al., 2020; Lampitt et al., 2023; Laget et al., 2024); and the distinct roles of free-living and particle-attached bacteria, carbon fixation by chemotrophic prokaryotes, and protist bacterivory (Arístegui et al., 2009; Herndl et al., 2023). For example, including zooplankton migration would likely enhance deep carbon export and mesopelagic sPOC stocks, while reducing NPP and epipelagic sPOC stocks (Aumont et al., 2018; Gorgues et al., 2019). These changes would entail region- and depth-dependent effects on model biases (Table 3). While incorporating missing processes might help bridge the gaps between the model and observations, it would increase model complexity and require extensive re-tuning to maintain consistency across coupled biogeochemical pathways.
In this study, we evaluated the representation of POC dynamics in the upper 1000 m of the North Atlantic in the NEMO4-PISCESv2_RC model using diverse observational datasets. Combined with a detailed examination of detrital POC budgets extracted from the model, this approach provided insights into the processes regulating POC distribution, vertical export and biological transformations in biogeochemically-contrasting regions. Below we summarise our main conclusions:
-
PISCES-simulated gravitational fluxes increase with latitude (from ∼ 1.3 to 4.3 mmol C m−2 d−1 annually), whereas maximal primary production occurs in midlatitudes, in reasonable agreement with observations. Consequently, epipelagic export efficiency (EE) increases with latitude, mirroring the diatom fraction and the contribution of large, fast-sinking detrital aggregates to gravitational export. However, the model overestimates diatom biomass at mid and high latitudes, likely implying excessively large detritus export flux and removal pathways.
-
In areas experiencing deep winter mixing, diffusive POC export fluxes (dominated by plankton biomass) peak in early spring, preceding the summertime peak in gravitational export. Model-derived diffusive fluxes are consistent with independent observational estimates, and supply ∼ 1.6 mmol C m−2 d−1 to the mesopelagic subpolar Atlantic annually. Neglecting non-gravitational fluxes substantially underestimates EE in this region (21 % vs. 29 %) and obscures the coupling between primary production and mesopelagic metabolism.
-
In the subtropical area, bias compensation between underestimated primary production and overestimated POC export leads to overestimation of modelled EE (8 %). In the lower mesopelagic, however, the model reproduces observed gravitational fluxes, suggesting that model-diagnosed transfer efficiency (23 %) may be underestimated. Negative biases in mesopelagic small POC further indicate an increasing imbalance in modelled detritus supply and removal toward low latitudes. These biases warrant further examination, given the large contribution of oligotrophic regions to global POC export.
-
Mesopelagic POC budgets are jointly regulated by zooplankton transformations and microbial degradation. A large fraction of the gravitational POC supply – up to 60 % in the subpolar region – transits through zooplankton. Much of this material is recycled via fragmentation, faecal pellet production, and mortality, rather than being immediately attenuated. This mesopelagic detrital loop modulates particle size, sinking speed, and residence time, thereby shaping microbial remineralisation pathways and rates that ultimately drive POC decay. Modelled mesopelagic decay rates agree within ±15 % with scarce observations at mid-to-high latitudes.
-
In PISCES, mesopelagic transfer efficiency is lowest in midlatitudes and coincides with maximal productivity, consistent with some observational assessments. This pattern arises from interacting mechanisms: (i) increasing lability of exported POC toward higher latitudes; (ii) increasing temperature-driven mesopelagic decay rates toward low latitudes; (iii) seasonal trophic feedback between aggregate export and zooplankton, by which enhanced export of large aggregates triggers zooplankton detritivory and fragmentation, limiting transfer efficiency in productive regions. These modelled mechanisms reconcile apparently contradictory hypotheses and highlight the essential role of zooplankton in regulating mesopelagic POC transfer.
-
Small slow-sinking detritus supports 50 %–61 % of mesopelagic POC decay across regions and drives 33 %–50 % of the export flux at 1000 m. Key modelled responses enabling these contributions are (i) diverse sources for small detritus – such as zooplankton fragmentation and bacterial disaggregation of large aggregates, plankton mortality, and sloppy feeding – and (ii) the refractory nature of small particles reaching the lower mesopelagic in PISCES. Further research is needed to clarify functional links between small and large POC fractions and their model representation.
-
Overall, this study demonstrates the value of a mechanistic, budget-based approach to evaluating models of the biological carbon pump. Detailed POC budget analysis reveals model-specific drivers of export and transfer efficiency and provides a reproducible method to diagnose inter-model biases. This approach can guide model tuning and the development of parameterisations for missing processes. Ultimately, biases in modelled POC budgets can inform assessments of biogenic DIC sequestration fluxes.
Post-processed data are available as annexes in the supplementary information section, and additional detailed information on the raw outputs will be provided upon request. The open-source Autosubmit workflow manager (https://autosubmit.readthedocs.io/en/master/, last access: 6 July 2023) was used to ensure simulation reproducibility. All analyses and plots were developed through open-source code: Python3 (https://python.org/, last access: 12 February 2026), ESMValCore (https://doi.org/10.5281/zenodo.3387139, Andela et al., 2026), and R version 4.3.3 (https://cran.r-project.org/bin/, last access: 16 February 2026). The codes used for the analysis and plots, including Jupyter notebooks, will be made available upon request to the MAOG. All observational data used for model evaluation are publicly available.
Supplement text, tables and figures is included in a pdf document. In addition, there are two files (S1 and S2) with the post-processed model output data in the Supplement Sect. S4. The supplement related to this article is available online at https://doi.org/10.5194/bg-23-4083-2026-supplement.
Conceptualisation: MAOG, MG, YRR, RB. Methodology: MAOG, MG, YRR, VL, MC, SL, MSC, PAB. Investigation: MAOG, MG, YRR. Visualisation: MAOG, MG. Funding acquisition: MG, YRR. Project administration: MG, YRR. Supervision: MG, YRR. Writing – original draft: MAOG. Writing – review and editing: MAOG, MG, YRR, RB.
The contact author has declared that none of the authors has any competing interests.
Publisher's note: Copernicus Publications remains neutral with regard to jurisdictional claims made in the text, published maps, institutional affiliations, or any other geographical representation in this paper. The authors bear the ultimate responsibility for providing appropriate place names. Views expressed in the text are those of the authors and do not necessarily reflect the views of the publisher.
We thank the Barcelona Supercomputing Center team (Eneko Martín-Martínez, Alba Santos-Espeso, Marcus Falls, Victòria Agudetse, Eric Ferrer, Elisa Bergas-Massó, Joan Llort and Valentina Sicardi) for their help in developing the experiment set-up and/or postprocessing and plotting results, and Olivier Aumont for useful discussions. We thank the anonymous reviewers and the Editor for their comments, which helped improve the manuscript.
The Spanish Sciences and Universities Ministry funded this work through a personal FPI grant (PRE2020-093628, to M.A.O-G.) and the OPERA project (PID2019-107952GA-I00, to M.G. and Y.R-R.). M.G. acknowledges financial support through a Junior Leader Fellowship from “La Caixa” Banking Foundation (ORCAS project; LCF/BQ/PI18/11630009) and the European Space Agency (TIME project; contract no. 4000147354/25/I-LR). The ICM-CSIC is supported by a “Severo Ochoa” Centre of Excellence grant (CEX2019-000928-S).
The article processing charges for this open-access publication were covered by the CSIC Open Access Publication Support Initiative through its Unit of Information Resources for Research (URICI).
This paper was edited by Peter Landschützer and reviewed by four anonymous referees.
Alonso-González, I. J., Arístegui, J., Vilas, J. C., and Hernández-Guerra, A.: Lateral POC transport and consumption in surface and deep waters of the Canary Current region: A box model study, Global Biogeochem. Cy., 23, GB2007, https://doi.org/10.1029/2008GB003185, 2009.
Alonso-González, I. J., Arístegui, J., Lee, C., Sanchez-Vidal, A., Calafat, A., Fabrés, J., Sangrá, P., Masqué, P., Hernández-Guerra, A., and Benítez-Barrios, V.: Role of slowly settling particles in the ocean carbon cycle, Geophys. Res. Lett., 37, L13608, https://doi.org/10.1029/2010GL043827, 2010.
Andela, B., Broetz, B., de Mora, L., Drost, N., Eyring, V., Koldunov, N., Lauer, A., Predoi, V., Righi, M., Schlund, M., Vegas-Regidor, J., Zimmermann, K., Bock, L., Diblen, F., Dreyer, L., Earnshaw, P., Hassler, B., Little, B., Loosveldt-Tomas, S., and Lenhardt, J.: ESMValCore (v2.14.0), Zenodo [data set], https://doi.org/10.5281/zenodo.18941253, 2026.
Arístegui, J., Gasol, J. M., Duarte, C. M., and Herndld, G. J.: Microbial oceanography of the dark ocean's pelagic realm, Limnol. Oceanogr., 54, 1501–1529, https://doi.org/10.4319/lo.2009.54.5.1501, 2009.
Aumont, O., Ethé, C., Tagliabue, A., Bopp, L., and Gehlen, M.: PISCES-v2: an ocean biogeochemical model for carbon and ecosystem studies, Geosci. Model Dev., 8, 2465–2513, https://doi.org/10.5194/gmd-8-2465-2015, 2015.
Aumont, O., Van Hulten, M., Roy-Barman, M., Dutay, J.-C., Éthé, C., and Gehlen, M.: Variable reactivity of particulate organic matter in a global ocean biogeochemical model, Biogeosciences, 14, 2321–2341, https://doi.org/10.5194/bg-14-2321-2017, 2017.
Aumont, O., Maury, O., Lefort, S., and Bopp, L.: Evaluating the Potential Impacts of the Diurnal Vertical Migration by Marine Organisms on Marine Biogeochemistry, Global Biogeochem. Cy., 32, 1622–1643, https://doi.org/10.1029/2018GB005886, 2018.
Baker, C. A., Henson, S. A., Cavan, E. L., Giering, S. L. C., Yool, A., Gehlen, M., Belcher, A., Riley, J. S., Smith, H. E. K., and Sanders, R.: Slow-sinking particulate organic carbon in the Atlantic Ocean: Magnitude, flux, and potential controls, Global Biogeochem. Cy., 31, 1051–1065, https://doi.org/10.1002/2017GB005638, 2017.
Baumas, C. and Bizic, M.: A focus on different types of organic matter particles and their significance in the open ocean carbon cycle, Prog. Oceanogr., 224, 103233, https://doi.org/10.1016/j.pocean.2024.103233, 2024.
Belcher, A., Iversen, M., Giering, S., Riou, V., Henson, S. A., Berline, L., Guilloux, L., and Sanders, R.: Depth-resolved particle-associated microbial respiration in the northeastAtlantic, Biogeosciences, 13, 4927–4943, https://doi.org/10.5194/bg-13-4927-2016, 2016.
Bellacicco, M., Marullo, S., Dall'Olmo, G., Iudicone, D., and Buongiorno Nardelli, B.: The oceanic physical injection pump of organic carbon, Nat. Commun., 16, 7100, https://doi.org/10.1038/s41467-025-62363-z, 2025.
Benner, R. and Amon, R. M. W.: The Size-Reactivity Continuum of Major Bioelements in the Ocean, Annu. Rev. Mar. Sci., 7, 185–205, https://doi.org/10.1146/annurev-marine-010213-135126, 2015.
Berger, W. H. and Wefer, G.: Export production: seasonality and intermittency, and paleoceanographic implications, Palaeogeogr. Palaeocl., 89, 245–254, https://doi.org/10.1016/0921-8181(90)90020-D, 1990.
Bishop, J. K. B., Lam, P. J., and Wood, T. J.: Getting good particles: Accurate sampling of particles by large volume in-situ filtration, Limnol. Oceanogr. Method., 10, 681–710, https://doi.org/10.4319/lom.2012.10.681, 2012.
Bol, R., Henson, S. A., Rumyantseva, A., and Briggs, N.: High-Frequency Variability of Small-Particle Carbon Export Flux in the Northeast Atlantic, Global Biogeochem. Cy., 32, 1803–1814, https://doi.org/10.1029/2018GB005963, 2018.
Boudreau, B. P. and Ruddick, B. R.: On a reactive continuum representation of organic matter diagenesis, Am. J. Sci., 291, 507–538, https://doi.org/10.2475/ajs.291.5.507, 1991.
Boyd, P. W., Claustre, H., Levy, M., Siegel, D. A., and Weber, T.: Multi-faceted particle pumps drive carbon sequestration in the ocean, Nature, 568, 327–335, https://doi.org/10.1038/s41586-019-1098-2, 2019.
Brabson, E. K., Doyle, L. F., Acosta, R. P., Fedorov, A. V., Hull, P. M., and Burls, N. J.: A Revised Temperature-Dependent Remineralization Scheme for the Community Earth System Model (v1.2.2), EGUsphere [preprint], https://doi.org/10.5194/egusphere-2025-3808, 2025.
Bressac, M., Laurenceau-Cornec, E. C., Kennedy, F., Santoro, A. E., Paul, N. L., Briggs, N., Carvalho, F., and Boyd, P. W.: Decoding drivers of carbon flux attenuation in the oceanic biological pump, Nature, 633, 587–593, https://doi.org/10.1038/s41586-024-07850-x, 2024.
Briggs, N., Dall'Olmo, G., and Claustre, H.: Major role of particle fragmentation in regulating biological sequestration of CO2 by the oceans, Science, 367, 791–793, https://doi.org/10.1126/science.aay1790, 2020.
Brun, P., Stamieszkin, K., Visser, A. W., Licandro, P., Payne, M. R., and Kiørboe, T.: Climate change has altered zooplankton-fuelled carbon export in the North Atlantic, Nat. Ecol. Evol., 3, 416–423, https://doi.org/10.1038/s41559-018-0780-3, 2019.
Buesseler, K. O.: The decoupling of production and particulate export in the surface ocean, Global Biogeochem. Cy., 12, 297–310, https://doi.org/10.1029/97GB03366, 1998.
Buesseler, K. O., and Boyd, P. W.: Shedding light on processes that control particle export and flux attenuation in the twilight zone of the open ocean, Limnol. Oceanogr., 54, 1210–1232, https://doi.org/10.4319/lo.2009.54.4.1210, 2009.
Buesseler, K. O., Lamborg, C. H., Boyd, P. W., Lam, P. J., Trull, T. W., Bidigare, R. R., Bishop, J. K. B., Casciotti, K. L., Dehairs, F., Elskens, M., Honda, M., Karl, D. M., Siegel, D. A., Silver, M. W., Steinberg, D. K., Valdes, J., Van Mooy, B., and Wilson, S.: Revisiting Carbon Flux Through the Ocean's Twilight Zone, Science, 316, 567–570, https://doi.org/10.1126/science.1137959, 2007.
Buesseler, K. O., Boyd, P. W., Black, E. E., and Siegel, D. A.: Metrics that matter for assessing the ocean biological carbon pump, P. Natl. Acad. Sci. USA, 117, 9679–9687, https://doi.org/10.1073/pnas.1918114117, 2020.
Buesseler, K. O., Lamborg, C. H., Boyd, P. W., Lam, P. J., Trull, T. W., Bidigare, R. R., Bishop, J. K. B., Casciotti, K. L., Dehairs, F., Elskens, M., Honda, M., Karl, D. M., Siegel, D. A., Silver, M. W., Steinberg, D. K., Valdes, J., Van Mooy, B., and Wilson, S.: Revisiting Carbon Flux Through the Ocean's Twilight Zone, Science, 316, 567–570, https://doi.org/10.1126/science.1137959, 2007b-04-27.
Burd, A. B., Hansell, D. A., Steinberg, D. K., Anderson, T. R., Arístegui, J., Baltar, F., Beaupré, S. R., Buesseler, K. O., DeHairs, F., Jackson, G. A., Kadko, D. C., Koppelmann, R., Lampitt, R. S., Nagata, T., Reinthaler, T., Robinson, C., Robison, B. H., Tamburini, C., and Tanaka, T.: Assessing the apparent imbalance between geochemical and biochemical indicators of meso- and bathypelagic biological activity: What the @$?! is wrong with present calculations of carbon budgets?, Deep-Sea Res. Pt. II, 57, 1557–1571, https://doi.org/10.1016/j.dsr2.2010.02.022, 2010.
Cael, B. B. and Follows, M. J.: On the temperature dependence of oceanic export efficiency, Geophys. Res. Lett., 43, 5170–5175, https://doi.org/10.1002/2016GL068877, 2016.
Cael, B. B., Cavan, E. L., and Britten, G. L.: Reconciling the Size-Dependence of Marine Particle Sinking Speed, Geophys. Res. Lett., 48, e2020GL091771, https://doi.org/10.1029/2020GL091771, 2021.
Carr, S. D., Capet, X. J., Mcwilliams, J. C., Pennington, J. T., and Chavez, F. P.: The influence of diel vertical migration on zooplankton transport and recruitment in an upwelling region: estimates from a coupled behavioral-physical model, Fish. Oceanogr., 17, 1–15, https://doi.org/10.1111/j.1365-2419.2007.00447.x, 2008.
Ceballos-Romero, E., Le Moigne, F. A. C., Henson, S., Marsay, C. M., Sanders, R. J., García-Tenorio, R., and Villa-Alfageme, M.: Influence of bloom dynamics on Particle Export Efficiency in the North Atlantic: a comparative study of radioanalytical techniques and sediment traps, Mar. Chem., 186, 198–210, https://doi.org/10.1016/j.marchem.2016.10.001, 2016.
Claustre, H., Legendre, L., Boyd, P. W., and Levy, M.: The Oceans' Biological Carbon Pumps: Framework for a Research Observational Community Approach, Front. Mar. Sci., 8, 780052, https://doi.org/10.3389/fmars.2021.780052, 2021.
Clerc, C., Bopp, L., Benedetti, F., Knecht, N., Vogt, M., and Aumont, O.: Effects of Mesozooplankton Growth and Reproduction on Plankton and Organic Carbon Dynamics in a Marine Biogeochemical Model, Glob. Biogeochem. Cycles, 38, e2024GB008153, https://doi.org/10.1029/2024GB008153, 2024.
Dall'Olmo, G., Dingle, J., Polimene, L., Brewin, R. J. W., and Claustre, H.: Substantial energy input to the mesopelagic ecosystem from the seasonal mixed-layer pump, Nat. Geosci., 9, 820–823, https://doi.org/10.1038/ngeo2818, 2016.
de Boyer Montégut, C.: Mixed layer depth climatology computed with a density threshold criterion of 0.03 kg/m3 from 10 m depth value, https://doi.org/10.17882/91774, 2023.
de Melo Viríssimo, F., Martin, A. P., and Henson, S. A.: Influence of Seasonal Variability in Flux Attenuation on Global Organic Carbon Fluxes and Nutrient Distributions, Global Biogeochem. Cy., 36, e2021GB007101, https://doi.org/10.1029/2021GB007101, 2022.
de Melo Viríssimo, F., Martin, A. P., Henson, S. A., and Wilson, J. D.: Seasonality in Carbon Flux Attenuation Explains Spatial Variability in Transfer Efficiency, Geophys. Res. Lett., 51, e2023GL107050, https://doi.org/10.1029/2023GL107050, 2024.
DeVries, T. and Weber, T.: The export and fate of organic matter in the ocean: New constraints from combining satellite and oceanographic tracer observations, Global Biogeochem. Cy., 31, 535–555, https://doi.org/10.1002/2016GB005551, 2017.
Doléac, S., Lévy, M., El Hourany, R., and Bopp, L.: Toward more robust net primary production projections in the North Atlantic Ocean, Biogeosciences, 22, 841–862, https://doi.org/10.5194/bg-22-841-2025, 2025.
Doney, S. C., Mitchell, K. A., Henson, S. A., Cavan, E., DeVries, T., Gruber, N., Hauck, J., Mouw, C. B., Müller, J. D., and Primeau, F. W.: Observational and Numerical Modeling Constraints on the Global Ocean Biological Carbon Pump, Global Biogeochem. Cy., 38, e2024GB008156, https://doi.org/10.1029/2024GB008156, 2024.
Eppley, R. W. and Peterson, B. J.: Particulate organic matter flux and planktonic new production in the deep ocean, Nature, 282, 677–680, https://doi.org/10.1038/282677a0, 1979.
Fennel, K., Mattern, J. P., Doney, S. C., Bopp, L., Moore, A. M., Wang, B., and Yu, L.: Ocean biogeochemical modelling, Nat. Rev. Methods Primer, 2, 76, https://doi.org/10.1038/s43586-022-00154-2, 2022.
François, R., Honjo, S., Krishfield, R., and Manganini, S.: Factors controlling the flux of organic carbon to the bathypelagic zone of the ocean, Global Biogeochem. Cy., 16, https://doi.org/10.1029/2001GB001722, 2002.
Frenger, I., Landolfi, A., Kvale, K., Somes, C. J., Oschlies, A., Yao, W., and Koeve, W.: Misconceptions of the marine biological carbon pump in a changing climate: Thinking outside the “export” box, Glob. Change Biol., 30, e17124, https://doi.org/10.1111/gcb.17124, 2024.
Galí, M., Falls, M., Claustre, H., Aumont, O., and Bernardello, R.: Bridging the gaps between particulate backscattering measurements and modeled particulate organic carbon in the ocean, Biogeosciences, 19, 1245–1275, https://doi.org/10.5194/bg-19-1245-2022, 2022.
Galí, M., Orihuela-García, M. A., Ruprich-Robert, Y., Lapin, V., Sánchez-Urrea, M., Fontela, M., Llort, J., Sicardi, V., and Bernardello, R.: Convection injects labile particulate organic carbon to the deep ocean, Science Advances, in press, 2026.
García‐Martín, E. E., Davidson, K., Davis, C. E., Mahaffey, C., McNeill, S., Purdie, D. A., and Robinson, C.: Low Contribution of the Fast‐Sinking Particle Fraction to Total Plankton Metabolism in a Temperate Shelf Sea, Global Biogeochem. Cy., 35, e2021GB007015, https://doi.org/10.1029/2021GB007015, 2021.
Gardner, W. D., Chung, S. P., Richardson, M. J., and Walsh, I. D.: The oceanic mixed-layer pump, Deep-Sea Res. Pt. II, 42, 757–775, https://doi.org/10.1016/0967-0645(95)00037-Q, 1995.
Gasol, J. M., Del Giorgio, P. A., and Duarte, C. M.: Biomass distribution in marine planktonic communities, Limnol. Oceanogr., 42, 1353–1363, https://doi.org/10.4319/lo.1997.42.6.1353, 1997.
Gehlen, M., Bopp, L., Emprin, N., Aumont, O., Heinze, C., and Ragueneau, O.: Reconciling surface ocean productivity, export fluxes and sediment composition in a global biogeochemical ocean model, Biogeosciences, 3, 521–537, https://doi.org/10.5194/bg-3-521-2006, 2006.
Giering, S. L. C., Sanders, R., Lampitt, R. S., Anderson, T. R., Tamburini, C., Boutrif, M., Zubkov, M. V., Marsay, C. M., Henson, S. A., Saw, K., Cook, K., and Mayor, D. J.: Reconciliation of the carbon budget in the ocean's twilight zone, Nature, 507, 480–483, https://doi.org/10.1038/nature13123, 2014.
Giering, S. L. C., Sanders, R., Martin, A. P., Lindemann, C., Möller, K. O., Daniels, C. J., Mayor, D. J., and St. John, M. A.: High export via small particles before the onset of the N orth A tlantic spring bloom, J. Geophys. Res.-Ocean., 121, 6929–6945, https://doi.org/10.1002/2016JC012048, 2016.
Giering, S. L., Sanders, R., Martin, A. P., Henson, S. A., Riley, J. S., Marsay, C. M., and Johns, D. G.: Particle flux in the oceans: Challenging the steady state assumption, Global Biogeochem. Cy., 31, 159–171, https://doi.org/10.1002/2016GB005424, 2017.
Gorgues, T., Aumont, O., and Memery, L.: Simulated Changes in the Particulate Carbon Export Efficiency due to Diel Vertical Migration of Zooplankton in the North Atlantic, Geophys. Res. Lett., 46, 5387–5395, https://doi.org/10.1029/2018GL081748, 2019.
Guidi, L., Legendre, L., Reygondeau, G., Uitz, J., Stemmann, L., and Henson, S. A.: A new look at ocean carbon remineralization for estimating deepwater sequestration, Global Biogeochem. Cy., 29, 1044–1059, https://doi.org/10.1002/2014GB005063, 2015.
Henson, S., Bisson, K., Hammond, M. L., Martin, A., Mouw, C., and Yool, A.: Effect of sampling bias on global estimates of ocean carbon export, Environ. Res. Lett., 19, 024009, https://doi.org/10.1088/1748-9326/ad1e7f, 2024.
Henson, S. A., Sanders, R., and Madsen, E.: Global patterns in efficiency of particulate organic carbon export and transfer to the deep ocean, Global Biogeochem. Cy., 26, GB1028, https://doi.org/10.1029/2011GB004099, 2012.
Henson, S. A., Yool, A., and Sanders, R.: Variability in efficiency of particulate organic carbon export: A model study, Global Biogeochem. Cy., 29, 33–45, https://doi.org/10.1002/2014GB004965, 2015.
Henson, S. A., Laufkötter, C., Leung, S., Giering, S. L. C., Palevsky, H. I., and Cavan, E. L.: Uncertain response of ocean biological carbon export in a changing world, Nat. Geosci., 15, 248–254, https://doi.org/10.1038/s41561-022-00927-0, 2022.
Hernández-León, S., Calles, S., and Fernández De Puelles, M. L.: The estimation of metabolism in the mesopelagic zone: Disentangling deep-sea zooplankton respiration, Prog. Oceanogr., 178, 102163, https://doi.org/10.1016/j.pocean.2019.102163, 2019.
Herndl, G. J., Bayer, B., Baltar, F., and Reinthaler, T.: Prokaryotic Life in the Deep Ocean's Water Column, Annu. Rev. Mar. Sci., 15, 461–483, https://doi.org/10.1146/annurev-marine-032122-115655, 2023.
Honjo, S.: Material fluxes and modes of sedimentation in the mesopelagic and bathypelagic zones, J. Mar. Res., 38, https://elischolar.library.yale.edu/journal_of_marine_research/1499 (last access: 16 February 2026), 1980.
Iversen, M. H. and Lampitt, R. S.: Size does not matter after all: No evidence for a size-sinking relationship for marine snow, Prog. Oceanogr., 189, 102445, https://doi.org/10.1016/j.pocean.2020.102445, 2020.
Jackson, G. A.: Flux feeding as a mechanism for zooplankton grazing and its implications for vertical particulate flux 1, Limnol. Oceanogr., 38, 1328–1331, https://doi.org/10.4319/lo.1993.38.6.1328, 1993.
Jackson, G. A. and Burd, A. B.: Simulating aggregate dynamics in ocean biogeochemical models, Prog. Oceanogr., 133, 55–65, https://doi.org/10.1016/j.pocean.2014.08.014, 2015.
Jiao, N., Herndl, G. J., Hansell, D. A., Benner, R., Kattner, G., Wilhelm, S. W., Kirchman, D. L., Weinbauer, M. G., Luo, T., Chen, F., and Azam, F.: Microbial production of recalcitrant dissolved organic matter: long-term carbon storage in the global ocean, Nat. Rev. Microbiol., 8, 593–599, https://doi.org/10.1038/nrmicro2386, 2010.
Johnson, W. M., Longnecker, K., Kido Soule, M. C., Arnold, W. A., Bhatia, M. P., Hallam, S. J., Van Mooy, B. A. S., and Kujawinski, E. B.: Metabolite composition of sinking particles differs from surface suspended particles across a latitudinal transect in the South Atlantic, Limnol. Oceanogr., 65, 111–127, https://doi.org/10.1002/lno.11255, 2020.
Jónasdóttir, S. H., Visser, A. W., Richardson, K., and Heath, M. R.: Seasonal copepod lipid pump promotes carbon sequestration in the deep North Atlantic, P. Natl. Acad. Sci. USA, 112, 12122–12126, https://doi.org/10.1073/pnas.1512110112, 2015.
Kharbush, J. J., Close, H. G., Van Mooy, B. A. S., Arnosti, C., Smittenberg, R. H., Le Moigne, F. A. C., Mollenhauer, G., Scholz-Böttcher, B., Obreht, I., Koch, B. P., Becker, K. W., Iversen, M. H., and Mohr, W.: Particulate Organic Carbon Deconstructed: Molecular and Chemical Composition of Particulate Organic Carbon in the Ocean, Front. Mar. Sci., 7, 518, https://doi.org/10.3389/fmars.2020.00518, 2020.
Kiørboe, T.: How zooplankton feed: mechanisms, traits and trade-offs, Biol. Rev., 86, 311–339, https://doi.org/10.1111/j.1469-185X.2010.00148.x, 2011.
Kiørboe, T., Tang, K., Grossart, H.-P., and Ploug, H.: Dynamics of Microbial Communities on Marine Snow Aggregates: Colonization, Growth, Detachment, and Grazing Mortality of Attached Bacteria, Appl. Environ. Microbiol., 69, 3036–3047, https://doi.org/10.1128/AEM.69.6.3036-3047.2003, 2003.
Kobayashi, S., Ota, Y., Harada, Y., Ebita, A., Moriya, M., Onoda, H., Onogi, K., Kamahori, H., Kobayashi, C., Endo, H., Miyaoka, K., and Takahashi, K.: The JRA-55 Reanalysis: General Specifications and Basic Characteristics, J. Meteorol. Soc. Jpn. Ser II, 93, 5–48, https://doi.org/10.2151/jmsj.2015-001, 2015.
Koestner, D., Stramski, D., and Reynolds, R. A.: Improved multivariable algorithms for estimating oceanic particulate organic carbon concentration from optical backscattering and chlorophyll-a measurements, Front. Mar. Sci., 10, 1197953, https://doi.org/10.3389/fmars.2023.1197953, 2024.
Kulk, G., Platt, T., Dingle, J., Jackson, T., Jönsson, B., Bouman, H., Babin, M., Brewin, R., Doblin, M., Estrada, M., Figueiras, F., Furuya, K., González-Benítez, N., Gudfinnsson, H., Gudmundsson, K., Huang, B., Isada, T., Kovač, Ž., Lutz, V., Marañón, E., Raman, M., Richardson, K., Rozema, P., Poll, W., Segura, V., Tilstone, G., Uitz, J., Dongen-Vogels, V., Yoshikawa, T., and Sathyendranath, S.: Primary Production, an Index of Climate Change in the Ocean: Satellite-Based Estimates over Two Decades, Remote Sens., 12, 826, https://doi.org/10.3390/rs12050826, 2020.
Kwon, E. Y., Primeau, F., and Sarmiento, J. L.: The impact of remineralization depth on the air–sea carbon balance, Nat. Geosci., 2, 630–635, https://doi.org/10.1038/ngeo612, 2009.
Lacour, L., Briggs, N., Claustre, H., Ardyna, M., and Dall'Olmo, G.: The Intraseasonal Dynamics of the Mixed Layer Pump in the Subpolar North Atlantic Ocean: A Biogeochemical-Argo Float Approach, Global Biogeochem. Cy., 33, 266–281, https://doi.org/10.1029/2018GB005997, 2019.
Lacour, L., Llort, J., Briggs, N., Strutton, P. G., and Boyd, P. W.: Seasonality of downward carbon export in the Pacific Southern Ocean revealed by multi-year robotic observations, Nat. Commun., 14, 1278, https://doi.org/10.1038/s41467-023-36954-7, 2023.
Laget, M., Drago, L., Panaïotis, T., Kiko, R., Stemmann, L., Rogge, A., Llopis-Monferrer, N., Leynaert, A., Irisson, J.-O., and Biard, T.: Global census of the significance of giant mesopelagic protists to the marine carbon and silicon cycles, Nat. Commun., 15, 3341, https://doi.org/10.1038/s41467-024-47651-4, 2024.
Lampitt, R. S., Briggs, N., Cael, B. B., Espinola, B., Hélaouët, P., Henson, S. A., Norrbin, F., Pebody, C. A., and Smeed, D.: Deep ocean particle flux in the Northeast Atlantic over the past 30 years: carbon sequestration is controlled by ecosystem structure in the upper ocean, Front. Earth Sci., 11, 1176196, https://doi.org/10.3389/feart.2023.1176196, 2023.
Le Moigne, F. A. C., Villa-Alfageme, M., Sanders, R. J., Marsay, C., Henson, S., and García-Tenorio, R.: Export of organic carbon and biominerals derived from 234Th and 210Po at the Porcupine Abyssal Plain, Deep Sea Res. Part Oceanogr. Res. Pap., 72, 88–101, https://doi.org/10.1016/j.dsr.2012.10.010, 2013.
Le Quéré, C., Andrew, R. M., Canadell, J. G., Sitch, S., Korsbakken, J. I., Peters, G. P., Manning, A. C., Boden, T. A., Tans, P. P., Houghton, R. A., Keeling, R. F., Alin, S., Andrews, O. D., Anthoni, P., Barbero, L., Bopp, L., Chevallier, F., Chini, L. P., Ciais, P., Currie, K., Delire, C., Doney, S. C., Friedlingstein, P., Gkritzalis, T., Harris, I., Hauck, J., Haverd, V., Hoppema, M., Klein Goldewijk, K., Jain, A. K., Kato, E., Körtzinger, A., Landschützer, P., Lefèvre, N., Lenton, A., Lienert, S., Lombardozzi, D., Melton, J. R., Metzl, N., Millero, F., Monteiro, P. M. S., Munro, D. R., Nabel, J. E. M. S., Nakaoka, S., O'Brien, K., Olsen, A., Omar, A. M., Ono, T., Pierrot, D., Poulter, B., Rödenbeck, C., Salisbury, J., Schuster, U., Schwinger, J., Séférian, R., Skjelvan, I., Stocker, B. D., Sutton, A. J., Takahashi, T., Tian, H., Tilbrook, B., Van Der Laan-Luijkx, I. T., Van Der Werf, G. R., Viovy, N., Walker, A. P., Wiltshire, A. J., and Zaehle, S.: Global Carbon Budget 2016, Earth Syst. Sci. Data, 8, 605–649, https://doi.org/10.5194/essd-8-605-2016, 2016.
Legendre, L.: Jigsaw puzzle of the interwoven biologically-driven ocean carbon pumps, Prog. Oceanogr., 229, 103338, https://doi.org/10.1016/j.pocean.2024.103338, 2024.
Lemaitre, N., Planquette, H., Planchon, F., Sarthou, G., Jacquet, S., García-Ibáñez, M. I., Gourain, A., Cheize, M., Monin, L., André, L., Laha, P., Terryn, H., and Dehairs, F.: Particulate barium tracing of significant mesopelagic carbon remineralisation in the North Atlantic, Biogeosciences, 15, 2289–2307, https://doi.org/10.5194/bg-15-2289-2018, 2018.
Levy, M., Bopp, L., Karleskind, P., Resplandy, L., Ethe, C., and Pinsard, F.: Physical pathways for carbon transfers between the surface mixed layer and the ocean interior, Global Biogeochem. Cy., 27, 1001–1012, https://doi.org/10.1002/gbc.20092, 2013.
Lindeman, R. L.: The Trophic-Dynamic Aspect of Ecology, Bull. Math. Biol., 53, 167–191, https://doi.org/10.1007/BF02464428, 1942.
Lomas, M. W., Steinberg, D. K., Dickey, T., Carlson, C. A., Nelson, N. B., Condon, R. H., and Bates, N. R.: Increased ocean carbon export in the Sargasso Sea linked to climate variability is countered by its enhanced mesopelagic attenuation, Biogeosciences, 7, 57–70, https://doi.org/10.5194/bg-7-57-2010, 2010.
Madec, G.: NEMO ocean engine, Institut Pierre-Simon Laplace (IPSL), France, Institut Pierre-Simon Laplace (IPSL), Note du Pole de Modélisation 27, 300 pp., https://nora.nerc.ac.uk/id/eprint/164324 (last access: 16 February 2026), 2008.
Margalef, R.: Life-forms of phytoplankton as survival alternatives in an unstable environment, Oceanol. Acta, 1, 493–509, 1978.
Marinov, I., Gnanadesikan, A., Sarmiento, J. L., Toggweiler, J. R., Follows, M., and Mignone, B. K.: Impact of oceanic circulation on biological carbon storage in the ocean and atmospheric pCO2, Global Biogeochem. Cy., 22, GB3007, https://doi.org/10.1029/2007GB002958, 2008b.
Marsay, C. M., Sanders, R. J., Henson, S. A., Pabortsava, K., Achterberg, E. P., and Lampitt, R. S.: Attenuation of sinking particulate organic carbon flux through the mesopelagic ocean, P. Natl. Acad. Sci. USA, 112, 1089–1094, https://doi.org/10.1073/pnas.1415311112, 2015.
Martin, J. H., Knauer, G. A., Karl, D. M., and Broenkow, W. W.: VERTEX: carbon cycling in the northeast Pacific, Deep-Sea Res. Pt. A, 34, 267–285, https://doi.org/10.1016/0198-0149(87)90086-0, 1987.
Mayor, D. J., Sanders, R., Giering, S. L. C., and Anderson, T. R.: Microbial gardening in the ocean's twilight zone: Detritivorous metazoans benefit from fragmenting, rather than ingesting, sinking detritus: Fragmentation of refractory detritus by zooplankton beneath the euphotic zone stimulates the harvestable production of labile and nutritious microbial biomass, BioEssays, 36, 1132–1137, https://doi.org/10.1002/bies.201400100, 2014.
Mayor, D. J., Gentleman, W. C., and Anderson, T. R.: Ocean carbon sequestration: Particle fragmentation by copepods as a significant unrecognised factor?: Explicitly representing the role of copepods in biogeochemical models may fundamentally improve understanding of future ocean carbon storage, BioEssays, 42, 2000149, https://doi.org/10.1002/bies.202000149, 2020.
Mouw, C. B., Barnett, A., McKinley, G. A., Gloege, L., and Pilcher, D.: Phytoplankton size impact on export flux in the global ocean, Global Biogeochem. Cy., 30, 1542–1562, https://doi.org/10.1002/2015GB005355, 2016.
NEMO TOP Working: TOP – Tracers in Ocean Paradigm – The NEMO Tracers engine, Zenodo, https://doi.org/10.5281/ZENODO.1471700, 2018.
Neukermans, G., Bach, L. T., Butterley, A., Sun, Q., Claustre, H., and Fournier, G. R.: Quantitative and mechanistic understanding of the open ocean carbonate pump – perspectives for remote sensing and autonomous in situ observation, Earth-Sci. Rev., 239, 104359, https://doi.org/10.1016/j.earscirev.2023.104359, 2023.
Oliver, S., Yool, A., Henson, S. A., and Martin, A. P.: Where and When the Mesopelagic Carbon Budget Balances, if at All, Geophys. Res. Lett., 52, e2024GL111667, https://doi.org/10.1029/2024GL111667, 2025.
Ono, S., Ennyu, A., Najjar, R. G., and Bates, N. R.: Shallow remineralization in the Sargasso Sea estimated from seasonal variations in oxygen, dissolved inorganic carbon and nitrate, Deep-Sea Res. Pt. II, 48, 1567–1582, https://doi.org/10.1016/S0967-0645(00)00154-5, 2001.
Palevsky, H. I. and Doney, S. C.: How Choice of Depth Horizon Influences the Estimated Spatial Patterns and Global Magnitude of Ocean Carbon Export Flux, Geophys. Res. Lett., 45, 4171–4179, https://doi.org/10.1029/2017GL076498, 2018.
Palevsky, H. I. and Doney, S. C.: Sensitivity of 21st Century Ocean Carbon Export Flux Projections to the Choice of Export Depth Horizon, Global Biogeochem. Cy., 35, e2020GB006790, https://doi.org/10.1029/2020GB006790, 2021.
Pomeroy, L. R.: The Ocean's Food Web, A Changing Paradigm, BioScience, 24, 499–504, https://doi.org/10.2307/1296885, 1974.
Ricour, F., Guidi, L., Gehlen, M., DeVries, T., and Legendre, L.: Century-scale carbon sequestration flux throughout the ocean by the biological pump, Nat. Geosci., 16, 1105–1113, https://doi.org/10.1038/s41561-023-01318-9, 2023.
Rodgers, K. B., Aumont, O., Toyama, K., Resplandy, L., Ishii, M., Nakano, T., Sasano, D., Bianchi, D., and Yamaguchi, R.: Low-latitude mesopelagic nutrient recycling controls productivity and export, Nature, 632, 802–807, https://doi.org/10.1038/s41586-024-07779-1, 2024.
Sathyendranath, S., Brewin, R., Brockmann, C., Brotas, V., Calton, B., Chuprin, A., Cipollini, P., Couto, A., Dingle, J., Doerffer, R., Donlon, C., Dowell, M., Farman, A., Grant, M., Groom, S., Horseman, A., Jackson, T., Krasemann, H., Lavender, S., Martinez-Vicente, V., Mazeran, C., Mélin, F., Moore, T., Müller, D., Regner, P., Roy, S., Steele, C., Steinmetz, F., Swinton, J., Taberner, M., Thompson, A., Valente, A., Zühlke, M., Brando, V., Feng, H., Feldman, G., Franz, B., Frouin, R., Gould, R., Hooker, S., Kahru, M., Kratzer, S., Mitchell, B., Muller-Karger, F., Sosik, H., Voss, K., Werdell, J., and Platt, T.: An Ocean-Colour Time Series for Use in Climate Studies: The Experience of the Ocean-Colour Climate Change Initiative (OC-CCI), Sensors, 19, 4285, https://doi.org/10.3390/s19194285, 2019.
Sauzède, R., Claustre, H., Uitz, J., Jamet, C., Dall'Olmo, G., D'Ortenzio, F., Gentili, B., Poteau, A., and Schmechtig, C.: A neural network-based method for merging ocean color and Argo data to extend surface bio-optical properties to depth: Retrieval of the particulate backscattering coefficient, J. Geophys. Res.-Ocean., 121, 2552–2571, https://doi.org/10.1002/2015JC011408, 2016.
Siegel, D. A., DeVries, T., Cetinić, I., and Bisson, K. M.: Quantifying the Ocean's Biological Pump and Its Carbon Cycle Impacts on Global Scales, Annu. Rev. Mar. Sci., 15, 329–356, https://doi.org/10.1146/annurev-marine-040722-115226, 2023.
Steinberg, D. K. and Landry, M. R.: Zooplankton and the Ocean Carbon Cycle, Annu. Rev. Mar. Sci., 9, 413–444, https://doi.org/10.1146/annurev-marine-010814-015924, 2016.
Stemmann, L. and Boss, E.: Plankton and Particle Size and Packaging: From Determining Optical Properties to Driving the Biological Pump, Annu. Rev. Mar. Sci., 4, 263–290, https://doi.org/10.1146/annurev-marine-120710-100853, 2012.
Stemmann, L., Jackson, G. A., and Ianson, D.: A vertical model of particle size distributions and fluxes in the midwater column that includes biological and physical processes – Part I: model formulation, Deep-Sea Res. Pt. A, 51, 865–884, https://doi.org/10.1016/j.dsr.2004.03.001, 7/2004b.
Stemmann, L., Jackson, G. A., and Gorsky, G.: A vertical model of particle size distributions and fluxes in the midwater column that includes biological and physical processes – Part II: application to a three year survey in the NW Mediterranean Sea, Deep-Sea Res. Pt. A, 51, 885–908, https://doi.org/10.1016/j.dsr.2004.03.002, 7/2004a.
Stukel, M. R., Ohman, M. D., Kelly, T. B., and Biard, T.: The Roles of Suspension-Feeding and Flux-Feeding Zooplankton as Gatekeepers of Particle Flux Into the Mesopelagic Ocean in the Northeast Pacific, Front. Mar. Sci., 6, 397, https://doi.org/10.3389/fmars.2019.00397, 2019.
Sverdrup, H. U.: On Conditions for the Vernal Blooming of Phytoplankton, ICES J. Mar. Sci., 18, 287–295, https://doi.org/10.1093/icesjms/18.3.287, 1953.
Takeuchi, M., Doubell, M. J., Jackson, G. A., Yukawa, M., Sagara, Y., and Yamazaki, H.: Turbulence mediates marine aggregate formation and destruction in the upper ocean, Sci. Rep., 9, 16280, https://doi.org/10.1038/s41598-019-52470-5, 2019.
Tsujino, H., Urakawa, S., Nakano, H., Small, R. J., Kim, W. M., Yeager, S. G., Danabasoglu, G., Suzuki, T., Bamber, J. L., Bentsen, M., Böning, C. W., Bozec, A., Chassignet, E. P., Curchitser, E., Boeira Dias, F., Durack, P. J., Griffies, S. M., Harada, Y., Ilicak, M., Josey, S. A., Kobayashi, C., Kobayashi, S., Komuro, Y., Large, W. G., Le Sommer, J., Marsland, S. J., Masina, S., Scheinert, M., Tomita, H., Valdivieso, M., and Yamazaki, D.: JRA-55 based surface dataset for driving ocean–sea-ice models (JRA55-do), Ocean Model., 130, 79–139, https://doi.org/10.1016/j.ocemod.2018.07.002, 2018.
Uchimiya, M., Fukuda, H., Wakita, M., Kitamura, M., Kawakami, H., Honda, M. C., Ogawa, H., and Nagata, T.: Balancing organic carbon supply and consumption in the ocean's interior: Evidence from repeated biogeochemical observations conducted in the subarctic and subtropical western North Pacific, Limnol. Oceanogr., 63, 2015–2027, https://doi.org/10.1002/lno.10821, 2018.
Uitz, J., Claustre, H., Morel, A., and Hooker, S. B.: Vertical distribution of phytoplankton communities in open ocean: An assessment based on surface chlorophyll, J. Geophys. Res.-Ocean., 111, 2005JC003207, https://doi.org/10.1029/2005JC003207, 2006.
Uitz, J. U., Huot, Y., Bruyant, F., Babin, M., and Claustre, H.: Relating phytoplankton photophysiological properties to community structure on large scales, Limnol. Oceanogr., 53, 614–630, https://doi.org/10.4319/lo.2008.53.2.0614, 2008.
Vancoppenolle, M., Fichefet, T., Goosse, H., Bouillon, S., Madec, G., and Maqueda, M. A. M.: Simulating the mass balance and salinity of Arctic and Antarctic sea ice. 1. Model description and validation, Ocean Model., 27, 33–53, https://doi.org/10.1016/j.ocemod.2008.10.005, 2009.
Villa-Alfageme, M., De Soto, F. C., Ceballos, E., Giering, S. L. C., Le Moigne, F. A. C., Henson, S., Mas, J. L., and Sanders, R. J.: Geographical, seasonal, and depth variation in sinking particle speeds in the North Atlantic, Geophys. Res. Lett., 43, 8609–8616, https://doi.org/10.1002/2016GL069233, 2016.
Volk, T. and Hoffert, M. I.: Ocean Carbon Pumps: Analysis of Relative Strengths and Efficiencies in Ocean-Driven Atmospheric CO2 Changes, in: Geophysical Monograph Series, edited by: Sundquist, E. T. and Broecker, W. S., American Geophysical Union, Washington, DC, 99–110, https://doi.org/10.1029/GM032p0099, 1985.
Walker, B. D., Beaupré, S. R., Guilderson, T. P., McCarthy, M. D., and Druffel, E. R. M.: Pacific carbon cycling constrained by organic matter size, age and composition relationships, Nat. Geosci., 9, 888–891, https://doi.org/10.1038/ngeo2830, 2016.
Walker, S. L. and Palevsky, H. I.: Ocean carbon export flux projections in CMIP6 Earth System Models across multiple export depth horizons, Global Biogeochem. Cycles, 39, e2024GB008329, https://doi.org/10.1029/2024GB008329, 2025.
Wang, B. and Fennel, K.: Biogeochemical-Argo data suggest significant contributions of small particles to the vertical carbon flux in the subpolar North Atlantic, Limnol. Oceanogr., 67, 2405–2417, https://doi.org/10.1002/lno.12209, 2022.
Wang, B. and Fennel, K.: Distinct sources of uncertainty in simulations of the ocean biological carbon pump at different depths, Commun. Earth Environ., 5, 395, https://doi.org/10.1038/s43247-024-01561-x, 2024.
Weber, T., Cram, J. A., Leung, S. W., DeVries, T., and Deutsch, C.: Deep ocean nutrients imply large latitudinal variation in particle transfer efficiency, P. Natl. Acad. Sci. USA, 113, 8606–8611, https://doi.org/10.1073/pnas.1604414113, 2016.
Wilson, J. D., Andrews, O., Katavouta, A., de Melo Viríssimo, F., Death, R. M., Adloff, M., Baker, C. A., Blackledge, B., Goldsworth, F. W., Kennedy-Asser, A. T., Liu, Q., Sieradzan, K. R., Vosper, E., and Ying, R.: The biological carbon pump in CMIP6 models: 21st century trends and uncertainties, P. Natl. Acad. Sci. USA, 119, e2204369119, https://doi.org/10.1073/pnas.2204369119, 2022.