the Creative Commons Attribution 4.0 License.
the Creative Commons Attribution 4.0 License.
 | 23 Jun 2026
Biochemical characteristics of the sea surface microlayer in the central Baltic Sea and potential signatures of cyanobacterial blooms
Theresa Barthelmeß
Bita Sabbaghzadeh
Anja Engel
The sea surface microlayer (SML) forms the < 1 mm thin ocean's boundary with the atmosphere and plays a critical role in mediating air–sea gas exchange and biogeochemical cycling. However, the biological processes shaping its molecular composition remain insufficiently understood. During a research cruise in the central Baltic Sea (Eastern Gotland Basin), we investigated how phytoplankton, including cyanobacteria, influence the biomolecular composition of the SML. Although no major bloom was detected, distinct shifts in phytoplankton composition were observed, leading to pronounced differences in biomolecular characteristics between the SML and underlying water (ULW), and between conditions characterized by high and low cyanobacteria abundance. While SML enrichment patterns and carbohydrate concentrations were comparable to those previously reported for the Western Baltic Sea, concentrations of total amino acids (TAA) and surfactants were substantially higher in this study and under cyanobacteria-dominated phytoplankton conditions. Distinct molecular signatures were associated with different phytoplankton size classes. During periods of high abundance of pico- and nanophytoplankton (P/NP; Synechococcus-dominated), the SML was characterized by elevated surfactant and total combined carbohydrate (TCCHO) concentrations. Furthermore, Synechococcus sp. co-varied with the non-protein amino acid γ-aminobutyric acid (GABA), particularly under high abundance of P/NP. This suggests that the production of surface-active organic matter may be linked to Synechococcus sp. In contrast, under high abundance of microphytoplankton (MP; filamentous and colonial cyanobacteria), particulate amino acids > 20 µm (PAA > 20 µm) and particulate combined carbohydrates > 20 µm (PCCHO > 20 µm) were elevated in the ULW, mirroring particulate organic carbon > 20 µm (POC > 20 µm) and filamentous/colonial cyanobacterial biomass patterns. The significant correlation between MP biomass and POC > 20 µm suggests that the particulate organic carbon pool was largely derived from filamentous/colonial cyanobacteria, even in the absence of a distinct bloom. Together, our results imply that phytoplankton size structure and taxonomy exert distinct biomolecular imprints on SML chemistry in the Central Baltic Sea. The contrasting roles of filamentous/colonial cyanobacteria (proteinaceous signatures) and Synechococcus sp. (carbohydrate/surface-activity imprint) imply community-dependent modulation of surface activity and indicate that future changes in biodiversity potentially impacts air–sea gas exchange in the ocean.
- Article
(3753 KB) - Full-text XML
-
Supplement
(1296 KB) - BibTeX
- EndNote


The sea surface microlayer (SML) forms the ocean's uppermost boundary, directly linking the hydrosphere and atmosphere. The SML covers up to 70 % of Earth's surface (Wurl et al., 2017), and plays a pivotal role in global biogeochemical processes (Engel et al., 2017) despite its narrow vertical extent, typically ranging from 50 to 1000 µm (Zhang et al., 2003; Cunliffe et al., 2013). Positioned at the air–sea interface, the SML modulates the exchange of climate-relevant gases such as dimethyl sulphide (DMS), carbon dioxide (CO2), and methane (CH4) (Engel et al., 2017), thereby influencing key climate processes (Wurl et al., 2017). These biogeochemical interactions are largely governed by the enrichment of surface-active biomolecules derived from biological production and organic matter cycling (Cunliffe et al., 2013; Thornton, 2014; Engel and Galgani, 2016; Engel et al., 2017; Wurl et al., 2017).
Phytoplankton are the primary source of dissolved organic matter (DOM) in the ocean and contribute substantially to the organic matter enrichment in the SML. Through exudation, cell breakage, and lysis, phytoplankton release a wide range of organic compounds, including lipids, proteins, amino acids, and carbohydrates, which shape the biochemical composition and dynamics of the SML (Parrish, 1998; Thornton, 2014; Galgani and Engel, 2016; Engel et al., 2018). Transparent exopolymer particles (TEP) and Coomassie stainable particles (CSP) constitute particulate fractions of extracellular polymeric substances (EPS) released by phyto- and bacterioplankton, forming polydiameric organic matrices that vary in size, composition, and structure. These particles contribute to the gelatinous and cohesive nature of the SML (Cunliffe and Murrell, 2009; Dreshchinskii and Engel, 2017).
Among the organic compounds accumulating in the SML are surface-active agents (surfactants). The accumulation of surface-active organic matter affects gas transfer velocity (k) by altering its hydrodynamic properties. Surfactants can reduce k by forming viscous films that suppress small-scale turbulence and dampen capillary waves (Frew et al., 2004; Jenkinson et al., 2018). A large-scale oceanic study in the Atlantic demonstrated that surfactant enrichment can significantly reduce CO2 exchange rates, even under moderate to high wind conditions (Sabbaghzadeh et al., 2017). Thus, air–sea gas transfer is highly sensitive to the presence of surfactants at the ocean's surface (Schmidt and Schneider, 2011; Pereira et al., 2018). Surfactant accumulation is particularly pronounced in regions of elevated primary production and has been associated with phytoplankton blooms, grazing, bacterial degradation (Zutić et al., 1981; Kujawinski et al., 2002; Tsai and Liu, 2003; Satpute et al., 2010), and photochemical degradation (Rickard et al., 2022). A recent meta-analysis revealed that pronounced enrichment of organic matter in the SML is rather uncommon, while nitrogen-containing biomolecules, including amino acids, preferentially accumulate in the SML (Silva et al., 2026). During a diatom culture experiment it has been shown that both carbohydrate-rich gels (TEP) and proteinaceous gels (CSP) were enriched in the SML, with the latter showing five times higher abundances in the SML (Galgani and Engel, 2013). This distinct enrichment of proteinaceous material, which is typically more amphiphilic and surface-active (Cosović and Vojvodić, 1998; Laß et al., 2013; Laß and Friedrichs, 2011, Barthelmeß and Engel, 2022), could contribute disproportionately to physicochemical properties of the SML. Phytoplankton blooms shape the microbial community inhabiting the SML, the bacterioneuston, through the release of organic substrates that sustain heterotrophic metabolism (Cunliffe et al., 2013; Taylor et al., 2014). During microbial degradation of phytoplankton exudates, high-molecular-weight polymers can be converted into smaller, more amphiphilic molecules. Additionally, bacterioneuston taxa can produce biosurfactants such as glycolipids and lipopeptides that directly lower surface tension (Abraham et al., 1998; Cunliffe et al., 2013; Kurata et al., 2016; Engel et al., 2017). While mesocosm and incubation experiments have linked phytoplankton blooms to enhanced surfactant concentrations and the accumulation of fresh organic material in the SML (Žutić et al., 1981; Galgani and Engel, 2013, Bibi et al., 2025), field observations remain limited and are restricted to coarse temporal and spatial resolution (Rolff et al., 2007; Kahru et al., 2025). As a result, the coupling between phytoplankton bloom dynamics and the release of surface-active biomolecules in natural systems is still poorly constrained.
In most studies focusing on phytoplankton bloom dynamics, fresh organic matter production is attributed to phytoplankton communities that dominate in terms of biomass and abundance (Ploug, 2008; Berg et al., 2018). Bibi et al. (2025) explicitly focused on the SML and attributed the release of fresh organic matter and surfactants to blooming phytoplankton taxa, dominating in abundance. Despite the recognized influence of phytoplankton production on organic matter composition in the SML (Wurl et al., 2011; Galgani and Engel, 2013), little is known about how specific phytoplankton species alter the molecular and biogeochemical composition of the SML under natural conditions. Accordingly, we address in our study how dominating, bloom-forming taxa influence the composition of the SML, while acknowledging that less abundant species potentially further contribute.
The semi-enclosed Baltic Sea represents an ideal system to explore the coupled dynamics of phytoplankton blooms, the release of surface-active biomolecules, and the resulting changes in the molecular composition of the SML due to its pronounced spatial and seasonal variability in nutrient inputs, phytoplankton productivity, and community composition (Murray et al., 2019). It is particularly susceptible to extensive summer blooms of filamentous cyanobacteria, promoted by warming waters, enhanced stratification, and low nitrogen-to-phosphorus ratios resulting from eutrophication and widespread anoxia (Hajdu et al., 2007; Thornton, 2018). Additionally, filamentous cyanobacteria require an optimal salinity range of 3.8–11.5 PSU (Wasmund, 1997), making them a characteristic feature of the Central Baltic Sea in contrast to the more saline Western Baltic Sea (> 12 PSU; Lennartz et al., 2014). Climate-driven changes in stratification are expected to further intensify the occurrence and persistence of such blooms (Paerl and Paul, 2012). Filamentous cyanobacteria in the Baltic Sea are diazotrophic, i.e. capable of fixing atmospheric nitrogen, and dominate the summer phytoplankton biomass when dissolved nitrogen is depleted (Kahru and Elmgren, 2014; Munkes et al., 2021). The bloom-forming taxa, Nodularia spumigena, Aphanizomenon sp., and Dolichospermum spp., form extensive surface accumulations across the Central Baltic Sea, including the Eastern Gotland Basin, typically peaking between July and August (Wasmund, 1997; Kahru and Elmgren, 2014; Karlson et al., 2015, Karlson et al., 2022). Their filamentous morphology is sustained by specific filament-forming proteins (Springstein et al., 2020), and protein-rich EPS, including CSP, have been observed in Nodularia spumigena cultures (Endres et al., 2013; Zhi et al., 2023), suggesting a potentially significant contribution to the extracellular amino acid fraction, which constitutes to the broader extracellular organic matter pool. Laboratory and field studies suggest that cyanobacteria produce EPS and glycolipids with pronounced surface activity, facilitating microlayer film formation and altering interfacial properties (De Philippis and Vincenzini, 1998), while experimental evidence further highlights the rapid turnover of phytoplankton bloom-derived organic matter by heterotrophic bacteria. During a filamentous cyanobacterial bloom in the Gulf of Finland (Baltic Sea), heterotrophic bacteria were shown to utilize approximately 25 %–55 % of dissolved organic carbon (DOC) released from the plankton community, with more than half of the accumulated DOC degraded within seven days (Hoikkala et al., 2016). This suggests that a substantial fraction of cyanobacteria-derived compounds entering the SML is short-lived, unless stabilized through transformation or incorporation into particulate or gel-like structures.
On the one hand, the release of such compounds can result in visible surface slicks, which locally modify near-surface physical processes (Wurl et al., 2018, Mustaffa et al., 2020). Under low-wind conditions in the Baltic Sea, the SML rapidly reorganizes into slick-like, polymer- and particle-rich states, consistent with enhanced surface activity during bloom periods (Stolle et al., 2010). During such periods, particulate organic carbon can contribute up to 55 % of the surfactant pool (Gašparović and Ćosović, 2003). Seasonal records further indicate that surfactant concentrations in the Western Baltic Sea peak during summer months following the spring bloom (Laß et al., 2013). On the other hand, biochemical studies in the Baltic Sea have shown that the SML is enriched in carbohydrates and amino compounds relative to the underlying water (Van Pinxteren et al., 2012). Time-series data from the coastal Boknis Eck station in the Western Baltic Sea further demonstrated recurring enrichment of carbohydrates, amino acids, TEP and CSP in the SML during spring (Dreshchinskii and Engel, 2017). Phytoplankton-derived biopolymers, including amino acid- and carbohydrate-like components, are thus potential key contributors to surface activity in this region, and are characterized by short turnover times and diel variability typical of fresh phytoplankton exudates (Van Pinxteren et al., 2012; Barthelmeß and Engel, 2022).
Taken together, cyanobacteria can represent major producers of extracellular organic matter, including amino acids, carbohydrates, lipids, and amphiphilic metabolites, that may substantially influence the surfactant pool in the Baltic Sea. This study aims to address the current knowledge gap regarding the role of cyanobacteria in shaping the biomolecular composition of the SML. Using a Neuston catamaran equipped with a net to sample the upper 20 cm (Surface) and an additional net to sample the underlying water (ULW-Net, at 1 m depth), we collected microphytoplankton (MP; cell size > 20 µm) as well as accompanying samples to determine the particulate organic matter composition (> 20 µm). SML water samples for characterizing pico- and nanophytoplankton abundances (P/NP; cell size ≤ 20 µm) as well as the total organic matter composition, including the dissolved and particulate fraction, were collected by applying specialized samplers, such as the glass plate (Harvey and Burzell, 1972) and the Garrett screen (Garrett, 1965). Underlying water (ULW) samples, used as reference for the SML, were collected at approximately 1 m depth using a manually deployed water sampler. To evaluate the influence of cyanobacteria, we assessed the variability of key biomolecular classes in relation to high and low phytoplankton abundance across size fractions, i.e., discriminating between P/NP (Synechococcus-dominated) in contrast to MP (filamentous/colonial cyanobacteria dominated). Our overarching goal was to determine how cyanobacteria modulate the biochemical composition of the SML, with implications for gas exchange processes as inferred from surfactant analysis.
2.1 Research area
Samples were collected in July (30 June–19 July 2022) during the cruise EMB295 with the RV Elisabeth Mann Borgese in the Central Baltic Sea. The cruise was part of the project “Central Baltic Sea Air Sea Exchange Experiment” (CenBASE). All stations were located in the Eastern Gotland Basin, between 19.1 and 20.2° E and 57.10 and 57.30° N (Fig. 1). Two stations were sampled daily, one in the morning at 06:00 and one in the afternoon at 18:00 local time for a total of 15 stations (Table A1). During the cruise, surface waters (3 m) had a salinity of 7.26 ± 0.10 PSU and a temperature of 18.86 ± 0.22 °C.
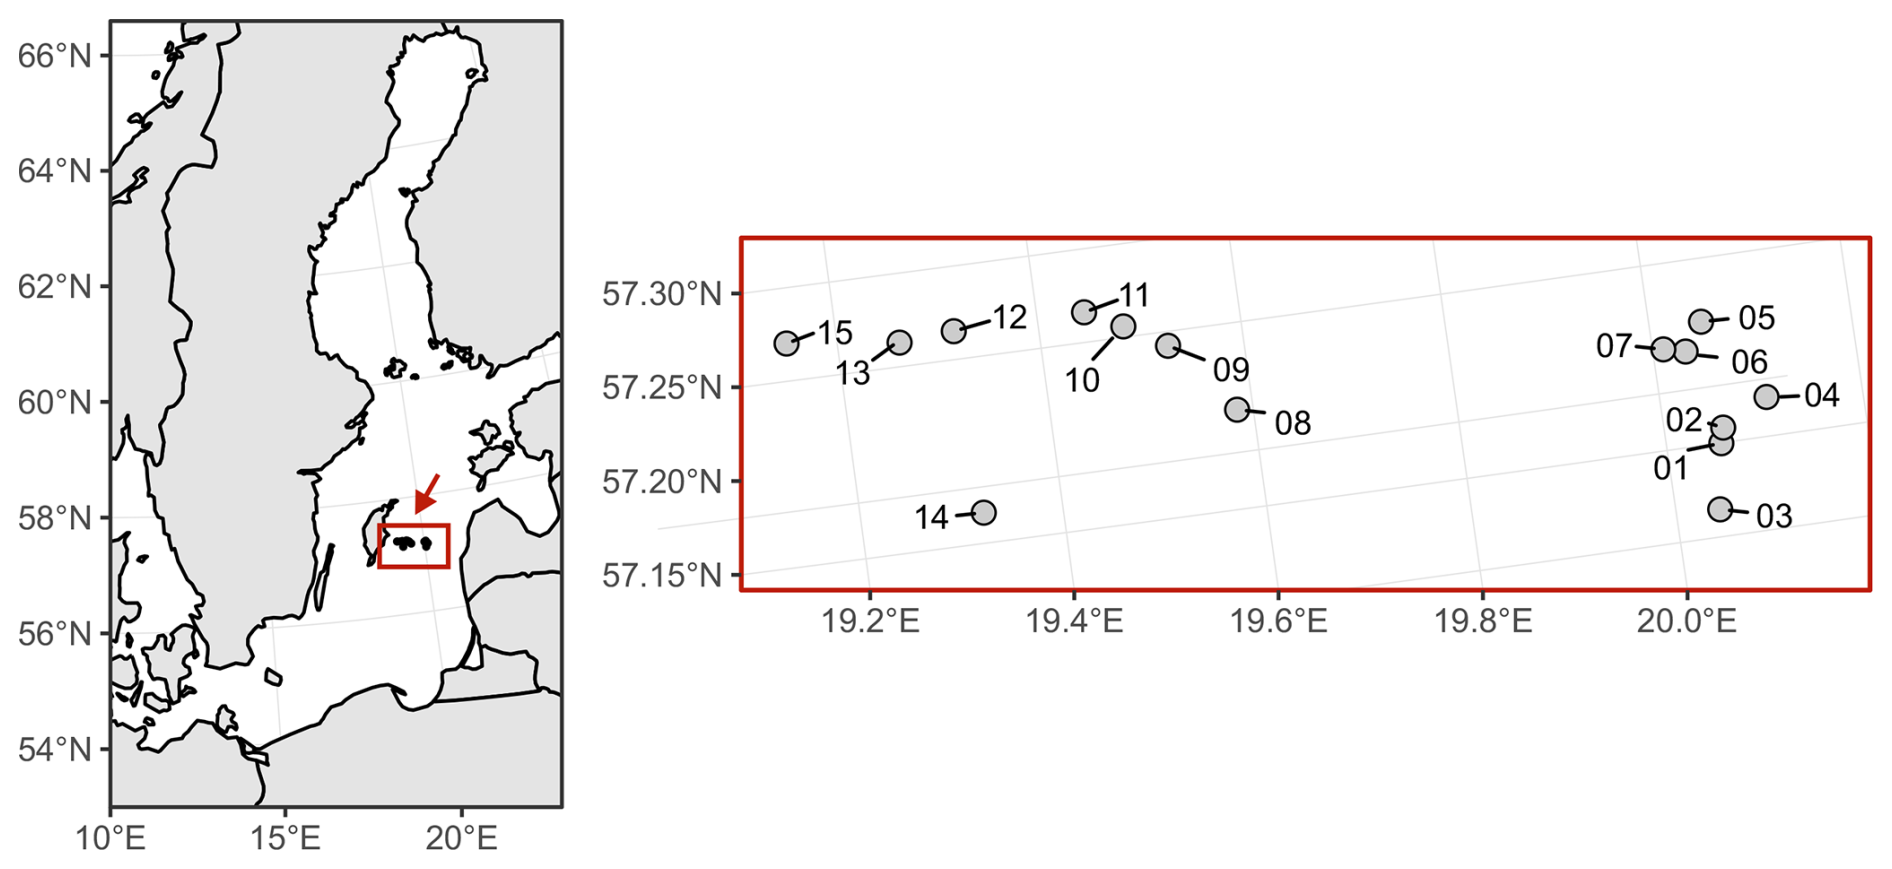
Figure 1The study area east of Gotland in the Central Baltic Sea is indicated by the red inset (left). The enlarged view of the Eastern Gotland Basin shows the stations, labelled with their station IDs, from the EMB295 cruise (right).
2.2 Sampling
At each station, seawater and organic particles (> 20 µm) were sampled. Seawater was sampled from the SML using a glass plate or a Garrett screen and from the ULW by a manually operated 2 L water sampler (Hydrobios, according to Ruttner). Particles > 20 µm were collected from the surface using a Neuston catamaran (Fig. S1 in the Supplemnt) and from ∼ 1 m depth using a ULW net (Fig. S2).
Seawater sampling was conducted from a working boat positioned ∼ 500 m upwind of the research vessel to minimize contamination and ensure an undisturbed surface. The SML was sampled with the glass plate (Cunliffe and Wurl, 2014; Harvey and Burzell, 1972) and collected into sample-rinsed amber borosilicate glass bottles (250 mL), yielding seven SML samples. Before sampling, the glass plate and frame were conditioned by sequential rinses with ambient seawater and a small volume of SML sample. Samples were kept shaded in an insulated box and processed within 2 h. For cleaning, the glass plate and bottles were soaked in 10 % HCl and thoroughly rinsed with Milli-Q water. The wiper and its frame were flushed with freshwater and then rinsed with Milli-Q. When working boat operations were not possible due to bad weather, the SML was sampled using a Garrett screen (Garrett, 1965) from the bow of the vessel as described in Barthelmeß et al. (2021), yielding eight SML samples. ULW was collected at 1 m using a manually operated water sampler (2 L) and filled into borosilicate bottles (250 mL) (n= 15). The following parameters were derived from seawater sampled with the glass plate or Garrett screen (SML) and the manually deployed water sampler (ULW): P/NP abundance, total organic carbon (TOC), total combined carbohydrates (TCCHO), total amino acids (TAA), and surfactants (SA). In the following text, the term “SML” refers to the uppermost microlayer, from which seawater samples were collected with the glass plate or Garrett screen, and “ULW” denotes the reference depth sampled with the manually deployed water sampler.
For the particles > 20 µm, a Neuston catamaran, equipped with a 20 µm mesh-size net attached, was towed at 3 knots on starboard side, allowing for the sampling of the upper ∼ 20 cm of the surface. Towing time for the Neuston catamaran was between ∼ 5 and ∼ 17 min, equivalent to 594 and 15 950 L seawater. In order to determine the amount of water that flowed through the net, a flowmeter (Hydro-Bios) was attached below the net opening, which was used to calculate the amount of water based on its rotations as follows:
with V(L) being the sampled water volume, N the number of revolutions, and A the area of the net opening (m2). The ULW reference depth was sampled with a ULW net with a mesh size of 20 µm, attached to a V-fin, and towed with 1.5 knots from starboard side at approximately 1 m depth. Towing time was between ∼ 5 and ∼ 14 min, equivalent to 1636 and 12 204 L seawater. The net opening area (A) was 0.0225 m2 for the Neuston catamaran and 0.045 m2 for the ULW net. During periods of strong wave action, the flow meter in the Neuston catamaran net opening occasionally emerged above the water surface, interrupting revolutions and yielding low or irregular counts. Consequently, sampled volumes calculated from N come with uncertainty. Before hauling in the Neuston catamaran and ULW net, the nets were rinsed with seawater from the outside, so that the entire content of the net was rinsed into the net sock. Once the net was on deck, the samples were rinsed with filtered seawater into a beaker. Due to the high biomass retained in the nets, the samples were diluted with filtered seawater, for which water was collected from a depth of 5 m and filtered through 3 and 0.2 µm pore-size. Samples were diluted in different ratios from 2:1 to 1:2 (v:v) depending on the thickness of the net catch and gently swirled before subsampling to ensure a homogeneous sample. Consequently, net samples included the particulate fraction > 20 µm and the added filtered seawater. Net samples were stored at 4 °C between subsampling. Rough weather conditions at stations 13 and 14 prevented the deployment of the Neuston catamaran and ULW net, and thus no net samples could be taken. Hereafter, Neuston catamaran and ULW net sample depths are referred to as “Surface” and “ULW-Net”, respectively. Sample sizes were n= 13 for each depth with the following parameters derived: MP biomass and abundance, particulate organic carbon > 20 µm (POC > 20 µm), particulate amino acids > 20 µm (PAA > 20 µm), and particulate combined carbohydrates > 20 µm (PCCHO > 20 µm).
2.3 Microphytoplankton microscopy
MP refers to phytoplankton with cell sizes > 20 µm and was exclusively sampled from net catches and determined by microscopy. After dilution of the net-tow samples as described above, 200 mL aliquots were transferred to amber glass bottles, preserved with 2 mL acidic Lugol's solution, and stored at 4 °C until processing. For analysis, samples were diluted (1:15 or 1:30) with water of the corresponding salinity, transferred to sedimentation chambers (Hydro-Bios), and left overnight to allow particle settling. MP community analysis included taxonomic identification (species composition), microscopic enumeration of abundance (Utermöhl, 1958; DIN EN 15972, 2011), and biovolume estimation based on measurements of a representative number of cells per taxon (DIN EN 16695, 2015). Microscopy was performed with a ZEISS Axiovert 25 inverted microscope at 100×, 200×, and 400× magnification. Where possible, organisms were identified to species level, otherwise, they were assigned to genus level or higher taxonomic groups. For MP samples only the eight most dominant MP taxa were identified: Aphanizomenon sp., Aphanocapsa sp., Nodularia spumigena, Cylindrotheca closterium, Pseudo-nitzschia delicatissima, Chaetoceros sp., Dinophysis sp., and Diplopsalis (group). For each sample, at least 400 individuals were enumerated, and approximately 20 individuals per taxon were measured for their visible dimensions. For biovolume estimation, each taxon was assigned an appropriate geometric body, and volume was calculated from the measured dimensions. When certain dimensions could not be measured (e.g. due to cell orientation in the chamber), standard correction factors were applied in accordance with DIN EN 16695:2015-12. Abundance was calculated accounting for the dilution factor and reported as cells per sample volume. Biomass was calculated based on biovolume and species-specific carbon content per cell.
2.4 Flow cytometry
P/NP refers to phytoplankton ≤ 20 µm determined by flow cytometry, based on seawater samples collected from the SML and ULW. Duplicates of 1.7 mL were preserved with 85 µL glutaraldehyde (GDA), and stored at −80 °C until later analysis. P/NP cells were quantified using a flow cytometer (Becton, Dickinson and Company FACSCalibur; software – BD Biosciences CellQuest Pro), calibrated with yellow-green latex beads (0.5 and 1 µm in diameter). Autotrophic cells were detected based on their autofluorescence (Marie et al., 1997), classified according to size as picophytoplankton (< 2 µm) and nanophytoplankton (2–20 µm), and further differentiated by their characteristic pigments into chlorophyll a- and phycoerythrin-rich picophytoplankton and -nanophytoplankton after Engel and Galgani (2016) and Zäncker et al. (2017). Picophytoplankton with phycoerythrin were affiliated to the unicellular cyanobacterium Synechococcus sp. We estimated the biomass of Synechococcus sp. based on cell counts. Reported estimates of Synechococcus cellular carbon biomass range from approximately 0.1 to 1.5 pg C cell−1 (Moisan et al., 2010). Here, we used an average carbon biomass of 0.3 pg C cell−1 based on Buitenhuis et al. (2012).
2.5 Chlorophyll a (Chl a)
Chlorophyll a (Chl a) samples were taken in duplicates from the manually deployed water sampler at 1 m depth (ULW). For each sample, 500 mL seawater was filtered onto a GF/F filter (Whatman, 25 mm), flash-frozen in liquid nitrogen and stored at −80 °C. Analyses were performed within one year of sample collection. Samples were acidified and measured with a fluorometer from Turner Designs (Turner TD 10-AU005) with an excitation at 450 nm and an emission of 670 nm according to the HELCOM COMBINE Manual (Helsinki Commission, 2000).
2.6 Organic matter analysis
For determination of TOC from SML and ULW, 20 mL seawater was filled into pre-combusted (8 h at 500 °C) glass ampules and acidified by adding 20 µL of 30 % hydrochloric acid (HCl, Suprapure, Sigma-Aldrich). After acidification, the samples were flame-sealed and stored at 4 °C until analysed with a TOC analyser (TOC-VCSH, Shimadzu) following Engel and Galgani (2016). TOC analysis was validated daily using deep seawater reference (DSR) material from the Consensus Reference Materials Project of RSMAS (University of Miami), yielding values within the certified range of 42–45 µmol C L−1. Two internal standards with DOC similar to samples were daily prepared using potassium hydrogen phthalate (Merck 109017). TOC concentrations in each sample were determined from 5 to 8 injections, with precision (< 4 %) estimated as the standard deviation divided by the mean. Total nitrogen (TN) was determined in parallel with TOC using the TNM-1 detector on the Shimadzu analyser. Nitrogen is combusted and transformed to NOx, which chemiluminesces when mixed with ozone and was detected using a photomultiplier (Dickson et al., 2007). The instrument was calibrated every 8–10 d using standard solutions (0, 500, 1000, 1500, 2500, and 5000 µg C L−1) prepared from a potassium hydrogen phthalate standard (Merck 109017). On each measurement day, ultrapure water determined the instrument blank. The detection limit of TOC was 1 µM.
For POC > 20 µm, duplicate 20 mL samples of the Surface and ULW-Net samples, including the particulate fraction and filtered seawater, were filled into ampules. From each ampule, two aliquots (0.5–2.0 mL) were filtered onto pre-combusted (8 h at 500 °C) GF/F filters (Whatman, 25 mm) at low constant vacuum (< 0.2 mbar), and the filtrate was collected in pre-acid-washed (HCl) Falcon tubes and stored at 4 °C. POC filters were stored at −20 °C until later analysis for less than a year. For the measurement, filters were wrapped in tin cups and measured using a Euro EA elemental analyser calibrated with an acetanilide standard after Sharp (1974). Filters with ultrapure water were measured as lab blank per run (< 10 µg C per filter). During storage in the ampules, particulate carbon may have dissolved. Therefore, the filtrate was measured in the same way as the TOC samples (see above). After the separated analyses, the carbon concentrations of the filtrate and filters were combined and reported as POC > 20 µm. Values were corrected by subtracting the TOC concentration of pre-filtered seawater (ranged from 341.07 to 457.15 µM) used to rinse the sample out of the net.
On board, samples for TCCHO (> 1 kDa) and TAA were collected from both SML and ULW samples into 20 and 4 mL pre-combusted glass vials and stored at −20 °C. Particulate fractions of combined carbohydrates (PCCHO > 20 µm) and amino acids (PAA > 20 µm) were determined from net samples and treated identically as the total fraction, i.e., filled into pre-combusted glass vials of the same respective volumes and stored at −20 °C. TCCHO and PCCHO > 20 µm were determined by high-performance anion-exchange chromatography coupled to pulsed amperometric detection (HPAEC-PAD) with a DIONEX ion chromatography system (ICS 6000) (Engel and Händel, 2011). The following neutral sugars were quantified: glucose, mannose and xylose, galactose, arabinose, fucose and rhamnose, the acidic sugars galacturonic acid and glucuronic acid, and the amino sugars galactosamine and glucosamine.
TAA and PAA > 20 µm were determined using a high-performance liquid chromatography (HPLC) system following Dittmar et al. (2009) and Lindroth and Mopper (1979). The following thirteen amino acids were quantified: aspartic acid, glutamic acid, serine, glycine, threonine, arginine, alanine, tyrosine, valine, isoleucine, phenylalanine, leucine, and γ-aminobutyric acid (GABA). Due to hydrolysis, aspartic acid and glutamic acid cannot be distinguished from asparagine and glutamine and are therefore reported as aspartic acid and glutamic acid, respectively.
The detection limit for combined carbohydrates and amino acids was 5–10 and ∼ 1 nM, respectively (Dittmar et al., 2009; Engel and Händel, 2011). Amino acid and carbohydrate concentrations are expressed in µM and their corresponding carbon equivalents in µM C.
2.7 Surfactants
For SA analysis, an 18 mL aliquot of SML- and ULW-derived seawater was transferred by a syringe into pre-acid-washed (HCl) and pre-combusted (8 h at 500 °C) 20 mL glass vials, and immediately stored at −20 °C. Samples were measured within 12 months after collection using phase-sensitive alternating current voltammetry (797 VA Computrace polarograph Metrohm, Switzerland), following the method initially introduced by Cosović and Vojvodić (1982). This technique is based on the discharge of an electrochemical double layer formed at the polar-non-polar interface of a hanging mercury drop electrode (Scholz, 2015), which interacts with surfactants present in the sample. The resulting changes in capacitive current, relative to a pure electrolyte blank, were used to quantify environmental surfactants. Prior to measurement, the sample's ionic strength was standardized by adding an appropriate volume of a 3 M sodium chloride (NaCl) solution. Samples were measured in glass vials at room temperature. Measurements were conducted with a 60 s deposition time and a voltage sweep ranging from −0.6 to −1 V. To prevent contamination, all measuring vials were pre-cleaned with 10 % HCl, rinsed with Milli-Q water, and combusted at 500 °C overnight. Calibration was performed using the artificial, non-ionic surfactant Triton X-100 (TX-100, Sigma-Aldrich, Germany, molecular weight: 625 g mol−1).
2.8 Data handling
Statistical analysis was executed in RStudio (version 2025.05.0). Data analysis comprised the calculation of mean (M) and standard deviation (SD), and all reported values follow the format M ± SD unless indicated otherwise. The median was used as a threshold to divide the dataset into phytoplankton abundance groups (see Sect. 3.1), ensuring an equal number of samples in each group and allowing for balanced statistical comparison. For characterizing the SML, enrichment factors (EFs) were calculated by dividing the concentration in the SML by the corresponding concentration in the ULW:
For statistical comparison of the MP and P/NP abundance conditions (see Sect. 3.1), and depth categories (SML vs. ULW; Surface vs. ULW-Net), normality was tested for each group using the Shapiro-Wilk normality test. If both groups passed the normality test (p > 0.05 in each group), a two-sample Welch's t-test was applied, otherwise, a Wilcoxon rank-sum test was used. We considered that null hypotheses testing and correlations were significant at p < 0.05.
For correlations, relative abundances were used. Parameters with only two data points (Diplopsalis (group) and Dinophysis sp.) were excluded from the correlation. Correlations between taxon-specific phytoplankton biomass and mol percent (mol %) of TAA, TCCHO, PAA > 20 µm, and PCCHO > 20 µm were tested using Spearman's rank correlation (ρ). Analyses were conducted separately for the SML/ULW and Surface/ULW-Net by subsetting the dataset by depth. To facilitate structure-revealing visualization, carbohydrates and amino acids were ordered by their similarity of correlation patterns with biomass. Statistical significance was encoded in the correlation matrices as *, , and for p < 0.05, p < 0.01, and p < 0.001, respectively.
3.1 Phytoplankton distribution and composition
To examine whether and which phytoplankton groups influence the biomolecular composition of seawater, we compared stations with varying P/NP and MP abundances. We used the median abundance to group P/NP and MP into high and low abundance conditions by referring to the samples of the reference depth (ULW and ULW-Net, respectively). A summary of this classification scheme is provided in Table A2 and will be explained in more detail with the help of Fig. 2. Figure 2 provides an overview of Chl a concentration, P/NP, and MP abundances encountered across stations in chronological order. Overall, the spatial patterns of phytoplankton abundance and Chl a reflected pronounced variability across the stations (Fig. 2). Chl a concentration in the ULW ranged from 1.60 to 3.05 µg L−1 (2.06 ± 0.34 µg L−1), showing a gradual increase towards station 15, except for stations 05, 11, and 12 (Fig. 2a). P/NP abundances were similar between the SML and ULW, with mean values of 69 ± 50 × 103 and 68 ± 39 × 103 cells mL−1, respectively, and with an overall mean of 69 ± 45 × 103 cells mL−1 (Fig. 2b). Across stations, abundance of P/NP increased from station 01 to 12, followed by a pronounced steep increase towards station 15, where the maximum value (205 × 103 cells mL−1) was recorded. MP abundance ranged between 13 and 1658 cells mL−1 with an overall mean of 287 ± 320 cells mL−1 and reaching a maximum at station 02 (1658 cells mL−1) (Fig. 2c). In the Surface, mean MP abundance was 202 ± 200 cells mL−1, compared to 371 ± 388 cells mL−1 in the ULW-Net. At stations 13 and 14, weather conditions were too rough to deploy the Neuston catamaran and ULW net, thus no net samples could be taken.
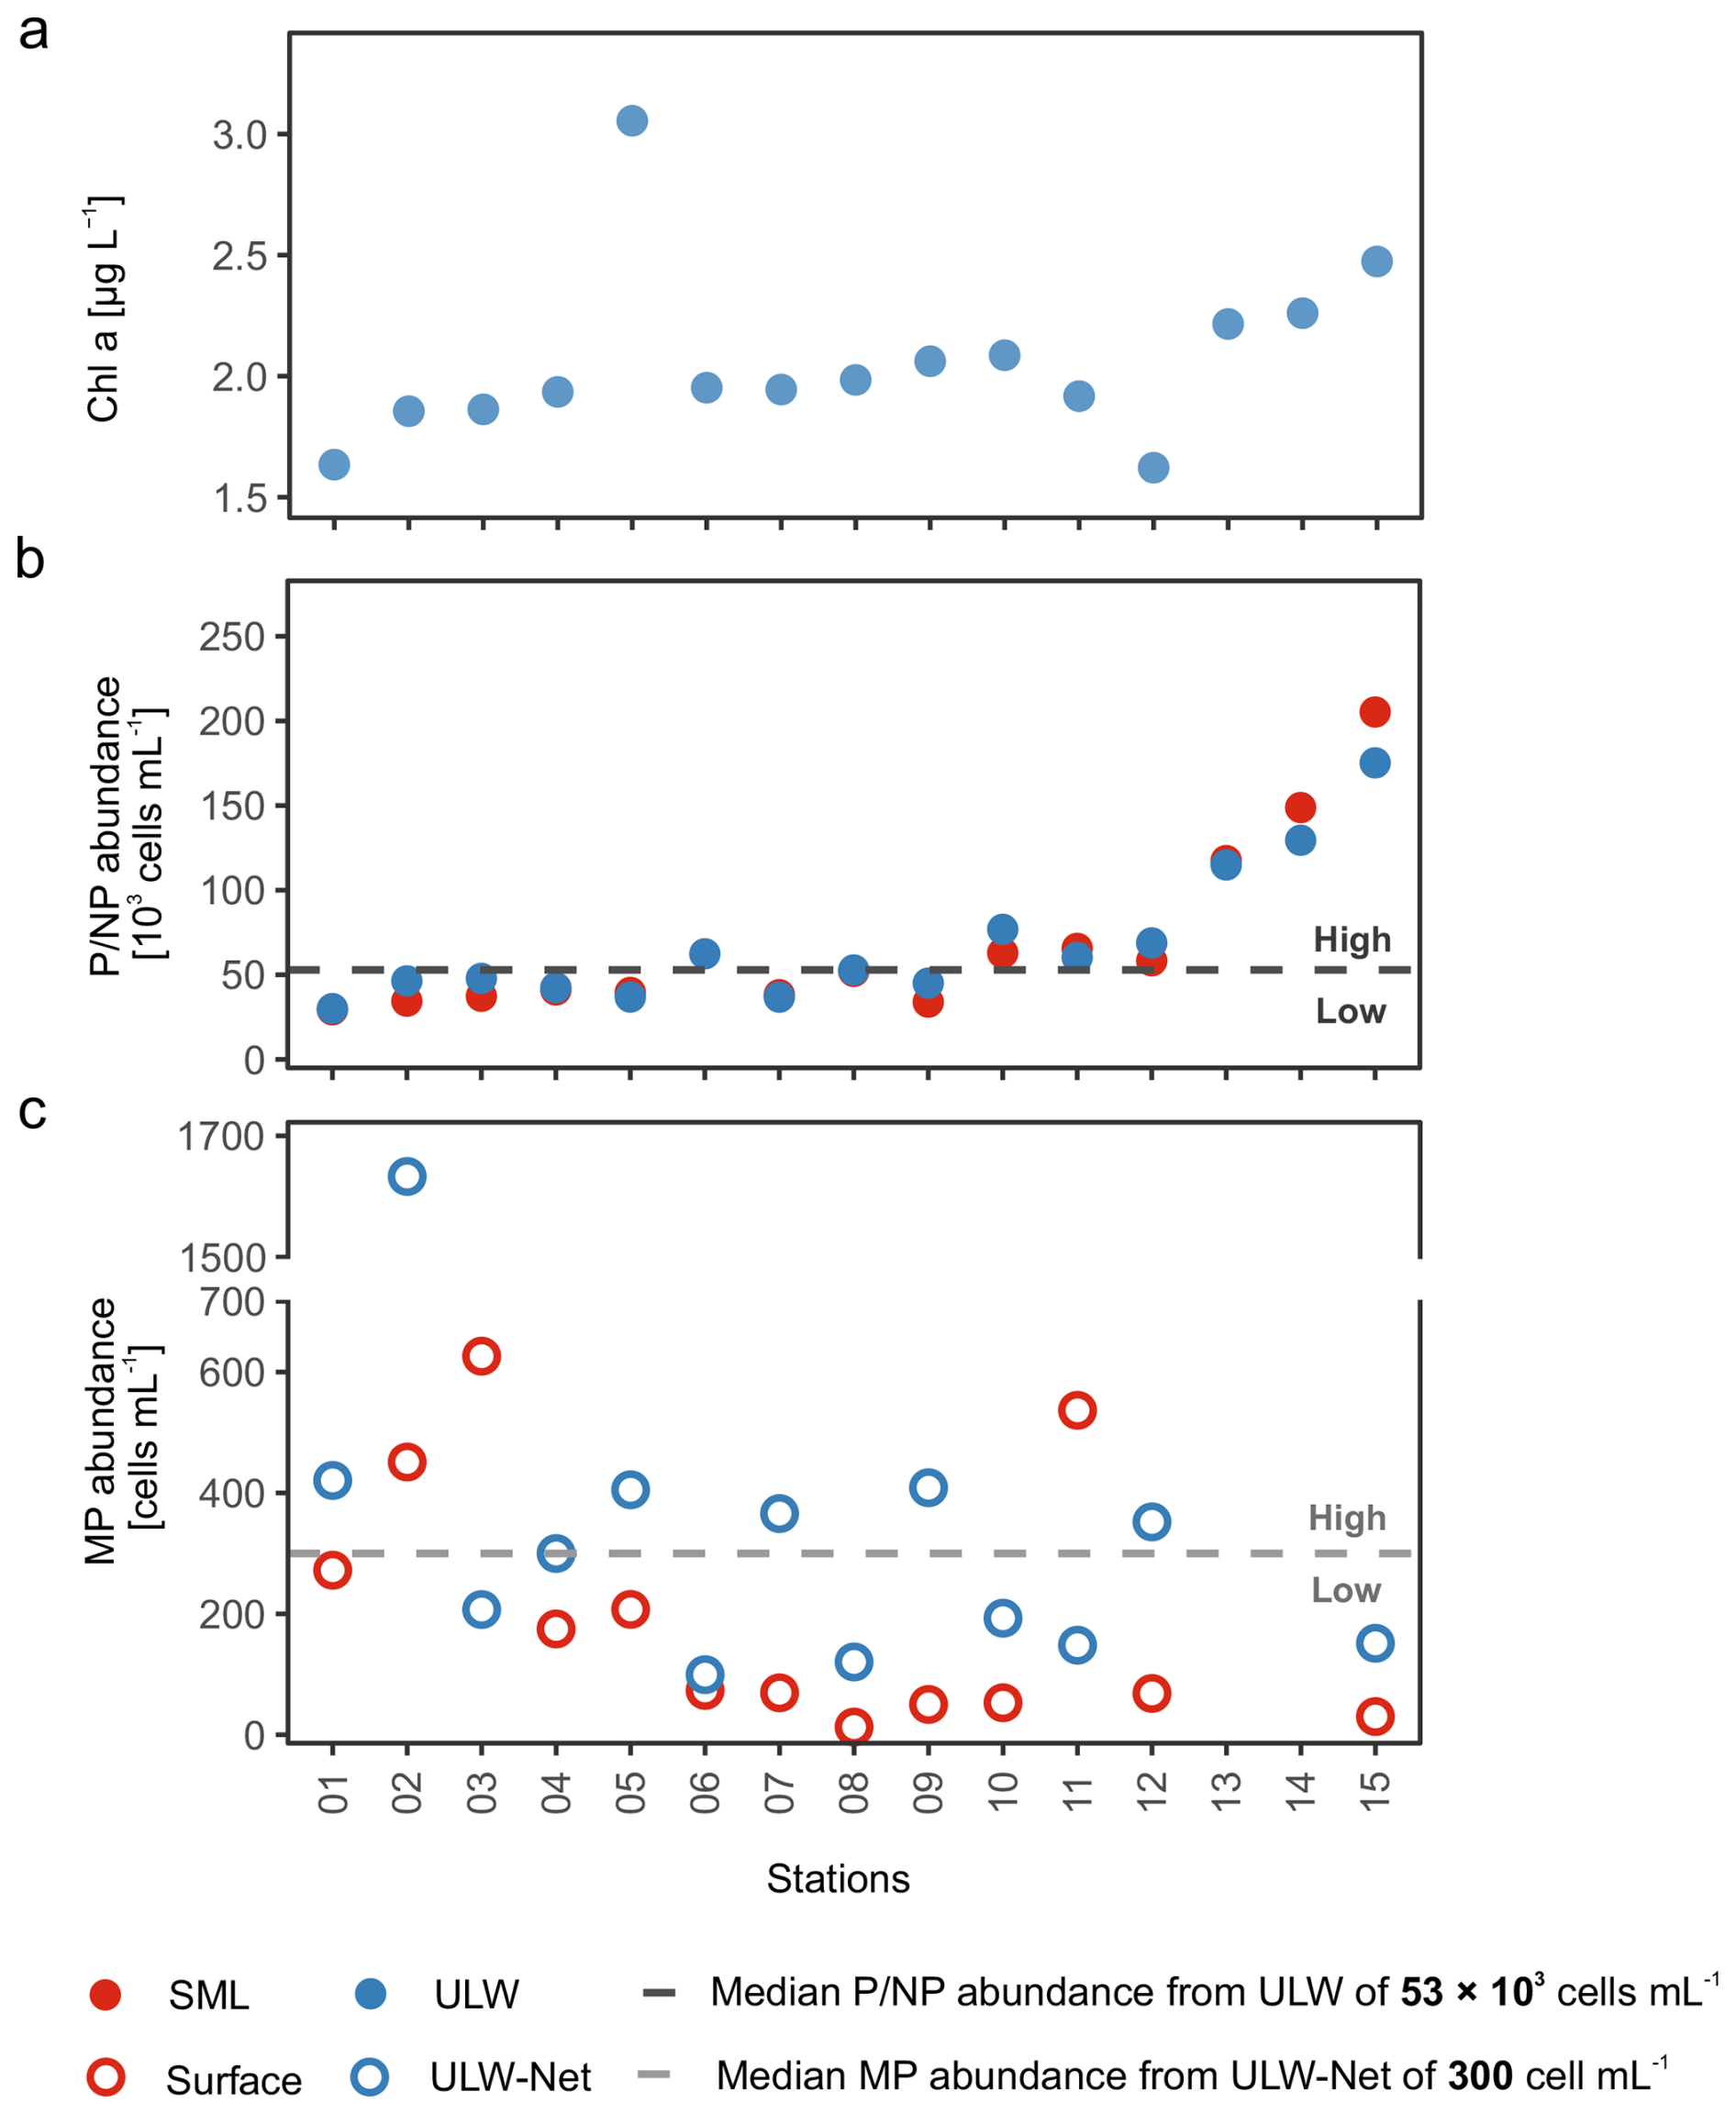
Figure 2Chlorophyll a (Chl a) concentrations (a) in the underlying water (ULW), (b) pico- and nanophytoplankton (P/NP) abundance in the sea surface microlayer (SML) and ULW, and (c) microphytoplankton (MP) abundance in Surface and ULW-Net samples across stations during EMB295. The dashed horizontal lines mark the median abundance of P/NP (dark grey) and MP (light grey) in the ULW and ULW-Net, respectively. Stations were classified into the condition characterized by low P/NP (Low P/NP) and low MP (Low MP) abundances, if below the respective median values. Samples were classified into the condition characterized by high P/NP (High P/NP) and high MP (High MP) abundances, if above the respective median values. The station order corresponds to temporal sequence of sampling conducted during the cruise.
The dashed lines in Fig. 2b and c represent the median values, which were taken to group stations into high and low phytoplankton abundance conditions. For P/NP (incl. Chl a- and phycoerythrin-rich picophytoplankton and nanophytoplankton), the median abundance was 53 × 103 cells mL−1 and for MP, the median abundance was 300 cells mL−1 (incl. Aphanizomenon sp., Aphanocapsa sp., Nodularia spumigena, Cylindrotheca closterium, Pseudo-nitzschia delicatissima, Chaetoceros sp., Dinophysis sp., and Diplopsalis (group)). Accordingly, stations above the respective medians were classified as a condition characterized by high, while those below were classified as a condition characterized by low abundances. Subsequently, stations with high P/NP abundance were addressed as “High P/NP” conditions, while stations with low P/NP abundance were addressed as “Low P/NP” conditions (Fig. 2b). The same categories were implemented to classify conditions based on MP abundances, either referring to high (“High MP”) or low (“Low MP”) abundances (Fig. 2c). In summary, the following four conditions were introduced and will be used throughout the text: “High P/NP” vs. “Low P/NP” and “High MP” vs. “Low MP”. It is important to highlight that in 10 out of 13 common stations, the abundances of P/NP corresponded inversely to those of MP, i.e. stations characterized by elevated abundances of P/NP (High P/NP) generally showed reduced abundances of MP (Low MP), and vice versa. At two stations, no net samples were derived and thus no MP condition could be assigned.
Within the P/NP community, picophytoplankton containing the pigment phycoerythrin (affiliated to the unicellular cyanobacterium Synechococcus sp.) were most abundant (42 ± 41 × 103 cells mL−1), representing more than 50 % of the total community by number at almost all stations, followed by picophytoplankton containing Chl a (18 ± 4.9 × 10³ cells mL−1) (Fig. 3a). During stations 13, 14, and 15, phycoerythrin-rich picophytoplankton abundance increased in the SML and ULW up to 178 × 103 and 148 × 103 cells mL−1, respectively, and made up more than 80 % of the P/NP community by number. Chl a−rich nanoplankton showed mean values about 4.3–4.5 ± 2.9 × 10³ cells mL−1 in the SML and ULW and phycoerythrin-rich nanoplankton varied about 4.5 ± 2.3 × 10³ cells mL−1 in the SML and 4.4 ± 2.2 × 10³ cells mL−1 in the ULW. Both varied little between stations and depth. P/NP abundance in the SML was not available for station 06.
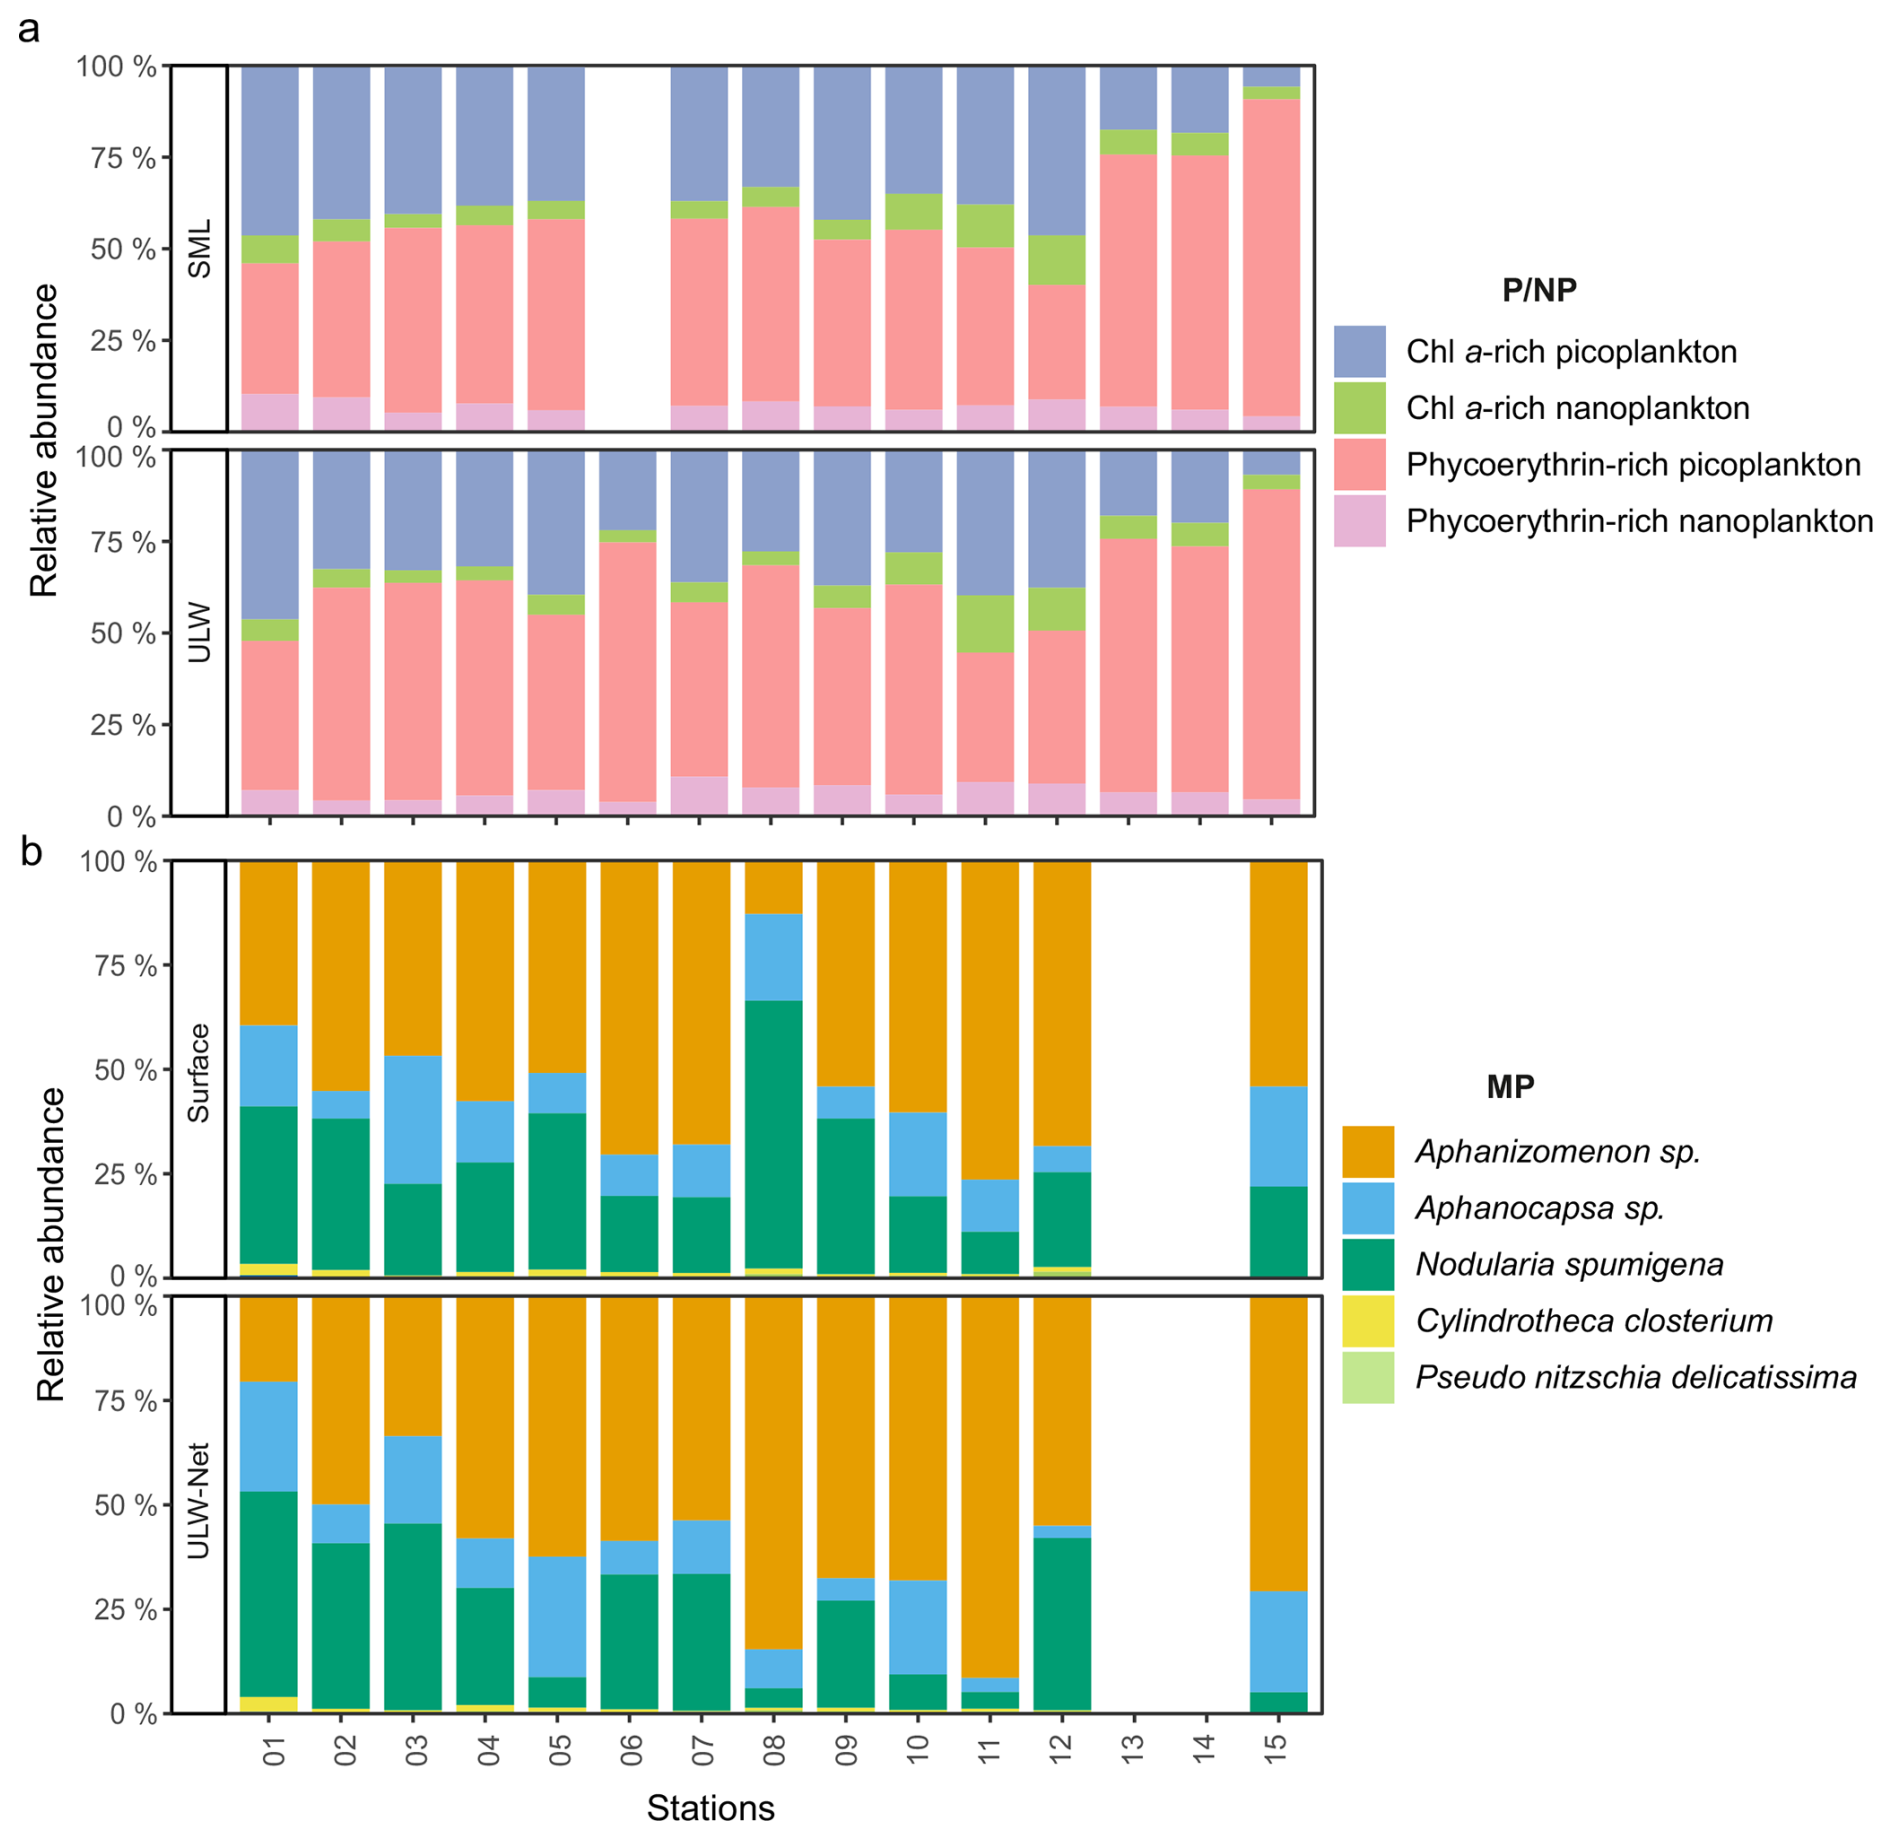
Figure 3Stacked bar plot showing the relative abundance of (a) the four pico- and nanophytoplankton (P/NP) groups in sea surface microlayer (SML) and underlying water (ULW) samples, and (b) dominant microphytoplankton (MP) species in Surface and ULW-Net samples. Colors for MP denote five of the eight identified phytoplankton taxa. Abundances of Chaetoceros sp., Dinophysis sp., and Diplopsalis (group) were < 1 % and are not shown.
Across the stations, the MP community was dominated by filamentous cyanobacteria in both Surface and ULW-Net samples (Fig. 3b). Aphanizomenon sp. was the dominant species at almost all stations and in both layers and accounted for a mean abundance of 158 ± 166 cells mL−1. Secondary contributions came from Nodularia spumigena (84 ± 128 cells mL−1), followed by Aphanocapsa sp. (41 ± 48 cells mL−1), which were consistently present but more variable among stations. Diatoms were a minor component of the MP community. Cylindrotheca closterium (3.3 ± 4.4 cells mL−1) and Pseudo-nitzschia delicatissima (1.1 ± 0.8 cells mL−1) were typically present at low percentages (< 2 %). Overall, variability in relative species abundance among stations was moderate across the stations and depths. Relative abundances for Chaetoceros sp., Dinophysis sp., and Diplopsalis (group) were < 2 % and are thus not visible in Fig. 3. A figure displaying a higher resolution of the relative abundances < 4 % can be found in the supplementary material (Fig. S3). MP abundances were approximately three orders of magnitude lower than those of P/NP.
Apart from abundances, microscopic analysis further enabled biomass estimation of MP. Pronounced differences in the biomass of dominant MP taxa between Surface and ULW-Net samples were observed during both Low MP and High MP conditions (Fig. 4). In addition, calculated Synechococcus sp. (phycoerythrin-rich picophytoplankton) biomass (see Sect. 2.4) was included for the same conditions to enable a comparison with the MP fraction.
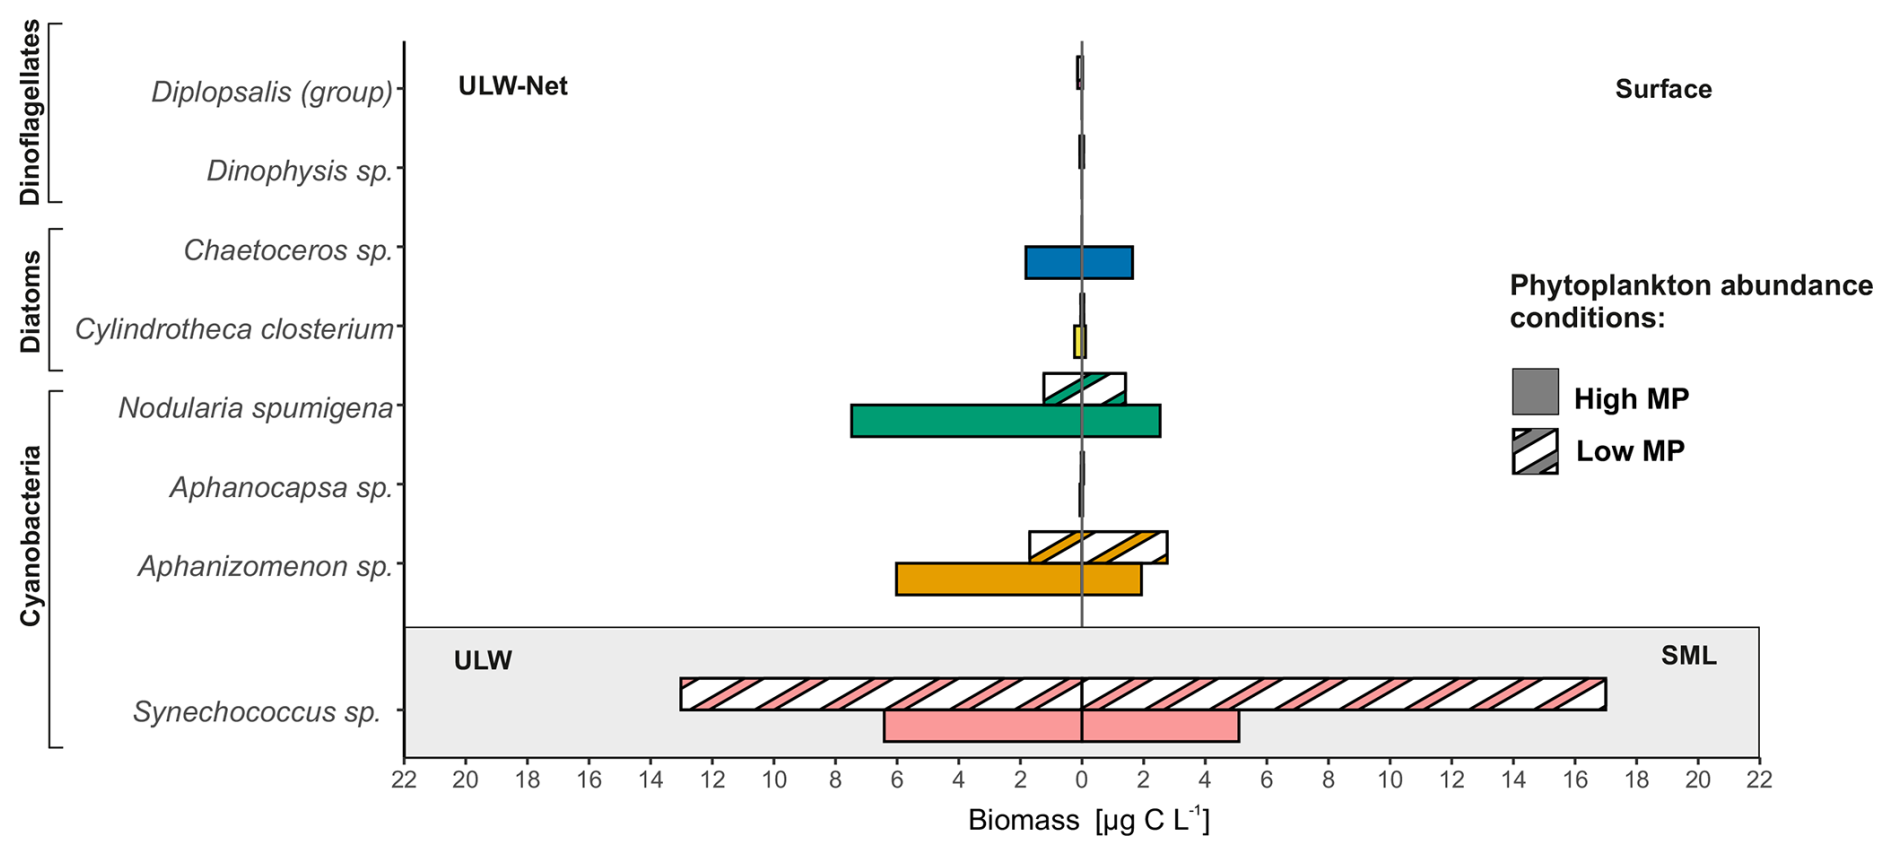
Figure 4Mean biomass (µg C L−1) of dominant microphytoplankton (MP) taxa in Surface and net-derived underlying water (ULW-Net) samples, as well as of Synechococcus sp. in sea surface microlayer (SML) and underlying water (ULW) samples. Data are differentiated by MP abundance conditions, solid bars represent high MP abundance (High MP), hatched bars represent low MP abundance (Low MP). Colors differ in accordance with annotated taxa. Pseudo-nitzschia delicatissima was excluded from the figure due to its negligible biomass contribution (< 0.01 µg C L−1).
In general, MP biomass was higher in the ULW-Net with an overall mean of 8.98 ± 10.50 µg C L−1 compared to the biomass of 4.59 ± 4.15 µg C L−1 in the Surface. The highest biomass contributions within MP species were from Aphanizomenon sp. and Nodularia spumigena ranging from 0.05 to 16.04 and 0.16 to 26.55 µg C L−1, respectively. Nodularia spumigena showed the highest biomass in the ULW-Net during High MP conditions (7.48 ± 8.07 µg C L−1) and was also present in the Surface at lower biomass. Aphanizomenon sp. occurred in both layers with generally greater values in the ULW-Net during High MP conditions (6.02 ± 4.39 µg C L−1). Cylindrotheca closterium and Chaetoceros sp. occurred under High MP conditions only with < 0.20 µg C L−1. Other taxa, including Aphanocapsa sp., Dinophysis sp., and Diplopsalis (group), made up less than 0.10 µg C L−1.
Synechococcus sp. exhibited higher biomass values than the MP taxa, with a mean of 12.63 ± 12.18 µg C L−1, showing no significant difference between SML and ULW samples. Under High MP conditions, Synechococcus sp. biomass was considerably lower (5.76 ± 1.52 µg C L−1) compared to Low MP conditions, during which it increased to 16.41 ± 15.59 µg C L−1. In summary, the phytoplankton community was characterized either by a dominance of filamentous cyanobacteria (Aphanizomenon sp. and Nodularia spumigena) or the unicellular cyanobacterium Synechococcus sp.
3.2 Biomolecular concentrations are shaped by phytoplankton
The enrichment and concentrations of the biochemical parameters were grouped with respect to depths and phytoplankton abundance conditions. The supplement provides an overview of all parameters (Figs. S5 and S6) as well as EFs for TOC, TAA, surfactants, and TCCHO at each station (Fig. S7). In the following, we present parameters derived from SML and ULW seawater samples under P/NP conditions (Fig. 5), as well as parameters derived from net sampling in Surface and ULW-Net under MP conditions (Fig. 6).
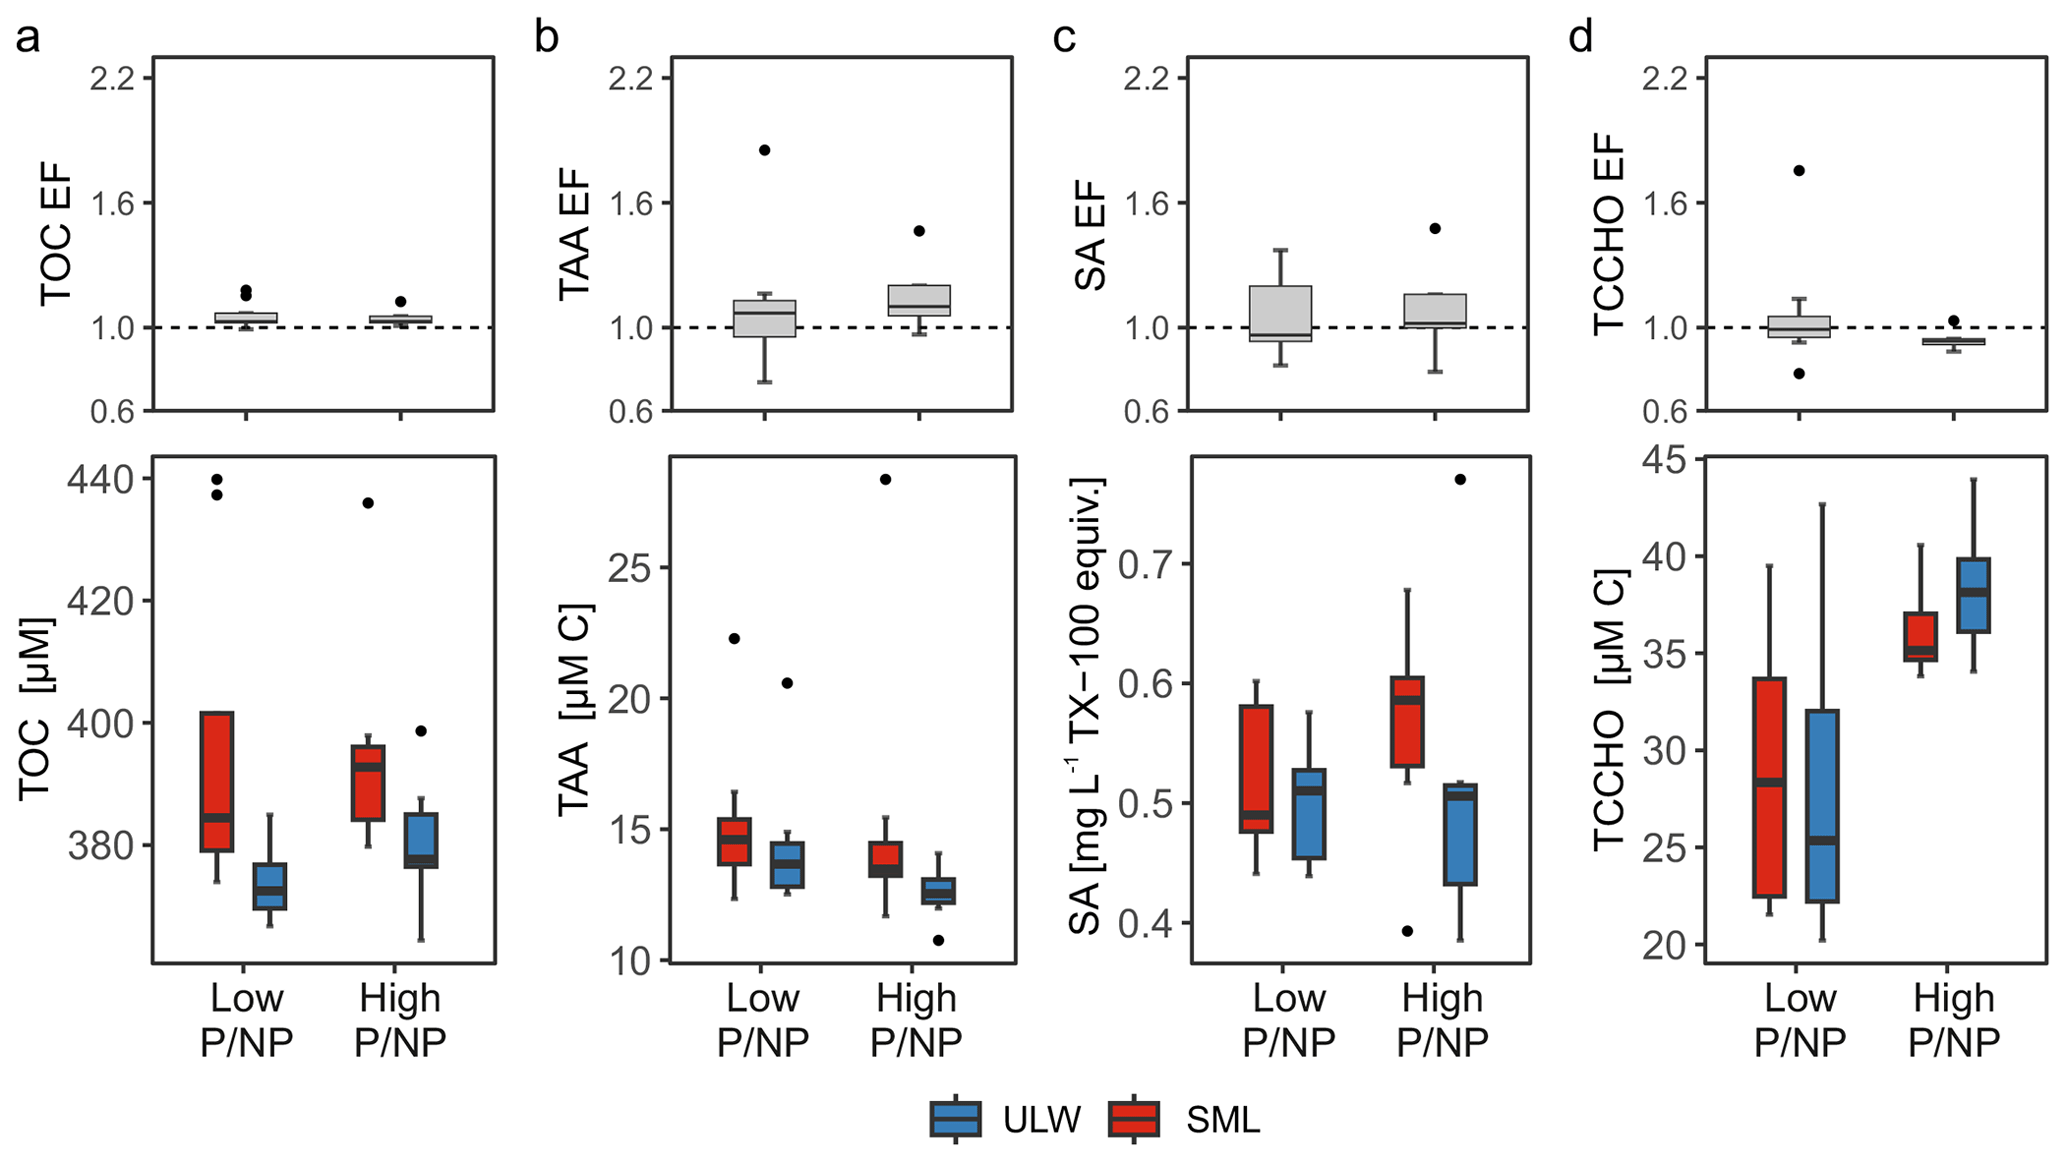
Figure 5Concentration differences during low pico- and nanophytoplankton abundance (Low P/NP) and high pico- and nanophytoplankton abundance (High P/NP) conditions in the sea surface microlayer (SML) and underlying water (ULW) for (a) total organic carbon (TOC), (b) total amino acids (TAA), (c) surfactant (SA) concentrations, and (d) total combined carbohydrates (TCCHO) are presented. Enrichment factors (EFs) for each parameter are shown for the respective condition.
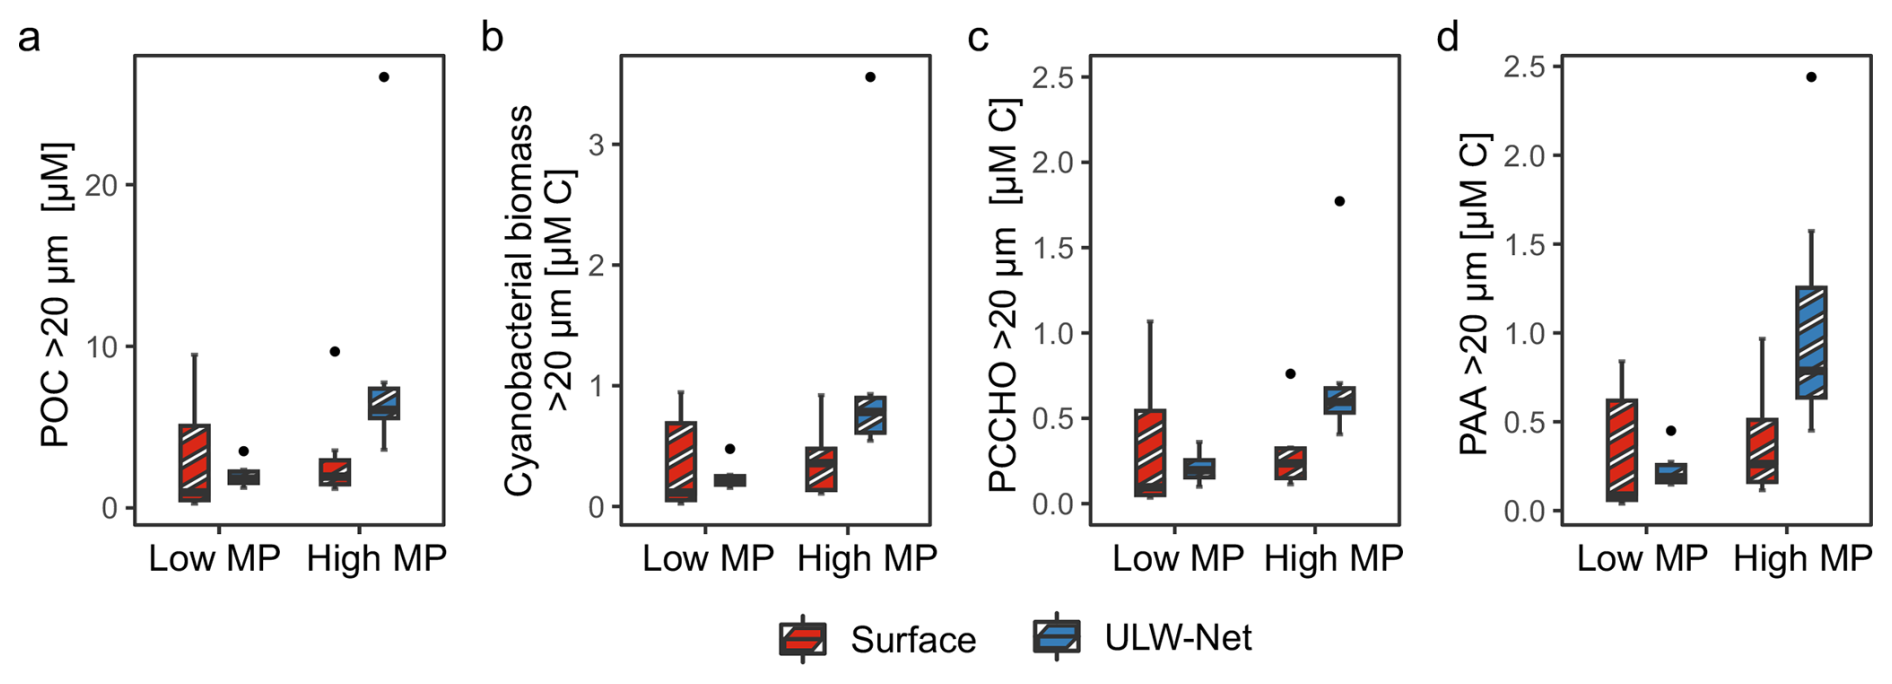
Figure 6Concentration differences during low microphytoplankton (Low MP) and high microphytoplankton abundance (High MP) conditions in Surface (red, striped) and ULW-Net (blue, striped) for (a) particulate organic carbon (POC) > 20 µm, (b) cyanobacterial biomass > 20 µm, (c) particulate combined carbohydrates (PCCHO) > 20 µm, and (d) particulate amino acids (PAA) > 20 µm are presented.
First, this section addresses variations in relation to P/NP conditions and parameters measured in seawater (Fig. 5). TOC concentrations during Low P/NP conditions were significantly higher in the SML (396 ± 25 µM) compared to the ULW (374 ± 6 µM, p= 0.044, Fig. 5a). Despite the significant difference, TOC EFs were close to 1 across stations (1.1 ± 0.1), which resulted from the overall elevated and unusually high TOC concentrations encountered in the Baltic Sea. Consequently, overall high TOC concentrations reduced the relative SML enrichment, while absolute differences between the SML and ULW remained statistically significant. Under High P/NP conditions, TOC concentrations did not differ significantly between the SML (396 ± 10 µM) and ULW (381 ± 10 µM). TAA concentrations were slightly higher in the SML (15.32 ± 2.86 µM C 3.59 ± 0.72 µM) than in the ULW (14.41 ± 2.47 µM C 3.33 ± 0.57 µM) under Low P/NP conditions, however, this difference was not statistically significant (Fig. 5b). Similarly, under High P/NP conditions, TAA concentrations did not differ significantly, despite elevated concentrations in the SML (15.56 ± 5.33 µM C 3.72 ± 1.35 µM) compared to the ULW (12.56 ± 0.97 µM C 2.92 ± 0.20 µM). The minor concentration differences between the SML and ULW resulted in similar EFs under both Low P/NP (1.1 ± 0.3; median = 1.1) and High P/NP (1.2 ± 0.4; median = 1.1) conditions.
Surfactant concentrations were comparable between SML (0.52 ± 0.06 mg L−1 TX-100 equiv.) and ULW (0.50 ± 0.05 mg L−1 TX-100 equiv.) under Low P/NP conditions, with an EF of 1.1 ± 0.2 (median = 1.0), as shown in Fig. 5c. Under High P/NP conditions, surfactant concentrations were elevated in the SML (0.56 ± 0.08 mg L−1 TX-100 equiv.) compared to the ULW (0.52 ± 0.12 mg L−1 TX-100 equiv.), however, the difference was not significant. This corresponded to an EF of 1.1 ± 0.2 (median = 1.1), which is similar to the EFs observed during Low P/NP conditions. Depth-related differences in TCCHO concentrations were not significant under either Low or High P/NP conditions (Fig. 5d). However, when samples were considered irrespective of depth, TCCHO concentrations were significantly higher under High P/NP conditions (37.21 ± 2.88 µM C 6.38 ± 0.49 µM) compared to Low P/NP conditions (28.37 ± 6.96 µM C 4.85 ± 1.19 µM, p= 0.007). EFs were comparable between Low P/NP (1.1 ± 0.3; median = 1.0) and High P/NP (0.9 ± 0.0; median = 0.9) conditions.
Second, the particulate organic matter composition of net-derived samples is presented and accordingly grouped into MP conditions (Fig. 6). During High MP conditions, POC > 20 µm concentrations differed significantly between depths (Fig. 6a), with markedly higher values in the ULW-Net (8.89 ± 7.36 µM) compared to the Surface (3.09 ± 2.79 µM; p= 0.02). In contrast, depth-related differences were not evident under Low MP conditions, where concentrations were lower in both Surface (3.07 ± 3.67 µM) and ULW-Net (2.04 ± 0.72 µM) compared to High MP conditions. Cell-based estimates of cyanobacterial biomass > 20 µm accounted on average for 12.6 ± 4.7 % of the POC > 20 µm (Fig. 6b). Their biomass reached 1.13 ± 1.00 µM C in the ULW-Net and was significantly reduced at the Surface (0.37 ± 0.27 µM C; p= 0.01).
PCCHO > 20 µm and PAA > 20 µm showed a similar patterns between depths under High MP conditions (Fig. 6c and d). PCCHO > 20 µm concentrations were elevated in the ULW-Net (0.74 ± 0.43 µM C 0.12 ± 0.07 µM) compared to the Surface (0.29 ± 0.21 µM C 0.05 ± 0.03 µM; p= 0.02). PCCHO > 20 µm accounted for 10.3 ± 2.3 % of the POC > 20 µm pool and 1.3 ± 1.2 % of TCCHO. Contributions of PCCHO to TCCHO differed between abundance conditions, with 1.7 ± 1.3 % under High MP conditions and 0.9 ± 0.9 % under Low MP conditions. PAA > 20 µm increased from 0.38 ± 0.32 µM C ( 0.08 ± 0.07 µM) in the Surface to 1.07 ± 0.71 µM C ( 0.23 ± 0.16 µM) in the ULW-Net (p= 0.05) (Fig. 6d). PAA > 20 µm contributed 12.8 ± 6.4 % to the POC > 20 µm pool and 0.3 % –18.6 % (3.8 ± 4.1 %) to TAA. PAA contributions to TAA were higher during High MP conditions (5.4 ± 4.8 %) than during Low MP conditions (1.9 ± 1.9 %).
In summary, the biochemical parameters revealed differences between depth and phytoplankton abundance conditions. TOC exhibited elevated concentrations in the SML during Low P/NP conditions, whereas TAA concentrations were only marginally higher in the SML. During High P/NP conditions, TCCHO concentrations were higher and surfactant concentrations were elevated in the SML compared to Low P/NP conditions, although this difference was not significant. Particulate fractions (PAA > 20 µm and PCCHO > 20 µm) reflected the expected enrichment of cyanobacterial biomass > 20 µm and POC > 20 µm in the ULW-Net under High MP conditions. Further, we found that MP biomass was significantly related to POC > 20 µm (R2= 0.94; p < 0.001) (Fig. S4), and accounted for 5.67 %–38.32 % (13.5 ± 6.2 %) of the POC > 20 µm pool, primarily driven by the contributions of Nodularia spumigena and Aphanizomenon sp.
3.3 Biomolecular composition of amino acids and carbohydrates
To highlight distinct differences in compound composition, the relative molecular composition of combined carbohydrates and amino acids for the total and particulate (> 20 µm) fractions were compared (Fig. 7).
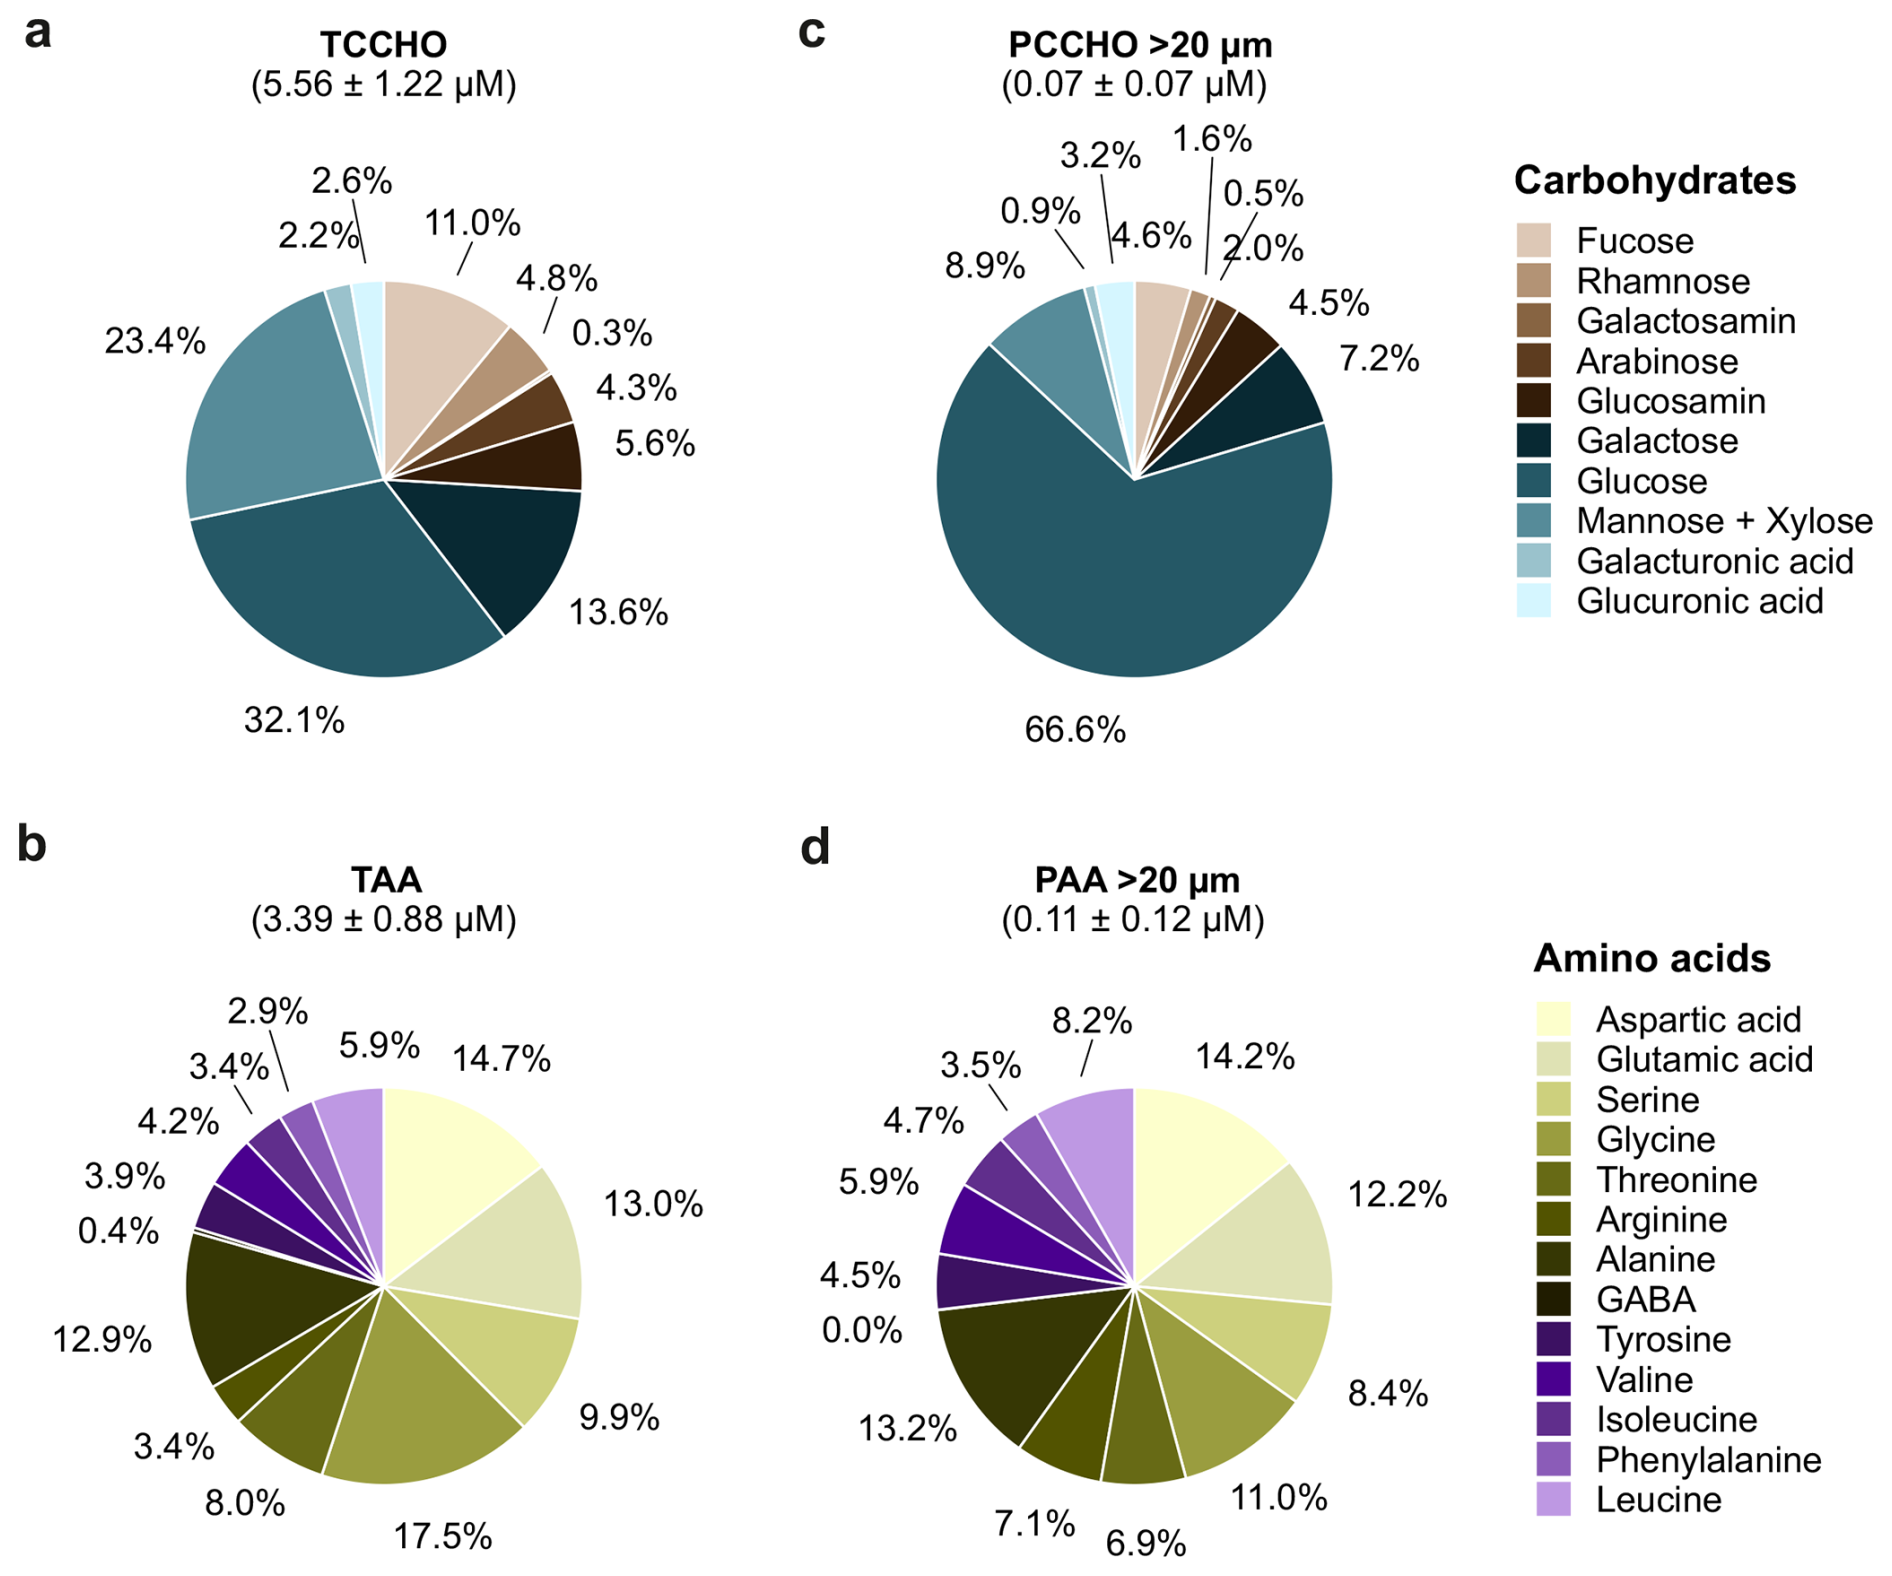
Figure 7Composition of combined carbohydrates and amino acids in total and particulate pools. The pie charts summarize the relative contributions of individual compounds (a) to total combined carbohydrates (TCCHO), (b) total amino acids (TAA), (c) particulate combined carbohydrates (PCCHO) > 20 µm, and (d) particulate amino acids (PAA) > 20 µm. Slice labels indicate the mol % contribution of each compound to the respective pool. Chart titles report the M ± SD concentration (µM) of the molecular concentrations of the corresponding pool across all samples.
A few key compounds strongly dominated carbohydrate composition, while several constituents contributed only marginally. In contrast, amino acid compositions showed a more even distribution among individual compounds. Differences are first described for the total fraction (Fig. 7a, b), followed by the particulate fraction (Fig. 7c, d).
TCCHO (5.6 ± 1.2 µM) was characterized by a predominance of glucose (32.1 mol %) and mannose and xylose (23.4 mol %), followed by galactose (13.6 mol %) and glucosamine (11.0 mol %) (Fig. 7a). The TAA pool (3.4 ± 0.8 µM) was mainly composed of glycine (17.5 mol %), aspartic acid (14.7 mol %), glutamic acid (13.0 mol %), and alanine (12.9 mol %) (Fig. 7b). Within the PCCHO > 20 µm pool (0.06 ± 0.07 µM), glucose dominance became even more pronounced, accounting for 66.6 mol %, while the contributions of mannose and xylose (8.9 mol %), galactose (7.2 mol %), and glucosamine (4.5 mol %) were comparatively smaller (Fig. 7c). An elevated fraction of glucuronic acid and galactosamine was also characteristic of the PCCHO > 20 µm pool in comparison to the TCCHO pool. The pool of PAA > 20 µm (0.11 ± 0.12 µM) exhibited a composition comparable to that of TAA, dominated by particulate aspartic acid (14.2 mol %), glutamic acid (12.2 mol %), alanine (13.2 mol %), and glycine (11.0 mol %) (Fig. 7d). Shifts in relative proportions suggest subtle differences in the source of amino acids between fractions. Relative shifts in the contributions of γ-aminobutyric acid (GABA), arginine, leucine, phenylalanine, valine, and tyrosine were observed. While GABA was elevated in the TAA pool, the latter amino acids were enriched within the PAA > 20 µm pool (Fig. 7d, mainly purple).
Principal component analysis (PCA) revealed systematic compositional differences between Low P/NP and High P/NP conditions (Fig. 8a, b). For TCCHO, conditions separated along both the PC1 and PC2 axis, explaining 68.7 % of variation in the data (Fig. 8a). Low P/NP conditions were mainly characterized by the high contribution of total glucose, while under High P/NP conditions, higher contributions of total galactose, glucosamine, fucose, and mannose and xylose were observed. For TAA, the PC1 explained 61.9 % of the variance, while categories separated mainly along PC2 (20.4 % explained variance) (Fig. 8b). Positive PC2 loadings were driven by total glutamic acid, isoleucine, and tyrosine, whereas negative PC2 loadings were associated with e.g. total GABA and total glycine. The PC1 axis, explaining most of the variance, was loosely related to a separation between ULW (negative values, e.g., total phenylalanine, leucine, arginine, tyrosine) and the SML (positive values for total glutamic acid, serine, glycine) (Fig. S8).
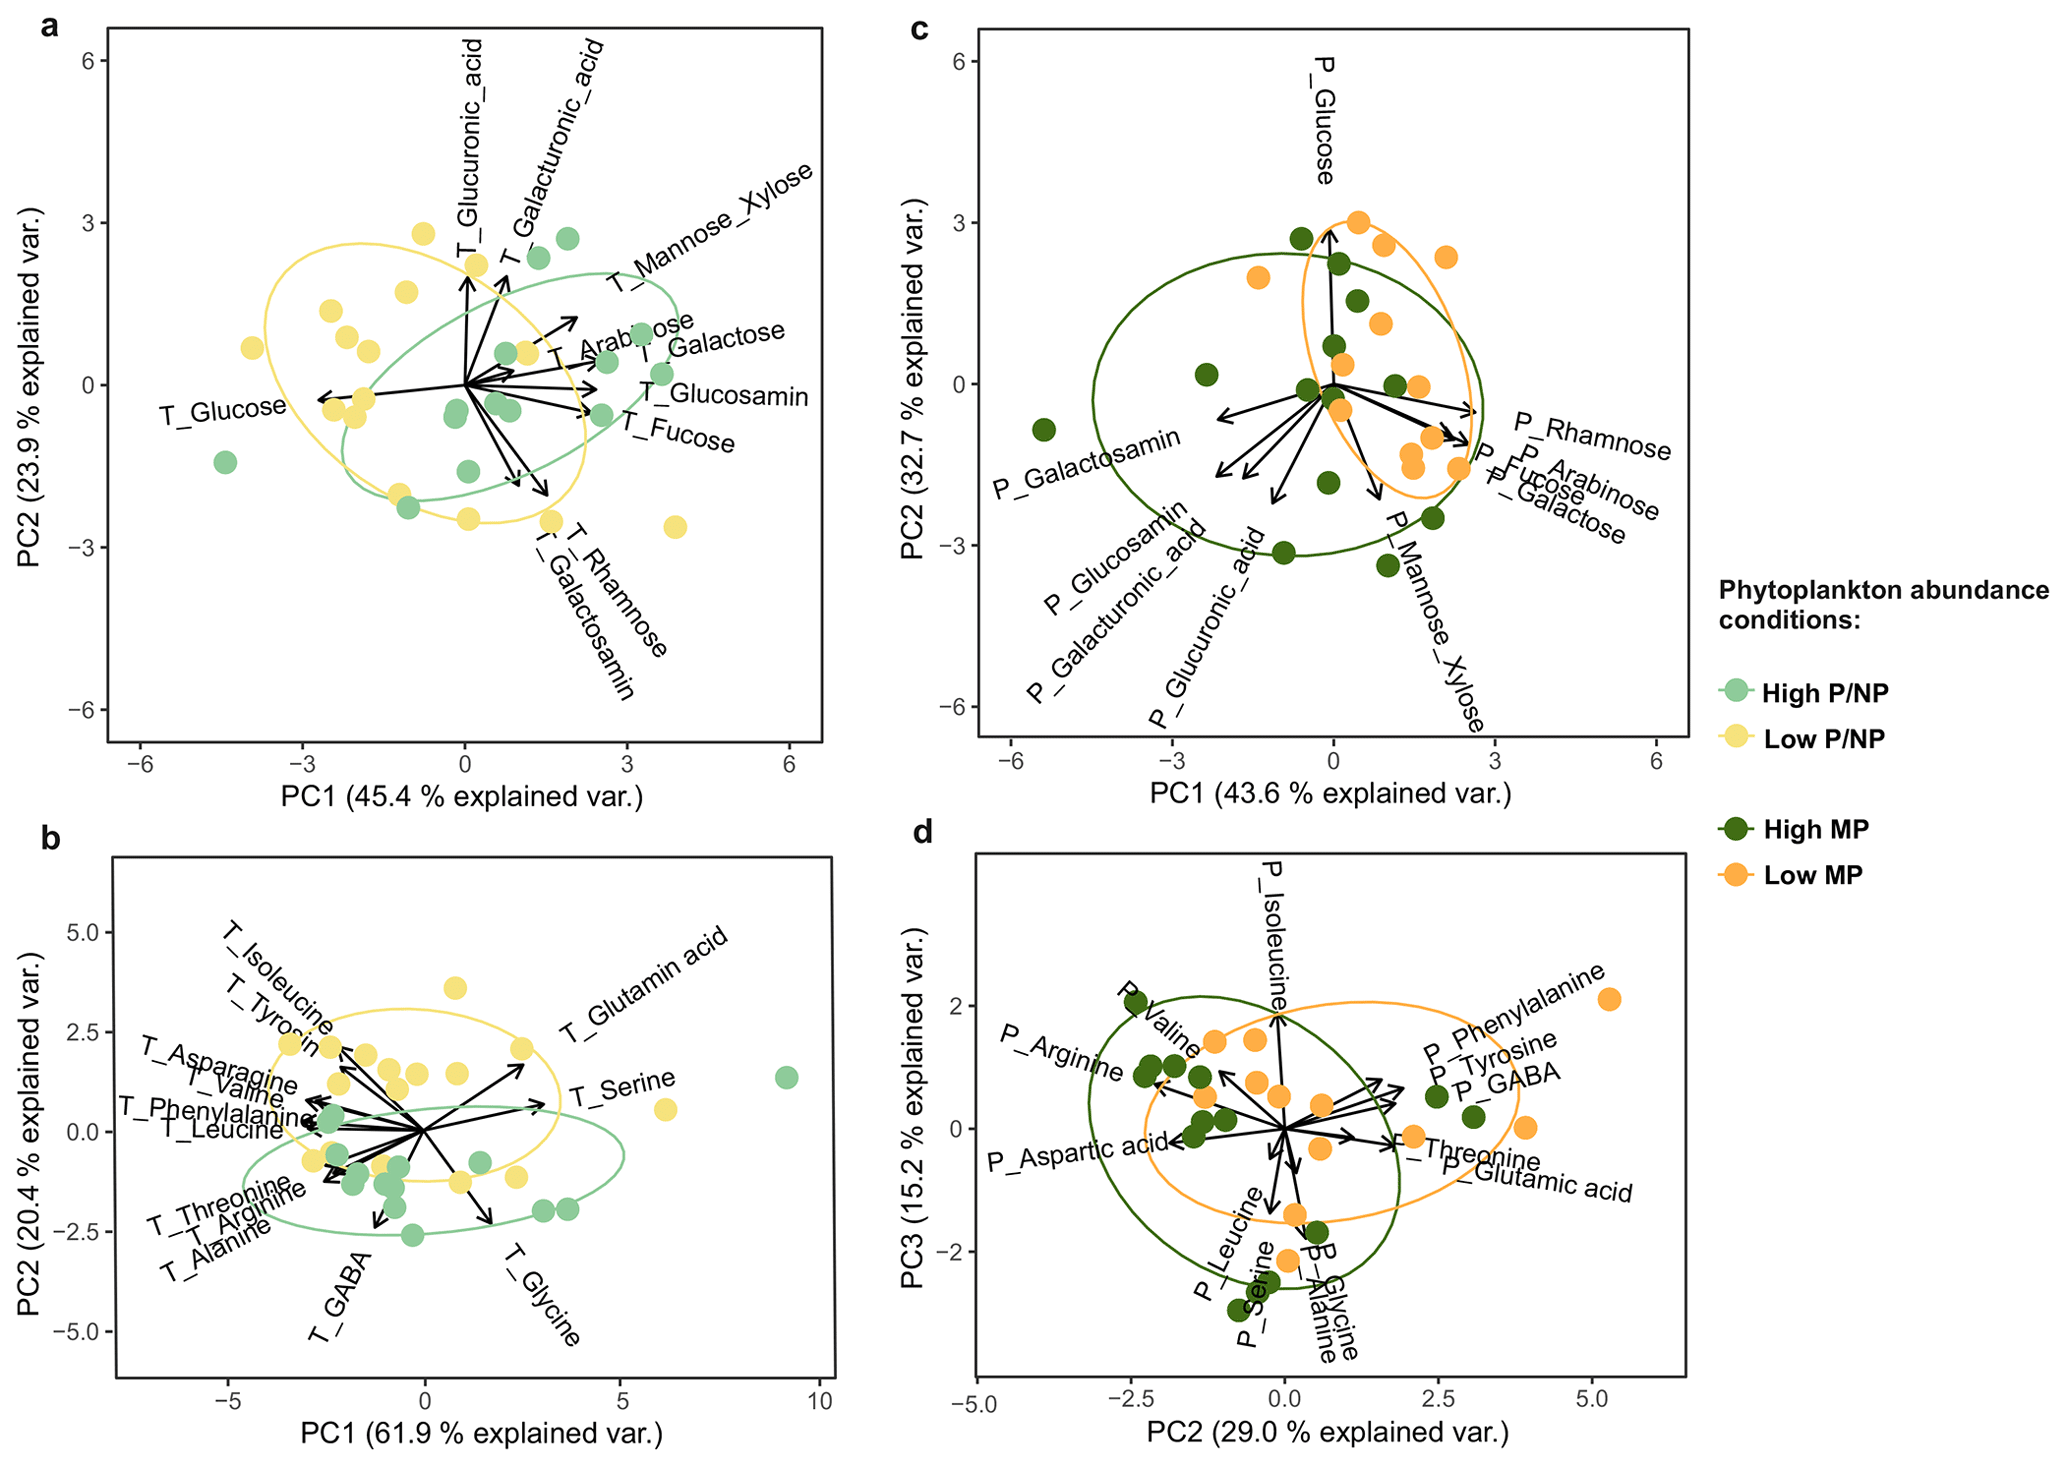
Figure 8Principal component analyses (PCA) were conducted to detect compositional differences between microphytoplankton (MP) and pico- and nanophytoplankton (P/NP) abundance conditions. Biplots show (a) total combined carbohydrates (TCCHO), (b) total amino acids (TAA), (c) particulate combined carbohydrates (PCCHO) > 20 µm, (d) and particulate amino acids (PAA) > 20 µm. Scores are colored based on High P/NP (light green), Low P/NP (light yellow), High MP (dark green) and Low MP (dark yellow) conditions. Arrows show variable loadings; axes are scaled to unit variance and annotated with percent variance explained.
The compound-specific analysis of PCCHO > 20 µm and PAA > 20 µm revealed distinct compositional differences between High MP and Low MP conditions, primarily separating along PC1 (explained variance: 43.6 %; Fig. 8c) and PC2 (explained variance: 29.0 %; Fig. 8d), respectively. During High MP conditions, PCCHO > 20 µm was characterized by elevated contributions of particulate galactosamine, along with notable proportions of particulate glucosamine, galacturonic acid, and glucuronic acid (Fig. 8c). In contrast, Low MP conditions were associated with higher relative contribution of particulate rhamnose, fucose, arabinose, and galactose. The PCA of PAA > 20 µm further indicated that particulate GABA, tyrosine, phenylalanine, and glutamic acid were associated with Low MP conditions, whereas the enrichment of arginine and aspartic acid characterized most samples associated with High MP conditions (Fig. 8d).
3.4 Species-specific correlations
To investigate potential links between phytoplankton species and major biomolecules, we conducted a correlation analysis between species-associated biomass and the biomolecular composition of carbohydrates and amino acids within the total and particulate > 20 µm fractions of the SML/Surface as well as the ULW/ULW-Net. Dinophysis sp., Diplopsalis (group) and Chaetoceros sp. were excluded from the correlation matrix due to their low abundance.
For TCCHO, no positive correlations with phytoplankton species were found, thus, results are only presented within the supplementary information (Fig. S9). The relative biomass of the diatom Cylindrotheca closterium correlated significantly negatively with total glucosamine (ρ= –0.60, p= 0.03), fucose (ρ= −0.60, p= 0.03) and rhamnose (ρ= −0.55, p= 0.05) in the SML and in the ULW with total fucose (, p= 0.01).
Among TAA (Fig. 9a), positive correlations for Nodularia spumigena and Cylindrotheca closterium were observed in the SML with total isoleucine (ρ= 0.68, p= 0.01; ρ= 0.62, p= 0.024), and tyrosine (ρ= 0.66, p= 0.013; ρ= 0.62, p= 0.024) and a negative correlation with total glycine. Aphanizomenon sp. correlated negatively with total glutamic acid (, p= 0.029) and total isoleucine (, p= 0.039). Synechococcus sp. biomass showed the only positive correlation in the SML with total GABA (ρ= 0.57, p= 0.041). In the ULW, Nodularia spumigena biomass showed a positive association with total glutamic acid (ρ= 0.59, p= 0.035), in contrast to the SML. Cylindrotheca closterium biomass correlated highly positively with total aspartic acid (ρ= 0.84, p= 0.00038) and less strongly with isoleucine (ρ= 0.69, p= 0.0087), but negatively with total glycine (, p= 0.0017) and GABA (, p= 0.044). Pseudo-nitzschia delicatissima biomass showed a positive correlation with total GABA (ρ= 0.74, p= 0.0038) and total threonine (ρ= 0.61, p= 0.028), while a negative correlation with total threonine (, p= 0.017) was observed for Aphanocapsa sp. biomass.
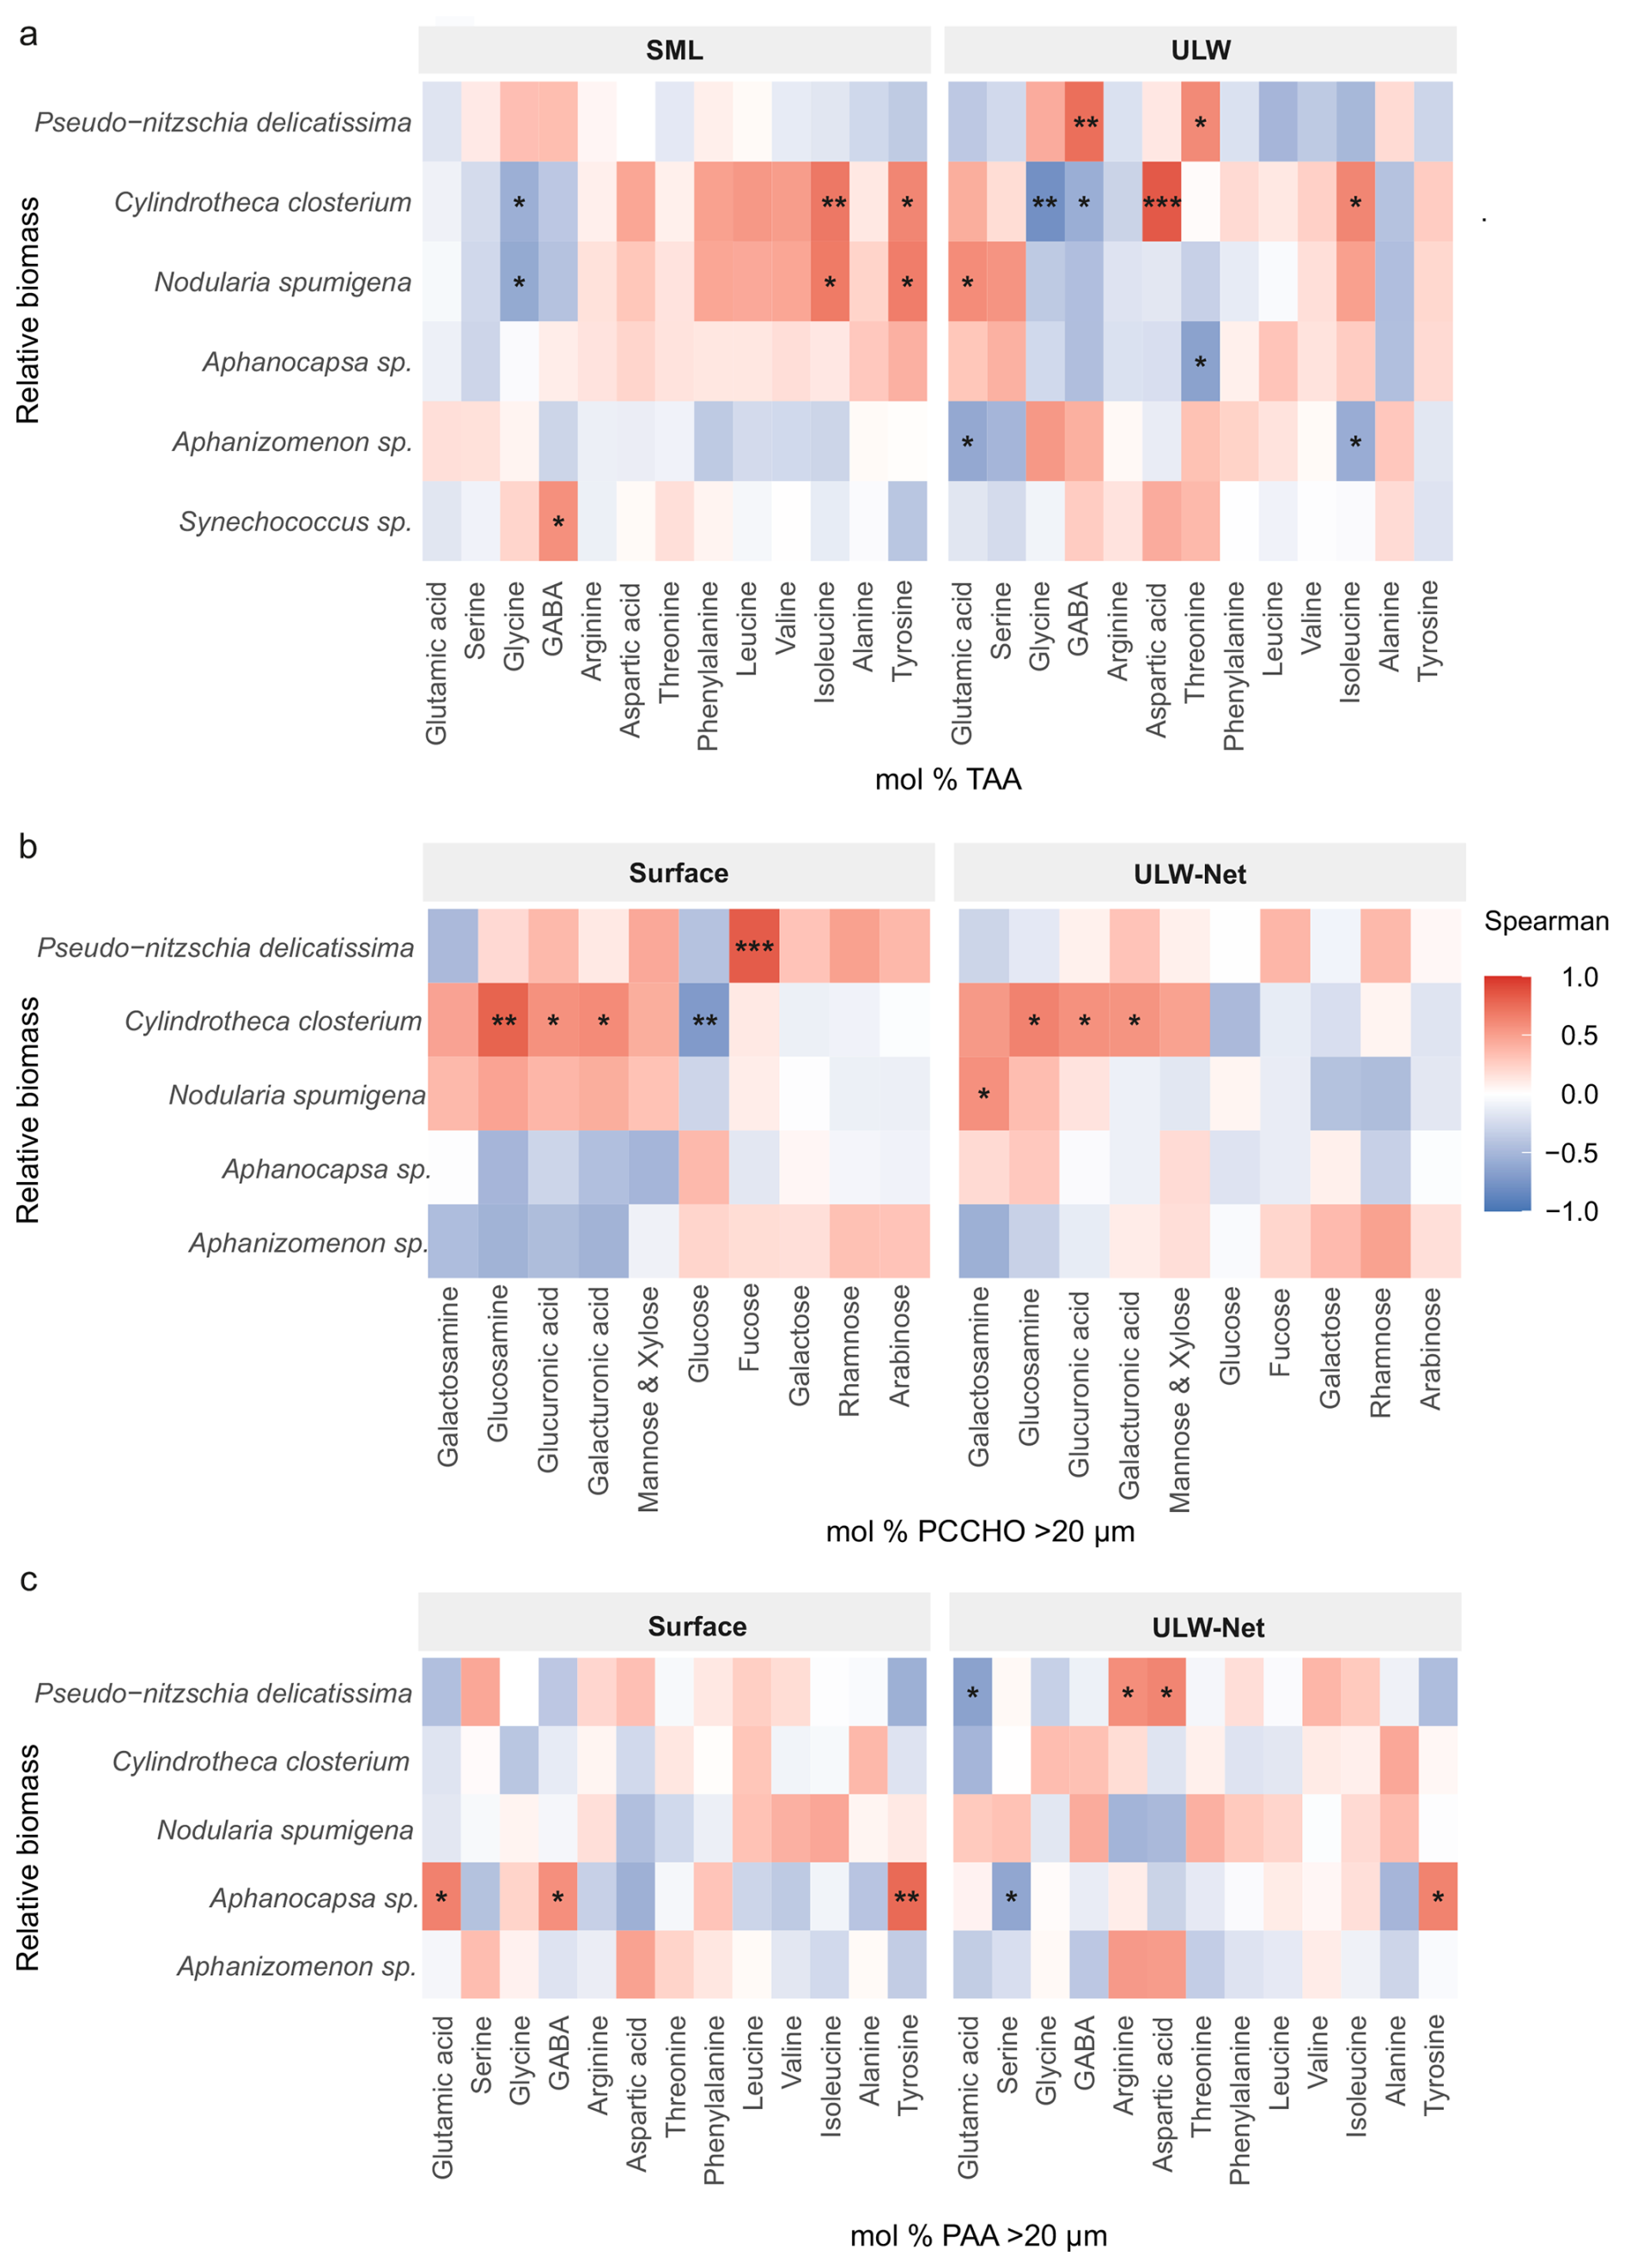
Figure 9Heatmaps of Spearman's rank-order correlations (ρ) between relative phytoplankton biomass and mol % of (a) total amino acids (TAA), (b) particulate combined carbohydrates (PCCHO) > 20 µm, and (c) particulate amino acids (PAA) > 20 µm in the SML/Surface (left) and ULW/ULW-Net (right). Carbohydrates and amino acids have been reordered by hierarchical clustering to group positively and negatively associated carbohydrates and amino acids. Tile colors range from blue () through white (ρ=0) to red (ρ= +1), and significant correlations are marked with asterisks (*p< 0.05; p< 0.01; 0.001). Correlations with Synechococcus sp. Biomass were only performed for TAA.
For PCCHO > 20 µm, several significant positive correlations with phytoplankton species were observed (Fig. 9b). In the Surface, the biomass of Cylindrotheca closterium showed the strongest positive correlation with particulate glucosamine (ρ= 0.79, p= 0.0013), followed by positive correlations with particulate glucuronic acid (ρ= 0.57, p= 0.044) and galacturonic acid (ρ= 0.60, p= 0.031) (Fig. 9b). Furthermore, in the Surface, Pseudo-nitzschia delicatissima biomass was significantly correlated with particulate fucose (ρ= 0.82, p= 0.0006). Cylindrotheca closterium biomass was negatively correlated with particulate glucose (, p= 0.0067). Other phytoplankton groups exhibited weaker or non-significant correlations in the Surface. In the ULW-Net, Cylindrotheca closterium retained its positive, although weaker, correlation to particulate glucosamine (ρ= 0.64, p= 0.018), glucuronic acid (ρ= 0.57, p= 0.044), and galacturonic acid (ρ= 0.55, p= 0.049).
Within the PAA > 20 µm pool, only Aphanocapsa sp. showed statistically significant positive correlations in the Surface (Fig. 9c). Its biomass correlated positively with particulate glutamic acid (ρ= 0.65, p= 0.017), GABA (ρ= 0.58, p= 0.039) and strongest with tyrosine (ρ= 0.76, p= 0.0024) (Fig. 9c). In the ULW-Net, two taxa displayed weak but significant positive links. Pseudo-nitzschia delicatissima biomass correlated with arginine (ρ= 0.58, p= 0.036) and aspartic acid (ρ= 0.63, p= 0.021), while Aphanocapsa sp. biomass correlated positively with tyrosine (ρ= 0.64, p= 0.019). Negative correlations were observed between Pseudo-nitzschia delicatissima biomass and particulate glutamic acid (, p= 0.016) and Aphanocapsa sp. biomass and particulate serine (, p= 0.025).
4.1 Phytoplankton composition in the Central Baltic Sea
The overarching goal of this study was to determine whether phytoplankton dynamics are reflected in SML composition, with a specific focus on cyanobacteria. To contextualize biomolecular dynamics, changes in the dominant phytoplankton members throughout the cruise will be discussed first. About 96 % of the MP biomass (6.78 ± 8.28 µg C L−1) was contributed by cyanobacteria, with an estimated mean biomass of 6.52 ± 8.12 µg C L−1. Aphanizomenon sp., Nodularia spumigena, and Aphanocapsa sp. represented the dominant taxa, with the first two typically occurring in filamentous life stages (Wasmund, 1997) and the latter forming non-filamentous colonies (Komárek, 2003). Nodularia and Aphanizomenon were also shown to generally represent the dominant genera during the Baltic Sea summer in the Eastern Gotland Basin (Ploug, 2008; Zettler et al., 2024; HELCOM, 2025). During our cruise, Aphanizomenon sp. showed a mean biomass of 3.17 ± 3.37 µg C L−1 and Nodularia spumigena of 3.31 ± 5.15 µg C L−1 (Fig. 4). This is lower than the estimate by Karlson et al. (2022), who reported a mean summer biomass of 15 µg C L−1 for both genera from the period 2000–2020. Wasmund (1997) suggested that, based on data collected from 1979–1993 in the Baltic proper and addressing Aphanizomenon sp. as the dominant genus, a biomass of up to 22 µg C L−1 (200 µg L−1 wet weight) can still be considered as a background concentration, while everything above should be defined as a bloom. According to HELCOM (2025), the recent mean of cyanobacterial biomass from June to August (2000–2023) was slightly below the long-term mean of 220 µg L−1 (wet weight), which corresponds to the bloom threshold set by Wasmund (1997) for Aphanizomenon sp. Overall, in comparison to previous published values, our taxa-specific biomass estimates for Aphanizomenon sp. and Nodularia spumigena are in the same order of magnitude and, following the interpretation of Wasmund (1997), do not align with bloom conditions. Cyanobacterial biomass > 20 µm sampled here made up 5.2 % to 28.7 % (mean: 12.7 %) of POC > 20 µm, which was on average 4.40 ± 5.23 µM (Fig. 6b). Nausch et al. (2002) reported a mean surface POC concentration of 26.8 µM for the Baltic Sea, however, including all particles > 0.7 µm. Likely, our cruise was slightly too early in the year to catch the summer blooms and we witnessed only the beginning accumulation of cyanobacterial biomass. In general, the spatial pattern of cyanobacteria accumulations on the surface is extremely patchy, as documented from remote-sensing and field studies (Kahru et al., 1994; Kutser, 2004; Seppälä et al., 2007; Karlson et al., 2022). A recent paper from Kahru et al. (2025) showed the frequency of the occurrence of cyanobacteria blooms from June to August during 2000–2024. For the area where our cruise was conducted, they found that roughly every fifth year no major accumulation of cyanobacterial biomass occurred. Additionally, they suggested that instead of sea surface temperature, surface irradiance causes the initiation of such blooms, implying that temporal seasonal offsets in the accumulation of biomass might occur in dependence on weather dynamics.
The Chl a concentration detected in this study (2.06 ± 0.34 µg L−1) was lower than later in the same year (3.23 µg L−1, August 2022), and close to our research area during a subsequent EMB298 cruise (Zettler et al., 2024). However, Bunse et al. (2019) noted Chl a concentrations similar to ours, and ranging from 1.68 to 2.41 µg L−1 during the summer months (June–September) in 2011 to 2014 west of Gotland. Our data showed that Chl a concentration increased over the course of the cruise from 1.63 ± 0.015 µg L−1 at the first station to 2.47 ± 0.1 µg L−1 at the last station (Fig. 2a). In parallel, also P/NP cells increased during our cruise (Fig. 2b). Other studies reported that picophytoplankton can significantly contribute to Chl a (Sondergaard, 1991; Stal et al., 1999; Ohlendieck et al., 2000; Stal, 2003; Tamm et al., 2018). We found an overall P/NP cell abundance of 69 ± 45 × 103 cells mL−1 based on flow cytometry for the Central Baltic Sea. This is comparable to other studies, which found picocyanobacteria abundances of 150 to 550 × 103 cells mL−1 during summer (Albertano et al., 1997; Mazur-Marzec et al., 2013). In June 2015, a study in the Gotland Basin observed phytoplankton (including phycoerythrin- and Chl a-rich pico- and nanoplankton) abundances of ∼ 96 × 103 cells mL−1 at 1 m depth (Cisternas-Novoa et al., 2019), which are in line with our cell counts of the ULW (68 ± 41 × 103 cells mL−1). Zufia et al. (2021) established that the abundance of phycoerythrin-rich picophytoplankton peaked during summer, which was consistent with other Baltic Sea studies (Mazur-Marzec et al., 2013; Larsson et al., 2014; Tamm et al., 2018). Overall, Chl a concentration and P/NP abundances fell within the expected range for Baltic Sea summer conditions.
To compare the biomass of Synechococcus sp. with other studies, we estimated their biomass based on cell counts. Reported estimates of Synechococcus cellular carbon content range from 0.1 to 1.5 pg C cell−1 (Moisan et al., 2010). Here, we used an average carbon content of 0.3 pg C cell−1 based on Buitenhuis et al. (2012) and also applied by Hepach et al. (2020) for the Baltic Sea. We calculated an overall average Synechococcus sp. biomass of 12.63 ± 12.18 µg C L−1, which did not differ between SML and ULW. The elevated Synechococcus sp. biomass during High P/NP conditions is comparable to other biomass values found for picophytoplankton during summer (Paczkowska et al., 2017). Additionally, Paczkowska et al. (2017) investigated that during summer (August), picocyanobacteria were the dominant size group, forming 40 %–90 % of the total biomass in all basins of the Baltic Sea. This aligns with our findings, which show that, Synechococcus sp. biomass was higher than that of filamentous cyanobacteria-dominated, even under High MP conditions (Fig. 4). Other studies also align with these findings (Andersson et al., 1996; Hajdu et al., 2007), and report a Synechococcus contribution of 65 % to phytoplankton biomass in the Baltic Proper with nitrogen-fixing cyanobacteria (Aphanizomenon spp. and Nodularia spp.) being the second dominant group (Stal et al., 1999).
4.2 General SML dynamics in dependence of phytoplankton composition
Although the associated MP biomass reported here does not indicate the presence of a typical cyanobacteria bloom, phytoplankton members and biomass dynamically changed throughout the cruise. Dominant phytoplankton members were represented by filamentous (Aphanizomenon sp. and Nodularia spumigena), colonial (Aphanocapsa sp.) and unicellular (Synechococcus sp.) cyanobacteria. These bloom-forming taxa typically dominate phytoplankton abundance and biomass (see Sect. 4.1) and are therefore likely the primary contributors to organic matter production. Nevertheless, less abundant species (with relatively large cell sizes or high per-cell biomass) may also further contribute to SML biomolecular composition via EPS production, or the release of surface-active compounds. However, these minor contributions are not the focus of this study.
The phytoplankton community during this study potentially influenced the organic matter pool as differences in biomolecular concentrations were revealed between depths (SML vs. ULW, Surface vs. ULW-Net) and abundance conditions (High MP vs. Low MP, High P/NP vs. Low P/NP). The highest average EF was detected for TAA (1.2 ± 0.4), while TCCHO and TOC exhibited EFs of approximately 1, independent of phytoplankton abundance. Previously reported EFs in the Western Baltic Sea during summer averaged around 1.1 for dissolved and particulate amino acids (Barthelmeß and Engel, 2022). At the Western Baltic Sea time series station Boknis Eck, an earlier study reported great seasonal variability in TAA and TCCHO concentrations and SML enrichment during two consecutive years, with EFs ranging between 0.8 and 1.2 (Dreshchinskii and Engel, 2017). TAA concentrations in the SML peaked in autumn with a maximum EF of 2.4 (Dreshchinskii and Engel, 2017), which is comparable to the highest TAA EF of 2.3 (Fig. S7; station 06) reported in this study. TCCHO concentrations in the SML peaked in autumn (∼ 5 µM) and were comparable to those observed in this study (SML: 5.53 ± 1.06 µM), although the maximum reported EF (1.4) was slightly lower than the highest value found here (1.8; Fig. S7, station 07). The enrichments of TAA and TCCHO in the SML of the Central Baltic Sea found in this study are thus in line with previous reports and further emphasize that SML enrichment patterns are compound-specific. At the time series station Boknis Eck, only one SML sample showed TAA concentration > 3.0 µM during two consecutive years (Dreshchinskii and Engel, 2017). Hence, TAA concentrations observed during this study (e.g. with a mean of 3.72 ± 1.35 µM in the SML during High MP condition) were thus substantially higher than concentrations previously recorded in the Western Baltic Sea.
The enrichment of surfactants in the SML was similar across phytoplankton abundance conditions, with comparable EF values observed for High P/NP (1.1 ± 0.2; median = 1.1) and Low P/NP (1.1 ± 0.2; median = 1.0). Although the median EF was slightly higher during High P/NP conditions, the overall differences were small and not statistically significant. During High P/NP, we further measured the highest surfactant concentrations (0.56 ± 0.08 mg L−1 TX-100 equiv.) in the SML (Fig. 5c). In line with our results, averaged EFs of surfactants ranged between 0.9 and 1.4 in coastal regimes of the North Sea and Baltic Sea (Stolle et al., 2020; Barthelmeß and Engel, 2022). EFs of surfactants are generally lower in eutrophic regimes (Wurl et al., 2011), such as the Baltic Sea. However, exceptionally high surfactant concentrations may occur in coastal regions or under specific oceanic conditions at low wind regimes and tend to condense into visible surface slicks, exceeding a concentration of 0.65 mg L−1 equiv. TX-100 (Wurl et al., 2016; Sabbaghzadeh et al., 2017; Mustaffa et al., 2020). Depending on the region and season, previously reported surfactant concentrations in coastal seas differ considerably. For the SML in a coastal transect off North East England, the authors reported a seasonal minimum and maximum of 0.08 and 0.38 mg L−1 equiv. TX-100, respectively (Pereira et al., 2016). During spring, diel variability of SML surfactant concentrations ranged between 0.17 and 0.26 mg L−1 equiv. TX-100 at a coastal station of the North Sea (Stolle et al., 2020). In the Western Baltic Sea, SML surfactant concentrations varied between 0.28 and 0.49 mg L−1 equiv. TX-100 during two consecutive seasons (Barthelmeß and Engel, 2022). Estuarine and riverine surfactant concentrations, in contrast, frequently exceeded 1.00 mg L−1 equiv. TX-100 (Rickard et al., 2022). In summary, surfactant concentrations reported here were rather high in comparison to other coastal stations including the Western Baltic Sea (Barthelmeß and Engel, 2022).
Although TOC enrichment was close to 1, concentrations varied significantly with depth during High P/NP (Fig. 5a). The average TOC concentrations in the SML presented here was 396 ± 22 µM. TOC and DOC concentrations in the Baltic Sea are comparable, as POC constitutes only a minor fraction of TOC (Strååt et al., 2016). In the Baltic Proper, it is estimated that 74 % to 77 % of DOC in spring and autumn, respectively, can be attributed to riverine input (Seidel et al., 2017). DOC concentrations steadily decline towards the Western Baltic Sea due to mixing with inflowing North Sea water, also reducing the contribution of terrestrial DOC (Seidel et al., 2017). Within the Western Gotland Sea, DOC concentration exhibited a seasonal range of 327 to 472 µM (mean 361 µM), while peaking during the summer months, reflected by an increase of ∼ 50 µM (Bunse et al., 2019). This summer increase is potentially associated with autochthonous production (Seidel et al., 2017). Depending on the season and region, TOC concentrations in the Baltic Sea are exceptionally high in comparison to other coastal seas, and due to the high terrestrial DOC load. In summary, the general SML enrichment pattern as well as carbohydrate concentrations aligned with previous results reported from the Western Baltic Sea or elsewhere. TAA and surfactant concentrations, however, were notably elevated in the Central Baltic Sea in comparison to the Western Baltic Sea. The observed summer TOC variability can likely be attributed to phytoplankton production.
4.3 Specific biomolecular pattern associated with distinct phytoplankton members
In line with categorizing MP into high and low abundance, POC, cyanobacterial biomass > 20 µm, PAA and PCCHO > 20 µm concentration were highest in the ULW-Net during High MP. PAA and PCCHO > 20 µm contributed on average 12.9 ± 6.4 % and 10.1 ± 2.3 % to POC > 20 µm, respectively. This corresponds roughly to the proportion of amino acids and carbohydrates reported for particulate organic matter in the surface ocean (∼ 30 %, pore size ∼ 0.4 µm, Kaiser and Benner, 2009). Cell-based MP biomass estimates and measured POC > 20 µm concentrations diverged considerably, as the biomass contributed only 13.5 ± 6.2 % to POC > 20 µm concentrations. Satellite and in-situ observations corroborate that phytoplankton biomass in temperate and more productive regimes substitutes between 10 % to 30 % of POC only (Arteaga et al., 2016). The residual POC, which was not explained by the apparent biomass, may be attributed to the associated extracellular material constituting the filamentous and colonial lifestyle of cyanobacteria, with contributions of detached gel-like particles, inhabiting heterotrophic bacteria as well as detrital material (Mari and Kiørboe, 1996; Engel et al., 2004; Pannard et al., 2016, Cisternas-Novoa et al. 2019). Indeed, the observed correlation between POC > 20 µm and cellular MP biomass (Fig. S4) indicates that particulate organic matter was largely associated with filamentous and colonial cyanobacteria, including detrital and extracellular components. During this study, POC > 20 µm concentration contributed on average 1.2 ± 1.4 % to TOC and varied with conditions (High MP: 1.6 ± 1.7 % of TOC; Low MP: 0.7 ± 0.7 % of TOC). Our results confirm the assumption that filamentous or colonial cyanobacteria can influence the total organic matter pool of the Central Baltic Sea, even in the absence of a bloom. PAA accounted for a significantly larger proportion of TAA under High MP conditions (5.4 ± 4.8 %) than under Low MP conditions (1.9 ± 1.9 %). In contrast, the overall contribution of PCCHO > 20 µm to TCCHO (1.3 ± 1.2 %) and the difference between conditions were considerably smaller.
PAA > 20 µm showed high fractions of the particulate amino acid arginine in comparison to TAA (Fig. 7d vs. b). Arginine defined a specific cluster of High MP conditions (PCA Fig. 8d), which was most likely associated with co-occurring Pseudo-nitzschia delicatissima and Aphanizomenon sp. (Fig. 9c), of which the latter constituted a considerably higher biomass. The fraction of arginine in the PAA pool (> 20 µm) of the Central Baltic Sea was particularly higher than in the Western Baltic Sea (Barthelmeß and Engel, 2022), where filamentous cyanobacteria are mostly absent. Moreover, PCCHO > 20 µm was composed of elevated fractions of glucose and glucuronic acid in comparison to the total fraction (Fig. 7a, c). While particulate glucose defined filamentous and colonial cyanobacteria during High MP and Low MP conditions equally (Fig. 8c), elevated ratios of glucuronic acid, glucosamine, galacturonic acid, and galactosamine aligned with High MP conditions (Fig. 8b) and further correlated with Cylindrotheca closterium and Nodularia spumigena (Fig. 9a), of which the later constituted the higher biomass. The higher percentage of particulate glucose is characteristic for productive regimes, as reported in previous studies (Engel et al., 2012; Barthelmeß and Engel, 2022).
As outlined above, the contributions of MP and P/NP members were notably reciprocal (High MP conditions correspond to Low P/NP conditions and vice versa). The co-occurrence of specific phytoplankton taxa is not random but potentially relates to trophic or allelopathic interactions, such as the transfer of newly fixed nitrogen from filamentous cyanobacteria to diatoms (Chen et al., 2011) or species-specific selection via the release of allelochemicals. Nodularia spumigena may cause a decline in growth and physical cell damage to specific diatoms by the release of toxins (Śliwińska-Wilczewska et al., 2019), or be adversely affected by diatoms (Lage et al., 2022). In the latter study, co-culturing resulted in an upregulated release of specific peptides by Nodularia. spumigena. Allelopathic interaction between Baltic strains of cyanobacteria has been also observed, such as a multifactorial growth suppression of Nodularia spumigena by Synechococcus sp. (Barreiro Felpeto et al., 2018). Allelopathic effects may thus explain why reciprocal patterns were found for the conditions of MP and P/NP abundance i.e. elevated contributions of Synechococcus sp. occurred with decreased cyanobacterial biomass > 20 µm in 10 out of 13 sample sets (Table A2). To summarize, specific biomolecular patterns of the SML could be associated with the particulate fraction and the occurrence of filamentous and colonial cyanobacteria, as well as with the total fraction and the predominant occurrence of picophytoplankton (Synechococcus sp.), respectively.
4.4 The influence of cyanobacteria on the ambient organic matter pool
The reciprocal pattern of the occurrence of MP and P/NP further allows to determine whether filamentous and colonial or unicellular cyanobacteria potentially exhibit a biomolecular imprint on the total organic matter pool. In Fig. 8a, galactose and glucose defined the main variance along PC1 (TCCHO). While the former represented High P/NP conditions, the latter aligned with High MP conditions. The variance along PC2 was associated with glucuronic acid and further influenced samples related to High MP conditions. As previously noted, glucose and glucuronic acid defined major differences between the PCCHO (> 20 µm) and TCCHO pool (Fig. 7a, c). The described pattern can therewith be interpreted as a subtle biomolecular imprint of filamentous and colonial cyanobacteria on the ambient TCCHO pool. In Fig. 8b, the main variance along PC1 was defined by a bundle of amino acids (incl. total arginine, leucine, phenylalanine), which are often associated with fresher material from the surface ocean, and were opposed by total glutamic acid, serine and glycine of which the latter two define degraded rather than freshly produced organic matter (Dauwe et al., 1999; Kaiser and Benner, 2009). Amino acids characteristic of fresher material were thus associated with the ULW (Fig. S8). Consistently, the PCA reveals a more pronounced separation of TAA composition between SML and ULW samples (Fig. S8; PC1) than between the High P/NP and Low P/NP condition (Fig. 8b; PC2). This pattern suggests that depth-related differences exert a stronger influence on TAA variability than the distinction between P/NP-associated conditions. However, filamentous and colonial cyanobacteria dominated in the ULW during High MP conditions (Fig. 4), while Synechococcus sp. occurred in similar abundances in both the SML and ULW. Tentatively, a biomolecular imprint of filamentous and colonial cyanobacteria defined by predominantly particulate arginine but also leucine (PAA, Fig. 8d) can thus be detected along the negative PC1 (TAA, Fig. 8b). This aligns as well with the subtle recognized differences between the average mean composition of PAA (> 20 µm) and TAA (Fig. 7b, d).
Heterocystous cyanobacteria, such as Nodularia sp. and Aphanizomenon sp. are a monophyletic group (Komárek and Komárková, 2006; Tomitani et al., 2006). Filamentous and colonial cyanobacteria with the ability to fix atmospheric nitrogen accumulate cyanophycin within their heterocysts. Cyanophycin is a polymer composed of arginine and aspartate (Flores et al., 2019). Specific anabolic pathways using the four nitrogen atoms of arginine therewith establish cyanophycin as a labile nitrogen reservoir in heterocystous cyanobacteria during unbalanced growth conditions (Flores et al., 2019) and may explain the particularly high fraction of arginine in the PAA > 20 µm pool as well as its subtle influence on the composition of the ULW (TAA). While cyanobacteria accumulate cyanophycin within their heterocysts (Flores et al., 2019), these specialized cells rely on the supply of carbohydrates from adjacent vegetative cells (Nürnberg et al., 2015; Stuart et al., 2016). Interestingly, glucose dominates this intercellular trophic exchange and further constitutes the associated extracellular material (Nürnberg et al., 2015; Stuart et al., 2016). Within cyanobacterial mats, glucose polymers are made available by the release of extracellular enzymes (Stuart et al., 2016). In accordance, an increased fraction of uronic acids and amino sugars has been attributed to aid EPS aggregation as summarized by Engel et al. (2020). Glucose, amino sugars and uronic acids were elevated in PCCHO > 20 µm (Fig. 7c) and associated with High MP conditions (Fig. 8c) and thus characterized in particular the extracellular material of the filamentous and colonial cyanobacteria, which is further inhabited by a rich heterotrophic community. Heterotrophic bacteria profit from the extracellular and aggregated resources, likewise replenishing the pool of extracellular proteins further (Stuart et al., 2016). To conclude, we found that both MP and P/NP influenced the ambient total organic matter pool, as evident from specific biomolecular contributions, which can likely be explained by trophic and allelopathic interactions.
4.5 How surfactants relate to biomolecular dynamics
In general, elevated surface activity has been associated with both the particulate and dissolved fraction as well as with fresh and degraded organic matter profiles (Zutić et al., 1981; Engel et al., 2018; Barthelmeß and Engel, 2022). As summarized by Barthelmeß and Engel (2022), amino acids accumulating in the SML are usually characterized by a higher polarity and are represented by arginine, glutamic acid, and serine. This is again supported by the data presented here, as total serine and glutamic acid seemed to be relatively more abundant in the SML (Fig S8).
Explicitly arginine has been suggested as a potent candidate to enhance surface activity (Engel et al., 2018). While relatively higher fractions of arginine accompanied the predominant occurrence of filamentous and colonial cyanobacteria in the ULW (Fig. 8d), surfactant concentrations were higher by trend within the SML under the prevalence of the unicellular cyanobacterium Synechococcus sp. (High P/NP). On the one hand, we found elevated fractions of galactose as well as Chl a during High P/NP characterized by elevated Synechococcus sp. biomass (20.59 ± 15.17 µg C L−1). Elevated Chl a concentration and galactose fractions indicate that a system is typically dominated by phytoplankton production rather than bacterial degradation (Barthelmeß et al., 2021; Engel et al., 2012). On the other hand, heterotrophic bacteria release surfactants to enhance substrate availability and uptake (Satpute et al., 2010). Higher surfactant enrichment has been shown to occur in alignment with advanced organic matter degradation (Wurl et al., 2011; Barthelmeß and Engel, 2022). GABA characterized the organic matter pool during High P/NP and has been associated with, first, advanced bacterial processing (Davis et al., 2009) and, second, the accumulation of surfactants at the air–sea interface (Engel et al., 2018).
Direct attribution of individual biomolecules to cyanobacterial production versus heterotrophic processing remains limited, because most available studies rely on correlations with community composition or gene expression rather than direct compound-specific source tracing (Berg et al., 2018; Barthelmeß and Engel, 2022). Thus, the SML surfactant pool, explicitly during High P/NP conditions, should be understood as the outcome of an interplay between cyanobacterial inputs and subsequent microbial reworking, rather than as a signal attributable to one group alone. In conclusion, we suggest that the surfactant pools during our study were dominated by condition-dependent, elevated phytoplankton production with potential contributions from heterotrophic microbial processing. Notably, while the Central Baltic Sea harbours a rich reservoir of microbially altered terrestrial material, also abiotic factors such as solar radiation (Rickard et al., 2022) or anthropogenic pollutants may alter surface activity (Wurl and Obbard, 2004).
In general, elevated TAA concentrations in the Central Baltic Sea likely reflect the high biomass of filamentous and colonial cyanobacteria. Surfactant concentrations reported here were also rather high in comparison to other coastal stations. This is in line with Mustaffa et al. (2020), who encountered an extensive Trichodesmium sp. bloom in the open ocean Pacific, which provoked a slick-covered surface. High surfactant concentrations suggest a pronounced suppression of air–sea gas fluxes (Pereira et al., 2016; Mustaffa et al., 2020) and exceeding the effect size of the surfactant pool, which is present in the Western Baltic Sea (Barthelmeß and Engel, 2022).
This study examined whether phytoplankton dynamics are reflected in the composition of the SML, focusing on cyanobacteria. Although no typical bloom occurred, the phytoplankton community varied dynamically throughout the cruise, resulting in clear differences in biomolecular composition between depths (SML vs. ULW; Surface vs. ULW-Net) and between phytoplankton defined conditions (High P/NP vs. Low P/NP; High MP vs. Low MP). SML enrichment patterns and carbohydrate concentrations generally aligned with previous observations from the Western Baltic Sea, while TAA and surfactant concentrations were notably higher in the Central Baltic Sea. This likely reflects enhanced phytoplankton production under a favourable salinity range (3.8–11.5 PSU), supporting filamentous and colonial diazotroph cyanobacteria, and unlike the more saline Western Baltic Sea (> 12 PSU). Distinct biomolecular signatures indicated contributions from both MP and P/NP. Elevated TCCHO concentrations during High P/NP conditions suggest that P/NP, dominated by Synechococcus sp., drove carbohydrate and surfactant production, whereas the tendency towards higher TAA and PAA concentrations during High MP conditions, dominated by Aphanizomenon sp., Nodularia spumigena, and Aphanocapsa sp., points to a stronger influence of filamentous/colonial cyanobacteria on proteinaceous material. Compared to the Western Baltic Sea, elevated surfactant and TAA concentrations, along with the observed biomolecular imprints, indicate that cyanobacteria have a strong influence on the organic matter and surfactant pool in the Central Baltic Sea.
Table A1Overview of stations sampled during EMB295 cruise. A cross indicates stations at which particulate matter > 20 µm was sampled with the Neuston catamaran and ULW net. The table also indicates whether SML sampling was performed with the glass plate or Garrett screen and whether ULW sampling was performed with a manually deployed water sampler. Morning and afternoon sampling took place at each station, except for the first and last station.
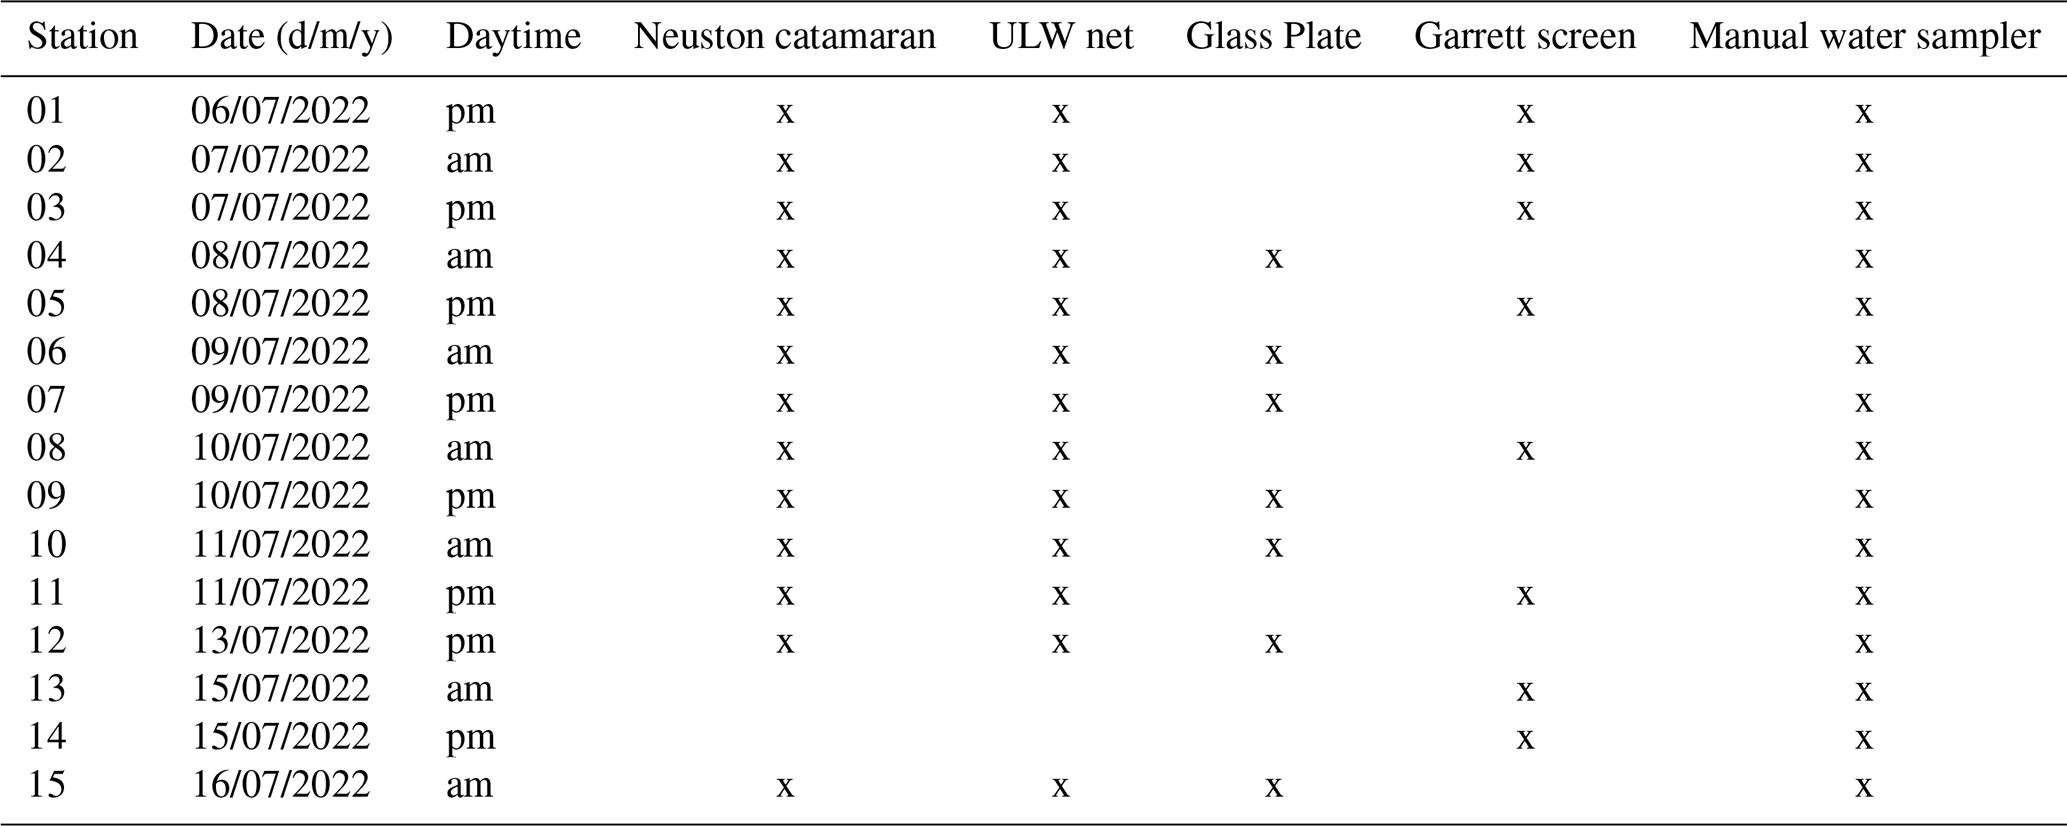
Table A2Classification of stations according to pico- and nanophytoplankton (P/NP) and microphytoplankton (MP) abundance.
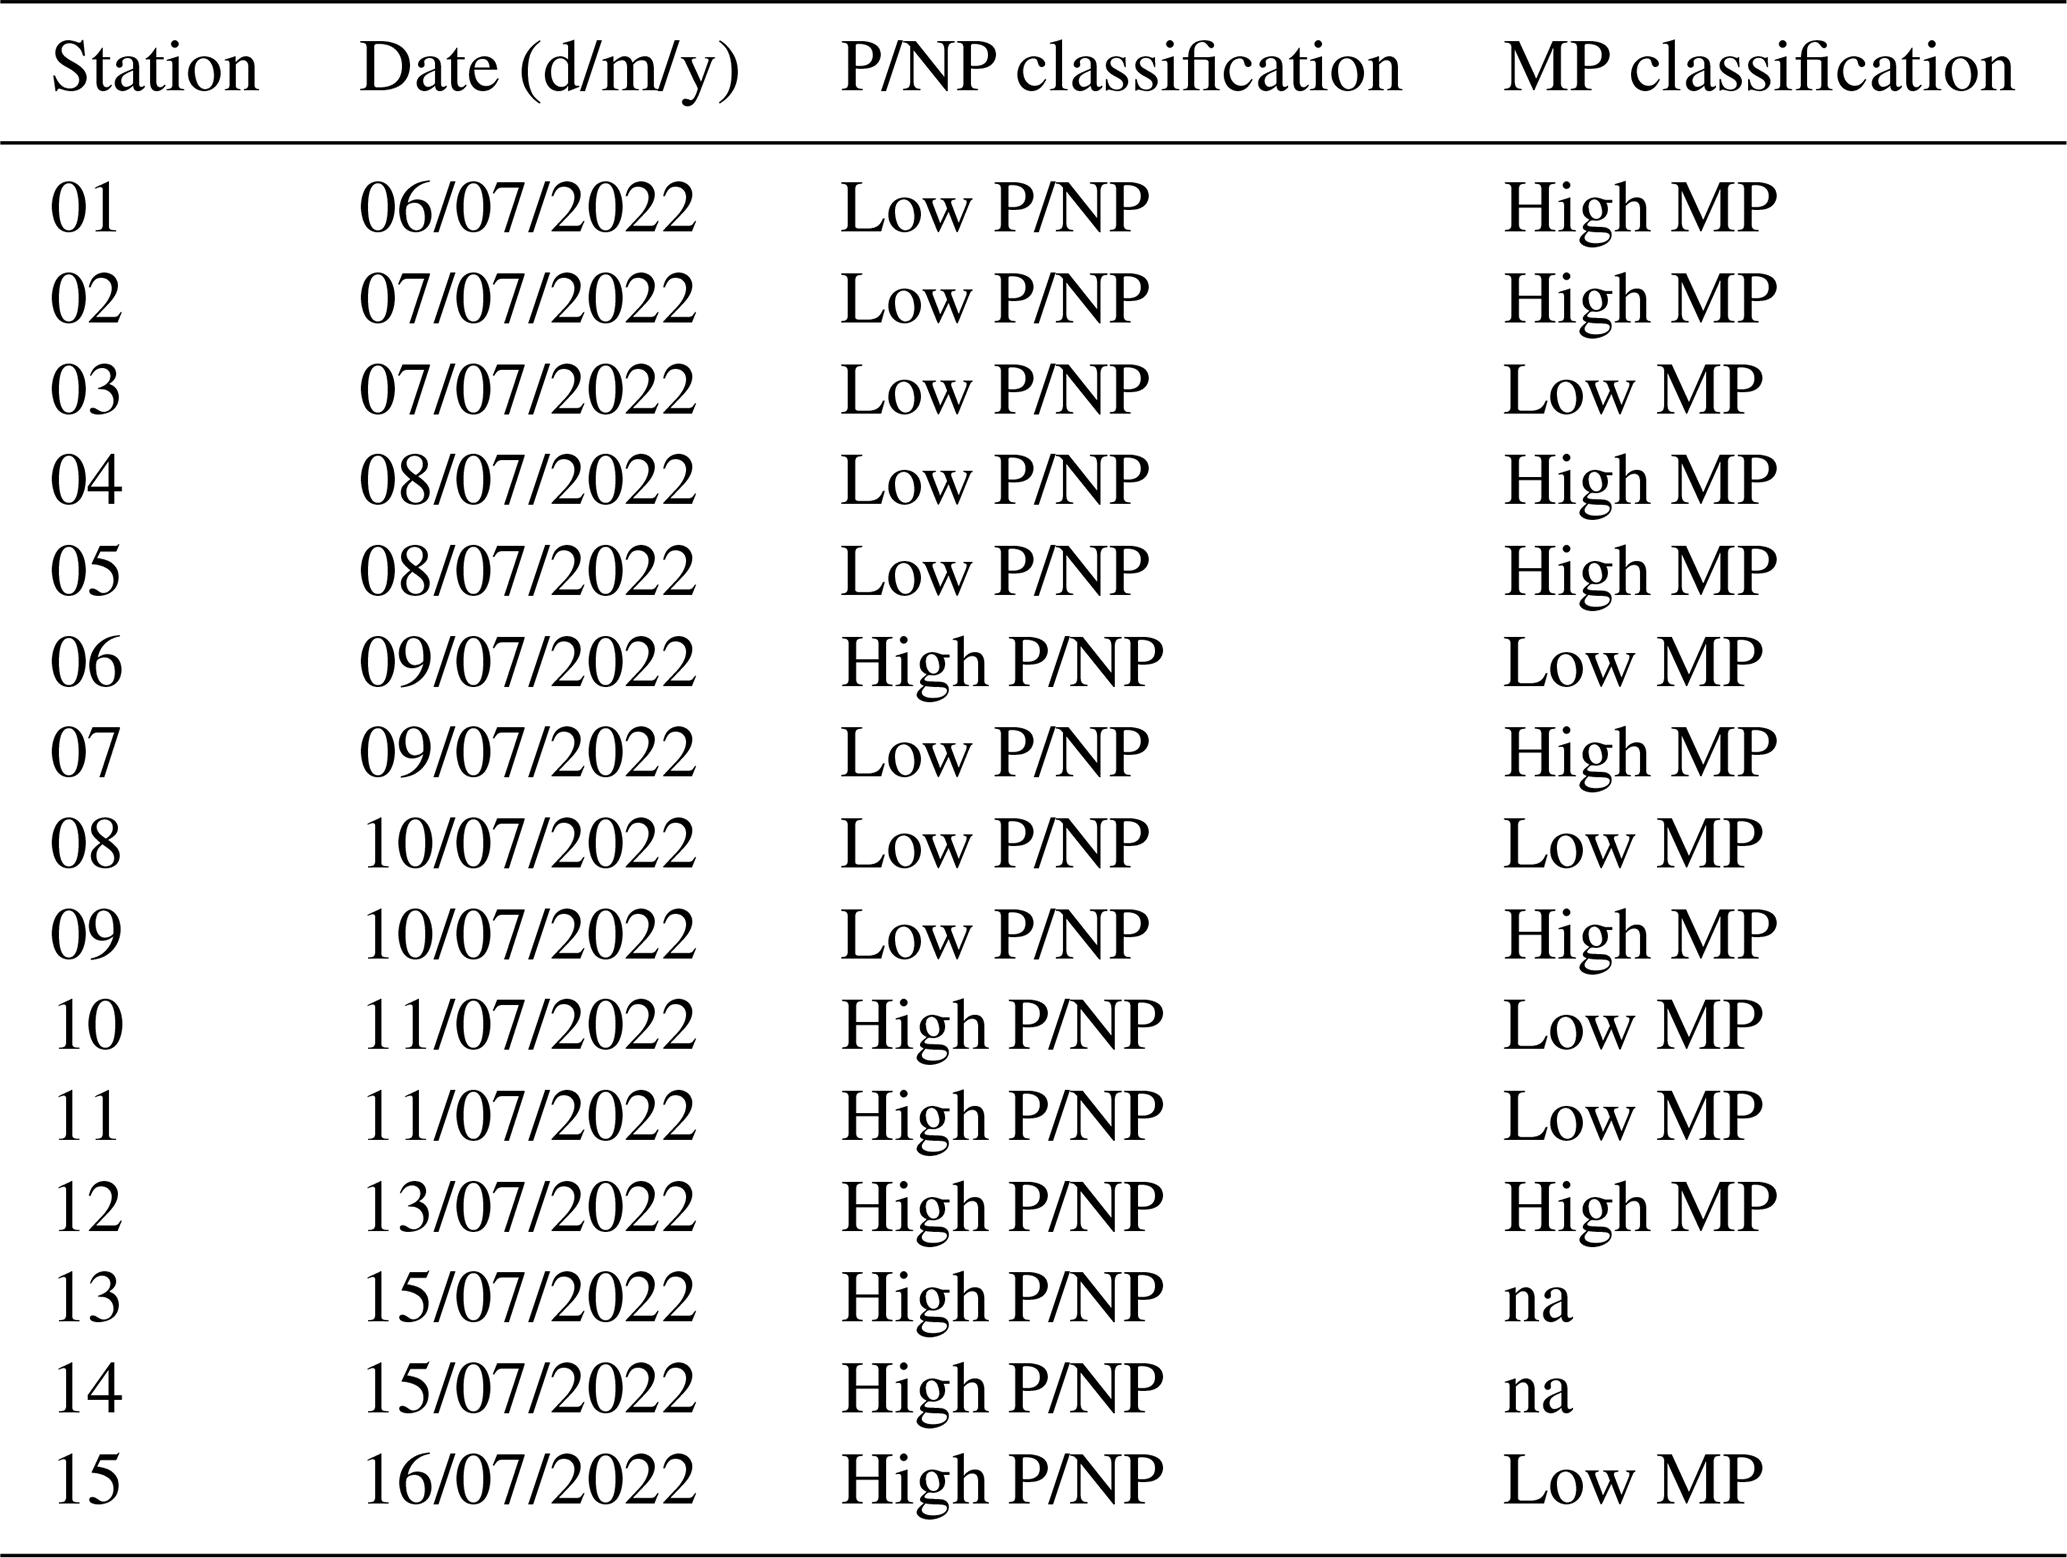
The data presented in this study are publicly available at https://doi.org/10.1594/PANGAEA.993574 (Karnatz et al., 2026).
The supplement related to this article is available online at https://doi.org/10.5194/bg-23-4145-2026-supplement.
JK collected samples during the research cruise, performed surfactant analyses, conducted data analysis, and wrote and prepared the manuscript. AE designed the project, supervised the research, and contributed to manuscript writing and revision. TB assisted with data analysis, contributed to manuscript writing, and participated in manuscript revision. BS supported sample collection and filtration during the cruise and contributed to manuscript proofreading.
The contact author has declared that none of the authors has any competing interests.
Publisher's note: Copernicus Publications remains neutral with regard to jurisdictional claims made in the text, published maps, institutional affiliations, or any other geographical representation in this paper. The authors bear the ultimate responsibility for providing appropriate place names. Views expressed in the text are those of the authors and do not necessarily reflect the views of the publisher.
This article is part of the special issue “Biogeochemical processes and Air–sea exchange in the Sea-Surface microlayer (BG/OS inter-journal SI)”. It is not associated with a conference.
We sincerely thank the chief scientist Henry Bittig and the senior scientist Christa Marandino for their exceptional efforts in organizing the research cruises and supporting the implementation of our extensive SML sampling program. We are grateful to Mathis Björner for his assistance with SML sampling on the working boat and, together with Michael Glockzin (IOW), for operating the CTD. We also extend our appreciation to the captain and crew of the RV Elisabeth Mann Borgese for their dedicated support throughout the cruise operations.
We further thank Tania Klüver, Jon Roa, and Ruth Flerus for analyzing a substantial portion of the samples in our home laboratory. Our gratitude goes to Christian Burmeister for chlorophyll a measurements, Lars Kreuzer for nutrient analyses, and Joanna Waniek and Prof. Heide Schulz-Vogt (IOW) for generously providing laboratory access. We also acknowledge AquaEcology GmbH & Co. KG for conducting the microphytoplankton analyses.
This research was supported by the project “Biogeochemical processes and Air-sea exchange in the Sea-Surface microlayer (BASS)”, which was funded by the German Research Foundation (DFG) (grant no. 451574234).
The article processing charges for this open-access publication were covered by the GEOMAR Helmholtz Centre for Ocean Research Kiel.
This paper was edited by Peter S. Liss and reviewed by two anonymous referees.
Abraham, W. R., Meyer, H., and Yakimov, M.: Novel glycine containing glucolipids from the alkane using bacterium Alcanivorax borkumensis, Biochim. Biophys. Ac., 1393, 57–62, https://doi.org/10.1016/S0005-2760(98)00058-7, 1998.
Albertano, P., Somma, D. Di, and Capucci, E.: Cyanobacterial picoplankton from the Central Baltic Sea: cell size classification by image-analyzed fluorescence microscopy, J. Plankton Res., 19, 1405–1416, https://doi.org/10.1093/plankt/19.10.1405, 1997.
Andersson, A., Hajdu, S., Haecky, P., Kuparinen, J., and Wikner, J.: Succession and growth limitation of phytoplankton in the Gulf of Bothnia (Baltic Sea), Marine Biol., 126, 791–801, https://doi.org/10.1007/BF00351346, 1996.
Arteaga, L., Pahlow, M., and Oschlies, A.: Modeled Chl:C ratio and derived estimates of phytoplankton carbon biomass and its contribution to total particulate organic carbon in the global surface ocean, Global Biogeochem. Cy., 30, 1791–1810, https://doi.org/10.1002/2016GB005458, 2016.
Barreiro Felpeto, A., Śliwińska-Wilczewska, S., Złoch, I., and Vasconcelos, V.: Light-dependent cytolysis in the allelopathic interaction between picoplanktic and filamentous cyanobacteria, J. Plankton Res., 40, 165–177, https://doi.org/10.1093/plankt/fby004, 2018.
Barthelmeß, T. and Engel, A.: How biogenic polymers control surfactant dynamics in the surface microlayer: insights from a coastal Baltic Sea study, Biogeosciences, 19, 4965–4992, https://doi.org/10.5194/bg-19-4965-2022, 2022.
Barthelmeß, T., Schütte, F., and Engel, A.: Variability of the Sea Surface Microlayer Across a Filament's Edge and Potential Influences on Gas Exchange, Front. Mar. Sci., 8, https://doi.org/10.3389/fmars.2021.718384, 2021.
Berg, C., Dupont, C., Asplund-Samuelsson, J., Celepli, N. A., Eiler, A., Allen, A. E., Ekman, M., Bergmann, B., and Ininbergs, K.: Dissection of Microbial Community Functions during a Cyanobacterial Bloom in the Baltic Sea via Metatranscriptomics, Front. Mar. Sci., 5, 55, https://doi.org/10.3389/fmars.2018.00055, 2018.
Bibi, R., Ribas-Ribas, M., Jaeger, L., Lehners, C., Gassen, L., Cortés-Espinoza, E. F., Wollschläger, J., Thölen, C., Waska, H., Zöbelein, J., Brinkhoff, T., Athale, I., Röttgers, R., Novak, M., Engel, A., Barthelmeß, T., Karnatz, J., Reinthaler, T., Spriahailo, D., Friedrichs, G., Schäfer, F. A., and Wurl, O.: Biogeochemical dynamics of the sea-surface microlayer in a multidisciplinary mesocosm study, Biogeosciences, 22, 7563–7589, https://doi.org/10.5194/bg-22-7563-2025, 2025.
Buitenhuis, E. T., Li, W. K. W., Vaulot, D., Lomas, M. W., Landry, M. R., Partensky, F., Karl, D. M., Ulloa, O., Campbell, L., Jacquet, S., Lantoine, F., Chavez, F., Macias, D., Gosselin, M., and McManus, G. B.: Picophytoplankton biomass distribution in the global ocean, Earth Syst. Sci. Data, 4, 37–46, https://doi.org/10.5194/essd-4-37-2012, 2012.
Bunse, C., Israelsson, S., Baltar, F., Bertos-Fortis, M., Fridolfsson, E., Legrand, C., Lindehoff, E., Lindh, M. V., Martínez-García, S., and Pinhassi, J.: High frequency multi-year variability in baltic sea microbial plankton stocks and activities, Front. Microbiol., 10, https://doi.org/10.3389/fmicb.2018.03296, 2019.
Chen, Y. L. L., Tuo, S., and Chen, H. Y.: Co-occurrence and transfer of fixed nitrogen from Trichodesmium spp. to diatoms in the low-latitude Kuroshio Current in the NW Pacific, Mar. Ecol. Prog. Ser., 421, 25–38, https://doi.org/10.3354/meps08908, 2011.
Cisternas-Novoa, C., Le Moigne, F. A. C., and Engel, A.: Composition and vertical flux of particulate organic matter to the oxygen minimum zone of the central Baltic Sea: impact of a sporadic North Sea inflow, Biogeosciences, 16, 927–947, https://doi.org/10.5194/bg-16-927-2019, 2019.
Cosović, B. and Vojvodić, V.: The application of ac polarography to the determination of surface-active substances in seawater, Limnol. Oceanogr., 27, 361–369, https://doi.org/10.4319/lo.1982.27.2.0361, 1982.
Ćosović, B. and Vojvodić, V.: Voltammetric analysis of surface active substances in natural seawater, Electroanalysis, 10, 429–434, https://doi.org/10.1002/(SICI)1521-4109(199805)10:6<429::AID-ELAN429>3.0.CO;2-7, 1998.
Cunliffe, M. and Murrell, J. C.: The sea-surface microlayer is a gelatinous biofilm, ISME J., 3, 1001–1003, https://doi.org/10.1038/ismej.2009.69, 2009.
Cunliffe, M. and Wurl, O.: Guide to best practices to study the ocean's surface, Occas. Publ. Mar. Biol. Assoc. UK, https://doi.org/10.25607/OBP-1512, 2014.
Cunliffe, M., Engel, A., Frka, S., Gašparović, B. Ž., Guitart, C., Murrell, J. C., Salter, M., Stolle, C., Upstill-Goddard, R., and Wurl, O.: Sea surface microlayers: A unified physicochemical and biological perspective of the air–ocean interface, Prog. Oceanogr., 109, 104–116, https://doi.org/10.1016/J.POCEAN.2012.08.004, 2013.
Dauwe, B., Middelburg, J. J., Herman, P. M. J., and Heip, C. H. R.: Linking diagenetic alteration of amino acids and bulk organic matter reactivity, Limnol. Oceanogr., 44, 1809–1814, https://doi.org/10.4319/lo.1999.44.7.1809, 1999.
Davis, J., Kaiser, K., and Benner, R.: Amino acid and amino sugar yields and compositions as indicators of dissolved organic matter diagenesis, Org. Geochem., 40, 343–352, https://doi.org/10.1016/J.ORGGEOCHEM.2008.12.003, 2009.
De Philippis, R. and Vincenzini, M.: Exocellular polysaccharides from cyanobacteria and their possible applications, FEMS Microbiol. Rev., 22, 151–175, https://doi.org/10.1111/j.1574-6976.1998.tb00365.x, 1998.
Dickson, A. G., Sabine, C. L., and Christian, J. Robert.: Guide to best practices for ocean CO2 measurements, North Pacific Marine Science Organization, https://doi.org/10.25607/OBP-1342, 2007.
DIN EN 15972: Wasserbeschaffenheit – Anleitung für die quantitative und qualitative Untersuchung von marinem Phytoplankton, Beuth Verlag, 34 pp., https://doi.org/10.31030/1756505, 2011.
DIN EN 16695: Wasserbeschaffenheit – Anleitung zur Abschätzung des Phytoplankton-Biovolumens. Beuth Verlag, 101 pp., https://doi.org/10.31030/2303923, 2015.
Dittmar, T., Cherrier, J., and Ludwichowski, K.-U.: The Analysis of Amino Acids in Seawater, in: Practical Guidelines for the Analysis of Seawater, edited by: Wurl, O., CRC Press, 67–77, https://doi.org/10.1201/9781420073072, 2009.
Dreshchinskii, A. and Engel, A.: Seasonal variations of the sea surface microlayer at the Boknis Eck Times Series Station (Baltic Sea), J. Plankton Res., 39, 943–961, https://doi.org/10.1093/plankt/fbx055, 2017.
Endres, S., Unger, J., Wannicke, N., Nausch, M., Voss, M., and Engel, A.: Response of Nodularia spumigena to pCO2 – Part 2: Exudation and extracellular enzyme activities, Biogeosciences, 10, 567–582, https://doi.org/10.5194/bg-10-567-2013, 2013.
Engel, A. and Galgani, L.: The organic sea-surface microlayer in the upwelling region off the coast of Peru and potential implications for air–sea exchange processes, Biogeosciences, 13, 989–1007, https://doi.org/10.5194/bg-13-989-2016, 2016.
Engel, A. and Händel, N.: A novel protocol for determining the concentration and composition of sugars in particulate and in high molecular weight dissolved organic matter (HMW-DOM) in seawater, Mar. Chem., 127, 180–191, https://doi.org/10.1016/J.MARCHEM.2011.09.004, 2011.
Engel, A., Delille, B., Jacquet, S., Riebesell, U., Rochelle-Newall, E., Terbrüggen, A., and Zondervan, I.: Transparent exopolymer particles and dissolved organic carbon production by Emiliania huxleyi exposed to different CO2 concentrations: a mesocosm experiment, Aquat. Microb. Ecol., 34, 93–104, 2004.
Engel, A., Harlay, J., Piontek, J., and Chou, L.: Contribution of combined carbohydrates to dissolved and particulate organic carbon after the spring bloom in the northern Bay of Biscay (North-Eastern Atlantic Ocean), Cont. Shelf Res., 45, 42–53, https://doi.org/10.1016/j.csr.2012.05.016, 2012.
Engel, A., Bange, H. W., Cunliffe, M., Burrows, S. M., Friedrichs, G., Galgani, L., Herrmann, H., Hertkorn, N., Johnson, M., Liss, P. S., Quinn, P. K., Schartau, M., Soloviev, A., Stolle, C., Upstill-Goddard, R. C., van Pinxteren, M., and Zäncker, B.: The ocean's vital skin: Toward an integrated understanding of the sea surface microlayer, Front. Mar. Sci., 4, 165, https://doi.org/10.3389/fmars.2017.00165, 2017.
Engel, A., Sperling, M., Sun, C., Grosse, J., and Friedrichs, G.: Organic matter in the surface microlayer: Insights from a wind wave channel experiment, Front. Mar. Sci., 5, 182, https://doi.org/10.3389/fmars.2018.00182, 2018.
Engel, A., Endres, S., Galgani, L., and Schartau, M.: Marvelous Marine Microgels: On the Distribution and Impact of Gel-Like Particles in the Oceanic Water-Column, Front. Mar. Sci., 7, https://doi.org/10.3389/fmars.2020.00405, 2020.
Flores, E., Arévalo, S., and Burnat, M.: Cyanophycin and arginine metabolism in cyanobacteria, Algal Res., 42, 101577, https://doi.org/10.1016/J.ALGAL.2019.101577, 2019.
Frew, N. M., Bock, E. J., Schimpf, U., Hara, T., Haußecker, H., Edson, J. B., McGillis, W. R., Nelson, R. K., McKenna, S. P., Uz, B. M., and Jähne, B.: Air-sea gas transfer: Its dependence on wind stress, small-scale roughness, and surface films, J. Geophys. Res.-Oceans, 109, https://doi.org/10.1029/2003JC002131, 2004.
Galgani, L. and Engel, A.: Accumulation of Gel Particles in the Sea-Surface Microlayer during an Experimental Study with the Diatom Thalassiosira weissflogii, Int. J. Geosci., 4, 129–145, https://doi.org/10.4236/ijg.2013.41013, 2013.
Galgani, L. and Engel, A.: Changes in optical characteristics of surface microlayers hint to photochemically and microbially mediated DOM turnover in the upwelling region off the coast of Peru, Biogeosciences, 13, 2453–2473, https://doi.org/10.5194/bg-13-2453-2016, 2016.
Garrett, W. D.: Collection of slick-forming materials from the sea surface microlayer, Limnol. Oceanogr., 10, 602–605, https://doi.org/10.4319/lo.1965.10.4.0602, 1965.
Gašparović, B. and Ćosović, B.: Surface-active properties of organic matter in the North Adriatic Sea, Estuar. Coast Shelf S., 58, 555–566, https://doi.org/10.1016/S0272-7714(03)00133-1, 2003.
Hajdu, S., Höglander, H., and Larsson, U.: Phytoplankton vertical distributions and composition in Baltic Sea cyanobacterial blooms, Harmful Algae, 6, 189–205, https://doi.org/10.1016/j.hal.2006.07.006, 2007.
Harvey, G. W. and Burzell, L. A.: A simple microlayer method for small samples, Limnol. Oceanogr., 17, 156–157, https://doi.org/10.4319/lo.1972.17.1.0156, 1972.
Helsinki Commission (HELCOM): Manual for Marine Monitoring in the COMBINE Programme of HELCOM, https://helcom.fi/publications/manual-for-marine-monitoring-in-the-combine-programme-of-helcom/ (last access: 12 June 2026), 2000.
Helsinki Commission (HELCOM): Baltic Sea Environment Fact Sheets, Cyanobacteria biomass 2000–2023, HELCOM, https://helcom.fi/helcom-at-work/publications/baltic-sea-environment-fact-sheets-bsefs/ (last access: 12 June 2026), 2025.
Hepach, H., Hughes, C., Hogg, K., Collings, S., and Chance, R.: Senescence as the main driver of iodide release from a diverse range of marine phytoplankton, Biogeosciences, 17, 2453–2471, https://doi.org/10.5194/bg-17-2453-2020, 2020.
Hoikkala, L., Tammert, H., Lignell, R., Eronen-Rasimus, E., Spilling, K., and Kisand, V.: Autochthonous dissolved organic matter drives bacterial community composition during a bloom of filamentous cyanobacteria, Front. Mar. Sci., 3, 111, https://doi.org/10.3389/fmars.2016.00111, 2016.
Jenkinson, I. R., Seuront, L., Ding, H., and Elias, F.: Biological modification of mechanical properties of the sea surface microlayer, influencing waves, ripples, foam and air-sea fluxes, Elem. Sci. Anth., 6, 26, https://doi.org/10.1525/elementa.283, 2018.
Kahru, M. and Elmgren, R.: Multidecadal time series of satellite-detected accumulations of cyanobacteria in the Baltic Sea, Biogeosciences, 11, 3619–3633, https://doi.org/10.5194/bg-11-3619-2014, 2014.
Kahru, M., Horstmann, U., and Rud, O.: Satellite Detection of Increased Cyanobacteria Blooms in the Baltic Sea: Natural Fluctuation or Ecosystem Change?, Ambio, 23, 469–472, 1994.
Kahru, M., Cahill, B., Elmgren, R., and Rehder, G.: What initiates cyanobacterial blooms in the Baltic Sea?, Harmful Algae, 148, https://doi.org/10.1016/j.hal.2025.102924, 2025.
Kaiser, K. and Benner, R.: Biochemical composition and size distribution of organic matter at the Pacific and Atlantic time-series stations, Mar. Chem., 113, 63–77, https://doi.org/10.1016/J.MARCHEM.2008.12.004, 2009.
Karlson, A. M. L., Duberg, J., Motwani, N. H., Hogfors, H., Klawonn, I., Ploug, H., Barthel Svedén, J., Garbaras, A., Sundelin, B., Hajdu, S., Larsson, U., Elmgren, R., and Gorokhova, E.: Nitrogen fixation by cyanobacteria stimulates production in Baltic food webs, Ambio, 44, 413–426, https://doi.org/10.1007/s13280-015-0660-x, 2015.
Karlson, B., Arneborg, L., Johansson, J., Linders, J., Liu, Y., and Olofsson, M.: A suggested climate service for cyanobacteria blooms in the Baltic Sea – Comparing three monitoring methods, Harmful Algae, 118, https://doi.org/10.1016/j.hal.2022.102291, 2022.
Karnatz, J., Barthelmeß, T., Sabbaghzadeh, B., and Engel, A.: Biochemical composition and phytoplankton community of the sea surface microlayer and underlying water during ELISABETH MANN BORGESE cruise EMB295 (CenBASE) in 2022, PANGAEA [data set], https://doi.org/10.1594/PANGAEA.993574, 2026.
Komárek, J.: Coccoid and Colonial Cyanobacteria, Freshwater Algae of North America: Ecology and Classification, 59–116, https://doi.org/10.1016/B978-012741550-5/50004-0, 2003.
Komárek, J. and Komárková, J.: Diversity of Aphanizomenon-like cyanobacteria, Fottea, 6, 1–32, 2006.
Kujawinski, E. B., Farrington, J. W., and Moffett, J. W.: Evidence for grazing-mediated production of dissolved surface-active material by marine protists, Mar. Chem. 77, 133–142, https://doi.org/10.1016/S0304-4203(01)00082-2, 2002.
Kurata, N., Vella, K., Hamilton, B., Shivji, M., Soloviev, A., Matt, S., Tartar, A., and Perrie, W.: Surfactant-associated bacteria in the near-surface layer of the ocean, Sci. Rep., 6, https://doi.org/10.1038/srep19123, 2016.
Kutser, T.: Quantitative detection of chlorophyll in cyanobacterial blooms by satellite remote sensing, Limnol. Oceanogr., 49, 2179–2189, https://doi.org/10.4319/lo.2004.49.6.2179, 2004.
Lage, S., Mazur-Marzec, H., and Gorokhova, E.: Interspecific Interactions Drive Nonribosomal Peptide Production in Nodularia spumigena, Appl. Environ. Microb., 88, https://doi.org/10.1128/aem.00966-22, 2022.
Larsson, J., Celepli, N., Ininbergs, K., Dupont, C. L., Yooseph, S., Bergman, B., and Ekman, M.: Picocyanobacteria containing a novel pigment gene cluster dominate the brackish water Baltic Sea, ISME J., 8, 1892–1903, https://doi.org/10.1038/ismej.2014.35, 2014.
Laß, K. and Friedrichs, G.: Revealing structural properties of the marine nanolayer from vibrational sum frequency generation spectra, J. Geophys. Res., 116, C08042, https://doi.org/10.1029/2010JC006609, 2011.
Laß, K., Bange, H. W., and Friedrichs, G.: Seasonal signatures in SFG vibrational spectra of the sea surface nanolayer at Boknis Eck Time Series Station (SW Baltic Sea), Biogeosciences, 10, 5325–5334, https://doi.org/10.5194/bg-10-5325-2013, 2013.
Lennartz, S. T., Lehmann, A., Herrford, J., Malien, F., Hansen, H.-P., Biester, H., and Bange, H. W.: Long-term trends at the Boknis Eck time series station (Baltic Sea), 1957–2013: does climate change counteract the decline in eutrophication?, Biogeosciences, 11, 6323–6339, https://doi.org/10.5194/bg-11-6323-2014, 2014.
Lindroth, P. and Mopper, K.: High Performance Liquid Chromatographic Determination of Subpicomole Amounts of Amino Acids by Precolumn Fluorescence Derivatization with o-Phthaldialdehyde, Anal. Chem., 51, 1667–1674, https://doi.org/10.1021/ac50047a019, 1979.
Marie, D., Partensky, F., Jacquet, S., and Vaulot, D.: Enumeration and Cell Cycle Analysis of Natural Populations of Marine Picoplankton by Flow Cytometry Using the Nucleic Acid Stain SYBR Green I, Appl. Environ. Microb., 63, 186–193, https://doi.org/10.1128/aem.63.1.186-193.1997, 1997.
Mari, X. and Kiørboe, T.: Abundance, size distribution and bacterial colonization of transparent exopolymeric particles (TEP) during spring in the Kattegat, J. Plankton Res., 18, 969–986, https://doi.org/10.1093/plankt/18.6.969, 1996.
Mazur-Marzec, H., Sutryk, K., Kobos, J., Hebel, A., Hohlfeld, N., Błaszczyk, A., Toruńska, A., Kaczkowska, M. J., Łysiak-Pastuszak, E., Kraśniewski, W., and Jasser, I.: Occurrence of cyanobacteria and cyanotoxin in the Southern Baltic Proper. Filamentous cyanobacteria versus single-celled picocyanobacteria, Hydrobiologia, 701, 235–252, https://doi.org/10.1007/s10750-012-1278-7, 2013.
Moisan, T. A., Blattner, K. L., and Makinen, C. P.: Influences of temperature and nutrients on Synechococcus abundance and biomass in the southern Mid-Atlantic Bight, Cont. Shelf Res., 30, 1275–1282, https://doi.org/10.1016/j.csr.2010.04.005, 2010.
Munkes, B., Löptien, U., and Dietze, H.: Cyanobacteria blooms in the Baltic Sea: a review of models and facts, Biogeosciences, 18, 2347–2378, https://doi.org/10.5194/bg-18-2347-2021, 2021.
Murray, C. J., Müller-Karulis, B., Carstensen, J., Conley, D. J., Gustafsson, B. G., and Andersen, J. H.: Past, present and future eutrophication status of the Baltic Sea, Front. Mar. Sci., 6, https://doi.org/10.3389/fmars.2019.00002, 2019.
Mustaffa, N. I. H., Ribas-Ribas, M., Banko-Kubis, H. M., and Wurl, O.: Global reduction of in situ CO2 transfer velocity by natural surfactants in the sea-surface microlayer, Philos. T. R. Soc. A, 476, https://doi.org/10.1098/rspa.2019.0763, 2020.
Nausch, G., Feistel, R., Lass, H. U., Nagel, K., and Siegel, H.: Hydrographisch-chemische Zustandseinschätzung der Ostsee 2001, Meereswiss. Ber., 49, https://www.iow.de/files/forschung/meereswissenschaftliche-berichte/mebe49_2002-zustand-hc.pdf (last access: 12 June 2026), 2002.
Nürnberg, D. J., Mariscal, V., Bornikoel, J., Nieves-Morión, M., Krauß, N., Herrero, A., Maldener, I., Flores, E., and Mullineaux, C. W.: Intercellular diffusion of a fluorescent sucrose analog via the septal junctions in a filamentous cyanobacterium, MBio, 6, e02109-14, https://doi.org/10.1128/mBio.02109-14, 2015.
Ohlendieck, U., Stuhr, A., and Siegmund, H.: Nitrogen fixation by diazotrophic cyanobacteria in the Baltic Sea and transfer of the newly fixed nitrogen to picoplankton organisms, J. Marine Syst., 25, 213–219, https://doi.org/10.1016/S0924-7963(00)00016-6, 2000.
Paczkowska, J., Rowe, O. F., Schlüter, L., Legrand, C., Karlson, B., and Andersson, A.: Allochthonous matter: An important factor shaping the phytoplankton community in the Baltic Sea, J. Plankton Res., 39, 23–34, https://doi.org/10.1093/plankt/fbw081, 2017.
Paerl, H. W. and Paul, V. J.: Climate change: Links to global expansion of harmful cyanobacteria, Water Res., 46, 1349–1363, https://doi.org/10.1016/j.watres.2011.08.002, 2012.
Pannard, A., Pédrono, J., Bormans, M., Briand, E., Claquin, P., and Lagadeuc, Y.: Production of exopolymers (EPS) by cyanobacteria: impact on the carbon-to-nutrient ratio of the particulate organic matter, Aquat. Ecol., 50, 29–44, https://doi.org/10.1007/s10452-015-9550-3, 2016.
Parrish, C. C.: Lipid biogeochemistry of plankton, settling matter and sediments in Trinity Bay, Newfoundland. I. Lipid classes, Org. Geochem., 29, 1531–1545, 1998.
Pereira, R., Schneider-Zapp, K., and Upstill-Goddard, R. C.: Surfactant control of gas transfer velocity along an offshore coastal transect: results from a laboratory gas exchange tank, Biogeosciences, 13, 3981–3989, https://doi.org/10.5194/bg-13-3981-2016, 2016.
Pereira, R., Ashton, I., Sabbaghzadeh, B., Shutler, J. D., and Upstill-Goddard, R. C.: Reduced air-sea CO2 exchange in the Atlantic Ocean due to biological surfactants, Nat. Geosci., 11, 492–496, https://doi.org/10.1038/s41561-018-0136-2, 2018.
Ploug, H.: Cyanobacterial surface blooms formed by Aphanizomenon sp. and Nodularia spumigena in the Baltic Sea: Small-scale fluxes, pH, and oxygen microenvironments, Limnol. Oceanogr., 53, 914–921, https://doi.org/10.4319/lo.2008.53.3.0914, 2008.
Rickard, P. C., Uher, G., and Upstill-Goddard, R. C.: Photo-Reactivity of Surfactants in the Sea-Surface Microlayer and Subsurface Water of the Tyne Estuary, UK, Geophys. Res. Lett., 49, https://doi.org/10.1029/2021GL095469, 2022.
Rolff, C., Almesjö, L., & Elmgren, R.: Nitrogen fixation and abundance of the diazotrophic cyanobacterium Aphanizomenon sp. in the Baltic Proper. Mar. Ecol. Prog. Ser, 332, 107–118, https://doi.org/10.3354/meps332107, 2007.
Sabbaghzadeh, B., Upstill-Goddard, R. C., Beale, R., Pereira, R., and Nightingale, P. D.: The Atlantic Ocean surface microlayer from 50° N to 50° S is ubiquitously enriched in surfactants at wind speeds up to 13 m s−1, Geophys. Res. Lett., 44, 2852–2858, https://doi.org/10.1002/2017GL072988, 2017.
Satpute, S. K., Banat, I. M., Dhakephalkar, P. K., Banpurkar, A. G., and Chopade, B. A.: Biosurfactants, bioemulsifiers and exopolysaccharides from marine microorganisms, Biotechnol. Adv., 28, 436–450, https://doi.org/10.1016/j.biotechadv.2010.02.006, 2010.
Schmidt, R. and Schneider, B.: The effect of surface films on the air-sea gas exchange in the Baltic Sea, Mar. Chem., 126, 56–62, https://doi.org/10.1016/j.marchem.2011.03.007, 2011.
Scholz, F.: Voltammetric techniques of analysis: the essentials, Chem. Texts, 1, https://doi.org/10.1007/s40828-015-0016-y, 2015.
Seidel, M., Manecki, M., Herlemann, D. P. R., Deutsch, B., Schulz-Bull, D., Jürgens, K., and Dittmar, T.: Composition and Transformation of Dissolved Organic Matter in the Baltic Sea, Front. Earth Sci., 5, 31, https://doi.org/10.3389/feart.2017.00031, 2017.
Seppälä, J., Ylöstalo, P., Kaitala, S., Hällfors, S., Raateoja, M., and Maunula, P.: Ship-of-opportunity based phycocyanin fluorescence monitoring of the filamentous cyanobacteria bloom dynamics in the Baltic Sea, Estuar. Coast. Shelf S., 73, 489–500, https://doi.org/10.1016/J.ECSS.2007.02.015, 2007.
Sharp, J. H.: Improved analysis for “particulate” organic carbon and nitrogen from seawater, Limnol. Oceanogr. 19.6, 984–989, https://doi.org/10.4319/lo.1974.19.6.0984, 1974.
Silva, A., Nikzad, S., Barthelmeß, T., Engel, A., Herrmann, H., van Pinxteren, M., Wirtz, K., Wurl, O., and Schartau, M.: Meta-analytical insights into organic matter enrichment in the surface microlayer, Biogeosciences, 23, 1697–1718, https://doi.org/10.5194/bg-23-1697-2026, 2026.
Śliwińska-Wilczewska, S., Felpeto, A. B., Mozdzeń, K., Vasconcelos, V., and Latała, A.: Physiological effects on coexisting microalgae of the allelochemicals produced by the bloom-forming cyanobacteria synechococcus sp. And nodularia spumigena, Toxins, 11, 712, https://doi.org/10.3390/toxins11120712, 2019.
Sondergaard, M.: Phototrophic Picoplankton in Temperate Lakes: Seasonal Abundance and Importance along a Trophic Gradient, Int. Rev. Ges. Hydrobio., 76, 505–522, https://doi.org/10.1002/iroh.19910760404, 1991.
Springstein, B. L., Weissenbach, J., Koch, R., Stücker, F., and Stucken, K.: The role of the cytoskeletal proteins MreB and FtsZ in multicellular cyanobacteria, FEBS Open Bio., 10, 2510–2531, https://doi.org/10.1002/2211-5463.13016, 2020.
Stal, L. J.: Microphytobenthos, their Extracellular Polymeric Substances, and the Morphogenesis of Intertidal Sediments, Geomicrobiol. J., 20, 463–478, https://doi.org/10.1080/713851126, 2003.
Stal, L. J., Staal, M., and Villbrandt, M.: Nutrient control of cyanobacterial blooms in the Baltic Sea, Aquat. Microb. Ecol., 18, 165–173, https://doi.org/10.3354/ame018165, 1999.
Stolle, C., Nagel, K., Labrenz, M., and Jürgens, K.: Succession of the sea-surface microlayer in the coastal Baltic Sea under natural and experimentally induced low-wind conditions, Biogeosciences, 7, 2975–2988, https://doi.org/10.5194/bg-7-2975-2010, 2010.
Stolle, C., Ribas-Ribas, M., Badewien, T. H., Barnes, J., Carpenter, L. J., Chance, R., Damgaard, L. R., Durán Quesada, A. M., Engel, A., Frka, S., Galgani, L., Gašparović, B., Gerriets, M., Hamizah Mustaffa, N. I., Herrmann, H., Kallajoki, L., Pereira, R., Radach, F., Revsbech, N. P., Rickard, P., Saint, A., Salter, M., Striebel, M., Triesch, N., Uher, G., Upstill-Goddard, R. C., van Pinxteren, M., Zäncker, B., Zieger, P., and Wurl, O.: The MILAN Campaign: Studying Diel Light Effects on the Air–Sea Interface, B. Am. Meteorol. Soc., 101, E146–E166, https://doi.org/10.1175/BAMS-D-17-0329.1, 2020.
Strååt, K. D., C. M. Mörth, A. Sobek, Smedberg, E., and Undeman, E.: Modeling total particulate organic carbon (POC) flows in the Baltic Sea catchment, Biogeochemistry, 128, 51–65, https://doi.org/10.1007/s10533-016-0194-8, 2016.
Stuart, R. K., Mayali, X., Lee, J. Z., Craig Everroad, R., Hwang, M., Bebout, B. M., Weber, P. K., Pett-Ridge, J., and Thelen, M. P.: Cyanobacterial reuse of extracellular organic carbon in microbial mats, ISME J., 10, 1240–1251, https://doi.org/10.1038/ismej.2015.180, 2016.
Tamm, M., Laas, P., Freiberg, R., Nõges, P., and Nõges, T.: Parallel assessment of marine autotrophic picoplankton using flow cytometry and chemotaxonomy, Sci. Total Environ., 625, 185–193, https://doi.org/10.1016/j.scitotenv.2017.12.234, 2018.
Taylor, J. D., Cottingham, S. D., Billinge, J., and Cunliffe, M.: Seasonal microbial community dynamics correlate with phytoplankton-derived polysaccharides in surface coastal waters, ISME J., 8, 245–248, https://doi.org/10.1038/ismej.2013.178, 2014.
Thornton, D. C. O.: Dissolved organic matter (DOM) release by phytoplankton in the contemporary and future ocean, Eur. J. Phycol., 49, 20–46, https://doi.org/10.1080/09670262.2013.875596, 2014.
Thornton, D. C. O.: Coomassie Stainable Particles (CSP): Protein containing exopolymer particles in the ocean, Front. Mar. Sci., 5, 206, https://doi.org/10.3389/fmars.2018.00206, 2018.
Tomitani, A., Knoll, A. H., Cavanaugh, C. M., and Ohno, T.: The evolutionary diversification of cyanobacteria: Molecular-phylogenetic and paleontological perspectives, P. Natl. Acad. Sci. USA, 103, 5442–5447, 2006.
Tsai, W. ting and Liu, K. K.: An assessment of the effect of sea surface surfactant on global atmosphere-ocean CO2 flux, J. Geophys. Res.-Oceans, 108, https://doi.org/10.1029/2000jc000740, 2003.
Utermöhl, H.: Zur Vervollkommnung der quantitativen Phytoplankton-Methodik, Int. Ver. The., 9, 1–38, https://doi.org/10.1080/05384680.1958.11904091, 1958.
Van Pinxteren, M., Müller, C., Iinuma, Y., Stolle, C., and Herrmann, H.: Chemical characterization of dissolved organic compounds from coastal sea surface microlayers (Baltic Sea, Germany), Environ. Sci. Technol., 46, 10455–10462, https://doi.org/10.1021/es204492b, 2012.
Wasmund, N.: Occurrence of cyanobacterial blooms in the baltic sea in relation to environmental conditions, Int. Rev. Ges. Hydrobio., 82, 169–184, https://doi.org/10.1002/iroh.19970820205, 1997.
Wurl, O. and Obbard, J. P.: A review of pollutants in the sea-surface microlayer (SML): a unique habitat for marine organisms, Mar. Pollut. Bull., 48, 1016–1030, https://doi.org/10.1016/J.MARPOLBUL.2004.03.016, 2004.
Wurl, O., Wurl, E., Miller, L., Johnson, K., and Vagle, S.: Formation and global distribution of sea-surface microlayers, Biogeosciences, 8, 121–135, https://doi.org/10.5194/bg-8-121-2011, 2011.
Wurl, O., Stolle, C., Van Thuoc, C., The Thu, P., and Mari, X.: Biofilm-like properties of the sea surface and predicted effects on air–sea CO2 exchange, Prog. Oceanogr., 144, 15–24, https://doi.org/10.1016/J.POCEAN.2016.03.002, 2016.
Wurl, O., Ekau, W., Landing, W. M., and Zappa, C. J.: Sea surface microlayer in a changing ocean – A perspective, Elem. Sci. Anth., 5, 31, https://doi.org/10.1525/elementa.228, 2017.
Wurl, O., Bird, K., Cunliffe, M., Landing, W. M., Miller, U., Mustaffa, N. I. H., Ribas-Ribas, M., Witte, C., and Zappa, C. J.: Warming and Inhibition of Salinization at the Ocean's Surface by Cyanobacteria, Geophys. Res. Lett., 45, 4230–4237, https://doi.org/10.1029/2018GL077946, 2018.
Zäncker, B., Bracher, A., Röttgers, R., and Engel, A.: Variations of the organic matter composition in the sea surface microlayer: A comparison between open ocean, coastal, and upwelling sites off the Peruvian coast, Front. Microbiol., 8, https://doi.org/10.3389/fmicb.2017.02369, 2017.
Zettler, M. L., Kremp, A., and Dutz, J.: Biological assessment of the Baltic Sea 2022, Meereswissenschaftliche Berichte, 125, https://doi.iow.de/10.12754/msr-2024-0125, 2024.
Zhang, Z., Liu, L., Liu, C., and Cai, W.: Studies on the sea surface microlayer: II. The layer of sudden change of physical and chemical properties, J. Colloid. Interf. Sci., 264, 148–159, https://doi.org/10.1016/S0021-9797(03)00390-4, 2003.
Zhi, W., Klingler, C., Liu, J., and Li, L.: Widespread deoxygenation in warming rivers, Nat. Clim. Change, 13, 1105–1113, https://doi.org/10.1038/s41558-023-01793-3, 2023.
Zufia, J. A., Farnelid, H., and Legrand, C.: Seasonality of Coastal Picophytoplankton Growth, Nutrient Limitation, and Biomass Contribution, Front. Microbiol., 12, https://doi.org/10.3389/fmicb.2021.786590, 2021.
Zutić, V., Ćosović, B., Marčenko, E., Bihari, N., and Kršinić, F.: Surfactant production by marine phytoplankton, Mar. Chem., 10, 505–520, https://doi.org/10.1016/0304-4203(81)90004-9, 1981.