the Creative Commons Attribution 4.0 License.
the Creative Commons Attribution 4.0 License.
 | 16 Jan 2026
Long-term impacts of mixotrophy on ocean carbon storage: insights from a 10 000 year global model simulation
Thomas S. Bibby
Jamie D. Wilson
Ben A. Ward
Mixotrophs – organisms that combine the use of light and inorganic resources with the ingestion of prey – have been shown in simulations to increase mean organism size and carbon export in the ocean. These simulations have, however, been limited to decade-long timescales that are insufficient to investigate the impacts of mixotrophy on the ocean's long-term capacity for carbon storage. Here we explore these long-term impacts using a low-resolution ocean model that resolves important feedbacks between surface ecology and the ocean interior over multi-millennial periods. The model was compared in two configurations: one with a strict distinction between phytoplankton and zooplankton populations and one in which all populations were assumed to be capable of mixotrophy. Consistent with earlier studies, we found that increased carbon and nutrient export associated with mixotrophy was rapidly established within the first few years of the simulation and was robust over long time scales. However, we also found that these increases were partially offset over longer time scales by a decline in “preformed” inorganic carbon and nutrients entering the deep ocean via the sinking of surface waters. Over the 10 000 year duration of the simulations, we found that ecologically-driven changes in C export increased the oceanic C inventory by up to 537 Pg, and that this was partially offset by decline of 150 Pg in the preformed C inventory, leaving a net increase of up to 387 Pg C (∼1 %).
- Article
(5068 KB) - Full-text XML
- BibTeX
- EndNote


Plankton communities lie at the foundation of marine food webs, indirectly supporting human populations through fisheries (Hollowed et al., 2013) and playing a central role in global biogeochemical cycles (Falkowski et al., 1998; Worden et al., 2015). Despite the frequent conceptual and practical division of plankton into autotrophic phytoplankton and heterotrophic zooplankton, especially in past modelling studies (Azam et al., 1983; Fasham et al., 1990; Burkholder et al., 2008), these modes of nutrition are not mutually exclusive and an increasing number of species are recognized as being mixotrophic (Stoecker, 1998; Hartmann et al., 2012; Stoecker et al., 2017).
Modelling studies have shown that mixotrophs can impact marine ecosystem structure and function (Stoecker, 1998), increasing the efficiency with which nutrients and energy are passed through the food web (Mitra et al., 2014; Ward and Follows, 2016). This may lead to increased primary production (Baretta-Bekker et al., 1998; Hammer and Pitchford, 2005; Mitra et al., 2014), larger organisms and increased export (Ward and Follows, 2016; Stoecker et al., 2017). At the global scale, Ward and Follows (2016) showed that mixotrophy allowed for increased carbon export from the ocean surface, compared to an equivalent simulation without mixotrophy. In their simulations photosynthesis supported by the mixotrophic ingestion of prey provided an additional source of carbon for the same supply of limiting nutrients. This increase sustained the growth of larger and faster sinking organisms that were relatively enriched in carbon, leading to increased export of carbon to depth.
The global modelling study of Ward and Follows (2016) was restricted to a time frame between 10–15 years. This is sufficient time for the ecological community to stabilize given the modelled nutrient supply from depth, but it was not sufficient to resolve any feedbacks that might occur as the ecological community alters the deep ocean nutrient and carbon inventories over thousands of years (DeVries et al., 2012). For example, the presence of larger and thus faster-sinking plankton (Sournia, 1982) could potentially lead to a deeper sequestration of nutrients and an associated decline in primary production at the surface.
To investigate this issue, this article investigates the impacts of mixotrophy in a global model of the marine plankton community, using the coarse-resolution EcoGEnIE model (Ward et al., 2018). In the following, we describe the global ocean model and the experimental design. We then present results that illustrate the response of the ocean ecosystem at the surface and at depth over a range of time scales from 1 to 10 000 years. We show that the increased organism size and carbon-to-nutrient ratios attributable to mixotrophy are robust to any long-term feedbacks with the ocean interior. However, while the expected ecological shifts led to an increase of biological carbon export at large scales, this increase was partially offset by a decline in the amount of preformed dissolved inorganic carbon entering the ocean interior in the North Atlantic via physical pathways. We discuss the mechanisms underpinning this response and explore the sensitivity of our findings to the strength of unknown physiological costs associated with mixotrophy.
We use the EcoGEnIE (Ward et al., 2018) model, which is an ecological extension of cGEnIE (“carbon-centric Grid Enabled Integrated Earth system model”; Ridgwell et al., 2007). EcoGEnIE is an Earth System Model of Intermediate Complexity (Claussen et al., 2002) with a low spatial resolution that facilitates long simulations (on the order of 10 000 years) to be achieved within hours or days (depending on the ecological complexity of the model) on a personal computer or workstation.
The ecosystem model resolves the plankton community into a number of different size classes and each size class may be resolved into a number of functional groups (e.g. phytoplankton, mixotrophs, zooplankton). Each functional group has an associated set of size-dependent traits. For example, phytoplankton take up inorganic nutrients and use light to photosynthesise (Geider et al., 1998), zooplankton obtain resources by consuming smaller prey, while mixotrophs can combine these traits to varying degrees. Several traits are size dependent (Edwards et al., 2012; Marañón et al., 2013; Ward et al., 2017). For example, biomass-specific nutrient affinities and uptake rates are highest in the smallest phototrophic plankton, while biomass-specific maximum photosynthetic rates decline either side of a peak at approximately 6 µm diameter (Marañón et al., 2013). Zooplankton graze most efficiently on prey that are 10 times smaller than themselves in length, with maximum grazing rates increasing with decreasing organism size (Hansen et al., 1997).
Flexible cellular stoichiometry is included in the model as each population is represented in terms of its C, P, and Fe biomass. The proportion of these elements may change within the cell as they are acquired through photosynthesis, the uptake of inorganic nutrients, and/or the ingestion of prey. Ward and Follows (2016) showed that mixotrophs can achieve the same net growth rate with lower internal reserves of P and Fe, supported by their additional flexibility to gain carbon from both photosynthesis and grazing. Mixotrophic ecosystems are therefore able to sustain higher carbon-to-limiting-nutrient ratios than similar ecosystems dominated by specialists.
For reasons of computational efficiency, EcoGEnIE only represents plankton communities in the 80 m surface layer, with no growth below this. Organic matter is produced through mortality and unassimilated grazing, with the relative fractions assigned to dissolved and particulate organic matter (DOM and POM) determined by organism size, with smaller organisms producing a larger fraction of DOM. POM is not explicitly represented, instead being instantly exported from the surface layer and remineralised at depth according to a depth-dependent exponential profile. DOM does not sink.
Note that phosphate and iron are the only explicitly resolved nutrients in EcoGEnIE. While the exclusion of nitrogen is not realistic, phosphate provides a reasonable representation of global macronutrient limitation. A full description of EcoGEnIE can be found in Ward et al. (2018).
2.1 Ecosystem Configurations
To assess the impact of mixotrophy on the global ocean ecosystem, we compared five different configurations of EcoGEnIE. All configurations resolved eight plankton size classes of 0.6, 1.9, 6, 19, 60, 190, 600, and 1900 µm equivalent spherical diameter (ESD). In the first “Two-Guild” simulation, each size class was divided into two populations: one strictly autotrophic phytoplankton and one strictly heterotrophic zooplankton. This simulation was the standard configuration used in Ward et al. (2018) and is used here as a non-mixotrophic control, against which the effects of mixotrophy in other simulations can be assessed.
A second “Mixotrophic” configuration did not divide the eight size classes into individual functional groups. Instead, a single mixotrophic population in each size class was allowed to take up nutrients, photosynthesise and consume prey. The populations in the Mixotrophic configuration do not incur any penalty for the ability to combine autotrophic and heterotrophic traits and are simultaneously assigned the same traits as both the phytoplankton and zooplankton populations in the Two-Guild configuration.
The assumption that there is no physiological cost associated with mixotrophy is not necessarily realistic (Edwards et al., 2023a), but it does allow estimation of the maximum possible impacts of mixotrophy in the modelled ecosystem (Ward and Follows, 2016). To test the sensitivity of the model to potentially more realistic (albeit poorly constrained) costs associated with mixotrophy, we also tested three additional “Trade-Off” configurations. These configurations included three trophic strategies, with one phytoplankton, one mixotroph and one zooplankton in each size class. The maximum nutrient uptake rates, maximum photosynthetic rates and maximum grazing rates of the mixotrophic populations were then scaled by a fixed trade-off factor. In these three simulations, maximum rates of nutrient uptake, photosynthesis and grazing were downgraded to 60 %, 50 %, and 40 % of the specialist values used in the Two-Guild configuration. All five model configurations are summarized in Table 1.
Table 1The five ecological model configurations, with the degree to which maximum rates of nutrient uptake, photosynthesis and grazing were decreased in the mixotrophic populations.
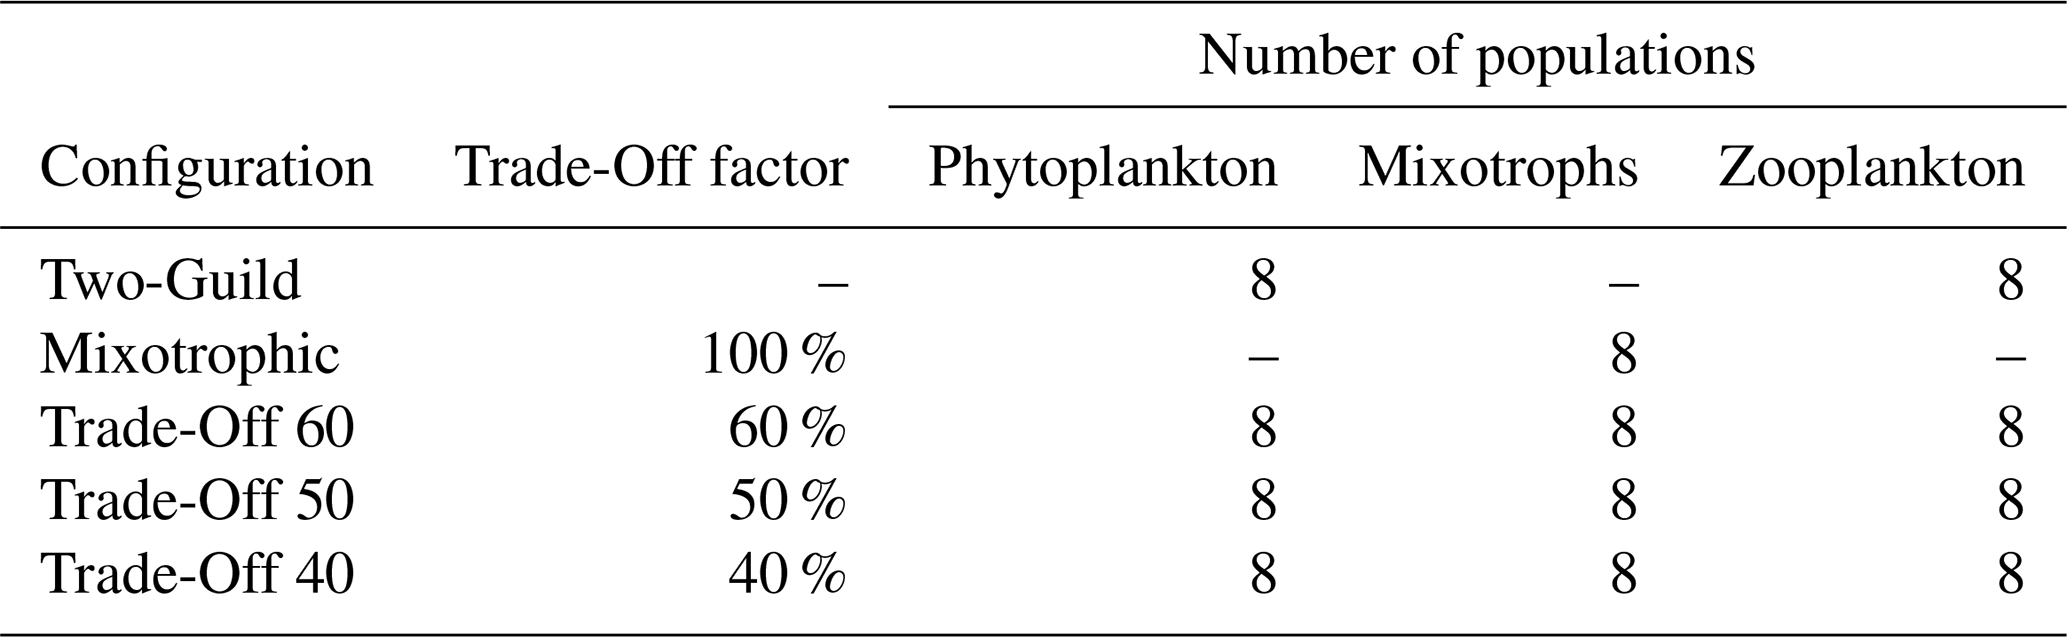
Note. The trade-off factor scales the maximum rates of nutrient uptake, photosynthesis and grazing in the mixotrophic populations. Phytoplankton have nutrient uptake and photosynthetic rates set to 100 % of the default values, while the maximum grazing rate is set to zero. The opposite is true for the zooplankton populations (Ward et al., 2018).
2.2 Simulations
To assess the long-term biogeochemical effects of changing the ecosystem configuration through time, the model was first spun-up for 10 000 years with the Two-Guild configuration. All model configurations (including the Two-Guild configuration) were then run for a further 10 000 years from this spin-up, so that changes relative to the Two-Guild configuration can be tracked as they develop through time. 10 000 years was sufficient time for the ocean to reach a repeating annual cycle with no changes in the global annual averages for the model state variables. In all cases the atmospheric CO2 concentration was fixed at 278 ppm, as in Ward et al. (2018).
We initially compare the Mixotrophic simulation to the Two-Guild (control) simulation to identify an upper limit for the possible impacts of mixotrophy on the modelled system. Further simulations are then used to explore the sensitivity of these effects to the assumed strength of any physiological costs associated with mixotrophy.
Prior global modelling on a decadal timescale (Ward and Follows, 2016) has suggested that increased trophic transfer efficiency associated with mixotrophy can increase mean plankton size and global carbon export. Here we test whether these effects are also seen in the EcoGEnIE model and examine whether the simulated changes are robust to biogeochemical feedbacks with the ocean interior occurring over millennial timescales.
3.1 Global-scale effects
Figure 1 shows the global mean carbon biomass within each model size class throughout the Two-Guild and Mixotrophic configurations. With different years of the simulations shown with different colours, it is clear that distinctive size distributions are established within the first year of each simulation, and that these distributions remain relatively stable throughout the 10 000 years of each simulation. At the end of the two simulations, the global biomass-weighted geometric mean size is 22.44 µm (×/÷ 6.21) in the Two-Guild configuration, increasing to 54.85 µm (×/÷ 7.42) in the Mixotrophic configuration.
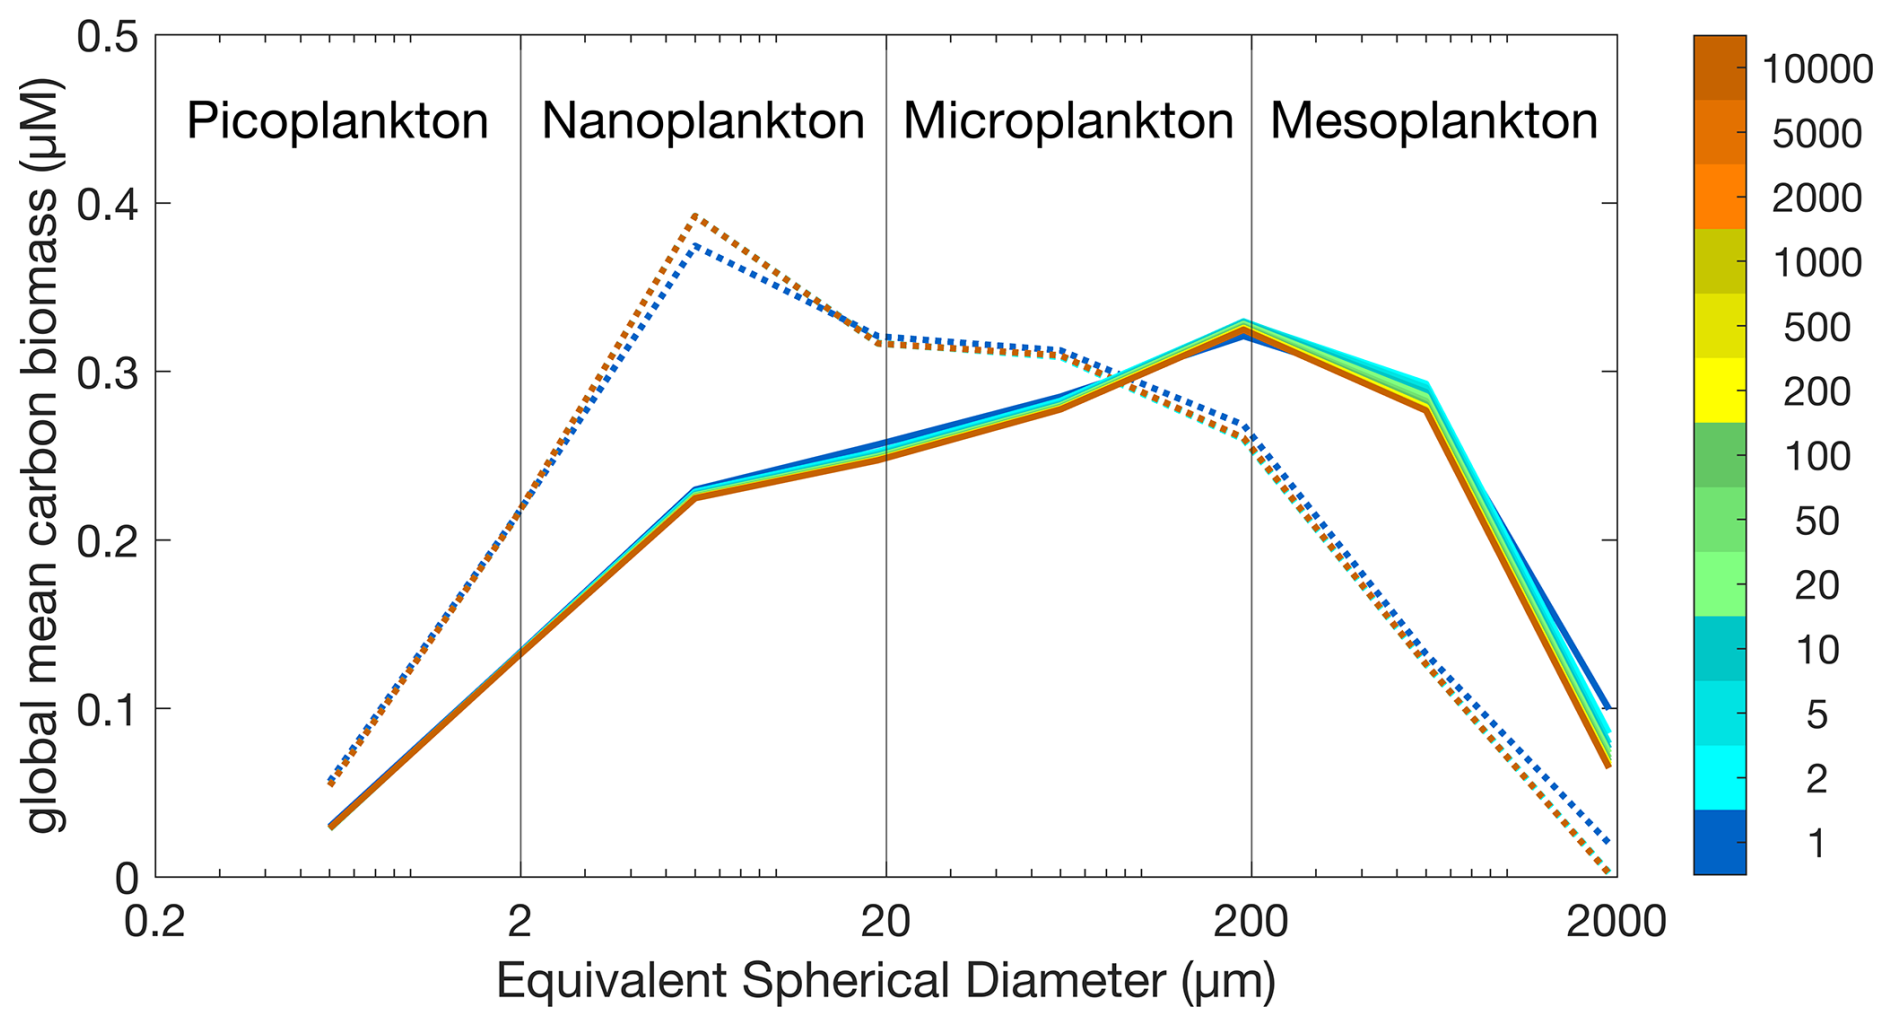
Figure 1Global plankton size distributions in the Two-Guild (dotted lines) and Mixotrophic (solid lines) configurations. Colours correspond to the simulation year, as indicated by the colour scale.
The influence of mixotrophy on the surface ecosystem is further explored in Fig. 2, which shows the change in six key ecosystem characteristics from the Two-Guild to the Mixotrophic configuration at four time points. In terms of ESD, the switch to mixotrophy drives a universal increase in biomass-weighted geometric mean size (Fig. 2a–d), with the largest changes in the most productive regions. The effects of mixotrophy on the particulate carbon and phosphorus export fluxes are more complicated, with a differential response at high and low latitudes (Fig. 2e–l). Export of particulate organic carbon generally increases between 60° North and South, with a decline in the Southern Ocean. Export of particulate organic phosphorus shows almost the opposite trend, increasing in the Southern Ocean, the North Atlantic and the Northwest Pacific, while remaining relatively unaffected at lower latitudes.
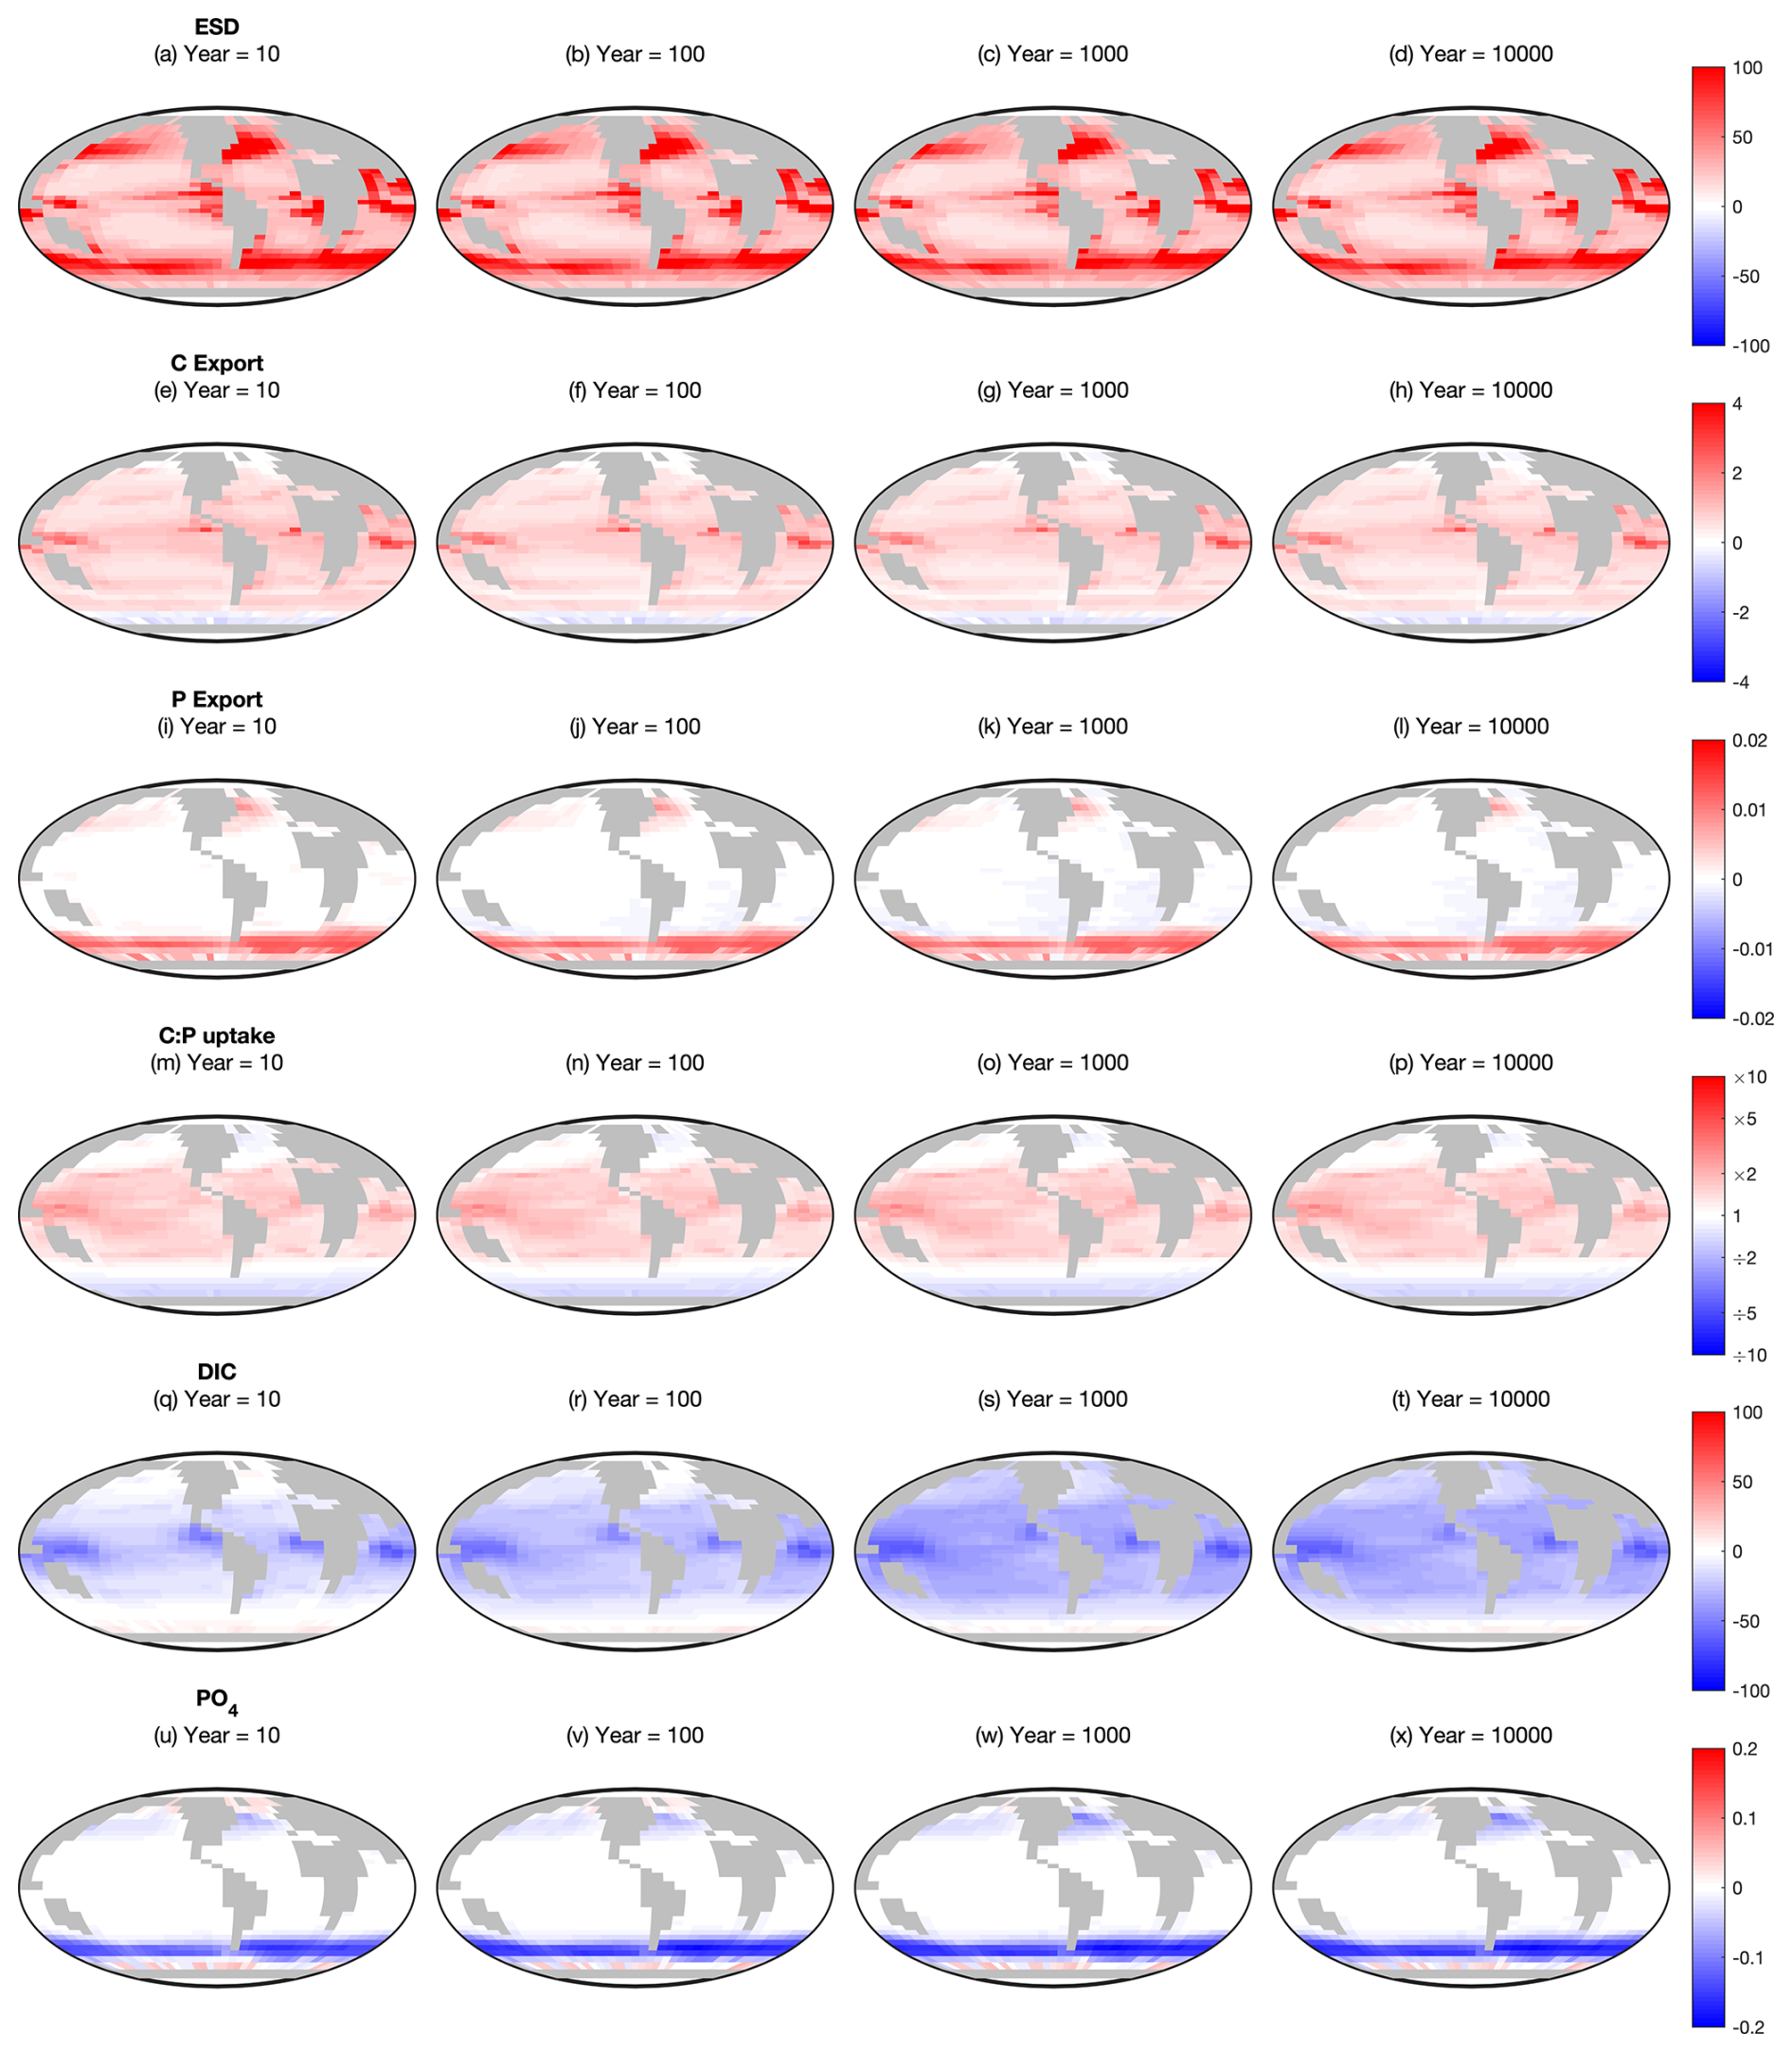
Figure 2Changes between the Mixotrophic and Two-Guild configurations at different time points. Red colours indicate regions where mixotrophy increased the variable in question, whereas blue colours indicate a decline. First row (a–d): equivalent spherical diameter of all plankton. Second row (e–h): particulate organic carbon export. Third row (i–l): particulate organic phosphorus export. Fourth row (m–p): community autotrophic C:P uptake ratio. Fifth row (q–t): dissolved inorganic carbon. Sixth row (u–x): dissolved PO4. All rows show Mixotrophy – Two-Guild (on a linear colour scale), except C:P uptake, which shows Mixotrophy – Two-Guild (on a logarithmic colour scale).
While increased plankton size is associated with deeper sinking, the contrasting responses of C and P export suggest that particle size is not the dominant mechanism by which mixotrophy affects the magnitude of export in the model. Changes in particulate export flux related to mixotrophy appear to be more strongly associated with changes in plankton uptake stoichiometry. If we define the community C:P uptake ratio as the community-integrated ratio of inorganic carbon fixation to inorganic phosphate uptake, Fig. 2m–p suggests that a higher C:P uptake ratio among mixotrophic plankton at low latitudes allows them to export more carbon there, while a lower C:P uptake ratio at high latitudes hinders carbon export. Conversely, the inverse (P:C) uptake ratio seems to play a similar role in regulating P export.
An exception to this first-order pattern occurs in some regions, such as the North Atlantic and the sub-Antarctic zone of the Southern Ocean, where C export increases despite a decline in the C:P uptake ratio. These regions are also associated with very large increases in plankton mean size, which appears to be driving an increased C export flux despite a decreased C:P uptake ratio.
While differences in surface PO4 develop early in the simulation and remain relatively stable throughout (Fig. 2u–x), surface DIC takes somewhat longer for the full differences to develop (Fig. 2q–t). While PO4 is a lot lower in the mixotrophic simulation at high latitudes, DIC initially declines at low latitudes (suggestive of an ecological effect), while lower concentrations develop at higher latitudes over hundreds to thousands of years (suggestive of a feedback with the ocean circulation).
Regardless of these spatial trends, it is clear that the changes to ESD, export and C:P uptake ratios established inside the first ten years remain relatively stable throughout the remainder of the simulation (relative to the spatial variability within each time step). The only exceptions to this are P export in the Atlantic Ocean and South East Pacific, which appears to decline slightly over longer timescales, and surface DIC, which declines over a much larger region on long time scales. In general, this indicates that the previously reported ecological and biogeochemical effects of mixotrophy at the surface (Ward and Follows, 2016) are largely robust to feedbacks from the ocean interior, although there may be some internal processes that are worthy of investigation.
3.2 Impacts on the ocean interior
Figure 3 shows how the mean vertical distribution of DIC and PO4 develop through time in each of the Pacific, Atlantic and Indian Ocean basins. As both model configurations were initialised from an equilibrated spin-up of the Two-Guild configuration, these vertical distributions do not change in the Two-Guild simulation. Contrary to Fig. 1, in which large and stable differences between the two configurations are established at the surface within the first year of the simulations, noticeable differences only begin to emerge at depth on multi-decadal timescales (green colours). These continue to develop over multi-centennial timescales (yellow colours), and have largely stabilised by multi-millennial timescales (orange colours).
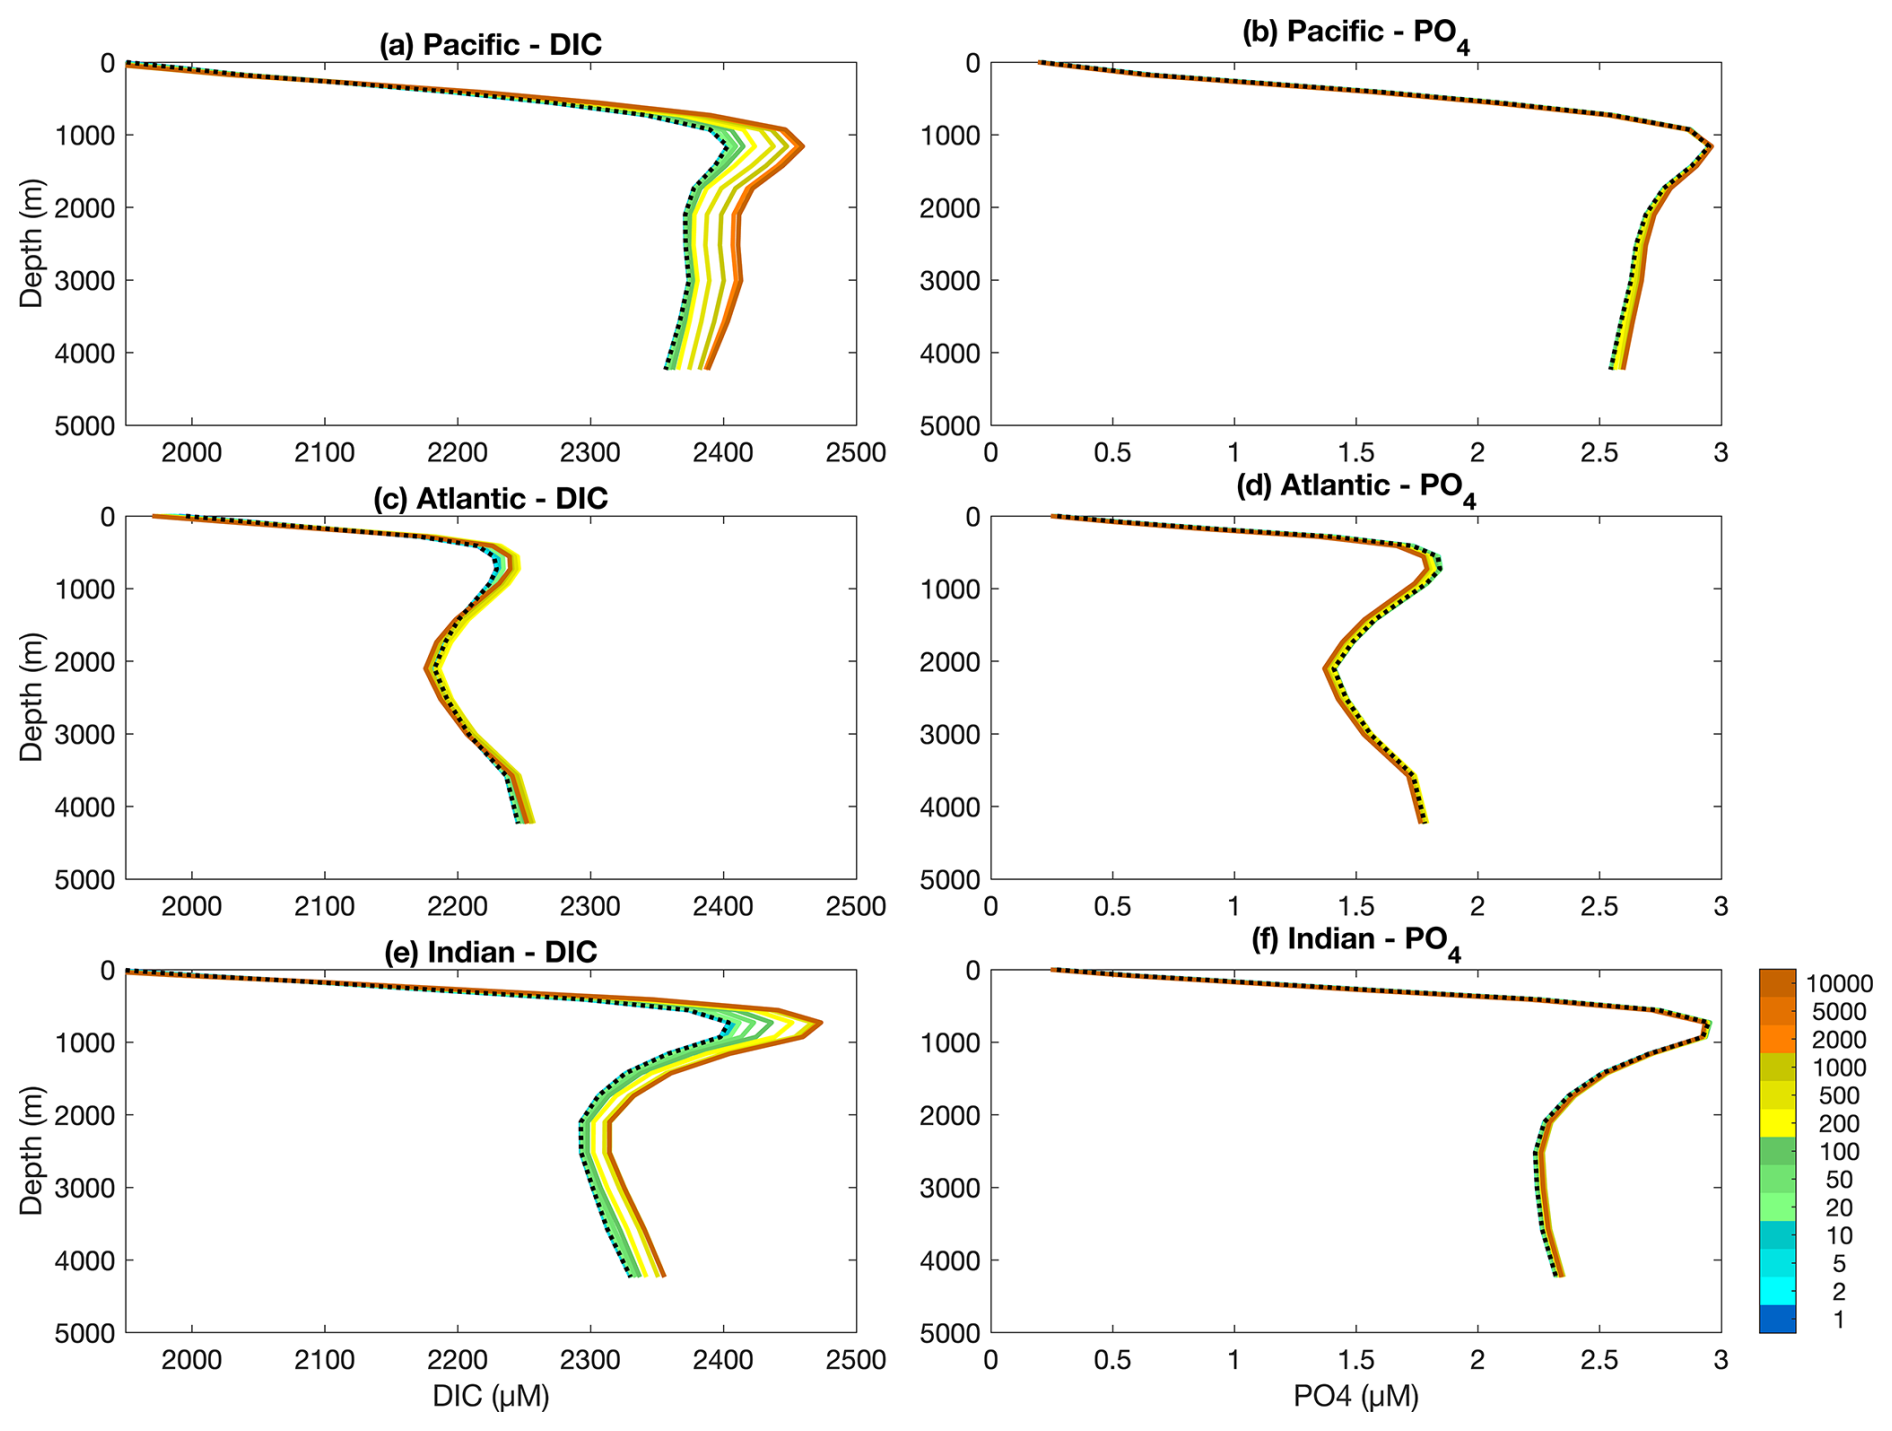
Figure 3Basin-averaged depth profiles of dissolved inorganic carbon (DIC) and phosphorus (PO4) in the three main ocean basins for the Two-Guild (black dotted line) and Mixotrophic (coloured solid lines) simulations. Simulation years for the Mixotrophic simulation are indicated by colours, as in Fig. 1. Two-Guild simulation is plotted in black because the internal profiles do not change from the initial state.
Within the Pacific and Indian Oceans, mixotrophy has the straightforward effect of increasing DIC storage at depth over long time scales, with a slight decrease in DIC at the surface. The response within the Atlantic Ocean is more complex. Over the first 500 years, mixotrophy leads to increased DIC storage at all depths below the thermocline, but after about 1000 years, there is a decline in DIC storage between about 1500–3500 m.
The vertical PO4 distributions show a similar, but more subtle response to mixotrophy. PO4 concentrations increase slightly at depth in the Pacific and Indian Oceans, but decline slightly in the Atlantic.
The differential response in the Atlantic Ocean occurs at depths associated with the North Atlantic Deep Water (NADW) (Toggweiler and Key, 2001), which suggests some feedback with the ocean circulation. This is explored in Figs. 4 and 5, which show the temporal evolution of differences in zonally-averaged chemical profiles for DIC and PO4.
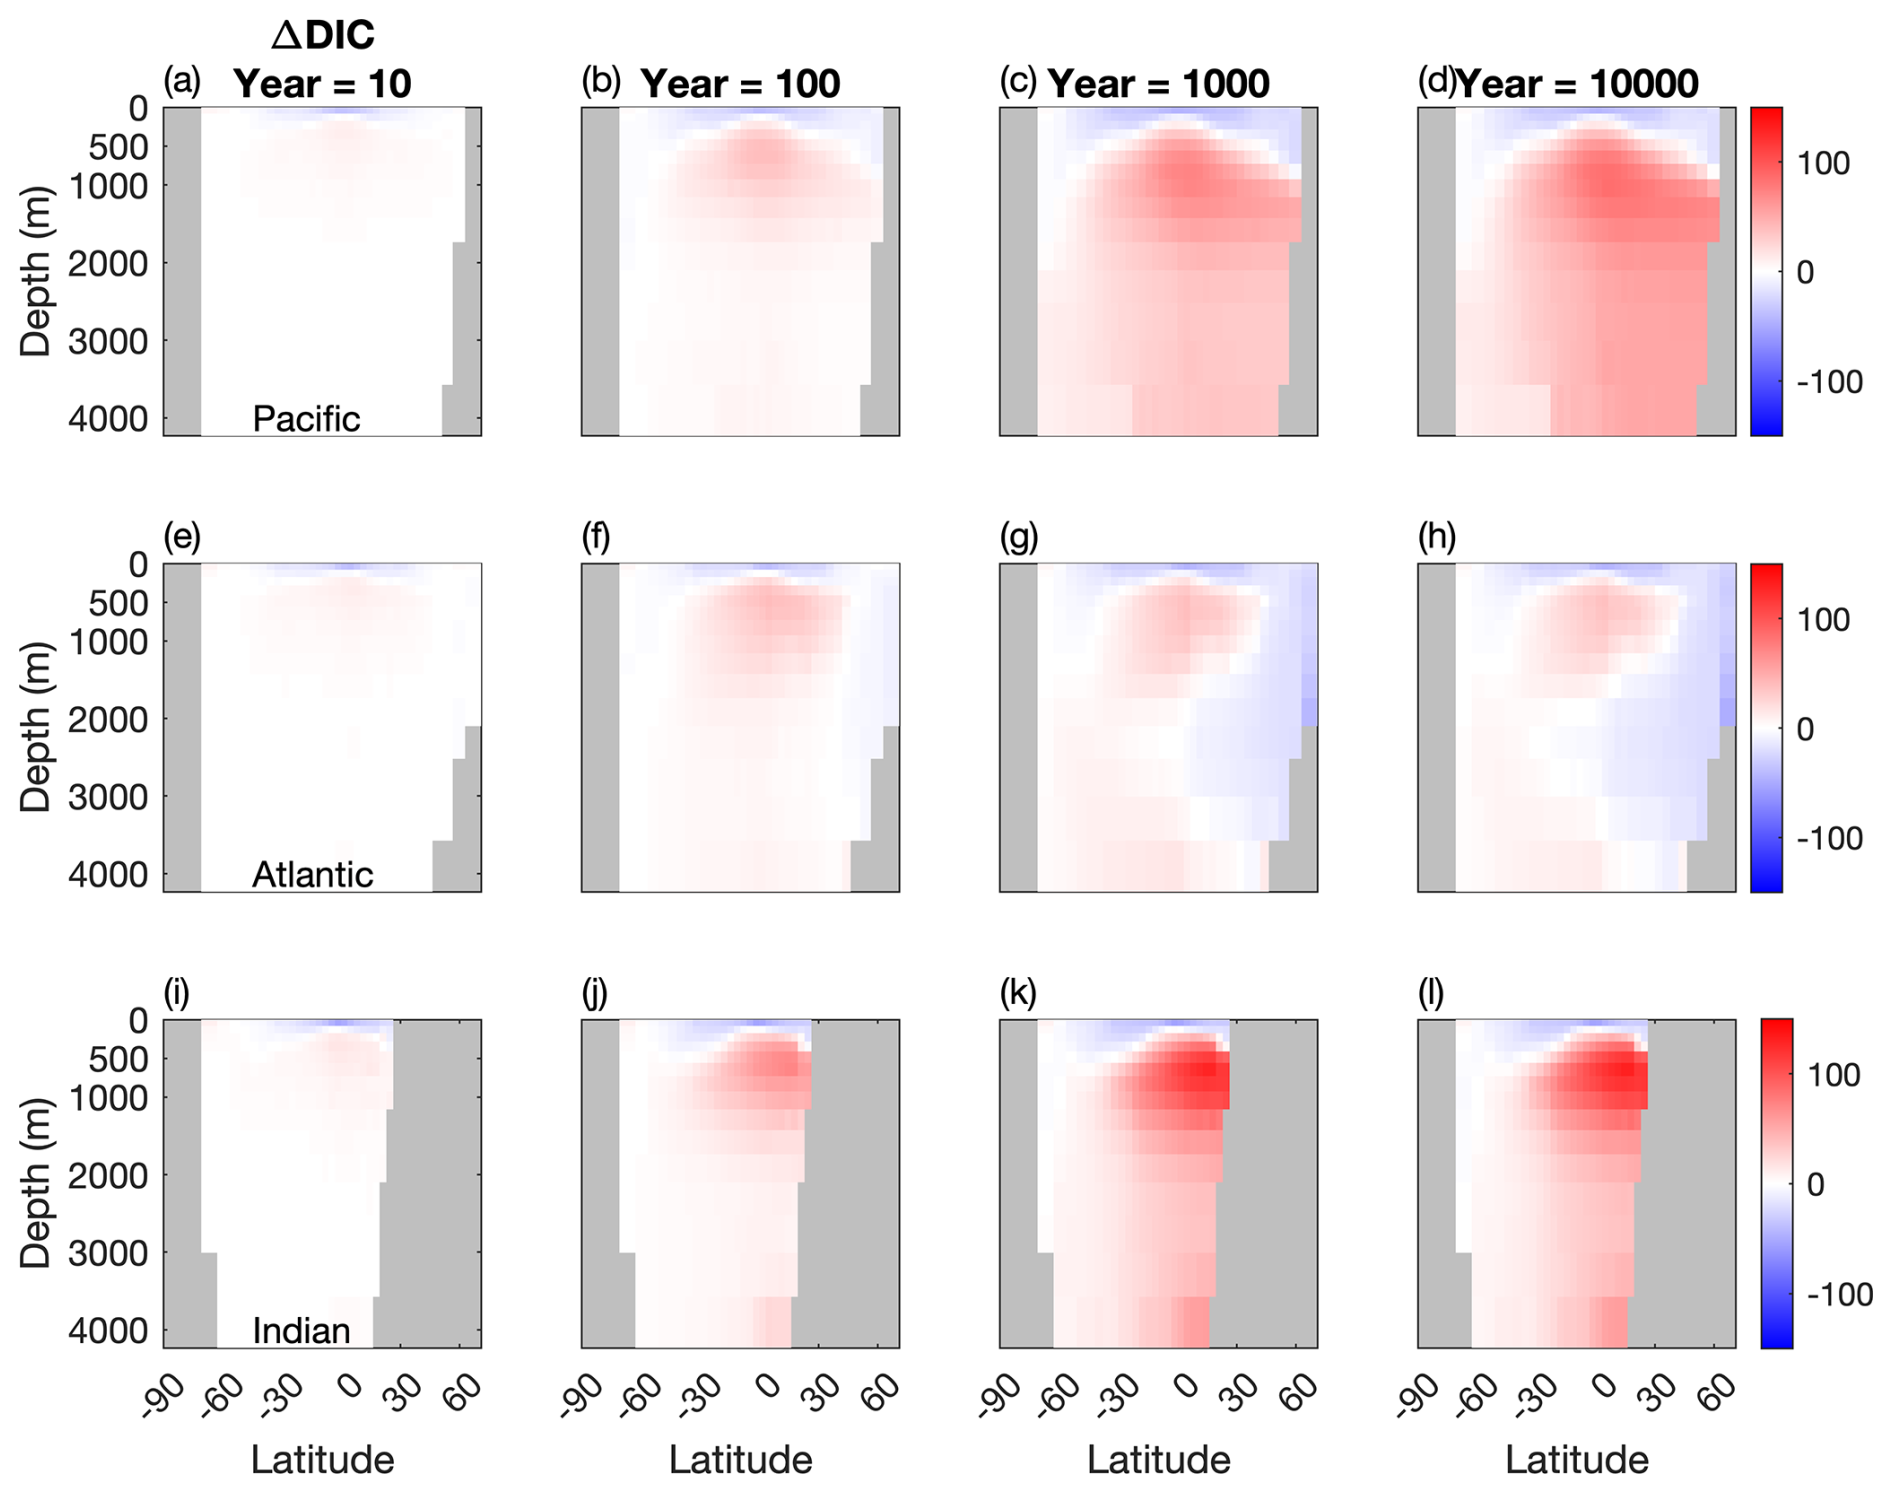
Figure 4Temporal evolution of differences in the meridional averaged DIC concentration between the two configurations (µM). (a, b, c) Atlantic basin, (d, e, f), Indian basin, and (g, h, i) Pacific basin. Blue: less DIC stored in the Mixotrophic configurations. Red: more DIC stored in the Mixotrophic configuration.
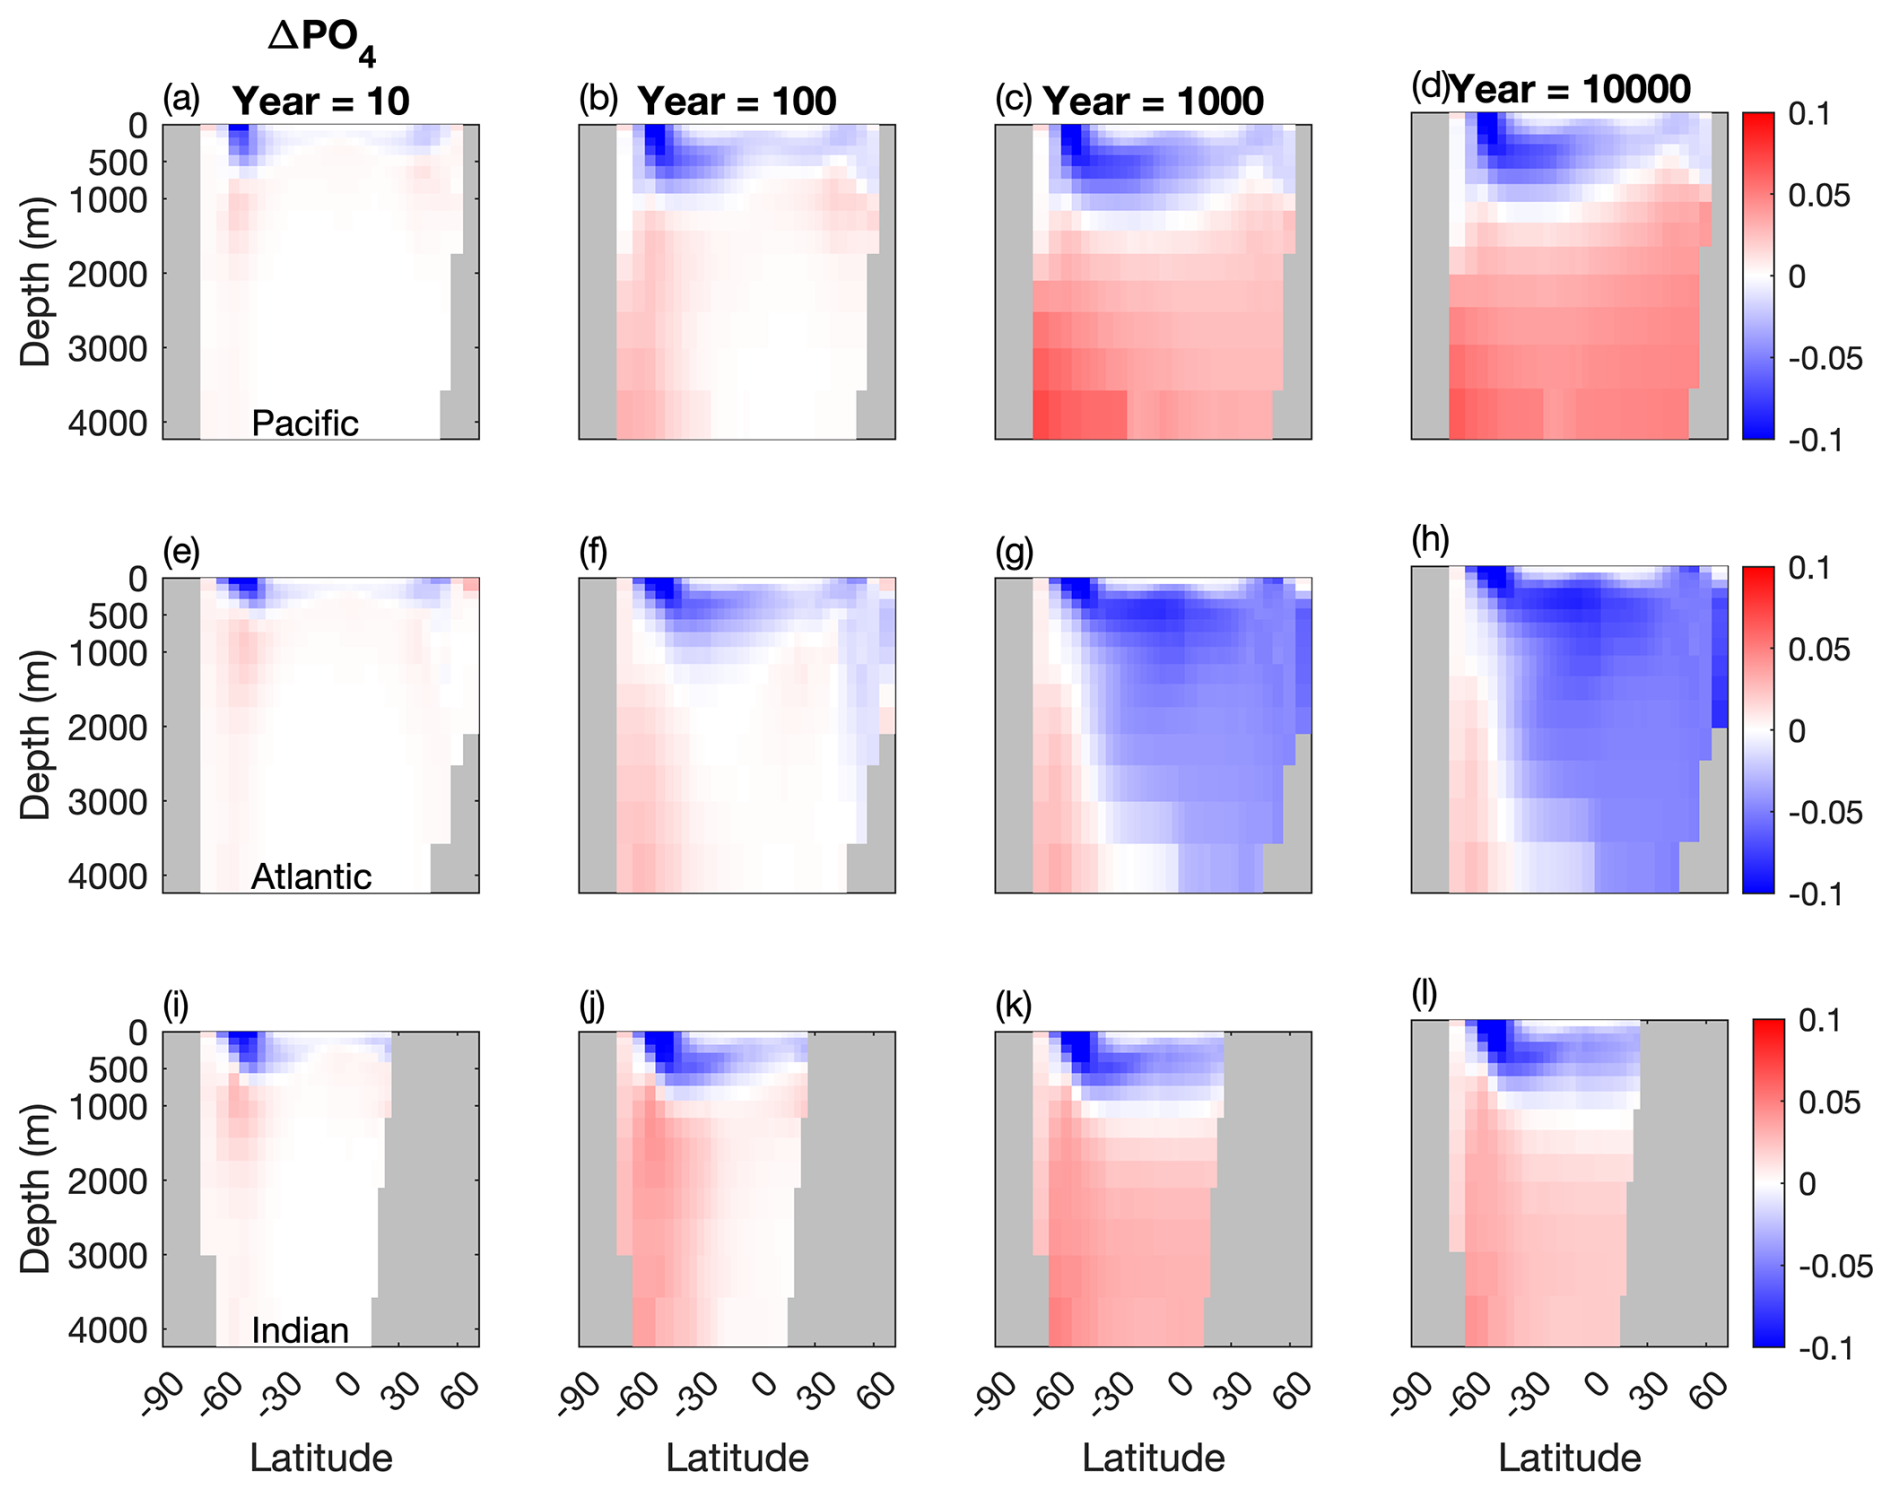
Figure 5Temporal evolution of differences in the meridional averaged PO4 concentration between the two configurations (µM). (a, b, c) Atlantic basin, (d, e, f), Indian basin, and (g, h, i) Pacific basin. Blue: less PO4 stored in the Mixotrophic configurations. Red: more PO4 stored in the Mixotrophic configuration.
The patterns shown in Fig. 4 reflect what is shown by the vertical profiles in Fig. 3. Early in the simulation the increased export of POC at low latitudes (Fig. 2i) leads to a corresponding downward shift in DIC in all three ocean basins, with less DIC stored near the surface and a corresponding accumulation of DIC at depth. This is consistent with the deeper sinking of the larger and more carbon-enriched organic matter produced by the mixotrophic community (Fig. 2).
This downward shift continues to develop through time in the Indian and the Pacific oceans, with mixotrophy causing a widespread increase in DIC storage in the ocean interior. The Atlantic Ocean, by contrast, shows a more complex response across the duration of the simulation. While the South Atlantic shows a consistent increase in deep ocean DIC through time, the North Atlantic eventually shows a decline in DIC storage associated with ventilation of the ocean interior by the NADW.
Corresponding changes in the oceanic PO4 distribution are shown in Fig. 5. As was the case for DIC, the initial response within the first 10–100 years of the simulations is similar across all three ocean basins, with a deepening of the PO4 profile at high latitudes. This response continues to develop within the Pacific and Indian Oceans, while the Atlantic Ocean deviates over longer timescales, with less PO4 at stored depth in the Mixotrophic Simulation. This decline is much more widespread than was seen for DIC (Fig. 4h).
3.3 Remineralised and preformed nutrients
The distribution of nutrients within the ocean interior is primarily influenced by two main processes, namely the local remineralisation of organic matter and the transport of “preformed” inorganic nutrients from the ocean surface (Ito et al., 2005). The effect of mixotrophy on these two processes is shown for DIC and PO4 in Figs. 6 and 7.
Figure 6 shows that while mixotrophy drives increased internal DIC storage through export and remineralisation, it has an opposite effect on the contribution from preformed DIC (Table 2).
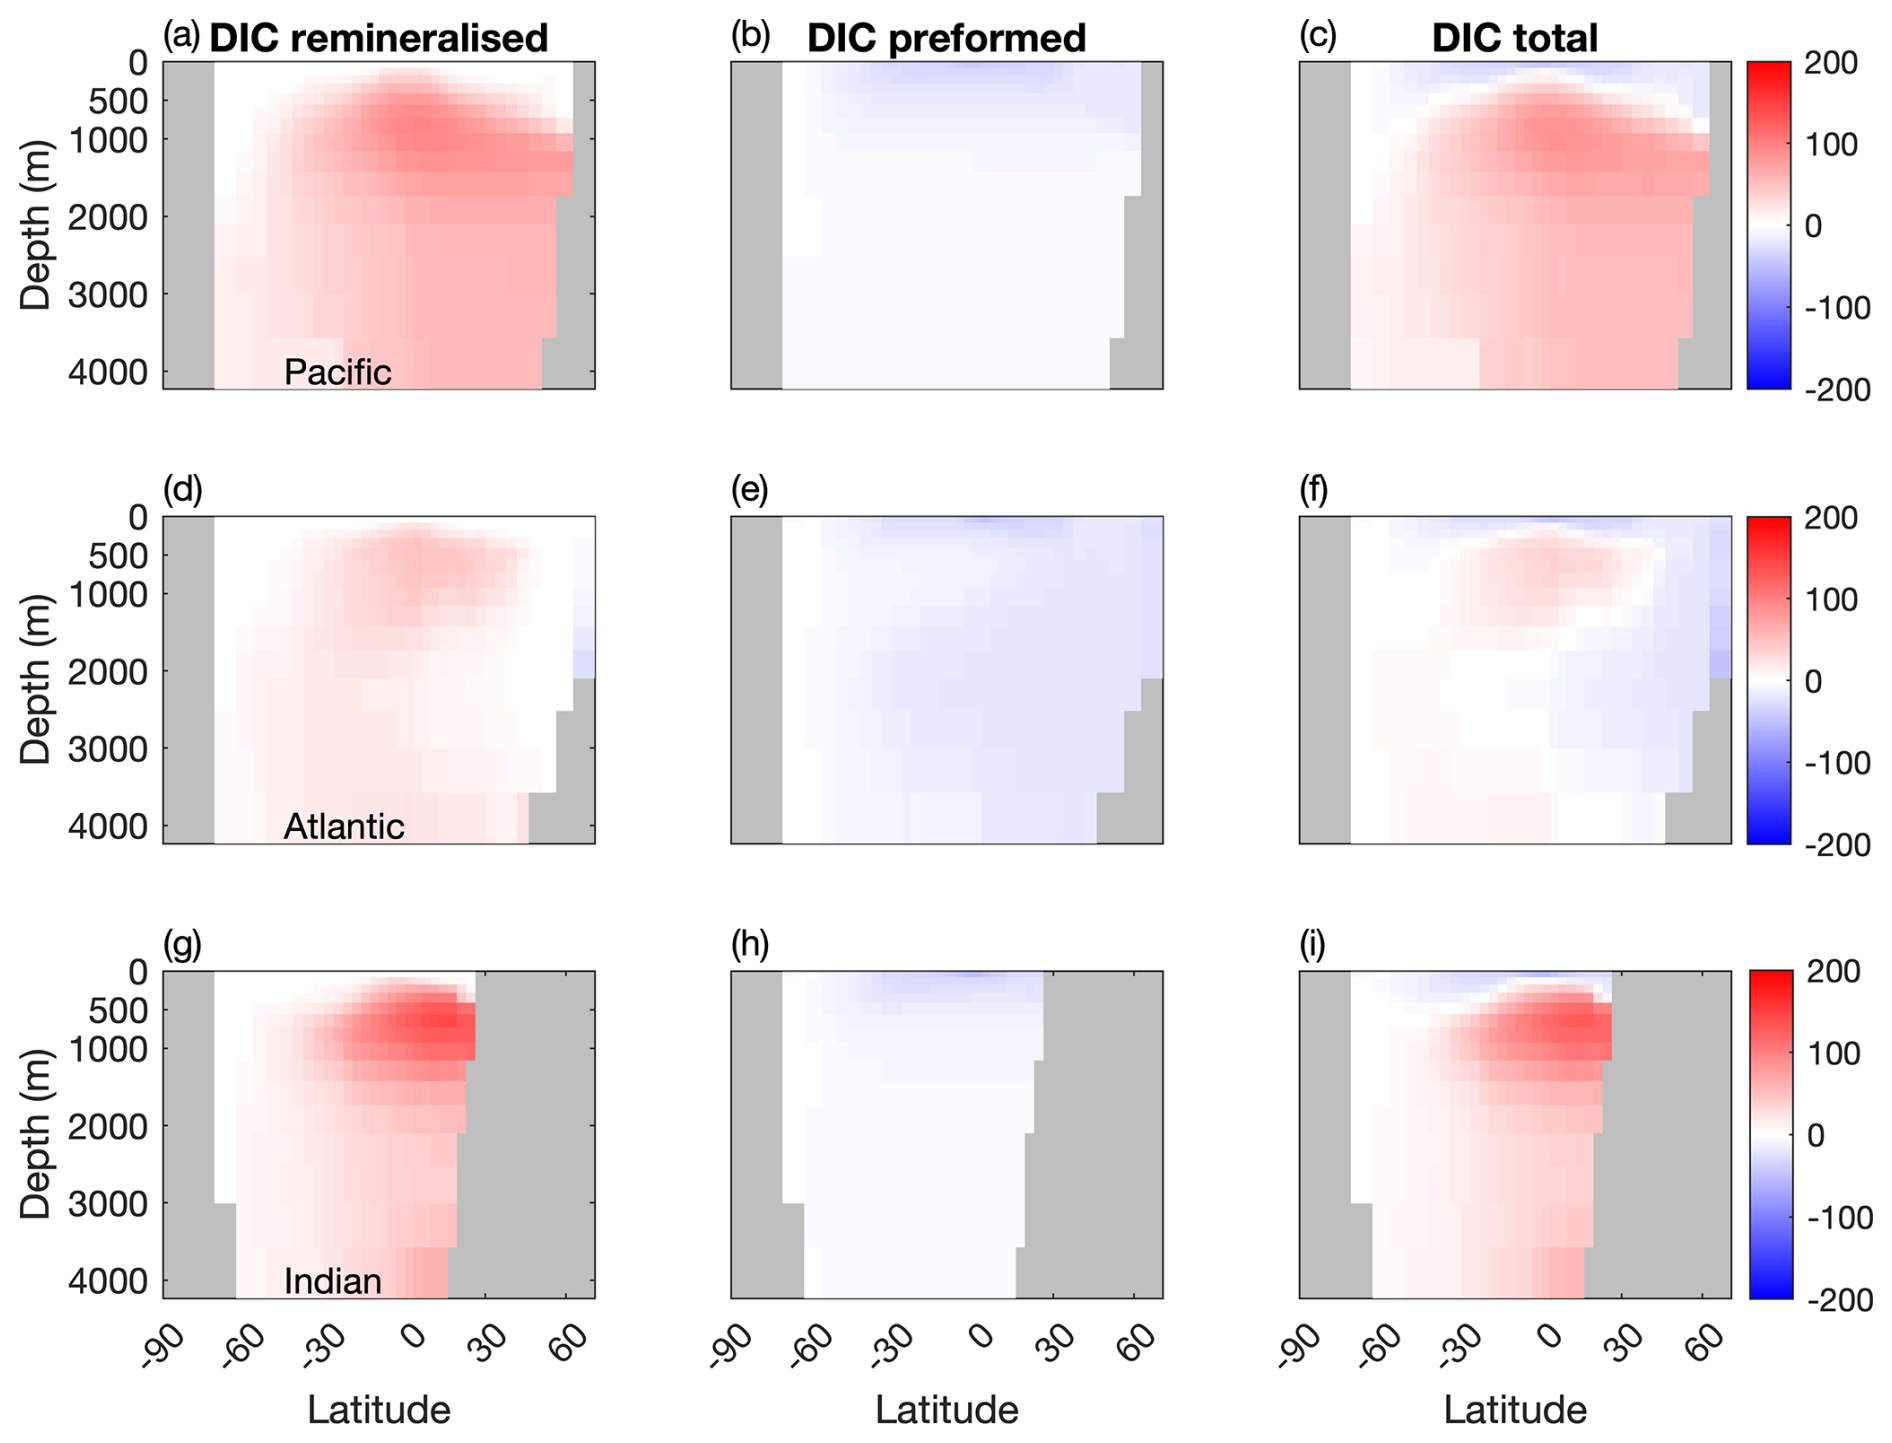
Figure 6Differences in remineralised, preformed and total DIC between the two configurations (µM) in the Pacific, Atlantic and Indian Basins. Blue: less DIC stored in the Mixotrophic configurations. Red: more DIC stored in the Mixotrophic configuration.
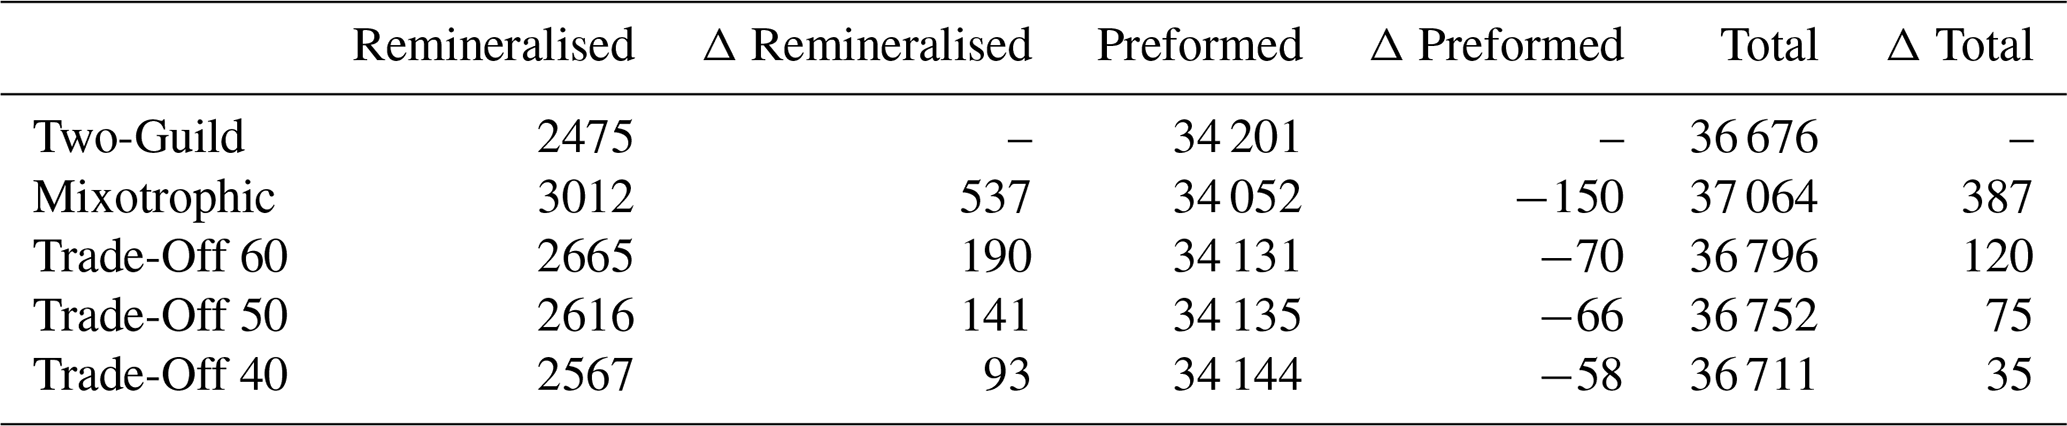
Table 2Comparison of remineralised, preformed and total DIC (Pg) across the different simulations at year 10 000. The Δ columns are the differences between the four mixotrophic simulations and the Two-Guild simulation.
Specifically, increased uptake and export of carbon at the surface causes a decline in surface DIC, and thus less DIC is carried into the ocean interior as those surface waters are subducted. Given that the effects on surface DIC are felt most strongly at low latitudes (Fig. 2t), this process has most effect on the ocean interior in the North Atlantic, where the northward transport of surface waters followed by the formation and subduction of NADW provides a direct pathway into the ocean interior. Preformed DIC plays a much weaker role in the Pacific and Indian Oceans, where there is no equivalent pathway for low latitude surface waters into the ocean interior.
A similar effect is seen for PO4 (Fig. 7), although in this case the impact on preformed PO4 is felt more strongly, because surface PO4 concentrations are most impacted at higher latitudes (Fig. 2x), where there are much more direct pathways into the ocean interior, especially in the Southern Ocean.
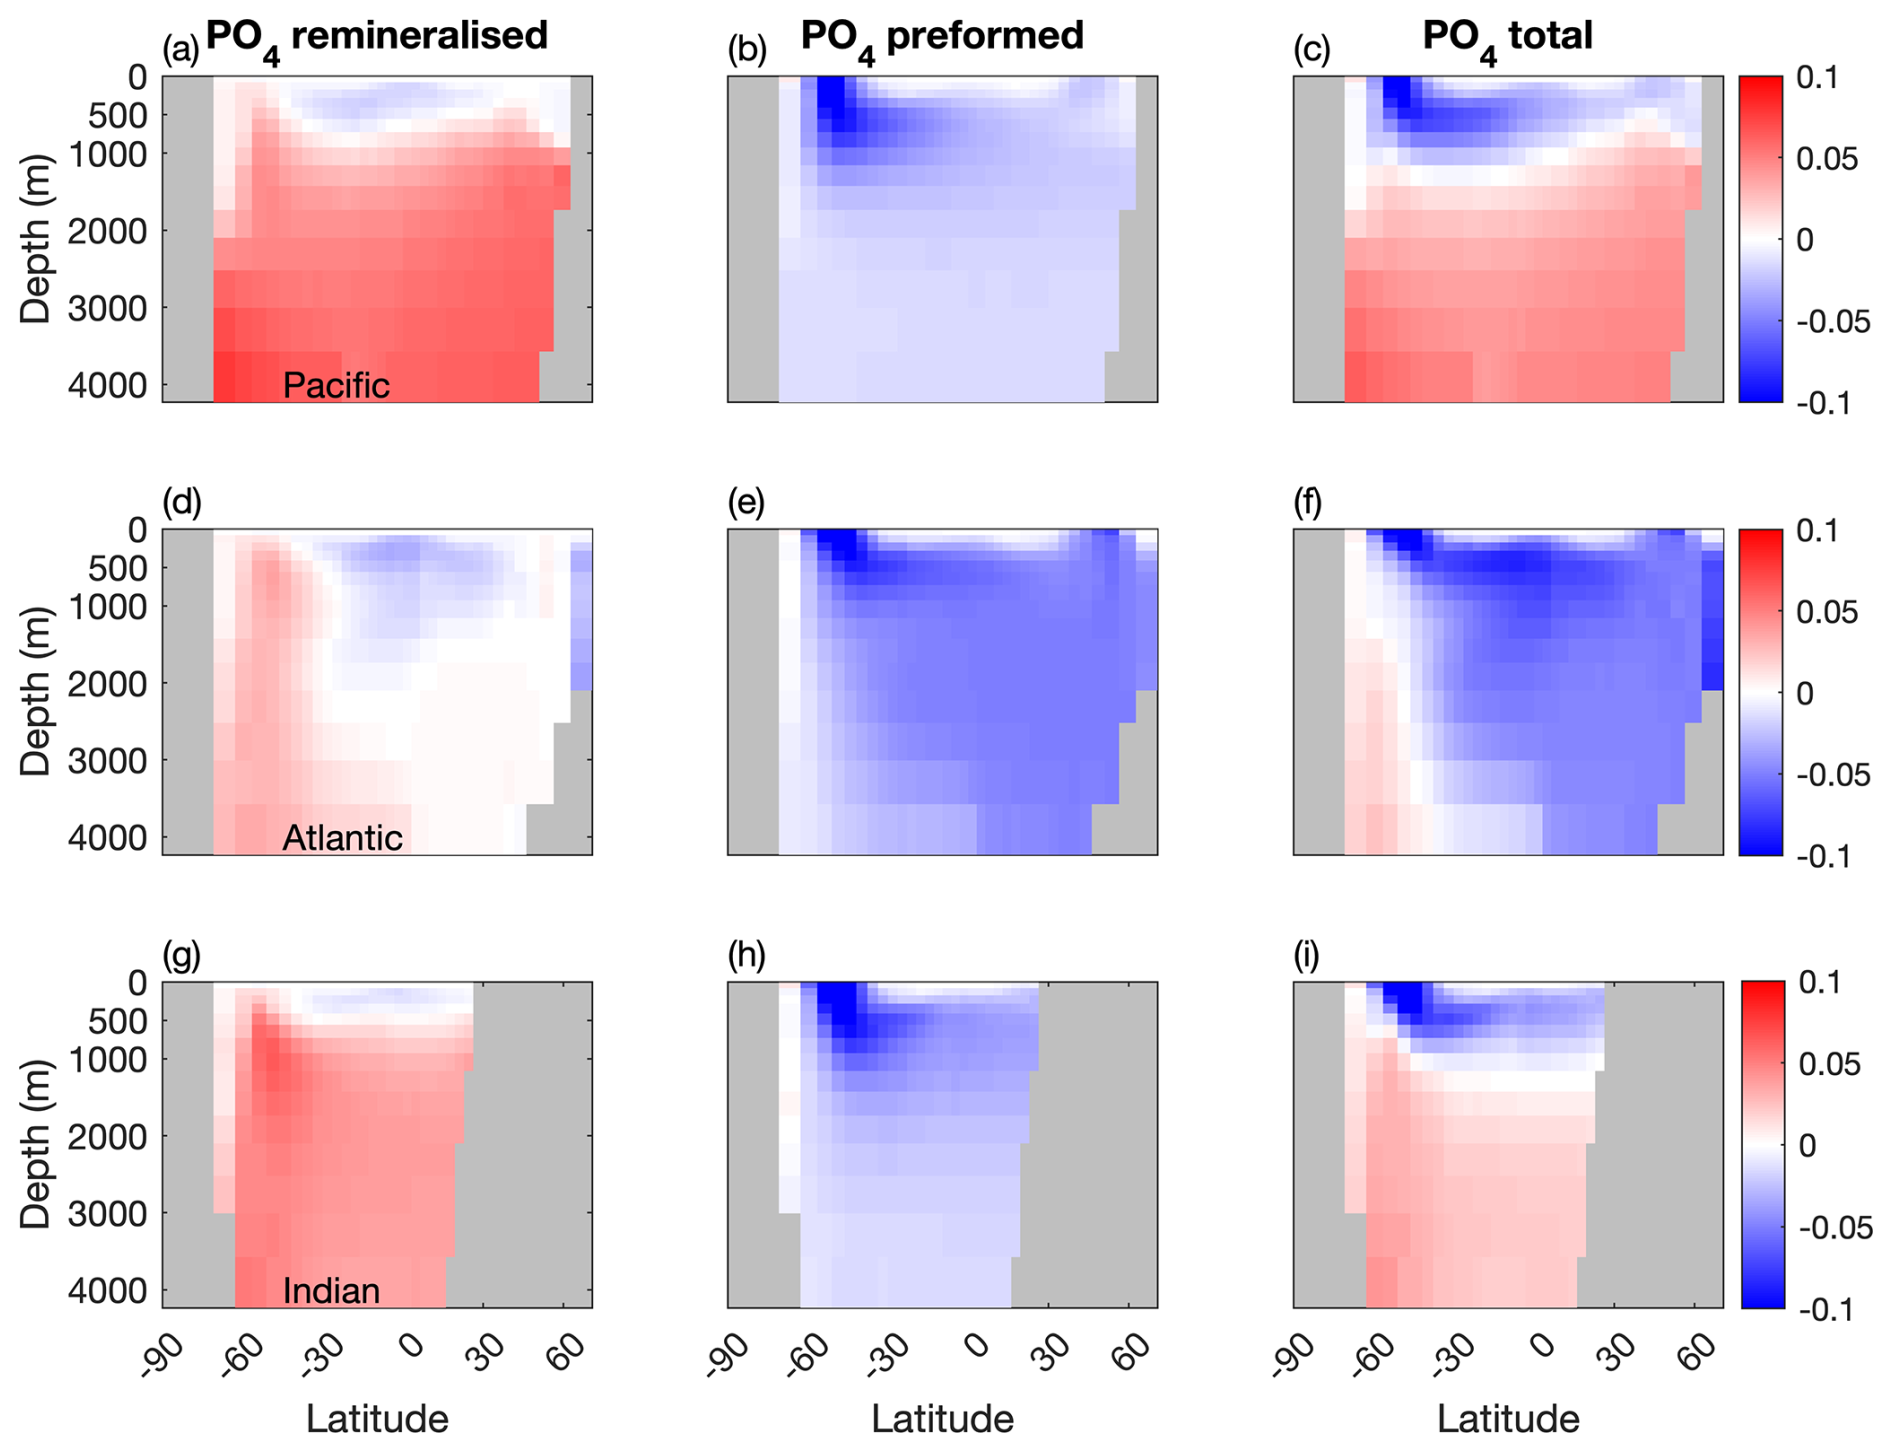
Figure 7Temporal evolution of differences in the remineralised and preformed PO4 between the two configurations (µM). (a, b, c) Atlantic basin, (d, e, f), Indian basin, and (g, h, i) Pacific basin. Blue: less PO4 stored in the Mixotrophic configurations. Red: more PO4 stored in the Mixotrophic configuration.
The weaker relative effect on preformed DIC may also be related to a buffering effect from the the model's atmosphere. This has a fixed CO2 concentration of 278 ppm, such that the increased drawdown of DIC is tempered to some extent by increased dissolution from atmosphere. This does not occur for PO4, for which the model ocean has a fixed inventory, with no atmospheric exchange to compensate for increased drawdown.
3.4 Sensitivity to trade-offs
The results presented and discussed above make the unrealistic assumption that mixotrophs incur no physiological costs for combining autotrophic and heterotrophic traits (Edwards et al., 2023a, b). It is therefore important to assess the potential impact of any physiological costs associated with mixotrophy.
Figure 8 shows how different potential costs of mixotrophy can moderate the ecological and biogeochemical impacts discussed above. As might be expected, the overall impact of mixotrophy on organism size and carbon export decreased when mixotrophs were subject to stronger physiological costs. While mixotrophy causes organism size and export to change in different directions in different regions, in general, the simulations revealed that a weaker trade-off (i.e. a lesser penalty associated with mixotrophy) made positive differences more positive (e.g. export production at low latitudes and organism size increased by more) and made negative differences more negative (e.g. export production at high latitudes declined by more). This pattern suggests that the results presented above constitute an upper limit to the impacts of mixotrophy and that the influence of mixotrophy on the carbon cycle depends on the strength of any associated trade-offs. The impacts of Mixotrophy on remineralised, preformed and total DIC are summarised in Table 2.
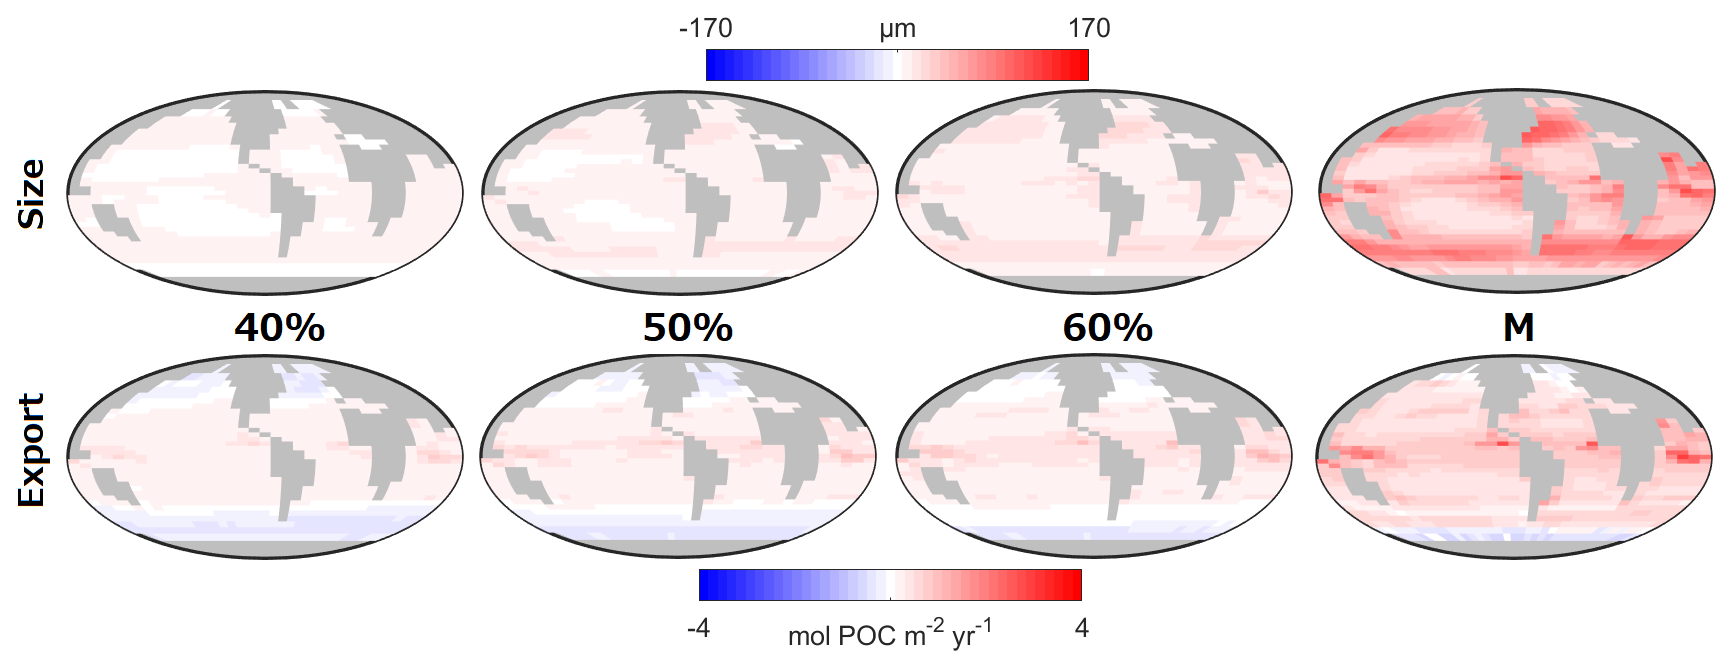
Figure 8Impact of the trophic trade-off on size and carbon export. The maps are the difference between the Mixotrophic/Trade-Off configurations and the Two-Guild configuration. The percentage refers to the Trade-Off factor (Table 1). “M” refers to the Mixotrophic configuration and these last two panels are identical to Fig. 2d and h, but for the colour bar used for size.
On timescales greater than approximately one year, the amount of exogenous nutrients supplied to the ocean surface is often assumed to be balanced by the vertical export of biomass (Hain et al., 2014). In principle, under this assumption, carbon export is set by the physical supply of “new” nutrients from below. In practice, however, the amount of carbon sequestered may be modified by both the size and stoichiometry of plankton. Larger plankton produce larger detrital particles (Small et al., 1979) that account for the majority of the vertical flux in the water column (McCave, 1975), while more carbon-rich organic matter exports more carbon per mole of limiting nutrient supplied.
Mixotrophy has been shown to influence carbon export through its effects on both plankton size and stoichiometry. Using a global ocean circulation model with one-degree resolution, Ward and Follows (2016) showed that mixotrophy allows photosynthesis to occur above the basal trophic level, supported by additional nutrients acquired from prey. At low latitudes in particular (where nutrients are more scarce), this increased the ratio of photosynthesis to inorganic nutrient uptake, and allowed more biomass to be passed up the food web to larger and faster sinking organisms.
While the enhanced sinking of larger and more carbon-enriched material was associated with increased carbon export, the 10–15 year timescale of the simulations used by Ward and Follows (2016) did not allow investigation of how these changes might impact ocean carbon sequestration. An unanswered question was what would happen to community structure and function once long-term feedbacks with the ocean circulation have been accounted for. Specifically, could long-term changes in oceanic DIC and nutrient distributions feed back and modify the initial ecological response? In this article the lower resolution EcoGEnIE model was used to simulate the system over the timescales required for these feedbacks to be resolved.
The results presented above confirm that the change from the Two-Guild to the Mixotrophic configuration rapidly affects ecosystem structure and function, and further suggest that these changes remain stable even after long-term feedbacks between the surface and ocean interior have been accounted for.
All plankton must acquire energy and a number of bioavailable elements (C, N, P, Fe, etc.) to grow and reproduce. For specialist phytoplankton, these resources come from photosynthesis and the uptake of inorganic nutrients. When light or any one inorganic nutrient becomes sufficiently scarce, the uptake of all elements is restricted. Mixotrophs, by contrast, can overcome the scarcity of individual inorganic resources through predation. This has previously been discussed as a mechanism by which mixotrophy allows more photosynthesis for the same supply of limiting nutrients, allowing more carbon to be exported to depth (Ward and Follows, 2016).
In the results presented above, it appears that the same mechanism also allows greater uptake and export of PO4 at high latitudes. The Mixotrophic model therefore exports more carbon at low latitudes and more phosphorus at high latitudes than the Two-Guild model. These effects emerge on very short yearly time scales and remain robust over millennia.
These results are largely consistent with the findings of Ward and Follows (2016), but here we also see the emergence of an indirect effect over centuries to millennia. Specifically, the additional DIC and PO4 removed by mixotrophs at the surface can lead to a decline in the deep ocean carbon and phosphate inventories in regions where surface waters are transported to depth. This is apparent in the influence of mixotrophs on preformed DIC and phosphate shown in Figs. 6 and 7.
The subduction of carbon and phosphorus depleted surface waters into the ocean interior partially counteracts the direct effects of mixotrophy on the biological carbon pump (Table 2), resulting in lower DIC and PO4 storage in the North Atlantic.
In general however, mixotrophy drives DIC and PO4 deeper into the water column. While the former represents increased oceanic carbon sequestration, the latter has the potential to impede oceanic production, if less PO4 is being supplied to the ocean surface. By running EcoGEnIE for 10 000 years, we were able to test whether such a feedback could temper the initial ecosystem response seen on annual to decadal timescales. In general, the consistent responses of the surface ecosystem through time suggest that the importance of any such feedbacks is limited, with a few exceptions, as noted above.
The long-term simulations presented here confirm that mixotrophy drives increased mean organism size and carbon export, even after long-term feedbacks between surface ecology and the biogeochemical inventory of the ocean interior have been accounted for. While there are some caveats associated with a long-term feedback associated with the transport of preformed DIC and PO4 through the NADW, this does not seem to qualitatively affect the capacity for mixotrophs to increase oceanic carbon storage as a consequence of their increased trophic transfer efficiency.
The results from the model are further explored in this section. To confirm that the model has reached the complete steady-state, we plotted the global mean surface nutrients and total global carbon export, and DIC components in Fig. A1.
Figure A2 shows the absolute values of equivalent spherical diameter, particulate organic carbon export, particulate organic phosphorus export, community autotrophic C:P uptake ratio, dissolved inorganic carbon and dissolved PO4 in the surface layer of the Two-Guild simulation. The relative effect of mixotrophy on these variables is shown in Fig. 2.
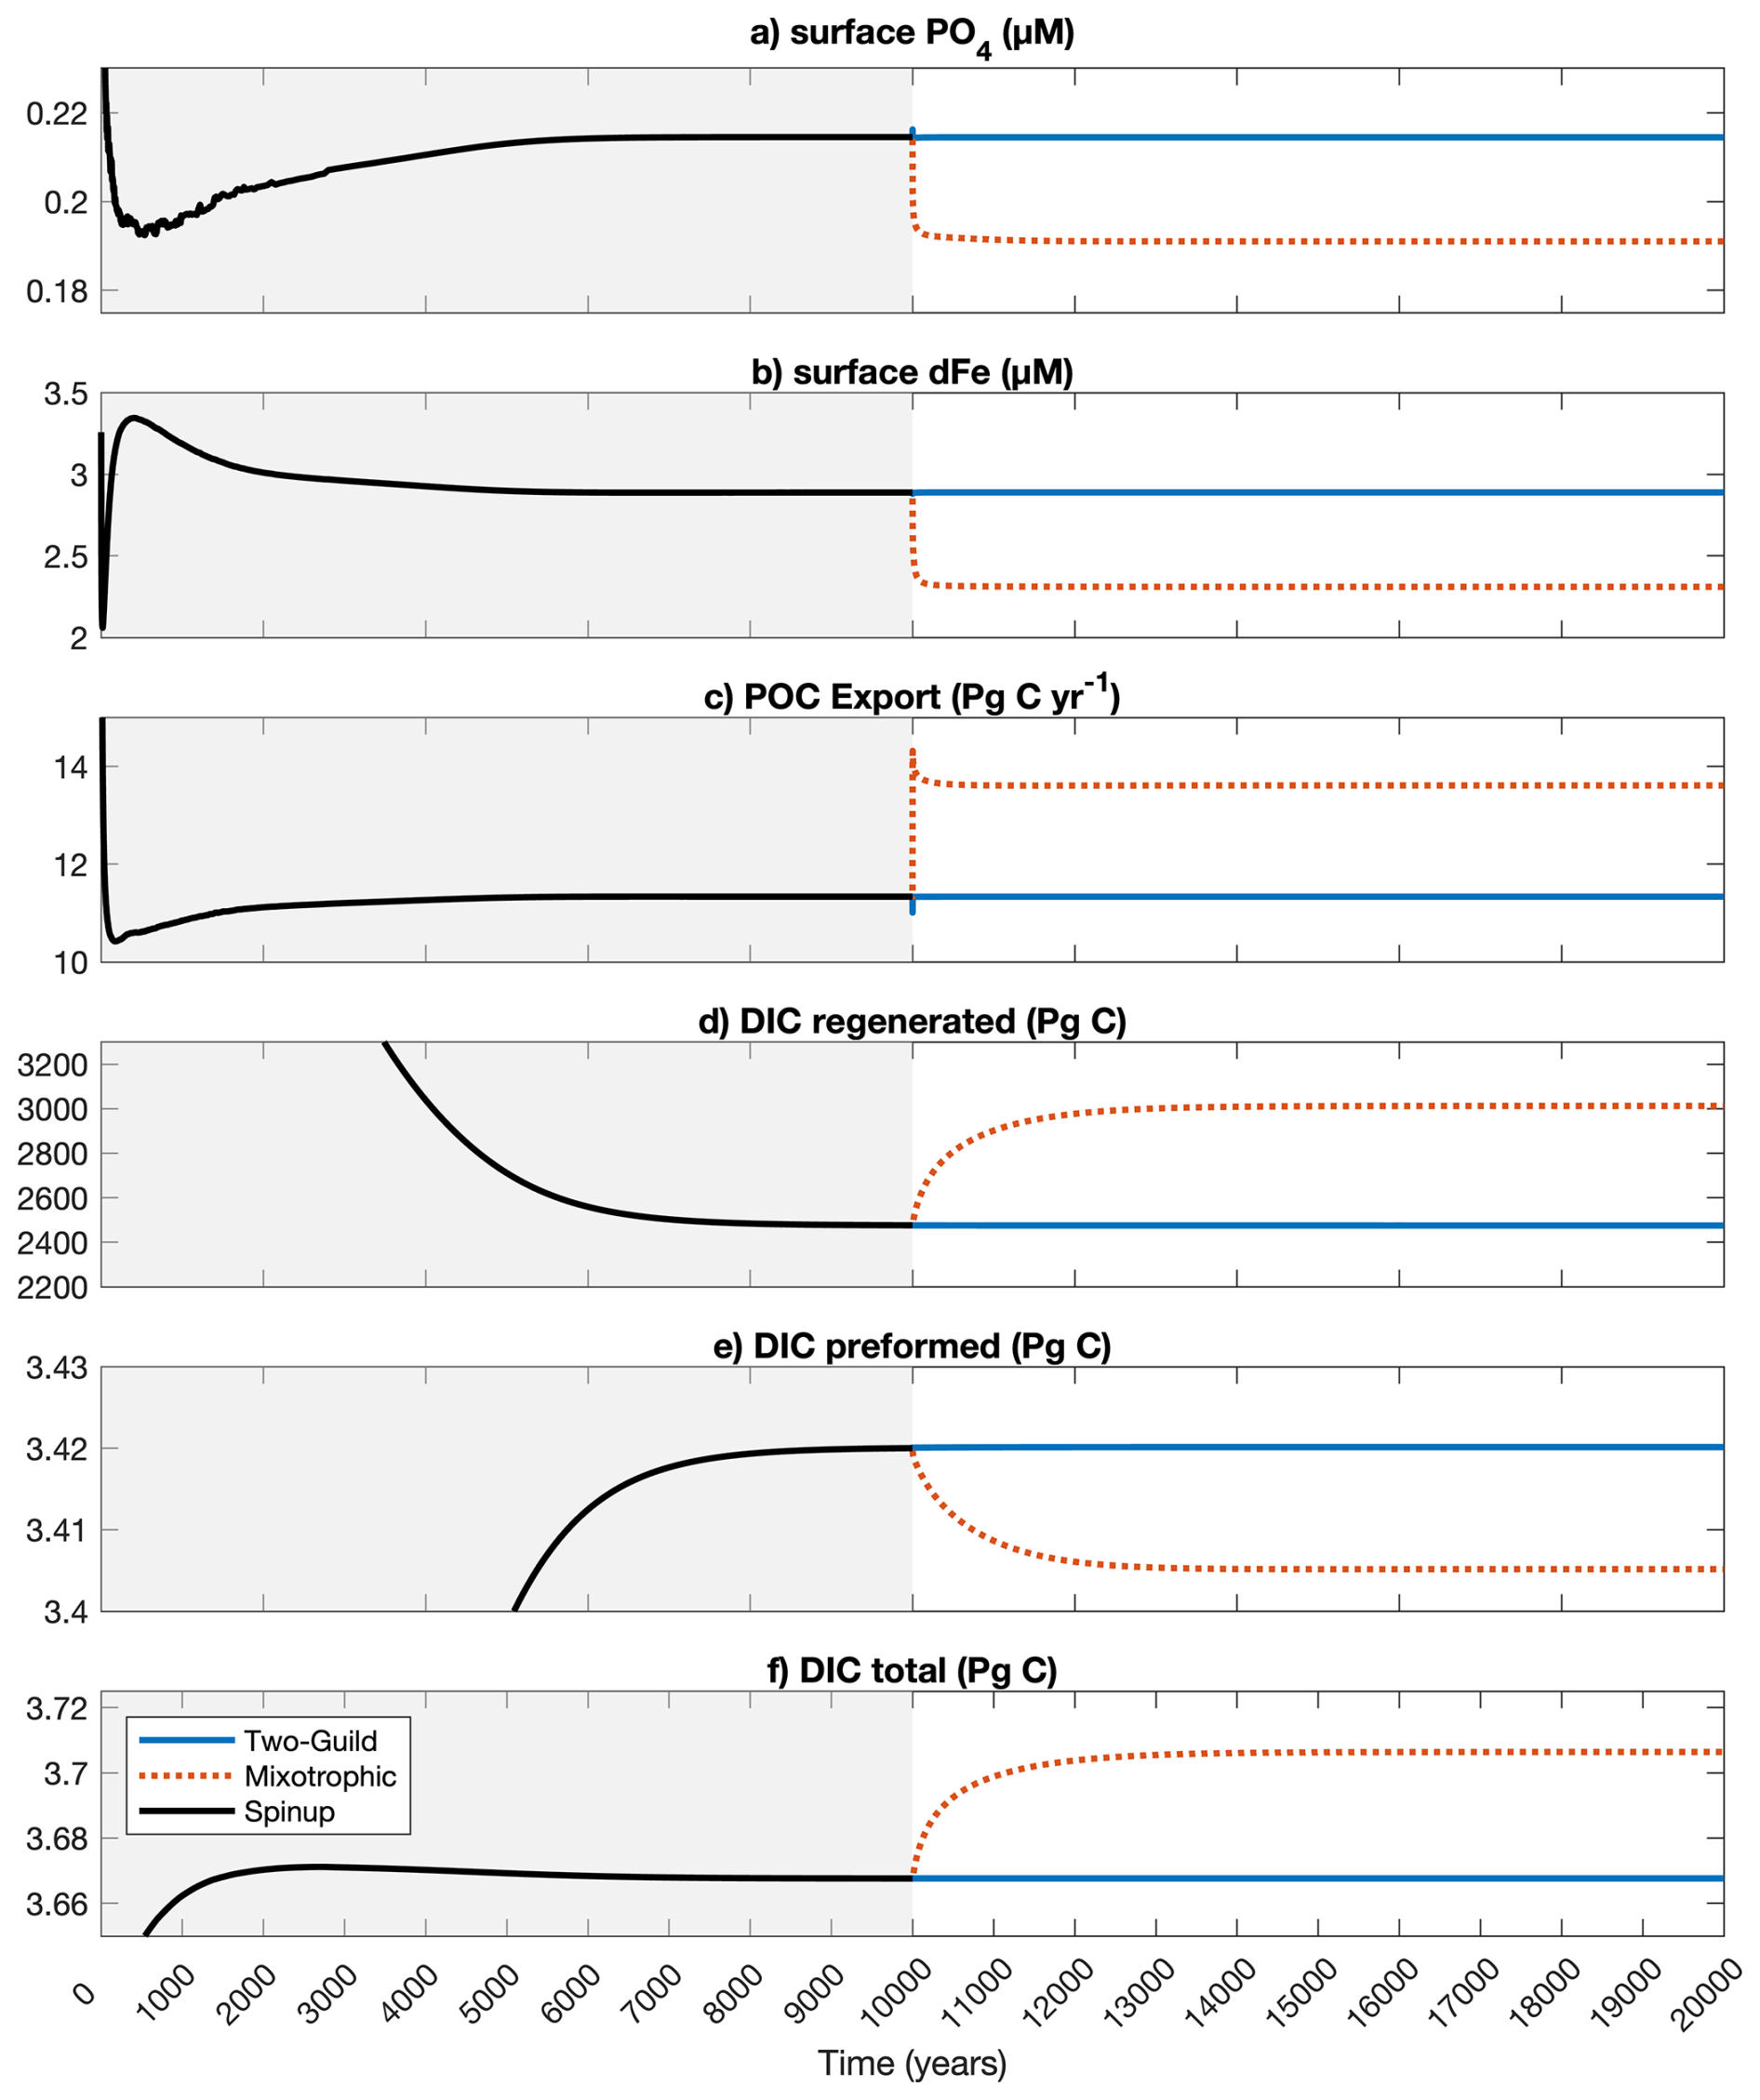
Figure A1Changes in global mean surface nutrients and total global carbon export, and DIC components throughout the spin-up and experimental simulations.
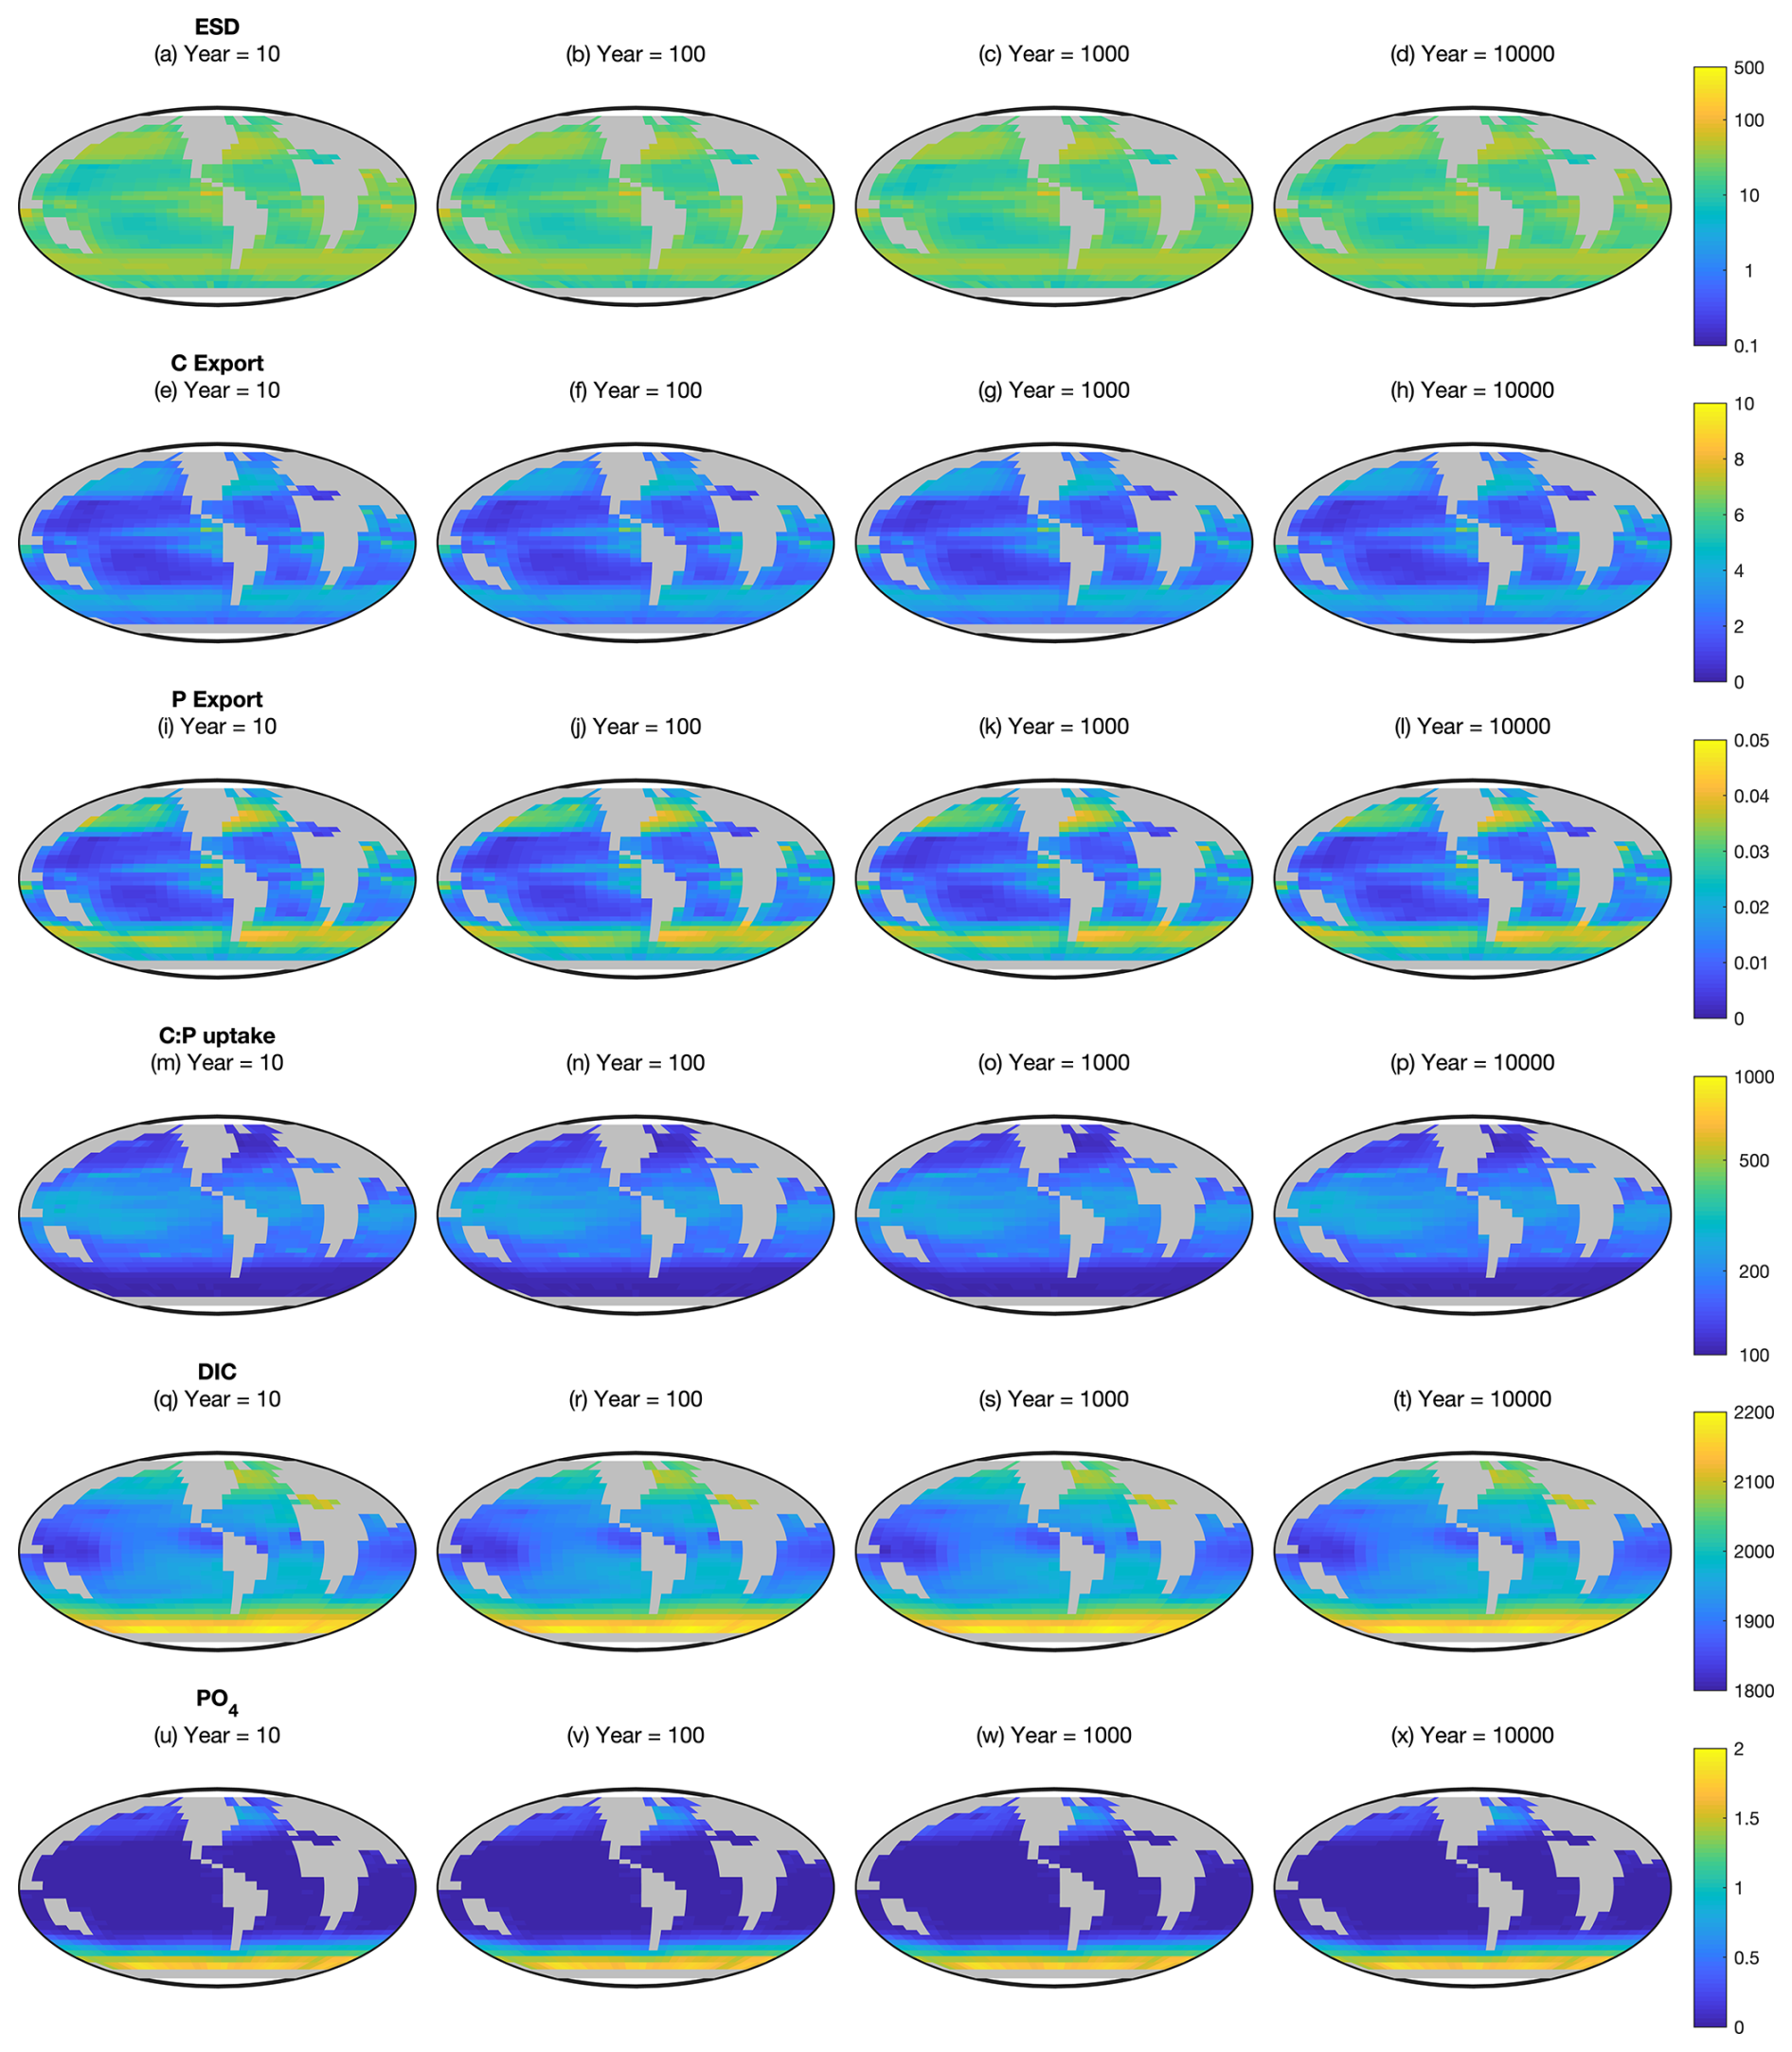
Figure A2Ecosystem state variables at the surface in the Two-Guild configuration. First row (a–d): equivalent spherical diameter of all plankton. Second row (e–h): particulate organic carbon export. Third row (i–l): particulate organic phosphorus export. Fourth row (m–p): community autotrophic C:P uptake ratio. Fifth row (q–t): dissolved inorganic carbon. Sixth row (u–x): dissolved PO4. These are the absolute values corresponding to the differences shown in Fig. 2.
The code for the version of the “muffin” release of the cGENIE Earth system model used in this paper, is tagged as v0.9.69, and is assigned a DOI: https://doi.org/10.5281/zenodo.17941040. Configuration files for the specific experiments presented in the paper can be found in the directory: genie-userconfigs/PUBS/submitted/Puglia_et_al.BioGeoSci.2025. Details of the experiments, plus the command line needed to run each one, are given in the readme.txt file in that directory. All other configuration files and boundary conditions are provided as part of the code release. A manual detailing code installation, basic model configuration, tutorials covering various aspects of model configuration, experimental design, and output, plus the processing of results, is assigned a DOI: https://doi.org/10.5281/zenodo.13377225.
MP and BAW conceptualized the study and performed the formal analysis. MP curated the data. BAW and JDW developed the methodology. MP, BAW, and TSB wrote the first draft of the manuscript. MP, BAW, TSB, and JDW contributed to the review and editing of the manuscript. All authors contributed to the interpretation of the results and approved the final version of the manuscript.
The contact author has declared that none of the authors has any competing interests.
Publisher's note: Copernicus Publications remains neutral with regard to jurisdictional claims made in the text, published maps, institutional affiliations, or any other geographical representation in this paper. While Copernicus Publications makes every effort to include appropriate place names, the final responsibility lies with the authors. Views expressed in the text are those of the authors and do not necessarily reflect the views of the publisher.
The authors would like to thank CM Moore (University of Southampton) for providing helpful feedback on earlier versions of the manuscript.
This research has been supported by the Royal Society (grant no. RGF\R1\180000).
This paper was edited by Jack Middelburg and reviewed by two anonymous referees.
Azam, F., Fenchel, T., Field, J. G., Gray, J. S., Meyer-Reil, L.-A., and Thingstad, F.: The ecological role of water-column microbes in the sea, Mar. Ecol. Prog. Ser., 10, 257–263, https://doi.org/10.3354/meps010257, 1983. a
Baretta-Bekker, J., Baretta, J., Hansen, A., and Riemann, B.: An improved model of carbon and nutrient dynamics in the microbial food web in marine enclosures, Aquat. Microb. Ecol., 14, 91–108, https://doi.org/10.3354/ame014091, 1998. a
Burkholder, J. M., Glibert, P. M., and Skelton, H. M.: Mixotrophy, a major mode of nutrition for harmful algal species in eutrophic waters, Harmful Algae, 8, 77–93, https://doi.org/10.1016/j.hal.2008.08.010, 2008. a
Claussen, M., Mysak, L., Weaver, A., Crucifix, M., Fichefet, T., Loutre, M.-F., Weber, S., Alcamo, J., Alexeev, V., Berger, A., Calov, R., Ganopolski, A., Goosse, H., Lohmann, G., Lunkeit, F., Mokhov, I., Petoukhov, V., Stone, P., and Wang, Z.: Earth system models of intermediate complexity: closing the gap in the spectrum of climate system models, Clim. Dynam., 18, 579–586, https://doi.org/10.1007/s00382-001-0200-1, 2002. a
DeVries, T., Primeau, F., and Deutsch, C.: The sequestration efficiency of the biological pump, Geophys. Res. Lett., 39, https://doi.org/10.1029/2012GL051963, 2012. a
Edwards, K. F., Thomas, M. K., Klausmeier, C. A., and Litchman, E.: Allometric scaling and taxonomic variation in nutrient utilization traits and maximum growth rate of phytoplankton, Limnol. Oceanogr., 57, 554–566, https://doi.org/10.4319/lo.2012.57.2.0554, 2012. a
Edwards, K. F., Li, Q., McBeain, K. A., Schvarcz, C. R., and Steward, G. F.: Trophic strategies explain the ocean niches of small eukaryotic phytoplankton, P. Roy. Soc. B-Biol. Sci., 290, 20222021, https://doi.org/10.1098/rspb.2022.2021, 2023a. a, b
Edwards, K. F., Li, Q., and Steward, G. F.: Ingestion kinetics of mixotrophic and heterotrophic flagellates, Limnol. Oceanogr., 68, 917–927, https://doi.org/10.1002/lno.12320, 2023b. a
Falkowski, P. G., Barber, R. T., and Smetacek, V.: Biogeochemical controls and feedbacks on ocean primary production, Science, 281, 200–206, https://doi.org/10.1126/science.281.5374.200, 1998. a
Fasham, M. J., Ducklow, H. W., and McKelvie, S. M.: A nitrogen-based model of plankton dynamics in the oceanic mixed layer, J. Mar. Res., 48, 591–639, 1990. a
Geider, R. J., MacIntyre, H. L., and Kana, T. M.: A dynamic regulatory model of phytoacclimation to light, nutrients and temperature, Limnol. Oceanogr., 43, 679–694, https://doi.org/10.4319/lo.1998.43.4.0679, 1998. a
Hain, M. P., Sigman, D., and Haug, G.: The biological Pump in the Past, Reference Module in Earth Systems and Environmental Sciences, Treatise on Geochemistry (Second Edition), The Oceans and Marine Geochemistry, 8, 485–517, https://doi.org/10.1016/B978-0-08-095975-7.00618-5, 2014. a
Hammer, A. C. and Pitchford, J. W.: The role of mixotrophy in plankton bloom dynamics, and the consequences for productivity, ICES J. Mar. Sci., 62, 833–840, https://doi.org/10.1016/j.icesjms.2005.03.001, 2005. a
Hansen, P., Bjørnsen, P., and Hansen, B.: Zooplankton grazing and growth: scaling within the 2-2,000-µm body size range, Limnol. Oceanogr., 42, 687–704, https://doi.org/10.4319/lo.1997.42.4.0687, 1997. a
Hartmann, M., Grob, C., Tarran, G. A., Martin, A. P., Burkill, P. H., Scanlan, D. J., and Zubkov, M. V.: Mixotrophic basis of Atlantic oligotrophic ecosystems, P. Natl. Acad. Sci. USA, 109, 5756–5760, https://doi.org/10.1073/pnas.1118179109, 2012. a
Hollowed, A. B., Barange, M., Beamish, R. J., Brander, K., Cochrane, K., Drinkwater, K., Foreman, M. G. G., Hare, J. A., Holt, J., Ito, S., Kim, S., King, J., Loeng, H., MacKenzie, B. R., Mueter, F. J., Okey, T. A., Peck, M. A., Radchenko, V. I., Rice, J. C., Schirripa, M. J., Yatsu, A., and Yamanaka, Y.: Projected impacts of climate change on marine fish and fisheries, ICES J. Mar. Sci., 70, 1023–1037, https://doi.org/10.1093/icesjms/fst081, 2013. a
Ito, T., Parekh, P., Dutkiewicz, S., and Follows, M. J.: The Antarctic circumpolar productivity belt, Geophys. Res. Lett., 32, https://doi.org/10.1029/2005GL023021, 2005. a
Marañón, E., Cermeño, P., López-Sandoval, D. C., Rodríguez-Ramos, T., Sobrino, C., Huete-Ortega, M., Blanco, J. M., and Rodríguez, J.: Unimodal size scaling of phytoplankton growth and the size dependence of nutrient uptake and use, Ecol. Lett., 16, 371–379, https://doi.org/10.1111/ele.12052, 2013. a, b
McCave, I. N.: Vertical flux of particles in the ocean, Deep Sea Research and Oceanographic Abstracts, 22, 491–502, https://doi.org/10.1016/0011-7471(75)90022-4, 1975. a
Mitra, A., Flynn, K. J., Burkholder, J. M., Berge, T., Calbet, A., Raven, J. A., Granéli, E., Glibert, P. M., Hansen, P. J., Stoecker, D. K., Thingstad, F., Tillmann, U., Våge, S., Wilken, S., and Zubkov, M. V.: The role of mixotrophic protists in the biological carbon pump, Biogeosciences, 11, 995–1005, https://doi.org/10.5194/bg-11-995-2014, 2014. a, b
Ridgwell, A., Hargreaves, J. C., Edwards, N. R., Annan, J. D., Lenton, T. M., Marsh, R., Yool, A., and Watson, A.: Marine geochemical data assimilation in an efficient Earth System Model of global biogeochemical cycling, Biogeosciences, 4, 87–104, https://doi.org/10.5194/bg-4-87-2007, 2007. a
Small, L., Fowler, S., and Ünlü, M.: Sinking rates of natural copepod fecal pellets, Mar. Biol., 51, 233–241, https://doi.org/10.1007/BF00386803, 1979. a
Sournia, A.: Form and function in marine phytoplankton, Biological Reviews, 57, 347–394, https://doi.org/10.1111/j.1469-185X.1982.tb00702.x, 1982. a
Stoecker, D. K.: Conceptual models of mixotrophy in planktonic protists and some ecological and evolutionary implications, European Journal of Protistology, 34, 281–290, https://doi.org/10.1016/S0932-4739(98)80055-2, 1998. a, b
Stoecker, D. K., Hansen, P. J., Caron, D., and Mitra, A.: Mixotrophy in the Marine Plankton, Annu. Rev. Mar. Sci., 9, 311–335, https://doi.org/10.1146/annurev-marine-010816-060617, 2017. a, b
Toggweiler, J. R. and Key, R. M.: Thermohaline circulation, in: Encyclopedia of Ocean Sciences, Elsevier, https://doi.org/10.1006/rwos.2001.0111, 2941–2947, 2001. a
Ward, B. A. and Follows, M. J.: Marine mixotrophy increases trophic transfer efficiency, net community production and carbon export, Proceedings of the National Academy of Sciences of the United States of America, 113, 2958–2963, https://doi.org/10.1073/pnas.1517118113, 2016. a, b, c, d, e, f, g, h, i, j, k, l
Ward, B. A., Marañón, E., Sauterey, B., Rault, J., and Claessen, D.: The size dependence of phytoplankton growth rates: a trade-off between nutrient uptake and metabolism, Am. Nat., 189, 170–177, 2017. a
Ward, B. A., Wilson, J. D., Death, R. M., Monteiro, F. M., Yool, A., and Ridgwell, A.: EcoGEnIE 1.0: plankton ecology in the cGEnIE Earth system model, Geosci. Model Dev., 11, 4241–4267, https://doi.org/10.5194/gmd-11-4241-2018, 2018. a, b, c, d, e, f
Worden, A. Z., Follows, M. J., Giovannoni, S. J., Wilken, S., Zimmerman, A. E., and Keeling, P. J.: Rethinking the marine carbon cycle: factoring in the multifarious lifestyles of microbes, Science, 347, 1257594, https://doi.org/10.1126/science.1257594, 2015. a