
the Creative Commons Attribution 4.0 License.
the Creative Commons Attribution 4.0 License.
 | 13 Jul 2026
Testing the precipitation-driven diffusion limitation hypothesis for declining methane uptake in forest soils
Victor Edmonds
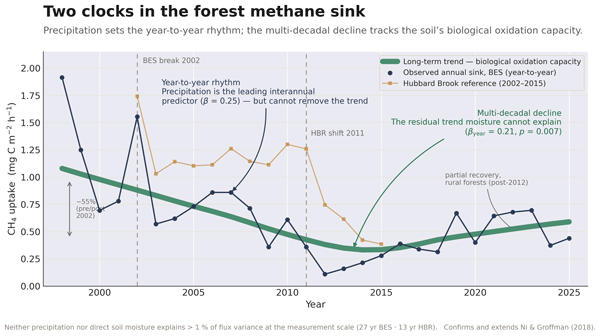
Upland forest soils oxidize 22–38 Tg CH4 yr−1, roughly 5 % of the total atmospheric methane sink. A recent study documented a 53 %–89 % reduction at two long-term ecological research networks in the northeastern US and attributed it to increased precipitation via diffusion limitation (the precipitation-driven, or climatic, diffusion limitation hypothesis). We tested five predictions of that hypothesis against 27 years of chamber flux data from the Baltimore Ecosystem Study (BES, 1998–2025; n=9359) and 13 years from the Hubbard Brook Experimental Forest (HBR, 2002–2015).
Four predictions were not supported. At the individual-measurement scale, neither monthly precipitation nor direct soil moisture (measured 2011–2020, after the 2002 BES break) explained more than 1 % of CH4 flux variance (R2=0.0008 and 0.0055). While precipitation emerged as a significant interannual predictor when data were aggregated to annual-site means (β=0.249, p=0.002), it did not eliminate the residual multi-decadal decline (βyear=0.211, p=0.007). No seasonal moisture–flux structure matched diffusion predictions. Urban and rural BES forests diverged despite sharing a regional precipitation regime (Year × LandUse interaction, p=0.007), and a residual temporal trend persisted after controlling for moisture, temperature, and spatial pseudoreplication (p=0.002). A structural breakpoint at 2002 (BES) and a putative shift at 2011 (HBR) aligned with atmospheric deposition trends rather than precipitation. A fifth test, the Hubbard Brook calcium amendment, yielded a null result that does not discriminate between mechanisms but constrains methanotrophic recovery potential.
These results suggest that precipitation-driven diffusion limitation does not adequately account for the multi-decadal loss of CH4 uptake at these sites and point toward chronic biological degradation, potentially through nitrogen-mediated inhibition of high-affinity methanotrophy compounded by structural changes from invasive earthworm activity.
- Article
(1933 KB) - Full-text XML
- BibTeX
- EndNote


Upland forest soils are a globally significant sink for atmospheric methane. Methanotrophic bacteria in the upper soil horizons oxidize CH4 at ambient concentrations (∼1.9 ppm), consuming an estimated 22–38 Tg CH4 yr−1 (Dutaur and Verchot, 2007; Saunois et al., 2020). This biological sink offsets roughly 5 % of total atmospheric CH4 removal, but it has been declining.
Ni and Groffman (2018b) documented a 53 %–89 % reduction in CH4 uptake across two independent long-term ecological research networks: the Baltimore Ecosystem Study (BES) in Maryland and the Hubbard Brook Experimental Forest (HBR) in New Hampshire. Their analysis of 317 peer-reviewed articles suggested a global decline of 77 % over three decades. They attributed the decline to increased precipitation: wetter soils reduce gas-phase diffusivity, physically limiting the supply of atmospheric CH4 to methanotrophs in the soil column.
This attribution rests on the diffusion limitation hypothesis, which holds that soil moisture is the primary rate-limiting control on CH4 uptake (Striegl, 1993; Ball et al., 1997; Ridgwell et al., 1999). The mechanism is intuitive: as rainfall fills soil pore spaces, the volume available for gas-phase transport shrinks, and because atmospheric CH4 must diffuse from the surface to the methanotrophs below, reduced air-filled porosity directly limits substrate supply. The framework is well established. Multiple global models parameterize the soil CH4 sink through diffusion-based equations (Del Grosso et al., 2000), and experimental manipulations at Harvard Forest have demonstrated that throughfall exclusion increases CH4 uptake while snow cover suppresses it (Borken et al., 2006). The hypothesis is mechanistically coherent and has been the default explanation for temporal variation in forest CH4 fluxes for three decades.
The organisms responsible for this oxidation are primarily uncultured high-affinity methanotrophs, principally the Upland Soil Cluster alpha (USCα) (Kolb, 2009; Knief, 2015). Unlike the low-affinity methanotrophs active at the elevated concentrations found in wetlands and landfills, USCα specialize in atmospheric-concentration oxidation. They are extremely slow-growing, with recovery timescales measured in decades after disturbance (Lim et al., 2024). This biology matters for evaluating the diffusion hypothesis: any mechanism that degrades the methanotrophic community, rather than merely restricting gas supply, would produce a decline that persists independently of moisture conditions.
The diffusion hypothesis also makes specific predictions. If diffusion limitation controls the long-term decline in CH4 uptake, then: (1) soil moisture should explain a substantial fraction of flux variance; (2) the moisture–flux relationship should exhibit seasonal structure consistent with site-specific precipitation regimes; (3) sites receiving identical precipitation should exhibit identical flux trajectories regardless of soil chemistry; (4) flux recovery should be general across sites sharing a precipitation regime; and (5) after controlling for moisture, no residual temporal trend should remain. A parallel, non-climatic hypothesis (physical destruction of methanotrophic habitat by invasive earthworms) makes overlapping predictions with the biological alternatives considered here and is evaluated in the Discussion.
Ni and Groffman (2018b) tested the association between precipitation trends and CH4 decline using data through 2016. They did not test direct soil moisture measurements against flux, apply formal changepoint detection, or use the Hubbard Brook calcium amendment as a natural manipulation to test the diffusion mechanism. Direct in-situ volumetric water content (VWC) data from BES soil sensors (2011–2020) were not incorporated.
We extend the BES record by 9 years (through 2025), add direct VWC measurements, and apply five independent tests to the diffusion hypothesis. The analysis incorporates over 9000 quality-controlled flux measurements, PRISM climate data, NADP wet deposition records, lysimeter soil solution chemistry, and vegetation surveys. Four of the five predictions were not supported; the fifth (a calcium amendment experiment) yields a null result consistent with diffusion limitation but also with biological alternatives. Taken together, the results suggest that precipitation-driven diffusion limitation, as applied to these two LTER networks, does not adequately account for the observed decline.
2.1 Study sites
The Baltimore Ecosystem Study (BES) is an urban-to-rural Long Term Ecological Research site in the greater Baltimore, Maryland metropolitan area (39.3° N, 76.6° W). CH4 flux measurements span nine forest sites along an urbanization gradient, from urban parks (Gwynns Falls, Hillsdale) to exurban forests (Oregon Ridge). The Hubbard Brook Experimental Forest (HBR) is located in the White Mountains of New Hampshire (43.9° N, 71.7° W). CH4 flux data are available from Watershed 1 (WS1), which received a calcium silicate amendment in October 1999, and the reference Watershed 6 at Bear Brook (WS6-BB). Site characteristics are summarized in Table 1.
Table 1Study site characteristics.

2.2 Data sources
CH4 flux. BES trace gas collection data (1998–2025) were obtained from the BES LTER data archive (knb-lter-bes). Measurements were made using static chambers with gas chromatography. The dataset contains 10 674 individual flux measurements across all sites and years. HBR CH4 flux data (2002–2015) were obtained from the Hubbard Brook data archive (knb-lter-hbr.207), comprising 231 annual and 1764 monthly observations.
Climate. Monthly precipitation and mean temperature for each site were obtained from the PRISM Climate Group (Oregon State University) at 4 km resolution. Separate extractions were performed for BES and HBR site coordinates.
Soil moisture. Hourly volumetric water content (VWC) measurements from BES soil sensor networks (2011–2020) were obtained from the BES data archive (knb-lter-bes.3400). The dataset contains 691 965 hourly readings from nine sensor locations across five sites. This 2011–2020 measurement window postdates the 2002 BES structural break (Sect. 3.6), so the direct VWC test characterizes post-decline rather than pre-decline soil moisture conditions.
Atmospheric deposition. Wet deposition of sulfate () and inorganic nitrogen () were obtained from the National Atmospheric Deposition Program (NADP) National Trends Network. Station NH02 (Hubbard Brook) provided sulfate records from 1978–2023. Station MD99 (Beltsville, MD) provided inorganic nitrogen records from 1999–2023.
Soil solution chemistry. Lysimeter concentrations (1999–2025) were obtained from the BES data archive (knb-lter-bes.428), comprising 20 479 measurements across all sampled plots; trend analyses focused on the three forested sites with continuous records (Hillsdale, Leakin Park, Oregon Ridge).
Soil properties. Physical, chemical, and biological properties of forest soils at 0–10 cm depth were obtained from knb-lter-bes.584 for four BES sites (Hillsdale, Leakin Park, Oregon Ridge, Oregon Ridge Upper). Properties include C:N ratio, microbial biomass carbon, net nitrogen mineralization, and net nitrification rates.
Vegetation. Seedling cover data across three BES census years (1998, 2003, 2015) were obtained from knb-lter-bes.3300 for three forested sites.
2.3 Data quality control
Two BES sites were excluded from all sink analyses: Gwynns Falls (GB), an urban stream-adjacent site, and Oregon Ridge Lower Riparian (ORLR). These two stream-adjacent sites produced 63 extreme positive CH4 measurements (fluxes up to 7234 ; 0.6 % of all measurements) representing ebullition from saturated riparian soils rather than the upland forest sink. Because neither site samples the upland sink under study, all of their measurements were excluded, not only the extreme values: this removed 875 measurements (8.4 % of the forest dataset), of which the 63 extreme positive fluxes were the motivating cases.
The full filtering sequence closes as follows. The raw archive contained 10 674 measurements. Restricting to forest sites and removing records with missing CH4 flux (200 and 114 measurements, respectively) yielded a forest dataset of 10,360; excluding the two hotspot sites removed a further 875 (the 8.4 % noted above), leaving 9485. A final per-measurement filter then removed the 126 values exceeding ±3 standard deviations within each site-year group, reducing the analytical dataset to 9359 measurements. The filter criteria, site exclusion rationale, and the number of observations removed at each stage are documented in the analysis code.
2.4 Prediction 1: Moisture–flux regressions
Precipitation proxy (climatological test). For each BES flux measurement, we matched the corresponding monthly total precipitation from PRISM. Ordinary least-squares regression of CH4 flux on monthly precipitation was performed on the pooled dataset (n=9359). This tests the diffusion hypothesis as Ni and Groffman (2018b) originally framed it: using precipitation as a proxy for soil moisture at the climatological scale. The diffusion hypothesis predicts a significant negative relationship (wetter months, less uptake).
Direct soil moisture (mechanistic test). BES VWC sensor readings were aggregated to a mean VWC per site-month and matched to CH4 flux measurements by site and month. This yielded 2415 paired VWC–flux observations (2011–2020, a window that postdates the 2002 BES break, Sect. 3.6). OLS regression was performed as above. Because gas-phase diffusivity (Dp) is physically controlled by air-filled porosity – the fraction of soil pore space not occupied by water – precipitation is an indirect proxy at best. A given rainfall event may or may not change soil moisture depending on antecedent conditions, drainage, and evapotranspiration. The VWC test therefore provides the mechanistically appropriate evaluation of diffusion limitation, while the precipitation test evaluates the hypothesis as Ni and Groffman (2018b) originally framed it. A significant VWC–flux relationship would support diffusion limitation even if precipitation proved to be a poor proxy.
2.5 Prediction 2: Seasonal stratification
The dataset was stratified by meteorological season (Winter: DJF; Spring: MAM; Summer: JJA; Fall: SON). Separate precipitation–flux regressions were performed within each season. In the humid mid-Atlantic climate of Baltimore, summer receives the highest total precipitation, but summer evapotranspiration (ET) from the deciduous canopy is also at its annual maximum, making summer soils the driest of the year in terms of water-filled pore space. Diffusion theory therefore predicts that summer should exhibit the highest methane uptake (maximum air-filled porosity) and the weakest precipitation–flux coupling (because precipitation inputs are rapidly offset by ET). The strongest moisture–flux coupling should occur in spring or fall, when precipitation exceeds ET and soils are wettest. We tested whether any seasonal R2 exceeded a negligible threshold and whether the seasonal flux pattern tracked the expected soil moisture seasonality.
2.6 Prediction 3: Calcium amendment experiment
The Hubbard Brook WS1 calcium silicate experiment provides a natural manipulation in which soil chemistry was altered while precipitation remained identical. WS1 (treated, October 1999) and WS6-BB (reference) occupy adjacent watersheds at similar elevation and aspect. Both receive the same precipitation inputs.
We compared mean CH4 flux between WS1 and WS6-BB and computed Cohen's d as the standardized effect size. We also computed the frequency of source events (positive CH4 flux, indicating net emission) at each site. The diffusion hypothesis predicts identical flux at both sites (same rain, same response), so a null result is expected under diffusion limitation. However, the comparison also tests whether reversing soil acidification – a major biogeochemical consequence of the calcium addition – restores CH4 uptake capacity. A null result therefore constrains the biological interpretation by establishing that 13 years of improved soil chemistry did not detectably alter the methanotrophic sink.
2.7 Prediction 4: Urban–rural divergence
BES sites were classified as urban (Hillsdale, Leakin Park) or rural (Oregon Ridge, Oregon Ridge Upper) following the BES urbanization gradient. Post-2012 linear trends in annual CH4 flux were computed separately for each group. The cutoff year (2012) was chosen following the apparent recovery visible in the final years of the Ni and Groffman (2018b) time series (their Fig. 1). Under a simple diffusion framework, sites sharing a regional precipitation regime should exhibit broadly convergent flux trajectories. However, urban and rural soils may differ in bulk density, macropore structure, and compaction history, so identical precipitation does not necessarily produce identical air-filled porosity. Divergent trajectories therefore provide suggestive but not definitive evidence for a non-climatic driver.
2.8 Prediction 5: Multi-predictor model
Two models were fit to the measurement-scale data. The primary model was a linear mixed-effects model (LMM) with a random intercept for site, CH4 ∼ Precipitation + Temperature + Year + (1 | Site), fit via restricted maximum likelihood (REML). The random intercept absorbs systematic differences between sites (e.g. one site consistently producing higher uptake than another), ensuring that fixed-effect estimates reflect within-site temporal relationships rather than between-site contrasts. This accounts for pseudoreplication from repeated chamber measurements at fixed locations. For transparency, an ordinary least-squares (OLS) model was also fit for comparison. All predictors were standardized (z-scored) to allow direct comparison of coefficient magnitudes. The diffusion hypothesis predicts that after controlling for moisture, no significant temporal trend (Year effect) should remain.
To address the possibility that chamber-level measurement noise obscures a real moisture signal, the OLS model was additionally fit at three temporal scales: (1) individual measurements (n=9359), (2) seasonal-site means aggregated by site × season × year (n=625), and (3) annual-site means aggregated by site × year (n=169). If diffusion limitation operates at longer timescales than individual measurements can resolve, aggregation should increase the precipitation signal relative to Year. The diffusion hypothesis predicts that precipitation should dominate and Year should become non-significant at the aggregated scales.
2.9 Changepoint detection
To identify years in which the CH4 flux time series underwent abrupt structural shifts, as opposed to gradual trends, we applied the Pruned Exact Linear Time (PELT) changepoint algorithm (Killick et al., 2012). PELT partitions a time series into segments that minimize within-segment variance, identifying the points where the statistical properties of the data shift. It was applied to annual median CH4 flux at BES and HBR independently. Annual medians were used rather than means because extreme positive events (even after outlier filtering) distort the mean, while the median tracks the bulk behavior of the soil sink. Penalty calibration was performed through sensitivity analysis across a range of penalty values (0.01–10). A penalty of 0.1 produced stable, interpretable breakpoints at both sites. Breakpoint robustness was further evaluated through block-bootstrap confidence intervals on breakpoint timing, a comparison across alternative detection algorithms (binary segmentation, bottom-up, dynamic programming, and a window-based scan), an expanded penalty sweep, and a power analysis for the short post-2011 HBR record (Sect. 3.6; Appendix A14–A17). These analyses are implemented in breakpoint_robustness.py; the original sensitivity analysis is documented in the analysis code.
2.10 Deposition and soil chemistry context
NADP wet deposition data were plotted against CH4 flux time series to assess temporal alignment between deposition trends and flux breakpoints. Lysimeter concentrations were aggregated to annual site means and analyzed by site for monotonic trends using OLS regression against time.
2.11 Statistical considerations
The 9359 individual flux measurements are not fully independent. Repeated measurements from fixed chamber locations introduce spatial pseudoreplication, and temporal autocorrelation is expected in long environmental time series. We address these concerns in four ways. First, all primary results are reported at both the individual-measurement and site-year aggregated scales. Second, changepoint detection (PELT) is applied to annual time series rather than raw measurements, eliminating within-year autocorrelation. Third, the five tests are independent of one another; the conclusion rests on the convergence of multiple lines of evidence, not on the statistical significance of any single test. Fourth, the multi-predictor model (Prediction 5) is fit as a linear mixed-effects model (LMM) at two levels of spatial nesting: a random intercept for site and a random intercept for individual collar (Site × Plot × Chamber); the collar-level LMM serves as the primary analysis, with the site-level LMM and OLS providing comparisons. Residuals are checked for temporal autocorrelation via Durbin–Watson statistics.
All analyses were performed in Python 3.x using pandas, numpy, scipy, statsmodels, matplotlib, seaborn, and ruptures. The complete analysis is implemented in reproducible scripts (master_analysis.py, with robustness checks in supplemental_robustness.py and breakpoint_robustness.py) using portable relative paths. All data are publicly available from the respective LTER data archives.
3.1 Prediction 1: Moisture–flux regressions
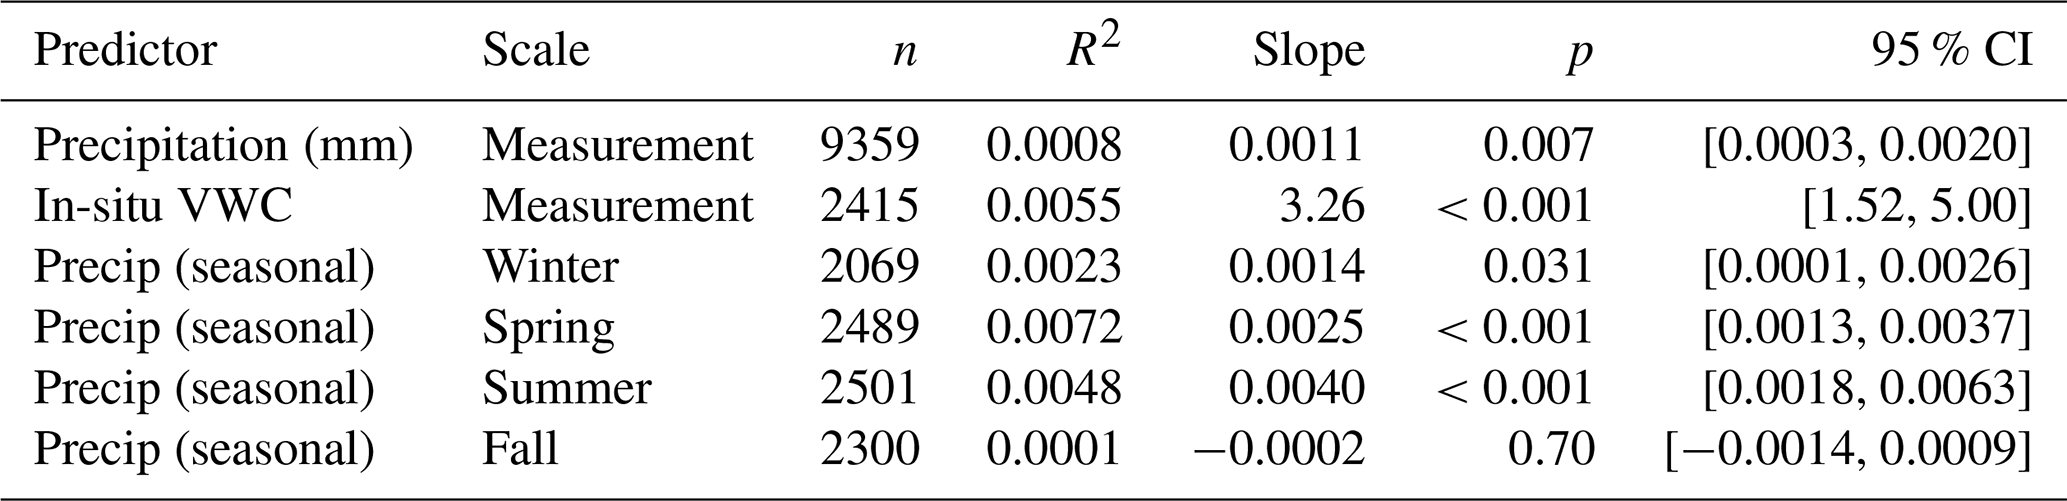
Monthly precipitation explained 0.08 % of the variance in CH4 flux across the pooled BES dataset (R2=0.0008, slope=0.0011, p=0.007, n=9359; Fig. 1a). The slope was positive (more precipitation associated with less negative flux, i.e. reduced uptake), consistent with the predicted direction under diffusion limitation, but the magnitude is negligible. A temporal scale mismatch is inherent to this test: each chamber measurement captures a single hour of gas exchange, while monthly precipitation integrates 30 d of rainfall. This mismatch weakens the expected correlation even if diffusion limitation operates on shorter timescales, making the precipitation test a conservative evaluation of the hypothesis.

Figure 1Moisture–flux regressions at BES. (a) Monthly precipitation vs. CH4 flux, 1998–2025 (n=9359; R2=0.0008). (b) In situ volumetric water content vs. CH4 flux, 2011–2020 (n=2415; R2=0.0055). Neither the climatological proxy nor the direct mechanistic variable explains more than 1 % of flux variance.
Direct in-situ VWC performed marginally better but remained negligible: R2=0.0055 (slope=3.26, p<0.001, n=2415; Fig. 1b). The direct soil moisture measurement, which the diffusion hypothesis identifies as the mechanistically relevant variable, explained less than 1 % of flux variance over the 2011–2020 measurement period.
Neither the proxy nor the direct measurement approaches the explanatory power expected of a rate-limiting control (Table 2). Borken et al. (2006) found moisture explained substantial variance at Harvard Forest under experimental manipulation; in observational data spanning 27 years at BES, the relationship is effectively absent.
A caveat applies to the VWC test: the soil moisture data span 2011–2020, a period that postdates the BES structural breakpoint at 2002 (Sect. 3.6). If the methanotrophic community was already degraded by 2011, the VWC test evaluates moisture–flux coupling in a system where the biological capacity for atmospheric CH4 oxidation may have been diminished. The low R2 is therefore ambiguous: it could indicate that diffusion was never the rate-limiting step, or that diffusion control was present historically but is no longer detectable because the biological sink has weakened. The precipitation–flux test (1998–2025) spans the full record, including the pre-breakpoint period, and also shows negligible explanatory power (R2=0.0008).
As a sensitivity check, re-running the precipitation–flux regression without the ±3 SD per-site-year filter (retaining 126 extreme measurements) actually weakened the precipitation signal: R2 dropped from 0.0008 to 0.0003 and became non-significant (p=0.085). The extreme positive measurements, microsites where saturation-driven methanogenesis overwhelms uptake, do not reinforce a precipitation–flux relationship; they add noise that further obscures any diffusion signal (see Sect. 4.11 for details).
The moisture–flux relationship was not always this weak. Stratifying the BES record at the 2002 PELT changepoint (Sect. 3.6) reveals that pre-breakpoint (1998–2002) precipitation explained 0.57 % of flux variance (n=1250, R2=0.0057, p=0.008); roughly 7× the full-record value. A quadratic model accounting for the unimodal diffusion relationship reached R2=0.018 (). After 2002, the relationship vanished entirely (R2=0.0001, p=0.31). A caveat: the 2002 split point was identified by PELT on annual median fluxes from the same dataset, so this stratification is post-hoc. A permutation test shuffling year labels (n=1000) yielded p=0.057 for the observed ΔR2, indicating that the pre/post coupling difference is suggestive but not formally significant at α=0.05 (Sect. 4.11). PELT optimized for a shift in flux level, not for moisture–flux coupling strength, so the pre/post comparison tests a quantity that was not used to select the breakpoint, but this distinction does not fully resolve the circularity concern. This pattern is consistent with a weak moisture–flux coupling that existed while the methanotrophic community was intact, and that disappeared after the structural break as the community's capacity to respond to moisture fluctuations degraded. Monthly precipitation is an inherently blunt proxy for the instantaneous soil moisture experienced by a chamber at the time of measurement; the direct VWC test above provides the mechanistically appropriate evaluation, but even this more relevant variable explains less than 1 % of variance.
3.2 Prediction 2: Seasonal stratification
Seasonal precipitation–flux R2 values were: Spring 0.0072, Summer 0.0048, Winter 0.0023, Fall 0.0001. No season exceeded 1 %. Although summer has the highest total precipitation, high evapotranspiration from the deciduous canopy makes summer soils the driest of the year. Diffusion theory therefore predicts the strongest moisture–flux coupling in spring or fall, when soils are wettest. Spring showed the highest R2 (0.0072), but this remains negligible. Fall, when soils begin to rewet after the growing season, showed the weakest coupling (R2=0.0001), opposite to diffusion predictions. At no season did precipitation explain a meaningful fraction of flux variance.
3.3 Prediction 3: Calcium amendment experiment
Mean CH4 flux at WS1 (Ca-treated) was −1.0414 . Mean flux at WS6-BB (reference) was −1.0346 . Cohen's , a negligible standardized effect ( is conventionally classified as small; Table 3). Both sites declined at the same rate. WS1 had a source event frequency of 0.0 %; WS6-BB had 1.8 %.
Table 3Calcium amendment experiment: WS1 (treated) vs. WS6-BB (reference), Hubbard Brook, 2002–2015.

At first glance, the null result appears consistent with the diffusion hypothesis, which predicts that a chemical amendment should not affect gas-phase transport. The soils at Hubbard Brook are Spodosols (acidic, leached forest soils with a characteristic iron-enriched B-horizon), derived from glacial till and texturally coarse, sandy loams with very low clay content. Unlike the heavy agricultural soils where liming promotes clay flocculation and macroporosity changes (Haynes and Naidu, 1998), surface wollastonite application to these sandy soils is unlikely to have meaningfully altered bulk density or gas-phase diffusivity in the deeper profile. Identical flux between WS1 and WS6-BB is therefore exactly what the physical diffusion hypothesis predicts, and this test does not discriminate between diffusion and biological mechanisms on physical grounds alone. Its value lies instead in constraining the biological interpretation: the calcium silicate addition reversed soil solution chemistry, increased soil pH, and restored forest growth at WS1 (Battles et al., 2014; Johnson et al., 2014), yet did not detectably alter the CH4 sink over 13 years of monitoring. If acidification-mediated damage to the methanotrophic community were readily reversible, recovery should have been apparent at WS1 over this timescale.
If the decline reflected reversible acidification damage to methanotrophs, calcium amendment should have initiated recovery over the 13-year monitoring period, yet no such recovery was observed. This is consistent with either irreversible community degradation (see Lim et al., 2024, who document recovery timescales of decades for high-affinity methanotrophs) or a mechanism unrelated to soil acidity per se.
However, a mechanistic interpretation is available that – while it cannot be confirmed with the data here – is consistent with the known biochemistry. The high-affinity atmospheric methanotrophs (USCα) that dominate upland forest soils are adapted to acidic conditions, with some clades explicitly acidophilic (Täumer et al., 2021; Kolb, 2009). Liming raises soil pH and dramatically stimulates nitrification (Groffman et al., 2006). The elevated turnover of inhibits methane monooxygenase (MMO), the enzyme responsible for the initial oxidation step – not through simple substrate competition with CH4, but substantially through the nitrite intermediate generated during ammonium oxidation (Schnell and King, 1994). On this view, the CaSiO3 addition may not merely have failed to restore the methanotrophic community but plausibly created a less favourable environment for USCα, simultaneously raising pH above their acidophilic optimum and increasing the supply of enzymatic inhibitors. Under this interpretation the null result would be not merely ambiguous but the expected outcome of a treatment working against the very organisms it would need to recruit. We offer this as a plausible hypothesis consistent with established biochemical pathways, not as discriminating evidence: confirming it would require direct microbial data (e.g. pmoA gene surveys), which are not available here.
3.4 Prediction 4: Urban–rural flux trajectories
Post-2012 trends in CH4 flux diverged between urban and rural BES forests (Fig. 2). Rural forests showed a significant continuing decline (, p=0.001). Urban forests showed no significant trend (, p=0.31). However, comparing two separate p-values does not formally test whether the trajectories differ (Gelman and Stern, 2006). An interaction model on post-2012 BES chamber data (CH4 ∼ Year × LandUse; n=4639; 2012–2025) confirmed that the divergence is statistically significant: the Year × LandUse interaction was (p=0.007). A secondary analysis using monthly aggregated data (2012–2016; n=234) yielded a consistent result (, p=0.015).

Figure 2Post-2012 CH4 flux trends at urban vs. rural BES sites. Annual means are shown from the monthly-aggregated record, which extends through 2016; the Year × LandUse interaction test (p=0.007) is fit on the full chamber record (2012–2025; n=4639). Rural forests show continuing decline (p=0.001); urban forests show no significant trend (p=0.31), confirming divergent trajectories under a shared precipitation regime.
The two groups share regional precipitation, temperature, and atmospheric CO2 concentrations. Under a simple diffusion framework, shared precipitation should produce broadly similar flux trajectories. However, urban and rural soils differ in bulk density, macropore structure, and compaction history, so identical precipitation does not necessarily yield identical air-filled porosity. The divergence is therefore ambiguous with respect to diffusion: it could reflect differences in soil physical properties, or it could implicate non-climatic drivers such as deposition history, fragmentation, heat island effects, or microbial community composition. The pattern is more naturally explained by the latter, but does not by itself rule out a diffusion-mediated contribution. One possibility is that urban forests have reached a functional floor: if the high-affinity methanotrophic community has already been depleted at urban sites, minimal residual oxidation capacity would leave little room for further decline regardless of moisture conditions. This interpretation is evaluated in Sect. 4.8.
3.5 Prediction 5: Multi-predictor models across temporal scales
The linear mixed-effects model (LMM) with a random intercept for site yielded standardized coefficients of: Temperature (, ), Precipitation (β=0.103, ), and Year (β=0.081, p=0.003). The site random intercept variance (0.40) was modest relative to the residual variance (5.32), confirming that site-level clustering accounts for only a small fraction of total variability. Year remained significant after accounting for the hierarchical data structure, indicating a residual temporal trend that persists after controlling for both moisture and temperature. The diffusion hypothesis predicts that moisture should dominate and Year should become non-significant; this does not occur.
Because chamber measurements are repeated at fixed collar locations within sites, we also fit a collar-level model (random intercept for each of 64 unique Site × Plot × Chamber combinations). The collar-level model was preferred by AIC ( relative to the site-level model). Fixed-effect estimates were essentially unchanged: Year β=0.084 (p=0.002), Precipitation β=0.101 (), Temperature (). Accounting for collar-level spatial pseudoreplication slightly increased the Year coefficient rather than attenuating it. LMM residuals showed weak temporal autocorrelation (mean per-site lag-1 r=0.19; Durbin–Watson range 1.34–2.04 across sites). This level of autocorrelation may modestly inflate the Year p-value but is unlikely to alter its significance at α=0.05. A random-slopes specification (Year|Site) rendered the fixed Year effect non-significant (β=0.016, p=0.81), indicating that the temporal trend varies substantially across sites – consistent with the urban–rural divergence documented in Sect. 3.4. The precipitation coefficient was unchanged (β=0.100), confirming that moisture's weak explanatory power is insensitive to whether sites are forced to share a common temporal slope (see Sect. 4.11).
For comparison, the OLS model (CH4 ∼ Precipitation + Temperature + Year) explained 1.2 % of total flux variance (R2=0.012, F=37.82, p<0.001, n=9359). The OLS Year coefficient (β=0.192) was attenuated in the LMM (β=0.081), indicating that part of the OLS temporal trend reflected site-level differences absorbed by the time term. Precipitation (β=0.104) and Temperature () were essentially unchanged between models (Table 4).
Table 4Multi-predictor model (CH4 ∼ Precipitation + Temperature + Year) across temporal scales. All predictors standardized.

In both specifications, precipitation contributed the least explanatory power at the measurement scale.
In the humid mid-Atlantic, temperature covaries positively with precipitation (warm months are also wet). The negative coefficient is consistent with warm-wet conditions suppressing uptake through increased water-filled pore space; it does not independently support diffusion limitation because the temperature–moisture covariance cannot be separated at the measurement scale without continuous soil moisture. The VWC test (Sect. 3.1) provides the direct evaluation.
At the seasonal-site mean scale (n=625), total R2 increased to 0.031. year remained the dominant predictor (β=0.224, p=0.0002). Precipitation was marginally significant (β=0.133, p=0.037). Temperature became non-significant (, p=0.12).
At the annual-site mean scale (n=169), total R2 reached 0.108. Precipitation and Year were comparable in magnitude (β=0.249, p=0.002 vs. β=0.211, p=0.007). Temperature vanished entirely (β=0.013, p=0.87) (Fig. 3).

Figure 3Multi-scale analysis. (A) R2 across temporal aggregation scales. (B) Standardized predictor coefficients across scales. Even at the annual-site scale, precipitation does not dominate.
Aggregating away measurement noise improved total explanatory power from 1.2 % to 10.8 %, but it did not produce the pattern predicted by diffusion limitation. At the measurement and seasonal-site scales, Year was the dominant predictor and precipitation contributed the least. At the annual-site scale, precipitation emerged as the strongest individual predictor (β=0.249 vs. βyear=0.211): when high-frequency chamber noise is averaged out, interannual precipitation variability does play the leading statistical role in explaining year-to-year flux variation. However, precipitation does not eliminate the residual multi-decadal decline, which is absorbed by the Year term (p=0.007). At no scale did Year become non-significant after controlling for moisture, as the diffusion hypothesis predicts. Even under the most generous interpretation (annual site means with all chamber-level variability averaged out), precipitation and a residual temporal trend contribute comparably, and together they explain barely one-tenth of the variance.
3.6 Structural breaks at 2002 (BES) and 2011 (HBR)
PELT changepoint detection on annual median CH4 flux identified a structural break at 2002 in the BES time series and at 2011 in the HBR time series (Table 5; Fig. 4). In an expanded penalty sweep, the BES break at 2002 was present across penalty values from 0.01 to 2.0 and the HBR break at 2011 from 0.05 to 1.5 (Appendix A16); secondary BES breakpoints (2007, 2017) appeared only at lower penalties.
Table 5Pre- and post-breakpoint flux statistics.

Note: BES breakpoint precedes HBR by 9 years despite shared regional climate trends. Block-bootstrap 95 % intervals on breakpoint timing: BES [2000, 2006], HBR [2011, 2012].
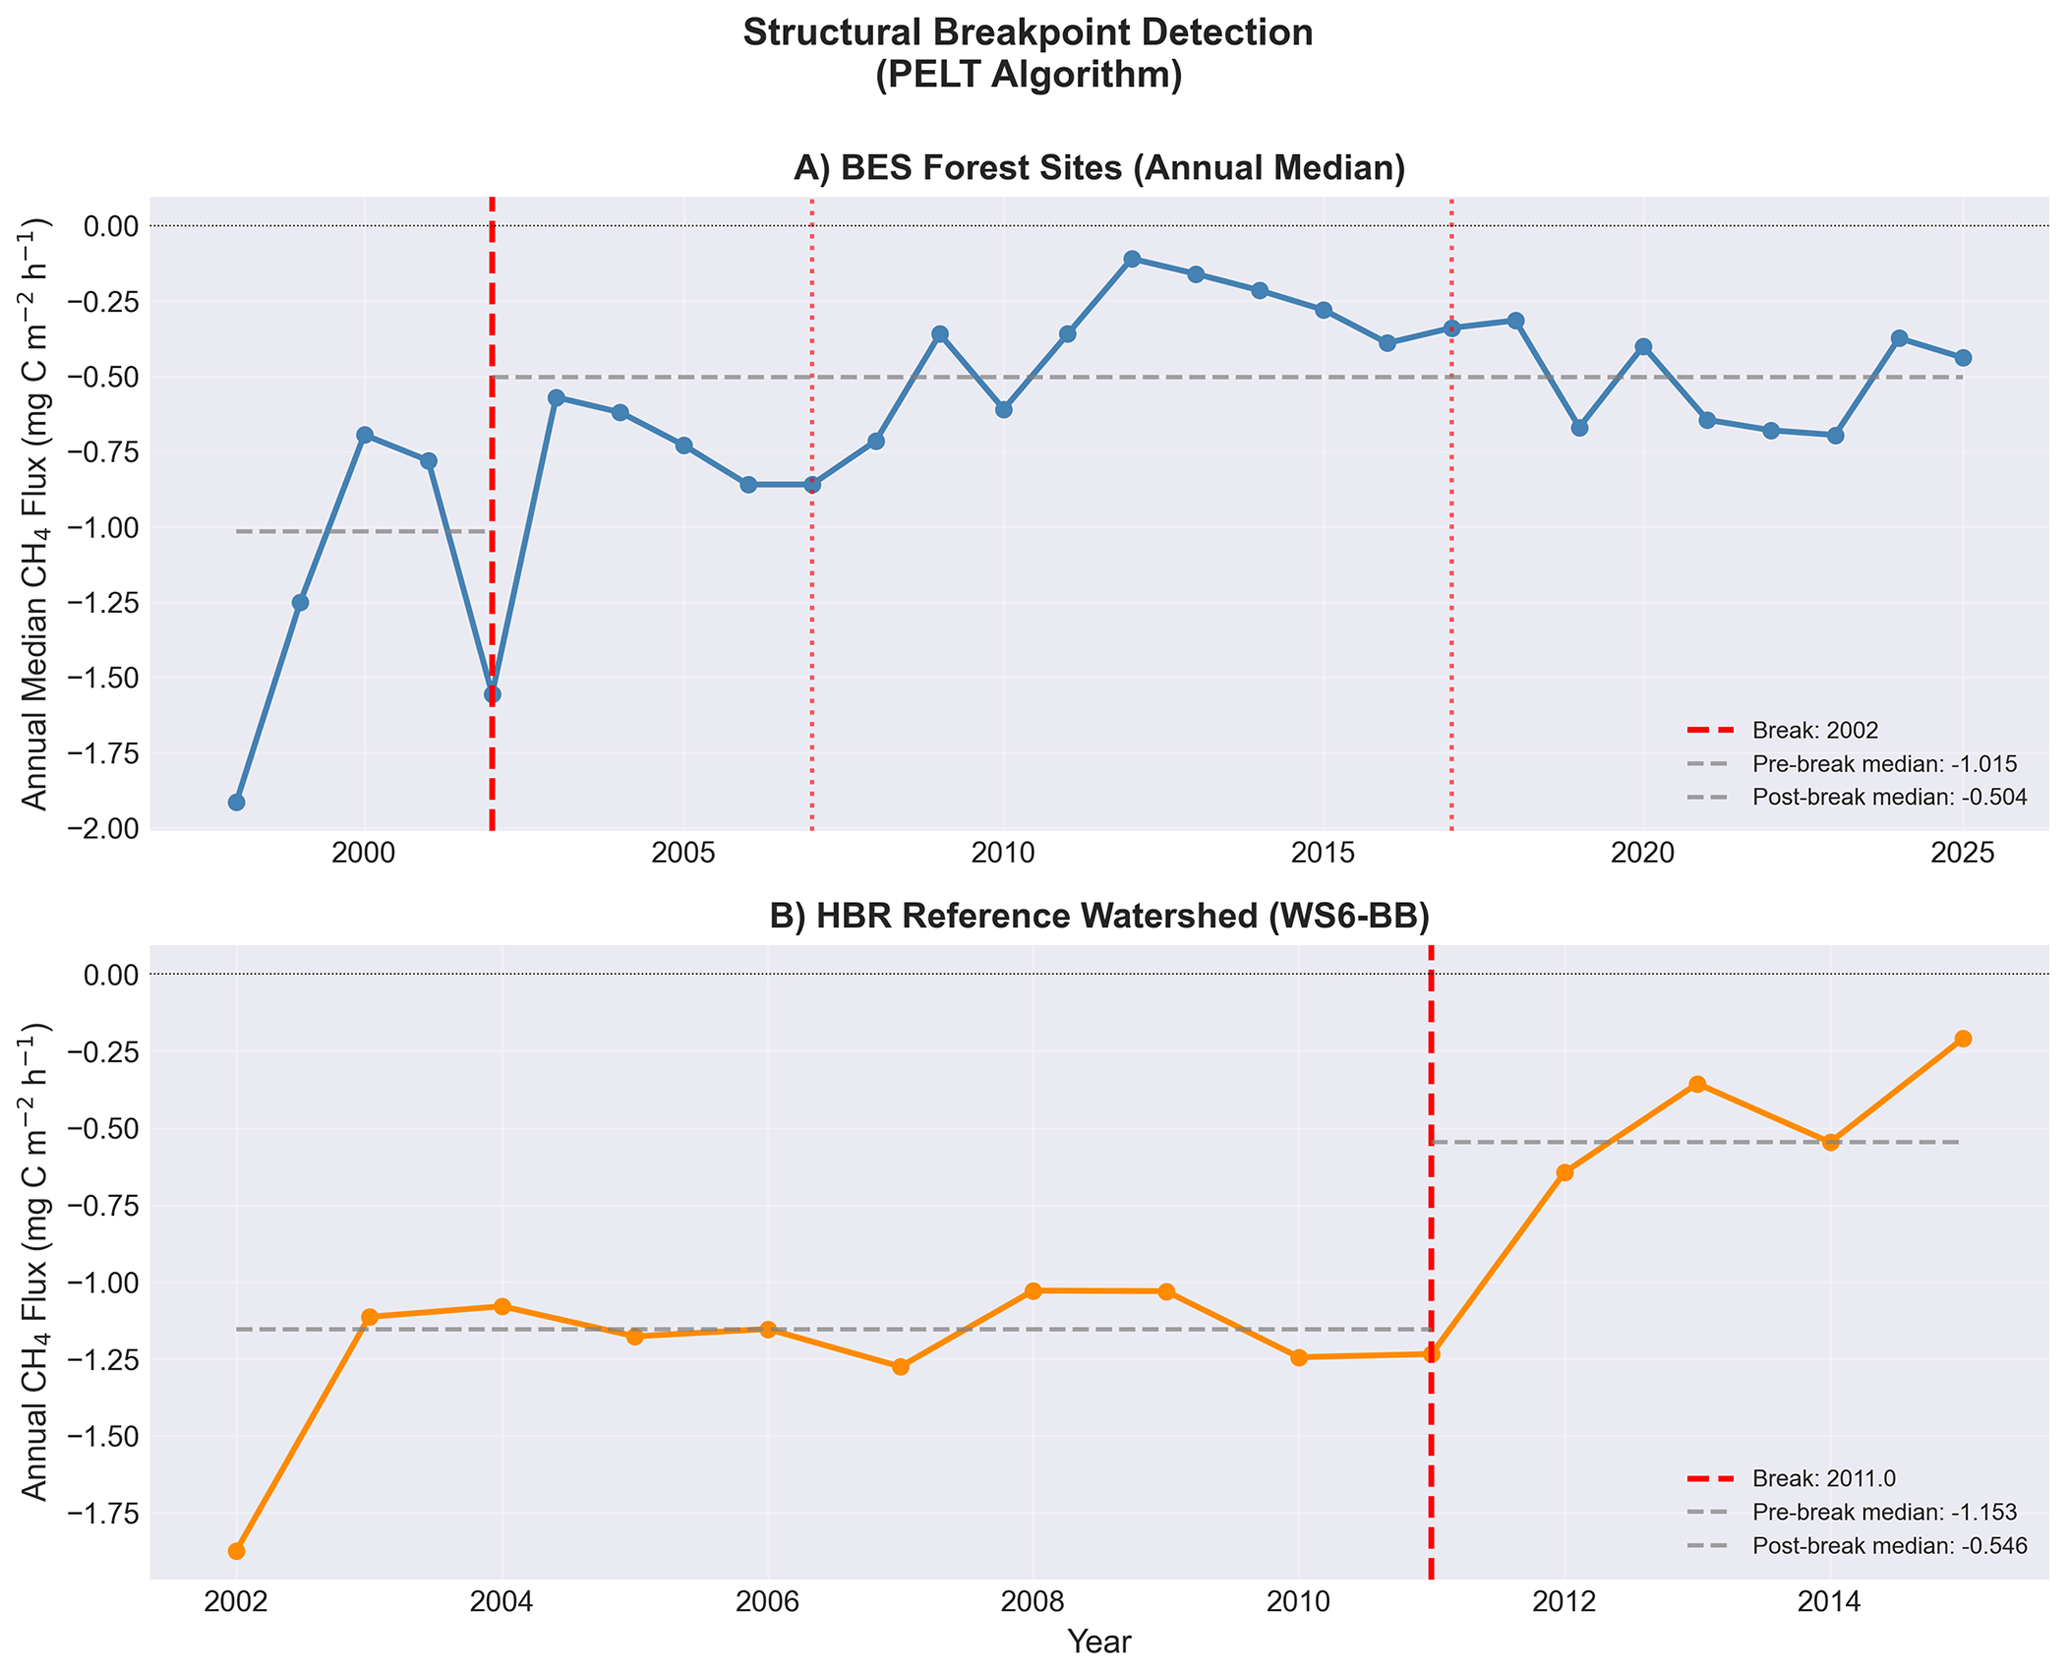
Figure 4PELT changepoint detection on annual median CH4 flux. Structural breaks detected at 2002 (BES) and 2011 (HBR).
Breakpoint robustness was evaluated in four ways (Appendix A14–A17). Block-bootstrap confidence intervals (residual moving-block, B=2000) place the BES break at 2002 with a 95 % interval of [2000, 2006] and the HBR break at 2011 with [2011, 2012]; the intervals do not overlap, so the ∼9-year asynchrony between sites is preserved. The BES break at 2002 was recovered by four of five changepoint algorithms (PELT, binary segmentation, bottom-up, and dynamic programming; a window-based scan placed it at 1999), and the HBR break at 2011 by all five. The bootstrap interval quantifies the precision of breakpoint timing conditional on a break being present; for HBR, the more pertinent limitation is the short post-break record discussed below.
The different timing at two independent LTER sites separated by 500 km argues against a common external driver such as regional precipitation change. If increased precipitation drove the decline at both sites, breakpoints should be approximately synchronous or correlated with regional precipitation shifts. The BES break in 2002 precedes the strongest precipitation trends in the mid-Atlantic. The HBR break in 2011 postdates the Ni and Groffman (2018b) dataset by only 5 years and leaves only 4 annual data points in the post-break regime (2 if 2014–2015 are truncated), making it a putative shift rather than a definitive structural break. The observed shift is large (pre-break n=10, post-break n=4; Cohen's d=3.35, p=0.0001), so the constraint is not low power to detect the shift itself but that a four-point regime cannot have its level or stability characterized, and only large shifts (d≥1.8) are detectable at all (Appendix A17). A sensitivity test dropping the final two years (2014–2015) and re-running PELT on the truncated 2002–2013 record yielded an identical breakpoint across all penalty values tested (0.05–1.0), but the post-break segment in that case consists of just two data points, which is insufficient to establish a distinct statistical regime. We therefore characterize the 2011 HBR break as an emerging shift that requires confirmation through extension of the HBR record. The asynchrony is more consistent with site-specific biogeochemical trajectories than with a shared climatic forcing.
3.7 Deposition trends align with flux decline
SO4 wet deposition at Hubbard Brook peaked at 35.3 around 1981 and declined to less than 1.0 by 2023, reflecting the cumulative effects of the Clean Air Act and its 1990 Amendments. Inorganic nitrogen () deposition at the Maryland NADP station ranged from 1.2 to 10.5 over 1999–2023, with a declining trend (Fig. 5).
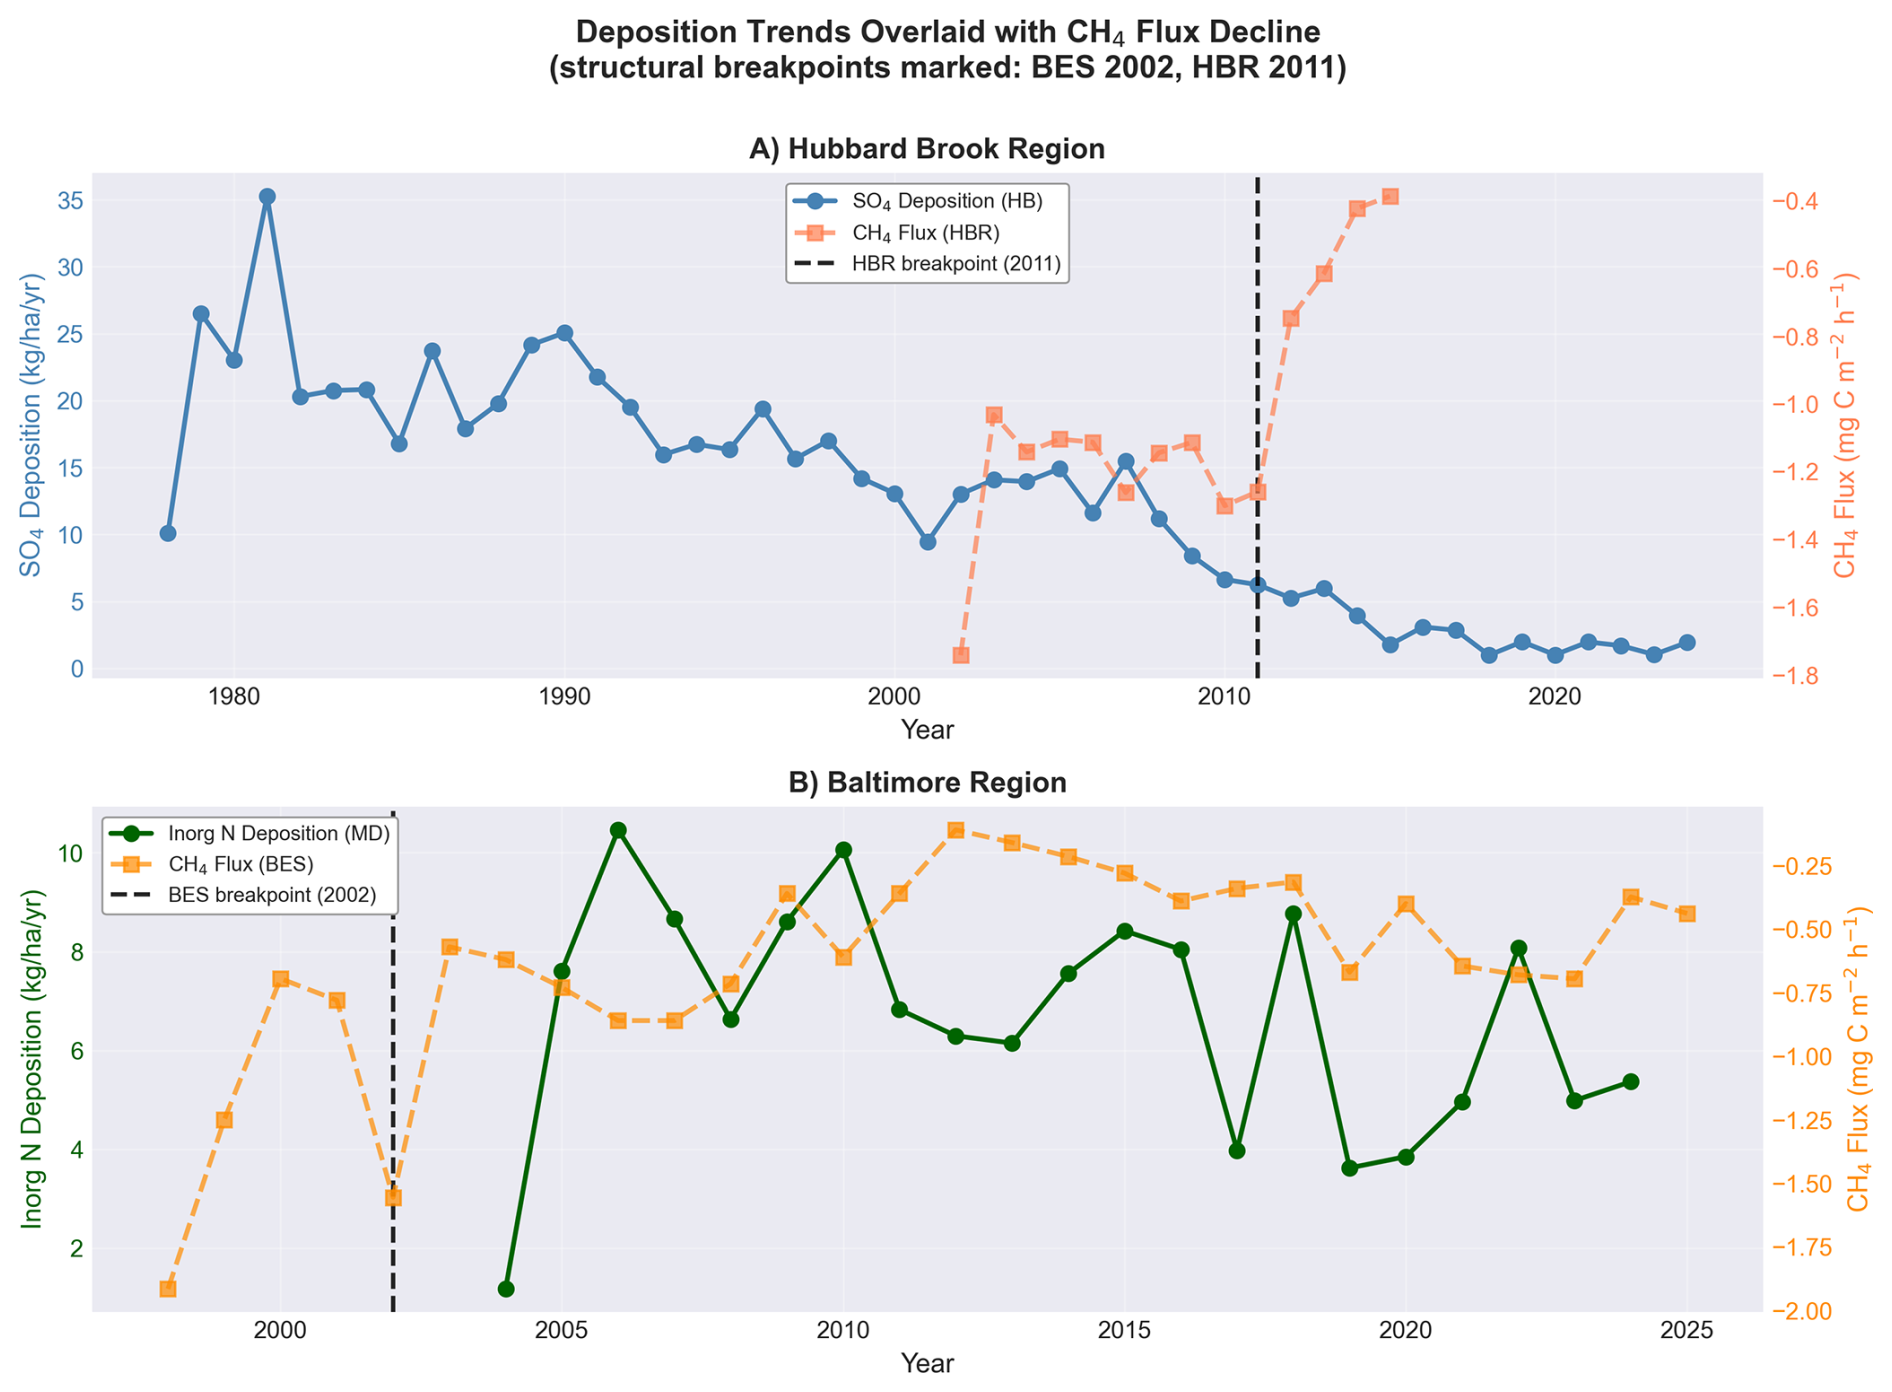
Figure 5Atmospheric wet deposition trends overlaid with CH4 flux time series. SO4 deposition at Hubbard Brook (1978–2023) and inorganic N deposition at Beltsville, MD (1999–2023). Vertical dashed lines mark the PELT structural breakpoints (panel A, HBR 2011; panel B, BES 2002), allowing the multi-year lag between peak deposition loading and the sink breakpoints to be read directly.
The temporal pattern of deposition decline overlaps with the CH4 flux breakpoints, though the relationship is indirect. The BES break at 2002 and the HBR break at 2011 both occur while deposition is declining, not increasing. If deposition toxicity were the proximate cause, the break should coincide with peak loading, not with recovery. Two considerations may reconcile this apparent paradox. First, cumulative chronic exposure over 50+ years may cross an irreversibility threshold with a substantial lag, consistent with established nitrogen saturation trajectories in northeastern forests (Aber et al., 1998). Biological collapse due to chronic N-saturation is threshold-dependent and non-linear, which explains why a changepoint algorithm detects a sudden structural break rather than a smooth, gradual decline: the structural break reflects the manifestation of accumulated damage to slow-growing methanotrophic populations, not the moment of peak input. Recovery timescales for high-affinity atmospheric methanotrophs are measured in decades (Lim et al., 2024), so community collapse could become apparent long after peak loading has passed. Second, the decline in acid deposition itself altered soil chemical equilibria (rising pH, shifting base cation ratios, changing aluminum speciation) in ways that may have destabilized microbial communities adapted to decades of acidified conditions. This “recovery disruption” is well documented for other soil processes at Hubbard Brook, where base cation pools continued to decline for decades after atmospheric inputs improved (Likens et al., 1996).
Lysimeter concentrations, analyzed as annual site means (2000–2023) to avoid within-site-year pseudoreplication, showed heterogeneous trends across the three forested BES sites: Hillsdale (urban) declined significantly ( , p=0.005, R2=0.31), consistent with declining atmospheric N inputs; Leakin Park (urban) and Oregon Ridge (rural) showed no significant trend (p=0.17 and 0.24, respectively). The lack of a coherent network-wide trajectory complicates a simple N-saturation narrative and is consistent with site-specific biogeochemical processing rather than a uniform deposition signal.
This alignment does not establish causation. Deposition, precipitation, temperature, CO2, and land use have all changed over the study period. However, the deposition timeline is more consistent with the observed flux patterns than the precipitation timeline, and the urban–rural divergence (Sect. 3.4) argues against atmospheric variables that are spatially uniform across the BES network.
3.8 Soil properties
Forest soils at the four characterized BES sites (0–10 cm depth) showed site-level variation in C:N ratio, microbial biomass carbon, net nitrogen mineralization, and net nitrification. This variation documents the biogeochemical heterogeneity underlying the flux patterns and provides context for interpreting site-specific responses. The soil characterization is descriptive; we do not attempt to correlate soil properties with flux trends given the limited spatial replication.
4.1 Precipitation-driven diffusion limitation is insufficient at these sites
Five predictions derived from the diffusion limitation framework were tested against 27 years of flux data at BES and 13 years at HBR. Four were not supported: precipitation and direct soil moisture each explained less than 1 % of flux variance, no seasonal structure matched diffusion predictions, and urban and rural sites diverged in ways not easily reconciled with shared climate forcing alone (though differences in soil physical properties may contribute). Year dominated the multi-predictor model after controlling for moisture at the measurement and seasonal scales, and remained a significant predictor even at the annual scale where precipitation contributed comparably. The fifth test, the calcium amendment, yielded a null result consistent with the diffusion hypothesis but also with biological alternatives, and constrains the recovery timescale for the methanotrophic community.
Each test alone would be inconclusive. Low R2 values are typical for individual-measurement regressions in chamber-based trace gas studies (Parkin, 1987), and the calcium null result is consistent with multiple hypotheses. A quadratic moisture–flux model, which accounts for the theoretically unimodal relationship between soil moisture and gas diffusion, did not meaningfully improve explanatory power (Sect. 4.11). However, stratifying at the 2002 changepoint revealed that the pre-breakpoint precipitation–flux relationship was 7× stronger, with a quadratic model explaining 1.8 % of pre-breakpoint variance (Sect. 3.1). This pattern is consistent with diffusion playing a minor role in flux variability while the methanotrophic community was intact, and that role becoming undetectable after biological degradation reduced the community's capacity to respond to moisture fluctuations.
The evidential weight comes from the convergence: five independent tests, using different subsets of the data, different statistical approaches, and different temporal scales, collectively suggest that precipitation-driven diffusion limitation does not adequately explain the multi-decadal decline at these sites. The urban–rural divergence may illustrate this: urban sites could have stabilized at what we term a “biological floor” – a hypothesized state in which the high-affinity USCα community has been substantially depleted, leaving mostly low-capacity methanotrophs that maintain minimal baseline oxidation. If the high-affinity oxidizers were largely gone, the sink could decline little further regardless of moisture conditions. We emphasize that this is an interpretation consistent with the observed pattern, not a measured outcome; no microbial abundance data are presented here. Rural sites, where USCα may persist at reduced abundance, continue to lose capacity. This asymmetry is difficult to account for under the diffusion hypothesis but is consistent with a biological degradation model (Sect. 4.8).
4.2 Relationship to Ni and Groffman (2018)
Ni and Groffman (2018b) documented the decline at BES and HBR and proposed increased precipitation as the mechanism. Their analysis established the problem and remains the essential reference for the magnitude and timing of the CH4 sink collapse.
This study differs from theirs in five respects. First, the BES record is extended by 9 years (2016–2025), adding substantial information about the post-decline trajectory. Second, direct in-situ VWC data are included, providing the mechanistically relevant variable that Ni and Groffman proxied with precipitation. Third, five independent hypothesis tests are applied rather than a correlation between precipitation trends and flux trends. Fourth, formal changepoint detection with documented penalty calibration is used to identify structural breaks. Fifth, the Hubbard Brook calcium amendment is analyzed as a natural manipulation experiment.
The datasets overlap substantially. The analytical approaches differ. Where Ni and Groffman asked whether precipitation trends correlate with flux trends (they do, weakly), we ask whether diffusion limitation can account for the flux patterns when tested directly. At these sites, over these timescales, it does not.
4.3 What does explain the decline?
The five tests do not identify an alternative mechanism. They constrain one. Whatever is driving the decline operates outside the moisture–temperature–diffusion framework, persists after controlling for climatic variables, differs between urban and rural settings, and is not reversed by calcium amendment over 13 years.
The most parsimonious class of explanations is biological: a long-term degradation of the methanotrophic community itself. As noted in the Introduction, the high-affinity USCα methanotrophs responsible for atmospheric CH4 oxidation are extremely slow-growing, with recovery timescales of decades (Lim et al., 2024). They are functionally irreplaceable on management-relevant timescales.
4.4 Structural diffusion limitation: the earthworm hypothesis
A parallel driver blurs the boundary between “biological” and “physical” mechanisms. Northeastern forests, including parts of the BES and HBR networks, historically lacked native earthworms, and are now subject to invasion by European lumbricids and Asian jumping worms (Amynthas spp.) (Bohlen et al., 2004; Chang et al., 2021). Invasive earthworms consume the O-horizon and mix organic matter into the mineral soil, altering soil structure and bulk density (Bohlen et al., 2004; Resner et al., 2015). Earthworm effects on CH4 oxidation are not uniformly negative: deep-burrowing (anecic) earthworms can increase macroporosity and thereby enhance gas-phase diffusion and oxidation – the mechanism by which biologically active, earthworm-mixed mull soils sustain higher oxidation rates than moder or mor humus types (Brumme and Borken, 1999). The epigeic European lumbricids and Amynthas spp. invading these northeastern forests, however, act primarily by consuming the O-horizon and compacting the near-surface mineral soil where high-affinity methanotrophs reside; the sign of the structural effect therefore depends on the functional group involved, and we invoke only this O-horizon-loss pathway. Beyond this physical compaction, the complete removal of the O-horizon eliminates a critical thermal and hydrologic buffer for the mineral soil where methanotrophs reside, exposing the microbial community to amplified temperature and moisture fluctuations that may further degrade oxidation capacity. Because gas-phase diffusivity (Dp) is a function of air-filled porosity, earthworm invasion creates a structural diffusion limitation (physically reducing Dp through biotic soil compaction) distinct from the precipitation-driven (climatic) diffusion limitation posited by Ni and Groffman (2018b). Our analysis addresses the climatic mechanism (increased rainfall filling pore space) and finds it insufficient, but does not address structural changes to the soil matrix itself.
Earthworm invasion also follows an urban-to-rural gradient. Yesilonis et al. (2024) documented shifts in earthworm community composition across the BES urban–rural gradient over two decades, with invasive jumping worms (Amynthas spp.) now established at multiple Baltimore sites. This trajectory mirrors the urban–rural divergence in CH4 flux (Sect. 3.4): urban sites, where the O-horizon has long been degraded, have stabilized at a biological floor, while rural sites continue to decline as invasion progresses. Consistent with ongoing understory change, total seedling cover in the BES permanent plots fell at all three censused forest sites between the 2003 and 2015 surveys (by roughly 50 %–90 %; knb-lter-bes.3300), though this sparse three-site census is offered only as coarse context and cannot be linked directly to the flux trajectory. We do not attempt to partition the relative contributions of nitrogen toxicity and earthworm habitat destruction with the data available here; both mechanisms are consistent with the observed patterns and may act synergistically.
4.5 Nitrogen as the primary mechanistic pathway
The literature on nitrogen inhibition of methanotrophy is extensive and mechanistically well characterized. inhibits methane monooxygenase, the enzyme responsible for the initial oxidation of CH4; in forest soils this suppression arises not from simple substrate competition but substantially from the nitrite produced during ammonium oxidation (Schnell and King, 1994; Gulledge and Schimel, 1998). Experimental nitrogen additions reduce forest soil CH4 uptake by 33 %–86 % across multiple sites and N forms (Steudler et al., 1989; Bodelier and Laanbroek, 2004; Liu and Greaver, 2009; Gulledge et al., 2004). Long-term fertilization alters the kinetics of atmospheric-concentration oxidation specifically (Gulledge et al., 2004).
Whether ambient deposition levels at BES and HBR are sufficient to cause the observed decline is an open question. Experimental additions in the literature typically exceed ambient deposition by an order of magnitude. Xia et al. (2020) report a suppression threshold near 27 in temperate forests, and Cen et al. (2024) show the response is nitrogen-status dependent. BES inorganic N wet deposition peaked at approximately 10 , below this threshold. However, NADP measures only wet deposition and substantially underestimates total N inputs in urban settings. In the Baltimore metropolitan area, bulk collectors capture only about 47 % of the nitrogen measured in throughfall, indicating that gaseous and dry-deposited nitrogen intercepted by the canopy accounts for more than half of total loading (Bettez and Groffman, 2013). Even so, measured throughfall N along the Baltimore urban–rural gradient reached only ∼15 at the most urban sites – roughly 50 % above forested sites, but still below the ∼27 experimental suppression threshold.
Two additional considerations mitigate the remaining gap. First, BES and HBR have received chronic, continuous deposition for over 50 years; the experimental studies measure responses to acute additions over years to decades. Cumulative chronic exposure may produce effects at lower annual doses than short-term experiments suggest. Second, the relevant comparison may not be current deposition but peak historical loading: SO4 wet deposition at Hubbard Brook peaked near 35 in the late 1970s (NADP NTN station NH02; Sect. 3.8), and the legacy effects of that loading on soil chemistry persist decades after atmospheric concentrations declined (Likens et al., 1996, 2002).
4.6 The sulfate complication
The role of sulfate in upland methanotrophy is unresolved. Bradford et al. (2001) found that chronic H2SO4 deposition increased CH4 oxidation rates in a temperate forest soil, the opposite of what a simple sulfate-toxicity narrative would predict. Su et al. (2025) confirm that the upland sulfate–CH4 literature is nascent. The well-developed wetland literature (Gauci et al., 2004; Shen et al., 2025) is not directly transferable to aerated soils where methanotrophy rather than methanogenesis dominates.
We do not claim sulfate deposition as a mechanism for the CH4 decline, but the Bradford et al. finding raises a provocative alternative: if chronic acid deposition stimulated methanotrophy over the mid-to-late 20th century, then the declines documented at BES and HBR may not represent biological degradation at all, but rather a return to a pre-industrial baseline. Under this “return-to-baseline” hypothesis, the high CH4 uptake rates observed in the 1990s were the anomaly – an artifact of decades of acid-stimulated methanotrophic activity – and the post-2002 decline reflects normalization as deposition falls. This interpretation is parsimonious: it requires no irreversible community damage, no nitrogen toxicity threshold, and no earthworm invasion. It predicts that uptake rates should eventually stabilize at a level consistent with pre-industrial soil chemistry, and that sites with the longest deposition histories should show the earliest and largest declines – a pattern broadly consistent with the BES (urban, high cumulative loading, early break) vs. HBR (montane, lower cumulative N, later break) comparison.
We cannot distinguish the return-to-baseline hypothesis from the biological degradation hypothesis with the data available here. The key discriminating test would be molecular: if the methanotrophic community is intact but operating at reduced rates because the acid-driven subsidy has ended, USCα abundance should remain relatively high. If biological degradation has occurred, USCα should be depleted. We note this alternative explicitly because it reframes the narrative: the “decline” may be recovery, viewed from the wrong baseline.
More broadly, deposition trends (including sulfate) show better temporal alignment with flux breakpoints than precipitation does. The mechanistic link, if any, may operate through soil acidification and its cascading effects on base cation availability and microbial community structure (see Brumme and Borken, 1999, who found that base saturation (r2=0.88) and soil pH (r2=0.77) were the strongest univariate correlates of among-site variation in CH4 oxidation across European forests) rather than through direct sulfate toxicity. Resolving this requires experimental work beyond the scope of a flux-based analysis.
4.7 Why BES and HBR differ
The two sites broke at different times (2002 vs. 2011), declined at different rates, and operate in different forest types (mixed deciduous urban-rural gradient vs. northern hardwood montane). This heterogeneity is expected under a biogeochemical mechanism and unexpected under a shared climatic driver.
BES soils have received decades of elevated urban nitrogen deposition superimposed on regional acid deposition. HBR soils experienced historically intense sulfate loading (peak >35 ) followed by rapid decline after the 1990 Amendments. The calcium amendment at WS1 partially reversed acidification effects at HBR but did not restore CH4 uptake, consistent with irreversible methanotroph community damage. Borken et al. (2002) documented an analogous non-recovery of CH4 uptake at the Solling spruce forest in Germany after more than 10 years of reduced nitrogen and acid inputs.
4.8 Recovery is not guaranteed
The post-2012 divergence at BES, with rural forests continuing to decline while urban forests stabilize, suggests that recovery trajectories differ by land use context. Lim et al. (2024) document that high-affinity atmospheric methanotrophs require decades to recover from persistent disturbance. If USCα populations have been depleted by chronic deposition, functional recovery of the forest CH4 sink may lag atmospheric improvements by a generation or more, as has been observed for soil base cation pools at Hubbard Brook (Likens et al., 1996).
Urban forests face additional constraints. Edge effects, soil compaction, impervious surface proximity, and heat island effects create conditions that may preclude recolonization by high-affinity methanotrophs even after deposition declines. One interpretation of the urban stabilization is that these sites may have reached a biological floor: the high-affinity USCα community could have been substantially depleted, leaving mostly low-affinity, low-capacity methanotrophs that maintain a minimal baseline of CH4 oxidation. This remains a hypothesis consistent with the data rather than a demonstrated mechanism. Under this interpretation, urban flux has stabilized not because conditions have improved, but because there is little remaining biological capacity to lose. Rural sites, where USCα populations may persist at reduced abundance, continue to decline as the degradation progresses. This framing generates a testable prediction: urban soils should be depleted in USCα relative to rural soils at the same network, detectable through pmoA gene surveys (see Sect. 4.11).
4.9 Broader context
Brumme and Borken (1999) demonstrated that among-site variation in CH4 oxidation across temperate European forests correlated most strongly with base saturation (r2=0.88) and soil pH (r2=0.77) in separate univariate regressions, with total nitrogen, organic-horizon mass, and bulk density more weakly correlated. Borken et al. (2002) showed that atmospheric input reductions did not restore CH4 uptake at Solling. Täumer et al. (2021) identified soil pH as a key driver of USCα abundance and methanotrophic activity. These findings, from independent research groups working on different continents, converge on a common theme: the long-term capacity of forest soils to oxidize atmospheric CH4 may be governed primarily by soil biogeochemistry rather than by gas-phase diffusion alone.
The diffusion mechanism likely operates at short timescales (event to seasonal) and controls the high-frequency variability in CH4 flux. Wet days produce less uptake than dry days. This is well established. What our data suggest is that diffusion does not control the multi-decadal trend. The patterns are more consistent with a structural shift in the biological capacity of the soil to consume methane than with a dry-to-wet transition.
4.10 Limitations
This study has six principal limitations. First, it is based on two LTER networks in the northeastern US. The conclusions may not generalize to tropical forests, boreal systems, or regions with different deposition histories. Second, we present no direct microbial data. The biological interpretation is inferential, based on the insufficiency of the physical alternative and consistency with the published mechanistic literature. Third, the analysis is observational. Despite the calcium amendment providing a quasi-experimental manipulation, the core flux analyses are correlational. Fourth, precipitation data for urban and rural BES sites are drawn from two PRISM grid cells approximately 20 km apart; any systematic difference between these stations could bias the urban–rural moisture comparison. However, by-site regressions show R2<0.07 at every individual site, indicating that station assignment does not mask a real moisture signal within either land-use class. Fifth, chamber-based measurements sample a small fraction of the soil surface and are subject to artifacts (pressure perturbation, collar effects) that eddy covariance methods avoid, though at the cost of sensitivity to the small fluxes involved in atmospheric CH4 oxidation. Sixth, the precipitation test uses monthly totals matched to instantaneous chamber measurements; a finer-resolution meteorological proxy such as trailing 7- or 14-d cumulative precipitation might better capture antecedent moisture conditions. The direct VWC test substantially mitigates this concern by measuring the mechanistically relevant variable at the time of flux measurement, but a trailing precipitation index could further refine the climatological test for the pre-2011 period when VWC data are unavailable.
4.11 Robustness checks
Seventeen additional analyses were conducted to address methodological concerns (Appendix A1–A17). In brief: (1) removing the ±3 SD outlier filter weakened rather than strengthened the precipitation signal; (2) a quadratic moisture–flux model did not rescue the diffusion signal (R2 improvement <0.05 percentage points); (3) the pre-breakpoint precipitation–flux relationship was 7× stronger than the full-record value but a permutation test could not rule out a selection artifact (p=0.057); (4–5) collar-level random effects () and AR(1) autocorrelation diagnostics (mean lag-1 r=0.19) confirmed that the Year trend is robust to spatial pseudoreplication and temporal non-independence; (6) a formal interaction test confirmed urban–rural divergence (p=0.007); (7) per-site regressions showed R2<0.07 at every individual site, ruling out PRISM station assignment artifacts; (8) the breakpoint permutation test is detailed in the Appendix; (9) lysimeter trends were heterogeneous across sites (Sect. 3.7); (10–11) the LMM comparison and HBR changepoint sensitivity test (breakpoint stable after dropping 2014–2015) are detailed in the Appendix; (12) a Precipitation × Post2002 interaction model tested whether the moisture–flux coupling structurally changed at the 2002 breakpoint without subsetting the data; the interaction was not significant (p=0.24), though the Post2002 level shift independently confirmed the PELT breakpoint () and Year remained significant after accounting for both (p=0.0004); (13) an LMM with random slopes for Year by site (Year|Site) was fit to address Referee concern that urban and rural sites have fundamentally different temporal trajectories. The fixed Year effect became non-significant (β=0.016, p=0.81) as site-specific slopes absorbed the heterogeneous trends documented in Prediction 4. Critically, the precipitation coefficient was essentially unchanged (β=0.100, ), confirming that the inadequacy of precipitation as a predictor is robust to model specification. The random slopes model confirms that the decline is real but site-specific, consistent with local biogeochemical drivers rather than shared climatic forcing. Four further checks (Appendix A14–A17) address breakpoint robustness: (14) block-bootstrap 95 % confidence intervals on breakpoint timing (BES [2000, 2006]; HBR [2011, 2012]); (15) a cross-method comparison recovering the BES break at 2002 under four of five algorithms and the HBR break at 2011 under all five; (16) an expanded penalty sweep (BES 2002 stable across 0.01–2.0; HBR 2011 across 0.05–1.5); and (17) a power analysis showing that the short post-2011 HBR record permits detection only of large shifts (d≥1.8). All analyses are implemented in supplemental_robustness.py and breakpoint_robustness.py in the code repository.
4.12 Testable predictions
If the decline reflects degradation of the methanotrophic community, four predictions follow:
-
Archived soils from declining BES and HBR sites should show reduced abundance of USCα (high-affinity atmospheric methanotrophs) relative to stable reference sites, detectable through pmoA gene surveys and quantitative PCR. Transcriptomic (RNA-based) analysis would be more definitive than DNA surveys alone, since relic DNA from dead or dormant cells can persist in soil for years, inflating apparent abundance.
-
Methanotrophic community composition should differ systematically between urban sites (where the decline has stabilized) and rural sites (where it continues), with urban communities depleted in high-affinity oxidizers.
-
Sites with documented non-recovery of CH4 uptake (BES post-2002, HBR post-2011, Solling per Borken et al., 2002) should show convergent community signatures distinct from sites where uptake remains intact.
-
O-horizon thickness and invasive earthworm biomass should correlate with the magnitude of sink decline across BES sites, with urban sites showing thinner O-horizons, higher earthworm density, and lower CH4 uptake capacity than rural sites at comparable soil moisture.
These predictions are specific, falsifiable, and addressable with existing molecular ecology methods. We encourage the broader LTER network to make archived soils available, which would allow retrospective community analysis at BES, HBR, and comparable sites spanning the period of decline.
Five independent tests of the precipitation-driven diffusion limitation hypothesis at two long-term ecological research networks, spanning 27 and 13 years of continuous measurement, do not support it as the primary driver of the multi-decadal decline in forest CH4 uptake. Neither precipitation nor direct soil moisture explains more than 1 % of flux variance. A formally significant urban–rural divergence (p=0.007, interaction test) and a residual temporal trend robust to collar-level pseudoreplication and temporal autocorrelation diagnostics are difficult to reconcile with a purely climatic explanation. The decline documented by Ni and Groffman (2018b) is confirmed and extended with 9 additional years of data, but its attribution to increased precipitation is not supported by the extended record, by direct soil moisture measurements, or by the pattern of asynchronous breakpoints across sites. The timing of those breakpoints, occurring well after peak deposition, is consistent with threshold-dependent nitrogen saturation trajectories (Aber et al., 1998) and the long recovery timescales of high-affinity methanotrophs (Lim et al., 2024). The convergence of these results points toward biological control, consistent with chronic degradation of the methanotrophic community through nitrogen-mediated inhibition, potentially compounded by structural diffusion limitation from invasive earthworm compaction of the soil matrix. Precipitation-driven (climatic) diffusion likely remains an important control on short-timescale flux variability – the pre-breakpoint moisture–flux coupling and its subsequent disappearance support this view – but it does not appear to govern the long-term trajectory of the sink. We also note an alternative interpretation that the present data cannot exclude: if chronic acid deposition stimulated methanotrophy through the late twentieth century, part of the apparent decline may reflect a return to a pre-industrial baseline rather than net biological degradation (Sect. 4.6). Confirming the biological mechanism (and distinguishing it from this return-to-baseline alternative) requires molecular evidence from archived soils, and we have outlined four specific predictions to guide that work. Whether that program can be carried out will depend on the broader long-term ecological research community opening its soil archives for molecular analysis.
Seventeen additional analyses were conducted to probe methodological concerns and test the robustness of primary results. Analyses Appendix A1–A13 are implemented in supplemental_robustness.py and the breakpoint robustness checks Appendix A14–A17 in breakpoint_robustness.py, both in the code repository. Results are summarized in SUPPLEMENTAL_RESULTS.txt and BREAKPOINT_ROBUSTNESS_RESULTS.txt.
A1 Linear mixed-effects model
The primary multi-predictor model (CH4 ∼ Precipitation + Temperature + Year) was fit as a LMM with a random intercept for site, using REML estimation (n=9359). Site variance (random intercept) was 0.40; residual variance was 5.32. Fixed effects (OLS → LMM): Precipitation ; Temperature ; Year . The Year coefficient was attenuated in the LMM (part of the OLS temporal trend reflected between-site differences), but remained significant (p=0.003).
A2 Outlier sensitivity
The precipitation–flux regression and multi-predictor model were re-run without the ±3 SD per-site-year filter, retaining 126 extreme measurements. Rather than strengthening the diffusion signal, including extreme values weakened it: precipitation R2 dropped from 0.0008 to 0.0003 (p=0.085, non-significant). Multi-predictor R2 dropped from 0.012 to 0.004. year remained the dominant predictor (β=0.215, ).
A3 Non-linear moisture–flux model
A quadratic model (Flux ∼ Precipitation + Precipitation2) improved R2 from 0.077 % to 0.12 % – a 0.04 percentage point gain. The quadratic term was borderline significant (p=0.044), but total variance explained remained negligible. For direct VWC measurements (n=2415, the full paired dataset of Sect. 3.1), the quadratic term was non-significant (p=0.72) and the quadratic R2 (0.56 %) did not improve on the linear model (0.55 %).
A4 Pre-breakpoint precipitation regression
Pre-2002 BES data: R2=0.57 % (n=1250, p=0.008), roughly 7× the full-record value. Quadratic R2=1.8 % (). Post-2002: R2=0.01 % (p=0.31). Full details in main text Sect. 3.1.
A5 Urban–rural interaction test
An interaction model (CH4 ∼ Year × LandUse) on post-2012 BES chamber data (n=4639; 2012–2025) yielded a significant Year × LandUse interaction (, p=0.007). Secondary analysis on HBR monthly data (2012–2016; n=234): , p=0.015. Both confirm statistically divergent trajectories.
A6 Nested random effects
A collar-level LMM (64 unique Site × Plot × Chamber groups) improved model fit () and slightly increased the Year coefficient (β=0.084, p=0.002) relative to the site-level model (β=0.081, p=0.003). Collar-level pseudoreplication does not attenuate the temporal trend.
A7 Temporal autocorrelation
LMM residuals showed weak per-site lag-1 autocorrelation (mean r=0.19; Durbin–Watson range 1.34–2.04). This may modestly inflate the Year p-value but is unlikely to alter significance at α=0.05.
A8 Per-site precipitation R2
Individual site regressions: no site exceeded R2=0.07 (max: Cub Hill, R2=0.068). Urban sites mean R2=0.004; rural sites mean R2=0.020. PRISM station assignment does not mask a moisture signal within either land-use class.
A9 Breakpoint permutation test
A permutation test (n=1000, shuffling year labels) yielded p=0.057 for the observed ΔR2=0.0056 at the 2002 breakpoint (95th percentile of null: 0.0061). The pre/post coupling difference is suggestive but does not reach formal significance.
A10 Lysimeter trends
Lysimeter concentrations, analyzed as annual site means (2000–2023) to avoid within-site-year pseudoreplication, at three forested BES sites: Hillsdale (urban) declined significantly ( , p=0.005, R2=0.31); Leakin Park (urban, p=0.17) and Oregon Ridge (rural, p=0.24) showed no significant trend.
A11 HBR changepoint sensitivity
Using the same annual WS6-BB median series and l2 cost as the main analysis (Fig. 4), dropping 2014–2015 and re-running PELT on the truncated 2002–2013 record returned the 2011 breakpoint in both the full and truncated series at penalties 0.05–0.5; at penalty 1.0 the 12-point truncated series returns no break. No secondary breakpoint appears under the l2 cost. The 2011 break is therefore not an artifact of the two most extreme post-break observations, but with only 2–4 post-break data points this putative shift requires confirmation through extension of the HBR record (see Sect. 3.6 and Appendix A17).
A12 Precipitation × Post-2002 interaction model
To address the circularity of subsetting the data at the PELT-identified 2002 breakpoint (Appendix A4, A9), an interaction model was fit on the full 1998–2025 BES record: CH4 ∼ Precipitation + Post2002 + Precipitation × Post2002 (n=9359). The Post2002 level shift was highly significant (, ), independently confirming the PELT breakpoint. However, the interaction term was not significant (, p=0.24), indicating that the change in moisture–flux coupling strength at 2002 does not reach statistical significance when tested without data subsetting. Adding Year as a covariate did not alter this result (interaction p=0.27); Year remained significant (, p=0.0004), confirming that the secular decline persists after accounting for both the level shift and precipitation. The non-significant interaction is consistent with the permutation test in Appendix A9 (p=0.057): the pre/post coupling difference is directionally consistent with a weakening of moisture–flux coupling but does not clear conventional significance thresholds.
A13 Random slopes LMM
The primary LMM uses a random intercept for site but a fixed (global) slope for Year. Because Prediction 4 demonstrates that urban and rural sites have significantly different post-2012 trajectories, a random-slopes specification (Year|Site) was fit to test whether the fixed Year effect is an artifact of forcing heterogeneous sites to share a common temporal slope. In the random-slopes model, the fixed Year effect became non-significant (β=0.016, p=0.81), as site-specific slopes absorbed the divergent trends. The Year slope variance across sites was 0.026, and the intercept–slope covariance was negative (−0.090), indicating that sites with higher baseline uptake tended to show steeper declines. Critically, the precipitation coefficient was essentially unchanged (β=0.100, ), confirming that the inadequacy of precipitation as a predictor is robust to whether sites are forced to share a common temporal trajectory. The random-slopes model confirms that the decline is real but proceeds at site-specific rates, consistent with local biogeochemical drivers rather than shared climatic forcing.
A14 Bootstrap confidence intervals on breakpoint timing
A residual moving-block bootstrap around the fitted piecewise-constant model (B=2000; seeded) was used to place a confidence interval on the breakpoint year for each site, using the same annual-median series and l2 cost as the main analysis. The BES break has a 95 % interval of [2000, 2006] (mode 2002, in 80 % of resamples) and the HBR break [2011, 2012] (mode 2011, 92 %). The intervals do not overlap, so the ∼9-year asynchrony between sites is preserved. This bootstrap quantifies the precision of breakpoint timing conditional on a break being present; for HBR the binding limitation is the short post-break record (Appendix A17).
A15 Cross-method changepoint comparison
The dominant single breakpoint was estimated with five changepoint methods (PELT, binary segmentation, bottom-up, dynamic programming, and a window-based scan). The BES break at 2002 was recovered by four of five (the window-based scan placed it at 1999, three years earlier and still well before the HBR break). The HBR break at 2011 was recovered by all five methods.
A16 Expanded penalty sensitivity
PELT was run across a wide penalty grid (0.01–10). The BES break at 2002 was present across penalties 0.01–2.0 (no break at penalty ≥3); secondary BES breakpoints appeared only at low penalties (2007 and 2017 at penalties ≤0.1, with an additional 2012 break emerging at penalties ≤0.05). The HBR break at 2011 was present across penalties 0.05–1.5 (no break at penalty ≥2), with a secondary 2006 break only at penalties 0.01–0.02. These ranges are wider than the 0.05–0.5 stability previously reported.
A17 Hubbard Brook statistical power
The 2011 HBR break leaves only four post-break annual observations (two if 2014–2015 are truncated). The observed shift is large (pre-break n=10, mean −1.221; post-break n=4, mean −0.439; Cohen's d=3.35; two-sample p=0.0001), so the constraint is not low power to detect the shift itself: retrospective power exceeds 0.95 for both n=4 and n=2. Rather, the minimum detectable effect at 80 % power is large (d≈1.8 for n=4; d≈2.4 for n=2), so only large shifts are resolvable and a four-point regime cannot have its level or stability characterized. The 2011 break is robust to leave-one-out deletion of any single post-break year and to minimum-segment-size constraints; on these grounds we retain the “putative shift” description (Sect. 3.6).
The complete analysis code (master_analysis.py, supplemental_robustness.py, and breakpoint_robustness.py) and data manifest are archived at Zenodo (https://doi.org/10.5281/zenodo.18944402, Edmonds, 2026).
All data used in this study are publicly available. BES trace gas fluxes (Groffman and Martel, 2020c), soil moisture and temperature (Groffman and Martel, 2020a), lysimeter chemistry (Groffman and Martel, 2020b), soil properties (Groffman and Raciti, 2020), and permanent plot vegetation surveys (Cary Institute of Ecosystem Studies and Templeton, 2018) are archived at the Environmental Data Initiative (EDI; https://portal.edirepository.org/, last access: 10 March 2026). HBR CH4 flux data are available as knb-lter-hbr.207 (Ni and Groffman, 2018a). Harvard Forest atmospheric CH4 concentration data are available as knb-lter-hfr.60 (Crill, 2023). PRISM climate data were obtained from the PRISM Climate Group at Oregon State University (PRISM Climate Group, 2025). NADP wet deposition data were obtained from the National Atmospheric Deposition Program (National Atmospheric Deposition Program, 2025).
VE designed the study, performed all analyses, and wrote the manuscript.
The author has declared that there are no competing interests.
Publisher's note: Copernicus Publications remains neutral with regard to jurisdictional claims made in the text, published maps, institutional affiliations, or any other geographical representation in this paper. The authors bear the ultimate responsibility for providing appropriate place names. Views expressed in the text are those of the authors and do not necessarily reflect the views of the publisher.
The Baltimore Ecosystem Study and Hubbard Brook Experimental Forest LTER programs provided the long-term data that made this analysis possible. PRISM climate data were provided by the PRISM Climate Group at Oregon State University. Atmospheric deposition data were provided by the National Atmospheric Deposition Program. All analyses used publicly available data and open-source software. Computational verification of analytical results and preparation of script-generated figures were assisted by Claude (Anthropic). All scientific arguments, data interpretation, and conclusions are the author's own.
This research was self-funded by Final Stop Consulting LLC with no external grant support.
This paper was edited by Lishan Ran and reviewed by Jiaxu Han and two anonymous referees.
Aber, J. D., McDowell, W., Nadelhoffer, K., Magill, A., Berntson, G., Kamakea, M., McNulty, S., Currie, W., Rustad, L., and Fernandez, I.: Nitrogen saturation in temperate forest ecosystems: hypotheses revisited, BioScience, 48, 921–934, https://doi.org/10.2307/1313296, 1998. a, b
Ball, B. C., Dobbie, K. E., Parker, J. P., and Smith, K. A.: The influence of gas transport and porosity on methane oxidation in soils, J. Geophys. Res.-Atmos., 102, 23301–23308, https://doi.org/10.1029/97JD00870, 1997. a
Battles, J. J., Fahey, T. J., Driscoll, C. T., Jr., Blum, J. D., and Johnson, C. E.: Restoring soil calcium reverses forest decline, Environ. Sci. Tech. Let., 1, 15–19, https://doi.org/10.1021/ez400033d, 2014. a
Bettez, N. D. and Groffman, P. M.: Nitrogen deposition in and near an urban ecosystem, Environ. Sci. Technol., 47, 6047–6051, https://doi.org/10.1021/es400664b, 2013. a
Bodelier, P. L. E. and Laanbroek, H. J.: Nitrogen as a regulatory factor of methane oxidation in soils and sediments, FEMS Microbiol. Ecol., 47, 265–277, https://doi.org/10.1016/S0168-6496(03)00304-0, 2004. a
Bohlen, P. J., Groffman, P. M., Fahey, T. J., Fisk, M. C., Suarez, E., Pelletier, D. M., and Fahey, R. T.: Ecosystem consequences of exotic earthworm invasion of north temperate forests, Ecosystems, 7, 1–12, https://doi.org/10.1007/s10021-003-0126-z, 2004. a, b
Borken, W., Beese, F., Brumme, R., and Lamersdorf, N.: Long-term reduction in nitrogen and proton inputs did not affect atmospheric methane uptake and nitrous oxide emission from a German spruce forest soil, Soil Biol. Biochem., 34, 1815–1819, https://doi.org/10.1016/S0038-0717(02)00171-2, 2002. a, b, c
Borken, W., Davidson, E. A., Savage, K., Sundquist, E. T., and Steudler, P.: Effect of summer throughfall exclusion, summer drought, and winter snow cover on methane fluxes in a temperate forest soil, Soil Biol. Biochem., 38, 1388–1395, https://doi.org/10.1016/j.soilbio.2005.10.011, 2006. a, b
Bradford, M. A., Ineson, P., Wookey, P. A., and Lappin-Scott, H. M.: The effects of acid nitrogen and acid sulphur deposition on CH4 oxidation in a forest soil: a laboratory study, Soil Biol. Biochem., 33, 1695–1702, https://doi.org/10.1016/S0038-0717(01)00091-8, 2001. a
Brumme, R. and Borken, W.: Site variation in methane oxidation as affected by atmospheric deposition and type of temperate forest ecosystem, Global Biogeochem. Cy., 13, 493–501, https://doi.org/10.1029/1998GB900017, 1999. a, b, c
Cary Institute of Ecosystem Studies and Templeton, L.: BESLTER Permanent Plot vegetation data combined for the survey years of 1998, 2003, and 2015 ver 110, Environmental Data Initiative [data set], https://doi.org/10.6073/pasta/67cd7c50ea5b87369c2b64be62db 366f, 2018. a
Cen, X., He, N., Li, M., Xu, L., Yu, X., Cai, W., Li, X., and Butterbach-Bahl, K.: Suppression of nitrogen deposition on global forest soil CH4 uptake depends on nitrogen status, Global Biogeochem. Cy., 38, e2024GB008098, https://doi.org/10.1029/2024GB008098, 2024. a
Chang, C.-H., Bartz, M. L. C., Brown, G., Callaham, M. A., Jr., Cameron, E. K., Dávalos, A., Dobson, A., Görres, J. H., Herrick, B. M., Ikeda, H., James, S. W., Johnston, M. R., McCay, T. S., McHugh, D., Minamiya, Y., Nouri-Aiin, M., Novo, M., Ortiz-Pachar, J., Pinder, R. A., Ransom, T., Richardson, J. B., Snyder, B. A., and Szlavecz, K.: The second wave of earthworm invasions in North America: biology, environmental impacts, management and control of invasive jumping worms, Biol. Invasions, 23, 3291–3322, https://doi.org/10.1007/s10530-021-02598-1, 2021. a
Crill, P.: EMS – Automated high-frequency methane data ver 19, Harvard Forest Data Archive: HF060, Environmental Data Initiative [data set], https://doi.org/10.6073/pasta/8edcfbf4d9ee31d4a9090e82dc2a3 c83, 2023. a
Del Grosso, S. J., Parton, W. J., Mosier, A. R., Ojima, D. S., Potter, C. S., Borken, W., Brumme, R., Butterbach-Bahl, K., Crill, P. M., Dobbie, K., and Smith, K. A.: General CH4 oxidation model and comparisons of CH4 oxidation in natural and managed systems, Global Biogeochem. Cy., 14, 999–1019, https://doi.org/10.1029/1999GB001226, 2000. a
Dutaur, L. and Verchot, L. V.: A global inventory of the soil CH4 sink, Global Biogeochem. Cy., 21, GB4013, https://doi.org/10.1029/2006GB002734, 2007. a
Edmonds, V.: Final-Stop-Consulting/forest-methane-sink-decline: v1.1.0: breakpoint robustness + reproducibility fixes (v1.1.0), Zenodo [code], https://doi.org/10.5281/zenodo.20669062, 2026. a
Gauci, V., Matthews, E., Dise, N., Walter, B., Koch, D., Granberg, G., and Vile, M.: Sulfur pollution suppression of the wetland methane source in the 20th and 21st centuries, P. Natl. Acad. Sci. USA, 101, 12583–12587, https://doi.org/10.1073/pnas.0404412101, 2004. a
Gelman, A. and Stern, H.: The difference between “significant” and “not significant” is not itself statistically significant, Am. Stat., 60, 328–331, https://doi.org/10.1198/000313006X152649, 2006. a
Groffman, P. M. and Martel, L. D.: Baltimore Ecosystem Study: Soil moisture and temperature along an urban to rural gradient, 2011–present ver 160, Environmental Data Initiative [data set], https://doi.org/10.6073/pasta/76e44dc0b004859a661f74ebe1d8a 610, 2020a. a
Groffman, P. M. and Martel, L. D.: Baltimore Ecosystem Study: Soil solution chemistry data from long-term study plots ver 290, Environmental Data Initiative [data set], https://doi.org/10.6073/pasta/afdbfd008b8f67596ebce31ae17ef 707, 2020b. a
Groffman, P. M. and Martel, L. D.: Baltimore Ecosystem Study: Soil atmosphere fluxes of carbon dioxide, nitrous oxide and methane ver 650, Environmental Data Initiative [data set], https://doi.org/10.6073/pasta/a5d0316370e50cbc720ef438409c 433c, 2020c. a
Groffman, P. M. and Raciti, S.: Baltimore Ecosystem Study: Physical, chemical and biological properties of forest and home lawn soils ver 200, Environmental Data Initiative [data set], https://doi.org/10.6073/pasta/3847c58578bd9d5987a49e55066b 497b, 2020. a
Groffman, P. M., Fisk, M. C., Driscoll, C. T., Likens, G. E., Fahey, T. J., Eagar, C., and Pardo, L. H.: Calcium additions and microbial nitrogen cycle processes in a northern hardwood forest, Ecosystems, 9, 1289–1305, https://doi.org/10.1007/s10021-006-0177-z, 2006. a
Gulledge, J. and Schimel, J. P.: Low-concentration kinetics of atmospheric CH4 oxidation in soil and mechanism of inhibition, Appl. Environ. Microb., 64, 4291–4298, https://doi.org/10.1128/AEM.64.11.4291-4298.1998, 1998. a
Gulledge, J., Hrywna, Y., Cavanaugh, C., and Steudler, P. A.: Effects of long-term nitrogen fertilization on the uptake kinetics of atmospheric methane in temperate forest soils, FEMS Microbiol. Ecol., 49, 389–400, https://doi.org/10.1016/j.femsec.2004.04.013, 2004. a, b
Haynes, R. J. and Naidu, R.: Influence of lime, fertilizer and manure applications on soil organic matter content and soil physical conditions: a review, Nutr. Cycl. Agroecosys., 51, 123–137, https://doi.org/10.1023/A:1009738307837, 1998. a
Johnson, C. E., Driscoll, C. T., Blum, J. D., Fahey, T. J., and Battles, J. J.: Soil chemical dynamics after calcium silicate addition to a northern hardwood forest, Soil Sci. Soc. Am. J., 78, 1458–1468, https://doi.org/10.2136/sssaj2014.03.0114, 2014. a
Killick, R., Fearnhead, P., and Eckley, I. A.: Optimal detection of changepoints with a linear computational cost, J. Am. Stat. Assoc., 107, 1590–1598, https://doi.org/10.1080/01621459.2012.737745, 2012. a
Knief, C.: Diversity and habitat preferences of cultivated and uncultivated aerobic methanotrophic bacteria evaluated based on pmoA as molecular marker, Front. Microbiol., 6, 1346, https://doi.org/10.3389/fmicb.2015.01346, 2015. a
Kolb, S.: The quest for atmospheric methane oxidizers in forest soils, Environ. Microbiol. Rep., 1, 336–346, https://doi.org/10.1111/j.1758-2229.2009.00047.x, 2009. a, b
Likens, G. E., Driscoll, C. T., and Buso, D. C.: Long-term effects of acid rain: response and recovery of a forest ecosystem, Science, 272, 244–246, https://doi.org/10.1126/science.272.5259.244, 1996. a, b, c
Likens, G. E., Driscoll, C. T., Buso, D. C., Mitchell, M. J., Lovett, G. M., Bailey, S. W., Siccama, T. G., Reiners, W. A., and Alewell, C.: The biogeochemistry of sulfur at Hubbard Brook, Biogeochemistry, 60, 235–316, https://doi.org/10.1023/A:1020972100496, 2002. a
Lim, J., Wehmeyer, H., Heffner, T., Aeppli, M., Gu, W., Kim, P. J., Horn, M. A., and Ho, A.: Resilience of aerobic methanotrophs in soils; spotlight on the methane sink under agriculture, FEMS Microbiol. Ecol., 100, fiae008, https://doi.org/10.1093/femsec/fiae008, 2024. a, b, c, d, e, f
Liu, L. and Greaver, T. L.: A review of nitrogen enrichment effects on three biogenic GHGs: The CO2 sink may be largely offset by stimulated N2O and CH4 emission, Ecol. Lett., 12, 1103–1117, https://doi.org/10.1111/j.1461-0248.2009.01351.x, 2009. a
National Atmospheric Deposition Program: National Trends Network (NTN), NADP Program Office, Wisconsin State Laboratory of Hygiene [data set], https://nadp.slh.wisc.edu/networks/national-trends-network/ (last access: 10 March 2026), 2025. a
Ni, X. and Groffman, P. M.: Declines in methane uptake in forest soils ver 3, Environmental Data Initiative [data set], https://doi.org/10.6073/pasta/1a06d382471c941f303a538f4c5be f6c, 2018a. a
Ni, X. and Groffman, P. M.: Declines in methane uptake in forest soils, P. Natl. Acad. Sci. USA, 115, 8587–8590, https://doi.org/10.1073/pnas.1807377115, 2018b. a, b, c, d, e, f, g, h, i
Parkin, T. B.: Soil microsites as a source of denitrification variability, Soil Sci. Soc. Am. J., 51, 1194–1199, https://doi.org/10.2136/sssaj1987.03615995005100050019x, 1987. a
PRISM Climate Group: PRISM climate data, Oregon State University [data set], https://prism.oregonstate.edu (last access: 10 March 2026), 2025. a
Resner, K., Yoo, K., Sebestyen, S. D., Aufdenkampe, A., Hale, C., Lyttle, A., and Blum, A.: Invasive earthworms deplete key soil inorganic nutrients (Ca, Mg, K, and P) in a northern hardwood forest, Ecosystems, 18, 89–102, https://doi.org/10.1007/s10021-014-9814-0, 2015. a
Ridgwell, A. J., Marshall, S. J., and Gregson, K.: Consumption of atmospheric methane by soils: a process-based model, Global Biogeochem. Cy., 13, 59–70, https://doi.org/10.1029/1998GB900004, 1999. a
Saunois, M., Stavert, A. R., Poulter, B., Bousquet, P., Canadell, J. G., Jackson, R. B., Raymond, P. A., Dlugokencky, E. J., Houweling, S., Patra, P. K., Ciais, P., Arora, V. K., Bastviken, D., Bergamaschi, P., Blake, D. R., Brailsford, G., Bruhwiler, L., Carlson, K. M., Carrol, M., Castaldi, S., Chandra, N., Crevoisier, C., Crill, P. M., Covey, K., Curry, C. L., Etiope, G., Frankenberg, C., Gedney, N., Hegglin, M. I., Höglund-Isaksson, L., Hugelius, G., Ishizawa, M., Ito, A., Janssens-Maenhout, G., Jensen, K. M., Joos, F., Kleinen, T., Krummel, P. B., Langenfelds, R. L., Laruelle, G. G., Liu, L., Machida, T., Maksyutov, S., McDonald, K. C., McNorton, J., Miller, P. A., Melton, J. R., Morino, I., Müller, J., Murguia-Flores, F., Naik, V., Niwa, Y., Noce, S., O'Doherty, S., Parker, R. J., Peng, C., Peng, S., Peters, G. P., Prigent, C., Prinn, R., Ramonet, M., Regnier, P., Riley, W. J., Rosentreter, J. A., Segers, A., Simpson, I. J., Shi, H., Smith, S. J., Steele, L. P., Thornton, B. F., Tian, H., Tohjima, Y., Tubiello, F. N., Tsuruta, A., Viovy, N., Voulgarakis, A., Weber, T. S., van Weele, M., van der Werf, G. R., Weiss, R. F., Worthy, D., Wunch, D., Yin, Y., Yoshida, Y., Zhang, W., Zhang, Z., Zhao, Y., Zheng, B., Zhu, Q., Zhu, Q., and Zhuang, Q.: The Global Methane Budget 2000–2017, Earth Syst. Sci. Data, 12, 1561–1623, https://doi.org/10.5194/essd-12-1561-2020, 2020. a
Schnell, S. and King, G. M.: Mechanistic analysis of ammonium inhibition of atmospheric methane consumption in forest soils, Appl. Environ. Microb., 60, 3514–3521, https://doi.org/10.1128/aem.60.10.3514-3521.1994, 1994. a, b
Shen, L., Peng, S., Zhang, Z., Tong, C., Lin, J., Li, Y., Zhong, H., Ma, S., Zhuang, M., and Gauci, V.: The large role of declining atmospheric sulfate deposition and rising CO2 concentrations in stimulating future wetland CH4 emissions, Sci. Adv., 11, eadn1056, https://doi.org/10.1126/sciadv.adn1056, 2025. a
Steudler, P. A., Bowden, R. D., Melillo, J. M., and Aber, J. D.: Influence of nitrogen fertilization on methane uptake in temperate forest soils, Nature, 341, 314–316, https://doi.org/10.1038/341314a0, 1989. a
Striegl, R. G.: Diffusional limits to the consumption of atmospheric methane by soils, Chemosphere, 26, 715–720, https://doi.org/10.1016/0045-6535(93)90455-E, 1993. a
Su, R., Li, K., Wang, N., Yuan, F., Zhao, Y., Zuo, Y., Sun, Y., He, L., Yang, L., Xu, X., and Zhang, L.: Reviews and syntheses: Contribution of sulfate to aerobic methane oxidation in upland soils – a mini-review, Biogeosciences, 22, 5625–5634, https://doi.org/10.5194/bg-22-5625-2025, 2025. a
Täumer, J., Kolb, S., Boeddinghaus, R. S., Wang, H., Schöning, I., Schrumpf, M., Urich, T., and Marhan, S.: Divergent drivers of the microbial methane sink in temperate forest and grassland soils, Glob. Change Biol., 27, 929–940, https://doi.org/10.1111/gcb.15430, 2021. a, b
Xia, N., Du, E., Wu, X., Tang, Y., Wang, Y., and de Vries, W.: Effects of nitrogen addition on soil methane uptake in global forest biomes, Environ. Pollut., 264, 114751, https://doi.org/10.1016/j.envpol.2020.114751, 2020. a
Yesilonis, I., Placella, S., Csuzdi, C., and Szlavecz, K.: Changes in remnant forest soils and earthworm communities over two decades, Appl. Soil Ecol., 202, 105534, https://doi.org/10.1016/j.apsoil.2024.105534, 2024. a