
the Creative Commons Attribution 4.0 License.
the Creative Commons Attribution 4.0 License.
 | 13 Aug 2026
Uncertainty in Land Carbon Fluxes Simulated by CMIP6 Models from Treatments of Crop Distributions and Photosynthetic Pathways
Joseph Ovwemuvwose
Ian Colin Prentice
Heather Graven
A reliable representation of the diversity of vegetation in terrestrial ecosystems is needed for the accurate simulation of present and future biogeochemical cycling and global climate, particularly as climate change affects different vegetation types differently. We compare the distributions of crops and of C3 vs. C4 photosynthetic pathways in both natural vegetation and crops across Earth System Models in the 6th Coupled Model Intercomparison Project (CMIP6). We find a large range in C3 and C4 crops, natural and total vegetation for area and gross primary production (GPP) across the models. Even though 10 of the 11 models used Land Use Harmonisation (LUH2) crop areas as input data, modelled total crop area ranges from − 28 % to + 10 % of a satellite-based estimate. The C3 and C4 crop areas were − 56 % to + 15 % and − 100 % to + 38 % of LUH2 for 2014, respectively. The C4 fraction of total vegetation area in the models is 9 %–25 %, compared to 20 % ± 3 % in observation-based estimates for the year 2014. Total global GPP varies by a factor of two across the models, and the C4 fraction of GPP ranges from 12 % to 27 %. Simulated trends in the fraction of GPP by C3 vs. C4 vegetation type (− 20 % to + 29 %) would have changed global stable carbon isotopic discrimination by − 0.35 ‰ to + 0.11 ‰ over 1975–2005, not including changes in discrimination over time within C3 and C4 vegetation, indicating that modeled changes in the fraction of GPP by C3 and C4 vegetation do not account for the + 0.7 ‰ increase indicated by atmospheric data. Disparity in vegetation with these photosynthetic pathways in models contributes to uncertainty in land carbon flux simulations, and further constraints and improvements in models are needed.
- Article
(4951 KB) - Full-text XML
-
Supplement
(1723 KB) - BibTeX
- EndNote


The terrestrial biosphere captures ∼ 30 % of anthropogenically emitted CO2 annually (Friedlingstein et al., 2025) reducing CO2 accumulation in the atmosphere and the accompanying global warming. However, this CO2 uptake may be sensitive to future climate change (Arora et al., 2020). Understanding the mechanisms contributing to the CO2 uptake, including the role of different types of vegetation and land use, is essential to understanding potential carbon-climate feedback and future changes to the terrestrial carbon cycle.
The implementation of land use and land cover change (LUCC) and its impact on vegetation cover and dynamics are important components of terrestrial biosphere model development (Hu et al., 2021; Lam et al., 2021; Hurtt et al., 2020; Wang et al., 2022). LUCC is mainly driven by agriculture. The fraction of global land area used for agriculture increased from 14 % in 1850 to about 37 % in 2015 (Hurtt et al., 2020), and LUCC emitted about 118 PgC between 1850 and 2020 (Houghton and Castanho, 2023). In addition to CO2 emissions, the biophysical effects of land conversion also drive global temperature rise due to changes in surface albedo (Arora and Boer, 2010; Houghton et al., 2012). The alteration of the land surface will continue to be significant in the future as, for example, it has been projected that 14 % of vegetation and 5 % of soil carbon stocks will be lost to cropland expansion globally over 2010–2050 in a “middle-of-the-road” scenario (Molotoks et al., 2018).
To represent plant diversity and function, most model developers use plant functional types (PFTs) that group vegetation by similar features such as growth form, ecological requirements, and photosynthetic pathways. This helps to account for the variation in adaptive mechanisms and ecological distribution of different plants (Haxeltine and Prentice, 1996; Hurtt et al., 2020; Wullschleger et al., 2014). One important characteristic of plants is their use of either the C3 or C4 photosynthetic pathways. In C3 plants, the first product of the photosynthetic pathway is a three-carbon molecule called 3-phosphoglycerate (3-PGA), whereas in C4 plants, it is a four-carbon molecule called oxaloacetate. C3 and C4 types also differ in their response to changes in soil moisture content, temperature, CO2, and light (Luo et al., 2024). For more information about the anatomical/structural and physiological differences between vegetations with these photosynthetic pathways, which drive their distinct climate and CO2 concentration responses, see Luo et al. (2024), Cortés et al. (2021), Smith and Boers (2023), Polley et al. (1994), Farquhar et al. (1989), Still et al. (2003), Ehleringer and Björkman (1977).
Under increasing temperatures, especially those above the thermal optimum threshold, productivity in C3 vegetation is limited by increased photorespiration (Hermida-Carrera et al., 2016), which reduces photosynthetic efficiency in C3 plants. In contrast, C4 species overcome photorespiration through their CO2 concentrating mechanism that increases the amount of CO2 at the site of carboxylation (da Silva et al., 2020), leading to an abundance of C4 species (natural grasses and crops such as maize) in hot areas in the tropics and sub-tropics (Luo et al., 2024). While rising temperature generally favours C4 plants, rising atmospheric CO2 concentration confers a physiological advantage upon C3 species (Polley et al., 1994) due to a reduction in photorespiration and an increase in water use efficiency. This CO2 fertilisation effect is responsible for the increasing presence of C3 woody species in previously C4 dominated grasslands (Luo et al., 2024). Shifts in C3 and C4 species composition and carbon fluxes across different regions are projected to continue in future due to changing temperature, water availability and increasing CO2 concentration in the atmosphere (Cortés et al., 2021; Smith and Boers, 2023; Winslow et al., 2003).
A change in the relative contributions of C3 and C4 vegetation to global productivity may contribute to a global trend in stable photosynthetic carbon isotope discrimination (Δ) because C3 plants discriminate against carbon-13 more strongly than C4 plants (Farquhar et al., 1989). Since atmospheric studies have indicated that Δ increased by 0.7 ‰ over 1975–2005 globally (Keeling et al., 2017), and by 0.4 ‰ over 2000–2011 in the Northern Hemisphere (Peters et al., 2018), understanding the effect of changes in vegetation type on discrimination would help to quantify the environmental and physiological factors influencing plant function and resulting discrimination, including soil moisture content, vapour pressure deficit and stomatal conductance (Cornwell et al., 2018; Griffis et al., 2010; Francey and Farquhar, 1982).
Currently, the relative contribution and its change over time of C3 vs. C4 vegetation to global terrestrial biosphere productivity, and their ecological roles in climate change mitigation, are not well known. Using remote sensing products, physiological modelling, and crop data, Still et al. (2003) found that C3 and C4 area abundances are 87.4 and 18.8 million km2 (17.7 % as C4), and C3 and C4 gross primary production were 114.7 and 35.3 PgC yr−1 (23 % as C4), respectively, on average for the 1980s and 1990s. More recently, Luo et al. (2024) used global observations of plant photosynthetic pathways, satellite remote sensing, and photosynthetic optimality theory to estimate a similar level of C4 area coverage (17.5 %), but a lower fraction of gross primary productivity (19.4 %), compared to Still et al. (2003). Luo et al. (2024) showed that C4 vegetation coverage decreased from 17.7 % to 17.1 % over 2001 to 2019 as natural C4 grass cover declined in favour of C3 vegetation, especially C3 trees in tropical grasslands and savannas. In comparison, across the TRENDY ensemble of dynamic global vegetation models, there were large ranges of 7 %–23 % of vegetation area and 2 %–40 % of productivity from C4 vegetation (Luo et al., 2024), showing a need for better constraints and understanding of C3 C4 vegetation competition and change over time.
Here we investigate the contribution of vegetation diversity representation to uncertainty in carbon flux simulation in Earth System Models. We evaluate the representation of C3 and C4 vegetation over 1850–2014 in 11 Earth System Models used in the 6th Coupled Model Intercomparison project (CMIP6). We assess the distribution, productivity and carbon content of C3 and C4 vegetation and compare with observation/satellite-based estimates where possible. We also explore the potential trend in global carbon isotope discrimination Δ13C due to C3 and C4 vegetation changes simulated in the models.
2.1 CMIP6 Models Outputs and the LUH v2 Data
To analyze the CMIP6 models, we obtained the output for the following variables from the CMIP6-ESGF repository (https://esgf-node.ipsl.upmc.fr/search/cmip6-ipsl/, last access: 28 July 2026): fractions of C3 and C4 vegetation coverage (c3PftFrac and c4PftFrac), C3 and C4 crop fraction (cropFracC3 and cropFracC4), total crop fraction (cropFrac), gross primary production (gpp), grid cell area (areacella), and percentage of each grid cell covered by land (sftlf). The necessary output was available from 11 models (Table 1). Brief descriptions of the implementation of vegetation abundance in each of the 11 models are provided in the Supplement (section “Materials and Methods S1”).
Table 1Summary of each model's definition of crop cover and our calculation of C3 and C4 crop cover. More detail is given in SM Materials and Methods.
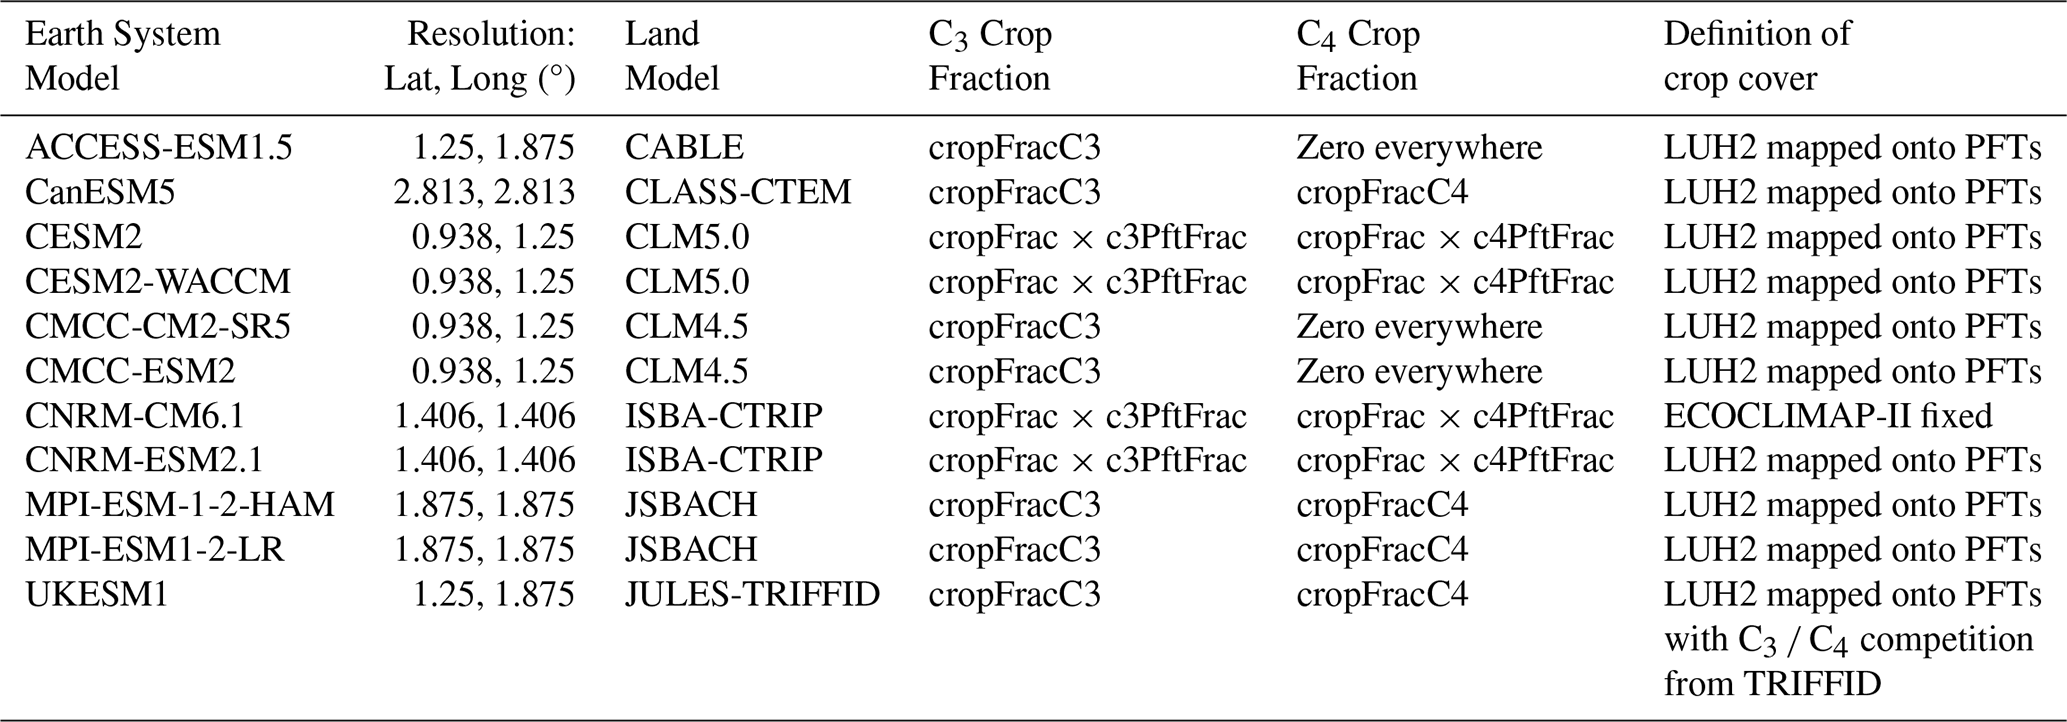
To specify crop cover, ten of the eleven CMIP6 models use the Land Use Harmonisation version 2 (LUH2) dataset (Hurtt et al., 2020, Table 1), so we also analyse the LUH2 data directly here. LUH2 estimates the fractional area and transition of use of 12 categories at an annual and 0.25° by 0.25° spatiotemporal resolution, starting from the year 850 (Hurtt et al., 2020). Five of these categories are C3 annual crops, C3 perennial crops, C3 nitrogen-fixing crops, C4 annual crops and C4 perennial crops. We group these categories into C3 crops and C4 crops, and their sum as total crops.
The UKESM1 model uses the LUH2 crop cover data with some modifications, including simulation of competition between C3 and C4 vegetation using the dynamic vegetation model TRIFFID (Top-down Representation of Interactive Foliage and Floral Including Dynamics, Sellar et al., 2019, Clark et al., 2011). Other models use the LUH2 data more directly, but differences can result from mapping the LUH2 data onto the model's PFTs, land cover and grid maps.
In CNRM-CM6.1, the crop cover is based on the ECOCLIMAP-II database (Voldoire et al., 2019). CNRM-CM6.1 adopts a vegetation cover map that is fixed to its present-day distribution, so that temporal changes in crop area are not included. The reasoning for using a fixed distribution is that the carbon cycle is not fully resolved in the model and there is uncertainty in the impacts of land use and land cover change on carbon flux (Faroux et al., 2013; Voldoire et al., 2019; Gasser et al., 2020).
2.2 Global Land Vegetation Cover and Productivity
We analysed changes in the vegetation cover (C3, C4 cropland and natural vegetation) for the 11 CMIP6 models by calculating the gridded annual area fraction for C3 and C4 vegetation for each year 1850–2014, which we also separated into crops, natural and total vegetation. We also calculated gridded annual gross primary production (GPP) for C3 and C4 vegetation in crops, natural and total vegetation in each model. We combined gridded estimates into global totals.
We calculated annual maps of the area fraction of C3 crops (cropFracC3) and C4 crops (cropFracC4). Most models included the cropFracC3 and cropFracC4 variables that could be used directly (Table 1). Some models had to be treated differently due to the output provided. ACCESS-ESM1.5, CMCC-CM2-SR5, and CMCC-ESM2 did not provide cropFracC4, and their cropFracC3 was equal to the total crop fraction (cropFrac), so we specified the fraction of C4 crops to be zero everywhere. The CESM2 models did not provide cropFracC3 and cropFracC4 variables, but they did provide c3PftFrac or c4PftFrac (the fractions for total vegetation), so cropFracC3 and cropFracC4 were calculated by multiplying cropFrac by c3PftFrac or c4PftFrac. In CNRM-CM6-1 and CNRM-ESM2.1, the cropFracC3 and cropFracC4 variables were identical to the c3PftFrac and c4PftFrac variables, which appears to be an error in the output. So, in CNRM-CM6-1 and CNRM-ESM2.1, cropFracC3 and cropFracC4 were calculated by multiplying cropFrac by c3PftFrac or c4PftFrac.We also compared the total cropland area in all the models and the LUH2 dataset to a satellite-based estimate from Potapov et al. (2022).
To calculate the fractions of natural C3 and C4 vegetation, we subtracted cropFracC3 and cropFracC4 from c3PftFrac or c4PftFrac (the total C3 and C4 vegetation fractions). Therefore, for each grid cell, we had the fractional area of C3 and C4 crops and of C3 and C4 natural vegetation.
The GPP from C3 or C4 vegetation was not provided, so we estimated these by multiplying the total GPP by the area fractions. In Luo et al. (2024), it was found that the per-unit-area photosynthetic rate of C4 grass was generally higher than that of C3 vegetation, indicating that these calculations may overestimate the proportion assigned to C3 vegetation. Therefore, we conducted a reliability analysis to determine the similarity between the values and distribution of C3 and C4 crops obtained from cropFrac × c3PftFrac and cropFrac × c4PftFrac in the models (CESM2, CESM2-WACCM, CNRM-ESM2-1 and CNRM-CM6.1) and LUH2 values and distribution using kernel density estimate (KDE) (Silverman, 1986; Chen, 2017) and constructed spatial probability distribution plots using all land pixels for C3, C4 and total crops for the year 2014 (Chiang et al., 2021). We also visually compared the spatial distribution of these values to LUH2 and to UKESM1 and MPI-ESM-1-2-HAM, two models that provided their C3 and C4 crops.
2.3 Global Stable Carbon Isotopic Discrimination
To estimate how the simulated changes in C3 and C4 fractions of GPP influenced the global stable carbon isotopic discrimination, we estimated discrimination assuming fixed values for stable carbon isotope discrimination by C3 and C4 vegetation. This neglects any environmental or physiological effects on discrimination that may be simulated by the models to isolate the potential effect from changes in C3 and C4 fractions of GPP alone. The total annual global stable carbon isotopic discrimination (Δtot) was calculated by the following weighted average with GPP:
Here, GPP and GPP are the integrated GPP for all C3 and C4 vegetation each year, and and are the fixed stable carbon isotope discrimination for C3 and C4, respectively. We also calculated the global natural stable carbon isotopic discrimination (Δnat) using the natural C3 and C4 GPP for all the models using the same weighted average approach. To calculate the effect of crops on the global annual stable carbon isotope discrimination (Δcrop), we subtracted Δnat from Δtot.
and were specified as the means of C3 and C4 plant leaf stable carbon isotope discrimination observations from the database of 3987 species published by Cornwell et al. (2018), which are 20.7 ‰ for and 6.3 ‰ for (Fig. 1). The two peaks in the histogram are assumed to correspond to the highest count for the species with either the C3 and C4 photosynthetic pathways. A breakpoint of 12.5 ‰ was chosen for C3 and C4 based on the midpoint between the two peaks, such that discrimination values lower than 12.5 ‰ in Fig. 1 are taken to correspond to vegetation with the C4 photosynthetic pathway while values higher than 12.5 ‰ correspond to stable carbon isotope discrimination in vegetation with the C3 photosynthetic pathway. The means of these two distributions were calculated and used to specify the fixed C3 and C4 discrimination: 20.7 ‰ for and 6.3 ‰ for .
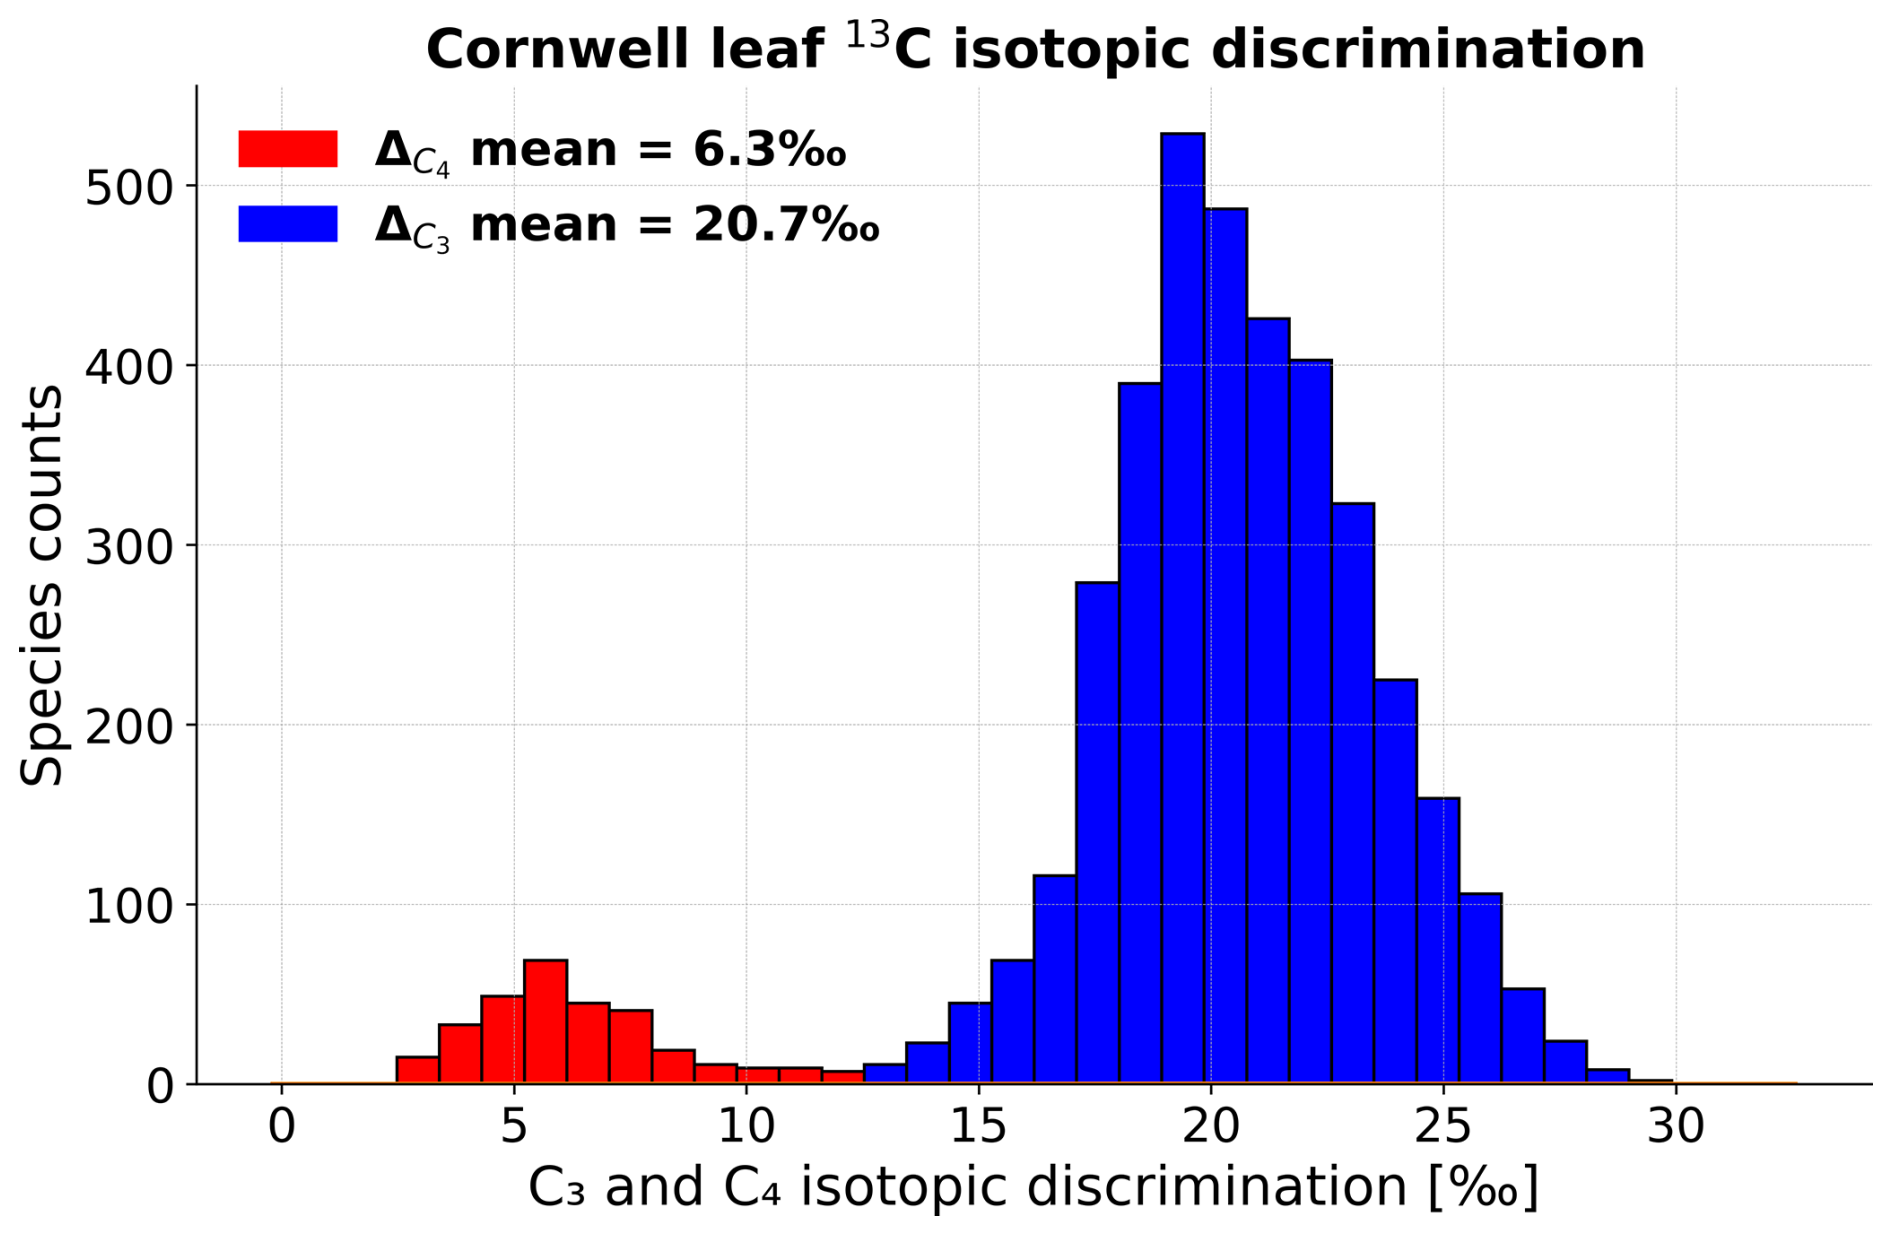
Figure 1Stable carbon isotope discrimination in leaves from the database published by Cornwell et al. (2018).
3.1 Crops Spatial Distribution and its Change between 1970 and 2014
Based on the LUH2 dataset averaged over 1970–2014, the highest C3 crop abundance is in agricultural regions in central North America, southwest Europe, southeast and south Asia, Sub-Saharan Africa, southeast South America and southern Australia (Figs. 2 and 3) (Hurtt et al., 2020). The fractional crop area is between 60 % and 100 % in these regions. For C4 crops, the highest abundance is in the Great Plains in North America, Sub-Saharan Africa, Southwest Asia and Southeast Asia (Fig. 2).
The models that do not use LUH2 data directly, UKESM1 (which used LUH2 indirectly) and CNRM-CM6-1, show differences with LUH2 (Figs. 2 and 3). UKESM1 underestimates C3 crops in Sub-Saharan and central Africa and in Southeast Asia, particularly in India, which is likely due to decreased precipitation in UKESM1 in these areas since the vegetation cover is coupled to its simulated climate (Sellar et al., 2019) and UKESM1 underestimates precipitation in India. UKESM1 estimates more C4 crop coverage than LUH2, particularly in Asia (Figs. 2 and 3 and Table S1 in the Supplement). Crop coverage in UKESM1 is about 10 % lower than LUH2 between the equator and 30° N (Fig. 3). CNRM-CM6-1 has less C4 crop cover in Europe and Africa, but more in North and South America, compared to LUH2 (Figs. 2 and 3). For models using LUH2 directly, there was still disagreement between the models and the LUH2 crop coverage, which could be due to a number of reasons, such as preprocessing of the LUH2 vegetation classes into the plant functional types (PFTs) and remapping of the LUH2 data into the spatial resolution needed for each model (Table S1). For the models where we calculated C3 and C4 crop cover by multiplying cropFract by C3PftFrac and C4PftFrac, CESM2, CESM2-WACCM, CNRM-ESM2-1 and CNRM-CM6.1, we found that the kernel density estimate (KDE) and visual comparison of the values of C3 and C4 crops distribution show they are within the range of values for UKESM1, MPI-ESM-1-2-HAM and LUH2 in terms of magnitude, range and spatial distribution as shown by the spatial distribution, and the overlap area in the percentage cover vs. density plots. For example, the overlap area between LUH2 and CESM2 in C3 and C4 crop cover is 0.68 and 0.70, respectively, which is close enough to that between LUH2 and MPI-ESM-1-2-HAM, which is 0.74 and 0.50, respectively (Figs. 3, S7–S13).
The models incorporating LUH2 have similar patterns in C3 and C4 crop; however, the total area of crops in these models differed from LUH2 by − 19 % to + 3 % and from satellite-based estimate by − 28 % to + 10 % (Fig. 4, Table S1) from Potapov et al. (2022) study that analysed the change in global cropland area in the first two decades of the twenty-first century using satellite and sample data that estimate crop cover at ∼ 10.9 and ∼ 11.42 million km2 respectively between 2003 and 2006. CanESM5 was the most consistent with LUH2. Inconsistencies among the models that use the LUH2 dataset may be due to how the data were pre-processed before incorporation into the model, due to grid spacing or due to differences in the model PFTs compared to LUH2 categories, particularly as some models did not include C4 crops. Also, because the variables cropFracC3 and cropFracC4 were not available for all models, our crop-fraction calculations may have contributed to the discrepancies. The magnitude of area abundance for C3 and C4 crop and natural vegetation for the years 1970 and 2014 are provided in the Supplement (Table S2).
Between 1970 and 2014, there were decreases in crop coverage in North America, Europe, Southern Africa, Chile, Japan and New Zealand, but increases in South and Southeast Asia, Africa and South America (Figs. 3b and S1). The largest increases of 10 % or more were concentrated around the eastern region of South America, especially in Brazil, the southern fringes of the Sahara Desert (sub-Saharan Africa) and southeast Africa. The largest decreases of more than 20 % were across the corn belt of the United States and in southwest and central Europe. Changes in crop area in UKESM1 were consistent with LUH2 except in the low latitudes of the Northern Hemisphere, where increases in C3 crops in Africa and Asia were underestimated, compared to LUH2 (Figs. 3b and S1).
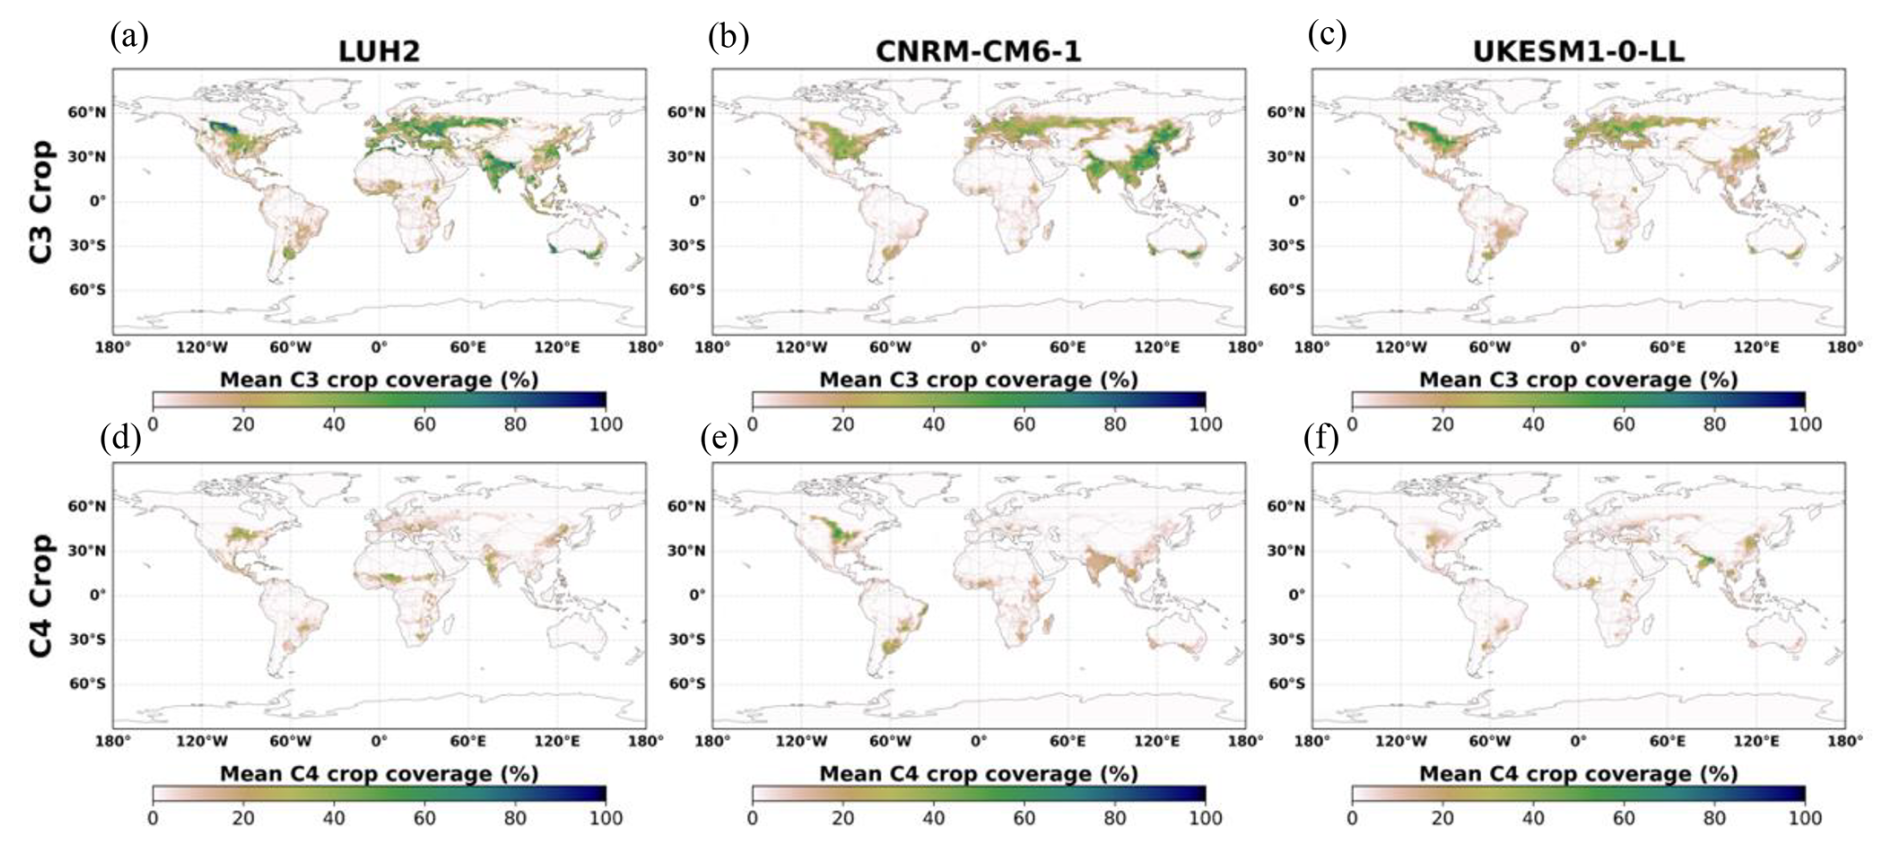
Figure 2Mean percentage of Earth surface covered by crops between 1970 and 2014 for C3 and C4 in LUH2, CNRM-CM6.1 and UKESM1-0-LL. Other models not shown use the LUH2 crop variables directly for their crop coverage and change.
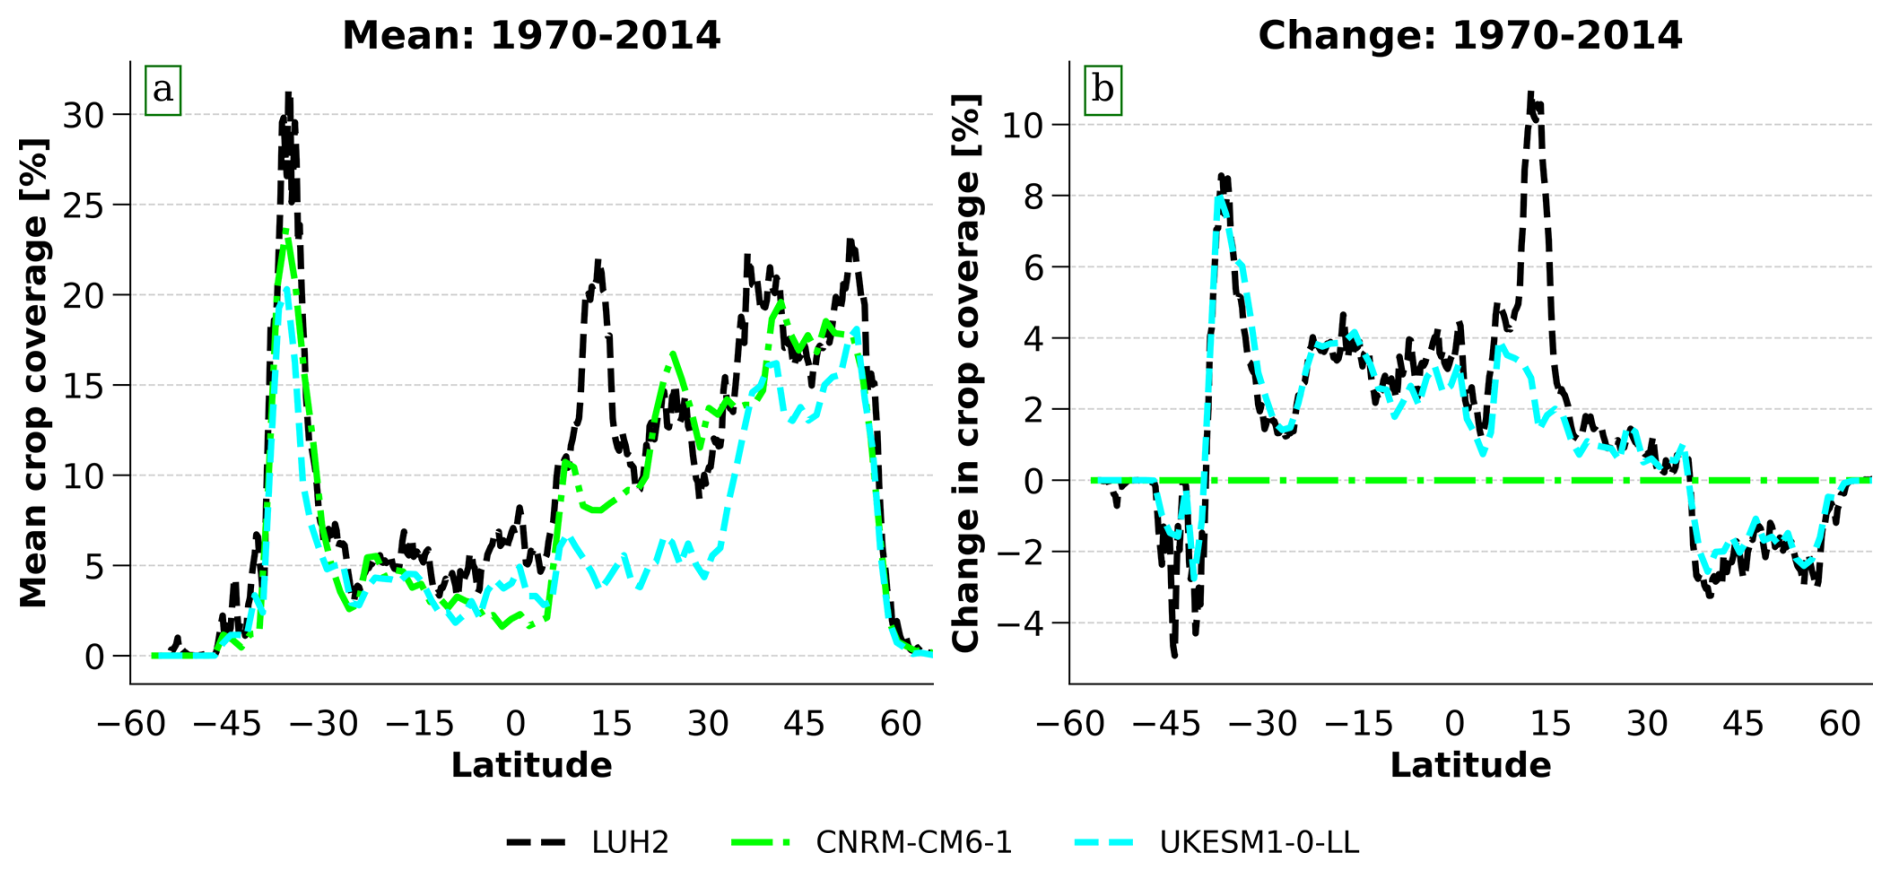
Figure 3Mean and change in crop coverage averaged over latitude between 1970 and 2014. (a) Mean crop coverage (b) change in crop coverage.
3.2 Global Temporal Trends in Vegetation Coverage
There is a strong positive trend in the area of croplands from 1850 until 2014 (Fig. 4a). Total crop area rose by 200 % in LUH2 and models using LUH2 data. Crop area in UKESM1 was lower than LUH2 but increased in a greater proportion, from 3 to 10 million m2 (217 %). In CNRM-CM6, the total crop area was fixed at ∼ 14 million km2, similar to LUH2 in the 1990s.
While representing a smaller fraction of total crop area (10 %–45 %) (Fig. 4a and g), the area of C4 crops increased in greater proportion (> 300 %) than C3 crops (160 %) in the LUH2 data (Fig. 4). Historically, in the CESM2 models, C3 crop area is lower and C4 crop area is higher than in LUH2, despite the model using LUH2 data, although this may be affected by our calculation from the variables provided (Table 1). In UKESM1, the C3 crop area was much smaller than LUH2, while its C4 crop area was larger (Fig. 4). UKESM1 C3 crop area peaked between the 1980s and 90s before declining slightly in the 2000s, in contrast to LUH2, where it continued to increase after 2010. UKESM1 C4 crop area rose through 2014, when it was about 42 % higher than LUH2. CNRM-CM6-1 had a fixed C4 crop fraction of 24 %, slightly higher than the C4 crop fraction in LUH2 in the 1990s. ACCESS-ESM1-5, CMCC-ESM2 and CMCC-CM2-SR5 do not have C4 crops, so their total crop area is equivalent to the C3 crop area.
The area of natural vegetation decreases in all models from 1850 until 1940–1970, when four models (CNRM-ESM2-1, UKESM1, MPI-ESM-1-2-HAM and MPI-ESM1-2-LR) start increasing while the others continue decreasing. Natural vegetation is similarly dominated by C3, with 9 %–23 % of natural vegetation as C4 in 2014, and most of the decline in natural vegetation area is in C3 vegetation. The trend in natural C4 vegetation area is inconsistent across the models. In CanESM5 and ACCESS-ESM1-5, the natural C4 vegetation area decreased over 1850–2014, while for MPI-ESM-1-2-HAM and MPI-ESM1-2-LR the natural C4 vegetation area increased especially from 1990. For the CESM2, CMCC-ESM2 and CMCC-CM2-SR5 , the natural C4 vegetation area was constant until the early 2000s before falling slightly. The UKESM1 estimate of the area of natural C4 vegetation for 2000–2014 compares well with Luo et al. (2024)'s, while other models simulate up to 15 % larger and up to 63 % smaller areas (Fig. 4h).
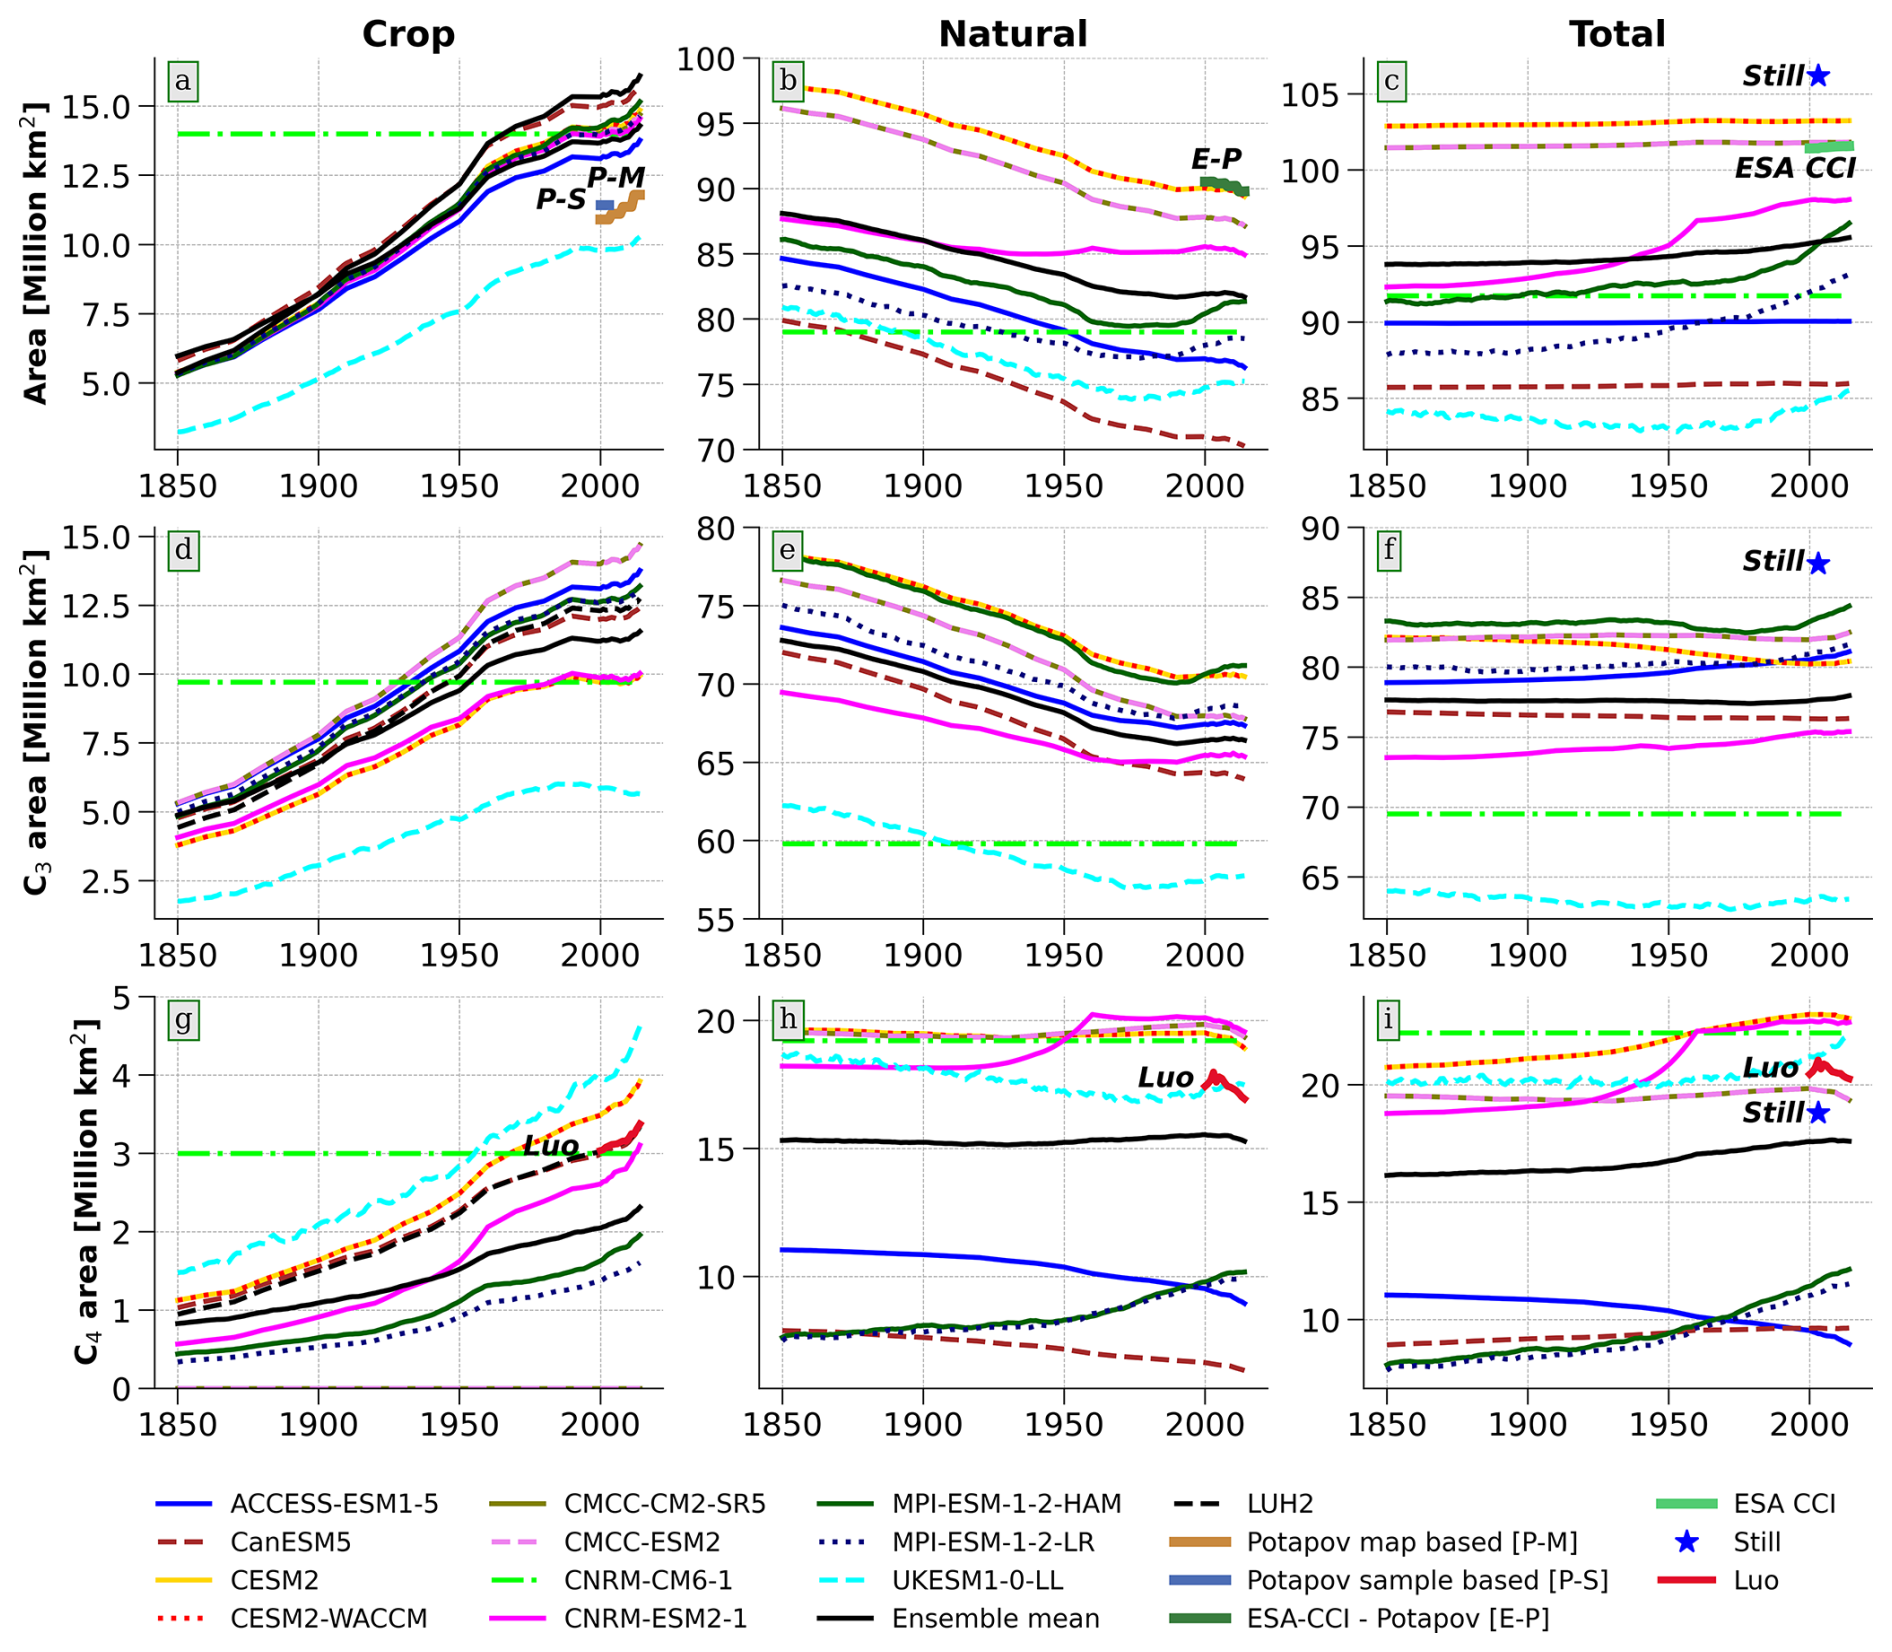
Figure 4Global temporal trends in vegetation area from 1850 to 2014 in CMIP6 models. Trend of the area covered by (a) total crop, (b) total natural vegetation (c) total global vegetation, (d) C3 crops, (e) C3 natural vegetation, (f) total C3 vegetation, (g) C4 crop, (h) C4 natural vegetation and (i) total C4 vegetation. All models except CNRM-CM6-1 used LUH2 data to inform their crop coverage. ACCESS-ESM1-5, CMCC-ESM2 and CMCC-CM2-SR5 do not have C4 crops.
For the total vegetation area, four models have distinct positive trends from the late 1960s through to 2014 (CNRM-ESM2.1, UKESM1, MPI-ESM-1-2-HAM and MPI-ESM1-2-LR) (Fig. 4c), driven mostly by an increase in C4 natural vegetation (Fig. 4h). In the other models, the increase in crop area is balanced by the decrease in area covered by natural vegetation. The estimated total vegetated area from the European Space Agency Climate Change Initiative (ESA-CCI) for 2000–2014 is matched by the CMCC-ESM2 and CMCC-CM2-SR5, while the CESM2 models simulate larger vegetated areas and all other models simulate smaller vegetated areas. The ESA CCI data shows a small increase that may be caused by the replacement of bare ground by natural grasses (Fig. S2).
3.3 Global Trends in Gross Primary Production
While all the models simulate an increase in GPP, the magnitude and contribution by vegetation types (in this context: crop/natural and C3 C4) differ (Fig. 5). The models disagree on the magnitude of total global GPP, ranging from 80 PgC yr−1 in CNRM- ESM2.1 to 150 PgC yr−1 in MPI-ESM-1-2-HAM and MPI-ESM1-2-LR (− 20 % to + 29 %) in 2014 (Gier et al., 2024; Arora et al., 2020) (Fig 5c). The total GPP for all the models increased steadily until the 1960s and then grew sharply for the rest of the historical period (Fig. 5c).
The increase in GPP in crops is linked to the cropland expansion, while the GPP change in natural vegetation is decoupled from the change in area (Figs. S5 and S6). In Fig. 4a, the total crop area increased by 200 % compared to Fig. 4b, in which natural vegetation decreased by 7 % on average. Comparing this change in area to the change in GPP in Fig. 5a and b, total crop GPP increased by 209 % on average. However, for CNRM-CM6.1 with a temporally fixed vegetation cover, the increase in total crop GPP is only 18 %. For natural vegetation, even though there is a mean 7 % decrease in total natural vegetation cover, there is an ∼ 18 % increase in GPP on average. In CNRM-CM6-1 with a fixed vegetation cover, the trend of C3, C4 and total crop GPP is not as strong compared to other models, especially before 1970 (Fig. 5a, d and g). They increased by 32 %, 27 %, and 18 % for C3, C4 and total crop GPP, respectively, compared to the ensemble mean increase of 195 %, 251 % and 209 %, respectively (Fig. 5a, d and g).
For GPP in natural vegetation, there are large ranges of 63–107 PgC yr−1 simulated for C3 vegetation and 9–23 PgC yr−1 simulated for C4 vegetation across the models before 1970 (Fig. 5e and h). Despite the decrease in natural C3 vegetation area before 1970, the C3 GPP trend is generally either weakly negative or unchanging until 1970 (Fig. 5e). Then all models increase steadily over 1970–2014. In natural C4 vegetation, there is generally an increase in GPP since 1850, but the increase is not at the same rate in all the models. It is weaker in ACCESS-ESM1-5, CanESM5 and UKESM1 (Fig. 5h). Natural C4 GPP decreased and remained relatively constant in ACCESS-ESM1-5 and CESM2 models, respectively, over 2000–2014.
The proportion of total GPP by C4 vegetation in the models is 12 %–27 % (Fig. 5i), compared to 23 % in Still et al. (2003) and 20 ± 3 % in Luo et al. (2024). Compared to other model simulations, the range was 2 %–40 % in TRENDY models (Luo et al., 2024), and 18 %–27 % in previous modelling studies (Farquhar and Lloyd, 1993; Fung et al., 1997).
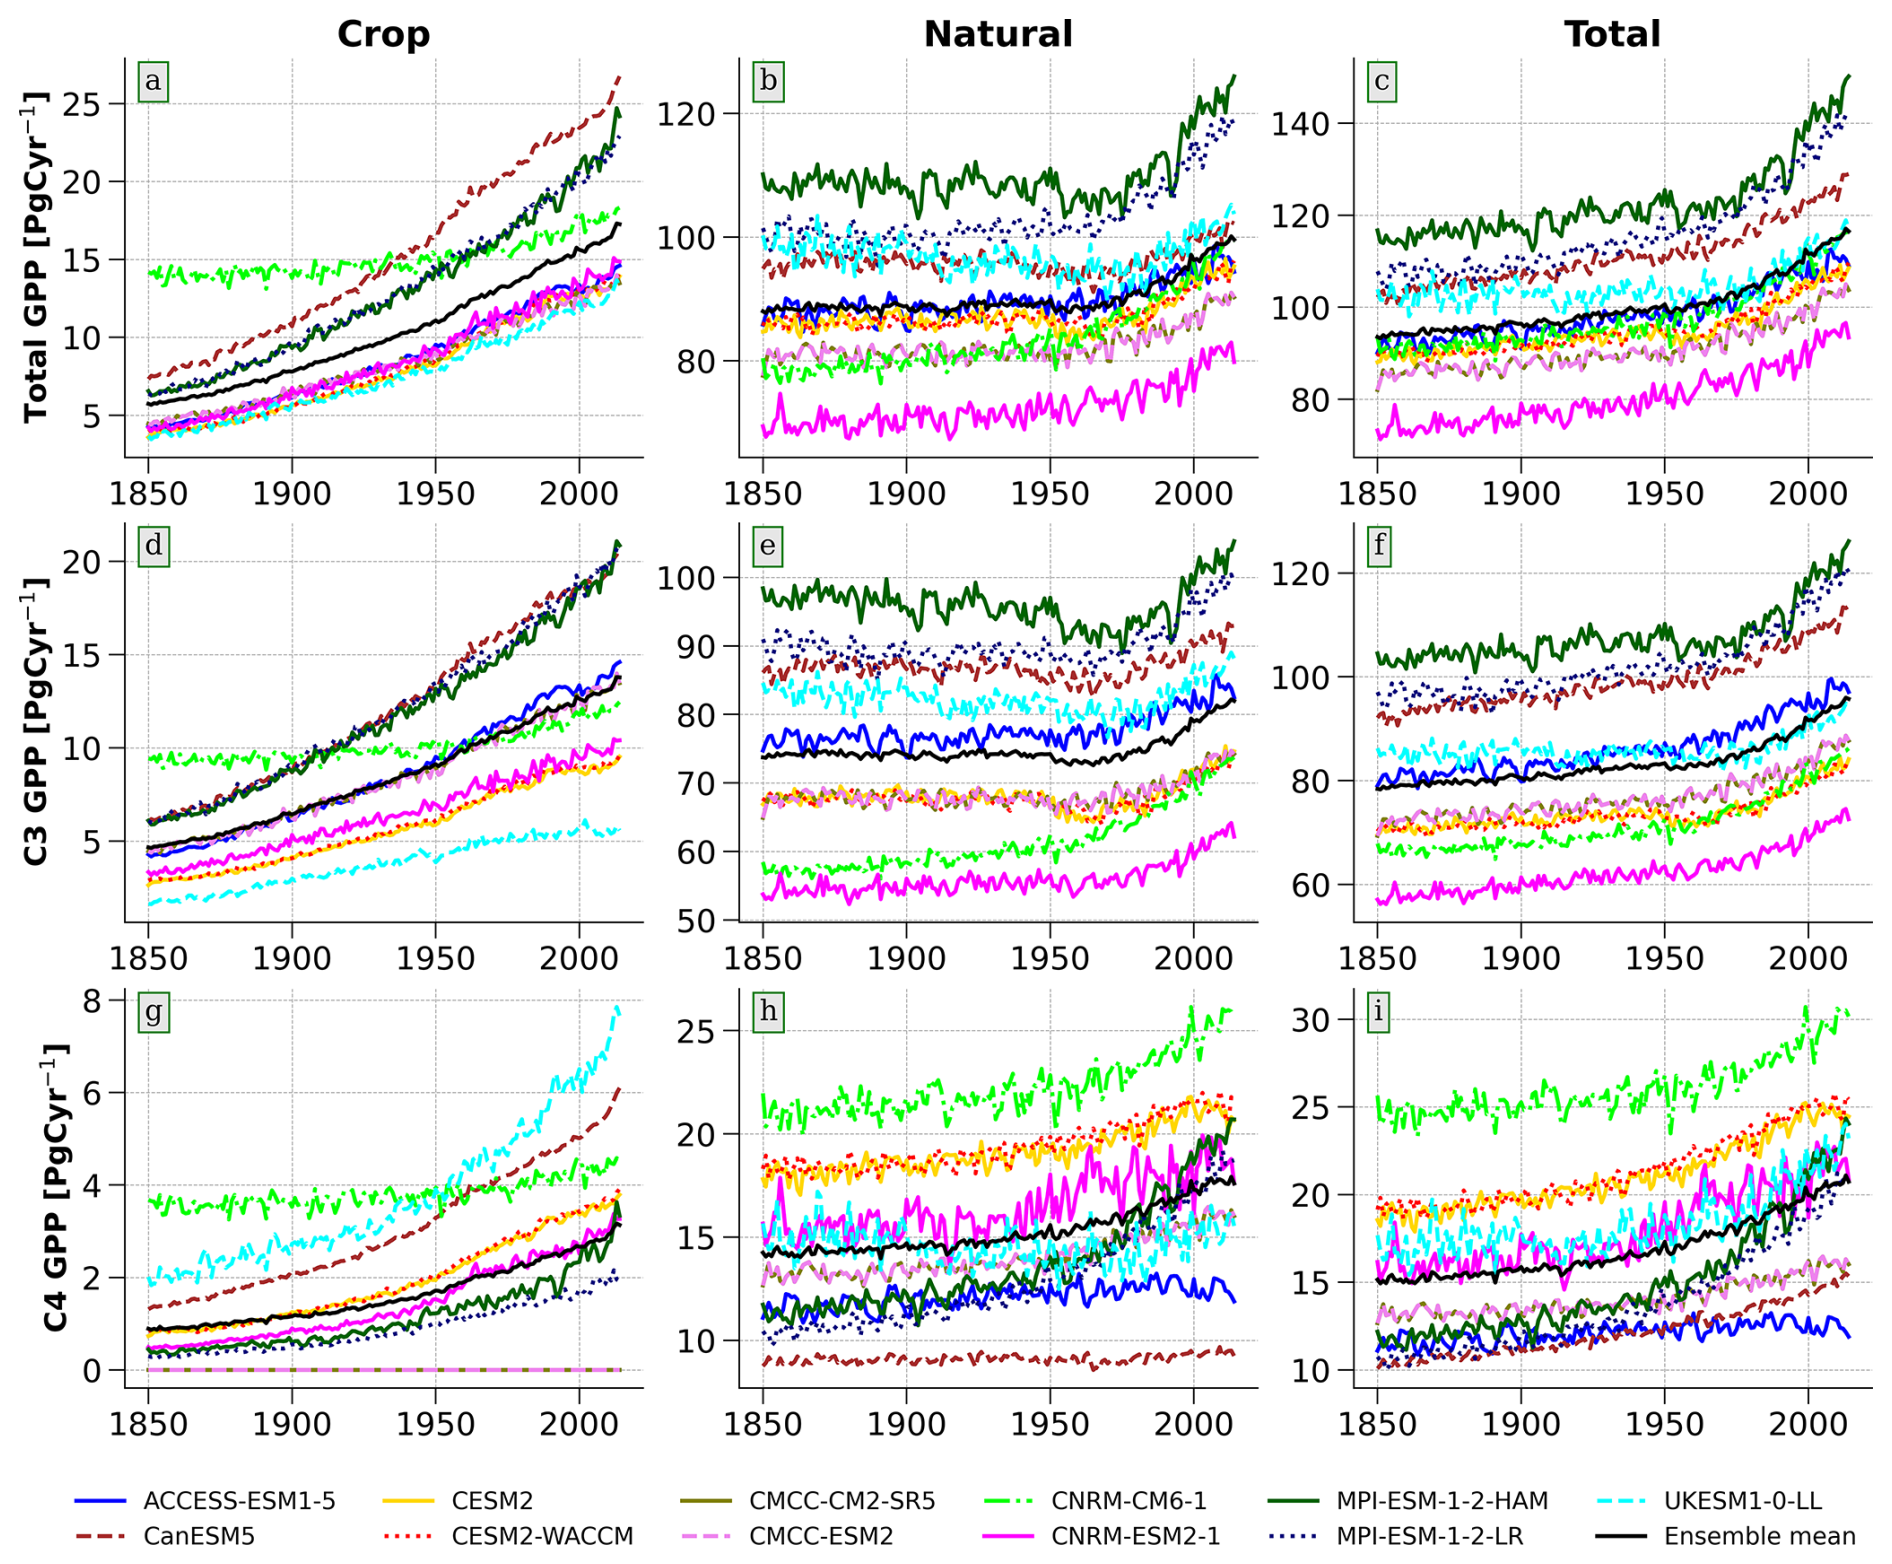
Figure 5Temporal trend in gross primary production (GPP) between 1850 and 2014. Trend of GPP of (a) total crop, (b) total natural vegetation (c) total global vegetation, (d) C3 crops, (e) C3 natural vegetation, (f) total C3 vegetation, (g) C4 crop, (h) C4 natural vegetation and (i) total C4 vegetation.
3.4 Global Trends in Stable Carbon Isotope Discrimination
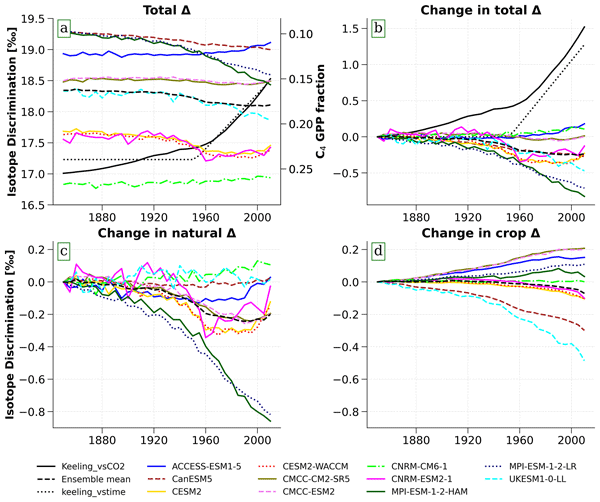
The models disagree on the magnitude and trend of Δtot, Δnat and Δcrop (Fig. 6), for our calculation of discrimination based only on the fraction of GPP from C3 and C4 vegetation, neglecting any physiological or environmental effects Eq. (1). As a result of the 12 %–27 % range in C4 fraction of total GPP, the global total stable carbon discrimination ranges from 16.9 ‰ to 19.5 ‰ (Table S2) in 2014 across the models, compared to 16.5 ‰ in Still et al. (2003). Models simulate no change (CESM2 models), slightly increasing Δtot (ACCESS-ESM1.5 and CNRM-CM6.1) or decreasing Δtot (all other models). The strongest decreases in Δtot were in MPI-ESM-1-2-HAM and MPI-ESM1-2-LR, which had the strongest increases in C4 vegetation area (Fig. 6). Compared to the strong positive trend in the global stable carbon isotope discrimination trend derived by Keeling et al. (2017) from atmospheric δ13C data, the effect of vegetation change in the models was much smaller or had the opposite sign (Fig. 6).
The models also disagree on the sign and magnitude of the trends in change in Δnat (− 0.83 ‰ to 1.7 ‰) and Δcrop (− 0.5 ‰ to 0.2 ‰ , Table S2). Among models with decreasing Δtot, the trend is primarily driven by growth in the productivity of C4 natural vegetation, affecting Δnat in MPI-ESM-1-2-HAM and MPI-ESM1-2-LR, but by growth in the productivity of C4 Crops, affecting Δcrop in the UKESM1 and CanESM5 models (Fig. 6).
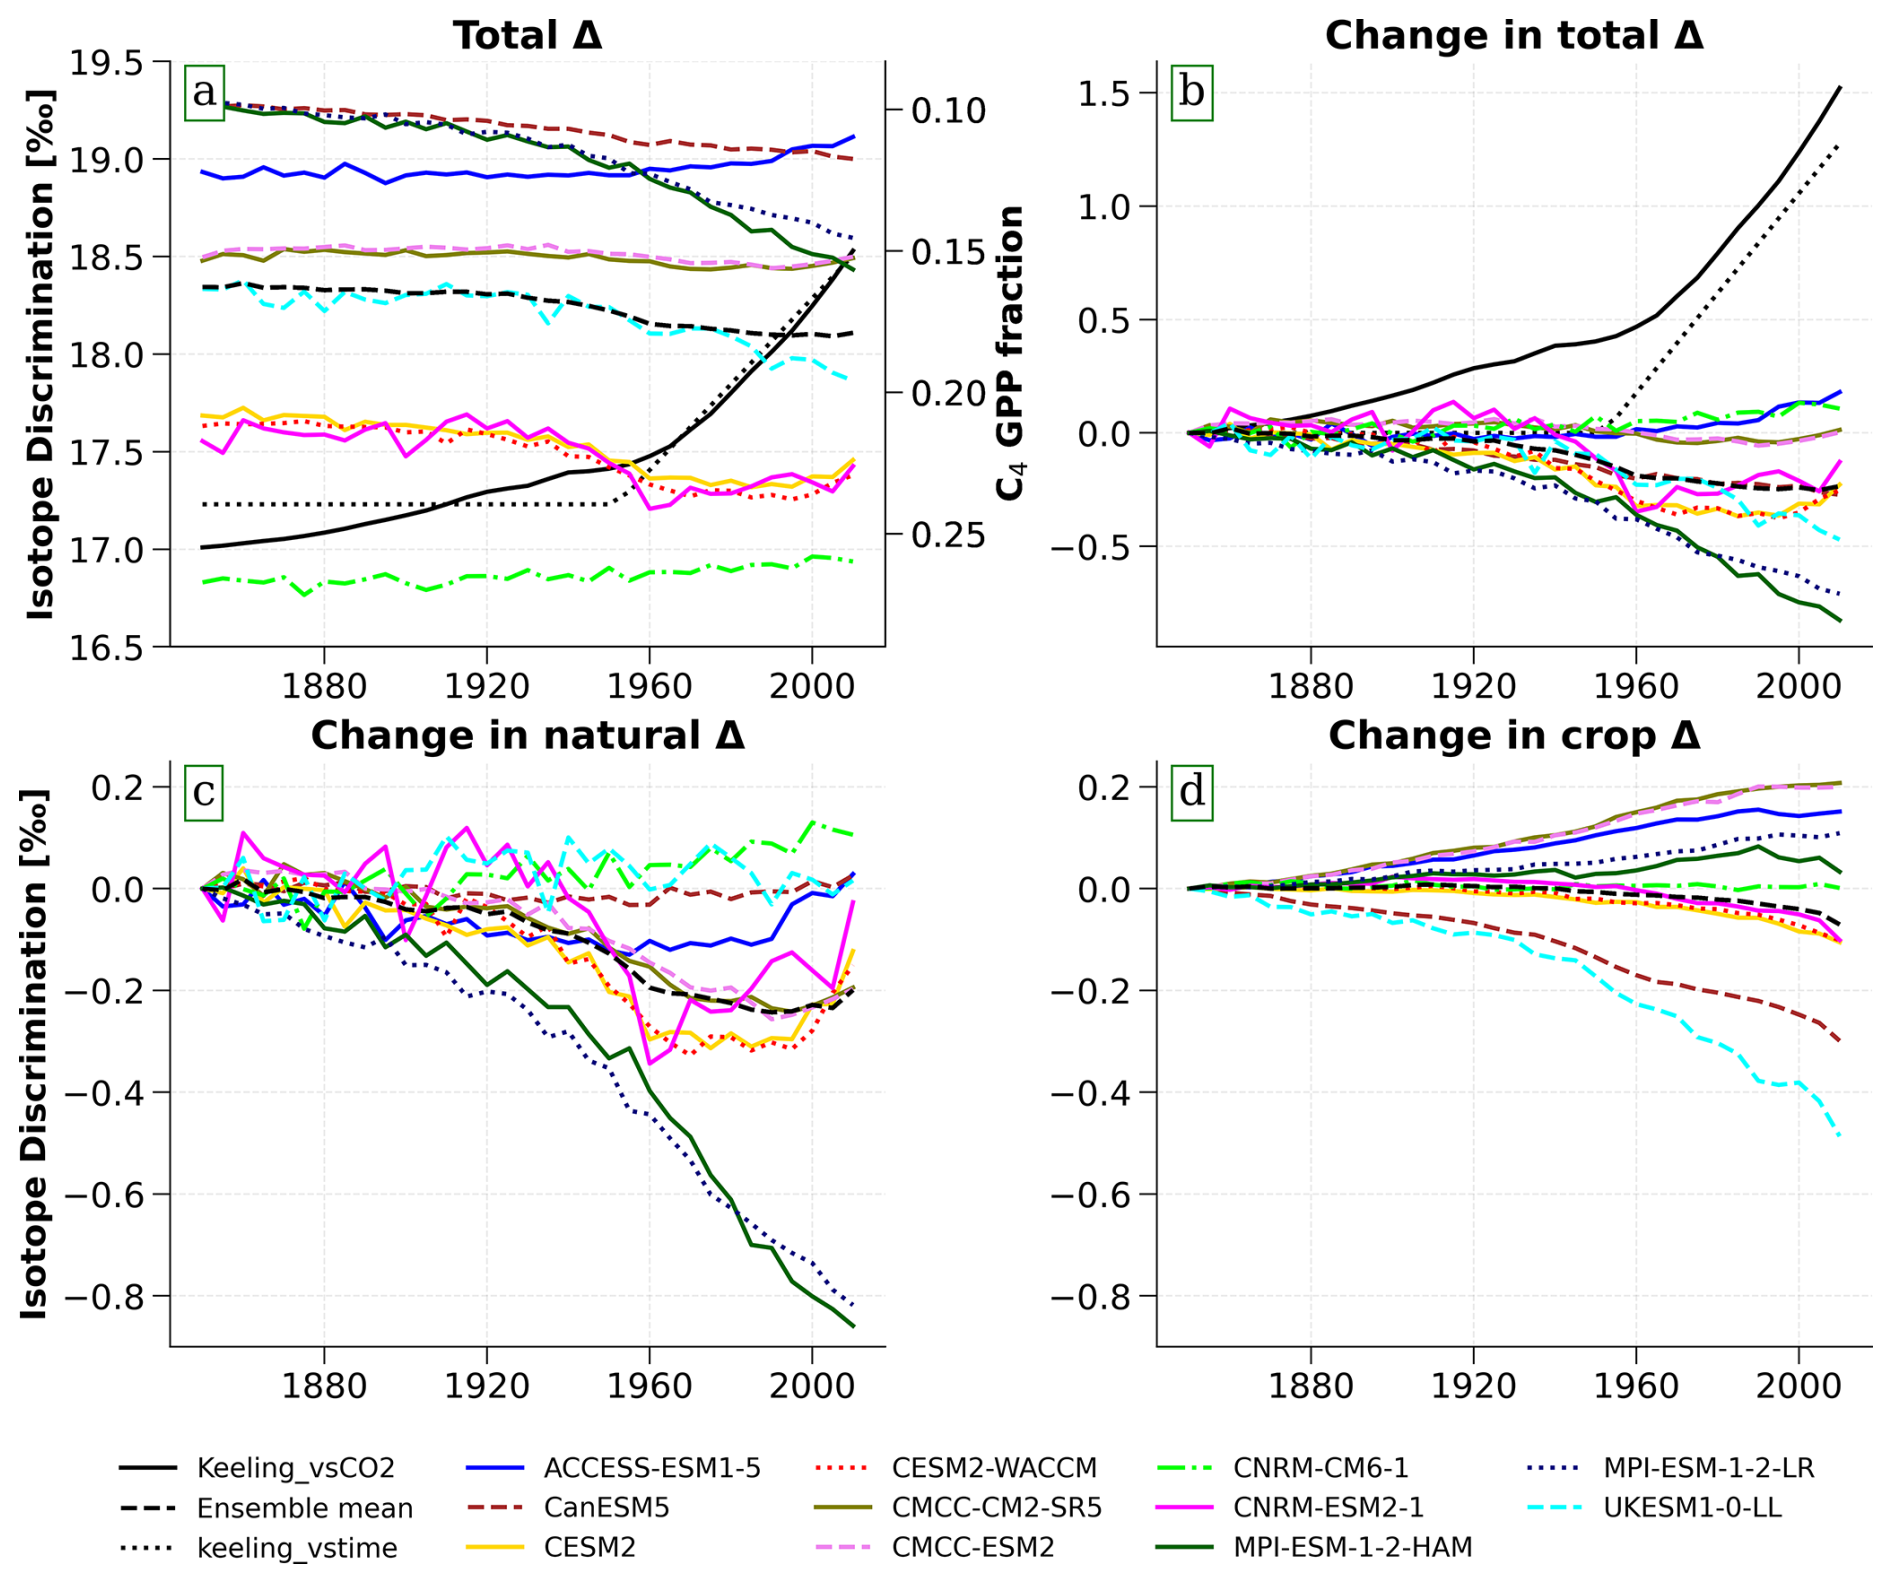
Figure 6Trend of global stable carbon isotope discrimination between 1850 and 2014. 10 year average stable carbon isotope discrimination of (a) total vegetation (Δtot), (b) difference in Δtot from 1850, (c) component of difference due to natural vegetation (Δnat) and (d) due to crops (Δcrop).
By examining the components of global vegetation area and GPP by vegetation types, we find that CMIP6 models span a large range for nearly all variables. Some models showed stronger gains in GPP in natural C3 vegetation, while for others the strongest gains were in either crop or natural C4 vegetation. Therefore, better quantification of vegetation types and more consistency in models would improve future carbon modelling. For example, total vegetated areas in some models that are much lower than the ESA-CCI estimate (Harper et al., 2023) and total C4 vegetated areas in some models that are much lower than the Luo et al. (2024) estimate can probably be ruled out. Additionally, Zhao et al. (2025) show that the uncertainty in the terrestrial biosphere GPP simulation in models depends strongly on the area of each PFTs and this dependence enabled them to reduce the spread in land carbon estimates by ∼ 75 %. They also found that changes in PFTs distribution is responsible for 56 % ± 21 % climate-induced variability in dynamic global vegetation models (DGVMs) GPP. This spread across models in many cases reflects the lack of observational constraints and may also be linked to the discrepancies in the natural vegetation composition in the context of our study.
Even though nearly all the models use LUH2 as input data, their crop areas and, in particular, their attribution to C3 and C4 vegetation are not consistent. While most models underestimated total crop area compared to LUH2 (Fig. 4a), another satellite-based cropland map (Potapov et al., 2022) estimates a lower crop area that overlaps some of the CMIP6 models' crop areas. Therefore, the spread in crop area across the models may reflect uncertainty in their input crop-area data. A limitation of some current models is that they do not include C4 crops; thus, carbon fluxes associated with C4 crops cannot be simulated in those models. In the future, the total crop area is likely to increase (Molotoks et al., 2018; O'Neill et al., 2016), so agriculture will exert an even stronger influence on carbon fluxes.
The range in global GPP was even larger than the range in vegetated area across the models, both for total (GPP: − 23 % to + 37 % vs. area: − 11 % to + 8 %, compared to the model mean) and for C3 (GPP: − 24 % to + 32 % vs. area: − 19% to + 8 %) vegetation types. In C4 natural vegetation, there was also disagreement over the sign of the GPP trend, with some models showing increases in GPP in grid cells dominated by C4 (> 75 %; Fig. S3; a–d), and others showing decreases. These inconsistencies indicate that models' parametrisations, simulated climate and other factors (Campbell et al., 2017; Hou et al., 2022; Lavergne et al., 2022; Zscheischler et al., 2014) are at least as important as vegetation area for GPP simulation. Therefore, achieving consistency in the area for vegetation types is not sufficient, and an improved understanding and representation of C3 and C4 GPP in models are needed.
The range in total area fraction of C4 vegetation of 10 %–26 % in the CMIP6 models spans the observation-based estimates of 17.1 %–17.7 % (Still et al., 2003; Luo et al., 2024) and has a similar range as the dynamic global vegetation models in the TRENDY project (7 %–23 %; Luo et al., 2024). Since the observation-based estimates are quite consistent, model simulations of carbon fluxes can likely be improved by detailed comparison and specification of C4 vegetation cover in particular PFTs within models to better align them with observational estimates.
The trends in C3 vs. C4 contributions to GPP simulated by CMIP6 models produced differing trends in stable carbon isotopic discrimination when only C3 and C4 fractions of GPP are used to calculate discrimination trends Eq. (1) (Fig. 6). The simulated changes in C3 and C4 fractions of GPP did not produce strong increasing trends as found by analysis of atmospheric δ13C data (Keeling et al., 2017; Peters et al., 2018). Since the effect of changing C3 and C4 fractions of GPP on stable carbon isotopic discrimination varied widely across the CMIP6 models, it is still uncertain how much they could add to or oppose changes in stable carbon isotopic discrimination caused by environmental or physiological effects. Nevertheless, Lavergne et al. (2026) found that accounting for the changes in C3 and C4 vegetation abundance improves the modelled trends in atmospheric carbon isotope composition compared to the data. In particular, since the GPP trend in the models (11 % to 18 %, Fig. S4) is weaker than the CO2 fertilisation effect over the 20th century based on carbonyl sulphide data (+ 30 %; Campbell et al., 2017), there may have been a more positive C3 vegetation-driven trend in stable carbon isotopic discrimination in reality than in the models. Since the CMIP6 models did not provide output for GPP for C3 and C4 vegetation or for crops and natural vegetation, we had to scale total GPP by the area fractions of each vegetation type for grid cells with mixed vegetation. This calculation may not represent the models' actual attribution precisely, since C4 vegetation can have higher GPP relative to area (Luo et al., 2024) in grid cells with a mosaic of C3 and C4. However, the extra resources needed in the C4 photosynthetic pathway (Ehleringer, 1978) to concentrate CO2 may make the difference between C3 and C4 CO2 uptake minimal, especially if they co-occur relatively equally in such grid cells. Incorporating more detailed vegetation information from the models would improve the accuracy of the calculations, and analysis based on TRENDY models could be a good place to start.
We analysed changes in vegetation with C3 and C4 photosynthetic pathways for natural vegetation and crops in 11 CMIP6 models over the historical period of 1850 to 2014. Except for one model that used a fixed vegetation distribution, the models include the expansion of agriculture using LUH2 data. Still, there is a significant variation in the fraction of area and GPP allocated to crops in these models, and the UKESM1 model strongly underestimated crops in Asia and Africa, likely due to biases in simulated climate. The C4 fraction of vegetated area has remained relatively constant in the models, though there is a large range in simulated C4 area fraction of 10 % to 26 % in 2014, while observation-based estimates are quite consistent at 17.1 %–17.7 % from the 1980s to 1990s and between 2001 and 2019 (Luo et al., 2024; Still et al., 2003). Overall, the total vegetation area in most models is not changing, but the global vegetation composition is changing in favour of crops. Whereas all the models agree that C3 vegetation GPP and total global GPP are increasing, the magnitude of the increase spans a wide range. In C4 vegetation, the models disagree on the magnitude of GPP and the sign of its trend, especially in natural vegetation, implying that our understanding of and model parametrisations for the simulation of C4 GPP need improvement. The strong positive trends in UKESM1 C4 crop and MPI-ESM-1-2-HAM and MPI-ESM1-2-LR C4 natural vegetation area clearly drive the decline in their global stable carbon isotopic discrimination trend, an effect that is not as pronounced in other models' vegetation categories. However, due to the large uncertainty in vegetation area abundance and GPP, it will be difficult to determine if this effect of change in vegetation area abundance and GPP on the global stable carbon isotopic discrimination trend is consistent across all the models. We have shown in this study that carbon flux simulations in current ESMs include uncertainties in the C3 and C4 photosynthetic pathways in crops and natural vegetation; reducing these uncertainties will require stronger observational constraints and more robust and realistic model parameterisations.
The code (Jupyter notebooks) used for the analysis of the CMIP6 models data and for the data visualization can be found in the following Github repository: https://github.com/jovwemuvwose/CMIP6_Model_Analysis_Project_2025_version2 (last access: 28 July 2026) and Zenodo at https://doi.org/10.5281/zenodo.16883407 (Ovwemuvwose, 2025).
The CMIP6 models data used in the are available at the World Climate Research Programme (WCRP) Coupled Model Intercomparison Project (Phase 6) website: https://esgf-node.ipsl.upmc.fr/projects/cmip6-ipsl/ (last access: 28 July 2026). The leaf carbon isotope data by Cornwell et al. (2018) are available at https://doi.org/10.1111/geb.12764. For the ESA CCI, LUH2, Still, Potapov and Luo data used in Fig. 4, see https://doi.org/10.5194/ESSD-15-1465-2023 (Harper et al., 2023), https://doi.org/10.5194/gmd-13-5425-2020 (Hurtt et al., 2020), https://doi.org/10.1029/2001GB001807 (Still et al., 2003), https://doi.org/10.1038/s43016-021-00429-z (Potapov et al., 2022) and https://doi.org/10.1038/s41467-024-45606-3 (Luo et al., 2024) respectively. For the Keeling_vsCO2, Keeling_vstime used in Fig. 7 see https://doi.org/10.1073/pnas.1619240114 (Keeling et al., 2017). The processed data used for the figures can be made available by the authors on request.
The supplement related to this article is available online at https://doi.org/10.5194/bg-23-5593-2026-supplement.
JO and HG conceptualize the overarching research and CIP contributed to broadening it; JO prepared and created the published work, specifically data analysis and visualization and writing of the initial draft of the manuscript. HG and CIP reviewed and edited the manuscript.
The contact author has declared that none of the authors has any competing interests.
Publisher's note: Copernicus Publications remains neutral with regard to jurisdictional claims made in the text, published maps, institutional affiliations, or any other geographical representation in this paper. The authors bear the ultimate responsibility for providing appropriate place names. Views expressed in the text are those of the authors and do not necessarily reflect the views of the publisher.
This project is supported by Schmidt Sciences, LLC.
This research has been supported by the Schmidt Futures (grant no. G-21-61881).
This paper was edited by Benjamin Stocker and reviewed by two anonymous referees.
Arora, V. K. and Boer, G. J.: Uncertainties in the 20th century carbon budget associated with land use change, Global Change Biol., 16, 3327–3348, https://doi.org/10.1111/J.1365-2486.2010.02202.X, 2010.
Arora, V. K., Katavouta, A., Williams, R. G., Jones, C. D., Brovkin, V., Friedlingstein, P., Schwinger, J., Bopp, L., Boucher, O., Cadule, P., Chamberlain, M. A., Christian, J. R., Delire, C., Fisher, R. A., Hajima, T., Ilyina, T., Joetzjer, E., Kawamiya, M., Koven, C. D., Krasting, J. P., Law, R. M., Lawrence, D. M., Lenton, A., Lindsay, K., Pongratz, J., Raddatz, T., Séférian, R., Tachiiri, K., Tjiputra, J. F., Wiltshire, A., Wu, T., and Ziehn, T.: Carbon–concentration and carbon–climate feedbacks in CMIP6 models and their comparison to CMIP5 models, Biogeosciences, 17, 4173–4222, https://doi.org/10.5194/bg-17-4173-2020, 2020.
Campbell, J. E., Berry, J. A., Seibt, U., Smith, S. J., Montzka, S. A., Launois, T., Belviso, S., Bopp, L., and Laine, M.: Large historical growth in global terrestrial gross primary production, Nature, 544, 84–87, https://doi.org/10.1038/nature22030, 2017.
Chen, Y. C.: A tutorial on kernel density estimation and recent advances, Biostatistics and Epidemiology, 1, 161–187, https://doi.org/10.1080/24709360.2017.1396742, 2017.
Chiang, F., Mazdiyasni, O., and AghaKouchak, A.: Evidence of anthropogenic impacts on global drought frequency, duration, and intensity, Nat. Commun., 12, https://doi.org/10.1038/s41467-021-22314-w, 2021.
Clark, D. B., Mercado, L. M., Sitch, S., Jones, C. D., Gedney, N., Best, M. J., Pryor, M., Rooney, G. G., Essery, R. L. H., Blyth, E., Boucher, O., Harding, R. J., Huntingford, C., and Cox, P. M.: The Joint UK Land Environment Simulator (JULES), model description – Part 2: Carbon fluxes and vegetation dynamics, Geosci. Model Dev., 4, 701–722, https://doi.org/10.5194/gmd-4-701-2011, 2011.
Cornwell, W. K., Wright, I. J., Turner, J., Maire, V., Barbour, M. M., Cernusak, L. A., Dawson, T., Ellsworth, D., Farquhar, G. D., Griffiths, H., Keitel, C., Knohl, A., Reich, P. B., Williams, D. G., Bhaskar, R., Cornelissen, J. H. C., Richards, A., Schmidt, S., Valladares, F.,Körner, C., Schulze, E., Buchmann, N., and Santiago, L. S.: Climate and soils together regulate photosynthetic carbon isotope discrimination within C3 plants worldwide, Global Ecol. Biogeogr., 27, 1056–1067, https://doi.org/10.1111/geb.12764, 2018.
Cortés, J., Mahecha, M. D., Reichstein, M., Myneni, R. B., Chen, C., and Brenning, A.: Where are global vegetation greening and browning trends significant?, Geophys. Res. Lett., 48, https://doi.org/10.1029/2020GL091496, 2021.
da Silva, R. G., Alves, R. de C., and Zingaretti, S. M.: Increased [CO2] causes changes in physiological and genetic responses in C4 crops: A brief review, Plants, 9, 1–13, https://doi.org/10.3390/plants9111567, 2020.
Ehleringer, J. R.: implications of quantum yield differences on the distributions of C3 and C4 grasses, Oecologia, 31, 255–267 https://doi.org/10.1007/BF00346246, 1978.
Ehleringer, J. and Björkman, O.: Quantum yields for CO2 uptake in C3 and C4 plants: dependence on temperature, CO2, and O2 concentration, Plant Physiol., 59, 86–90, https://doi.org/10.1104/pp.59.1.86, 1977.
Faroux, S., Kaptué Tchuenté, A. T., Roujean, J.-L., Masson, V., Martin, E., and Le Moigne, P.: ECOCLIMAP-II/Europe: a twofold database of ecosystems and surface parameters at 1 km resolution based on satellite information for use in land surface, meteorological and climate models, Geosci. Model Dev., 6, 563–582, https://doi.org/10.5194/gmd-6-563-2013, 2013.
Farquhar, G. D. and Lloyd, J.: Carbon and oxygen isotope effects in the exchange of carbon dioxide between trrestrial plants and the atmosphere, in: Stable Isotopes and Plant Carbon-water Relations, edited by: Ehleringer, J. R., Hall, A. E., Farquhar, G. D., Elsevier, 47–70, https://doi.org/10.1016/C2009-0-03312-1, 1993.
Farquhar, G. D., Ehleringer, J. R., and Hubick, K. T.: Carbon isotope discrimination and photosynthesis, Annu. Rev. Plant Physiol. Plant Mol. Bioi., 40, 503–37, https://doi.org/10.1146/annurev.pp.40.060189.002443, 1989.
Francey, R. and Farquhar, G.: An explanation of 13C/12C variations in tree rings, Nature, 297, 28–31, https://doi.org/10.1038/297028a0, 1982.
Friedlingstein, P., O'Sullivan, M., Jones, M. W., Andrew, R. M., Hauck, J., Landschützer, P., Le Quéré, C., Li, H., Luijkx, I. T., Olsen, A., Peters, G. P., Peters, W., Pongratz, J., Schwingshackl, C., Sitch, S., Canadell, J. G., Ciais, P., Jackson, R. B., Alin, S. R., Arneth, A., Arora, V., Bates, N. R., Becker, M., Bellouin, N., Berghoff, C. F., Bittig, H. C., Bopp, L., Cadule, P., Campbell, K., Chamberlain, M. A., Chandra, N., Chevallier, F., Chini, L. P., Colligan, T., Decayeux, J., Djeutchouang, L. M., Dou, X., Duran Rojas, C., Enyo, K., Evans, W., Fay, A. R., Feely, R. A., Ford, D. J., Foster, A., Gasser, T., Gehlen, M., Gkritzalis, T., Grassi, G., Gregor, L., Gruber, N., Gürses, Ö., Harris, I., Hefner, M., Heinke, J., Hurtt, G. C., Iida, Y., Ilyina, T., Jacobson, A. R., Jain, A. K., Jarníková, T., Jersild, A., Jiang, F., Jin, Z., Kato, E., Keeling, R. F., Klein Goldewijk, K., Knauer, J., Korsbakken, J. I., Lan, X., Lauvset, S. K., Lefèvre, N., Liu, Z., Liu, J., Ma, L., Maksyutov, S., Marland, G., Mayot, N., McGuire, P. C., Metzl, N., Monacci, N. M., Morgan, E. J., Nakaoka, S.-I., Neill, C., Niwa, Y., Nützel, T., Olivier, L., Ono, T., Palmer, P. I., Pierrot, D., Qin, Z., Resplandy, L., Roobaert, A., Rosan, T. M., Rödenbeck, C., Schwinger, J., Smallman, T. L., Smith, S. M., Sospedra-Alfonso, R., Steinhoff, T., Sun, Q., Sutton, A. J., Séférian, R., Takao, S., Tatebe, H., Tian, H., Tilbrook, B., Torres, O., Tourigny, E., Tsujino, H., Tubiello, F., van der Werf, G., Wanninkhof, R., Wang, X., Yang, D., Yang, X., Yu, Z., Yuan, W., Yue, X., Zaehle, S., Zeng, N., and Zeng, J.: Global Carbon Budget 2024, Earth Syst. Sci. Data, 17, 965–1039, https://doi.org/10.5194/essd-17-965-2025, 2025.
Fung, I., Field, C. B., Berry, J. A., Thompson, M. V., Randerson, J. T., Malmström, C. M., Vitousek, P. M., James Collatz, G., Sellers, P. J., Randall, D. A., Denning, A. S., Badeck, F., and John, J.: Carbon 13 exchanges between the atmosphere and biosphere, Global Biogeochem. Cy., 11, 507–533, https://doi.org/10.1029/97GB01751, 1997.
Gasser, T., Crepin, L., Quilcaille, Y., Houghton, R. A., Ciais, P., and Obersteiner, M.: Historical CO2 emissions from land use and land cover change and their uncertainty, Biogeosciences, 17, 4075–4101, https://doi.org/10.5194/bg-17-4075-2020, 2020.
Gier, B. K., Schlund, M., Friedlingstein, P., Jones, C. D., Jones, C., Zaehle, S., and Eyring, V.: Representation of the terrestrial carbon cycle in CMIP6, Biogeosciences, 21, 5321–5360, https://doi.org/10.5194/bg-21-5321-2024, 2024.
Griffis, T. J., Baker, J. M., Sargent, S. D., Erickson, M., Corcoran, J., Chen, M., and Billmark, K.: Influence of C4 vegetation on 13CO2 discrimination and isoforcing in the upper Midwest, United States, Global Biogeochem. Cy., 24, https://doi.org/10.1029/2009GB003768, 2010.
Harper, K. L., Lamarche, C., Hartley, A., Peylin, P., Ottlé, C., Bastrikov, V., San Martín, R., Bohnenstengel, S. I., Kirches, G., Boettcher, M., Shevchuk, R., Brockmann, C., and Defourny, P.: A 29 year time series of annual 300 m resolution plant-functional-type maps for climate models, Earth Syst. Sci. Data, 15, 1465–1499, https://doi.org/10.5194/essd-15-1465-2023, 2023.
Haxeltine, A. and Prentice, C. I.: BIOME3: An equilibrium terrestrial biosphere model based on ecophysiological constraints, resource availability, and competition among plant functional types, Global Biogeochem. Cy., 10, 693–709, https://doi.org/10.1029/96GB02344, 1996.
Hermida-Carrera, C., Kapralov, M. V., and Galmés, J.: Rubisco catalytic properties and temperature response in crops, Plant Physiol., 171, 2549–2561, https://doi.org/10.1104/pp.16.01846, 2016.
Hou, H., Zhou, B. B., Pei, F., Hu, G., Su, Z., Zeng, Y., Zhang, H., Gao, Y., Luo, M., and Li, X.: Future land use/land cover change has nontrivial and potentially dominant impact on global gross primary productivity, Earth's Future, 10, https://doi.org/10.1029/2021EF002628, 2022.
Houghton, R. A. and Castanho, A.: Annual emissions of carbon from land use, land-use change, and forestry from 1850 to 2020, Earth Syst. Sci. Data, 15, 2025–2054, https://doi.org/10.5194/essd-15-2025-2023, 2023.
Houghton, R. A., House, J. I., Pongratz, J., van der Werf, G. R., DeFries, R. S., Hansen, M. C., Le Quéré, C., and Ramankutty, N.: Carbon emissions from land use and land-cover change, Biogeosciences, 9, 5125–5142, https://doi.org/10.5194/bg-9-5125-2012, 2012.
Hu, X., He, Y., Kong, Z., Zhang, J., Yuan, M., Yu, L., Peng, C., and Zhu, Q.: Evaluation of future impacts of climate change, CO2, and land use cover change on global net primary productivity using a processed model, Land, 10, https://doi.org/10.3390/land10040365, 2021.
Hurtt, G. C., Chini, L., Sahajpal, R., Frolking, S., Bodirsky, B. L., Calvin, K., Doelman, J. C., Fisk, J., Fujimori, S., Klein Goldewijk, K., Hasegawa, T., Havlik, P., Heinimann, A., Humpenöder, F., Jungclaus, J., Kaplan, J. O., Kennedy, J., Krisztin, T., Lawrence, D., Lawrence, P., Ma, L., Mertz, O., Pongratz, J., Popp, A., Poulter, B., Riahi, K., Shevliakova, E., Stehfest, E., Thornton, P., Tubiello, F. N., van Vuuren, D. P., and Zhang, X.: Harmonization of global land use change and management for the period 850–2100 (LUH2) for CMIP6, Geosci. Model Dev., 13, 5425–5464, https://doi.org/10.5194/gmd-13-5425-2020, 2020.
Keeling, R. F., Graven, H. D., Welp, L. R., Resplandy, L., Bi, J., Piper, S. C., Sun, Y., Bollenbacher, A., and Meijer, H. A. J.: Atmospheric evidence for a global secular increase in carbon isotopic discrimination of land photosynthesis, P. Natl. Acad. Sci. USA, 114, 10361–10366, https://doi.org/10.1073/pnas.1619240114, 2017.
Lam, W. Y., Chatterton, J., Sim, S., Kulak, M., Mendoza Beltran, A., and Huijbregts, M. A. J.: Estimating greenhouse gas emissions from direct land use change due to crop production in multiple countries, Sci. Total Environ., 755, https://doi.org/10.1016/j.scitotenv.2020.143338, 2021.
Lavergne, A., Hemming, D., Prentice, I. C., Guerrieri, R., Oliver, R. J., and Graven, H.: Global decadal variability of plant carbon isotope discrimination and its link to gross primary production, Glob. Change Biol., 28, 524–541, https://doi.org/10.1111/gcb.15924, 2022.
Lavergne, A., Harrison, S. P., Atsawawaranunt, K., Dong, N., and Prentice, I. C.: Minimal impact of recent decline in C4 vegetation abundance on atmospheric carbon isotopic composition, Commun. Earth Environ., https://doi.org/10.1038/s43247-025-03102-6, 2026.
Luo, X., Zhou, H., Satriawan, T. W., Tian, J., Zhao, R., Keenan, T. F., Griffith, D. M., Sitch, S., Smith, N. G., and Still, C. J.: Mapping the global distribution of C4 vegetation using observations and optimality theory, Nat. Commun., 15, https://doi.org./10.1038/s41467-024-45606-3, 2024.
Molotoks, A., Stehfest, E., Doelman, J., Albanito, F., Fitton, N., Dawson, T. P., and Smith, P.: Global projections of future cropland expansion to 2050 and direct impacts on biodiversity and carbon storage, Glob. Change Biol., 24, 5895–5908, https://doi.org/10.1111/GCB.14459, 2018.
O'Neill, B. C., Tebaldi, C., van Vuuren, D. P., Eyring, V., Friedlingstein, P., Hurtt, G., Knutti, R., Kriegler, E., Lamarque, J.-F., Lowe, J., Meehl, G. A., Moss, R., Riahi, K., and Sanderson, B. M.: The Scenario Model Intercomparison Project (ScenarioMIP) for CMIP6, Geosci. Model Dev., 9, 3461–3482, https://doi.org/10.5194/gmd-9-3461-2016, 2016.
Ovwemuvwose, J.: CMIP6 Models Analysis Project, in: Biogeosciences, Zenodo [code], https://doi.org/10.5281/zenodo.16883407, 2025.
Peters, W., van der Velde, I. R., van Schaik, E., Miller, J. B., Ciais, P., Duarte, H. F., van der Laan-Luijkx, I. T., van der Molen, M. K., Scholze, M., Schaefer, K., Vidale, P. L., Verhoef, A., Wårlind, D., Zhu, D., Tans, P. P., Vaughn, B., and White, J. W. C.: Increased water-use efficiency and reduced CO2 uptake by plants during droughts at a continental scale, Nat. Geosci., 11, 744–748, https://doi.org/10.1038/s41561-018-0212-7, 2018.
Polley, H. W., Johnson, H. B., and Mayeux, H. S.: Increasing CO2: comparative responses of the C4 grass schizachyrium and grassland invader prosopis, Ecology, 75, https://doi.org/10.2307/1939421, 1994.
Potapov, P., Turubanova, S., Hansen, M. C., Tyukavina, A., Zalles, V., Khan, A., Song, X., Pickens, A., Shen, A., and Cortez, J.: Global maps of cropland extent and change show accelerated cropland expansion in the twenty-first century, Nat. Food, 3, 19–28, https://doi.org/10.1038/s43016-021-00429-z, 2022.
Sellar, A. A., Jones, C. G., Mulcahy, J. P., Tang, Y., Yool, A., Wiltshire, A., O'Connor, F. M., Stringer, M., Hill, R., Palmieri, J., Woodward, S., de Mora, L., Kuhlbrodt, T., Rumbold, S. T., Kelley, D. I., Ellis, R., Johnson, C. E., Walton, J., Abraham, N. L., Andrews, M. B., Andrews, T., Archibald, A. T., Berthou, S., Burke, E., Blockley, E. Carslaw, K., Dalvi, M., Edwards, J., Folberth, G. A., Gedney, N., Griffiths, P. T., Harper, A. B., Hendry, M. A., Hewitt, A. J., Johnson, B., Jones, A., Jones, C. D., Keeble, J., Liddicoat, S., Morgenstern, O., Parker, R. J., Predoi, V., Robertson, E., Siahaan, A., Smith, R. S., Swaminathan, R., Woodhouse, M. T., Zeng, G., and Zerroukat, M.: UKESM1: description and evaluation of the U.K. Earth System Model, J. Adv. Model. Earth Sy., 11, 4513–4558, https://doi.org/10.1029/2019MS001739, 2019.
Silverman, B. W.: Density Estimation for Statistics and Data Analysis, Monographs on Statistics and Applied Probability, 26, Chapman and Hall, London, ISBN 0412246201, https://ned.ipac.caltech.edu/level5/March02/Silverman/paper.pdf (last access: 27 July 2026), 1986.
Smith, T. and Boers, N.: Global vegetation resilience linked to water availability and variability, Nat. Commun., 14, https://doi.org/10.1038/s41467-023-36207-7, 2023.
Still, C. J., Berry, J. A., Collatz, G. J., and DeFries, R. S.: Global distribution of C3 and C4 vegetation: Carbon cycle implications, Global Biogeochem. Cy., 17, 1006, https://doi.org/10.1029/2001GB001807, 2003.
Voldoire, A., Saint-Martin, D., Sénési, S., Decharme, B., Alias, A., Chevallier, M., Colin, J., Guérémy, J. F., Michou, M., Moine, M. P., Nabat, P., Roehrig, R., Salas y Mélia, D., Séférian, R., Valcke, S., Beau, I., Belamari, S., Berthet, S., Cassou, C., Cattiaux, J., Deshayes, J., Douville, H., Ethé, C., Franchistéguy, L., Geoffroy, O., Lévy, C., Madec, G., Meurdesoif, Y., Msadek, R., Ribes, A., Sanchez-Gomez, E., Terray, L., and Waldman, R.: Evaluation of CMIP6 DECK Experiments With CNRM-CM6-1, J. Adv. Model. Earth Sy., 11, 2177–2213, https://doi.org/10.1029/2019MS001683, 2019.
Wang, J., Bretz, M., Dewan, M. A. A., and Delavar, M. A.: Machine learning in modelling land-use and land cover-change (LULCC): Current status, challenges and prospects, Sci. Total Environ., 822, https://doi.org/10.1016/j.scitotenv.2022.153559, 2022.
Winslow, J. C., Hunt Jr., E. R. and Piper, S. C.: The influence of seasonal water availability on global C3 versus C4 grassland biomass and its implications for climate change research, Ecol. Model., 163, 153–173, https://doi.org/10.1016/S0304-3800(02)00415-5, 2003.
Wullschleger, S. D., Epstein, H. E., Box, E. O., Euskirchen, E. S., Goswami, S., Iversen, C. M., Kattge, J., Norby, R. J., Van Bodegom, P. M., and Xu, X.: Plant functional types in earth system models: past experiences and future directions for application of dynamic vegetation models in high-latitude ecosystems, Ann. Bot.-London, 114, 1–16, https://doi.org/10.1093/aob/mcu077, 2014.
Zhao, R., Luo, X., Walker, A. P., Hoffman, F. M., and Koh, L. P.: Vegetation biogeography is a main source of uncertainty in modelling the land carbon cycle, Nat. Communm., https://doi.org/10.1038/s41467-025-67636-1, 2025.
Zscheischler, J., Mahecha, M. D., Von Buttlar, J., Harmeling, S., Jung, M., Rammig, A., Randerson, J. T., Schölkopf, B., Seneviratne, S. I., Tomelleri, E., Zaehle, S., and Reichstein, M.: A few extreme events dominate global interannual variability in gross primary production, Environ. Res. Lett., 9, https://doi.org/10.1088/1748-9326/9/3/035001, 2014.