
the Creative Commons Attribution 4.0 License.
the Creative Commons Attribution 4.0 License.
 | 02 Sep 2026
Stability of stream biofilm community composition to transient shifts in dissolved organic carbon characteristics

Ewen Silvester
Suman Acharya
Aleicia Holland
Michael Shackleton
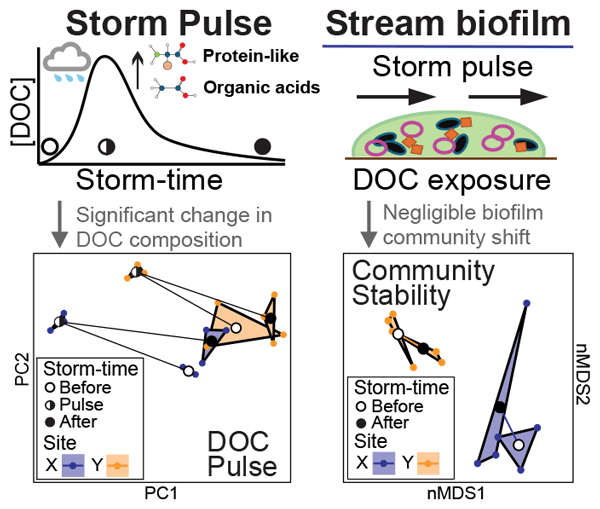
Microbial communities within biofilms are widely recognised as important contributors to ecological food webs and elemental cycles within stream systems. Yet, little is known about how these biofilm communities respond compositionally to storm-event-driven changes in dissolved organic carbon (DOC) characteristics. Alpine headwater peatland-draining streams offer a unique opportunity to investigate this response as these systems are known to export high loads of DOC during storm events, with little further upstream input. This study investigated how sub-alpine peatland-draining stream biofilm composition changed in response to storm-event-driven pulses of DOC. It was found that during the peak of each DOC pulse, the composition of DOC changed to include increased contributions of organic acids, protein-like substances and microbially derived DOC. Despite this change in DOC composition, the composition of most biofilm microbial communities did not significantly shift following each pulse; rather, differences in biofilm community composition appeared to be more closely linked to peatland stream site. The findings of this study suggest biofilm microbial communities maintain compositional stability following short-term rapid changes in stream water chemistry, and that site-specific environmental factors may be more important in determining biofilm microbial community composition in sub-alpine headwater peatland-draining streams.
- Article
(1553 KB) - Full-text XML
-
Supplement
(1715 KB) - BibTeX
- EndNote


Peatlands cover approximately 3 % of the global land surface area and are widely recognised for their crucial role in carbon storage (Xu et al., 2018; UNEP, 2022). It is estimated that peatlands may contain more than one third of the world's soil organic carbon (Yu, 2012; Gorham, 1991; Limpens et al., 2008; UNEP, 2022; Xu et al., 2018; Joosten and Clarke, 2002). Peatlands are closely associated with water-rich environments, such as headwater streams, and represent an important source of terrestrially derived dissolved organic carbon (DOC) for downstream aquatic ecosystems (Worrall et al., 2002; Pastor et al., 2003; Campeau et al., 2017; Billett et al., 2006; Aitkenhead et al., 1999; Dillon and Molot, 1997). The export of DOC from peatlands to downstream aquatic networks is closely linked to climate and catchment hydrology (Clark et al., 2007; Leach et al., 2016; Laudon et al., 2011; Worrall et al., 2002; Freeman et al., 2001; Pastor et al., 2003). In particular, episodic high-intensity precipitation (storm) events have been shown to have a strong influence on the mobilisation and export of DOC, with many studies reporting pulses of DOC associated with storm flows from peatland dominated catchments (Karis et al., 2016; Clark et al., 2007; Austnes et al., 2010; Hope et al., 1994; Dinsmore et al., 2013). The export of DOC from peatland catchments to downstream aquatic ecosystems may be impacted by climate change through increasing temperatures (Freeman et al., 2001; Winterdahl et al., 2016) and changes in precipitation patterns, particularly storm event frequency and intensity (Clark et al., 2007; Austnes et al., 2010; Dinsmore et al., 2013). DOC is critical to aquatic ecosystems, as it provides a source of carbon and chemical energy for biosynthesis and metabolism in aquatic food webs (Boulton et al., 2014; Berggren et al., 2009; Findlay and Sinsabaugh, 2003). Understanding the ecological response of aquatic ecosystems to storm-event-driven pulses of DOC is important for predicting the future trajectory of peatland systems and their impact on downstream aquatic ecosystems under a changing climate.
DOC is a complex mixture of organic compounds, encompassing molecules of various sizes, structures and chemical characteristics (Hope et al., 1994). The composition and characteristics of DOC is strongly influenced by its origin (e.g., source vegetation, peat soil characteristics) and any biogeochemical transformations it may have undergone (Hope et al., 1994; Jones et al., 2016; Pinsonneault et al., 2016; Nelson et al., 1992). The chemical characteristics of DOC can affect its bioavailability for microbial metabolic processes (Berggren et al., 2010; Demars et al., 2020; Guillemette and Del Giorgio, 2011; Boulton et al., 2014). Therefore, it could be expected that microbial community composition may shift in response to the mobilisation and delivery of different characteristic DOC, particularly during storm cycles. Studies have shown that aquatic microbial communities respond to DOC of differing concentrations and characteristics (Fasching et al., 2020; Demars et al., 2020; Berggren and Del Giorgio, 2015; Findlay et al., 2003; Roiha et al., 2016; Olapade and Leff, 2005; Covert and Moran, 2001), potentially driven by the differing bioavailabilities of DOC to microbial organisms (Guillemette and Del Giorgio, 2011; Creed et al., 2018). In stream systems, DOC can originate from in-stream biological production or terrestrially derived organic matter (Hope et al., 1994). The composition (and characteristics) of DOC in streams is highly dependent on hydrological connections between the stream and different source pools of DOC, which can vary with changes in water flow paths (Worrall et al., 2002; Jones et al., 2016; Broder et al., 2017; Limpens et al., 2008). High intensity storm events can raise water tables, increase water discharge, and create transient, surficial flow paths for water, all of which can facilitate the mobilisation DOC from different pools of carbon and lead to changes in DOC composition within the receiving stream (Clark et al., 2007; Branfireun and Roulet, 1998; Schiff et al., 1998; Wagner et al., 2019).
Biofilms (or periphyton) are ubiquitous within stream networks and represent the dominant mode of life for microbial organisms within clearwater streams (Findlay, 2010; Battin et al., 2016; Geesey et al., 1978). Biofilms are composed of complex communities of algae, bacteria and fungi, embedded within a surface associated extracellular polymeric matrix (Battin et al., 2016). Within streams, biofilms are significant sites of organic matter cycling and hotspots of microbial metabolic diversity (Battin et al., 2016; Romani et al., 2004; Besemer, 2015; Dopheide et al., 2015). Biofilms interact with DOC through diffusion and adsorption of DOC from the water column into the biofilm matrix, where it may be decomposed and utilised for energy and biosynthesis (Battin et al., 2008; Logue et al., 2016; Findlay and Sinsabaugh, 2003). Biofilms are an important food source to many higher trophic organisms and represent an important entry point of DOC into the aquatic food web through microbial metabolism (Meyer, 1994; Weitere et al., 2018; Baldwin et al., 2014). Changes in DOC concentration and composition due to high intensity storm events could have important consequences on the overall biogeochemical functions biofilms carry out within stream systems, particularly if the changes in DOC lead to shifts in biofilm community composition (Ylla et al., 2009; Demars et al., 2020; Judd et al., 2006; Besemer, 2015; Zeglin, 2015). Despite this, and the importance of biofilms within stream ecosystems, there are only limited studies that have investigated the impact of storm-event-driven pulses of DOC on stream biofilm microbial community composition, especially within peatland-draining streams.
In this study, the response of sub-alpine peatland stream biofilm communities to a storm-event-driven pulse of DOC, was investigated. This response was investigated at two different time points, late in the Austral Spring and early in the Austral Autumn, across three discrete peatlands and at the broader catchment scale. This study aimed to understand how biofilm microbial community composition in a peatland-draining stream responded to a storm-event-driven pulse of DOC.
2.1 Site description
This study was conducted within the Watchbed Creek catchment (3.35 km2) which is located within the Alpine National Park, near Falls Creek, Victoria, Australia (Lawrence, 1995). This region receives an average annual precipitation depth of 2350 mm (as rain and snow) (Bureau of Meterology, 2022).
The geology and vegetation of the Bogong High Plains area have been described previously (Beavis, 1962; Wahren et al., 1999). Briefly, the underlying bedrock around the Watchbed Creek catchment consists of metamorphosed Ordovician sediments, with the major rock types of the area being gneiss, schists and granites. The vegetation of the Bogong High plains includes areas of subalpine snow gum woodland, tussock grasslands, heathlands, herb fields and peatlands. The Watchbed Creek catchment contains extensive “valley bog” peatlands, the vegetation of which is dominated by Sphagnum cristatum (Sphagnum moss) in association with Dracophyllum continentis (candle heath), Carex sp. (sedge), Empodisma minus (rope rush) and Baeckea gunniana (alpine baeckea) (Lawrence, 1995). Four sites (A–D) within the Watchbed Creek catchment were used to collect water and biofilm samples for this study (Fig. S1 in the Supplement). These sites and associated streams have been the subject of previous studies (see: Karis et al., 2016; Silvester et al., 2021). Sites A–C are situated at drainage points below discrete peatland dominated sub-catchments within the Watchbed Creek catchment, while Site D is located just below a gauging station at the drainage point for the entire Watchbed Creek catchment. Site location details as well as the estimated sizes of the sub-catchments and peatland cover are provided in Table S1, as given by Karis et al. (2016).
2.2 Storm events and sampling regime
This study occurred concurrently with a hydrological study, whereby water and biofilm samples were collected over two high intensity rainfall events, hereafter referred to as Storm Event 1 (SE1) and Storm Event 2 (SE2). A high intensity storm event in this study was defined by a rainfall event with a forecast rainfall total of more than 20 mm within the first 24 h. The commencement of rainfall for each storm event was recorded as “zero storm time” (0 h). To provide a measure of baseflow conditions, all sites were sampled within 24 h prior to zero storm time. After zero storm time, water samples were collected every 6 h for the first 24 h and less frequently in the following days. Biofilm samples were collected twice over each storm event: within 24 h before zero storm time, and 12–16 d after each storm event. During both biofilm collections, concurrent physicochemical water parameter measurements and water samples were also taken. This work primarily focuses on the biological responses of stream biofilm communities. The water quality data used in this study forms part of a larger dataset focused on peatland hydrological response to storm flow, the details of which are reported elsewhere (Acharya, 2023).
SE1 occurred during the Austral Spring and began at 05:05 p.m. AEDT (06:05 a.m. UTC) on 2 November and continued until 8 November 2019. Rainfall during SE1 occurred in two spates; the first occurred from 2 to 3 November 2019 (0–26 h, storm time), and the second occurred over 7 until 8 November 2019 (115–145 h, storm time; Figs. S2 and S3). SE1 delivered a total precipitation depth of 117 mm, with the first spate delivering 57.8 mm and the second spate contributing 59.2 mm. SE2 occurred during the Austral Autumn and began at 03:00 p.m. AEDT (04:00 a.m. UTC) on 3 March and continued until 6 March 2020 (0–36 h, storm time; Figs. S2 and S3). SE2 delivered a total precipitation depth of 143 mm. Negligible additional rainfall occurred in the 2 weeks following SE1 and SE2. Between 8 November 2019 and 3 March 2020 (time between SE1 and SE2), three storm events occurred in the Watchbed Creek catchment that displayed similar rainfall characteristics (> 20 mm rainfall in first 24 h) to SE1 and SE2 (Fig. S3).
2.3 Site instrumentation
At sites A, B and C, 90° v-notch gauging weirs had been previously installed by Karis et al. (2016) and were used to measure stream discharge. At each weir, a TruTrack water height logger (WT-HR 500; TruTrack Ltd, Christchurch, New Zealand) was configured to record water height (stage) at 30 min intervals. Stream discharges for sites A, B and C were calculated from stage heights using a standard v-notch weir equation for a sharp-edged weir (Casey, 1992). It should be noted that the 90° v-notch gauging weirs at sites A, B and C have a discharge capacity of ∼ 68 L s−1 and will underestimate discharges above this value. Discharge at Site D was unable to be calculated for both events due to the gauging station at Site D not functioning during both events.
2.4 Field measurements and sample collection
On each water sampling occasion, three readings of each physicochemical water parameter was taken at each site whilst in the field. The physicochemical water parameters measured were: pH (Metrohm 826 mobile coupled to Metrohm temperature compensated “Aquatrode” pH electrode, Metrohm AG, Switzerland) and electrical conductivity (EC) (Hach HQ40d coupled with a CDC401 probe for EC; Hach, USA). Water samples were collected in triplicate from the overflow point of gauging weirs using acid-washed 1 L Nalgene bottles. Care was taken to triple rinse collection bottles with site water before samples were taken, and bottles were filled so that no air space remained. Each 1 L water sample was subsampled for: (i) dissolved organic carbon (DOC) concentration, (ii) organic acid (OA) content, (iii) fluorescence-absorbance spectroscopy and (iv) size exclusion liquid chromatography. All water subsamples were filtered (0.45 µm cellulose-acetate; Bonnet Equipment) and collected in 30 mL polycarbonate tubes (Sarstedt, Germany) within 6 h of sampling. Prior to subsample collection, filter membranes were initially flushed with 30 mL of sample water, and all sample containers were triple rinsed with sample filtrate. Subsamples collected for optical characterisation of DOC by spectroscopic analysis were wrapped in foil, stored at 4 °C and were analysed within 48 h of collection. All other samples were frozen at −20 °C until analysis.
At each biofilm sampling occasion (sampled immediately prior to and 12–16 d after each storm event), two (triplicate) sets of submerged rocks were collected for: (i) measurement of biofilm biomass and chlorophyll a (chl a) content, and (ii) the determination of biofilm community composition. Care was taken to select rocks that received direct sunlight and were situated within flowing water (non-deposition zones). In the field, biofilm samples were collected by gently scrubbing the upper light-exposed surface of each rock with a sterile toothbrush and rinsing the dislodged material into a 70 mL polypropylene container (Sarstedt, Germany) with autoclaved Milli-Q water. Rocks were not replaced until the study was complete to avoid re-sampling. Rock surface areas were estimated from planar projections. Planar projections were achieved by tracing the scrubbed area using black pen and 1 cm2 gridded transparency paper to determine the surface area sampled. Traces were scanned and saved as images and area (cm2) was calculated using ImageJ (version 1.52a, Wayne Rasband, National institutes of Health, USA). Biofilm samples were stored at −80 °C until analysis.
2.5 Water Sample analyses
2.5.1 Dissolved organic carbon characterisation
DOC concentration (mg-C L−1) was measured using an Analytik Jena 3100 N/C Analyser (DOC range: 0.1–250 mg-C L−1). Loads (mg C s−1) of DOC were calculated using measured DOC concentrations and linearly interpolated discharge values to match water sampling times.
DOC characterisation was conducted using spectroscopic techniques, size exclusion liquid chromatography linked to organic carbon detection (LC-OCD) and liquid chromatography – tandem mass spectroscopy (LC-MS/MS).
Fluorescence excitation emission matrices (EEM) scans and absorbance of each DOC sample were measured using a HORIBA Aqualog fluorimeter (HORIBA Scientific, Kyoto, Japan) in a 1 cm quartz cuvette, using Milli-Q water as a blank. EEMs were measured over excitation wavelengths of 240–450 nm (2 nm intervals) and emission wavelengths of 210–620 nm (1.64 nm intervals). Blank subtraction, inner filter effect correction and scatter removal (1st and 2nd order Raman and Rayleigh) were carried out in MATLAB R2019b (MathWorks, Inc.) using the drEEM toolbox (Murphy et al., 2013). EEM spectra were modelled using parallel factor analysis (PARAFAC) and validated by residual examination, split-half analysis and comparison of individual components to published literature in the OpenFluor database (https://openfluor.lablicate.com/ (last access: 27 August 2026); Murphy et al., 2014). This resulted in a four component PARAFAC model with four components (C1–C4) each related to fulvic-like, terrestrial humic-like, humic-like and protein-like substances, respectively (Table S2). Additionally, three optical metrics were calculated for each sample: specific ultra-violet (UV) absorbance at 254 nm (SUVA254) (Weishaar et al., 2003), spectral slope ratio (SR) (Helms et al., 2009) and the fluorescence index (FI) (Cory and Mcknight, 2005). SUVA254 is a measure of relative DOC aromaticity, with higher values indicating increased aromatic carbon content. SR is inversely related to the relative molecular weight of DOC, with lower values indicating increasing molecular weight. FI serves as an indicator of DOC source, where lower values correspond to terrestrially derived DOC, while higher values suggest microbially derived DOC from in-stream sources (see Table S3 for list of optical metrics measured and definitions). DOC samples were further analysed using LC-OCD following the method outlined by Huber et al. (2011). LC-OCD separates DOC into a hydrophobic component (HOC) and a hydrophilic component which is further separated into five sub-components: (i) biopolymers (BP) (ii) humic substances (HS), (iii) building blocks (BB), (iv) low molecular weight acids (LMWA) and (v) low molecular weight neutrals (LMWN). LWMA is not reported in this study as concentrations were below the limit of detection. Nominal molecular weight of the HS component (Mn) was determined by elution time (see Table S3 for list of LC-OCD components and definitions). LC-OCD data acquisition and chromatogram processing was completed using the ChromCALC software provided by DOC-LABOR, Germany. A full list of all optical metrics and LC-OCD components measured in this study are provided in Table S3.
The organic acids measured in this study were: acetic, fumaric, glycolic, glyoxylic, malic, malonic, pyruvic and succinic acid. Organic acid concentration (ppm) was measured following derivatisation by 3-nitrophenylhydrazine (3-NPH) using LC-MS/MS (Shimadzu Corporation, 2018). The LC-MS/MS system was a Shimadzu Nexera X2 ultra-high pressure liquid chromatograph (UPLC) linked to a Shimadzu 8045 triple quadrupole mass spectrometer, operated in positive ion electrospray ionisation (ESI) mode (Shimadzu Corporation, Kyoto, Japan). Sample blank subtraction was performed in the R software environment (R Core Team, 2021) using the average of three sample blanks.
2.6 Biofilm sample analyses
2.6.1 Biofilm biomass, organic matter content and chlorophyll a
Biofilm samples collected for biomass and chl a measurements were initially homogenised prior to measurement analysis. Each biofilm sample was centrifuged at 3600 rpm for 10 min (Beckman-Coulter Allegra X-15R Centrifuge, rotor type SX4750, Beckman Coulter, Inc. USA) and the supernatant discarded. Following this, the biofilm pellet was transferred to a clean 50 mL polypropylene tube (Sarstedt, Germany) and was homogenised using a tissue homogeniser until no distinct layers were visible (Omni Tissue Homogeniser (TH), Omni International Inc., USA).
Biofilm biomass (mg cm−2) was determined by loss on ignition (LOI), following standard procedures (Rice et al., 2012), using 5 mL of homogenised biofilm sample. Water of hydration was not accounted for. Biofilm chl a content (µg cm−2) was measured by visible spectroscopy (see Supplement for detailed methods). Biofilm chl a content (µg cm−2) was calculated from rock surface areas as per standard procedures (Rice et al., 2012). Both biomass and chl a measurements represent an average per unit area, where higher biomass values are assumed to indicate a thicker and/or denser biofilm. Measurements of biofilm organic biomass and chl a content are provided in the Supplement Sect. S1.
2.6.2 Biofilm community characterisation
Biofilm samples collected for the determination of community composition were centrifuged at 3600 rpm for 10 min (Beckman-Coulter Allegra X-15R Centrifuge, rotor type SX4750, Beckman Coulter, Inc. USA) and the supernatant carefully discarded. After this, the biofilm pellet was transferred to a sterile 2 mL tube (Sarstedt, Germany), further centrifuged at 10 700 rpm for 1 min (Sigma 1-14K Centrifuge, rotor type 12084, Sigma, Germany) and the supernatant discarded.
Biofilm DNA extraction was performed using the DNeasy PowerSoil kit (Qiagen, Germany) following the manufacturer's instructions. If a biofilm sample was large and required multiple DNA extractions, these extractions were pooled by combining 25 µL of each extraction into one sample. DNA concentration (ng µL−1) and purity (A260/280) were measured using a Thermo Scientific NanoDrop 2000 Spectrophotometer (Thermo Fisher Scientific Inc., USA) with MilliQ water used as a blank. DNA samples were stored at −20 °C prior to sequencing.
Amplification and sequencing of the biofilm DNA samples were completed by the sequencing provider MrDNA (Shallowater, Texas, USA). Three DNA metabarcoding regions were amplified from each sample, 16S rRNA V4 variable gene region, 23S rRNA fragment and ITS1-2 internal transcribed spacer region, to target the bacterial, algal and fungal components of the biofilm communities, respectively (primer sequences provided in Table S4). Sequence data processing, zero-radius operational taxonomic unit (zOTU) clustering, and taxonomic assignment were performed using the default data processing pipeline provided by MrDNA. Briefly, sequences were joined and sequences with ambiguous DNA base calls, and/or were less than 150 bp in length, were removed. Following this, sequences underwent quality filtering, using a maximum expected error threshold of 1.0 and were dereplicated. The dereplicated sequences were denoised, whereby sequences identified with sequencing or PCR point errors were removed, followed by chimera removal, providing a denoised sequence or zOTU. These zOTU sequences were taxonomically classified using BLASTn against a curated database derived from National Center for Biotechnology Information (NCBI). For each metabarcoding fragment, a zOTU table was created consisting of unique zOTUs, estimated taxonomic identity and number of sequence-reads per zOTU.
Additional sequence data processing was performed using the R software environment (R Core Team, 2021). Taxonomic identities were revised based on percent homology of the zOTU to the best matched taxonomic assignment. Specifically, taxonomic identities were retained at a specific taxonomic level if the percent homology was: ≥ 97 % for species, ≥ 95 % for genus, ≥ 90 % for family, ≥ 85 % for order, ≥ 80 % for class, phylum and kingdom. Any zOTUs with a percent homology less than 80 % at the taxonomic level of kingdom were removed from the dataset. Following this, any zOTUs that contributed less than 0.05 % to the total sequence read count within a sample or that were singletons (zOTUs that only occurred once in the entire dataset) were filtered from the dataset. Non-target taxa such as metazoans and flowering plants were manually filtered from the dataset. Lastly, the datasets were rarefied using “rrarefy” from the R package vegan (Oksanen et al., 2022) so that each sample contained 10 577 sequence reads, i.e., the smallest number of reads in any of the samples.
2.7 Data analyses
2.7.1 DOC characteristics analyses
The water sample dataset was reduced to three key collection timepoints per site and storm event: Before, Pulse and After. The water sample dataset “Before” and “After” corresponded to water sample data collected concomitantly with biofilm samples, and “Pulse” corresponded to the timepoint with the highest measured DOC concentration (mg-C L−1) (Table S5). During data collection, seven missing water samples corresponded to an exclusion of 55 datapoints from the data set. Missing datapoints were estimated using two or one-point imputation. Outlier detection was performed via visual inspection of draftsmans plots. Potential outliers were investigated, and if necessary, treated as missing data as described earlier. Using this method, three outliers were identified and removed.
Changes in water quality metrics and DOC characteristics over the course of each storm event and each site (A–D) were analysed using principal component analysis (PCA). To reduce the number of parameters and redundancy (multicollinearity) in the water sample dataset prior to PCA analysis, water quality metrics and DOC characteristics with high (r > 0.7) linear pairwise correlations were identified using “findCorrelation” from the package caret (Kuhn, 2008). The cut-off threshold of 0.7 was chosen as variables with a linear correlation of 0.7 or higher are widely considered strongly correlated (Mukaka, 2012; Schober et al., 2018). The “findCorrelation” function returns a vector of parameters that can be removed to reduce the overall pairwise correlations (and redundancy) in a dataset at a given cut-off value (r = 0.7 in this study). Thirteen parameters were identified as correlated by the function at the specified cut-off value (DOC, %C1, %C3, %C4, HS, BP, Glycolic, Malonic, Glyoxylic, Malic, Pyruvic, Succinic and Fumaric acids) and were excluded from the PCA analysis. Importantly, this process identified bulk DOC concentration as strongly correlated (r > 0.7) with several parameters in the water chemistry dataset. Of the parameters retained for the PCA analysis, DOC was most strongly correlated with Electrical Conductivity (conductivity, r = 0.76). Table S6 shows the strongest linear (Pearson's) correlation between an excluded (redundant) parameter and a parameter retained in the reduced water chemistry dataset for PCA analysis. Following the exclusion of redundant parameters, the reduced water chemistry dataset was centred and scaled and PCA analysis was performed using the function “PCA” from the package FactoMineR (Lê et al., 2008).
2.7.2 Biofilm community composition analyses
The average read contribution was determined by calculating the proportion of reads for each phylum in each (rarefied) sample and taking the average of these proportions across all samples within each of the algal, bacterial or fungal datasets. To account for the detection of Cyanobacteria in both the 16S rRNA V4 (bacterial) and 23S rRNA (algal) metabarcoding regions, the cyanobacterial zOTUs from the algal dataset were counted with the bacterial cyanobacterial zOTUs for zOTU richness. Additionally for the average proportions, after calculating the proportion Cyanobacterial zOTUs contributed to the read count total within the 23S dataset, these were averaged with the proportions calculated in the 16S dataset (n = 96). This accounting for Cyanobacteria was only performed for the calculation of zOTU richness and average read count contribution. The diatom phylum Bacillariophyta was only detected within the 16S dataset and is included as part of the bacterial community richness and diversity metrics.
Shannon's diversity (H′) was calculated on the rarefied zOTU data using the function “diversity” from the package vegan (Oksanen et al., 2022) and averaged across replicate samples within each of the algae, bacteria and fungi community datasets.
Prior to multivariate analysis, the rarefied algal, bacterial and fungal zOTU read count datasets were merged into one dataset. A Hellinger transformation was performed on this combined dataset using “decostand” from the package vegan (Oksanen et al., 2022), and Bray-Curtis dissimilarities (Bray and Curtis, 1957) were calculated between samples.
Differences in biofilm community composition amongst sites, storm events and storm time were examined using permutational multivariate analysis of variance (PERMANOVA), non-metric multidimensional scaling (nMDS) ordination and similarity percentages (SIMPER). For the PERMANOVA test, a three-factor fully factorial design was conducted within the PRIMERv7 software environment (PERMANOVA+ version 7.0.21; PRIMER-e Albany, New Zealand). The factors “Event” (two levels: SE1, SE2) and “Storm-time” (two levels: Before, After) were treated as fixed factors and Site (four levels: A–D) was treated as a random factor. Multivariate variation was partitioned using Type 1 (sequential) sums of squares (SS). In a balanced design, Type 1 SS is mathematically equivalent to Type 3 (marginal) SS (Anderson Mj, 2008). The order of fit of model terms was checked and there were no changes in the statistical significance of the terms based on order of fit. Statistical significance was calculated based on 9999 permutations of residuals under a reduced model, with an a priori chosen significance level of α = 0.05. Follow up pairwise comparisons of biofilm communities between the Storm-time levels “Before” and “After” within each level of Event and Site were conducted using the same parameters and significance level as the main PERMANOVA test; however, due to the limited number of unique permutations (10 per comparison), Monte-Carlo p-value estimates were used to assess the statistical significance of each comparison. Homogeneity of variance amongst groups was tested using the PERMDISP routine from PRIMERv7. Differences in biofilm community composition among samples were visualised using nMDS ordination using the function “metaMDS” from the R package vegan. The function was permitted to run up to 100 random starts and repeated three times to find the best global solution.
Two separate SIMPER analyses were conducted to identify zOTUs contributing to dissimilarity in biofilm community composition, using the function “simper” from the R package vegan. The first SIMPER analysis focussed on differences in composition between the “Before” and “After” Storm-time biofilm communities for each site and event. The second SIMPER analysis was performed to explore dissimilarity in biofilm community composition between sites, omitting the factors “Event” and “Storm-time” (i.e. only compared differences between sites A–D). For both SIMPER analyses, the percent proportion of zOTUs identified as contributing to the top 10 % to dissimilarity between each group comparison were summed by class (i.e. examined zOTUs (and classes) contributing to the top 10 % of dissimilarity between groups).
To investigate if any water quality (WQ) metrics and DOC characteristics were correlated with biofilm community composition amongst sites, WQ metrics and DOC characteristics were fitted a posteriori onto the biofilm community nMDS ordination using the function “envfit” from the package vegan. Prior to applying the “envfit” function, the water sample dataset was reduced to two water sample collection timepoints: Before and After (i.e. those collected concomitantly with biofilm samples) and the WQ and DOC characteristic variables were averaged across replicate samples. Note, all measured water quality metrics and DOC characteristic parameters were used as “envfit” fits each vector independently. The significance of each fitted vector was assessed using 9999 permutations of the environmental variables coupled with an a priori chosen significance level of α = 0.05. All other data analyses were performed in R. All figures were generated using the R package ggplot2 (Wickham, 2016) and further formatted using Adobe Illustrator 2023. A data processing and analysis workflow is provided in Fig. S4.
3.1 Discharge and Dissolved Organic Carbon Pulse
Hydrographs for sites A, B and C for both events are shown in Fig. S5, no discharge data was available for Site D. Stream discharge rapidly increased after the commencement of rainfall, with Site A experiencing the largest relative increase in discharge from baseflow to peak stormflow during both storm events. During SE1, peak stormflow across sites A, B and C occurred within the first spate of rainfall, 19.5–20.5 h after zero storm time. Stream discharge at sites A, B and C increased by factors of 83, 7.2 and 8.0 from baseflow to peak stormflow, respectively (Table S7). During SE2, peak stormflow across sites A, B and C occurred 23.5–24.5 h after zero storm time, and stream discharge at these sites increased from baseflow to peak stormflow by factors of 113, 70 and 60, respectively (Table S7). Discharge at sites B and C exceeded weir plate capacity (∼ 68 L s−1) during both events, thus peak discharges at these sites during both events were likely higher than that calculated from the v-notch weir equation.
Co-occurring with the rise and fall of discharge was an increase and decrease in the concentration of DOC (mg-C L−1) across all sites, with Site A also experiencing the greatest relative increase in DOC concentration during both storm events (Fig. S6; Table S7). During SE1, the concentration of DOC at sites A, B, C and D increased by factors of 3.7, 2.2, 2.0 and 3.5 from baseflow to maximum concentration observed during the storm cycle, respectively (Table S7). Sites A and D experienced a greater increase in the concentration of DOC during SE2 relative to SE1, with sites A, B, C and D experiencing an increase in DOC concentration by factors of 29, 3.3, 3.3 and 9.1, respectively (Table S7). Notably, the elevated DOC concentrations observed at each site following SE1 and SE2 did not decay at the same rate as discharge, suggesting each site experienced a period of DOC rich conditions following each storm event (compare Figs. S5 and S6).
DOC loads (mg C s−1) also increased and decreased at sites A, B and C (no data for Site D), following discharge and DOC concentration, with Site A experiencing the greatest relative change in DOC loads during both storm events (Table S7). During SE1, DOC loads increased from baseflow to peak stormflow by a factor of 238, 10 and 8.2 at sites A, B and C, respectively. The relative increase of DOC loads during SE2 was greater than SE1, with loads at sites A, B and C increasing by factors of 3550, 296 and 262, respectively. The change in DOC loads represents a substantial increase in the export of DOC from the (sub)catchments of these sites during both events. Importantly, samples for DOC concentration were collected near but not at peak storm discharge, therefore the maximum DOC loads described here could be underestimated, especially at sites B and C where stream discharge exceeded weir plate capacity.
3.2 Water Quality and DOC characteristics
PCA analysis of the reduced water chemistry dataset (see Tables S6, S8) suggested that samples from both events and all four sites separated into two main groups: samples collected during the storm pulse and samples collected before or after each storm event (Fig. 1; Table S8).
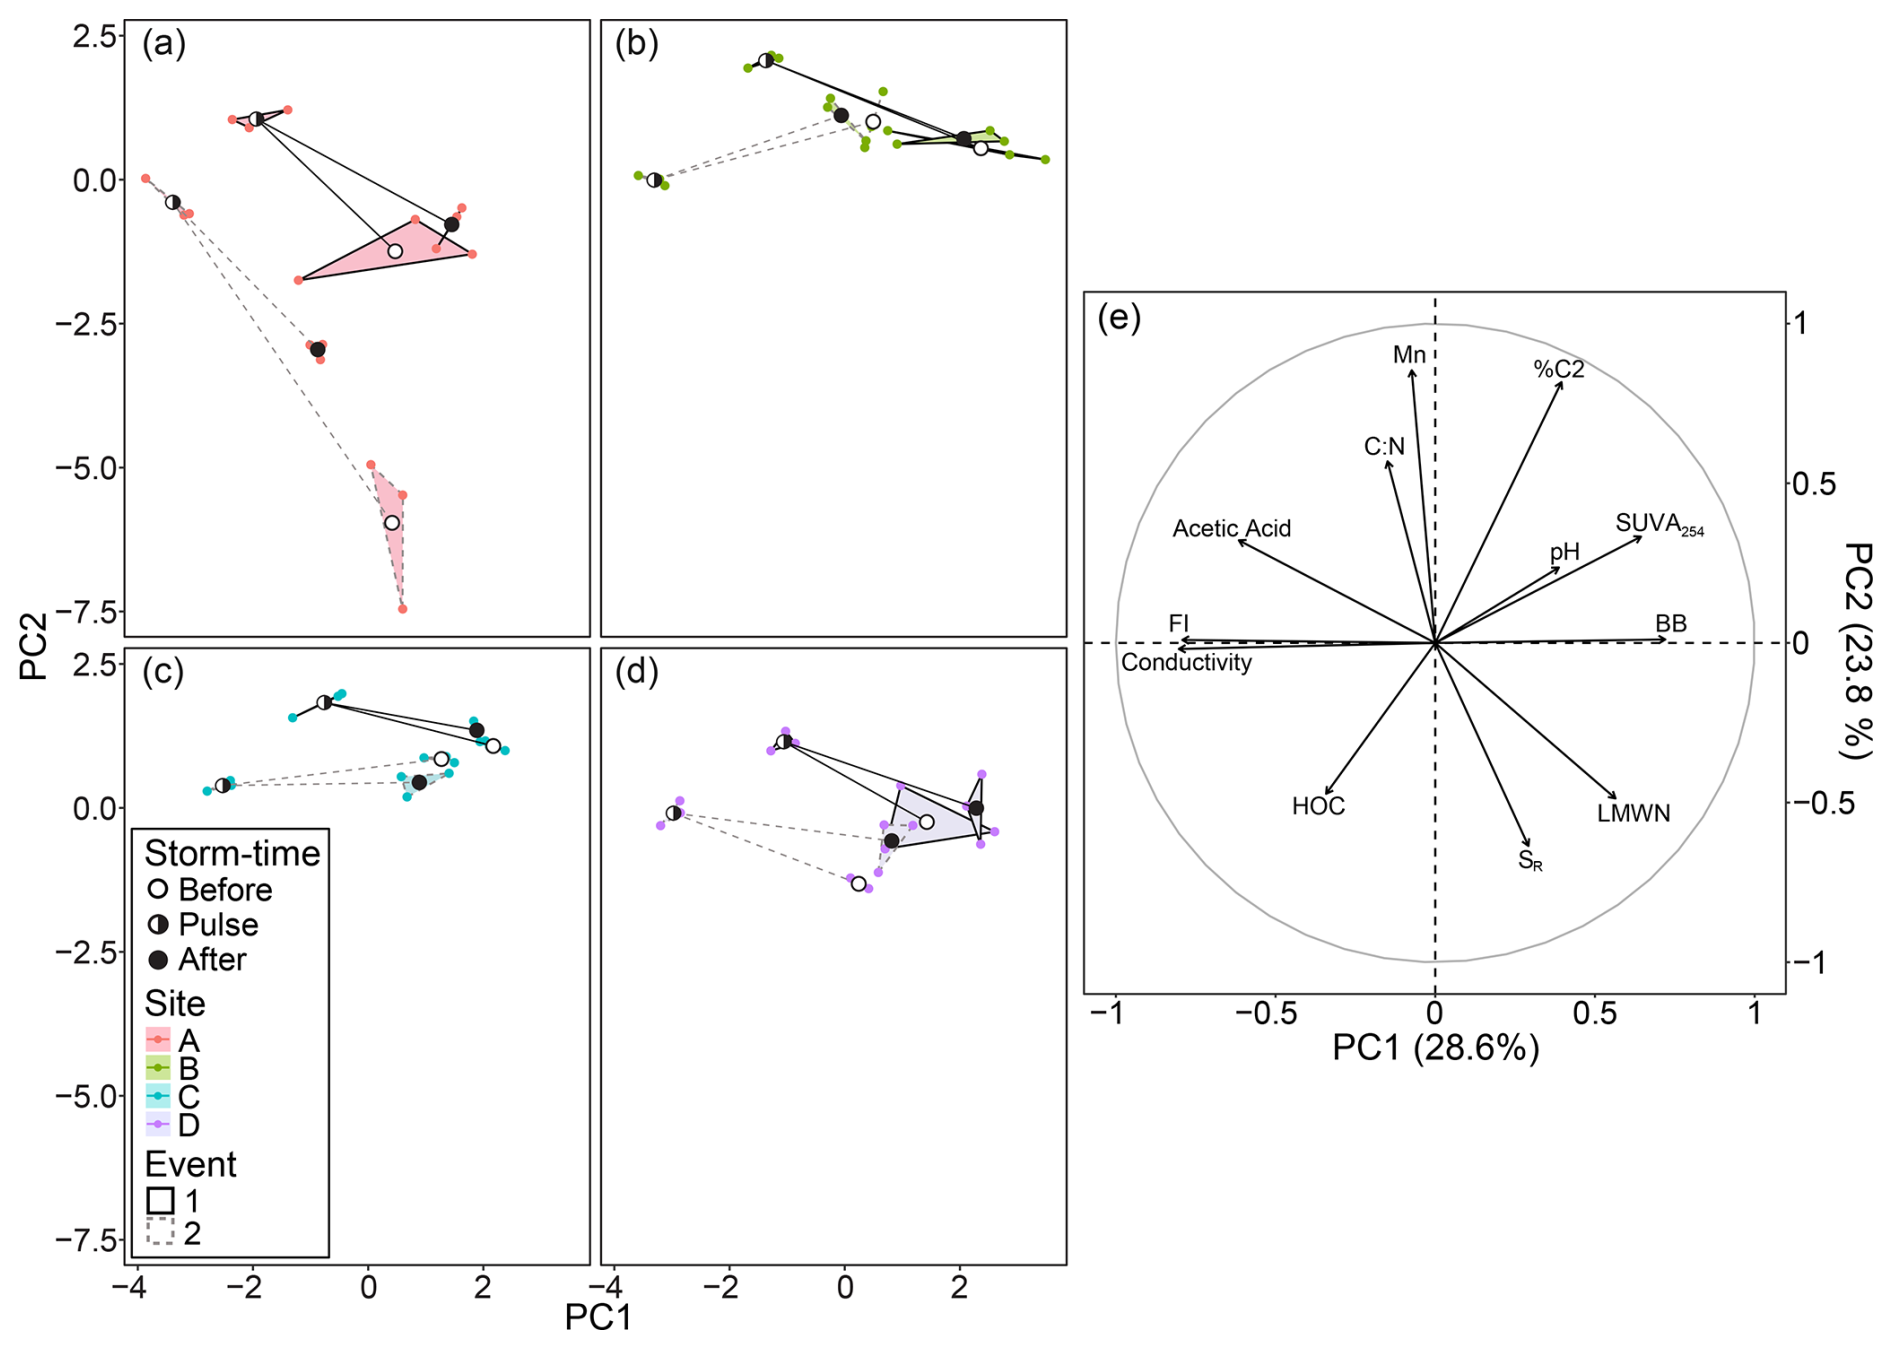
Figure 1Principal component analysis (PCA) of water quality (WQ) metrics and dissolved organic carbon (DOC) characteristics from samples collected before, during the peak of the storm pulse (at maximum DOC concentration), and after Storm Event 1 and 2, across sites A–D. Each site has been plotted individually but were analysed within the same PCA ordination space: (a) Site A, (b) Site B, (c) Site C and (d) Site D; (e) correlation plot of Principal Component 1 (PC1) and Principal Component 2 (PC2) with WQ and DOC characteristic variables. Sites are represented by colour; storm event by line-type; and samples collected “before”, during the “pulse” or “after” a storm event (Storm-time) are denoted by an open, semi or closed circle, respectively. Replicate water samples are clustered within convex hulls. See Table S3 for parameter definitions and see Table S6 for list of variables that were highly correlated with (redundant) a parameter included in the PCA analysis (and excluded from the analysis).
Broadly, the changes in water chemistry amongst groups displayed analogous responses across all sites and both events, with principal component 1 (PC1) and principal component 2 (PC2) explaining 28.6 % and 23.8 % of the variation amongst the samples, respectively (Fig. 1; Table S8). The samples collected during the pulse, relative to those collected before or after, were characterised by increases in electrical conductivity (pulse of charged ions), bulk DOC concentration (DOC pulse) and higher concentrations (ppm) of organic acids (all excluded organic acids were positively correlated with acetic acid or conductivity; see Table S6 for correlations and Table S8 for variable contributions to principal components). Additionally, the spectroscopic characteristics of the DOC during the pulse shifted to include more microbially derived substances (FI) and protein-like DOC (negatively correlated with % C2; r = −0.79) and less aromatic (SUVA254) humic-like (%C2; %C3) and fulvic-like (%C1) substances (Tables S6, S8), relative to samples collected before or after each storm event. Interestingly, within the before and after group, most samples collected after the pulse (except at Site C during SE2) were characterised with higher molecular weight DOC, C:N ratios and greater proportions of %C2, possibly indicating a trailing high molecular weight terrestrial humic-like signal following each storm pulse event (Silvester et al., 2021).
In addition to an increase in microbially derived material and organic acid concentration (Fig. 1; Table S8), DOC composition at Site A during both pulses experienced a greater shift towards increasing contributions of higher molecular weight DOC and DOC with greater C:N ratios, relative to all other sites. There were no notable differences in DOC composition between events except that samples collected during SE1 (in November) generally appeared to contain higher molecular weight DOC (Mn and SR), with greater C:N ratios compared to samples collected during SE2 (in March), possibly due to SE2 occurring at the end of the growing season.
3.3 Biofilm community
3.3.1 Biofilm community, diversity and abundance
Sequences from the biofilm algal (23S), bacterial (16S) and fungal (ITS) communities clustered into a total of 1975 unique zOTUs, representing 28 distinct phyla. Among these phyla, Proteobacteria, Ascomycota and Rhodophyta displayed the greatest zOTU richness within each of the biofilm bacterial, algal and fungal community groups, respectively (Fig. 2a). These phyla also contributed the greatest proportion of sequence reads per biofilm sample within their respective communities (Fig. 2b). Notably, the diversity and abundance of the phylum Cyanobacteria may be overestimated as zOTUs from this taxonomic group were detected by both the 16S (bacterial) and 23S (algal) metabarcoding regions (see Sect. 2.7.2 for details). The diatom phylum Bacillariophyta, was only detected within the 16S dataset and the percent contribution of zOTUs from this phylum is calculated as part of the 16S community data.
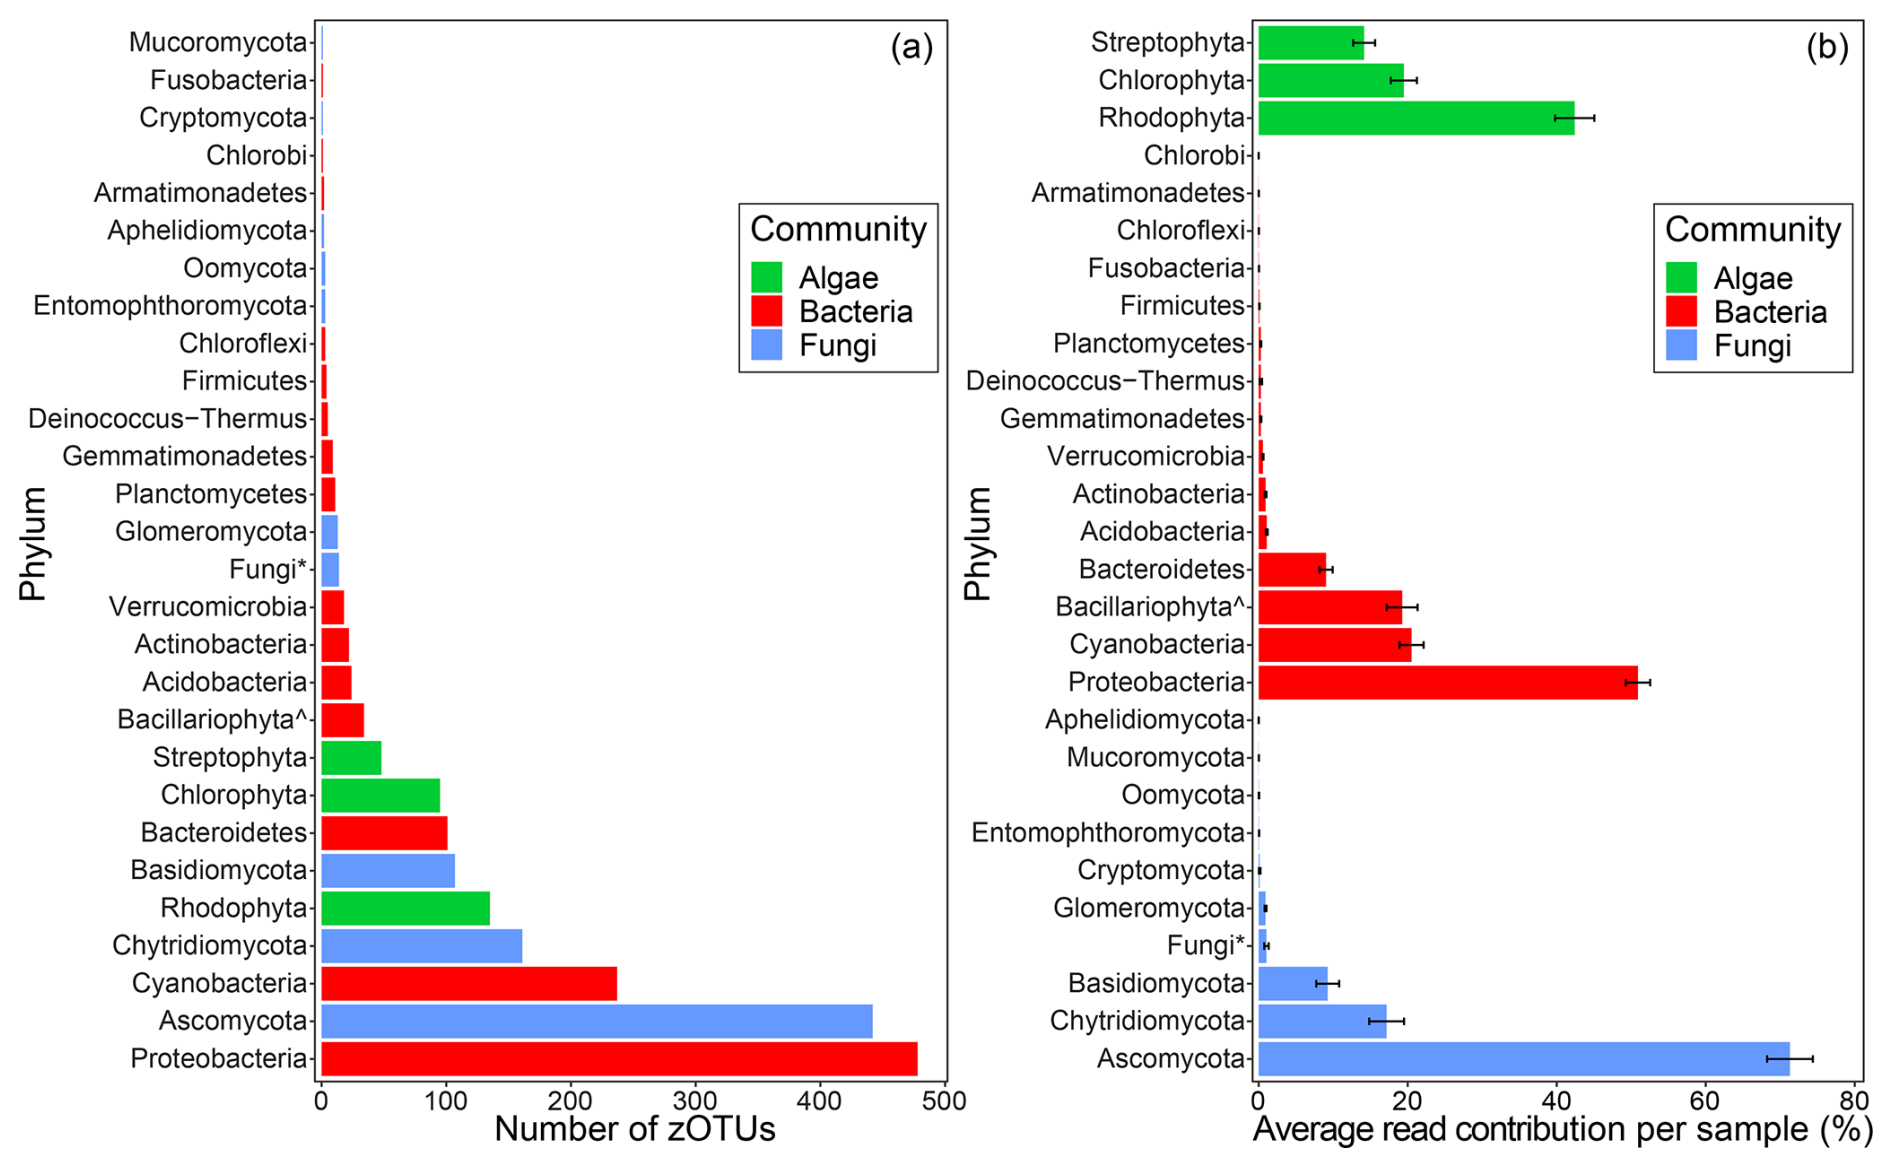
Figure 2Bar plot showing: (a) number of unique zero-radius operational taxonomic units (zOTUs) per phylum across all biofilm samples and (b) average percent proportion of reads each phylum contributed to biofilm samples within each sequencing dataset (community). Bars are coloured by biofilm community. Error bars represent ±1 SE of the mean. The “*” indicates a generic agglomerated phylum, where the taxonomy of the zOTU could not be resolved beyond kingdom; the “∧” highlights Bacillariophyta (diatoms).
3.3.2 Biofilm biomass and chl a response to a storm event
Average biofilm biomass (normalised to area) ranged between 0.22 (±0.06) to 4.65 (±2.35) mg cm−2 across all samples (in the Supplement Sect. S1). Average biofilm biomass decreased at sites A and B and increased at sites C and D following SE1 and decreased at all sites following SE2. Average biofilm chl a content (normalised to area) ranged between 0.21 (±0.08) to 6.43 (±2.43) µg cm−2 (see Supplement Sect. S1). Biofilm chl a content decreased at Site A and increased at all other sites following SE1, and decreased at sites A, B and D and increased at Site C following SE2.
3.3.3 Biofilm community compositional response to a storm event
Shannon's diversity indices indicated that biofilm algal, bacterial and fungal zOTU community diversity was relatively consistent across each storm event, with two notable exceptions observed at sites A and C after SE2 (Fig. 3; Table S9). At Site A, biofilms displayed a reduction in algal diversity after SE2, while bacterial and fungal community diversity did not appear to vary greatly. At Site C, biofilms displayed a reduction in both algal and bacterial community diversity, accompanied by an increase in fungal diversity after SE2. These shifts in biofilm community diversity were not observed at either site after SE1. Interestingly, biofilms at Site A consistently displayed reduced fungal diversity and relatively higher algal diversity compared to other sites, suggesting site-specific variations in biofilm community diversity. Additionally, across all sites and events, the diversity of the biofilm bacterial community at each site was generally higher relative to the algal and fungal communities, keeping in mind zOTUs from Bacillariophyta (diatoms) are also contributing to biofilm bacterial community diversity.
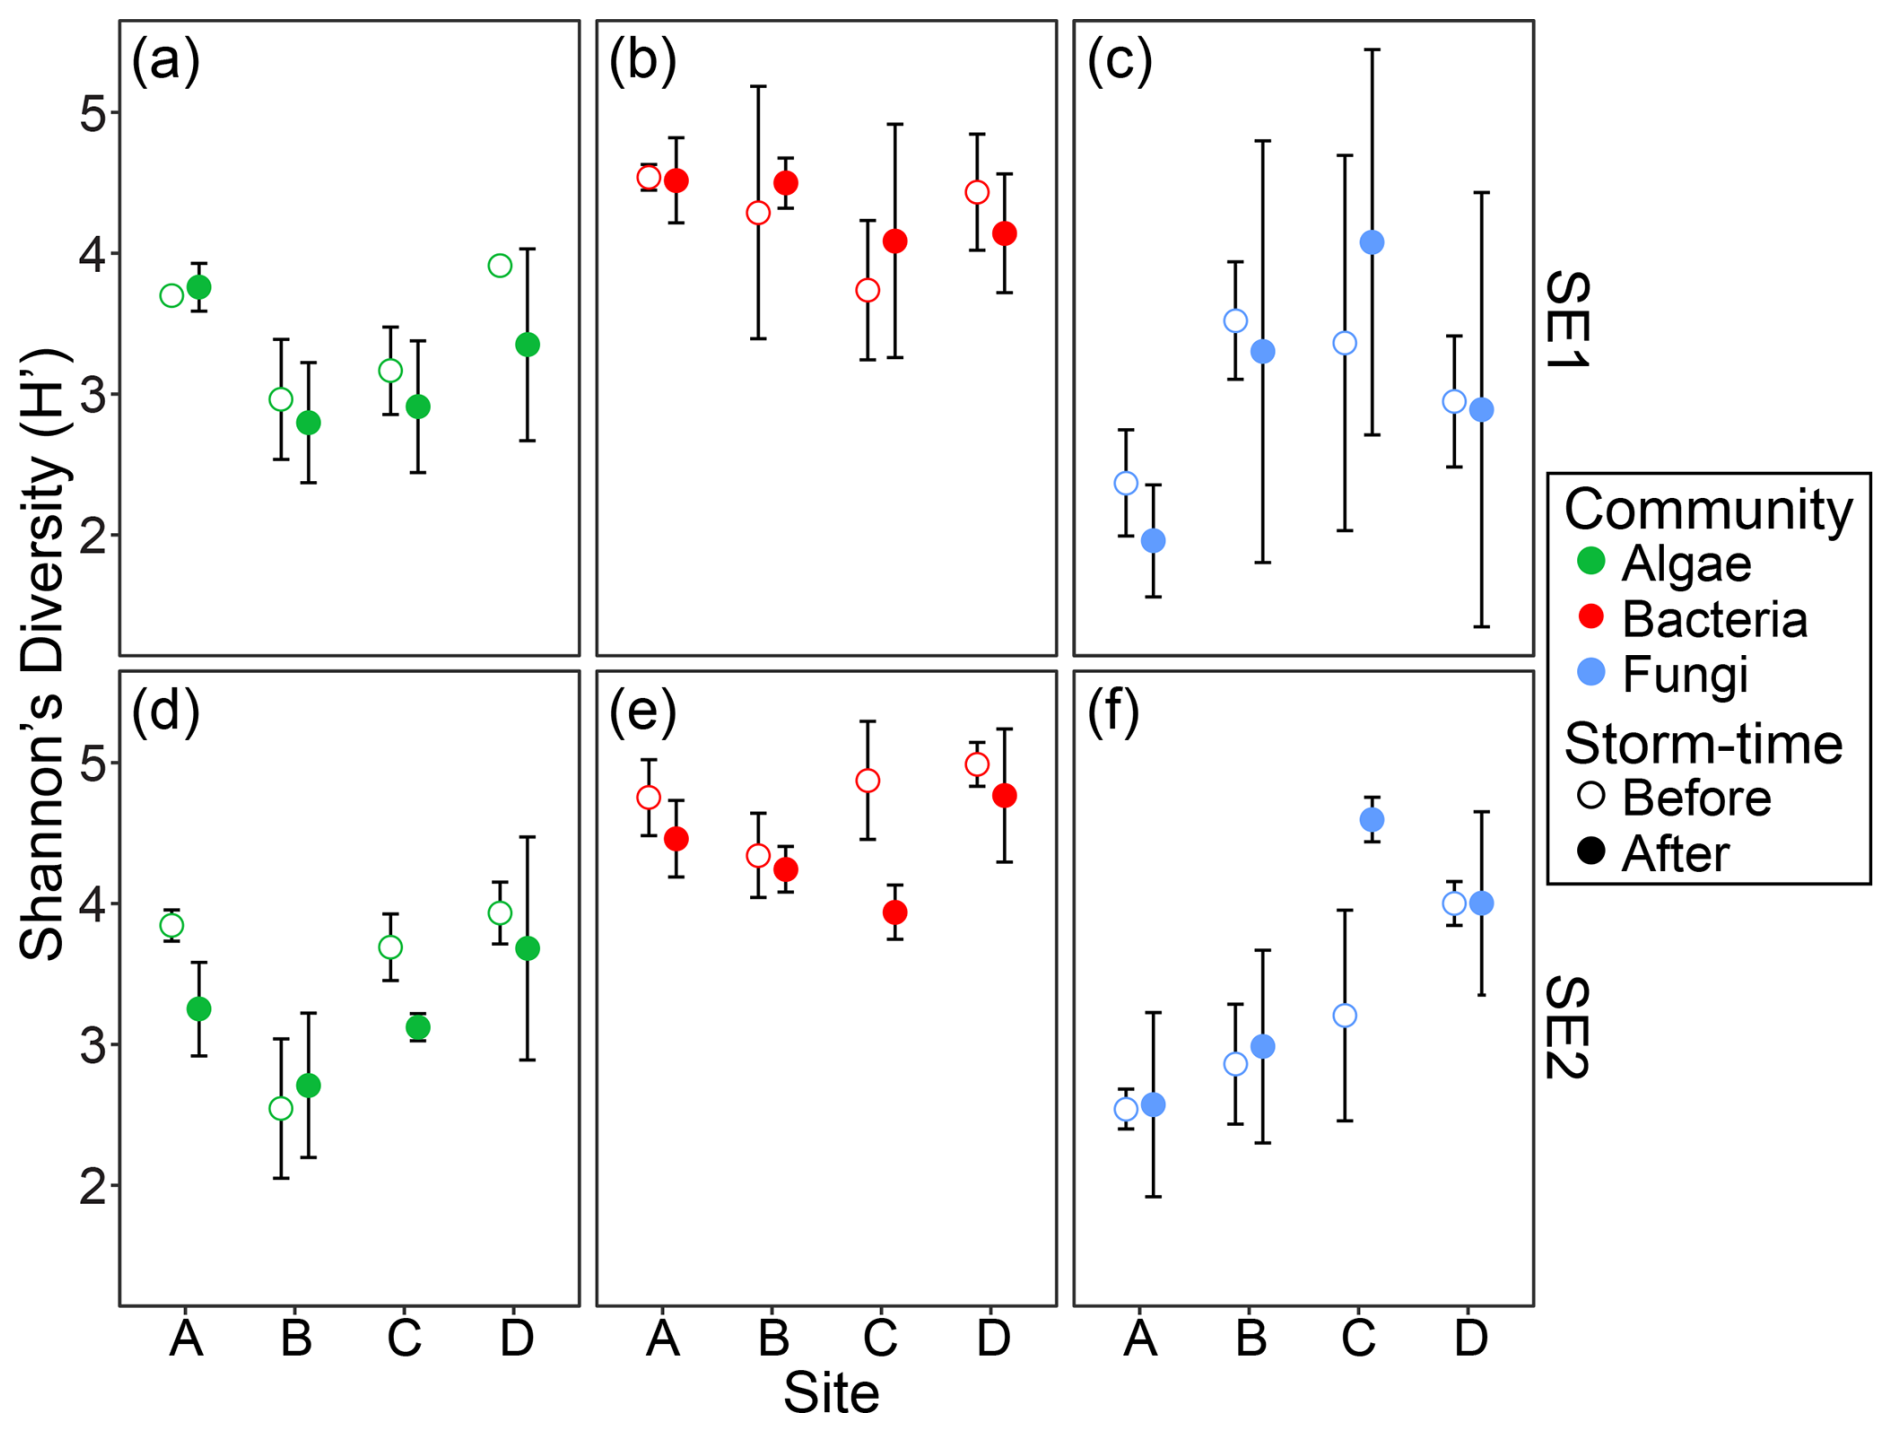
Figure 3Average Shannon's diversity (H′) of biofilm algal (green), bacterial (red) and fungal (blue) zOTU communities before (open circle) and after (closed circle) a storm event at sites A–D. Averages were calculated using zOTU H′ scores of three replicate biofilm samples. Top row: biofilm (a) algal, (b) bacterial and (c) fungal zOTU community diversity before and after Storm Event 1 (SE1). Bottom row: biofilm (d) algal, (e) bacterial and (f) fungal biofilm zOTU community diversity before and after Storm Event 2 (SE2). Error bars ±2* standard error (n= 3); where error bars are absent, standard error was less than the width of the symbol.
To assess shifts in whole biofilm community composition following storm-event-driven pulses of DOC at each site, the biofilm algal, bacterial, and fungal community datasets were combined and subsequently analysed as a complete biofilm community dataset.
A significant three-way interaction influencing biofilm community composition was detected amongst the factors Event, Site and Storm-time (PERMANOVA: p-value < 0.001; df = 3; Table S10). PERMDISP indicated multivariate dispersion between groups was statistically non-significant (PERMDISP: p-value > 0.05; Table S11). Notably, any lower order terms within the PERMANOVA model that included Site as a factor displayed small p-values (p< 0.05) (Table S10). This is important to consider as the significance of the three-way interaction on biofilm community composition may largely be driven by the contribution of Site, with smaller contributions from the factors Event and Storm-time. The effect of Site on biofilm community composition is also reflected in the nMDS ordination (Fig. 4a), with biofilm community composition (after grouping by replicate samples) strongly clustering by Site, relative to the factors Event or Storm-time.
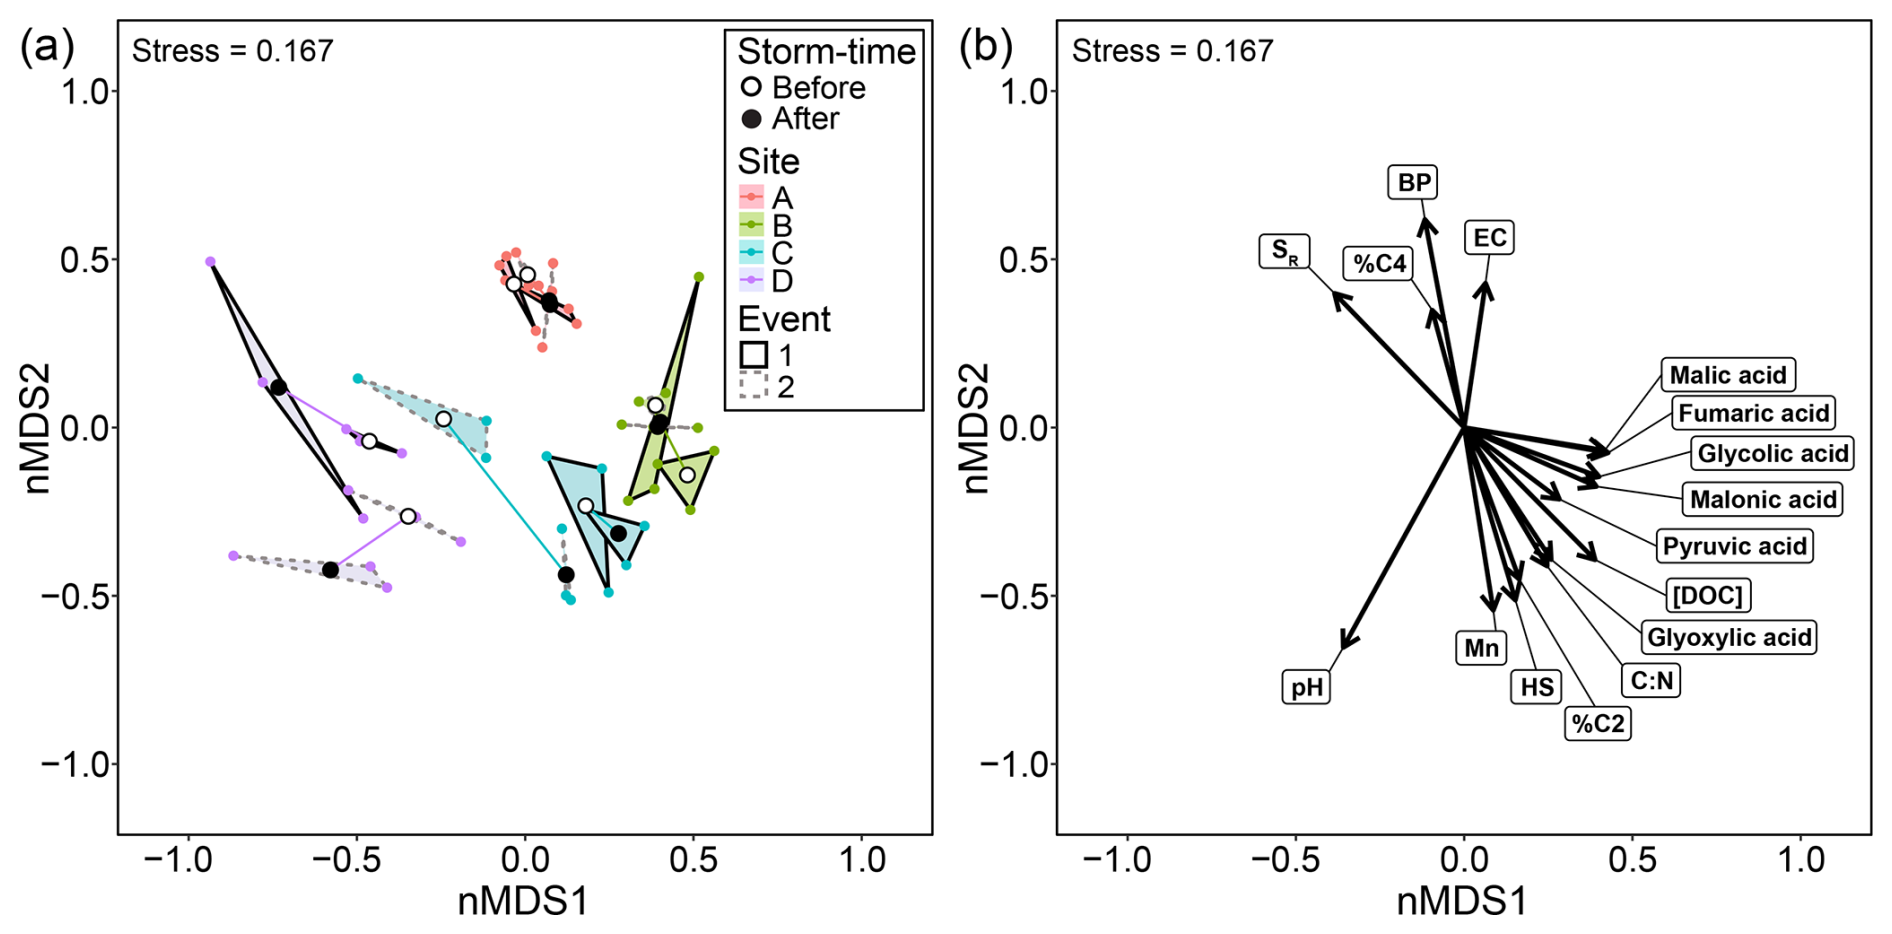
Figure 4Biofilm community variation across Storm-time, Site and Event, and statistically significant environmental variables correlated with biofilm community variation. (a) Non-metric multidimensional scaling (nMDS) ordination among biofilm samples. Sites are represented by colour, storm event by line-type and Storm-time “before” and “after” an event are denoted by an open and closed circle respectively. Replicate biofilm samples are clustered within convex hulls. (b) a posteriori fitted environmental variables statistically significantly correlated (p-value < 0.05) with variation in biofilm community composition relative to the nMDS ordination. Arrows are scaled to strength of correlation. Note that increasing molecular weight is inversely related to the vector direction of SR. See Table S3 for descriptions of water quality and dissolved organic carbon characteristics.
Follow-up pairwise comparisons between the Storm-time levels “Before” and “After” within each Site and Event indicated a statistically significant shift in biofilm community composition at sites C and D after SE2 (pairwise PERMANOVA: p-value < 0.05; Table S12). All other pairwise comparisons were statistically non-significant. The shift in biofilm community composition at Site C following SE2 is also indicated in the nMDS ordination (Fig. 4a), with biofilm samples collected before SE2 clearly distinct from those collected after the storm event. At Site D, the community composition of biofilm samples collected before and after SE2, were more clearly separated relative to the shifts in composition before and after SE1 at the same site. This could explain why community shifts over storm time at Site D for SE1 were not detected as statistically significant in the pairwise comparisons.
The overall dissimilarity between biofilm communities collected before and after SE2 differed by 52.1 % and 48.2 % at sites C and D, respectively. Specifically at Site C, 12 zOTUs from 8 taxonomic classes were identified as contributing to the top 10 % of dissimilarity between biofilm communities collected before and after SE2. Notably, zOTUs from the class Florideophyceae collectively contributed 2.64 % of the top 10 % of dissimilarity between biofilm communities collected before and after SE2 at Site C, with the contribution representing a general increase in the relative abundance of this taxonomic group following SE2 (Fig. S7). At Site D, 19 zOTUs from 10 classes contributed to the top 10 % of dissimilarity between biofilm communities collected before and after SE2. Of the zOTUS contributing to the top 10 % of dissimilarity between biofilm communities collected before and after SE2 at Site D, zOTUs from the class Chytridiomycetes accounted for 2.8 % (Fig. S7). This contribution to dissimilarity generally represented a loss of zOTU diversity within the Chytridiomycetes, with 4 of the 6 zOTUs of this class not detected at Site D after SE2. In general, there were no obvious patterns in the zOTUs (or classes) contributing to differences in biofilm community composition Before and After SE2 at sites C and D.
3.3.4 Differences in biofilm community composition amongst sites
An unexpected finding from this study was that Site contributed the greatest amount of variation to biofilm microbial community composition within the Watchbed Creek catchment (Fig. 4a). Estimates of the components of variation for each term within the PERMANOVA model indicated that Site was the largest contributor to variation in community composition amongst biofilm samples relative to all other terms (Table S10). The importance of Site on biofilm community composition is also observed in Fig. 4a where, following grouping by replicate sample, biofilm community composition strongly clustered by Site. On average, overall dissimilarity amongst biofilm communities at different peatland stream sites was 62.0 %, with the lowest dissimilarity between sites B and C at 55.3 % the highest between sites B and D at 67.7 %. This is also indicated by the nMDS ordination, where among sites, the strongest similarity in biofilm community composition is between sites B and C (smallest separation), and the greatest dissimilarity is between sites B and D (largest separation) (Fig. 4a).
Across all site-by-site comparisons, 43 unique zOTUs from 16 classes contributed to the top 10 % of biofilm community compositional differences (Fig. S8). Of these, zOTUs from the classes Cyanobacteria, Dothideomycetes, Eurotiomycetes, Zygnemophyceae and Florideophyceae were important contributors to the top 10 % of dissimilarity amongst all site comparisons (Fig. S8). Comparing biofilm communities between sites B and D, zOTUs from the class Cyanobacteria collectively contributed 2.8 % of the top 10 % of dissimilarity, with the relative abundance of four out of six of these zOTUs higher at Site D compared to Site B. Interestingly, bacterial classes were poorly represented in the top 10 % of dissimilarity between sites, accounting for 3 of 16 classes, potentially suggesting either a more uniform distribution across all sites or most individual bacterial zOTUs (or classes) only contributed a very small amount to dissimilarity relative to other taxa. On average, individual zOTUs did not contribute more than 1 % to biofilm community dissimilarity among sites, suggesting that differences in biofilm community composition amongst peatland stream sites may be driven by small variations in the presence and abundance of multiple taxa. In general, there were no obvious patterns in the zOTUs (or classes) contributing to dissimilarity amongst sites.
3.3.5 Correlations between WQ and DOC parameters and biofilm community composition.
Envfit analysis indicated that sixteen WQ and DOC characteristic parameters were statistically significantly correlated (p-value < 0.05) with biofilm community composition (Fig. 4b; see Table S13). Biofilm community composition at sites B and C were correlated with higher concentrations of DOC ([DOC]) and the organic acids malic, fumaric, glycolic, malonic, pyruvic and glyoxylic, relative to communities at sites A and D. The DOC characteristics correlated with biofilm communities at sites B and C suggested that the composition of DOC at these sites may be of higher molecular weight (Mn), include greater proportions of humic-like substances (%C2, HS) and DOC with greater C:N ratios, relative to other sites. Biofilm community composition at Site A was correlated with higher electrical conductivity and DOC characterised by protein-like substances, low molecular weight DOC (SR: inversely correlated with molecular weight) and biopolymers (BP), relative to other sites. Biofilm community composition at Site D was correlated with increasing pH, relative to sites A, B and C. No increases in DOC characteristics were correlated with biofilm community composition at Site D relative to other sites; however, Site D is situated at the drainage point of the Watchbed Creek catchment, and the composition of DOC at this site could represent an average of the entire catchment. These correlations suggest that the variation in biofilm community composition amongst sites could be driven by differences in DOC composition (concentration and characteristics) and ionic compound concentrations.
This study aimed to determine if peatland-draining stream biofilm community composition changed in response to storm-event-driven pulses of DOC. During each storm event at each site, DOC concentration (mg-C L−1) and load (mg-C s−1) rapidly increased, following stream discharge (Table S7; Figs. S5 and S6). These changes were accompanied by shifts in DOC composition, with the peak of the DOC pulse characterised by higher inputs of organic acids and a change in DOC source to include microbially derived materials, relative to baseflow (Fig. 1). Despite the shifts in DOC composition over storm time, stream biofilm community composition did not significantly change after exposure to the storm-event-driven pulses of DOC, except for at sites C and D after SE2, suggesting stability in these communities towards transient short-term storm pulses of DOC (Fig. 4; Table S10). However, stream biofilm community composition was found to differ amongst peatland stream sites (Fig. 4a), suggesting that site-specific environmental variables may have a greater influence on shaping the composition of these communities (Fig. 4b).
4.1 DOC storm pulse
A pulse of DOC was observed across all sites during both storm events, with the magnitude of the pulse greater in SE2 than SE1 (Fig. S6; Table S7). The DOC pulse during each event was characterised by a rapid increase in DOC concentration, following stream discharge, with maximum DOC concentrations occurring near peak stormflow at each site (Figs. S5 and S6; Table S7). DOC loads at sites A–C followed a similar pattern to DOC concentration, increasing with stream discharge and reaching a maximum load near peak stormflow. The delivery of DOC (concentration and load) to the peatland-draining streams during the rising limb of each storm event could be explained by the activation of transient subsurface flow paths, facilitated by increasing water table height, mobilising DOC deposited within higher layers of the peat soil profile during high-flow events (Worrall et al., 2002; Karis et al., 2016; Austnes et al., 2010; Campeau et al., 2017). This is supported by the findings of a previous DOC storm pulse study within the same catchment, where maximum DOC concentrations and loads also occurred near peak storm flow, coinciding with maximum water table height within these systems (Karis et al., 2016). Further to this, a companion study of the same storm event (Silvester et al., 2021), found that carbon to nitrogen (C:N) ratios of the DOC pulse on the rising limb changed with water table height, and the changes were consistent with C:N ratios measured within higher layers of the peat soil profile. The mobilisation of DOC sourced from higher layers of the peat soil profile during high flow events has also been observed in other peatland systems (Campeau et al., 2017; Austnes et al., 2010).
Notably, after peak stormflow, DOC concentration on the falling limb at each site appeared to decline at a slower rate than stream discharge following SE2. The elevated DOC concentrations persisted at each site for more than 2 d after stream discharge appeared to return to baseflow (compare Figs. S4 and S6). This observation was less distinct in SE1 possibly due to the second spate of rainfall that occurred during this event (Figs. S2 and S6). The slower decline in DOC concentration compared to stream discharge is important to consider, as it suggests that stream biofilm microbial communities were exposed to the DOC pulse for longer than stream discharge alone would suggest.
Associated with the changes in DOC concentration were shifts in DOC composition over the course of the storm cycles that were similar across sites and events (Fig. 1). Specifically, at the peak of the DOC pulse there was a relatively higher abundance of organic acids and microbially derived material, while post-pulse DOC was dominated by humic-like substances with higher aromaticity (Fig. 1). Two possible explanations for the changes in DOC composition during each storm cycle are: (i) water flow paths likely changed under high flow to include the upper peat soil profile (Campeau et al., 2017; Worrall et al., 2002; Austnes et al., 2010; Karis et al., 2016; Silvester et al., 2021; Yusuf et al., 2024) and; (ii) the peat soil matrix may act as its own molecular sieve by separating highly mobile DOC fractions, such as low molecular weight organic acids, amino acids etc., from slower moving larger fractions, such as high molecular weight humic-like substances (Silvester et al., 2021). The observed changes in DOC composition during each storm event suggest that stream biofilm microbial communities across the Watchbed Creek catchment were exposed to transient shifts in DOC concentration and chemical characteristics over the course of each DOC pulse, relative to the composition present before each storm event.
4.2 Biofilm community composition responses to a storm pulse of DOC
Most of the stream biofilm microbial communities did not show a significant shift in composition following the storm-event-driven pulses of DOC, despite the changes in DOC composition over the course of each DOC pulse (Fig. 4; Table S12). It is important to consider that the biofilm communities may have responded within the Before and After sampling interval, or the biofilm communities may have responded metabolically (O'Donnell and Hotchkiss, 2022; Hallberg et al., 2024) without any significant shifts to composition (Battin et al., 2016), leading to the observed stability following a storm event. Future studies could address these gaps by sampling 3 and/or 7 d post storm event and include meta-transcriptomic (RNA) analyses to compare differences in gene expression between biofilm communities before and after a storm event. Despite these study limitations, there are several other more compelling reasons that could explain the observed biofilm community stability following a storm event.
Potentially biofilm microbial communities may need to be exposed to DOC with specific characteristics for a certain length of time before undergoing a change in composition, which may not have occurred during the storm-event-driven pulse of DOC. Previous studies, exploring changes in microbial community composition associated with DOC of different characteristics and sources, observed these changes after exposing the microbial communities to the same DOC over the course of several days to weeks (Judd et al., 2006; Findlay et al., 2003; Docherty et al., 2006). For example, Findlay et al. (2003) found differences between bacterial community compositions of hyporheic biofilms after exposing the biofilms to labile (glucose mixture) or recalcitrant (tannic acid) DOC for several weeks. Docherty et al. (2006) found the composition of pelagic bacterial communities shifted to become more similar to the composition of the communities associated with a given source of DOC. However, these changes were observed after the communities had been incubated with the given source DOC for 72 h. Further to this, studies measuring microbial activity often report lags in activity following the addition of a new DOC source (Judd et al., 2006; Docherty et al., 2006), possibly suggesting a period of adjustment to the new carbon source before changes in community composition may take place. In the present study, during both storm events, the stream biofilm communities were exposed to a pulse of DOC with rapidly changing characteristics and composition (Fig. 1), with the peak of the pulse occurring approximately 1 d after the storm began (Fig. S6). In addition to the rapid changes in DOC composition, the increased rates of stream discharge during the storm pulse likely led to shorter water residency times, especially during the peak of the DOC pulse when discharge was at its highest. Studies investigating the response of whole stream metabolism to changes in discharge (including storm events) found that stream metabolism transiently responded to changes in stream flow (O'Donnell and Hotchkiss, 2019, 2022; Hallberg et al., 2024). Importantly, O'Donnell and Hotchkiss (2022), found that stream gross primary production transiently decreased following a storm event while ecosystem respiration was more resilient. This could be attributed to differences in biological demand for carbon and energy between autotrophs and heterotrophs at the time of the event (Hallberg et al., 2024). Building on this, if biological demand for carbon or energy is low at the time of a DOC pulse, biofilm communities may need to be exposed the altered DOC composition for longer before showing a response either metabolically or compositionally. Coupled together, the short residency time of water and rapidly changing composition of DOC observed in the present study, may have combined to produce very short exposure times of a given composition of DOC to the stream biofilm communities during the event. In turn, this may have left most of the stream biofilm communities with insufficient time to compositionally respond to the changes in DOC characteristics and concentration during each storm-event-driven pulse of DOC. The ecological implications of this are that stream biofilm communities may generally maintain compositional stability to rapid transient variations in carbon supply associated with high intensity storm events due to not having enough time to respond to the changes occurring during the pulse.
Another possible explanation for why most of the stream biofilm communities did not show a significant shift in composition following the DOC pulse could be that the biofilm matrix may have acted as a buffer to variations in DOC composition. Previous studies, particularly Freeman and Lock (1995) and Battin et al. (1999), suggested that the biofilm matrix could sustain bacterial heterotrophic metabolism without an external supply of DOC. Freeman and Lock (1995) found that bacterial heterotrophic activity within riverine biofilms could be stimulated by the addition of inorganic nutrients without an external supply of DOC. Moreover, the stimulated activity did not appear to be utilising known intracellular sources of carbon, suggesting that biofilm bacteria may have been accessing DOC captured and stored within the biofilm matrix or decomposing the matrix itself. Battin et al. (1999) found that biofilms with higher concentrations of extracellular polymeric substances (EPS or biofilm matrix) immobilised and retained more DOC. Additionally, microbial activity within biofilms with more EPS was slower to respond to the addition of DOC compared to those with lower EPS concentrations. Importantly, after the supply of DOC ceased, microbial activity generally continued for longer in biofilms with more EPS before plateauing, potentially indicating the utilisation of carbon from within the biofilm matrix. In the context of this study, throughout each storm cycle and associated DOC pulse, the stream biofilm communities may have continued accessing carbon substrates stored within the biofilm matrix, especially if the biofilm matrix hinders DOC diffusion and mass transfer rates. The importance of this is that the characteristics of this internal supply may continue to reflect DOC present before each storm event, potentially leading to minimal or no compositional response within the stream biofilm microbial communities.
Despite the composition of most of the biofilm communities not significantly changing in response to storm-event-driven pulses of DOC, two communities at sites C and D did show a statistically significant shift in composition following SE2. The overall dissimilarity between biofilm community composition before and after SE2 was 52.1 % and 48.2 % at sites C and D, respectively. The difference in composition at these two sites after SE2 appeared to be driven by a collective contribution of small differences in many taxa rather than larger changes in a few taxa. It is unclear why the composition of the biofilm communities at these specific sites shifted following SE2, especially as the changes in DOC composition were similar across the two storm events (Fig. 1). A potential explanation is that the composition of the biofilm community may have been responding to a latent environmental variable that coincided with the occurrence of SE2, or the composition may have naturally drifted over time (Lear et al., 2008). It is possible that at sites C and D the magnitude and/or timing of storm event was enough to shift community composition such as through shearing or scouring (Sousa, 1979). However, this was difficult to determine in this study as not all biofilms that underwent potential scouring (displayed an increase in chl a content and decrease in biomass, or a reduction in both) showed a significant shift in community composition following a storm event (in the Supplement Sect. S1). This could be explained by natural biofilms accumulating variable amounts of externally derived organic (detrital) material within the matrix, that will contribute to differences in biomass weight estimates but are unrelated to biofilm community composition.
4.3 Dissimilarity in biofilm community composition across Watchbed Creek catchment
In this study, the greatest differences in biofilm microbial community composition were observed amongst sites (Fig. 4a), suggesting site-specific environmental variables, such as DOC composition and water quality, may have an important influence on biofilm community structure (Fig. 4b). Several water quality and DOC characteristics were correlated with the variation in biofilm community composition amongst sites including pH and EC, bulk DOC and organic acid concentrations, DOC molecular weight and C:N ratios, and differences in DOC spectroscopic characteristics (humic or protein-like content) (Fig. 4b). While no direct links have been made in this study between differences in biofilm community composition and DOC characteristics, it is likely on a site-by-site basis, persistent long-term differences in DOC characteristics and water quality may influence the community composition of stream biofilms amongst sites within the Watchbed Creek catchment. For example, biofilm communities at Site A were associated with higher ionic concentrations (higher EC), and a composition of DOC that had higher concentrations of biopolymers (BP), was lower in molecular weight (SR) and was more proteinaceous in nature, relative to other sites (Fig. 4). It has been well established that the characteristics of DOC can influence microbial community composition (Covert and Moran, 2001; Judd et al., 2006), including within biofilms (Findlay et al., 2003; Olapade and Leff, 2006); however, these differences may be dependent on longer term exposure to DOC of a specific composition. The composition of DOC itself is highly influenced by landscape factors such as hydrological connection (Laudon et al., 2011; Inamdar and Mitchell, 2006; Broder et al., 2017), vegetation type (Harms et al., 2016; Pinsonneault et al., 2016) and the extent of the vegetation type coverage within the stream catchment (Kothawala et al., 2015). It could be possible that differences in site-specific environmental variables, such as the coverage of peatland vegetation within the stream catchment (Table S1), may be indirectly shaping biofilm community composition by influencing instream DOC characteristics and composition. This could in part explain the dissimilarity in biofilm community composition detected amongst sites as individual taxa respond to site-specific differences in DOC composition and water quality variables (see Fierer et al., 2007). This has important implications, particularly if the composition of DOC reflects aspects of peatland condition (for example see Herzsprung et al., 2017), as biofilm community composition could be used to assess peatland health and condition.
The results of this study suggest that after 12–16 d, stream biofilm microbial community composition in the Watchbed Creek catchment did not significantly shift in response to the changing characteristics of a DOC pulse associated with a high intensity storm event, in most cases. This outcome could be attributed to the rapid compositional shifts in DOC with specific characteristics and short water residency times during the storm-event driven-DOC pulses. The stability of biofilm community composition following high intensity storm events and associated pulses of DOC is crucial to recognise, as it suggests that with the predicted changes in the frequency and intensity of storm events under a warming climate, these communities may be resilient to short-term intense changes in stream water chemistry. Future studies could build on this work by investigating how quickly a storm event driven DOC pulse passes stationary points within a stream and calculate exposure time as the length of time between when a change in DOC composition is detected to when the compositional components of interest return to pre-storm conditions and compare this to changes in biofilm community composition. Additionally, future studies could investigate the stability of stream biofilms to repeat storm events that could lead to a shift in community composition. However, the feasibility of this type of experiment is entirely dependent upon receiving a series of storms where this can be tested within any given study period. The greatest differences in biofilm community composition were detected amongst peatland stream sites, potentially related to longer-term site-specific differences in water quality and DOC composition. To better understand these influences, future studies should examine how seasonal changes in DOC composition within peatland streams correlate with shifts in biofilm microbial community composition. Understanding how these communities respond to longer term seasonal changes in DOC composition could provide valuable insight on how these communities may respond to climate change driven shifts in the landscape. Moreover, understanding the links between peatland-draining stream DOC and biofilm community composition could facilitate the development of biomonitoring tools that are able to assess peatland condition.
The data and code that supports the findings of this study are openly available in the Supplement of this article and in OPAL at https://doi.org/10.26181/29757092 (Lines et al., 2025). The sequence data supporting this study are openly available in NCBI's GenBank Sequence Read Archive (SRA) (https://www.ncbi.nlm.nih.gov/genbank, last access: 6 August 2025), reference number PRJNA1301096.
The supplement related to this article is available online at https://doi.org/10.5194/bg-23-6019-2026-supplement.
OL: Field sampling, Sample Measurements, Data curation, Formal Analysis, Visualisation, Writing – original draft, review and editing; ES: Supervision, Conceptualisation, Funding Acquisition, Field Sampling, Writing – Review and editing; SA: Field Sampling, Sample Measurements, Data curation, Formal Analysis (PARAFAC components), Writing – Review and editing; AH: Conceptualisation, Funding Acquisition, Field Sampling, Writing – Review and editing; MS: Supervision, Conceptualisation, Field Sampling, Formal Analysis, Writing – Review and editing. All authors approved the final version.
The contact author has declared that none of the authors has any competing interests.
Publisher's note: Copernicus Publications remains neutral with regard to jurisdictional claims made in the text, published maps, institutional affiliations, or any other geographical representation in this paper. The authors bear the ultimate responsibility for providing appropriate place names. Views expressed in the text are those of the authors and do not necessarily reflect the views of the publisher.
The authors of this study are grateful to Dr. Marti Anderson for her suggestions and advice on the PERMANOVA model used in this study. This study was carried out under a National Parks research permit: No. 10005653. The field work in the Alpine National Park has been assisted through on-ground support from Falls Creek Resort Management and Parks Victoria (Alpine National Park, Mount Beauty).
This work was funded by Australian Heritage Trust: Peatland condition and headwater aquatic ecosystems: beyond sponges (grant no. AHG75117). OL was supported by an Australian Research Training Program (RTP) scholarship.
This paper was edited by Pierre Amato and reviewed by two anonymous referees.
Acharya, S.: Molecular Characterisation of Dissolved Organic Matter (DOM) in Australian Freshwaters: Sources and Bioavailability, Doctoral Thesis, La Trobe, Australia, https://doi.org/10.26181/25744911.v1, 2023.
Aitkenhead, J., Hope, D., and Billett, M.: The relationship between dissolved organic carbon in stream water and soil organic carbon pools at different spatial scales, Hydrol. Process., 13, 1289–1302, 1999.
Anderson, M. J., Gorley, R. N., and Clarke, K. R.: PERMANOVA+ for PRIMER: Guide to Software and Statistical Methods, PRIMER-E, Plymouth, UK, https://learninghub.primer-e.com/books/permanova-for-primer-guide-to-software-and-statistical-methods/page/01-title-page, (Last access: 27 August 2026), 2008.
Austnes, K., Evans, C. D., Eliot-Laize, C., Naden, P. S., and Old, G. H.: Effects of storm events on mobilisation and in-stream processing of dissolved organic matter (DOM) in a Welsh peatland catchment, Biogeochemistry, 99, 157–173, https://doi.org/10.1007/s10533-009-9399-4, 2010.
Baldwin, D. S., Whitworth, K. L., and Hockley, C. L.: Uptake of dissolved organic carbon by biofilms provides insights into the potential impact of loss of large woody debris on the functioning of lowland rivers, Freshwater Biol., 59, 692–702, 2014.
Battin, T. J., Butturini, A., and Sabater, F.: Immobilization and metabolism of dissolved organic carbon by natural sediment biofilms in a Mediterranean and temperate stream, Aquat. Microb. Ecol., 19, 297–305, 1999.
Battin, T. J., Kaplan, L. A., Findlay, S., Hopkinson, C. S., Marti, E., Packman, A. I., Newbold, J. D., and Sabater, F.: Biophysical controls on organic carbon fluxes in fluvial networks, Nat. Geosci., 1, 95–100, https://doi.org/10.1038/ngeo101, 2008.
Battin, T. J., Besemer, K., Bengtsson, M. M., Romani, A. M., and Packmann, A. I.: The ecology and biogeochemistry of stream biofilms, Nat. Rev. Microbiol., 14, 251, https://doi.org/10.1038/nrmicro.2016.15, 2016.
Beavis, F. C.: The geology of the Kiewa area, P. R. Soc. Victoria, 75, 349–410, 1962.
Berggren, M. and del Giorgio, P. A.: Distinct patterns of microbial metabolism associated to riverine dissolved organic carbon of different source and quality, J. Geophys. Res.-Biogeosci., 120, 989–999, 2015.
Berggren, M., Laudon, H., and Jansson, M.: Hydrological control of organic carbon support for bacterial growth in boreal headwater streams, Microb. Ecol., 57, 170–178, 2009.
Berggren, M., Laudon, H., Haei, M., Ström, L., and Jansson, M.: Efficient aquatic bacterial metabolism of dissolved low-molecular-weight compounds from terrestrial sources, The ISME Journal, 4, 408–416, 2010.
Besemer, K.: Biodiversity, community structure and function of biofilms in stream ecosystems, Res. Microbiol., 166, 774–781, https://doi.org/10.1016/j.resmic.2015.05.006, 2015.
Billett, M. F., Deacon, C. M., Palmer, S. M., Dawson, J. J. C., and Hope, D.: Connecting organic carbon in stream water and soils in a peatland catchment, J. Geophys. Res.-Biogeo., 111, https://doi.org/10.1029/2005JG000065, 2006.
Boulton, A., Brock, M., Robson, B., Ryder, D., Chambers, J., and O'Neill, J.: Australian Freshwater Ecology Processes and Management, 2nd edn., Wiley, ISBN:9781118568194, 2014.
Branfireun, B. A. and Roulet, N. T.: The baseflow and storm flow hydrology of a precambrian shield headwater peatland, Hydrol. Process., 12, 57–72, https://doi.org/10.1002/(SICI)1099-1085(199801)12:1<57::AID-HYP560>3.0.CO;2-U, 1998.
Broder, T., Knorr, K.-H., and Biester, H.: Changes in dissolved organic matter quality in a peatland and forest headwater stream as a function of seasonality and hydrologic conditions, Hydrol. Earth Syst. Sci., 21, 2035–2051, https://doi.org/10.5194/hess-21-2035-2017, 2017.
Bureau of Meteorology: Climate Data Online – Daily Rainfall for Station 083043 (Rocky Valley), https://www.bom.gov.au/climate/data/ (last access: 20 June 2022), 2022.
Campeau, A., Bishop, K. H., Billett, M. F., Garnett, M. H., Laudon, H., Leach, J. A., Nilsson, M. B., Öquist, M. G., and Wallin, M. B.: Aquatic export of young dissolved and gaseous carbon from a pristine boreal fen: implications for peat carbon stock stability, Glob. Change Biol., 23, 5523–5536, 2017.
Casey, T. J.: Water and wastewater engineering hydraulics, Oxford University Press, Oxford, UK, ISBN:0198563604, 1992.
Clark, J. M., Lane, S. N., Chapman, P. J., and Adamson, J. K.: Export of dissolved organic carbon from an upland peatland during storm events: Implications for flux estimates, J. Hydrol., 347, 438–447, https://doi.org/10.1016/j.jhydrol.2007.09.030, 2007.
Cory, R. M. and McKnight, D. M.: Fluorescence spectroscopy reveals ubiquitous presence of oxidized and reduced quinones in dissolved organic matter, Environ. Sci. Technol., 39, 8142–8149, 2005.
Covert, J. S. and Moran, M. A.: Molecular characterization of estuarine bacterial communities that use high-and low-molecular weight fractions of dissolved organic carbon, Aquat. Microb. Ecol., 25, 127–139, 2001.
Creed, I. F., Bergström, A.-K., Trick, C. G., Grimm, N. B., Hessen, D. O., Karlsson, J., Kidd, K. A., Kritzberg, E., McKnight, D. M., Freeman, E. C., Senar, O. E., Andersson, A., Ask, J., Berggren, M., Cherif, M., Giesler, R., Hotchkiss, E. R., Kortelainen, P., Palta, M. M., Vrede, T., and Weyhenmeyer, G. A.: Global change-driven effects on dissolved organic matter composition: Implications for food webs of northern lakes, Glob. Change. Biol., 24, 3692–3714, https://doi.org/10.1111/gcb.14129, 2018.
Demars, B. O., Friberg, N., and Thornton, B.: Pulse of dissolved organic matter alters reciprocal carbon subsidies between autotrophs and bacteria in stream food webs, Ecol. Monogr., 90, https://doi.org/10.1002/ecm.1399, 2020.
Dillon, P. and Molot, L.: Effect of landscape form on export of dissolved organic carbon, iron, and phosphorus from forested stream catchments, Water Resour. Res., 33, 2591–2600, 1997.
Dinsmore, K., Billett, M., and Dyson, K.: Temperature and precipitation drive temporal variability in aquatic carbon and GHG concentrations and fluxes in a peatland catchment, Glob. Change Biol., 19, 2133–2148, 2013.
Docherty, K. M., Young, K. C., Maurice, P. A., and Bridgham, S. D.: Dissolved organic matter concentration and quality influences upon structure and function of freshwater microbial communities, Microb. Ecol., 52, 378–388, 2006.
Dopheide, A., Lear, G., He, Z., Zhou, J., and Lewis, G. D.: Functional gene composition, diversity and redundancy in microbial stream biofilm communities, PLoS One, 10, https://doi.org/10.1371/journal.pone.0123179, 2015.
Fasching, C., Akotoye, C., Bižić, M., Fonvielle, J., Ionescu, D., Mathavarajah, S., Zoccarato, L., Walsh, D. A., Grossart, H. P., and Xenopoulos, M. A.: Linking stream microbial community functional genes to dissolved organic matter and inorganic nutrients, Limnol. Oceanogr., 65, S71–S87, 2020.
Fierer, N., Morse, J. L., Berthrong, S. T., Bernhardt, E. S., and Jackson, R. B.: Environmental Controls On The Landscape-Scale Biogeography Of Stream Bacterial Communities, Ecology, 88, 2162–2173, https://doi.org/10.1890/06-1746.1, 2007.
Findlay, S.: Stream microbial ecology, Journal of the North American Benthological Society, 29, 170–181, 2010.
Findlay, S. and Sinsabaugh, R. L.: Aquatic ecosystems interactivity of dissolved organic matter, 1st edn., Academic Press, ISBN: 1-281-31142-1, 2003.
Findlay, S. E., Sinsabaugh, R. L., Sobczak, W. V., and Hoostal, M.: Metabolic and Structural Response of Hyporheic Microbial Communities to Variations in Supply of Dissolved Organic Matter, Limnol. Oceanogr., 48, 1608–1617, https://doi.org/10.4319/lo.2003.48.4.1608, 2003.
Freeman, C. and Lock, M. A.: The biofilm polysaccharide matrix: a buffer against changing organic substrate supply?, Limnol. Oceanogr., 40, 273–278, 1995.
Freeman, C., Evans, C. D., Monteith, D. T., Reynolds, B., and Fenner, N.: Export of organic carbon from peat soils, Nature, 412, 785–785, https://doi.org/10.1038/35090628, 2001.
Geesey, G., Mutch, R., Costerton, J., and Green, R.: Sessile bacteria: An important component of the microbial population in small mountain streams 1, Limnol. Oceanogr., 23, 1214–1223, 1978.
Gorham, E.: Northern peatlands: role in the carbon cycle and probable responses to climatic warming, Ecol. Appl., 1, 182–195, 1991.
Guillemette, F. and del Giorgio, P. A.: Reconstructing the various facets of dissolved organic carbon bioavailability in freshwater ecosystems, Limnol. Oceanogr., 56, 734–748, 2011.
Hallberg, L., Bernal, S., and Bieroza, M.: Seasonal variation in flow and metabolic activity drive nitrate and carbon supply and demand in a temperate agricultural stream, J. Geophys. Res.-Biogeo., 129, https://doi.org/10.1029/2024JG008308, 2024.
Harms, T. K., Edmonds, J. W., Genet, H., Creed, I. F., Aldred, D., Balser, A., and Jones, J. B.: Catchment influence on nitrate and dissolved organic matter in Alaskan streams across a latitudinal gradient, J. Geophys. Res.-Biogeo., 121, 350–369, 2016.
Helms, J. R., Stubbins, A., Ritchie, J. D., Minor, E. C., Kieber, D. J., and Mopper, K.: Absorption spectral slopes and slope ratios as indicators of molecular weight, source, and photobleaching of chromophoric dissolved organic matter, Limnol. Oceanogr., 53, 955–969, https://doi.org/10.4319/lo.2008.53.3.0955, 2009.
Herzsprung, P., Osterloh, K., von Tümpling, W., Harir, M., Hertkorn, N., Schmitt-Kopplin, P., Meissner, R., Bernsdorf, S., and Friese, K.: Differences in DOM of rewetted and natural peatlands – Results from high-field FT-ICR-MS and bulk optical parameters, Sci. Total Environ., 586, 770–781, 2017.
Hope, D., Billett, M., and Cresser, M.: A review of the export of carbon in river water: fluxes and processes, Environ. Pollut., 84, 301–324, 1994.
Inamdar, S. P. and Mitchell, M. J.: Hydrologic and topographic controls on storm‐event exports of dissolved organic carbon (DOC) and nitrate across catchment scales, Water Resour. Res., 42, https://doi.org/10.1029/2005WR004212, 2006.
Jones, T. G., Evans, C. D., Jones, D. L., Hill, P. W., and Freeman, C.: Transformations in DOC along a source to sea continuum; impacts of photo-degradation, biological processes and mixing, Aquat. Sci., 78, 433–446, 2016.
Joosten, H. and Clarke, D.: Wise Use of Mires and Peatlands – Background and Principles Including a Framework for Decision-making, International Mire Conservation Group and International Peat Society, IBSN: 951-97744-8-3, 2002.
Judd, K. E., Crump, B. C., and Kling, G. W.: Variation In Dissolved Organic Matter Controls Bacterial Production And Community Composition, Ecology, 87, 2068–2079, https://doi.org/10.1890/0012-9658(2006)87[2068:VIDOMC]2.0.CO;2, 2006.
Karis, T., Silvester, E., and Rees, G.: Chemical regulation of alpine headwater streams during a storm event (Bogong High Plains, Victoria, Australia), J. Hydrol., 542, 317–329, 2016.
Kothawala, D. N., Ji, X., Laudon, H., Ågren, A. M., Futter, M. N., Köhler, S. J., and Tranvik, L. J.: The relative influence of land cover, hydrology, and in‐stream processing on the composition of dissolved organic matter in boreal streams, J. Geophys. Res.-Biogeo., 120, 1491–1505, 2015.
Kuhn, M.: Building predictive models in R using the caret package, J. Stat. Softw., 28, 1–26, 2008.
Laudon, H., Berggren, M., Ågren, A., Buffam, I., Bishop, K., Grabs, T., and Jansson, M.: Patterns and Dynamics of Dissolved Organic Carbon (DOC) in Boreal Streams: The Role of Processes, Connectivity, and Scaling, Ecosystems, 14, 880–893, https://doi.org/10.1007/s10021-011-9452-8, 2011.
Lawrence, R.: The Effects of Grazing Activity on the Hydrology of the Bogong High Plains, Australia, The Rangeland Journal, 17, 138–153, 1995.
Lê, S., Josse, J., and Husson, F.: FactoMineR: an R package for multivariate analysis, J. Stat. Softw., 25, 1–18, 2008.
Leach, J. A., Larsson, A., Wallin, M. B., Nilsson, M. B., and Laudon, H.: Twelve year interannual and seasonal variability of stream carbon export from a boreal peatland catchment, J. Geophys. Res.-Biogeo., 121, 1851–1866, https://doi.org/10.1002/2016JG003357, 2016.
Lear, G., Anderson, M. J., Smith, J. P., Boxen, K., and Lewis, G. D.: Spatial and temporal heterogeneity of the bacterial communities in stream epilithic biofilms, FEMS Microbiol. Ecol., 65, 463–473, https://doi.org/10.1111/j.1574-6941.2008.00548.x, 2008.
Limpens, J., Berendse, F., Blodau, C., Canadell, J. G., Freeman, C., Holden, J., Roulet, N., Rydin, H., and Schaepman-Strub, G.: Peatlands and the carbon cycle: from local processes to global implications – a synthesis, Biogeosciences, 5, 1475–1491, https://doi.org/10.5194/bg-5-1475-2008, 2008.
Lines, O., Silvester, E., Acharya, S., Holland, A., and Shackleton, M.: Data (zOTU and water chemistry as csv files), data processing and analysis workflow (pdf) and R scripts (as html files) for Lines et al. (2025) “Peatland stream biofilm community composition response to a storm pulse of dissolved organic carbon (DOC)”, La Trobe [data set and code], https://doi.org/10.26181/29757092.v1, 2025.
Logue, J. B., Stedmon, C. A., Kellerman, A. M., Nielsen, N. J., Andersson, A. F., Laudon, H., Lindström, E. S., and Kritzberg, E. S.: Experimental insights into the importance of aquatic bacterial community composition to the degradation of dissolved organic matter, ISME J., 10, 533–545, 2016.
Meyer, J.: The microbial loop in flowing waters, Microb. Ecol., 28, 195–199, 1994.
Mukaka, M. M.: A guide to appropriate use of correlation coefficient in medical research, Malawi Med. J., 24, 69, https://pmc.ncbi.nlm.nih.gov/articles/PMC3576830/ (last access: 27 August 2026), 2012.
Murphy, K. R., Stedmon, C. A., Graeber, D., and Bro, R.: Fluorescence spectroscopy and multi-way techniques. PARAFAC, Anal. Methods-UK, 5, 6557–6566, https://doi.org/10.1039/C3AY41160E, 2013.
Murphy, K. R., Stedmon, C. A., Wenig, P., and Bro, R.: OpenFluor–an online spectral library of auto-fluorescence by organic compounds in the environment, Anal. Methods-UK, 6, 658–661, 2014.
Nelson, P., Baldock, J., and Oades, J.: Concentration and composition of dissolved organic carbon in streams in relation to catchment soil properties, Biogeochemistry, 19, 27–50, 1992.
O'Donnell, B. and Hotchkiss, E. R.: Coupling Concentration- and Process-Discharge Relationships Integrates Water Chemistry and Metabolism in Streams, Water Resour. Res., 55, 10179–10190, https://doi.org/10.1029/2019WR025025, 2019.
O'Donnell, B. and Hotchkiss, E. R.: Resistance and resilience of stream metabolism to high flow disturbances, Biogeosciences, 19, 1111–1134, https://doi.org/10.5194/bg-19-1111-2022, 2022.
Oksanen, J., Simpson, G., Blanchet, F., Kindt, R., Legendre, P., Minchin, P., O'Hara, R., Solymos, P., Stevens, M., Szoecs, E., Wagner, H., Barbour, M., Bedward, M., Bolker, B., Borcard, D., Carvalho, G., Chirico, M., De Caceres, M., Durand, S., Evangelista, H., FitzJohn, R., Friendly, M., Furneaux, B., Hannigan, G., Hill, M., Lahti, L., McGlinn, D., Ouellette, M., Ribeiro Cunha, E., Smith, T., Stier, A., Ter Braak, C., and Weedon, J.: vegan: Community Ecology Package, R package version 2.6-4, https://vegandevs.github.io/vegan/ (last access: 27 August 2026), 2022.
Olapade, O. A. and Leff, L. G.: Seasonal Response of Stream Biofilm Communities to Dissolved Organic Matter and Nutrient Enrichments, Appl. Environ. Microbiol., 71, 2278–2287, https://doi.org/10.1128/AEM.71.5.2278-2287.2005, 2005.
Olapade, O. A. and Leff, L. G.: Influence of dissolved organic matter and inorganic nutrients on the biofilm bacterial community on artificial substrates in a northeastern Ohio, USA, stream, Can. J. Microbiol., 52, 540–549, 2006.
Pastor, J., Solin, J., Bridgham, S. D., Updegraff, K., Harth, C., Weishampel, P., and Dewey, B.: Global warming and the export of dissolved organic carbon from boreal peatlands, Oikos, 100, 380–386, https://doi.org/10.1034/j.1600-0706.2003.11774.x, 2003.
Pinsonneault, A. J., Moore, T. R., Roulet, N. T., and Lapierre, J.-F.: Biodegradability of Vegetation-Derived Dissolved Organic Carbon in a Cool Temperate Ombrotrophic Bog, Ecosystems, 19, 1023–1036, https://doi.org/10.1007/s10021-016-9984-z, 2016.
R Core Team: R: A Language and Environment for Statistical Computing, R Foundation for Statistical Computing [code], Vienna, Austria, https://doi.org/10.32614/R.manuals, 2021.
Rice, E., Baird, R., Eaton, A., and Clesceri, L.: Standard Methods for the Examination of Water and Wastewater, 22nd edn., American Public Health Association, American Water Works Association, Water Environment Federation, APHA Press, Washington DC, ISBN: 978-087553-013-0, 2012.
Roiha, T., Peura, S., Cusson, M., and Rautio, M.: Allochthonous carbon is a major regulator to bacterial growth and community composition in subarctic freshwaters, Sci. Rep., 6, 1–12, 2016.
Romani, A., Guasch, H., Munoz, I., Ruana, J., Vilalta, E., Schwartz, T., Emtiazi, F., and Sabater, S.: Biofilm structure and function and possible implications for riverine DOC dynamics, Microb. Ecol., 47, 316–328, 2004.
Schiff, S., Aravena, R., Mewhinney, E., Elgood, R., Warner, B., Dillon, P., and Trumbore, S.: Precambrian shield wetlands: hydrologic control of the sources and export of dissolved organic matter, Climatic Change, 40, 167–188, 1998.
Schober, P., Boer, C., and Schwarte, L. A.: Correlation coefficients: appropriate use and interpretation, Anesth. Analg., 126, 1763–1768, 2018.
Shimadzu Corporation: Analysis of Short-Chain Fatty Acids/Organic Acids (3-NPH Derivatives) in Fecal Specimens from SPF and Antibiotic-Fed Mice – Liquid Chromatography Mass Spectrometry Application News No. C168, https://www.shimadzu.com/an/apl/10771/index.html (last access: 27 August 2026), 2018.
Silvester, E., Karis, T., Yusuf, A., Pengelly, J., Grover, S., and Rees, G. N.: Organic carbon and nitrogen dynamics during a peatland storm event: How dissolved combined amino acids reveal the spatial and temporal separation of organic molecules, J. Hydrol., 597, 126191, https://doi.org/10.1016/j.jhydrol.2021.126191, 2021.
Sousa, W. P.: Disturbance in marine intertidal boulder fields: the nonequilibrium maintenance of species diversity, Ecology, 60, 1225–1239, 1979.
UNEP: Global Peatlands Assessment – The State of the World's Peatlands: Evidence for action toward the conservation, restoration, and sustainable management of peatlands, Global Peatlands Initiative, Nairobi Global Peatlands Initiative, Main Report, https://wedocs.unep.org/handle/20.500.11822/41222 (last access: 27 August 2026), 2022.
Wagner, S., Fair, J. H., Matt, S., Hosen, J. D., Raymond, P., Saiers, J., Shanley, J. B., Dittmar, T., and Stubbins, A.: Molecular Hysteresis: Hydrologically Driven Changes in Riverine Dissolved Organic Matter Chemistry During a Storm Event, J. Geophys. Res.-Biogeo., 124, 759–774, https://doi.org/10.1029/2018JG004817, 2019.
Wahren, C.-H., Williams, R., and Papst, W.: Alpine and subalpine wetland vegetation on the Bogong High Plains, south-eastern Australia, Aust. J. Bot., 47, 165–188, 1999.
Weishaar, J. L., Aiken, G. R., Bergamaschi, B. A., Fram, M. S., Fujii, R., and Mopper, K.: Evaluation of specific ultraviolet absorbance as an indicator of the chemical composition and reactivity of dissolved organic carbon, Environ. Sci. Technol., 37, 4702–4708, 2003.
Weitere, M., Erken, M., Majdi, N., Arndt, H., Norf, H., Reinshagen, M., Traunspurger, W., Walterscheid, A., and Wey, J. K.: The food web perspective on aquatic biofilms, Ecol. Monogr., 88, 543–559, 2018.
Wickham, H.: ggplot2: Elegant Graphics for Data Analysis, Springer, ISBN 978-3-319-24277-4, 2016.
Winterdahl, M., Laudon, H., Lyon, S. W., Pers, C., and Bishop, K.: Sensitivity of stream dissolved organic carbon to temperature and discharge: Implications of future climates, J. Geophys. Res.-Biogeo., 121, 126–144, 2016.
Worrall, F., Burt, T., Jaeban, R., Warburton, J., and Shedden, R.: Release of dissolved organic carbon from upland peat, Hydrol. Process., 16, 3487–3504, 2002.
Xu, J., Morris, P. J., Liu, J., and Holden, J.: PEATMAP: Refining estimates of global peatland distribution based on a meta-analysis, Catena, 160, 134–140, https://doi.org/10.1016/j.catena.2017.09.010, 2018.
Ylla, I., Borrego, C., Romaní, A. M., and Sabater, S.: Availability of glucose and light modulates the structure and function of a microbial biofilm, FEMS Microbiol. Ecol., 69, 27–42, 2009.
Yu, Z. C.: Northern peatland carbon stocks and dynamics: a review, Biogeosciences, 9, 4071–4085, https://doi.org/10.5194/bg-9-4071-2012, 2012.
Yusuf, A. Y., Silvester, E., Brkljaca, R., Birnbaum, C., Chapman, J., and Grover, S.: Peatland carbon chemistry, amino acids and protein preservation in biogeochemically distinct ecohydrologic layers, Eur. J. Soil Sci., 75, e13518, https://doi.org/10.1111/ejss.13518, 2024.
Zeglin, L. H.: Stream microbial diversity in response to environmental changes: review and synthesis of existing research, Front. Microbiol., 6, 454, https://doi.org/10.3389/fmicb.2015.00454, 2015.