
the Creative Commons Attribution 4.0 License.
the Creative Commons Attribution 4.0 License.
 | 14 Sep 2026
A boost on the final stretch: intense river metabolism and wetland discharge increase aquatic CO2 dynamics in the Danube Delta
Marie-Sophie Maier
Bernhard Wehrli

Cristian R. Teodoru
Many river deltas are aquatic hot spots for carbon dioxide (CO2) emissions to the atmosphere. Their patchwork of wetlands, lakes, channels, and river reaches often complicates the analysis of CO2 sources such as ecosystem respiration or lateral water transfer. Sensing techniques offer the opportunity of measuring the CO2, O2 and DIC concentrations at high temporal resolution for periods from days to months. Such time-series allow quantification of diurnal and seasonal cycles of river metabolism and lateral exchange. This study addresses the following general hypotheses: (1) Ecosystem metabolism intensifies when river water enters the slower flow paths through channels and lakes of a delta. (2) Wetland discharge from a delta significantly alters the oxygen and carbon dynamics in a river. (3) In such a case, average aquatic CO2 emissions increase on the final stretch before a river reaches the sea. We tested these hypotheses based on measurements of the oxygen and carbon dynamics at 15 min time resolution obtained from sensor packages. They were deployed for two years in the three main river reaches of the Danube Delta in Romania and for an additional year in three channels within the delta. By combining covariance analysis and monthly averaging of 24 h cycles we found a factor 100 difference in the amplitude of daily O2 and CO2 fluctuations across different stations and seasons. Channels with slow flow paths within the delta exhibited 4–8 times larger median amplitudes in daily metabolic cycles compared to the upstream river station. Correspondingly, metabolic intensity was on average 3–4 times more sensitive to changes in water temperature and cloud cover within the delta compared to the main river. Discharge of O2-depleted and CO2-rich wetland water into the downstream river sections was most pronounced during spring floods with apparent mixing rations of up to 13 %–25 % depending on the station. In a delta channel draining wetland waters, average CO2 supersaturation was almost an order of magnitude higher than in the Danube inflow. The combined effects of intense metabolism within the delta and wetland discharge doubled the CO2 emissions near the river mouth compared to an upstream Danube station. At the landscape level, however, carbon drawdown is likely five times larger than aquatic CO2 emissions. Based on a high-resolution timeseries spanning three years, this study demonstrates how connected wetlands enhance aquatic metabolism and associated CO2 dynamics in a large, lowland river.
- Article
(9038 KB) - Full-text XML
- BibTeX
- EndNote


Over the last decades, the paradigm of river systems as active reactors (Cole et al., 2007) replaced a pipe model for carbon and nutrient transfer from land to ocean (Degens et al., 1984). Global estimates of CO2 emissions from rivers and streams are 1.8±0.25 petagrams of carbon per year (Raymond et al., 2013). Including wetlands and inundated areas to river corridors (Abril and Borges, 2019) has further improved the analysis of carbon (Zuijdgeest et al., 2016) and oxygen dynamics in rivers (Zurbrügg et al., 2012). Reviews of river metabolism (Hotchkiss et al., 2015) covering the land-ocean aquatic continuum from the headwaters to the coastal zone have compiled an extensive database of carbon fluxes and transformations for river systems but available data remain more limited for large rivers and for the heterogeneous environments of the coastal and deltaic zones. Estuaries and their coastal vegetation were recently recognized as an effective global carbon sink (Rosentreter et al., 2023) but lateral carbon transfer from wetlands plays a key role in CO2 emissions of large river systems (Hastie et al., 2019). Our study aims to clarify the role of a large river delta in modifying the intensity of the regional river metabolism and the associated CO2 emissions.
Because river deltas often enclose large wetlands, the final stretch of a large river before entering the sea may exhibit a markedly different carbon dynamics compared to the upstream part. Three hypotheses guided this study on the delta of the Danube River in Romania: (1) Ecosystem metabolism intensifies when river water enters the slower flow paths through channels and lakes of a delta. (2) Wetland discharge from a delta significantly alters the oxygen and carbon dynamics in a river. (3) In such a case, average aquatic CO2 emissions increase on the final stretch before a river reaches the sea.
Testing these hypotheses requires monitoring and analysis of ecosystem metabolism in large river sections and small wetland channels, each with specific characteristics and challenges (Bernhardt et al., 2017): wide river sections with extensive open water areas are typically not shaded by riparian vegetation which reduces the seasonal effects of leaf cover. Furthermore, hydrological changes occur more gradually and with lower amplitude compared to headwater streams where disturbance regimes may induce abrupt ecosystem change such as the abrasion of productive biofilms (Sabater et al., 2016). On the other hand, lateral groundwater exchange in large river corridors and dynamic flooding of adjacent wetlands may play an important role for CO2 emissions (Borges et al., 2019; Marzolf et al., 2022). Wetlands are biogeochemical hotspots with high rates of daily gross primary production (Rabaey et al., 2024). Therefore, estimates of CO2 concentrations and their potential drivers in lowland rivers (Reiman and Xu, 2019) and river deltas (Huertas et al., 2017) can be improved by high-frequency measurements that allow resolving diel and seasonal cycles of photosynthesis, respiration, and transfer across system boundaries (Battin et al., 2023).
Progress in sensor technology (Rode et al., 2016) now facilitates the autonomous registration of water quality parameters at high frequency over time periods of months. Seasonal and multi-annual observations are feasible with appropriate maintenance and calibration. Specifically, wetland connectivity (Maier et al., 2022), the role of seasonal flood pulses (Dalmagro et al., 2018) and differences between daytime and nocturnal emissions (Gomez-Gener et al., 2021) can be monitored by in situ sensors. Covariance analysis of paired O2 and CO2 measurements from sensor deployments provides insights into the biological, chemical and physical forcing of aquatic ecosystem processes over time (Vachon et al., 2020). Analysing the temporal dynamics of paired O2-DIC measurements offers the advantage of removing buffer effects and simplifying carbon budget calculations (Shangguan et al., 2025). This combination of sensor measurements with statistical analysis has proven highly valuable in recent studies (Rocher-Ros et al., 2025) for identifying drivers of CO2 dynamics in US rivers (DelVecchia et al., 2023) and in the lower Ganges (Haque et al., 2022), for assessing the balance between river metabolism and CO2 emissions (Solano et al., 2023), for identifying the contribution of lateral inputs to the carbon budget of rivers (Marzolf et al., 2022), and for calculating the fraction of bicarbonate that supports river photosynthesis (Aho et al., 2021).
This study in the Danube Delta builds on previous analyses of discrete monthly sampling campaigns during two years (Maier et al., 2021) which revealed median CO2 fluxes in the main branches of the Danube of 25 , and four times higher values in the canals connecting wetlands and lakes. A subsequent on-site mapping study of dissolved gases at high spatial resolution by membrane-inlet mass spectrometry (Maier et al., 2022) revealed hot-spots in emission rates caused by wetland discharge to the canal systems, by plant mediated gas transfer via O2 ebullition in lakes, and by excess air formation in reed stands. Here we report results from a two-year deployment of commercially available multiprobe sensors (YSI EXO2) recording every 15 min in the three main stems of the Danube in the Romanian part of the delta near the Black Sea coast which was followed by a one-year deployment in selected delta channels. Time series of dissolved O2, CO2 and DIC obtained from these campaigns allowed us to address the following specific research questions: (1) How does the intensity of river metabolism differ between the open waters of the delta compared to the upstream Danube River? (2) How do lateral inputs from lake systems and reedbeds modify the O2 and CO2 dynamics of the main river reaches crossing the delta? (3) What are the overall effects of river metabolism and wetland discharge on aquatic CO2 emission rates in the Danube Delta? The first question addresses the intensity and characteristics of coupled O2–CO2 dynamics as indicators for differences in metabolic activity between river reaches and deltaic waters. The second question analyses O2, CO2 and DIC indicators for lateral inputs from lakes, channels and reed stands. Building on the evidence for metabolic activity and wetland discharge, the third question evaluates the consequences for aquatic supersaturation of CO2 and resulting emission rates. By addressing these questions our study proceeds from the analysis of local O2–CO2 and DIC patterns and processes to ecosystem-scale emission rates. We show how high-frequency observations can identify the controls of carbon processing and aquatic CO2 emissions in large, heterogeneous river deltas. The results fill a gap in our understanding how wetland–river interactions may define carbon dynamics on the final stretch of the land–ocean aquatic continuum.
2.1 Study site and monitoring stations
The Danube River is the second largest river in Europe and its international catchment of 817 000 km2 covers parts of 19 European countries. Originating in the Black Forest Mountains in Germany, the Danube flows southeast for over 2857 km before discharging into the Black Sea. The long-term mean discharge is 6360 m3 s−1 and ranged from 2930–11 300 m3 s−1 in the period 1921–2015 at the Ukrainian station of Reni (Romanova et al., 2019). Receiving meltwater from the Alps and the Carpathian Mountains, the hydrology of the Danube River shows a pronounced seasonality. In general, peak discharge lasts from April–June and low flow conditions prevail between September and November. Driven by rainfall in the lower catchment, a secondary discharge maximum usually occurs from December through January. During our study, seasonal air temperature changes varied from around 0 °C in winter to 20–25 °C in summer. The probability of cloud cover was higher in winter than in summer (Fig. 1a).
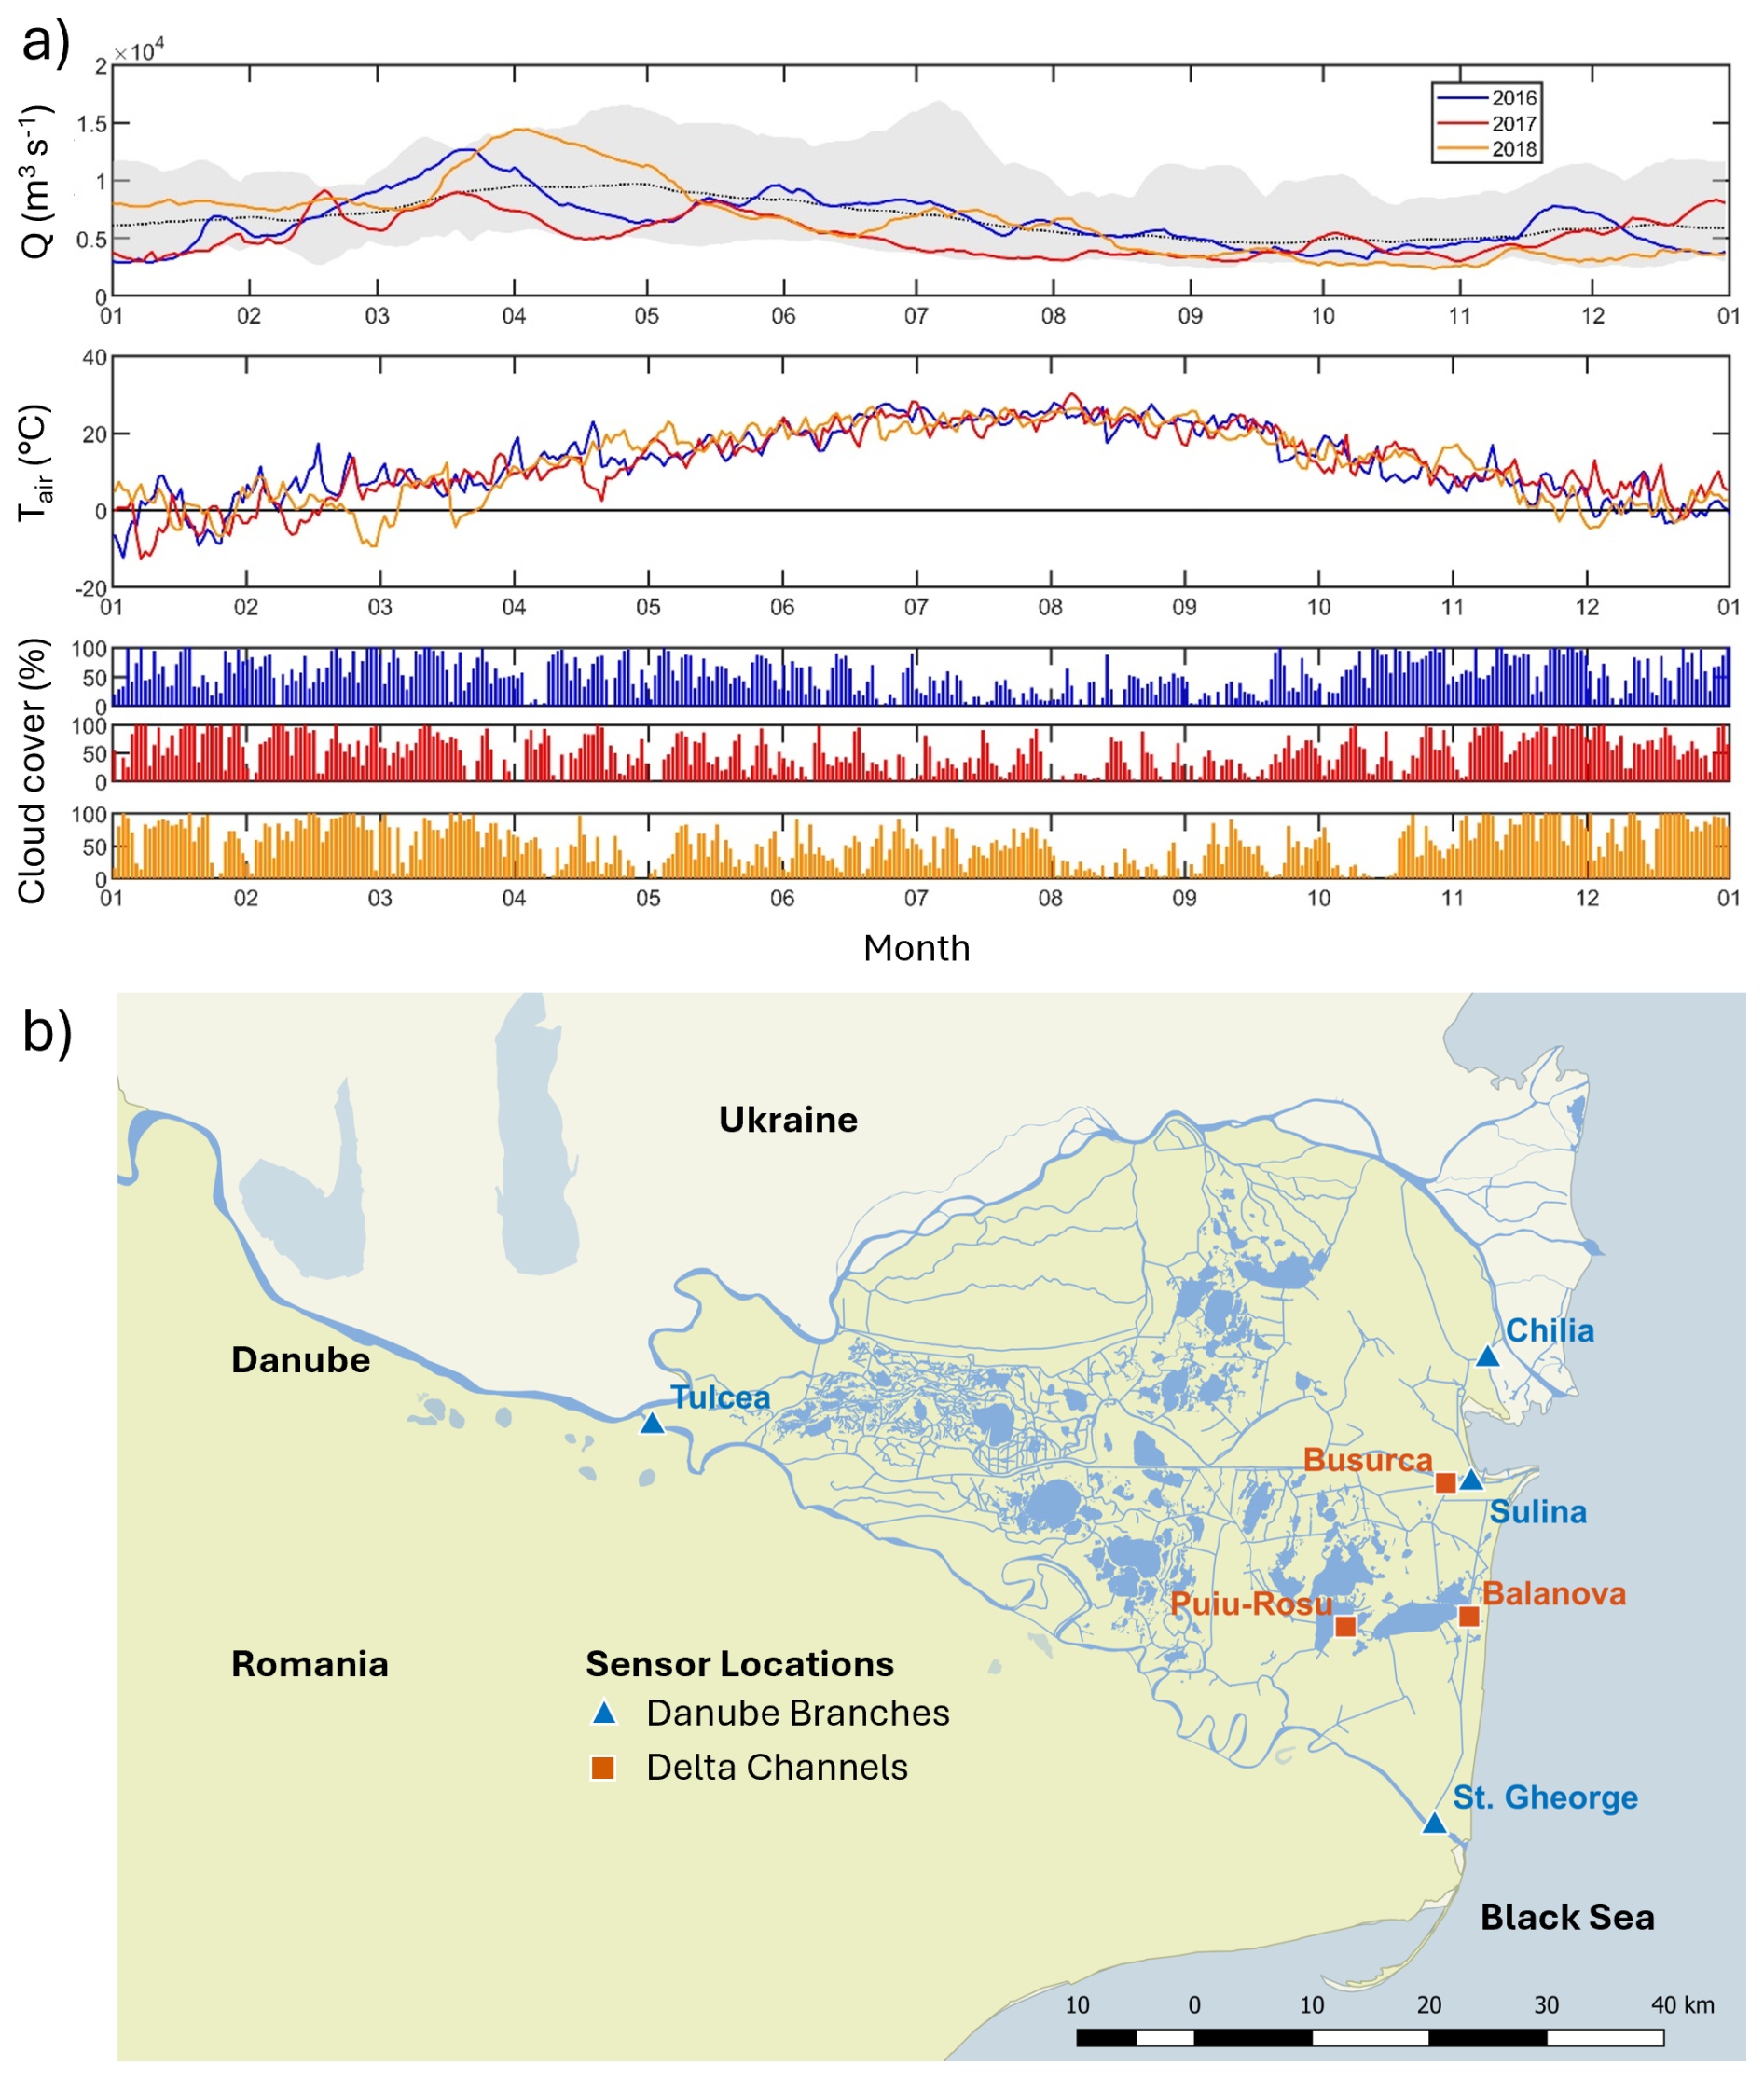
Figure 1(a) Three years of environmental records for the Danube Delta 2016–2018. Top: mean daily discharge of the Danube at Reni, Ukraine, upstream of the Delta (available at https://www.danubehis.org/stations, last access: 27 October 2025). Gray area indicates the range of daily discharge for the period 1998–2017. Middle: average daily air temperature; bottom: average daily cloud cover at Tulcea Airport (available at https://rp5.lv/Weather_in_Tulcea_(airport), last access: 27 October 2025). (b) Monitoring locations for EXO2 probes in main branches and within the Danube Delta. Map: © OpenStreetMap contributors 2024. Distributed under the Open Data Commons Open Database License (ODbL) v1.0.
Close to the mouth, the river splits into three arms that form the Danube Delta: Chilia in the north constitutes the border with Ukraine, Sulina in the middle was modified for maritime commercial navigation while Sfântu Gheorghe (St. George) limits the delta area in the south (Fig. 1b). The surface area of the Danube Delta between these river reaches is approximately 4150 km2, of which more than 80 % lies within Romania. As the youngest and the longest among the three arms, the 120 km long Chilia branch carries more than 50 % of the Danube water, the 64 km long Sulina channel about 27 % and the 70 km long river reach of St. George contributes about 20 % to the total water discharge. Travel-time analysis based on our sensor data resulted in average flow velocities in the range of 0.7 and 1.0 m s−1.
An intricate network of approximately 470 lakes, swamps, shallow water pools and about 3500 km of channels connects the delta's wetlands with the Danube River (Gomez-Baggethun et al., 2019). Although considered the most pristine delta in Europe, a series of hydrotechnical works in the Danube Delta, mostly for agriculture and fishery, led to doubling the length of the internal canals after 1980 (Gatescu, 1993). This, in turn, gradually increased the water flow through the delta from 260 m3 s−1 between 1951 and 1960 to 620 m3 s−1 in the period 1981–1990 (Bondar, 1994). Today, approximately 10 % of the total Danube discharge is estimated to enter the delta, of which about 20 % () may be lost via evapotranspiration in the wetlands. Reed (Phargmites australis) is the dominant species in the Delta covering ∼1600 km2 or almost 40 % of the study area (Oosterberg et al., 2000). Large stretches of the channels are bordered by riparian forests composed mainly of black alder (Alnus glutinosa) and silkvine (Periploca graeca) (Oprea et al., 2024). Most of the lakes are eutrophic and classified into three types: (1) lakes at short distance to the river with high flushing rates and dense submerged vegetation, (2) large, relatively deep lakes like Puiu and Rosu with longer residence time and high Potamogeton-cover that collapses during winter, and (3) small, isolated lakes receiving “black-water” inflows from floating reedbeds and dominated by Ceratophyllum demersum and Nitellopsis obtusa (Coops et al., 2008). A high diversity of submerged and floating macrophytes is present in the canals and old meanders (Oosterberg et al., 2000).
In the first phase of this study, we deployed four sensor packages (EXO2 Multiparameter Water Quality Sondes, YSI) along the main branches of the Danube at the stations labelled Tulcea, Chilia, Sulina, and St. George (Fig. 1b). Tulcea served as the upstream reference station for water entering the delta. The Chilia branch receives additional input from a Ukrainian catchment with shallow lakes to the north, the Sulina channel serves as the main shipping route with lateral inputs from adjacent wetlands, and the St. George branch collects inflow mainly from wetlands on its left side. The monitoring stations recorded data every 15 min between November 2015 and February 2018. For consistency, all timestamps were recorded in Easter European Time (EET) without a switch to summertime (EEST). For further details on time intervals and locations see Fig. A1 and Table A1. One multiprobe was damaged by floating ice in December 2016 which limited the time series at Chilia station to one year. In the second phase from February 2018–December 2018, the remaining three EXO2 probes were installed in channels within the delta at Puiu-Rosu, Balanova and Busurca. Puiu-Rosu is influenced by outflow of a large and relatively deep lake complex, Balanova receives mixed input from lakes wetlands while Busurca is mainly connected to reedbeds with negligible lake influence. Note that Balanova refers to a local name along the Central Channel that connects the Sulina and St. George branches (Fig. 1b).
2.2 Measured and derived parameters
The EXO2 multiprobe sensors recorded water temperature, pH, specific conductivity, and dissolved oxygen every 15 min. Data of sensors for turbidity and fluorescent dissolved organic matter was not analyzed for this study. Before each measurement, the sensor caps were automatically cleaned by a wiper. The EXO probes were moored at approximately 1 m below the water surface. Data gaps occurred sporadically due to unexplained energy drain from batteries and when probes were removed to prevent damage by floating ice sheets during cold spells in winter. Once a month, the probes were removed from the water for cleaning and pH and O2 sensors were calibrated using standard buffer solution and air-saturated water, respectively. Post-deployment, the data was drift-corrected using the calibration data. Crosschecks with discrete in situ measurements using the YSI Optical Dissolved Oxygen and Professional Plus Multiparameter instruments (Maier et al., 2021) showed good agreement. We used a low conductivity threshold () to detect and delete invalid data points recorded at times when the sensor was out of the water for servicing.
We derived the alkalinity time series from specific conductivity data using the linear correlation between laboratory analysis of alkalinity and specific conductivity (SpCond) measurement as: alkalinity SpCond [µS cm−1] + 0.60 (R2=0.70, Fig. B1). The same approach has been applied to derive multidecadal trends for CO2 evasion in the Loire River (Nguyen et al., 2025) and to estimate global riverine CO2 emission rates (Raymond et al., 2013). To calculate CO2 from pH and alkalinity, we used the CO2SYS MATLAB code version 1.1 with Matlab R2017a and 2022b (van Heuven et al., 2011). These calculations were based on dissociation constants for a temperature range of 2–35 °C (Cai and Wang, 1998). To obtain an upper and lower estimate for the derived CO2 time-series, we propagated the uncertainty of the alkalinity-conductivity regression estimates and obtained an error of ±13 %. The calculated CO2 values correlated well with discrete headspace measurements taken at the same time and location (R2=0.82, Fig. B1). Finally, we used solubilities (Weiss, 1974) and the temperature recordings from the EXO2 probes to calculate the deviation from atmospheric equilibrium in µmol L−1 of the O2–CO2 pairs. We defined the frequent excess of CO2 and the typical deficit of O2 with regards to atmospheric equilibrium as exCO2 and exO2 [µM] with a positive or negative sign, respectively. For the correlation of daily O2–CO2 covariance data with potential physical drivers, we used averaged daily water temperature from the EXO2 sensors and cloud cover from a meteorological station in Tulcea (Fig. 1a). The time-shift of one hour during daylight saving time was removed to synchronize the meteorological data with the continuous recording of EXO probes.
Some data-filtering was necessary for the time series of Chilia (2016) which was sporadically influenced by water from an adjacent wetland and for Sulina (2017) which recorded disturbances from the Black Sea, respectively. We flagged these spikes in conductivity by comparing the time series with upstream Tulcea station and removed data if they deviated more than 40 µS cm−1 from the baseline. This approach missed the beginning and the end of the spike events. To refine the cleanup, we took 5 h before and after an identified spike event and eliminated periods with changes in specific conductivity larger than 2 µS cm−1 and completed the task with few manual adjustments.
2.3 Statistical analysis
Vachon et al. (2020) proposed a set of parameters obtained from covariance analysis of paired exO2–exCO2 measurements to gain insights into aquatic ecosystem metabolism. Because buffer effects may distort the exO2–exCO2 data clouds at low CO2 concentrations (Diamond et al., 2025; Nguyen et al., 2025), we included the DIC timeseries and paired exO2–DIC measurements in our analysis. We developed a workflow in Mathematica 14.3 to analyze the Danube Delta time series at monthly and daily timescales. Days with fewer than 85 data pairs were excluded from analyses, as typically 96 pairs were recorded daily at 15 min intervals. Monthly analyses usually involved more than 2800 pairs and months with less than 500 pairs were omitted. Results of the covariance calculations included the centroids which represent the mean of the exO2 and exCO2 data over the period of days or months and the offset of the mean from an ideal line with slope −1 for photosynthesis and respiration (Fig. 2a). Stretch and width were obtained from the Eigenvalues of the covariance matrix as the major and minor axes length of the 95 % confidence ellipse and we obtained the slope scov of the stretch-line from the Eigenvectors of the covariance matrix. Parameters for the 95 %-ellipses obtained from covariance analysis provide valuable insights into the intensity of photosynthesis and respiration (stretch), the ecosystem quotient (), and the impact of lateral inflow (centroid position, offset).
To analyse monthly day-night dynamics, we calculated the average 24 h day-night cycles for each month of sensor deployment. For instance, monthly averages for 08:00 am in June were obtained by taking the mean of all June measurements at 08:00, 08:15, 08:30 and 08:45 EET. This approach resulted in average timing and amplitudes of the exO2, exCO2 and DIC cycles. The time-of-day averages reduced the influence of outliers and resulted in slopes s24 that may reflect EQs more closely than the tilt of the monthly covariance ellipse (scov) (Fig. 2b). The following analysis, however, focuses on amplitudes and stretch as indicators of metabolic intensity and on the offset and centroid positions as indicators of wetland discharge.
For a more detailed analysis, boxplots of the amplitudes of exO2, exCO2, DIC and stretch parameters were based on all available monthly data at the seven stations (Table A1). The boxes show the median and quartiles (25 % and 75 %), whiskers indicate the range of values (excluding outliers). The statistical difference of these parameters for metabolic intensity between river and delta stations was evaluated by Kruskal–Wallis tests. To assess the influence of temperature and daylight on the aquatic ecosystem metabolism, stretch parameters from daily covariance analyses were correlated by linear regression and covariance analysis with average daily cloud cover data from Tulcea Airport and water temperature measured in-situ by the EXO2 probes.
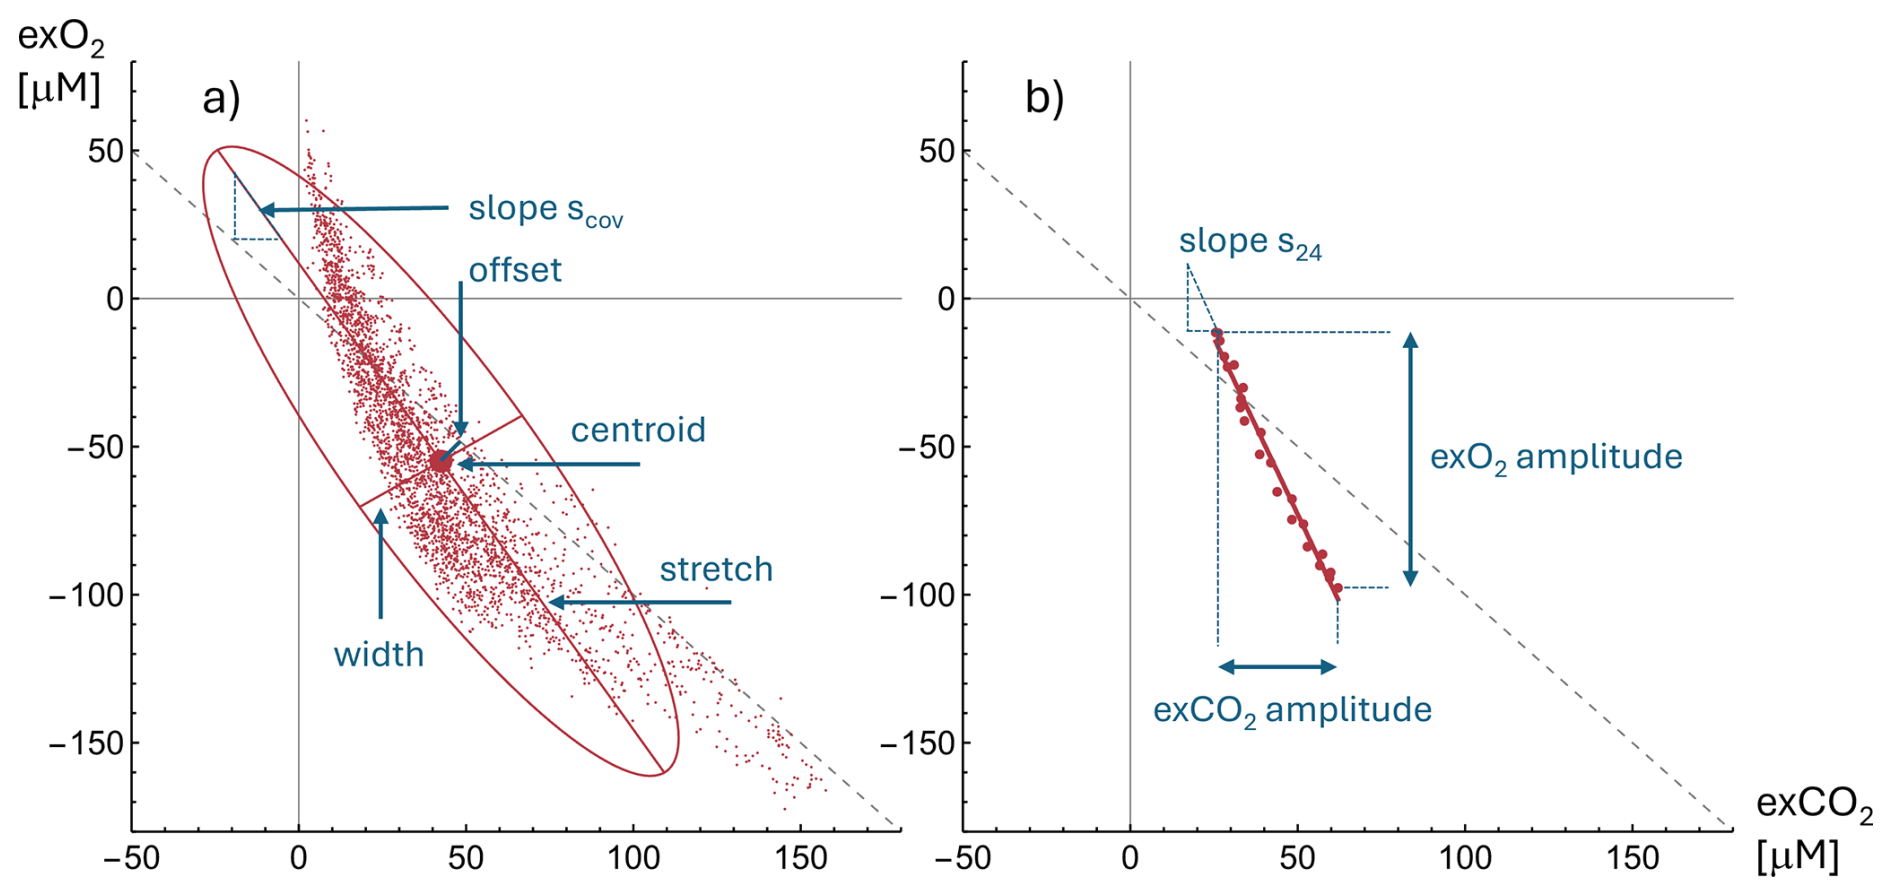
Figure 2(a) Example of covariance analysis of exO2–exCO2 data from July 2018 at Balanova station. Small dots are individual data points acquired every 15 min. The ellipse encloses 95 % of the datapoints and is defined by the centroid and the two main axes (125 and 29 µM) derived from the Eigenvalues of the covariance matrix. The offset corresponds to the nearest distance of the centroid from the grey dotted line with a slope of −1 for a theoretical photosynthesis-respiration process. (b) Using the same data as in (a), the monthly averages over 24 h of the day define a mean daily cycle for July at Balanova station. The average daily cycle shows an exCO2 amplitude of 36 µM but a wider exO2 amplitude of 88 µM.
3.1 Intensity of river metabolism
The intensity of photosynthesis and respiration, as recorded by CO2 oversaturation with respect to atmospheric equilibrium, O2 deficits and DIC concentrations, varied strongly in space and time during the observation period. The results allow testing of the hypothesis that aquatic metabolism is more intense within the delta compared to the main river reaches. The inflowing Danube at Tulcea showed DIC minima of 2.6 mM in the warm season and maxima of 3.5 mM during the cold months (Fig. C1). Averaging the 24 h cycles for O2, CO2 and DIC at the monthly scale provided insights into the intensity and seasonality of river metabolism (Figs. 3 and C2). In 2017 the sensors at Tulcea recorded small and rather constant supersaturation (exCO2) and undersaturation (negative exO2) in the range of ±40 µM with diel amplitudes from ∼1 µM in the cold months and below 10 µM in the warm season. Within the delta, the 24 h cycles at Balanova channel showed maximum daily fluctuations of more than 100 µM for exO2 in August. Overall, the 24-h amplitudes spanned two orders of magnitude between the extremes of 1 µM for the cold season in the upstream Tulcea station and 100 µM for warm season amplitudes within the delta.
The Balanova observations were characterized by maxima in the early morning (06:00–08:00 am EET) and minima in the afternoon (04:00–06:00 pm EET) between April and November (Fig. 3). Compared to exCO2, the oxygen cycles represented a mirror image where the strong undersaturation in the morning hours relaxed to near-equilibrium conditions in the late afternoon. Compared to CO2 and O2, the 24 h DIC curves showed more stochastic deviations from the sinusoidal pattern, likely reflecting the rapidly changing DIC concentration in the inflow (Figs. C1 and C2).
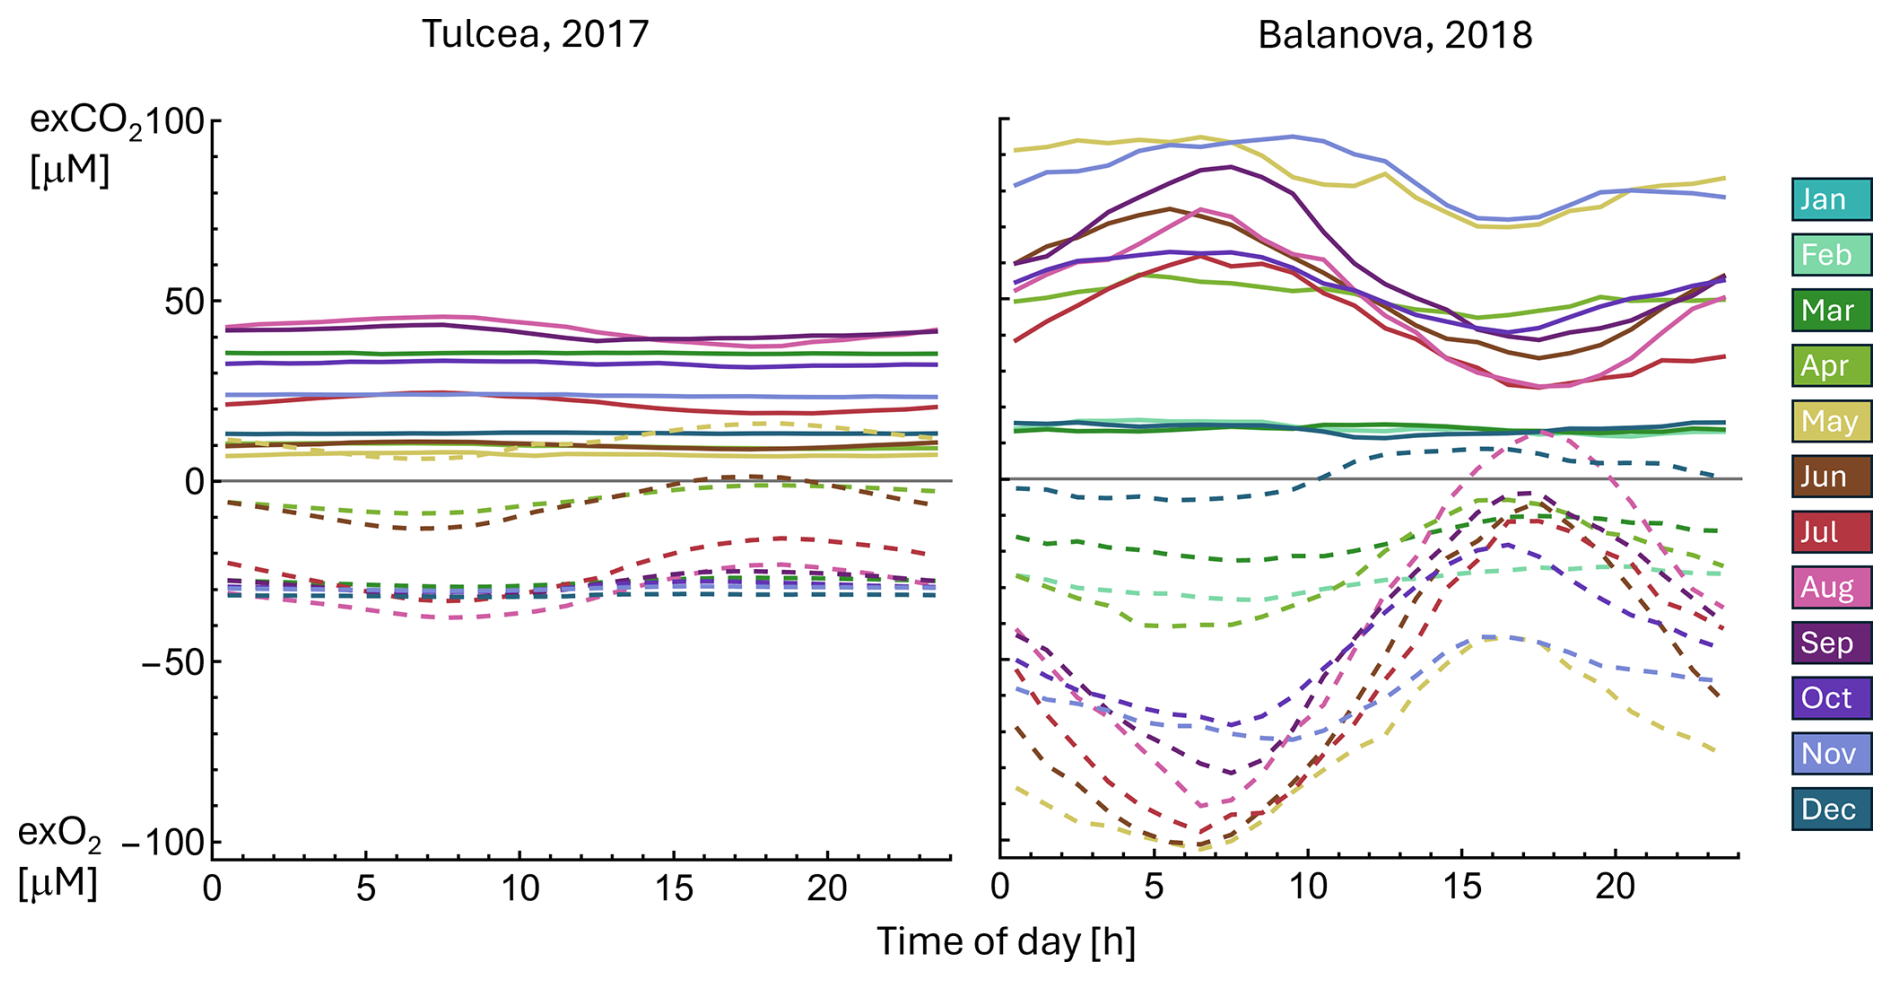
Figure 3Examples of 24 h monthly averages of exCO2 (solid lines) and exO2 (dashed lines) at Tulcea from March–December 2017 and at Balanova station from February–December 2018. The averaged daily cycles define characteristic amplitudes and timing of river metabolism for each month. See Fig. C2 for corresponding 24-cycles of DIC.
A comparison of median 24 h amplitudes based on four indicators of metabolic intensity (amplitudes of exO2, exCO2, DIC and the stretch parameter from covariance analysis) revealed significant differences between sites (Fig. 4). The two downstream sites of St. George and Chilia showed consistently higher median amplitudes compared to Tulcea. Amplitudes of exCO2 were generally lower than those of exO2, whereas the 24-h DIC variability was typically higher. Overall, the daily metabolic cycles intensified on the final of river flow between Tulcea and the three near shore stations.
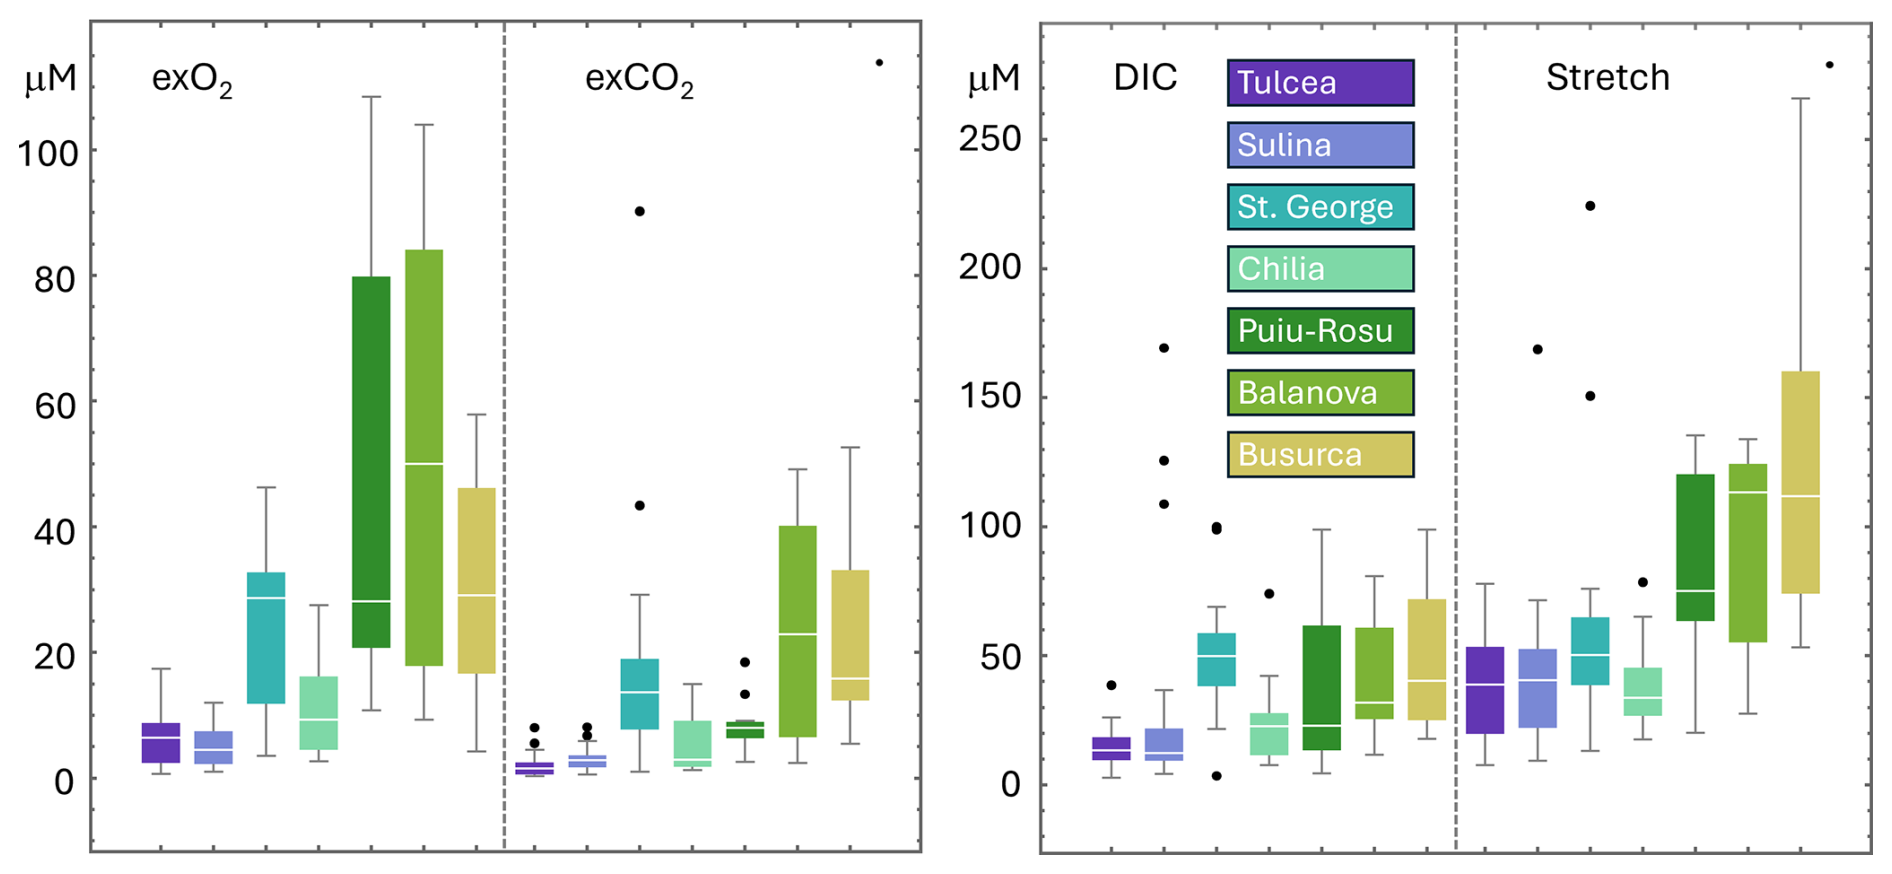
Figure 4Box plots of monthly mean 24 h amplitudes of exO2, exCO2, DIC and the stretch parameter. Stations from left to right: Tulcea, Sulina and St. George (2016–2017), Chilia in 2016 and Puiu-Rosu, Busurca and Balanova in 2018. The number of monthly means per station ranged from 11–21 (Table A1). White horizontal lines mark median values, boxes show the 25 %–75 % quartiles and whiskers indicate the range except for outliers marked with dots.
Compared to the river stations, amplitude and stretch values recorded in the delta were significantly larger (p<0.01 for exO2, exCO2 and stretch, p∼0.01 for DIC). Overall, the average daily fluctuations revealed increasing median values in the amplitude of exO2 from the apex to the inner delta, with low values from 6.5 and 4.5 µM at Tulcea and Sulina, respectively, to higher amplitudes of 29 and 9.3 µM at St. George and Chilia and consistently high values within the delta (28, 50, and 29 µM in Puiu-Rosu, Busurca and Balanova). In terms of median amplitudes, metabolic activity per unit volume was thus about 4–8 times higher at stations within the delta than at the upstream station of Tulcea. A similar pattern was observed for the median DIC amplitudes with 13 and 12 µM in Tulcea and Sulina, 50 and 23 in St. George and Chilia and elevated values within the delta: 23, 32 and 40 µM at Puiu-Rosu, Balanova and Busurca, respectively. Using DIC as an indicator, metabolic activity within the delta was 2–3 times higher than at the upstream Danube station. The results demonstrate how river metabolism intensified in the slow-flowing waters of the delta.
Plotting the 24 h cycles in the exO2–exCO2 plane allowed for a closer look at diel dynamics and the intensities of autotrophic versus heterotrophic ecosystem metabolism over the course of a year (Fig. 5). In the following, we focus on differences between the cold season (October–March) and the warm season (April–September). At Tulcea and Sulina, these plots illustrate minimal metabolic activity during cold months with exO2 amplitudes in the range of 1–2 µM and comparatively small signals of 7–9 µM during the warm months. In contrast, Chilia and St. George, were characterized by significantly stronger daily cycles with mean warm season exO2 values of 17 and 32 µM, respectively.
The delta stations reveal different types of dominant metabolic activities and a broad dynamic range of O2 and CO2. At the lake-outlet of Puiu-Rosu, autotrophic activity significantly exceeded heterotrophic metabolism with a pronounced buildup of dissolved oxygen and positive daytime exO2 values during the warm season. In contrast, the wetland discharge defining the water characteristics at Busurca was dominated by heterotrophic signatures with extremely high exCO2 concentrations of 300–500 µM during the warm season, while exO2 oscillated between −150 and −250 µM and approached anoxic conditions. Balanova, showed an intermediate signature between the lake and wetland waters with warm-season exO2-values ranging between 0 and −100 µM.
At high CO2 supersaturation observed for instance at Busurca, Balanova and St. George, the slopes of linear regression lines often converged towards idealized values of −1 for the O2:CO2 stoichiometry of photosynthesis and respiration (Fig. 5). At Puiu-Rosu, however, steeper slopes were observed due to the buffer effect of the carbonate system when CO2 values approach atmospheric equilibrium (Shangguan et al., 2025). The Busurca data followed a heuristic trajectory along a slope of −0.5, extending towards , and .
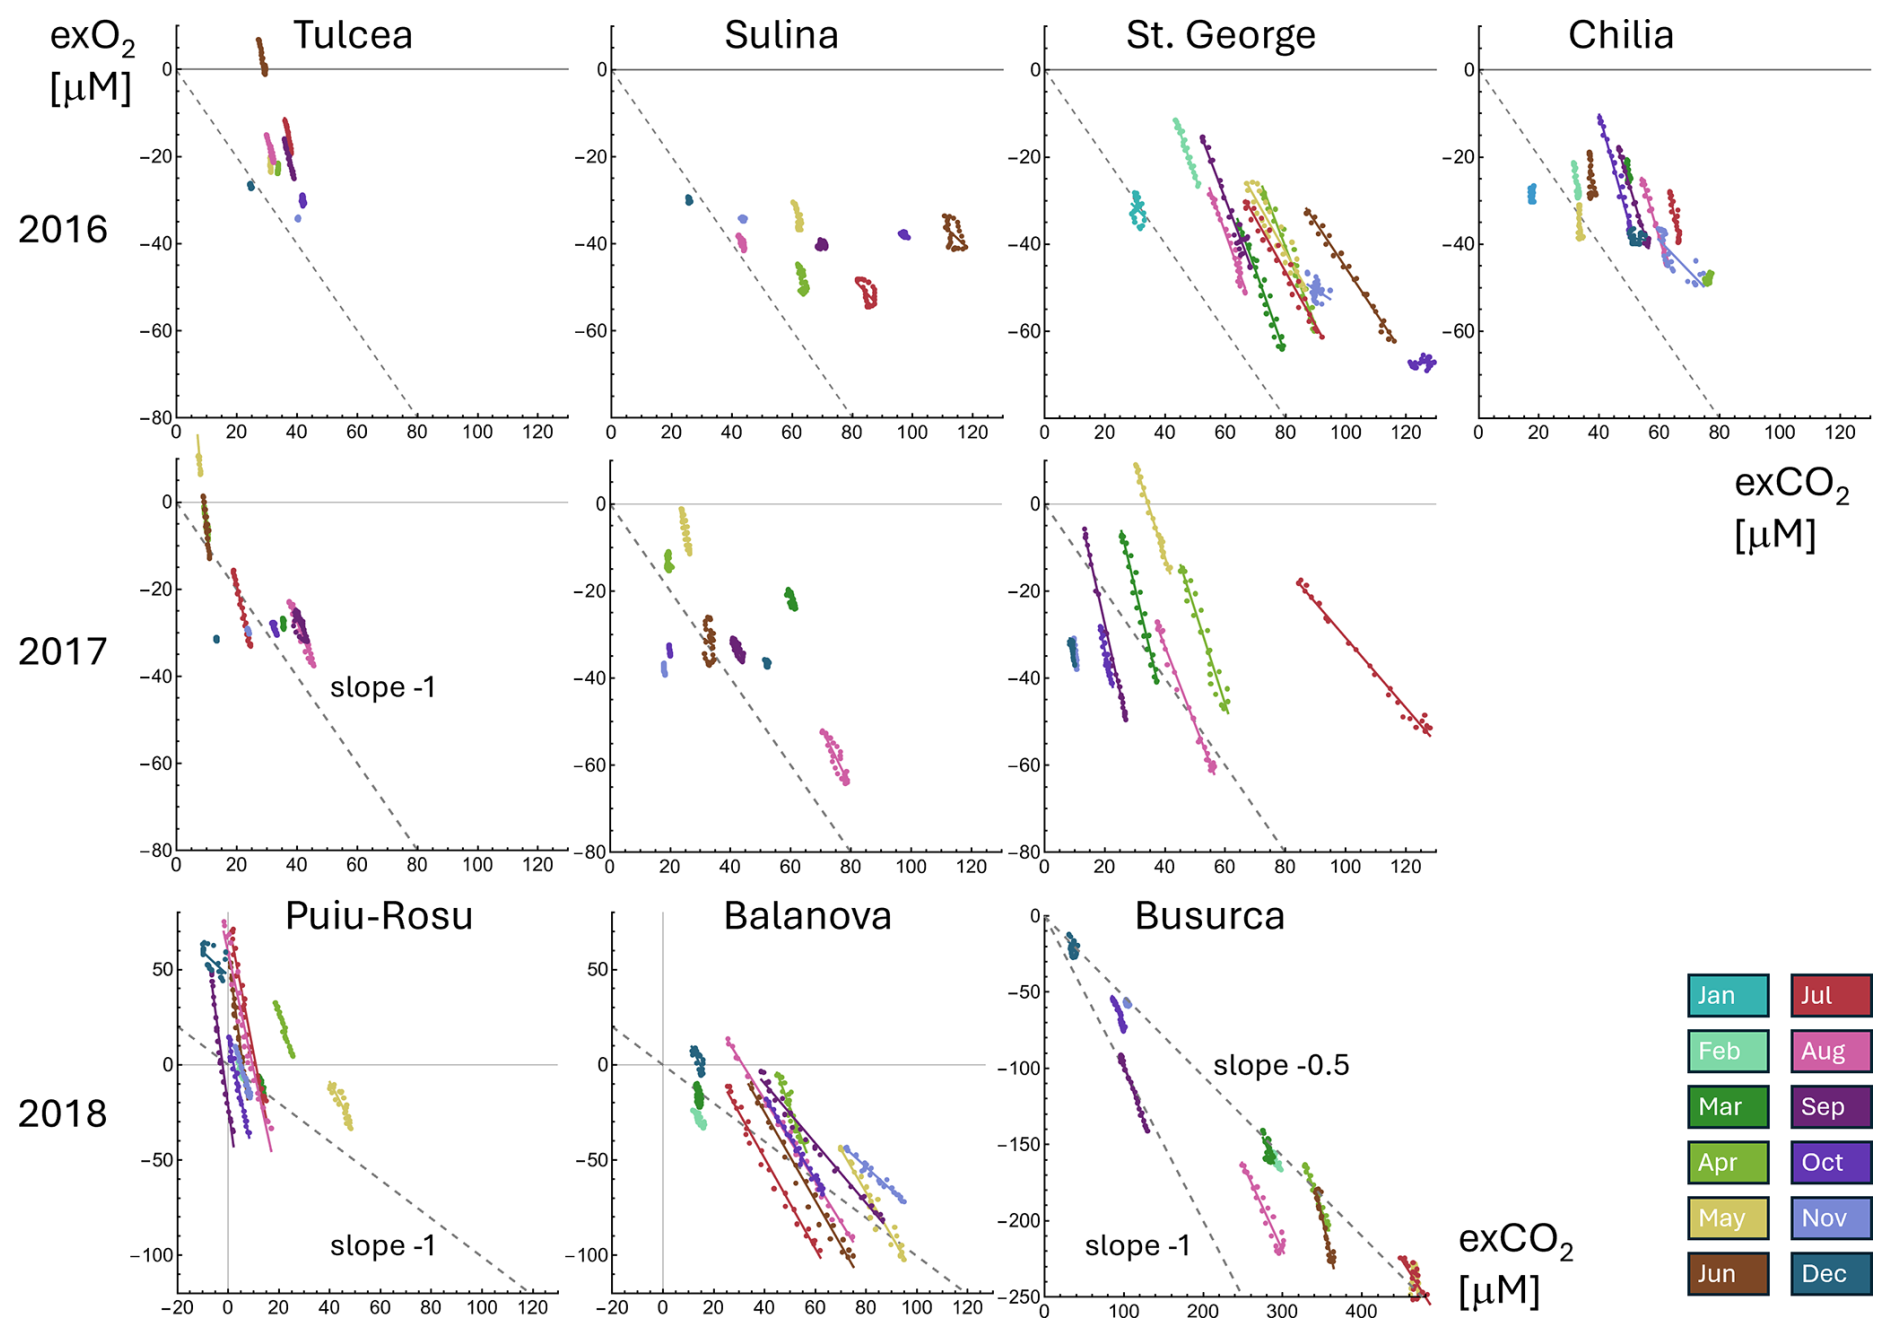
Figure 5Paired exO2–exCO2 plots of mean 24 h cycles. Dots represent monthly averages at one hour resolution and are connected by linear regression lines. Diagonals mark theoretical O2–CO2 stoichiometry of photosynthesis and respiration. Note extended x–y scale at Busurca.
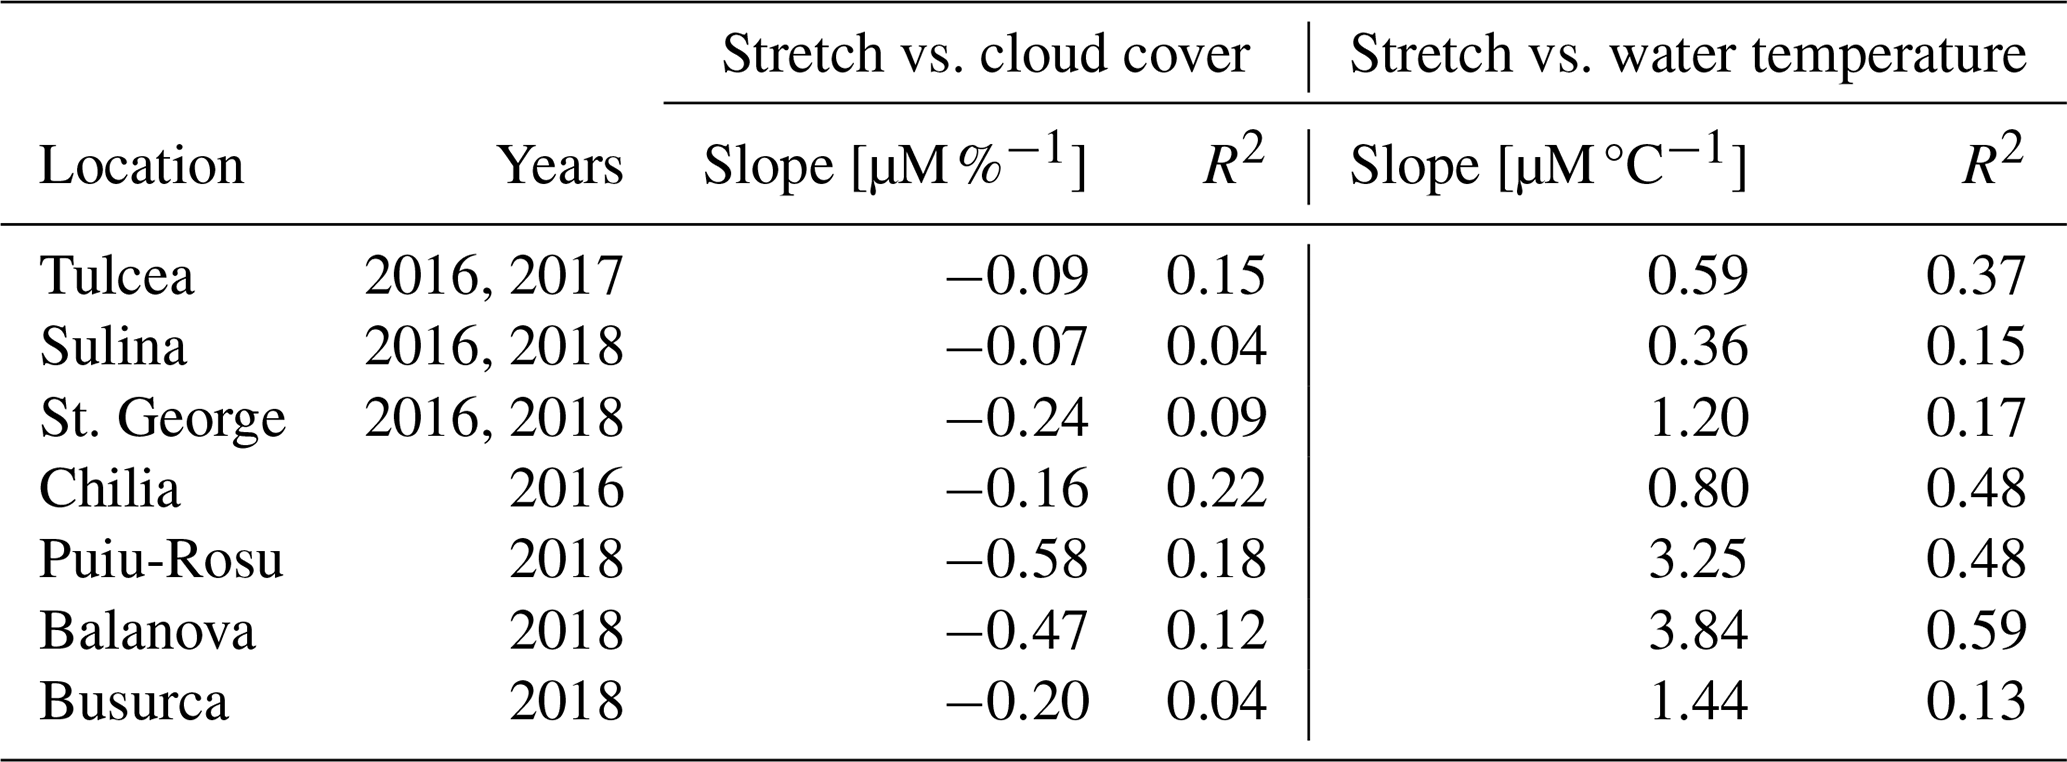
To assess the effect of potential drivers for the intensity of river metabolism such as temperature and cloud cover, we related the daily stretch parameters with mean water temperature measured by the in-situ probes and the mean daily cloud cover observed at Tulcea Airport (Table 1). Cloud cover blocking sunlight was negatively correlated to the diel stretch parameters for the seven analysed time series. The Pearson's coefficients ρ ranged from −0.26 at Busurca to −0.46 at Chilia. On average, the cloud-cover sensitivity of the stretch factor was ∼3 times larger at the delta stations compared to the river sections. The R2 values were typically <0.2, but the correlations were significant at the p<0.05 level.
Water temperature has been identified as a key variable for respiration rates in streams (Perkins et al., 2012). In this study, the correlation between the stretch parameters and mean daily water temperatures was rather strong (range ) and significant (p<0.05) for the seven stations (Table 1). On average, increasing water temperature enhanced the indicator of metabolic activity by 0.7 µM °C−1 at the river stations and by 2.8 µM °C−1 within the delta. For a seasonal shift in water temperature of 20 °C, the corresponding change in the stretch parameter amounted to 14 and 56 µM for typical Danube River reaches and delta channels, respectively. This factor 4 difference in the temperature-sensitivity of the daily stretch parameter between river and delta sites mirrors the metabolic response to cloud cover and is in line with the higher metabolic amplitudes in the delta.
Table 1Linear regression slopes of daily stretch values as a function of mean cloud cover at Tulcea Airport and local water temperature. R2 is the coefficient of determination.
3.2 Wetland discharge
The following analyses address our second hypothesis that lateral inputs modify the downstream O2–CO2 dynamics. The exO2–exCO2 patterns revealed significant differences in the stretch (elongation) of the 95 % covariance ellipses between the main reaches of the Danube in 2016 and the stations within the delta in 2018 (Fig. 6). In November, data from the river reaches were enclosed by rather circular shapes with minimal offset from the 1:1 diagonal. The June records, however, resulted in elongated ellipses characteristic for higher amplitudes. The data patterns within the covariance ellipses formed distinct monthly fingerprints which were only slightly distorted after moving from Tulcea to the downstream stations of Sulina and Chilia but appeared randomized at St. George.
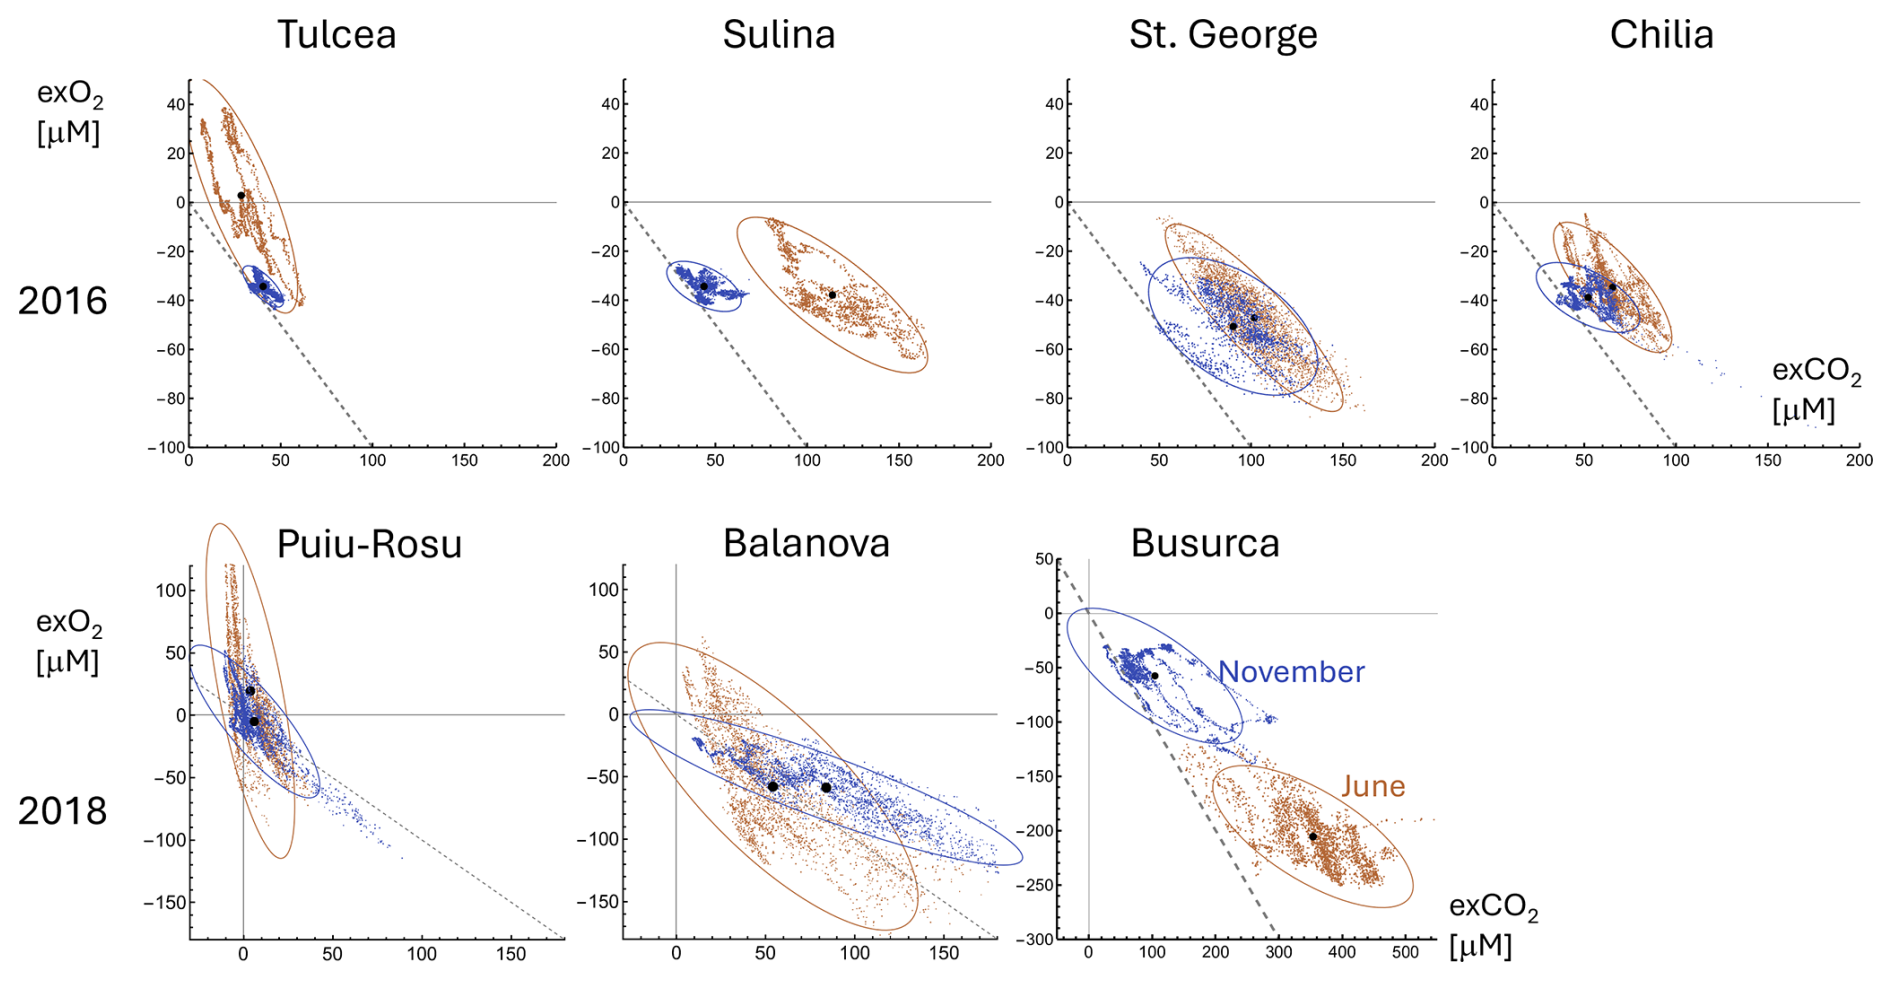
Figure 6Examples of covariance ellipses for exO2–exCO2 data pairs at 95 % confidence level for the Danube River reaches (upper panels) and stations within the delta (lower panels). Diagonal lines represent the theoretical slope of −1 for photosynthesis and respiration. Dots mark the centroids. Expanded axes for Busurca.
The delta stations showed smaller seasonal differences in stretch between June and November but marked shifts in the position within the exO2–exCO2 diagram. While the Puiu-Rosu data indicated intense photosynthesis with O2 supersaturation and equilibrium-level CO2, Busurca represented an extreme case of wetland discharge from the surrounding reed stands with CO2-rich and O2-depleted water masses. Balanova located downstream of Puiu-Rosu reflected a mixture of lake- and wetland water. Its monthly fingerprints resembled those of Puiu-Rosu but with a downward shift along the theoretical line of slope −1.
In the downstream Danube River reaches, wetland discharge led to increasing offsets and a shift along the heuristic slope −0.5 (Busurca, Fig. 5). Centroids were displaced towards O2 undersaturation by −40 µM and CO2 supersaturation of +35 to +85 µM. While offsets in June remained similar between Tulcea and Chilia, the two other downstream stations showed offset increases of 21 and 16 µM at Sulina and St. George, respectively. In November, covariance clouds remained compact and close to the line except for St. George where the offset exceeded that of Tulcea by more than 20 µM. Overall, these examples from two contrasting months provide clear evidence of wetland discharge affecting dissolved gas dynamics between Tulcea and the stations near the Black Sea coast.
A more systematic analysis of the centroids allows tracking how the monthly means of exO2–exCO2 evolved over time. The results reveal distinct annual journeys at the four Danube stations in 2016 and 2017 (Fig. 7). The trajectories at Tulcea were confined to a narrow quadrant between 0 and ±40 µM for both exO2 and exCO2. At the downstream stations, however, the warm-season centroids were typically more depleted in O2 and enriched in CO2 compared to Tulcea. The trajectories often moved along a heuristic slope of −0.5 for wetland discharge (Busurca, Fig. 7). The increase in average exCO2 between Tulcea and downstream stations reached factors as high as 4 (June 2016, Sulina) and 18 (June 2017, St. George). In contrast, the downstream depletion of exO2 at Sulina and St. George was less pronounced than the exCO2 loading and maximum exO2-differences compared to Tulcea were limited to factors of ∼3 (Sulina, July 2017) and 2 (St. George, October 2016). The Chilia station also showed consistently lower exO2 and higher exCO2 values compared to Tulcea, but extreme additions of CO2 rich waters were not observed in this more natural river reach which remains less affected by dredged channels.
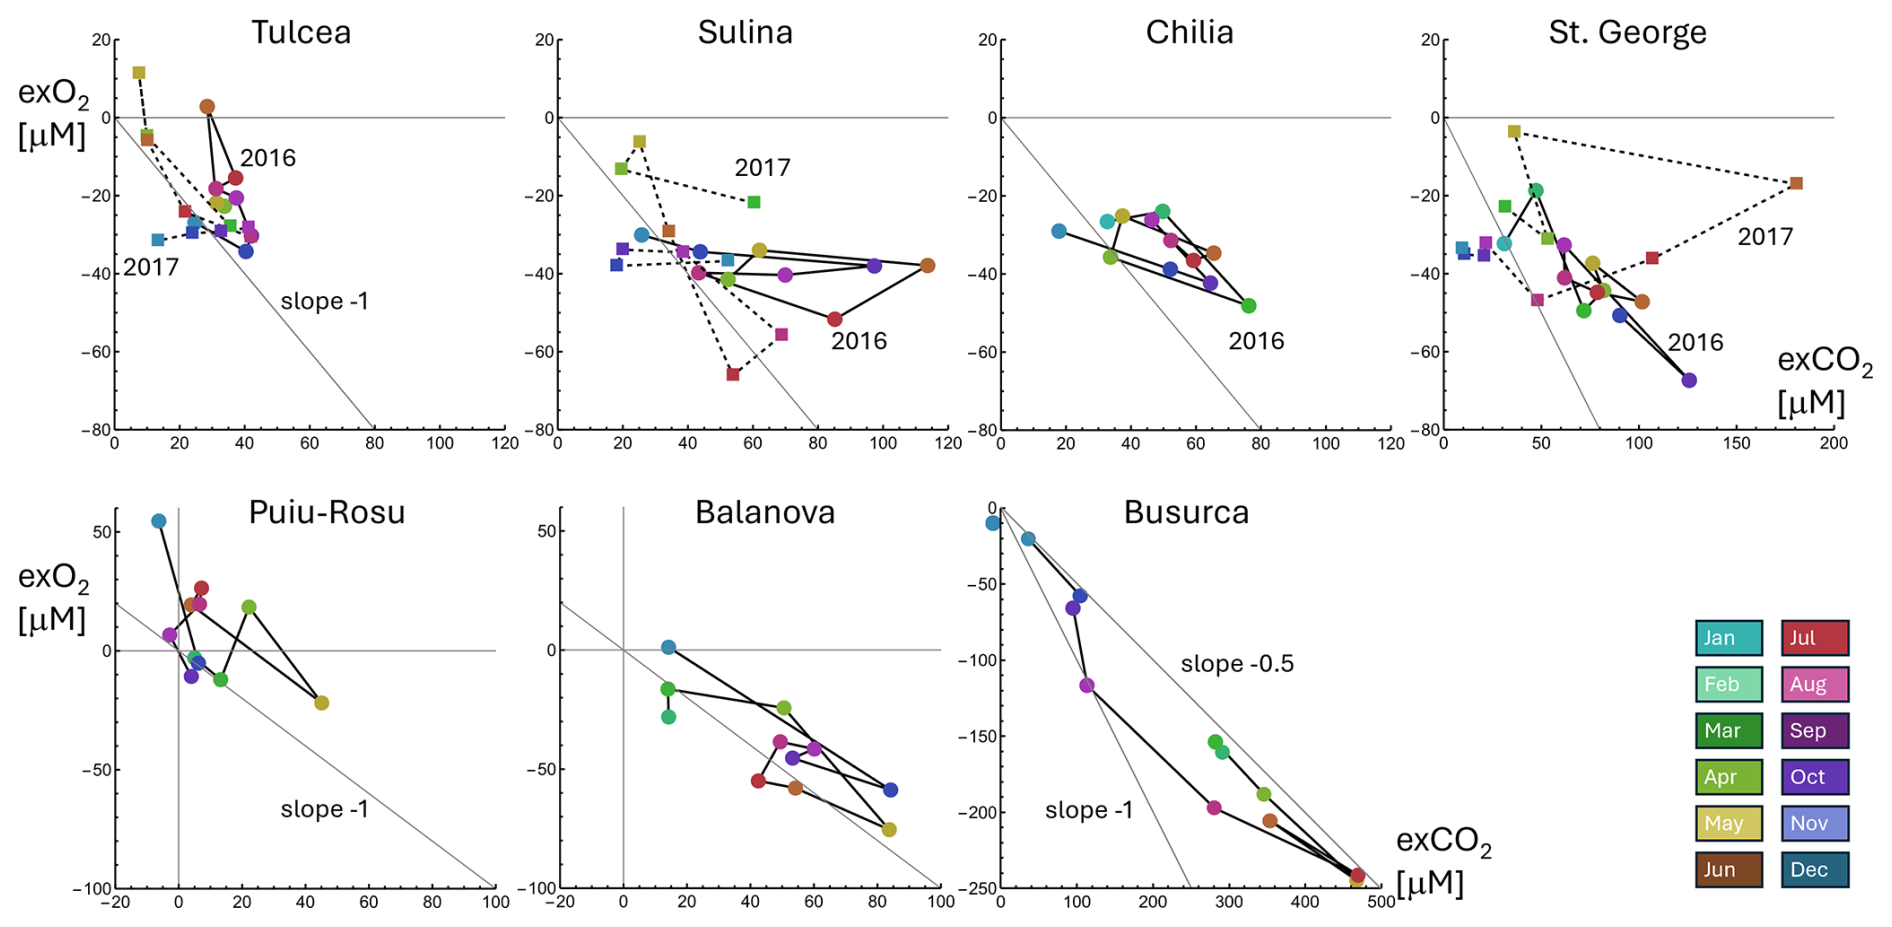
Figure 7Top: Annual trajectories of monthly centroids at the four Danube River stations in 2016 and 2017. Extended x-axis for St. George. Bottom: Monthly centroids at three stations within the Danube Delta in 2018. Extended x–y axes for Busurca.
Flood dynamics appear to play an important role at the stations within the delta. The largest flood peak during the three years of our study occurred in early April 2018 (Fig. 1) and was followed by a strong flood recession until mid-June. All three delta stations showed the highest CO2 loads with the lowest O2 levels in May 2018, when the flooded reed stands were likely exporting carbon-rich water into the adjacent channels and lakes. Higher discharge in July–August reversed the situation and moved the Busurca centroids towards photosynthesis-respiration line with slope −1. However, when exceptionally dry conditions re-established the wetland discharge in October–November, the Busurca centroids moved back towards the slope −0.5 line (Fig. 7).
3.3 CO2 emissions
Finally, we address the third hypothesis that a boost in aquatic metabolism in the delta and additional wetland discharge will increase the average aquatic CO2 emissions on the final stretch before a river reaches the sea. To compare CO2 emission rates across the delta, we calculated average exCO2 values at the seven stations. To avoid sampling bias caused by interruptions during winter, we interpolated missing months by average cold season values and obtained mean emission rates over two years for Tulcea, Sulina and St. George and over one year for the other stations (Table 2). The average exCO2 at the three downstream stations was 54 µM corresponding to a 1.9 times higher supersaturation level than at Tulcea.
Table 2Average exCO2 supersaturation recorded in 2016–2017 at Tulcea, Sulina and St. George, in 2016 at Chilia and in 2018 at Puiu-Rosu, Balanova and Busurca. Warm = warm season, April–September, cold = cold season,October–March.
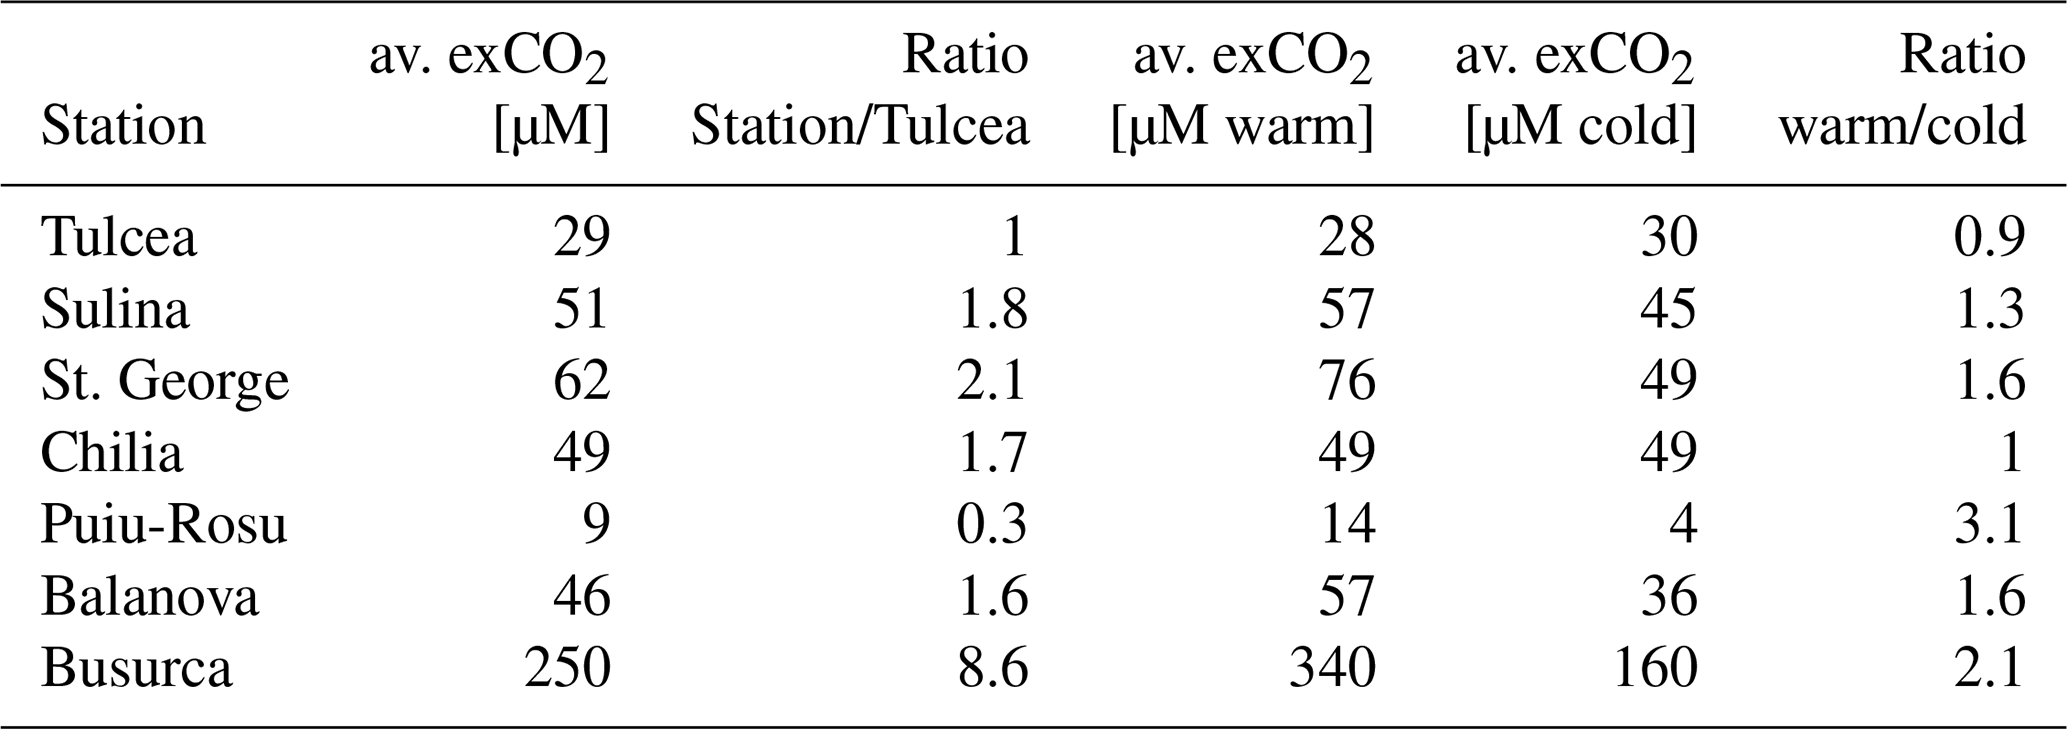
In 2018 the lake outflow at Puiu-Rosu showed only 31 % of the exCO2 supersaturation observed at Tulcea in the two preceding years, whereas the wetland discharge at Busurca reached almost an order of magnitude higher exCO2 levels. In a previous study based on discrete samples and floating chamber measurements, Maier et al. (2021) determined the median values of the gas transfer coefficients k600 [m s−1] for the different waterscapes of river reaches, lakes and channels. These results allowed the estimation of updated CO2 emission rates based on the continuous sensor observations. For the river reaches, we assumed an emission scenario of a linear increasing between Tulcea and the three downstream stations. For comparison with an earlier study (Maier et al., 2021), the Puiu-Rosu station was used as representative estimate for lakes and the average between Balanova and Busurca was assumed to represent the mean channel emission rate (Table 3).
Despite substantially higher CO2 concentration in channels compared to the river reaches and lakes, the waterways of the delta contribute a similar amount as lakes to total emissions because of their small surface area. According to data from global meta-analyses, the vast area of reed stands holds the potential for significant CO2 drawdown (Li et al., 2025; Lu et al., 2017).
Table 3CO2 emission rates across aquatic ecosystems in the Danube Delta based on average exCO2 values and median gas transfer rates. The 25 % and 75 % quartiles are shown in brackets. Gg=109 g.

* Data from Maier et al. (2021), CO2 uptake data from Li et al. (2025) and Lu et al. (2017)
4.1 Variability of ecosystem metabolism
Why is it relevant to study the differences in river metabolism between lowland river reaches and wetland channels? Our study provides evidence for significantly faster metabolic processes in the slowly moving waters of the delta wetlands compared to the main river reaches of the Danube. Monthly averages of 24 h amplitudes and the stretch of exO2–exCO2 covariance ellipses consistently indicate a 4–8 times more intense aquatic ecosystem metabolism within the delta. This distinction is particularly relevant in the context of ongoing wetland restoration efforts across the Lower Danube (Csagoly et al., 2018), where changes in hydrological connectivity may substantially alter carbon processing, nutrient retention, and greenhouse-gas dynamics (Hemes et al., 2018; Tschikof et al., 2022).
Additional analyses of daily DIC variability support the evidence for more intense carbon processing within the delta, although the DIC patterns exhibit higher stochasticity due to hydrological fluctuations. In contrast the direct response of O2 to photosynthesis and respiration, DIC concentrations are influenced by a broader range of interacting processes, like groundwater inputs, sediment-water exchange, and episodic flooding events. These hydrological perturbations can alter both the concentration and residence time of dissolved carbon, partially masking the metabolic signal at daily time scales.
The mean daily exO2 amplitude as an indicator for metabolic activity covered two orders of magnitude from cold season values in the upstream station of the Danube with cold-season values around 1 µM at Tulcea to a warm season maximum of 100 µM observed at Balanova station in August 2018. The dense aquatic vegetation in the delta lakes and channels including floating reed, riparian vegetation, macrophytes and high chlorophyll concentration translate into high substrate availability for ecosystem respiration (Coops et al., 2008; Oprea et al., 2024). A hydrological model for the Delta estimated travel times across the network of channels and lakes on the order of 2–3 weeks for the Puiu-Rosu and Balanova stations (Oosterberg et al., 2000), facilitating a high biomass concentration in prolonged contact with moving water. Average exCO2 concentrations close to 0.5 mM at Busurca in May and July 2018 may therefore result from the accumulation of mineralization products over timespans of weeks in water parcels traversing the reed stands (Fig. 5). By contrast, water residence times in the main river reaches are much shorter: sensor data revealed travel times between Tulcea and in the three downstream stations on the order of one day for Sulina and St. George and two days for Chilia essentially limiting the time for accumulating changes in O2 and CO2.
The significant differences between the three river reaches, can likely be attributed to their morphology and hydrological connectivity. Patterns exO2–exCO2 pairs within covariance ellipses retained close similarity between Tulcea and the downstream stations of Sulina and Chilia, whereas they appeared “randomized” at St. George (Fig. 6). The Sulina channel has been strongly modified for navigation with straight geometry and dykes that reduce lateral exchange, while the Chilia branch retains a more natural meandering geometry. The St. George reach consist of natural meanders and straight cuts for navigation, resulting in a broader distribution of water travel times and more intense exchange with adjacent wetlands and aquifers. This close interaction with wetlands at St. George likely superimposes multiple water masses with different metabolic histories, thereby disrupting the coherent diel covariance patterns that were preserved at Sulina and Chilia. Consequently, the 24 h amplitudes of exO2, exCO2 and DIC all follow the sequence St. George > Chilia > Sulina consistent with decreasing lateral connectivity (Fig. 4).
We used the daily stretch factors to test hypotheses that water temperature and cloud cover would influence the intensity of aquatic metabolism (Table 1). Overall, the correlation between cloud cover and covariance stretch was weaker than for water temperature as a forcing factor. The relations between cloud cover, photosynthetically active radiation, PAR, (Kathilankal et al., 2014) and metabolic response are inherently complex in multiyear (Dodds et al., 2013) or multisite analyses (Mulholland et al., 2001). As cloud cover does not directly translate to in-situ light conditions due factors like the seasonality of daylight and water transparency, further assessments require local PAR analyses at the monitoring stations. Such local data were available for determining the temperature sensitivity of metabolic amplitudes. The regression of daily mean in-situ temperatures with diel stretch factors resulted in a temperature sensitivity of the aquatic metabolism of 0.7 µM °C−1 in river reaches and 2.8 µM °C−1 in delta channels. These results suggest that a warming climate would affect the wetland's aquatic metabolism about four times more strongly than main river branches. Previous studies have shown that biofilm respiration exhibits complex temperature sensitivity (Dybdahl et al., 2024) while ecosystems with higher quantities of organic substrate are subject to stronger temperature sensitivity of ecosystem respiration (Jankowski et al., 2014).
The timing of daily cycles indicates a preferred sampling window around noon for obtaining representative values of O2, CO2 and DIC, whereas the early hours of 05:00–08:00 am EET and the late afternoon of 03:00–06:00 pm would introduce the largest sampling biases in the case of the lower Danube aquatic ecosystems (Figs. 3 and D1). For logistical reasons, field work is often scheduled between the late morning and early afternoon hours, which likely explains, why the CO2 emission rates based the continuous monitoring of this study (Table 3) agrees very with results from grab samples collected during field campaigns during the same years (Maier et al., 2021).
4.2 Wetland discharge
What are the effects of wetland discharge on river biogeochemistry and how can we identify its origin and magnitude? Large-scale approaches may analyse the CO2 dynamics within an entire river system: sampling transects across the Congo River a study demonstrated that lateral connectivity with riparian wetlands was driving spatial and temporal variability of CO2 concentrations and the river's greenhouse gas emissions (Borges et al., 2019). More targeted study designs focus directly on wetland drainage pathways: recent studies revealed disproportionally high contributions of ditches to CO2 emissions from Dutch peatlands (van der Knaap et al., 2025) and from a Phragmites dominated Chinese wetland (Xue et al., 2025). In the present study, we combined both approaches, although logistical constraints prevented synchronous observations of river reaches and delta channels.
The order of magnitude of exCO2 found in the delta channels compares well with a global meta-analysis of wetland ecosystem metabolism (Richardson et al., 2024). These authors reported mean values of dissolved pCO2 for fens and bogs of 3400 and 4100 ppm, respectively, which corresponds to approximately 100 µM exCO2 and falls within the range of downstream Danube stations with exCO2 of ∼50 µM and the extreme case of Busurca with 500 µM (Fig. 7). The mixing ration of wetland discharge in the Danube branches can be estimated based on the mean warm-season offset at Busurca (∼100 µM). If we interpret offsets of 0–100 µM as a proxy for lateral inflow of 0 %–100 %, then the warm-season offsets observed in 2016 at Chilia, Sulina, and St. George would correspond to contributions of wetland discharge of 13, 22 % and 25 % to total flow in these River reaches. These estimates should be considered as upper limits considering that the diversion of Danube water through the delta was estimated at 10 % (Oosterberg et al., 2000). The discrepancy can be attributed to incomplete horizontal mixing, and the positioning of the sensors close to the riverbanks. At the St. George station the inflow from the Tartaru Channel probably contributed the large offsets observed between May and July 2017 (Fig. 7).
A quantitative assessment of the different lateral interactions affecting the three Danube River reaches was based on monitoring the average monthly difference in DIC concentrations between the downstream stations and the inflow at Tulcea (Fig. C3). Integrating these differences from April–December 2016 reveals an annual DIC addition of 0.5 and 1.2 at Sulina and St. George, respectively. The observations in 2017 provided a similar result for St. George, but a higher accumulation rate for the Sulina stations. The seasonal balance for the Chilia branch, however, resulted in a negative value (). These contrasting observations can be explained by differences in hydrological connectivity and the origin of lateral inflows. Sulina and St. George are receiving carbon-rich wetland water. The important northern inflow to Chilia, however, originates from Lake Yuluph, the largest freshwater lake in Ukraine. Water from this system is transported via Lake Kuhurlui and connecting channels to the Chilia branch and appears to deliver DIC-depleted water.
A final question remains: how can we explain the absolute stoichiometry of up to 1:2 for exO2 : exCO2 during the warm season at the station downstream of the delta and within the Balanova and Busurca channels receiving wetland discharge? A mapping campaign in October 2017 with in-situ CH4 sensors reported median CH4 concentrations of 0.54, 0.70 and 2.2 µM for the Danube reaches, lakes and channels and an extreme value of 16 µM at a hotspot site near Busurca station (Canning et al., 2021). These data provide indirect evidence for an important source of CO2 co-generated by methanogens in anaerobic sediments of the reed stands. Although lateral water fluxes were not measured directly, the combination of CO2 enrichment, O2 depletion and deviations from 1:1 stoichiometry provides a consistent biogeochemical signature of wetland-derived inputs (Borges et al., 2019; Maier et al., 2021; Zuijdgeest et al., 2016). This anaerobically generated CO2 contributes to the offset towards a diagonal of slope −0.5 (Fig. 7). A portable membrane inlet mass spectrometer for O2, N2, He and Ar used during the same campaign in May and October 2017 revealed additional processes affecting O2 : CO2 ratios including excess air formation in riverbanks and root ventilation in Phragmites stands. These processes may fuel methane oxidation but will remain “invisible” to sensors in the water column (Maier et al., 2022). Therefore, anaerobically generated CO2 accumulating in the water column of reed beds, provided a distinct biogeochemical signature for identifying wetland discharge to channels and river reaches in the delta.
4.3 CO2 emissions by the wetland pump
In their perspective paper, Abril and Borges (2019) argued that riparian wetlands should be included in an expanded version of the reactive pipe concept for rivers (Cole et al., 2007). With their high productivity and slow gas-exchange at the air–water interface, riparian wetlands release large amounts of dissolved CO2. Additional fluxes of plant litter, and DOC add to the function of wetland discharge as a carbon pump. There is now increasing evidence that the wetland CO2 pump is increasing CO2 emissions of inland waters across different climatic zones from the tropical Congo River (Borges et al., 2019) to the arctic River Ob (Vorobyev et al., 2024).
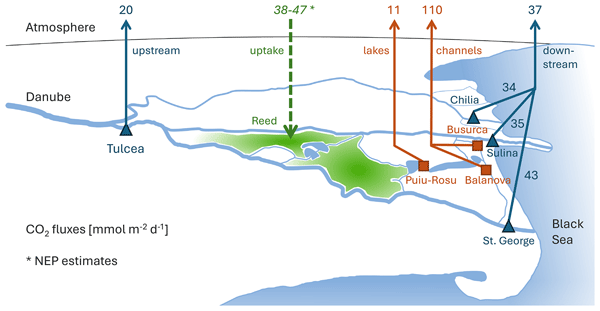
The exCO2 records (Fig. 5 and Table 2) allow constraining magnitude and timing of the wetland pump in the Danube Delta. Overall, the downstream stations exhibited exCO2 values and emission rates which were 1.7–2.1 times higher than measured at Tulcea (Fig. 8). Within the delta the high productivity of the Lake Puiu-Rosu complex reduced the average CO2 supersaturation to 30 % with reference to the inflowing Danube water indicating substantial CO2 uptake. In contrast, wetland discharge increased the average exCO2 by factors of 1.6 and 8.6 at Balanova and Busurca. The excess CO2 levels remained relatively constant at Tulcea and in the near natural Chilia branch receiving mainly lake outflow. Within the delta channels and at the Sulina and St. George stations, however, the wetland pump was most active during the warm season with exCO2 ratios between the warm and cold season of 1.3–2.1 (Table 2). This pronounced seasonality of the carbon pump is likely driven by the significant temperature dependence of the aquatic metabolism (Table 1) and the hydrological dynamics with flood peaks in spring an early summer (Fig. 1a).
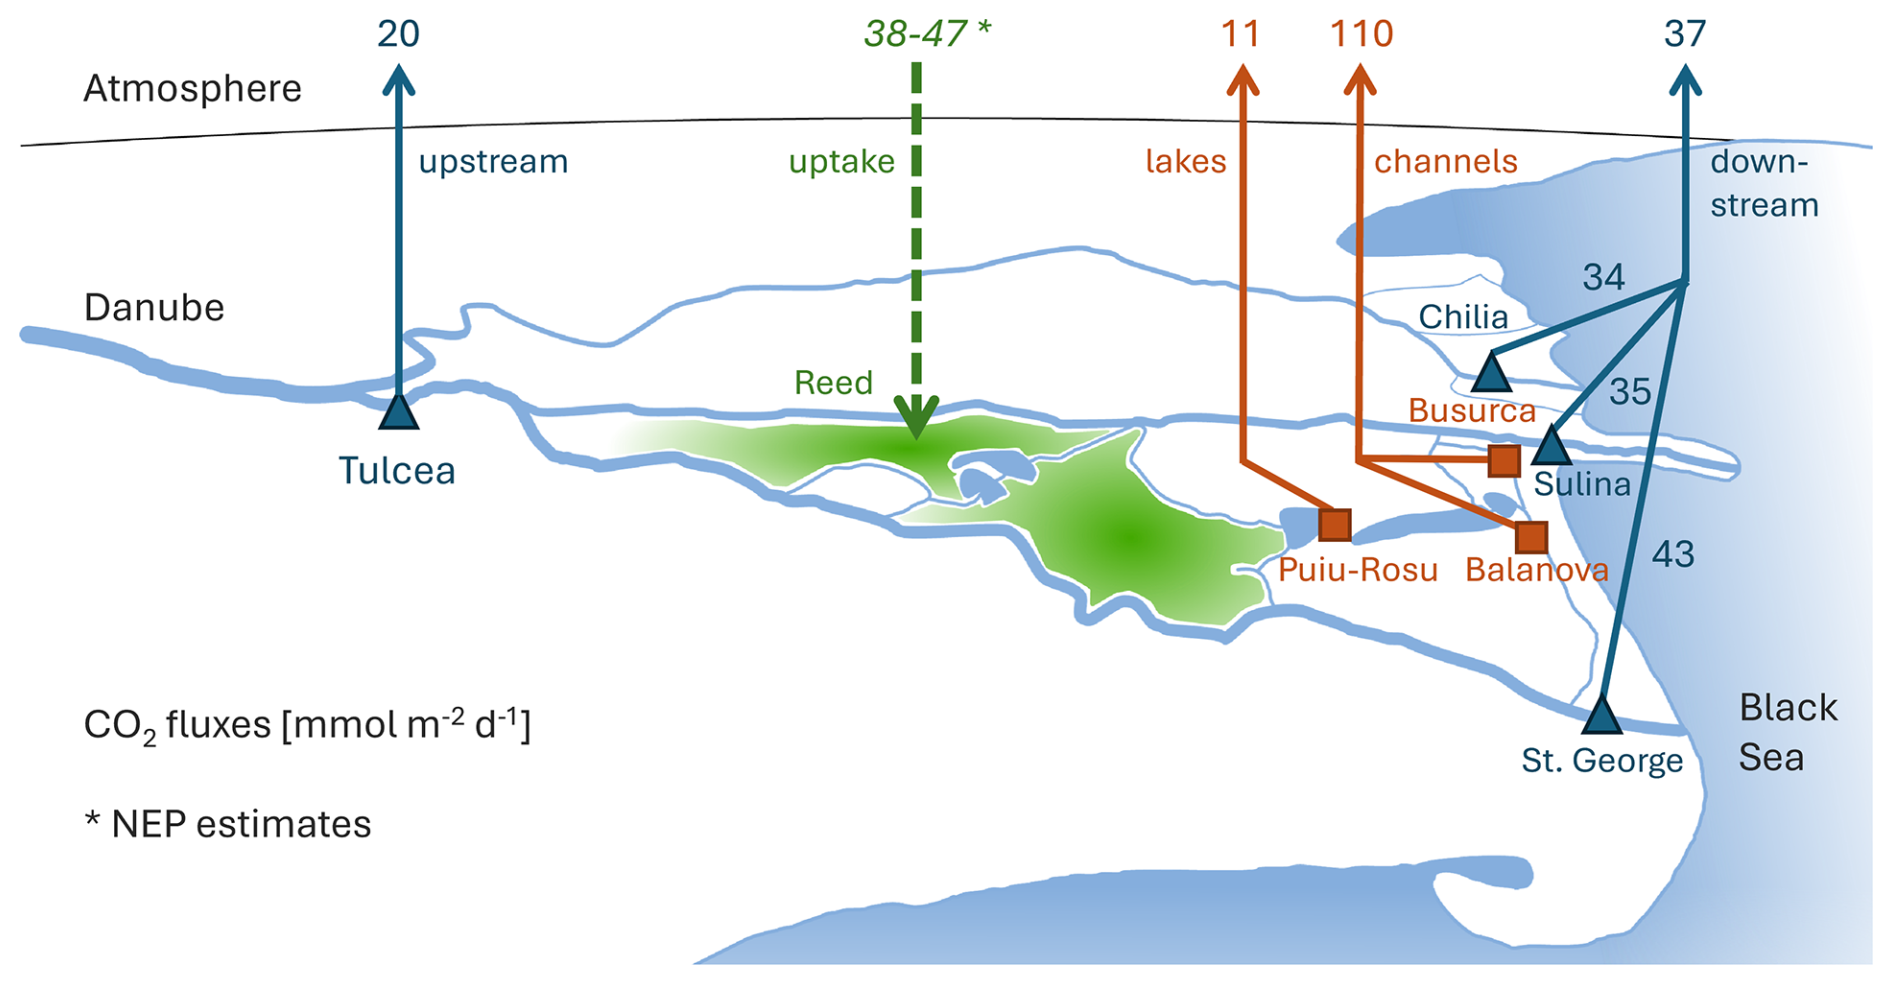
Figure 8Schematic overview of average CO2 emission rates in main river reaches upstream and downstream of the Danube Delta for 2016-2017 compared to stations within the delta in 2018 and global median net ecosystem production (NEP) uptake by wetlands from Li et al. (2025) and Lu et al. (2017).
The day-night cycles of exCO2 reached their maximum typically in the morning hours and showed a minim in the late afternoon and early evening (Fig. 3). Individual water samples were taken across the delta in 2016 and 2017 during daytime (Maier et al., 2021). The analysis of the three river reaches revealed no significant difference between individual water samples and the average values from the high-frequency records in this study (Table 3). This result seems to contradict a global study (Gomez-Gener et al., 2021) which reported evidence for higher night-time CO2 emissions from rivers based on an extensive compilation of day and night CO2 data. Analysing the 24 h cycles at the four Danube River stations in more detail (Fig. D1) reveals that sampling around midday captured values relatively close to mean daily conditions because exCO2 maxima and minima were cantered around the early morning and late afternoon hours, respectively. For systems affected by the wetland pump, these results indicate that the day-night sampling bias will depend on factors like lateral connectivity and water exchange rates.
Finally, we must address the “elephant in the delta” – namely the role of CO2 uptake by wetland vegetation and specifically by Phragmites stands. Direct carbon uptake by emergent wetland plants remains largely invisible to aquatic sensing, yet meta-analyses of net ecosystem production (NEP) report average global values of 168 and 208 for marshes (Li et al., 2025) and coastal wetlands (Lu et al., 2017), respectively. Applied to a 1600 km2 area of Phragmites dominated reed stands in the Danube Delta, these rates correspond to a carbon uptake on the order of 270–330 Gg C yr−1. This estimated uptake is roughly five time higher than the diffuse CO2 emissions from water surfaces in the delta region estimated as 49 Gg C yr−1 (this study, Table 3) and 60 Gg C yr−1 (Maier et al., 2021). This scenario estimates indicate that the wetland CO2 pump observed in the Danube delta is driven by the highly productive reed stands which act as strong net sink for CO2 at the landscape scale. Much of the CO2 released into channels and river branches originates from the respiration of recently fixed organic matter within reed stands and wetland sediments. At the same time, the sustained primary production of Phragmites seasonally removes atmospheric CO2 and transfers carbon into submerged biomass and accumulating sediments. The high CO2 emissions from water surfaces in the delta are therefore part of an efficient carbon processing ecosystem. A complete assessment of the carbon budget would require ecosystem-scale CO2 and CH4 exchange measurements, for example by eddy-covariance techniques, which have provided the basis for many wetland carbon budgets (Zou et al., 2022).
This study combined covariance analysis with averaging 24 h cycles of O2–CO2 pairs from sensor measurements at seven locations in the Danube Delta region. The dataset covered 105 monthly and about 3000 daily cycles. The results provide answers to the guiding questions outlined in the introduction:
-
How does the intensity of river metabolism differ between the open waters of the delta compared to the upstream Danube River? Analysing the intensity of exO2–exCO2 dynamics revealed two orders of magnitude difference in the amplitude of average diel cycles among stations and seasons with the lowest values during the cold season in the upstream stretch of Danube and the highest intensity in August at the the Balanova channel. The monthly average of 24 h amplitudes and the stretch of exO2–exCO2 covariance ellipses consistently indicated a 4–8 times more intense aquatic ecosystem metabolism within the delta compared to the main river branches.
-
How significant is the contribution of lateral inflows from lake systems and reedbeds to the O2 and CO2 dynamics of the main river reaches crossing the delta? Wetland discharge could be identified by CO2 rich water causing an offset with respect to the exO2 : exCO2 stoichiometry. Based on this indicator local wetland discharge was estimated as 13 %–25 % of total discharge. These numbers exceed the total estimates of river diversion through the delta and should therefore be considered an upper limit. Balancing DIC increases along the final stretches of the main Danube branches revealed clear differences between low-carbon inflow from lakes in Ukraine and high-carbon wetland discharge in the southern part of the Delta.
-
What are the overall effects of river metabolism and wetland discharge on aquatic CO2 emission rates in the Danube Delta? The exCO2 records helped quantifying the magnitude of the wetland CO2 pump in the Danube Delta. Overall, the downstream stations near the Black Sea exhibited exCO2 values which were 1.7–2.1 times higher than at Tulcea. The estimated annual diffuse CO2 emissions from water surface in the delta of 49 Gg C yr−1 were compatible with an earlier estimate based on more stations but less frequent sampling of 60 Gg C yr−1. Estimates of the landscape-level CO2 sink by the highly productive wetlands, however, are ∼5 times higher.
In summary, the well-connected delta wetlands provide a boost in ecosystem metabolism which leaves clear signals of the wetland CO2 pump in the lateral discharge reaching the main Danube branches. At the landscape scale, however, there is evidence from the literature that the highly productive wetland areas act as a net carbon sink which retains organic carbon in the sediments and exports POC and DOC to the Black Sea (Durisch-Kaiser et al., 2010; Maier et al., 2021).
The monitoring stations were located upstream of the Delta at Tulcea and downstream along the three branches of the Danube at St. George, Sulina and Chilia (Fig. 1). During the final year, the sensors were relocated to the Puiu-Rosu, Balanova, and Busurca channels within the Delta. The time coverage during the field campaign ranged between 11 and 21 months per station (Table A1). Spike removal at Sulina and Busurca reduced the number of observation days (Sect. 2.2). Due to logistical constraints the sensors were typically moored from anchored boats (Fig. A1).
Table A1Time series of O2, CO2 and DIC observations.
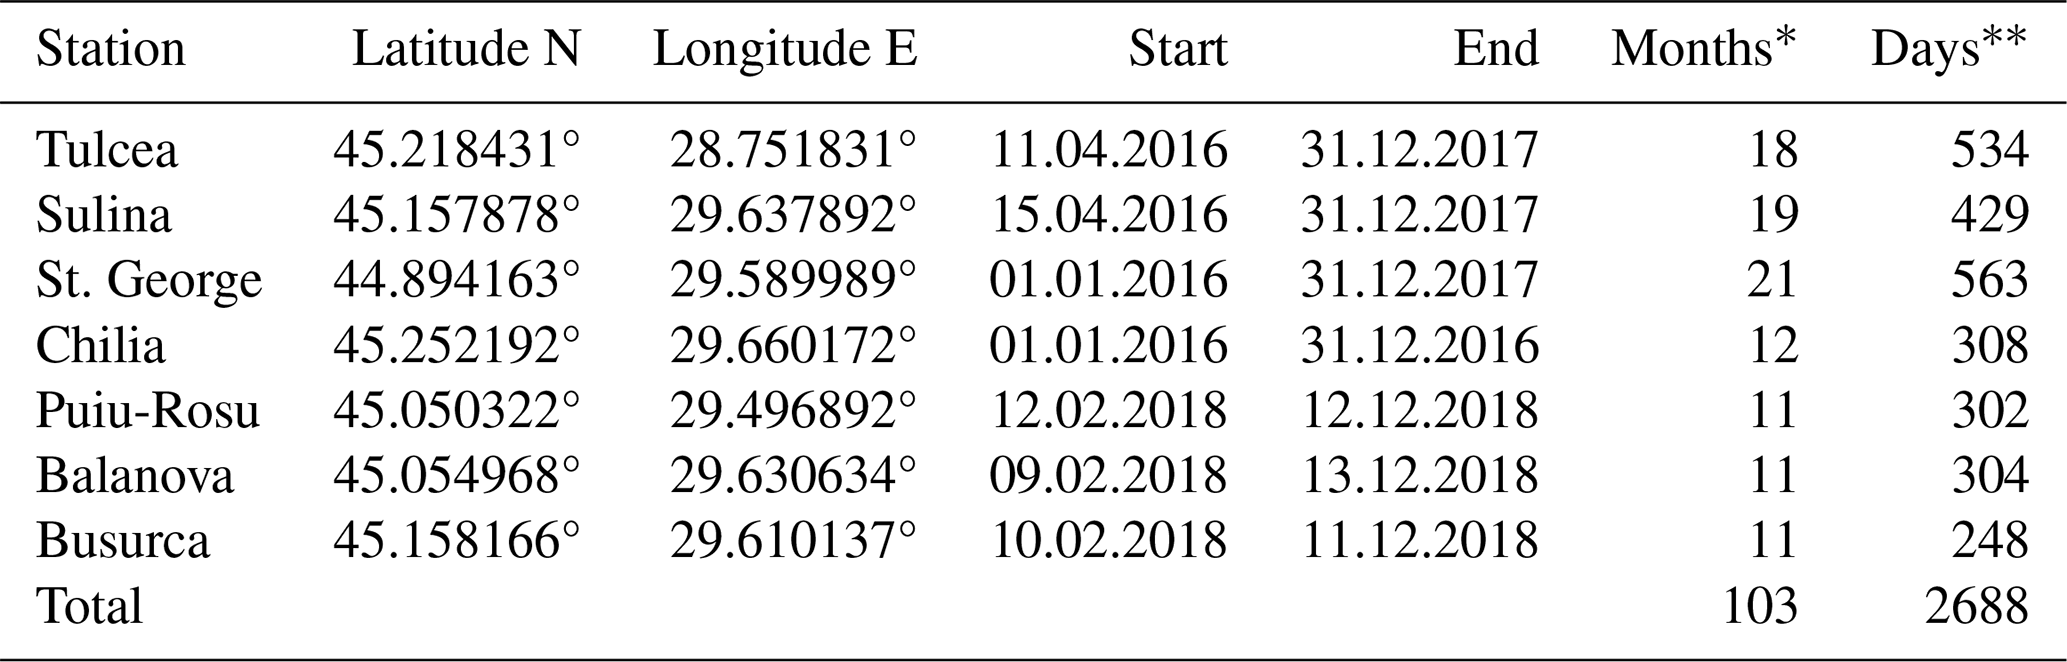
* Months with >500 data, days with >85 data.

Figure A1Characteristics of monitoring sites. (a) The Chilia site was located on the Romanian side of a small branch that defines the border with Ukraine. Despite its location in a sidearm, the water showed the same chemical signature as the main branch at the time of installation. (b) EXO2 probe at the Chilia station during winter conditions. (c) Clear water from the Busurca channel entering the Sulina reach of the Danube from the right. The Busurca monitoring station was located 25 m upstream of the confluence with the Sulina branch. (d) Sulina station located about 1 km downstream of Busurca junction and moored at an old, anchored ship. (e) View from Tartaru channel close to Balanova station. The Danube branch of St. George in the background with its turbid water is flowing from left to right towards the Black Sea. (f) For logistical reasons, the monitoring station at St. George branch was located about 500 m downstream of the confluence with the Tartaru channel. The Black Sea is visible on the horizon. (g) The Balanova multiprobe was deployed in the Central Channel connecting Sulina and St. George branches. The channel runs parallel to the gravel road linking two communities. The location is influenced by water originating from Lake Rosu. Balanova is a local name. (h) The Puiu-Rosu sensor recorded water quality at the outlet of Lake Puiu. The station was located on a small channel connecting Lake Puiu with Lake Rosu. (i) The Busurca multiprobe was moored on a small, anchored houseboat. Not shown: The Tulcea station monitoring Danube water at the apex of the delta. The station was located 300 m downstream of the bifurcation between the Tulcea and Chilia branches.
The EXO2 sensors measured pH, temperature and specific conductivity at a frequency of 15 min. Using grab samples we correlated the continuous conductivity data with discrete lab-based alkalinity measurements (Raymond et al., 2013) and used the COSYS code (van Heuven et al., 2011) to calculate dissolved CO2 concentrations (Sect. 2.2).
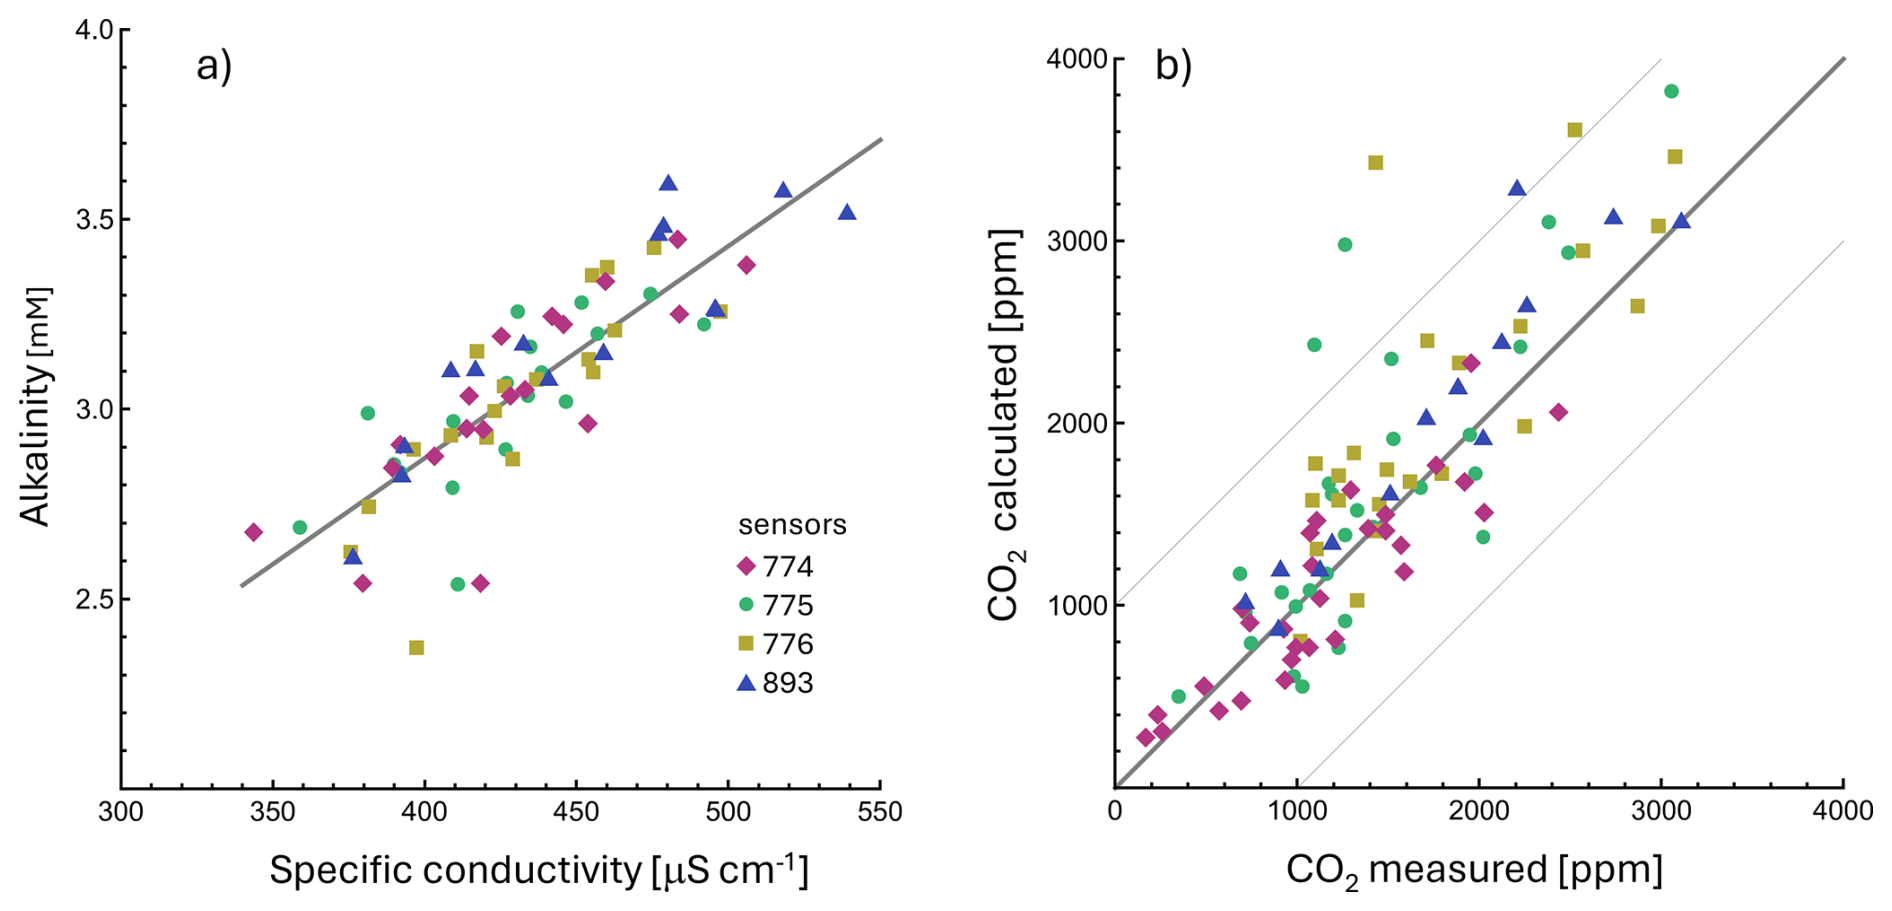
Figure B1(a) Linear regression of alkalinity analyses from water samples versus specific conductivity. The specific conductivity recorded by the EXO2 sensors was correlated with alkalinity measurements obtained from titration analysis of water samples taken at the same time and location. Labels mark the four different EXO-2 probes. Alkalinity specific conductivity [µS cm−1] +0.60, with a correlation coefficient of R2=0.70. (b) Measured CO2 data based on the headspace technique compared to dissolved CO2 calculated from EXO2 data Alkalinity was estimated by correlation (panel a) and pH plus temperature records were combined to calculate dissolved CO2. With few exceptions, the CO2 estimates compared well with direct CO2 measurements (R2=0.82). Diagonal marks the 1:1 relationship with lines at ±1000 ppm. Symbols represent the same sensors as in panel a).
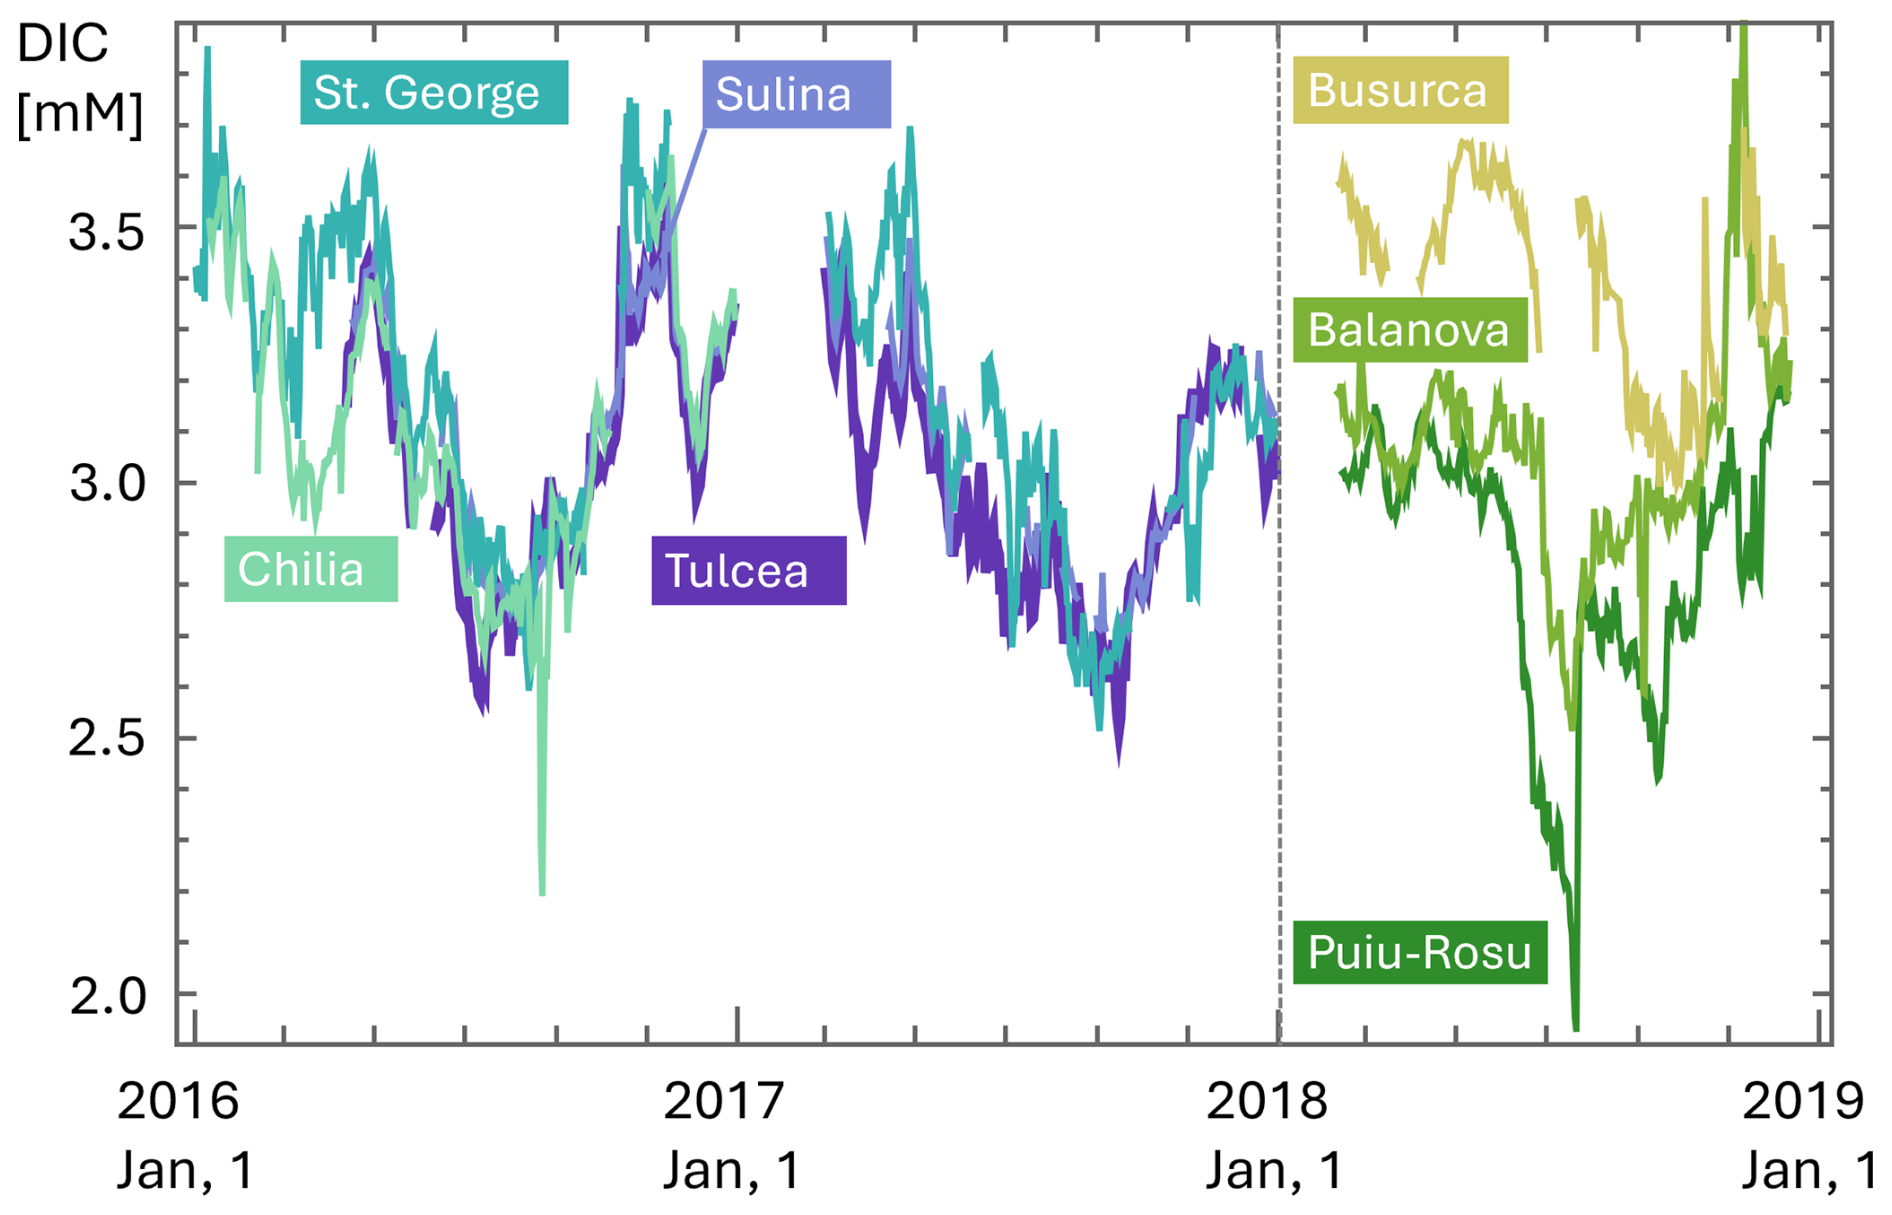
Figure C1Timeseries of DIC [mM] at the seven stations from January 2016–December 2018. DIC based on measurements of conductivity, temperature, pH, and the calibration with titration alkalinity (Fig. B1a).
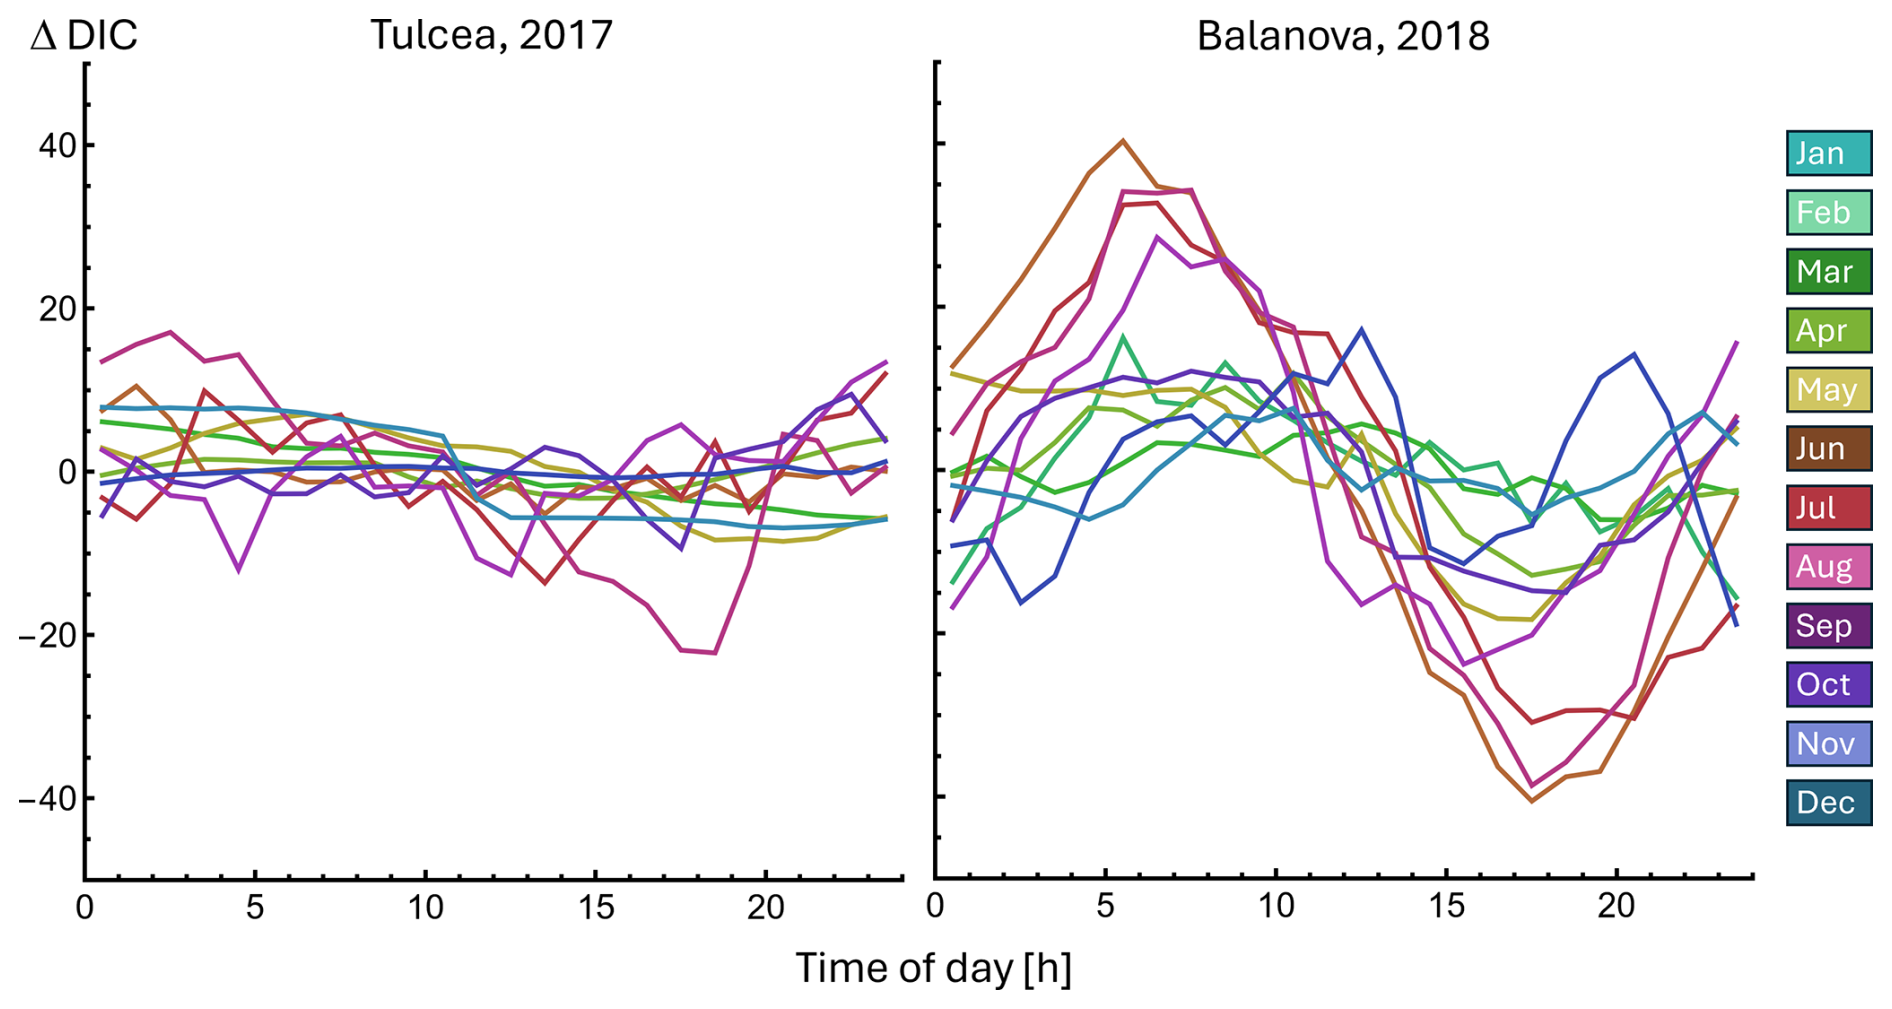
Figure C2Example of 24 h monthly averages for DIC at Tulcea from March–December 2017 and at Balanova station from February–December 2018. The DIC [micromolar] cycles show stronger random variability compared to the exO2 and exCO2 cycles in Fig. 3. Rapid changes in DIC at monthly timescales are likely and important source of this stochasticity (Fig. C1).
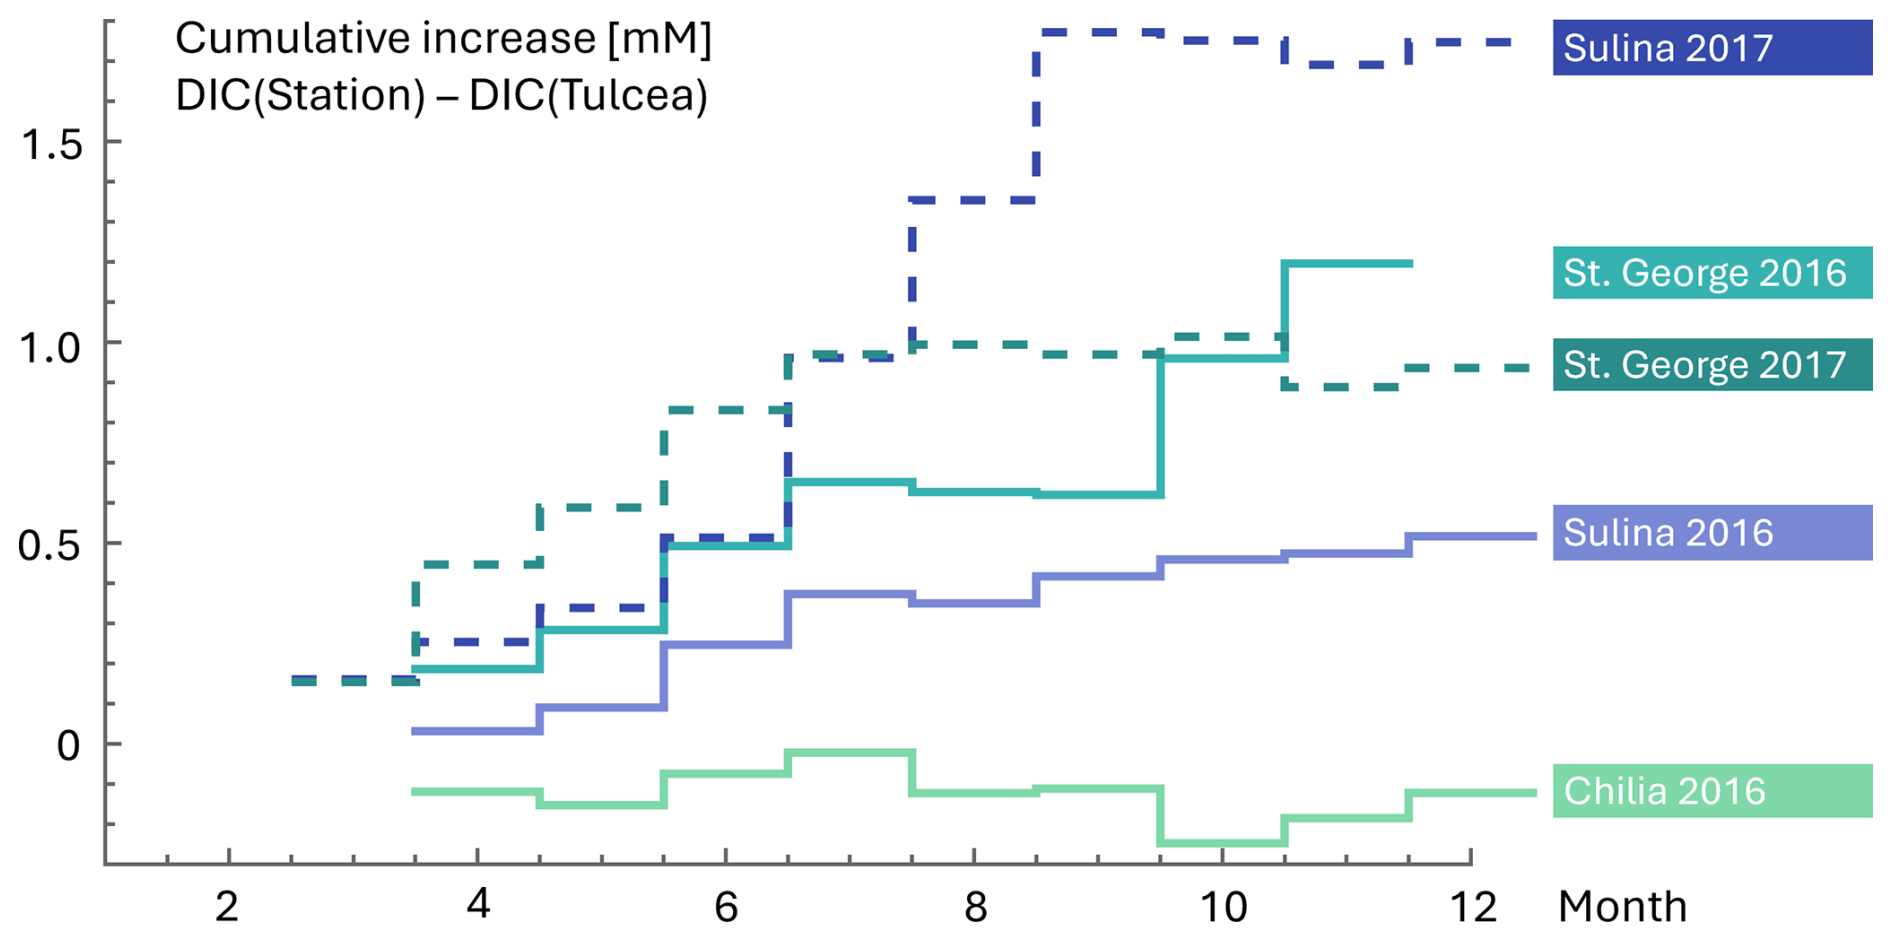
Figure C3Cumulative increase in DIC concentration during seasonal cycles calculated from the difference between the mean monthly DIC at a station and the upstream data at Tulcea.

Figure D1Monthly averaged time-of-day plots showing exCO2 (solid lines) and exO2 (dashed) during 2016 and 2017 at the Danube stations during 2018 at the Delta stations. Extended y-axis for Busurca.
The Mathematica code is available at https://doi.org/10.5281/zenodo.21456490 (Wehrli, 2026).
Timeseries data and the calculated daily and monthly covariance parameters for all stations are available at the ETH research collection via https://doi.org/10.3929/ethz-c-000786936 (Wehrli et al., 2025).
Field campaigns and statistical analyses were designed with input from all authors, BW provided project supervision, CRT led the monitoring campaigns and data collection, M-SM contributed to field work and was responsible for laboratory analyses, quality control and calculating exCO2, exO2 and DIC timeseries. BW led the coding, drafting and writing of the paper with continuous input from M-SM and CRT.
The contact author has declared that none of the authors has any competing interests.
Publisher's note: Copernicus Publications remains neutral with regard to jurisdictional claims made in the text, published maps, institutional affiliations, or any other geographical representation in this paper. The authors bear the ultimate responsibility for providing appropriate place names. Views expressed in the text are those of the authors and do not necessarily reflect the views of the publisher.
We thank Christian Dinkel, Patrick Kathriner and Tim Kalvelage for their support during fieldwork and lab analyses. The authors are grateful for constructive reviews and comments by Ji-Hyung Park, Jacob Diamond and an anonymous reviewer which helped to significantly improve an earlier version of the manuscript.
This study was supported by the Swiss State Secretariat for Education, Research and Innovation (SERI; grant no. 15.0068). The research consortium received funding from the European Union's Horizon 2020 research and innovation programme under the Marie-Skłodowska-Curie-Actions (grant no. 643052; C-CASCADES project). The Swiss National Science Foundation (SNF) and Eawag provided funding for the EXO2 probes (R'EQUIP 157750).
This paper was edited by Ji-Hyung Park and reviewed by Ji-Hyung Park, Jacob Diamond, and one anonymous referee.
Abril, G. and Borges, A. V.: Ideas and perspectives: Carbon leaks from flooded land: do we need to replumb the inland water active pipe?, Biogeosciences, 16, 769–784, https://doi.org/10.5194/bg-16-769-2019, 2019.
Aho, K. S., Hosen, J. D., Logozzo, L. A., McGillis, W. R., and Raymond, P. A.: Highest rates of gross primary productivity maintained despite CO2 depletion in a temperate river network, Limnology and Oceanography Letters, 6, 200–206, https://doi.org/10.1002/lol2.10195, 2021.
Battin, T. J., Lauerwald, R., Bernhardt, E. S., Bertuzzo, E., Gener, L. G., Hall, R. O., Jr., Hotchkiss, E. R., Maavara, T., Pavelsky, T. M., Ran, L., Raymond, P., Rosentreter, J. A., and Regnier, P.: River ecosystem metabolism and carbon biogeochemistry in a changing world, Nature, 613, 449–459, https://doi.org/10.1038/s41586-022-05500-8, 2023.
Bernhardt, E. S., Heffernan, J. B., Grimm, N. B., Stanley, E. H., Harvey, J. W., Arroita, M., Appling, A. P., Cohen, M. J., McDowell, W. H., Hall, R. O., Read, J. S., Roberts, B. J., Stets, E. G., and Yackulic, C. B.: The metabolic regimes of flowing waters, Limnol. Oceanogr., 63, https://doi.org/10.1002/lno.10726, 2017.
Bondar, C.: Referitor la alimentarea si tranzitul apelor Dunarii prin interiorul deltei, Analele ICPDD, III/2, 259–261, 1994.
Borges, A. V., Darchambeau, F., Lambert, T., Morana, C., Allen, G. H., Tambwe, E., Toengaho Sembaito, A., Mambo, T., Nlandu Wabakhangazi, J., Descy, J.-P., Teodoru, C. R., and Bouillon, S.: Variations in dissolved greenhouse gases (CO2, CH4, N2O) in the Congo River network overwhelmingly driven by fluvial-wetland connectivity, Biogeosciences, 16, 3801–3834, https://doi.org/10.5194/bg-16-3801-2019, 2019.
Cai, W. J. and Wang, Y.: The chemistry, fluxes, and sources of carbon dioxide in the estuarine waters of the Satilla and Altamaha Rivers, Georgia, Limnol. Oceanogr., 43, 657–668, 1998.
Canning, A., Wehrli, B., and Körtzinger, A.: Methane in the Danube Delta: the importance of spatial patterns and diel cycles for atmospheric emission estimates, Biogeosciences, 18, 3961–3979, https://doi.org/10.5194/bg-18-3961-2021, 2021.
Cole, J. J., Prairie, Y. T., Caraco, N. F., McDowell, W. H., Tranvik, L. J., Striegl, R. G., Duarte, C. M., Kortelainen, P., Downing, J. A., Middelburg, J. J., and Melack, J.: Plumbing the Global Carbon Cycle: Integrating Inland Waters into the Terrestrial Carbon Budget, Ecosystems, 10, 172–185, https://doi.org/10.1007/s10021-006-9013-8, 2007.
Coops, H., Buijse, L. L., Buijse, A. D., Constantinescu, A., Covaliov, S., Hanganu, J., Ibelings, B. W., Menting, G., Navodaru, I., Oosterberg, W., Staras, M., and Török, L.: Trophic gradients in a large-river Delta: ecological structure determined by connectivity gradients in the Danube Delta (Romania), River Res. Appl., 24, 698–709, https://doi.org/10.1002/rra.1136, 2008.
Csagoly, P., Magnin, G., and Hulea, O.: Lower Danube Green Corridor, in: The Wetland Book., edited by: Finlayson, C. M., Milton, G., Prentice, R., and Davidson, N., Springer, Dodrecht, https://doi.org/10.1007/978-94-007-4001-3_251, 2018.
Dalmagro, H. J., Lathuilliere, M. J., Hawthorne, I., Morais, D. D., Pinto, O. B., Couto, E. G., and Johnson, M. S.: Carbon biogeochemistry of a flooded Pantanal forest over three annual flood cycles, Biogeochemistry, 139, 1–18, https://doi.org/10.1007/s10533-018-0450-1, 2018.
Degens, E., Kempe, S., and Ittekkot, V.: Monitoring carbon in world rivers, Environment: Science and Policy for Sustainable Development, 26, 29–33, https://doi.org/10.1080/00139157.1984.9932533, 1984.
DelVecchia, A. G., Rhea, S., Aho, K. S., Stanley, E. H., Hotchkiss, E. R., Carter, A., and Bernhardt, E. S.: Variability and drivers of CO2, CH4, and N2O concentrations in streams across the United States, Limnol. Oceanogr., 68, 394–408, https://doi.org/10.1002/lno.12281, 2023.
Diamond, J. S., Truong, A. N., Abril, G., Bertuzzo, E., Chanudet, V., Lamouroux, R., and Moatar, F.: Inorganic carbon dynamics and their relation to autotrophic community regime shift over three decades in a large, alkaline river, Limnol. Oceanogr., 70, 1122–1136, https://doi.org/10.1002/lno.70016, 2025.
Dodds, W. K., Veach, A. M., Ruffing, C. M., Larson, D. M., Fischer, J. L., and Costigan, K. H.: Abiotic controls and temporal variability of river metabolism: multiyear analyses of Mississippi and Chattahoochee River data, Freshw. Sci., 32, 1073–1087, https://doi.org/10.1899/13-018.1, 2013.
Durisch-Kaiser, E., Doberer, A., Reutimann, J., Pavel, A., Balan, S., Radan, S., and Wehrli, B.: Organic matter governs N and P balance in Danube Delta lakes, Aquat. Sci., 73, 21–33, https://doi.org/10.1007/s00027-010-0156-5, 2010.
Dybdahl, A. K., Holmboe, C. M. H., Baattrup-Pedersen, A., Riis, T., and Pastor, A.: Temperature dependence of biofilm metabolism in a lowland stream, Freshw. Sci., 43, 277–287, https://doi.org/10.1086/731873, 2024.
Gatescu, P.: The Danube Delta: Geographical Characteristics and Ecological Recovery, GeoJournal, 29, 57–67, https://link.springer.com/article/10.1007/BF00806866 (last access: 10 September 2026), 1993.
Gomez-Baggethun, E., Tudor, M., Doroftei, M., Covaliov, S., Nastase, A., Onara, D. F., Mierla, M., Marinov, M., Dorosencu, A. C., Lupu, G., Teodorof, L., Tudor, I. M., Kohler, B., Museth, J., Aronsen, E., Johnsen, S. I., Ibram, O., Marin, E., Craciun, A., and Cioaca, E.: Changes in ecosystem services from wetland loss and restoration: An ecosystem assessment of the Danube Delta (1960–2010), Ecosyst. Serv., 39, 17, https://doi.org/10.1016/j.ecoser.2019.100965, 2019.
Gomez-Gener, L., Rocher-Ros, G., Battin, T., Cohen, M. J., Dalmagro, H. J., Dinsmore, K. J., Drake, T. W., Duvert, C., Enrich-Prast, A., Horgby, A., Johnson, M. S., Kirk, L., Machado-Silva, F., Marzolf, N. S., McDowell, M. J., McDowell, W. H., Miettinen, H., Ojala, A. K., Peter, H., Pumpanen, J., Ran, L. S., Riveros-Iregui, D. A., Santos, I. R., Six, J., Stanley, E. H., Wallin, M. B., White, S. A., and Sponseller, R. A.: Global carbon dioxide efflux from rivers enhanced by high nocturnal emissions, Nat. Geosci., 14, 289–294, https://doi.org/10.1038/s41561-021-00722-3, 2021.
Haque, M. M., Begum, M. S., Nayna, O. K., Tareq, S. M., and Park, J.-H.: Seasonal shifts in diurnal variations of CO2 and O2 in the lower Ganges River, Limnology and Oceanography Letters, 7, 191–201, https://doi.org/10.1002/lol2.10246, 2022.
Hastie, A., Lauerwald, R., Ciais, P., and Regnier, P.: Aquatic carbon fluxes dampen the overall variation of net ecosystem productivity in the Amazon basin: An analysis of the interannual variability in the boundless carbon cycle, Glob. Change Biol., 25, 2094–2111, https://doi.org/10.1111/gcb.14620, 2019.
Hemes, K. S., Chamberlain, S. D., Eichelmann, E., Knox, S. H., and Baldocchi, D. D.: A Biogeochemical Compromise: The High Methane Cost of Sequestering Carbon in Restored Wetlands, Geophys. Res. Lett., 45, 6081–6091, https://doi.org/10.1029/2018gl077747, 2018.
Hotchkiss, E. R., Hall Jr., R. O., Sponseller, R. A., Butman, D., Klaminder, J., Laudon, H., Rosvall, M., and Karlsson, J.: Sources of and processes controlling CO2 emissions change with the size of streams and rivers, Nat. Geosci., 8, 696–699, https://doi.org/10.1038/ngeo2507, 2015.
Huertas, I. E., Flecha, S., Figuerola, J., Costas, E., and Morris, E. P.: Effect of hydroperiod on CO2 fluxes at the air-water interface in the Mediterranean coastal wetlands of Donana, J. Geophys. Res.-Biogeo., 122, 1615–1631, https://doi.org/10.1002/2017JG003793, 2017.
Jankowski, K., Schindler, D. E., and Lisi, P. J.: Temperature sensitivity of community respiration rates in streams is associated with watershed geomorphic features, Ecology, 95, 2707–2714, https://doi.org/10.1890/14-0608.1, 2014.
Kathilankal, J. C., O'Halloran, T. L., Schmidt, A., Hanson, C. V., and Law, B. E.: Development of a semi-parametric PAR (Photosynthetically Active Radiation) partitioning model for the United States, version 1.0, Geosci. Model Dev., 7, 2477–2484, https://doi.org/10.5194/gmd-7-2477-2014, 2014.
Li, J. J., Yuan, J. J., Ciais, P., Kang, H. J., Freeman, C., Huang, Y. Y., Dong, Y. H., Liu, D. Y., Li, Y., and Ding, W. X.: Two decades of improved wetland carbon sequestration in northern mid-to-high latitudes are offset by tropical and southern declines, Nature Ecology and Evolution, 9, https://doi.org/10.1038/s41559-025-02809-1, 2025.
Lu, W. Z., Xiao, J. F., Liu, F., Zhang, Y., Liu, C. A., and Lin, G. H.: Contrasting ecosystem CO2 fluxes of inland and coastal wetlands: a meta-analysis of eddy covariance data, Glob. Change Biol., 23, 1180–1198, https://doi.org/10.1111/gcb.13424, 2017.
Maier, M.-S., Teodoru, C. R., and Wehrli, B.: Spatio-temporal variations in lateral and atmospheric carbon fluxes from the Danube Delta, Biogeosciences, 18, 1417–1437, https://doi.org/10.5194/bg-18-1417-2021, 2021.
Maier, M.-S., Canning, A. R., Brennwald, M. S., Teodoru, C. R., and Wehrli, B.: Spatial Mapping of Dissolved Gases in the Danube Delta Reveals Intense Plant-Mediated Gas Transfer, Frontiers in Environmental Science, 10, https://doi.org/10.3389/fenvs.2022.838126, 2022.
Marzolf, N. S., Small, G. E., Oviedo-Vargas, D., Ganong, C. N., Duff, J. H., Ramirez, A., Pringle, C. M., Genereux, D. P., and Ardon, M.: Partitioning inorganic carbon fluxes from paired O2–CO2 gas measurements in a Neotropical headwater stream, Costa Rica, Biogeochemistry, 160, 259–273, https://doi.org/10.1007/s10533-022-00954-4, 2022.
Mulholland, P. J., Fellows, C. S., Tank, J. L., Grimm, N. B., Webster, J. R., Hamilton, S. K., Martí, E., Ashkenas, L., Bowden, W. B., Dodds, W. K., McDowell, W. H., Paul, M. J., and Peterson, B. J.: Inter-biome comparison of factors controlling stream metabolism, Freshwater Biol., 46, 1503–1517, https://doi.org/10.1046/j.1365-2427.2001.00773.x, 2001.
Nguyen, A. T., Abril, G., Diamond, J. S., Lamouroux, R., Martinet, C., and Moatar, F.: Multidecadal trends in CO2 evasion and aquatic metabolism in a large temperate river, Biogeosciences, 22, 4923–4951, https://doi.org/10.5194/bg-22-4923-2025, 2025.
Oosterberg, W., Staras, M., Bodgdan, L., Buijse, A. D., Constantinescu, A., Coops, H., Hanganu, J., Ibelings, B. W., Menting, G. A. M., and Navodaru, I.: Ecological gradients in the Danube Delta lakes: present state and man-induced changes, RIZA Rijkswaterstaat, NL, ISBN 90.369.5309x, 2000.
Oprea, A., Sîrbu, C., Doroftei, M., and Covaliov, S.: New Contributions to Vegetation Knowledge of the Danube Delta, Romania (I), Journal of Plant Development, 31, 159–181, https://doi.org/10.47743/jpd.2024.31.1.958, 2024.
Perkins, D. M., Yvon-Durocher, G., Demars, B. O. L., Reiss, J., Pichler, D. E., Friberg, N., Trimmer, M., and Woodward, G.: Consistent temperature dependence of respiration across ecosystems contrasting in thermal history, Glob. Change Biol., 18, 1300–1311, https://doi.org/10.1111/j.1365-2486.2011.02597.x, 2012.
Rabaey, J. S., Holgerson, M. A., Richardson, D. C., Andersen, M. R., Bansal, S., Bortolotti, L. E., Cotner, J. B., Hornbach, D. J., Martinsen, K. T., Moody, E. K., and Schloegel, O. F.: Freshwater Biogeochemical Hotspots: High Primary Production and Ecosystem Respiration in Shallow Waterbodies, Geophys. Res. Lett., 51, https://doi.org/10.1029/2023gl106689, 2024.
Raymond, P. A., Hartmann, J., Lauerwald, R., Sobek, S., McDonald, C., Hoover, M., Butman, D., Striegl, R., Mayorga, E., Humborg, C., Kortelainen, P., Durr, H., Meybeck, M., Ciais, P., and Guth, P.: Global carbon dioxide emissions from inland waters, Nature, 503, 355–359, https://doi.org/10.1038/nature12760, 2013.
Reiman, J. H. and Xu, Y. J.: Dissolved carbon export and CO2 outgassing from the lower Mississippi River – Implications of future river carbon fluxes, J. Hydrol., 578, https://doi.org/10.1016/j.jhydrol.2019.124093, 2019.
Richardson, J. L., Desai, A. R., Thom, J., Lindgren, K., Laudon, H., Peichl, M., Nilsson, M., Campeau, A., Järveoja, J., Hawman, P., Mishra, D. R., Smith, D., D'Acunha, B., Knox, S. H., Ng, D., Johnson, M. S., Blackstock, J., Malone, S. L., Oberbauer, S. F., Detto, M., Wickland, K. P., Forbrich, I., Weston, N., Hung, J. K. Y., Edgar, C., Euskirchen, E. S., Bret-Harte, S., Dobkowski, J., Kling, G., Kane, E. S., Badiou, P., Bogard, M., Bohrer, G., O'Halloran, T., Ritson, J., Arias-Ortiz, A., Baldocchi, D., Oikawa, P., Shahan, J., and Matsumura, M.: On the Relationship Between Aquatic CO2 Concentration and Ecosystem Fluxes in Some of the World's Key Wetland Types, Wetlands, 44, https://doi.org/10.1007/s13157-023-01751-x, 2024.
Rocher-Ros, G., Gomez-Gener, L., Jativa, C., Lannergård, E. E., Laudon, H., Lupon, A., Martí, E., Peñarroya, X., Sponseller, R. A., and Bernal, S.: Emerging patterns of CO2 : O2 dynamics in rivers and their link to ecosystem carbon processing, Limnology and Oceanography Letters, https://doi.org/10.1002/lol2.70057, 2025.
Rode, M., Wade, A. J., Cohen, M. J., Hensley, R. T., Bowes, M. J., Kirchner, J. W., Arhonditsis, G. B., Jordan, P., Kronvang, B., Halliday, S. J., Skeffington, R. A., Rozemeijer, J. C., Aubert, A. H., Rinke, K., and Jomaa, S.: Sensors in the Stream: The High-Frequency Wave of the Present, Environ. Sci. Technol., 50, 10297–10307, https://doi.org/10.1021/acs.est.6b02155, 2016.
Romanova, Y., Shakirzanova, Z., Ovcharuk, V., Todorova, O., Medvedieva, I., and Ivanchenko, A.: Temporal variation of water discharges in the lower course of the Danube River across the area from Reni to Izmail under the influence of natural and anthropogenic factors, Energetika, 65, 144–160, https://doi.org/10.6001/energetika.v65i2-3.4108, 2019.
Rosentreter, J. A., Laruelle, G. G., Bange, H. W., Bianchi, T. S., Busecke, J. J. M., Cai, W.-J., Eyre, B. D., Forbrich, I., Kwon, E. Y., Maavara, T., Moosdorf, N., Najjar, R. G., Sarma, V. V. S. S., Van Dam, B., and Regnier, P.: Coastal vegetation and estuaries are collectively a greenhouse gas sink, Nat. Clim. Change, 13, 579–587, https://doi.org/10.1038/s41558-023-01682-9, 2023.
Sabater, S., Timoner, X., Borrego, C., and Acuña, V.: Stream Biofilm Responses to Flow Intermittency: From Cells to Ecosystems, Frontiers in Environmental Science, 4, https://doi.org/10.3389/fenvs.2016.00014, 2016.
Shangguan, Q. P., Degrandpre, M. D., Hall, R. O., Jr., and Payn, R. A.: Freshwater carbonate buffering revisited, Limnology and Oceanography Letters, 10, 619–635, https://doi.org/10.1002/lol2.70047, 2025.
Solano, V., Duvert, C., Birkel, C., Maher, D. T., Garcia, E. A., and Hutley, L. B.: Stream respiration exceeds CO2 evasion in a low-energy, oligotrophic tropical stream, Limnol. Oceanogr., 68, 1132–1146, https://doi.org/10.1002/lno.12334, 2023.
Tschikof, M., Gericke, A., Venohr, M., Weigelhofer, G., Bondar-Kunze, E., Kaden, U. S., and Hein, T.: The potential of large floodplains to remove nitrate in river basins – The Danube case, Sci Total Environ., 843, https://doi.org/10.1016/j.scitotenv.2022.156879, 2022.
Vachon, D., Sadro, S., Bogard, M. J., Lapierre, J. F., Baulch, H. M., Rusak, J. A., Denfeld, B. A., Laas, A., Klaus, M., Karlsson, J., Weyhenmeyer, G. A., and Giorgio, P. A.: Paired O2–CO2 measurements provide emergent insights into aquatic ecosystem function, Limnology and Oceanography Letters, 5, 287–294, https://doi.org/10.1002/lol2.10135, 2020.
van der Knaap, J., Harpenslager, S. F., Aben, R. C. H., Weideveld, S. T. J., van Giersbergen, Q., van Dijk, G., Wintjen, P., Buzacott, A. J. V., Fritz, C., Kruijt, B., and Kosten, S.: Disproportionately High Contribution of Ditches to Landscape Greenhouse Gas Emissions in Drained Peatlands, Ecosystems, 28, https://doi.org/10.1007/s10021-025-01005-3, 2025.
van Heuven, S., Pierrot, D., Rae, J. W. B., Lewis, E., and Wallace, D. W. R.: MATLAB Program Developed for CO2 System Calculations, Carbon Dioxide Information Analysis Center, Oak Ridge National Laboratory, U. S. Department of Energy, Oak Ridge, Tennessee, https://doi.org/10.3334/CDIAC/otg.CO2SYS_MATLAB_v1.1, 2011.
Vorobyev, S. N., Kolesnichenko, L. G., Kolesnichenko, Y., Prokushkin, A. S., Lugovaya-Dolmatova, A., Karlsson, J., and Pokrovsky, O. S.: Floodplain carbon dioxide emissions strongly exceed those of the main river stem: A case study of the Ob River, western Siberia, J. Hydrol., 638, https://doi.org/10.1016/j.jhydrol.2024.131468, 2024.
Wehrli, B.: bernhardwehrli/CO2-O2-stat: CO2 dynamics in the Danube Delta (Versions O2_CO2_statistics), Zenodo [code], https://doi.org/10.5281/zenodo.21456491, 2026.
Wehrli, B., Maier, M.-S., and Teodoru, C. R.: CO2-O2 timeseries Danube Delta, Research Collection ETH Zurich [data set], https://doi.org/10.3929/ethz-c-000786936, 2025.
Weiss, R. F.: Carbon dioxide in water and seawater: the solubility of a non-ideal gas, Mar. Chem., 2, 203–215, https://doi.org/10.1016/0304-4203(74)90015-2, 1974.
Xue, H., Ding, H., Han, X. K., Lang, Y. C., Wang, T. J., Li, P., Qiao, M. R., Liu, D. D., Liu, Z. H., and Liu, C. Q.: Ditches as key players in carbon emissions in managed Phragmites-dominated wetland, J. Hydrol., 647, https://doi.org/10.1016/j.jhydrol.2024.132355, 2025.
Zou, J. Y., Ziegler, A. D., Chen, D. L., McNicol, G., Ciais, P., Jiang, X., Zheng, C. M., Wu, J., Wu, J., Lin, Z. Y., He, X. Y., Brown, L. E., Holden, J., Zhang, Z. T., Ramchunder, S. J., Chen, A. P., and Zeng, Z. Z.: Rewetting global wetlands effectively reduces major greenhouse gas emissions, Nat. Geosci., 15, 627–632, https://doi.org/10.1038/s41561-022-00989-0, 2022.
Zuijdgeest, A., Baumgartner, S., and Wehrli, B.: Hysteresis effects in organic matter turnover in a tropical floodplain during a flood cycle, Biogeochemistry, 131, 49–63, https://doi.org/10.1007/s10533-016-0263-z, 2016.
Zurbrügg, R., Wamulume, J., Kamanga, R., Wehrli, B., and Senn, D. B.: River-floodplain exchange and its effects on the fluvial oxygen regime in a large tropical river system (Kafue Flats, Zambia), J. Geophys. Res.-Biogeo., 117, https://doi.org/10.1029/2011jg001853, 2012.
- Abstract
- Introduction
- Materials and Methods
- Results
- Discussion
- Conclusion
- Appendix A: Monitoring stations
- Appendix B: Calculation of CO2
- Appendix C: DIC dynamics at Danube Delta stations
- Appendix D: Overview of 24 h cycles
- Code availability
- Data availability
- Author contributions
- Competing interests
- Disclaimer
- Acknowledgements
- Financial support
- Review statement
- References
- Abstract
- Introduction
- Materials and Methods
- Results
- Discussion
- Conclusion
- Appendix A: Monitoring stations
- Appendix B: Calculation of CO2
- Appendix C: DIC dynamics at Danube Delta stations
- Appendix D: Overview of 24 h cycles
- Code availability
- Data availability
- Author contributions
- Competing interests
- Disclaimer
- Acknowledgements
- Financial support
- Review statement
- References