
the Creative Commons Attribution 4.0 License.
the Creative Commons Attribution 4.0 License.
 | 18 Sep 2026
Introducing shrubs enhances the representation of high-latitude vegetation and carbon cycling in the ORCHIDEE land surface model

Efrén López-Blanco
Vladislav Bastrikov
Sebastiaan Luyssaert
Philippe Peylin
Arctic–Boreal terrestrial ecosystems are rapidly changing under amplified high-latitude warming, including widespread expansion of shrubs, with consequences for regional carbon and energy balances. Yet, high-latitude vegetation diversity and vegetation–climate interactions remain under-represented in many global land surface models. In ORCHIDEE, the land surface component of the IPSL Earth system model, high-latitude vegetation is represented primarily as boreal trees or grasslands, omitting explicit shrubs. Here, we implement three high-latitude shrub plant functional types (PFTs) (tall deciduous, low deciduous, and evergreen dwarf shrubs) in ORCHIDEE (revision 9269). Following literature recommendations, this classification combines phenology and stature to capture key functional contrasts while keeping the number of new PFTs limited. The implementation builds on ORCHIDEE's existing woody vegetation scheme by recalibrating a targeted set of parameters controlling allometry, carbon allocation, recruitment, mortality and phenology. Parameter values are constrained using synthesised pan-Arctic observations to obtain regionally representative shrub traits. Shrub spatial distributions are prescribed with updated PFT maps that combine ESA CCI products with Arctic and regional shrub mapping information. The resulting shrub PFTs reproduce observed ranges of shrub size and biomass allocation across the Arctic–Boreal domain. Introducing shrubs reduces simulated total aboveground biomass in the Arctic–Boreal region from 54 to 46.7 Pg C (−13.5 %) and mean annual gross primary productivity from 498 to 481 (−3.4 %) over the simulated period 1992–2020, with a stronger reduction in the tundra region (4.6 to 3 Pg C (−34.8 %); and 334 to 289 (−13.5 %)), increasing agreement with benchmarking datasets. A key strength of our implementation is its simplicity, as it builds on ORCHIDEE’s existing woody vegetation framework. In addition, the use of synthesised pan-Arctic observations provides regionally representative observational constraints, making the methodological choices transferable beyond ORCHIDEE. Overall, this work provides a data-constrained shrub representation in ORCHIDEE with minimal added process complexity and establishes a foundation for future development of shrub-climate interactions and dynamic shrubification processes.
- Article
(10005 KB) - Full-text XML
- BibTeX
- EndNote


High-latitude regions are warming two to four times faster than the global average under anthropogenic climate change (AMAP, 2021; Rantanen et al., 2022), driving changes in ecosystem structure and function across boreal and Arctic tundra ecosystems (Parmesan et al., 2022). One of the most prominent ecological responses in the Arctic is the expansion of shrubs across tundra ecosystems, often referred to as shrubification (Berner et al., 2020; Myers-Smith et al., 2011). Through a complex set of plant–soil–atmosphere interactions, shrubification processes alter tundra carbon and energy balances, with potential feedback effects on local to global climate (Mekonnen et al., 2021; Heijmans et al., 2022). Shrub expansion can enhance carbon uptake through increases in productivity and biomass, but also increase carbon losses through ecosystem respiration and litter inputs, modify albedo via snow-shrub interactions, alter soil moisture and temperature, and contribute to permafrost degradation (Mekonnen et al., 2021). Due to the many and complex interacting processes involved, the net climate impact of shrubification and its future trajectory remain uncertain (Myers-Smith et al., 2011; Loranty and Goetz, 2012). Reducing such uncertainties requires both long-term field observations and improved process representation in ecosystem models. Consequently, coupled Earth System Models (ESMs) require credible representations of high-latitude vegetation characteristics and dynamics – including shrubs – to simulate observed change and project future scenarios.
However, shrub functional diversity is not always sufficiently represented in global land surface models (LSMs), the terrestrial land surface components of ESMs. Shrub tundra vegetation exhibits strong fine-scale heterogeneity with many structural variations and differing ecosystem functions. Since LSMs operate at much coarser spatial resolution and under computational constraints, plant species are typically aggregated into plant functional types (PFTs) based on similar characteristics and ecosystem function (Wullschleger et al., 2014). For high-latitude shrubs, the most common distinction is between evergreen and deciduous shrubs (Chapin et al., 1996; Wullschleger et al., 2014). However, this categorisation has been criticized as insufficient to capture divergent shrub responses to environmental change, motivating calls for more detailed, trait-informed representations of tundra vegetation in LSMs (Alton, 2011; Wullschleger et al., 2014; Mekonnen et al., 2021). This highlights a central modelling trade-off: PFT classifications must remain general enough for global models while still capturing the functional contrasts that control vegetation dynamics and shrub-climate interactions. To reduce existing uncertainties and biases, the choice of shrub categorisation and key characteristics should be grounded in current ecological knowledge and synthesised field observations.
In response, there have been efforts to improve the representation of high-latitude vegetation in ESM land components, including introducing explicit high-latitude shrub PFTs in LPJ-GUESS (Wolf et al., 2008) and CLASSIC (Meyer et al., 2021), and updating shrub parameterisations in JULES (Harper et al., 2016, 2018). Nevertheless, shrub representations remain uneven across models, and dedicated shrub PFTs are still absent from some widely used LSMs, including ORCHIDEE (Organising Carbon and Hydrology In Dynamic Ecosystems), the global land surface component of IPSL-CM.
In its present version (revision 9269), ORCHIDEE only represents high-latitude ecosystems as boreal forest, grassland or bare soil. As a result, regions that are shrub-dominated in reality are often prescribed as forest in the model. The lack of tundra plant diversity in the current model version leads to an inaccurate representation of tundra ecosystems and inherent feedback processes, together with biases in simulated high-latitude carbon stocks and CO2 fluxes (Zhu et al., 2015).
Previous attempts to address this limitation in ORCHIDEE were made by Druel et al. (2017), who implemented Arctic shrubs, grasses, and non-vascular plants in an earlier version (r1322). Since then, ORCHIDEE has undergone major structural changes, including a completely new carbon allocation scheme with tree demography (Naudts et al., 2015), addition of the nitrogen cycle (Vuichard et al., 2019), and a new multi-layer snow scheme (Wang et al., 2013). As a result, the implementation by Druel et al. (2017) is no longer compatible with the current model structure and could not be maintained in the present ORCHIDEE tag 4.3.
In this study, we introduce shrub PFTs into ORCHIDEE (r9269) to improve the representation of high-latitude vegetation and carbon cycling. To this aim, we: (1) define a classification of shrub types and associated traits constrained by synthesised pan-Arctic observations, (2) implement three new shrub PFTs in ORCHIDEE using existing woody-vegetation functionality, (3) develop updated annual PFT maps that include the new shrub PFTs across the Arctic–Boreal domain, and (4) evaluate the impact of shrub inclusion on high-latitude aboveground biomass and productivity fluxes using independent benchmarking datasets.
Introducing shrubs into a global land surface model requires simplifying shrub diversity into a limited set of characteristics that can be represented with few PFTs. In this study, we specifically focus on the role of high-latitude shrubs in carbon cycle processes in ORCHIDEE LSM.
First, we identified the central characteristics of shrubs and what distinguishes them from trees. Then, we established a meaningful categorisation into shrub PFTs (see Sect. 2.1.1), and determined calibration targets for each type based on observational data (Sect. 2.1.2). Following these data-based shrub characteristics, shrub PFTs were implemented in ORCHIDEE by selecting and optimising a set of PFT-specific parameters (Sect. 2.2). The spatial distributions of the shrub PFTs was prescribed with updated PFT maps (see Sect. 2.3). Finally, pan-Arctic simulations were evaluated against independent observation-based data products (Sect. 2.4).
2.1 Shrub PFT design and observational constraints
We adopted a data-driven strategy in which shrub PFT definition and calibration targets were guided by established ecological understanding and constrained by synthesised observations across the high-latitude region. This makes the shrub implementation approach transferable to modelling frameworks beyond ORCHIDEE, and increases region-scale representativeness of shrub characteristics.
2.1.1 Shrub characterisation and classification
Shrubs are low-stature woody plants – both deciduous and evergreen – adapted to limited growing conditions, such as in arid or cold regions (CAVM Team, 2024). In high-latitude regions, shrubs typically have lower height and stem diameter and therefore lower biomass relative to boreal trees. Furthermore, they are characterised by a multi-stemmed growth form, and a comparatively large belowground allocation to shallow, laterally extensive root systems (Myers-Smith et al., 2015b). Together with rapid regrowth and tolerance of stem loss, these traits may contribute to the ability of shrubs to persist further north than trees (Myers-Smith et al., 2011; Götmark et al., 2016; Treml et al., 2019). These common characteristics and survival mechanisms distinguish shrubs from trees and guide our shrub implementation by indicating which parameters and outputs should be targeted (cf. Sect. 2.2).
Beyond these shared traits, shrubs span a wide range of sizes and growth forms across the high-latitude region. Observed shrub stature ranges from prostrate dwarf shrubs (< 20 cm), through erect dwarf and low shrubs (≈ 20–50 cm), to tall shrubs that can exceed 2 m (Myers-Smith et al., 2015b). Shrub stature and composition vary with climate and local conditions (Yang et al., 2026), but this diversity cannot be resolved in a large-scale model like ORCHIDEE. Shrubs must therefore be grouped into PFTs that capture the functional contrasts most relevant for ecosystem functioning, responses to environmental change and climate interactions (Wullschleger et al., 2014).
Based on evidence from field studies and model experiments we have chosen to distinguish shrub types by phenology and size. We implemented three high-latitude shrub PFTs: tall deciduous shrubs, low deciduous shrubs and evergreen dwarf shrubs. The classification into deciduous and evergreen shrub PFTs follows tundra PFT recommendations and implementations in other models (Chapin et al., 1996; Wullschleger et al., 2014; Dobbert et al., 2021; Meyer et al., 2021). The approach was refined by adding a distinction by height, because shrub stature influences canopy structure, productivity, and snow interactions, and phenology alone is insufficient to capture observed divergent growth responses to climate change (Bonfils et al., 2012; Wullschleger et al., 2014; Saccone et al., 2017; Mekonnen et al., 2021).
The new shrub PFTs in ORCHIDEE represent (i) tall deciduous shrubs, such as willow (Salix spp.) and alder (Alnus spp.), which are often dominant under shrubification (Myers-Smith et al., 2011; Mekonnen et al., 2021); (ii) low deciduous shrubs, mainly representing dwarf birch (Betula nana), which are likewise expanding, but differ in their ecological function compared to tall deciduous shrubs through their lower stature (Bonfils et al., 2012; Sweet et al., 2014); and (iii) evergreen dwarf shrubs, which are expanding under different conditions, with distinct effects on ecosystems and climate feedbacks (Vowles et al., 2017; Vowles and Björk, 2019; Myers-Smith et al., 2011).
This categorisation captures functionally distinct trait combinations while keeping the number of PFTs manageable for data-driven calibration of a global model. The proposed PFTs represent dominant tundra shrub species, align with available calibration data, and support regionally representative parameter values.
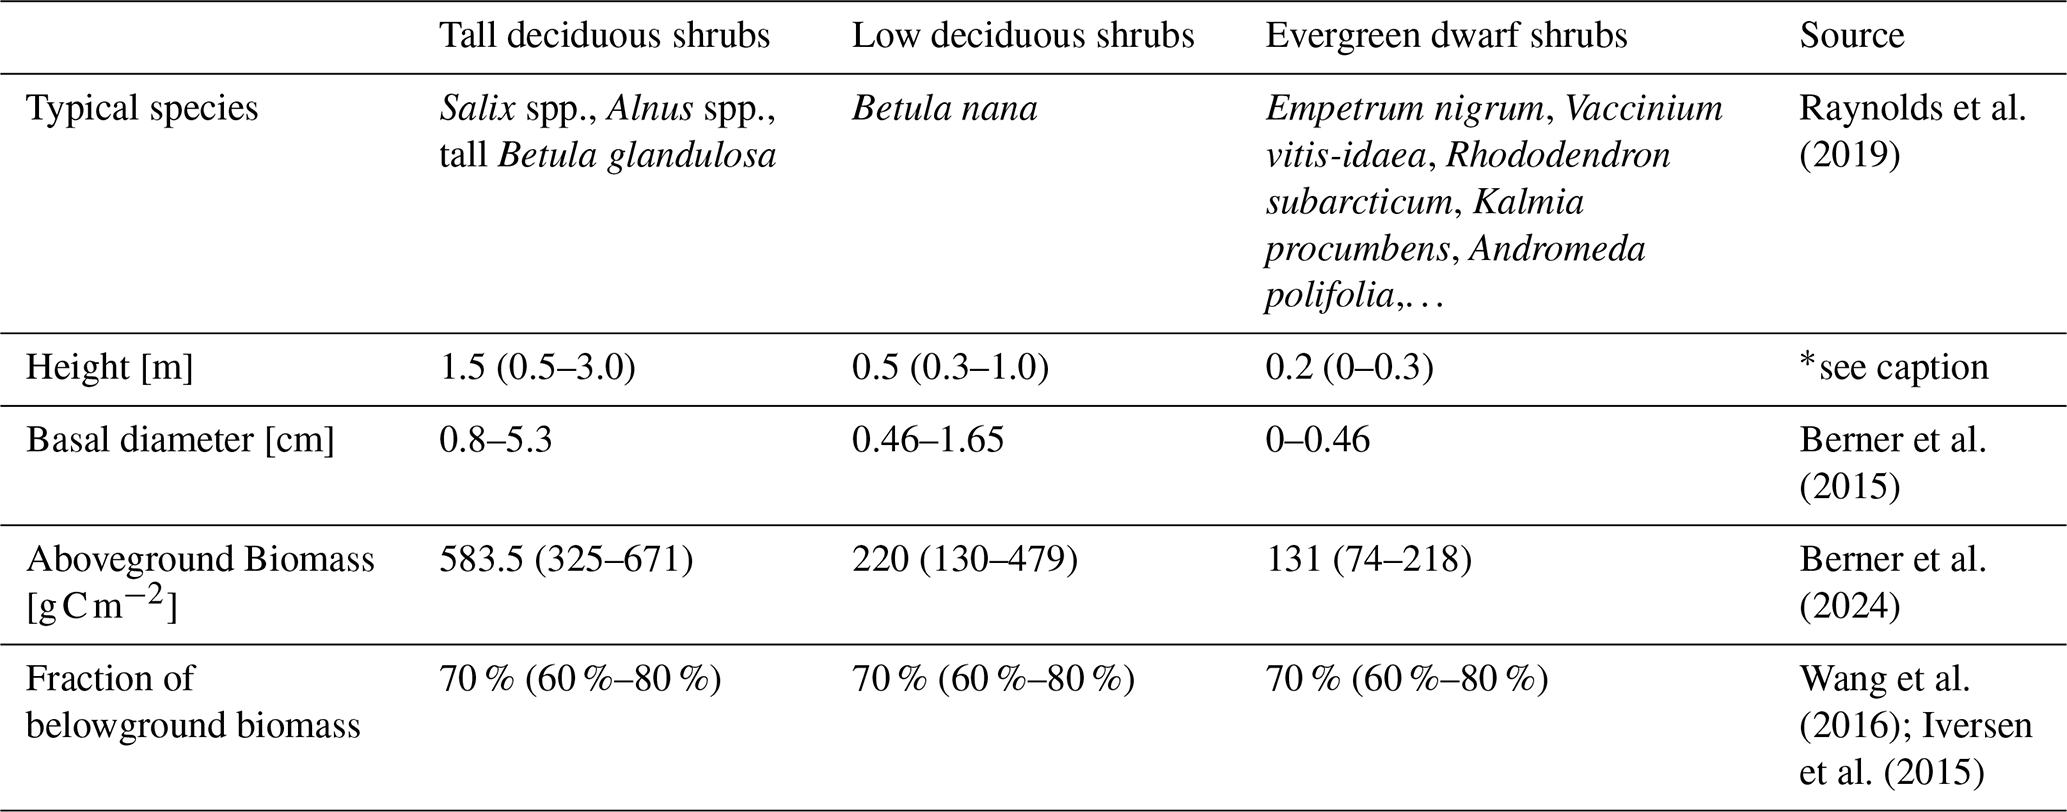
Raynolds et al. (2019)Berner et al. (2015)Berner et al. (2024)Wang et al. (2016); Iversen et al. (2015)Table 1Data-based characterisations and calibration constraints for the three shrub PFTs, given as representative values and typical ranges. (∗ Data sources for height: Myers-Smith et al. (2015b); Elmendorf et al. (2012); Raynolds et al. (2019); Macander et al. (2017); Walker and Maier (2008); Wolf et al. (2008).)
2.1.2 Observational constraints
Typical characteristics to constrain the calibration of the shrub PFTs (in Sect. 2.2) were compiled from various synthesized pan-Arctic field observations and literature. Since Sect. 2.1.1 identified low height and biomass, growth form with multiple stems, and a large fraction of belowground biomass as the most distinct shrub characteristics, we focused on observations of height, diameter, above- and belowground biomass and carbon flux measurements (see Table 1). Contrary to the approach taken in other shrub model implementation studies (e.g. Meyer et al., 2021), we chose not to calibrate the model against observations collected at a single field site. Instead, we relied on field observations and literature from across the high-latitude region, to capture the most representative characteristics for the simulated shrubs. This approach was used to enhance the chances that the shrub implementation reflected region-scale patterns rather than local tuning.
The three shrub PFTs are distinguished by height into a tall shrub PFT (aim for ≈ 1.5 m), a low shrub PFT (≈ 0.5 m), and a dwarf shrub PFT (≈ 0.2 m, Table 1). These values represent a compromise between different threshold values from literature (Myers-Smith et al., 2015b; Elmendorf et al., 2012), different shrub mapping products (Raynolds et al., 2019; Macander et al., 2017; Walker and Maier, 2008) and the LPJ-GUESS LSM (Wolf et al., 2008) (see Sect. A3 for further details).
The desired diameters were derived from shrub height based on allometric relationships established by Berner et al. (2015), and are in line with a small survey we conducted in Kobbefjord, Greenland (Table A2).
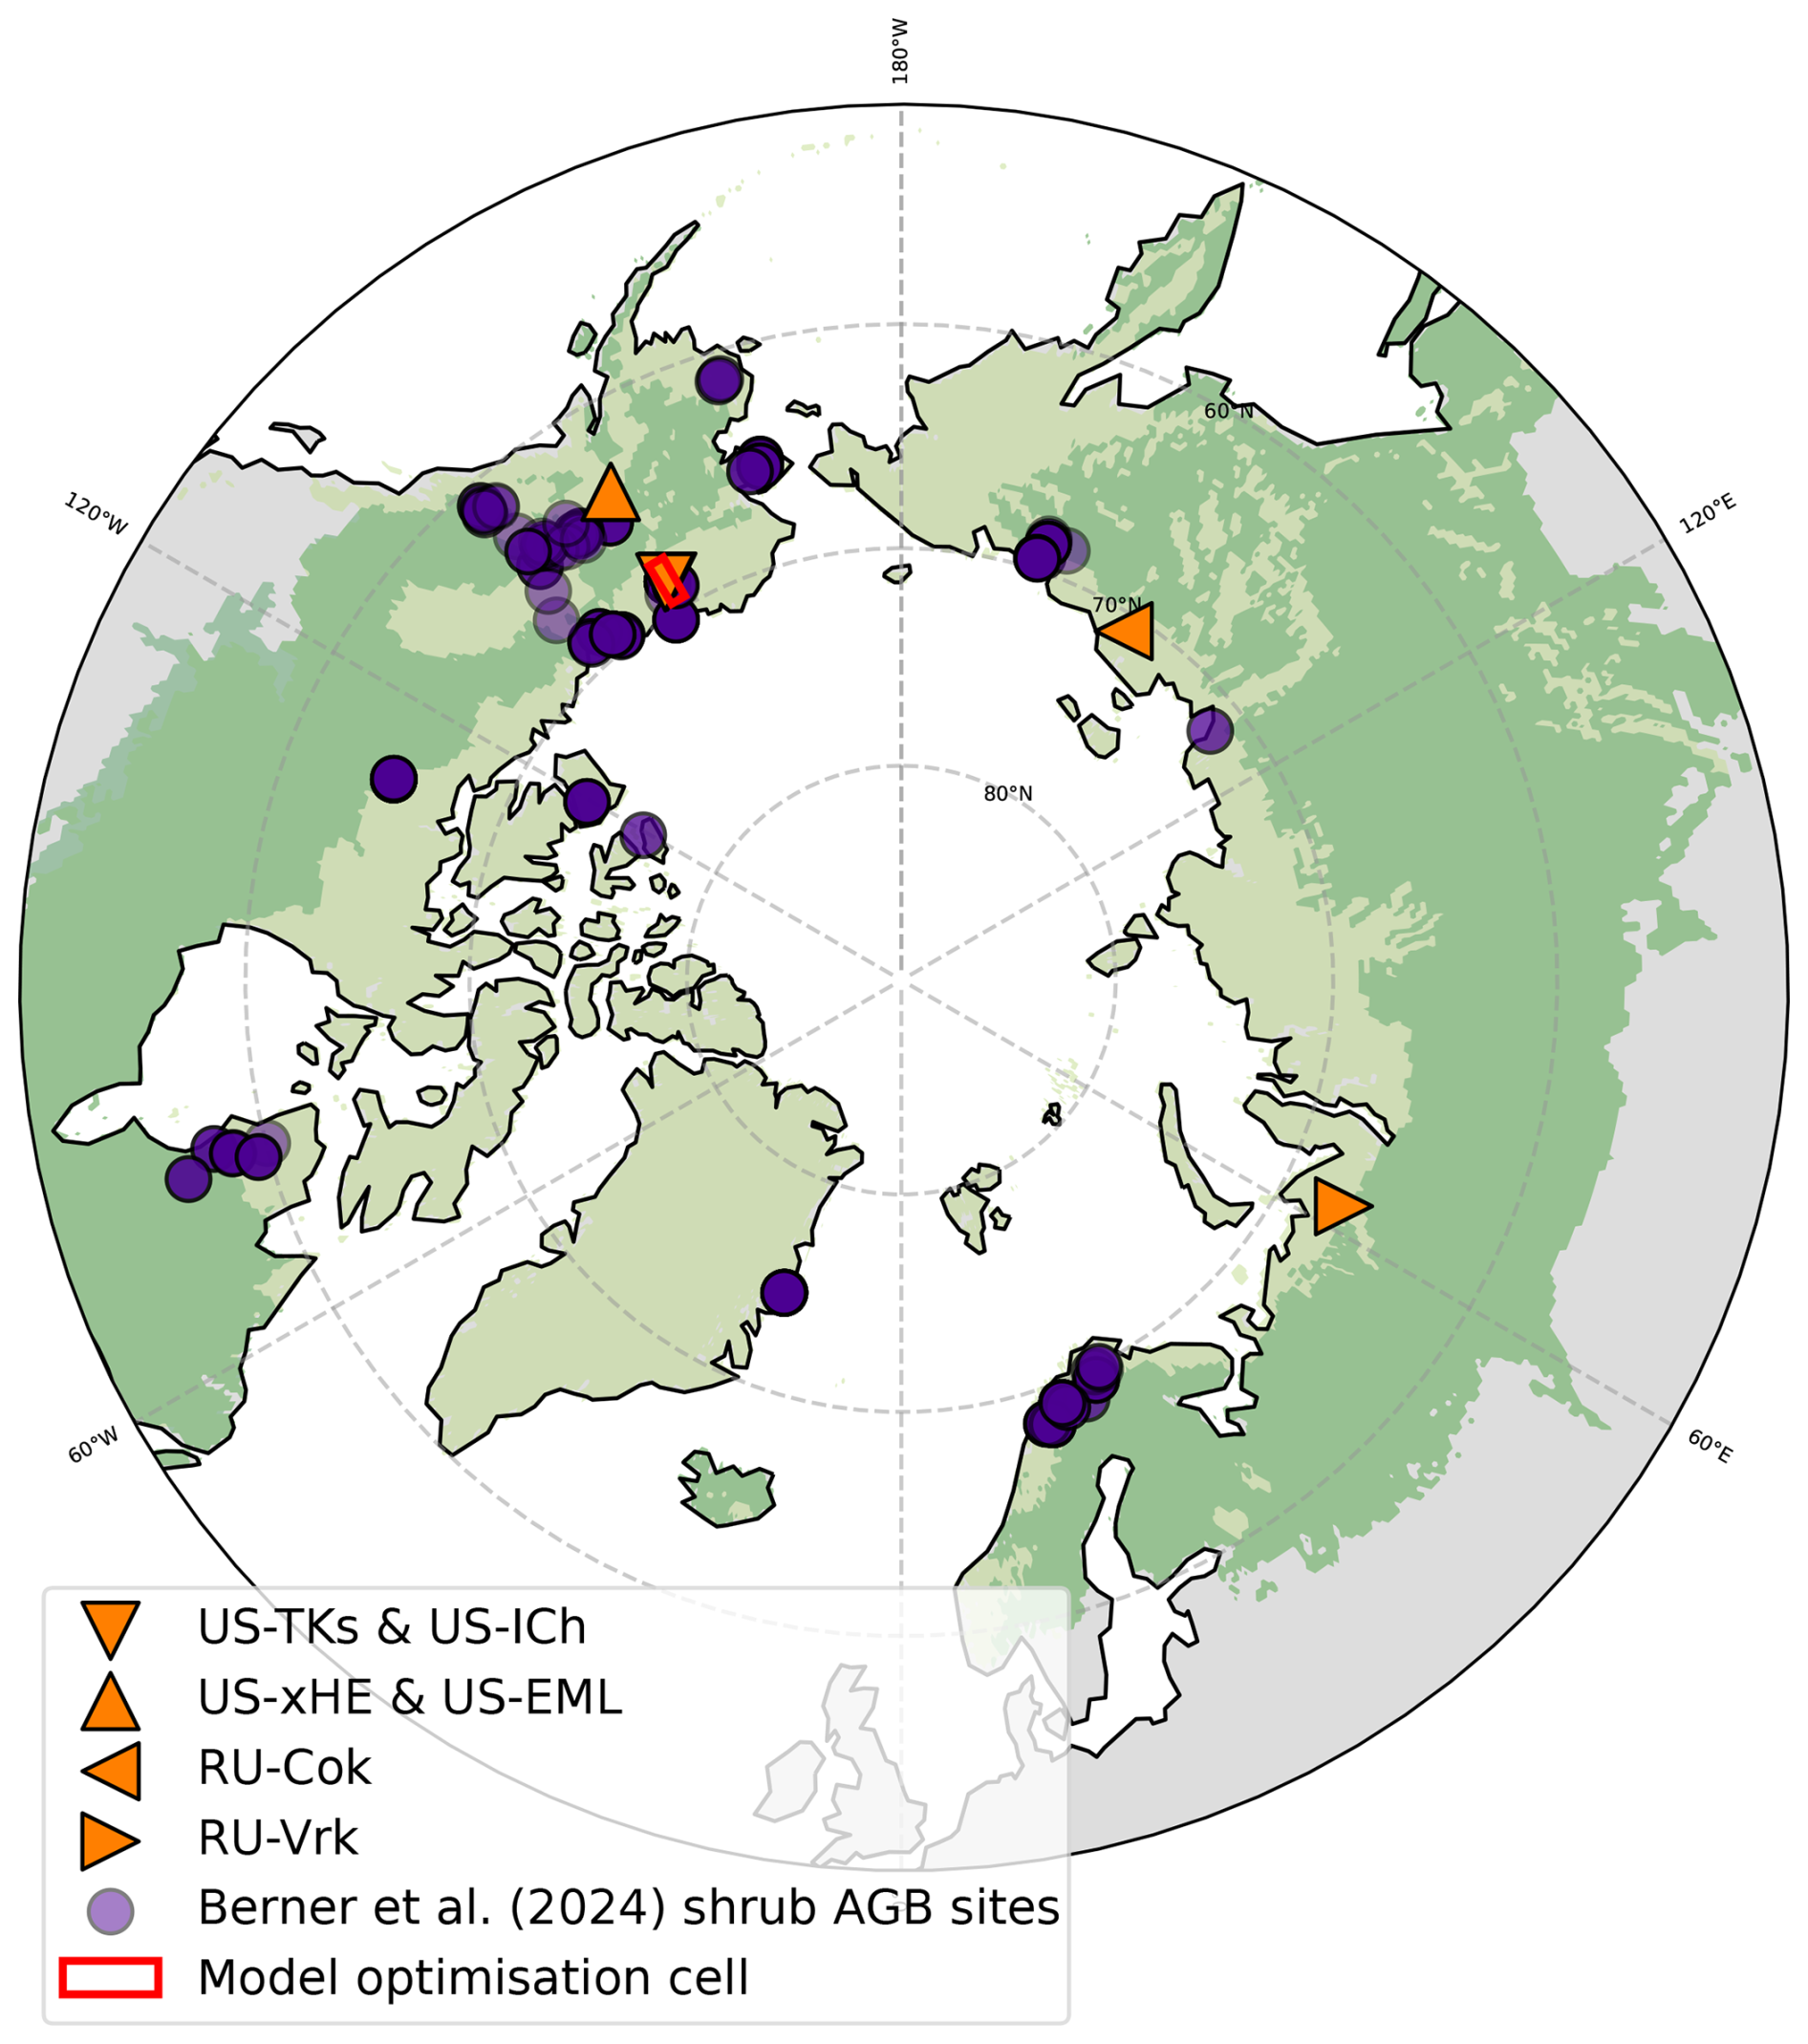
Figure 1Locations of observational data sites. Orange triangles: Six EC CO2 flux sites from FLUXNET and AmeriFlux. Purple dots: 331 shrub-dominated aboveground biomass sites in 24 different areas from Berner et al. (2024). Red rectangle: Model grid cell used for parameter optimisation. Green shading indicates the Arctic–Boreal region as defined in Olefeldt et al. (2021a, b), with the tundra (light green) and boreal (darker green) subregions (Dinerstein et al., 2017).
Ranges for aboveground biomass (AGB) were derived from the Arctic Plant Aboveground Biomass Synthesis Dataset (Berner et al., 2024), containing measurements of peak summer biomass collected at 636 field sites across the Arctic region between 1998 and 2022. Only sample plots with at least 80 % shrub AGB were selected, resulting in 331 sites located in 24 different areas (see Fig. 1) with a median (interquartile range) biomass of 142.5 (83.25–265.0) g C m−2. The dataset does not provide a categorisation of shrub types, but we used the vegetation description for each plot to extract specific aboveground biomass estimates for the three shrub PFTs by filtering for species or references to their height (see Sect. A3 for further details). We summarised biomass by field site (median across plots) before calculating statistics across sites and converted from dry biomass to carbon assuming 50 % C content. This resulted in the following AGB calibration targets: tall deciduous shrubs (14 sites): 583.5 (325.25–671.3125) g C m−2, low deciduous shrubs (65 sites): 220 (130–479) g C m−2, and evergreen dwarf shrubs (238 sites): 131 (74–218) g C m−2.
Fractions of belowground biomass were determined from Wang et al. (2016) and Iversen et al. (2015). Average fractions of belowground biomass were calculated to be 68.3 ± 9.2 % (mean ± standard deviation) for shrub-dominated sites (> 80 % of AGB) from the Wang et al. (2016) dataset, and Iversen et al. (2015) report 73 % for deciduous and 76 % for evergreen shrubs, which were combined into a target of approximately 70 % (60 %–80 %) of biomass allocated belowground for all three simulated shrub PFTs.
Table 2Eddy-covariance CO2 flux measurement sites located in shrub tundra locations from FLUXNET and Ameriflux. Columns: IGBP = IGBP vegetation classification (CSH = closed shrubland, OSH = open shrubland). Veg = Vegetation classification by Oehri et al. (2022) derived from site descriptions based on CAVM (Walker et al., 2005) (S2 = Low-shrub moss tundra, P2 = Prostrate/Hemiprostrate dwarf-shrub lichen tundra, G4 = Tussock sedge, dwarf-shrub, moss tundra). E = elevation [m]. T = Mean annual temperature [°C]. P = mean annual precipitation [mm]. GPP = median (interquartile range) annual GPP []. GPP estimated using nighttime flux partitioning method.
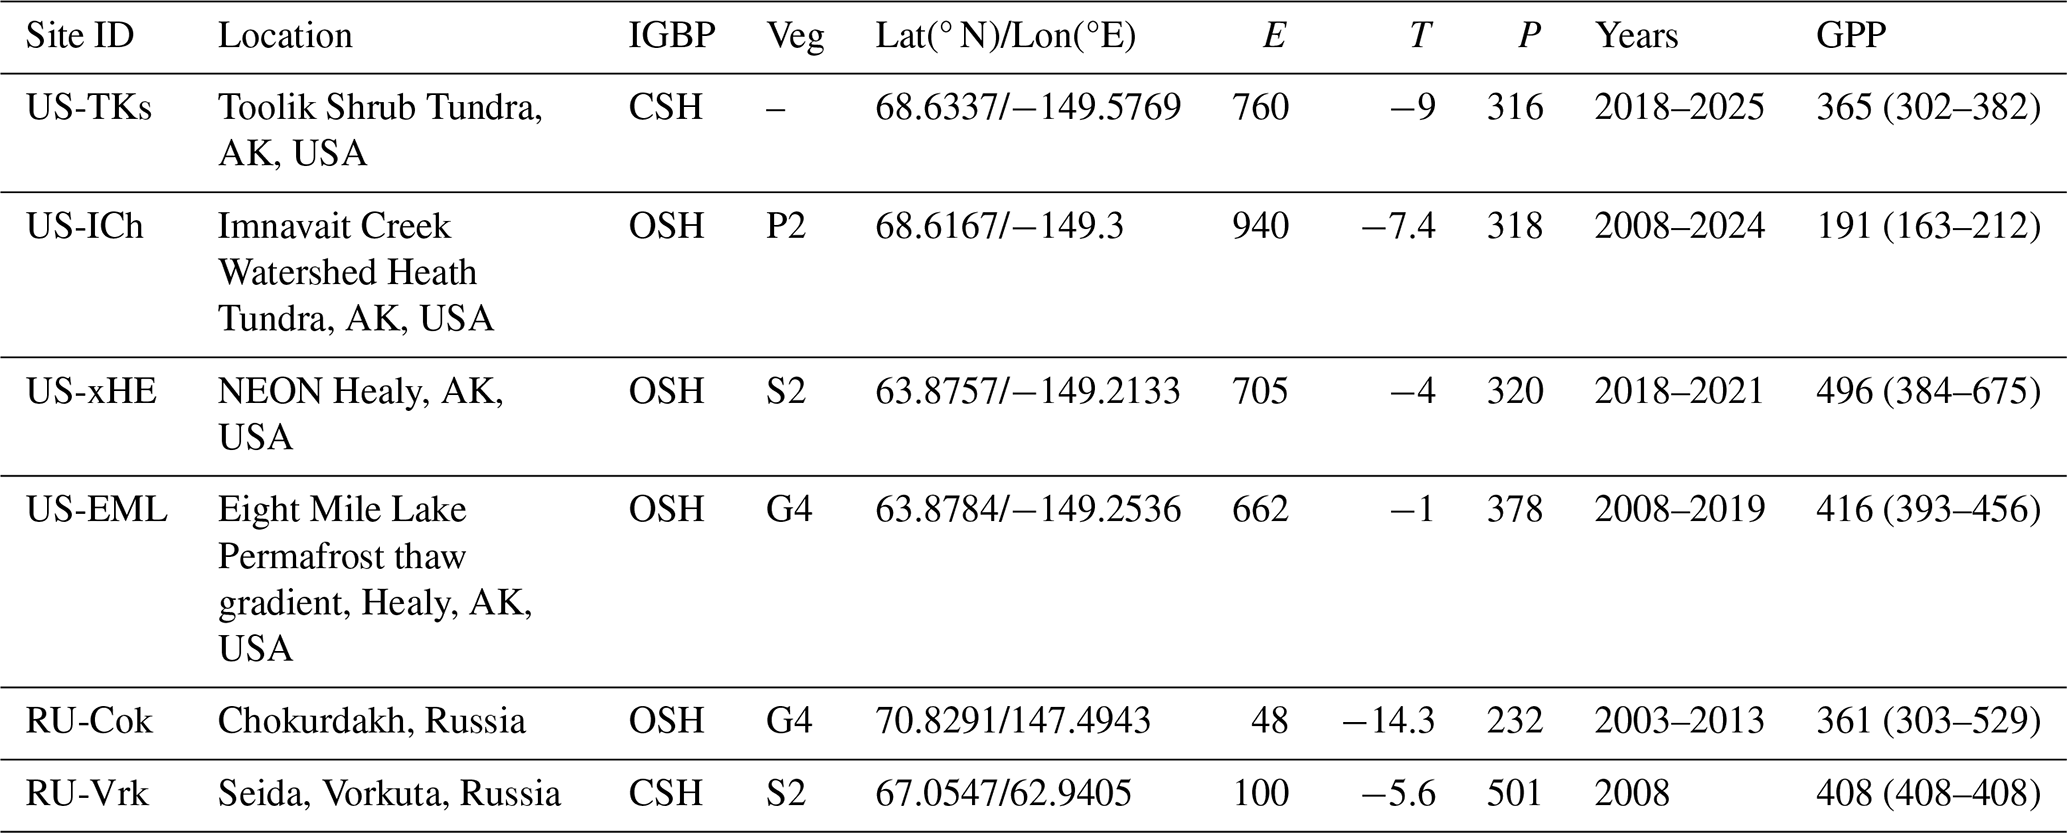
Data documenting the carbon fluxes between the atmosphere and shrub vegetation were extracted from the FLUXNET2015 (Pastorello et al., 2020) and AmeriFlux (Chu et al., 2023) datasets. We selected sites classified as open or closed shrubland (OSH/CSH), located above 50° N and with the full FLUXNET-standard post-processing available. Based on the available vegetation descriptions, further sites were excluded, including burn sites with fire succession vegetation, and one tussock-tundra site (US-ICt), resulting in six selected shrub sites (cf. Table 2). It is important to note that due to the nature of EC flux measurements, the recorded fluxes represent the aggregate of the entire ecosystems around the tower within a variable footprint, and the data does not specify the contributions of individual PFTs. Therefore, the sites were not assigned to specific shrub PFTs, but used instead as a benchmark for shrub tundra ecosystems to calibrate and evaluate all three ORCHIDEE shrub PFTs against. Notably, the available vegetation descriptions indicate that dwarf and low shrubs seem to be more prominent than tall shrubs at most sites (e.g. van der Molen et al. (2007); NEON (National Ecological Observatory Network) (2026); cf. Table 2). Across all six sites, a range of average daily gross primary productivity (GPP) of 0.73 (0.18–2.45) (median (interquartile range)) and average annual GPP of 336 (209–413) was extracted. The GPP statistics were calculated using nighttime flux partitioning, after excluding negative GPP estimates and years without positive values.
2.2 Implementation of shrub PFTs in ORCHIDEE
2.2.1 ORCHIDEE model description
We used ORCHIDEE (revision 9269), the land surface component of IPSL-CM (Peylin et al. (2026), see Krinner et al. (2005), Naudts et al. (2015), Vuichard et al. (2019) for descriptions of previous model versions, and supplementary Sect. A1 for an overview of the version used here). ORCHIDEE simulates exchanges of energy, water, and greenhouse gases and explicitly represents terrestrial C and N cycles. ORCHIDEE r9269 builds on ORCHIDEE tag 4.3, which forms the basis for upcoming model applications, including CMIP-7 FAST-TRACK and TRENDY (Peylin et al., 2026).
In ORCHIDEE, vegetation is represented by PFTs, and many parameters are PFT-specific to capture functional differences among ecosystems. The baseline ORCHIDEE r9269 configuration represents global vegetation using 15 PFTs, mainly focused on different types of forest ecosystems, and includes no dedicated shrub PFTs (see Table A1). High-latitude vegetation is represented by five PFTs representing boreal forests, grassland and bare soil. The spatial occurrence of PFTs is prescribed with PFT maps, based on satellite-derived maps of land cover classes (Harper et al., 2023), further combined with information from the land use harmonisation database (LUH; Hurtt et al., 2011) to reconstruct the historical evolution of PFTs back to 1850. Due to the lack of shrub PFTs, ORCHIDEE simulates boreal forest (80 %) and boreal grass (20 %) at high-latitude locations where shrub cover has been observed.
To improve ORCHIDEE's representation of high-latitude ecosystems, we introduced three high-latitude shrub PFTs – tall deciduous shrubs, low deciduous shrubs, and evergreeen dwarf shrubs – into ORCHIDEE (r9269). Shrubs were implemented using existing woody-PFT functionality by recalibrating a targeted set of parameters controlling allometry, recruitment and mortality, carbon allocation, and phenology. Deciduous shrubs were derived from the boreal summergreen tree PFT (PFT 8), and evergreen dwarf shrubs from the closest phenological analogue temperate broad-leaved evergreen tree PFT (PFT 5).
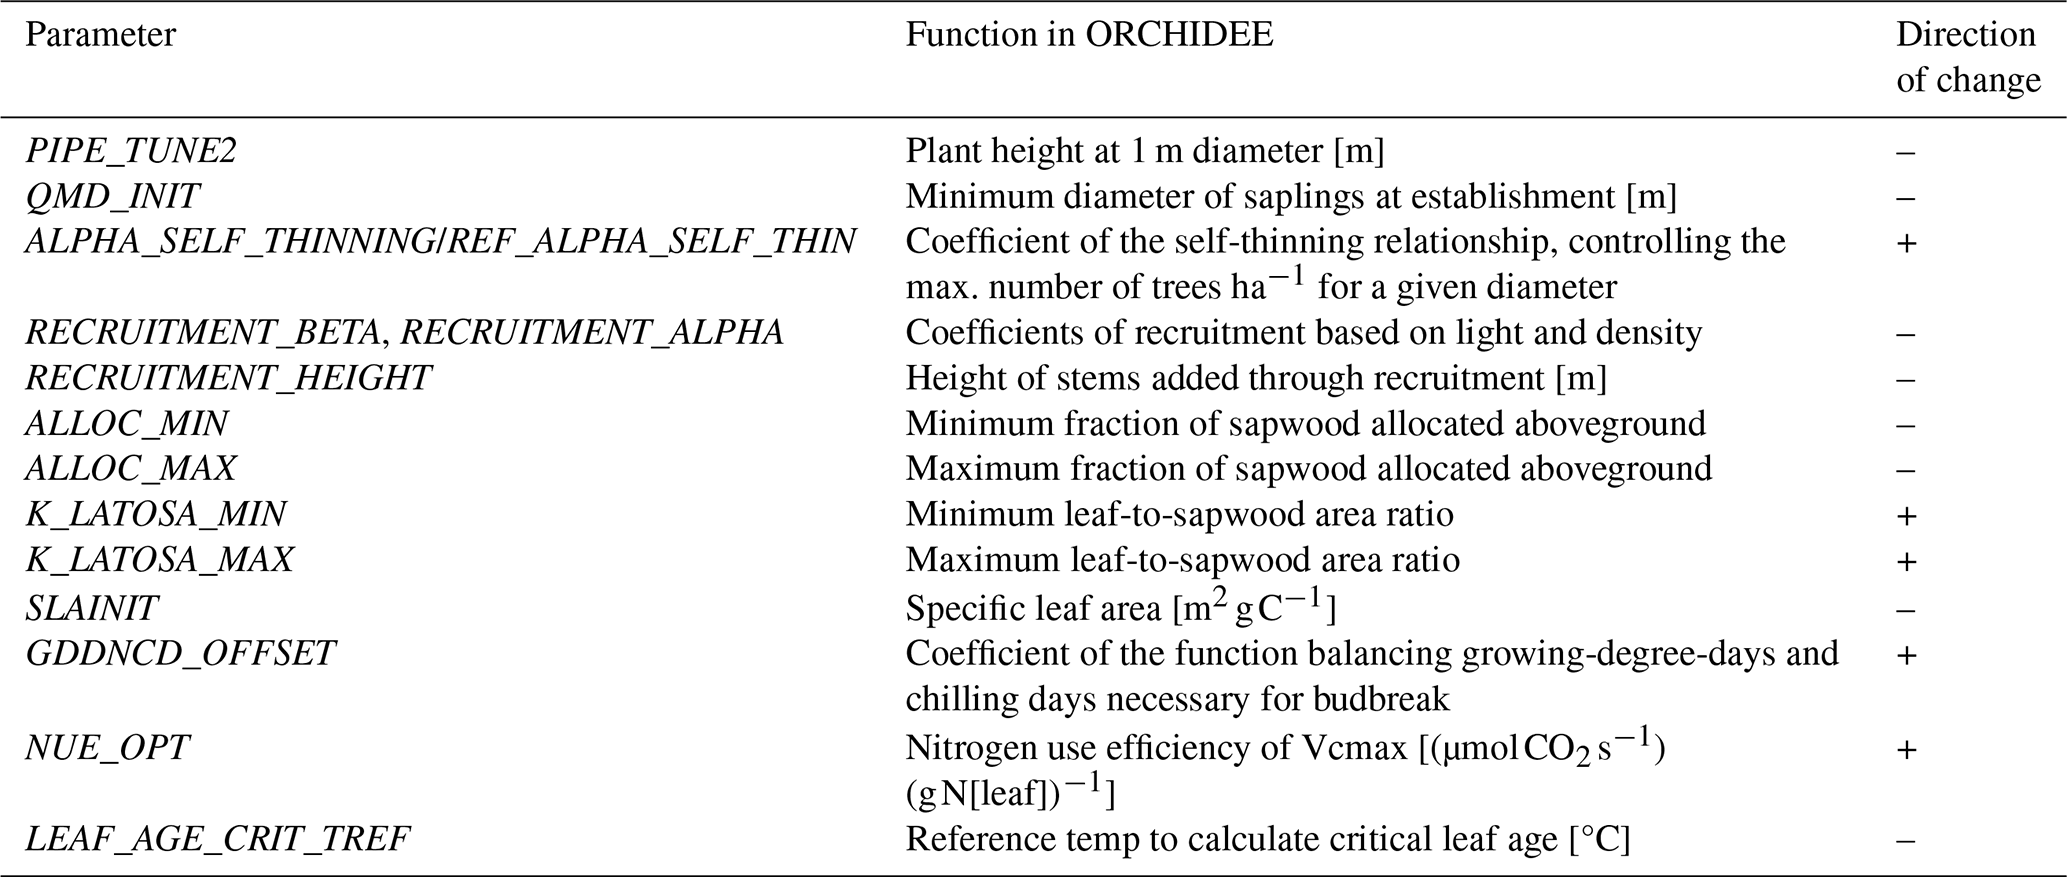
Table 3ORCHIDEE PFT-parameters altered to implement shrub PFTs based on tree PFTs, their function in the model, and the direction of change for shrubs (− = decrease, + = increase).
2.2.2 Model experiments
Calibration of the shrub PFT parameters was performed in two steps. First, manual sensitivity tests were conducted to identify influential parameters and value ranges (Sect. 2.2.3). Then, the selected parameters were optimised against observational calibration targets using the ORCHIDEE data assimilation system ORCHIDAS (Sect. 2.2.4). Sensitivity tests and optimisation were performed separately for each shrub PFT at grid cell level, primarily using the 2° × 2° grid cell around Toolik Lake, Alaska (67.6–69.6° N, 148.6–150.6° W). This area was found suitable both because it includes a well-studied diverse shrub tundra environment, and because initial ORCHIDEE simulations across the high-latitude region showed that it represents average growing conditions for the region. Different grid cells were tested during the development process, and parameterisation proved to be only weakly sensitive to grid cell-choice. While parameterisation and optimisation were limited to a single grid cell for computational reasons, they were based on regionally representative targets derived from synthesised pan-Arctic observations.
Site-level simulations consisted of a 340 year spinup (using cyclical 1901–1920 forcing), followed by a historical simulation (1900–2020). By using a semi-analytical spinup method, soil C/N pools could be brought to equilibrium with only 340 years spinup (Lardy et al., 2011). Atmospheric forcing conditions were supplied from CRU JRA v2.4 reanalysis, in line with the TRENDY model intercomparison experiment protocol (University of East Anglia Climatic Research Unit and Harris, 2023; Sitch et al., 2024).
2.2.3 Parameter selection and changes
Manual sensitivity tests at site-level determined a suitable set of parameters to target and the direction of their change to capture shrub characteristics starting from tree PFTs (see Table 3). To match the data-based shrub characteristics, the main aims were to decrease height, diameter and biomass, increase the belowground biomass allocation, and keep plant stands stable throughout those changes. The sensitivity analyses were performed by varying parameter values and evaluating their impact on relevant output variables. In some cases, parameters were varied individually using incremental adjustments. In other cases, multiple parameters were modified simultaneously, for example to account for changes in the balance between recruitment and mortality. The sensitivity analyses were partly iterative, requiring certain parameters to be re-adjusted after others had been constrained in order to maintain internal process consistency. Once model behaviour converged towards the predefined calibration objectives, formal optimisation with ORCHIDAS was initiated. In the subsequent paragraphs, the text in italics refers to the parameter names in ORCHIDEE r9269.
Plant allometry
Plant height and diameter were reduced by decreasing the initial diameter of saplings (qmd_init) and the reference plant height at a diameter of 1 m (pipe_tune2). In the current ORCHIDEE version, height can either be controlled statically through (pipe_tune2), or adjusted dynamically based on precipitation. Shrub PFTs use the static height, since precipitation is not the dominant driver for high-latitude shrub growth (Myers-Smith et al., 2015a).
Recruitment and mortality
Besides the influence of allometric parameters, the average stand diameter, height and biomass are the result of a balance between recruitment and mortality. We increased recruitment to stimulate self-thinning mortality and maintain dense, low-stature shrub stands.
In ORCHIDEE, natural mortality of forests is simulated through a self-thinning mechanism based on site carrying capacity (Reineke, 1933; Yoda et al., 1963):
where is the maximum stand density (maximum number of individuals of a given quadratic mean diameter (dqmdia)), that a site can support, and “alpha_self_thinning” and “beta_self_thinning” are PFT-specific parameters. Self-thinning occurs when actual density exceeds the maximum (). To allow higher shrub densities, we increased “alpha_self_thinning” for shrub PFTs and prescribed it as constant.
We increased natural mortality through increased recruitment. Recruitment was increased by tuning the PFT-specific parameters (“recruitment_alpha”, “recruitment_beta”) controlling yearly recruits (dind,rec; m−2) as a function of light availability (, calculated as in Naudts et al., 2015) and stand density (dind):
We also reduced the prescribed height of recruits (“recruitment_height”) to introduce smaller saplings. Increased recruitment and self-thinning shifted stands towards smaller plants. Increased mortality emulates difficult Arctic growing conditions, and higher density emulates multi-stemmed shrub growth and maintains realistic biomass.
Carbon allocation
Belowground biomass fraction was increased by decreasing “alloc_min” and “alloc_max”, reducing allocation to aboveground sapwood and investing more in belowground organs and coarse roots.
We increased the leaf-to-sapwood area ratio through the parameters “k_latosa_min”, “k_latosa_max”, to stabilise growth after biomass reductions, and reduced specific leaf area (SLA, the ratio of leaf surface area to mass) through “sla_init”, to control leaf area index (LAI).
Phenology
For low deciduous shrubs, we advanced growing-season onset by recalibrating the offset parameter in the GDD–NCD phenology model. The GDD-NCD model calculates budburst as a function of growing degree days (GDD) and chilling days (NCD) (Chuine, 2000; Hänninen and Kramer, 2007; Orlandi et al., 2004):
where GDDthres is the temperature-sum threshold for budburst, NCD is the number of chilling days accumulated over the chilling period, and “gddncd_ref”, “gddncd_curve” and “gddncd_offset” are model parameters. These parameters are not PFT-specific and were originally calibrated against satellite phenology data at global scale (Botta et al., 2000), with the default values “gddncd_ref”: 964, “gddncd_curve”: 0.0058, “gddncd_offset”: 12.8. We increased “gddncd_offset” only for low deciduous shrubs, to lower the onset threshold and improve agreement of simulated growing season timing with shrub tundra observations.
Others
For evergreen dwarf shrubs, originally based on a temperate tree PFT, we adapted key physiological parameters to reflect boreal conditions. Specifically, the reference temperature used to calculate critical leaf age (“leaf_age_crit_tref”) was reduced and nitrogen use efficiency was increased via the parameter “nue_opt”, to stabilise growth in nitrogen-limited high-latitude locations, in line with estimated values reported by Kattge et al. (2009). “nue_opt” represents the photosynthetic nitrogen use efficiency, defined as the carboxylation capacity at 25 °C () per leaf nitrogen content, based on Kattge et al. (2009), and is used for calculation of after accounting for sugar loading and leaf efficiency.
2.2.4 Parameter optimisation (ORCHIDAS)
After identifying influential parameters and plausible ranges (Sect. 2.2.3), shrub PFT parameter values were formally optimised against the observational targets determined in Sect. 2.1.2 using the ORCHIDEE data assimilation system ORCHIDAS. ORCHIDAS is an optimisation framework developed at Laboratoire des Sciences du Climat et de l'Environment (LSCE) for the ORCHIDEE model (ORCHIDAS team, 2024; see for example Bastrikov et al., 2018). We used a random-based Monte Carlo approach (Genetic Algorithm (GA); Goldberg, 1989) to identify parameter sets that minimise a cost function J(x) between model outputs (M(x)) and observational target ranges (Y). The observational targets (Y) included height, peak summer AGB, minimum fraction of belowground biomass, mean GPP, peak summer leaf area index, and age (ref. Table A4). The cost function can be written as:
and it also measures the misfit between the parameter values x and prior information on them, xb. Both mismatch terms are weighted by the prior error covariance matrices on observations R and parameters B, respectively (ORCHIDAS team, 2024).
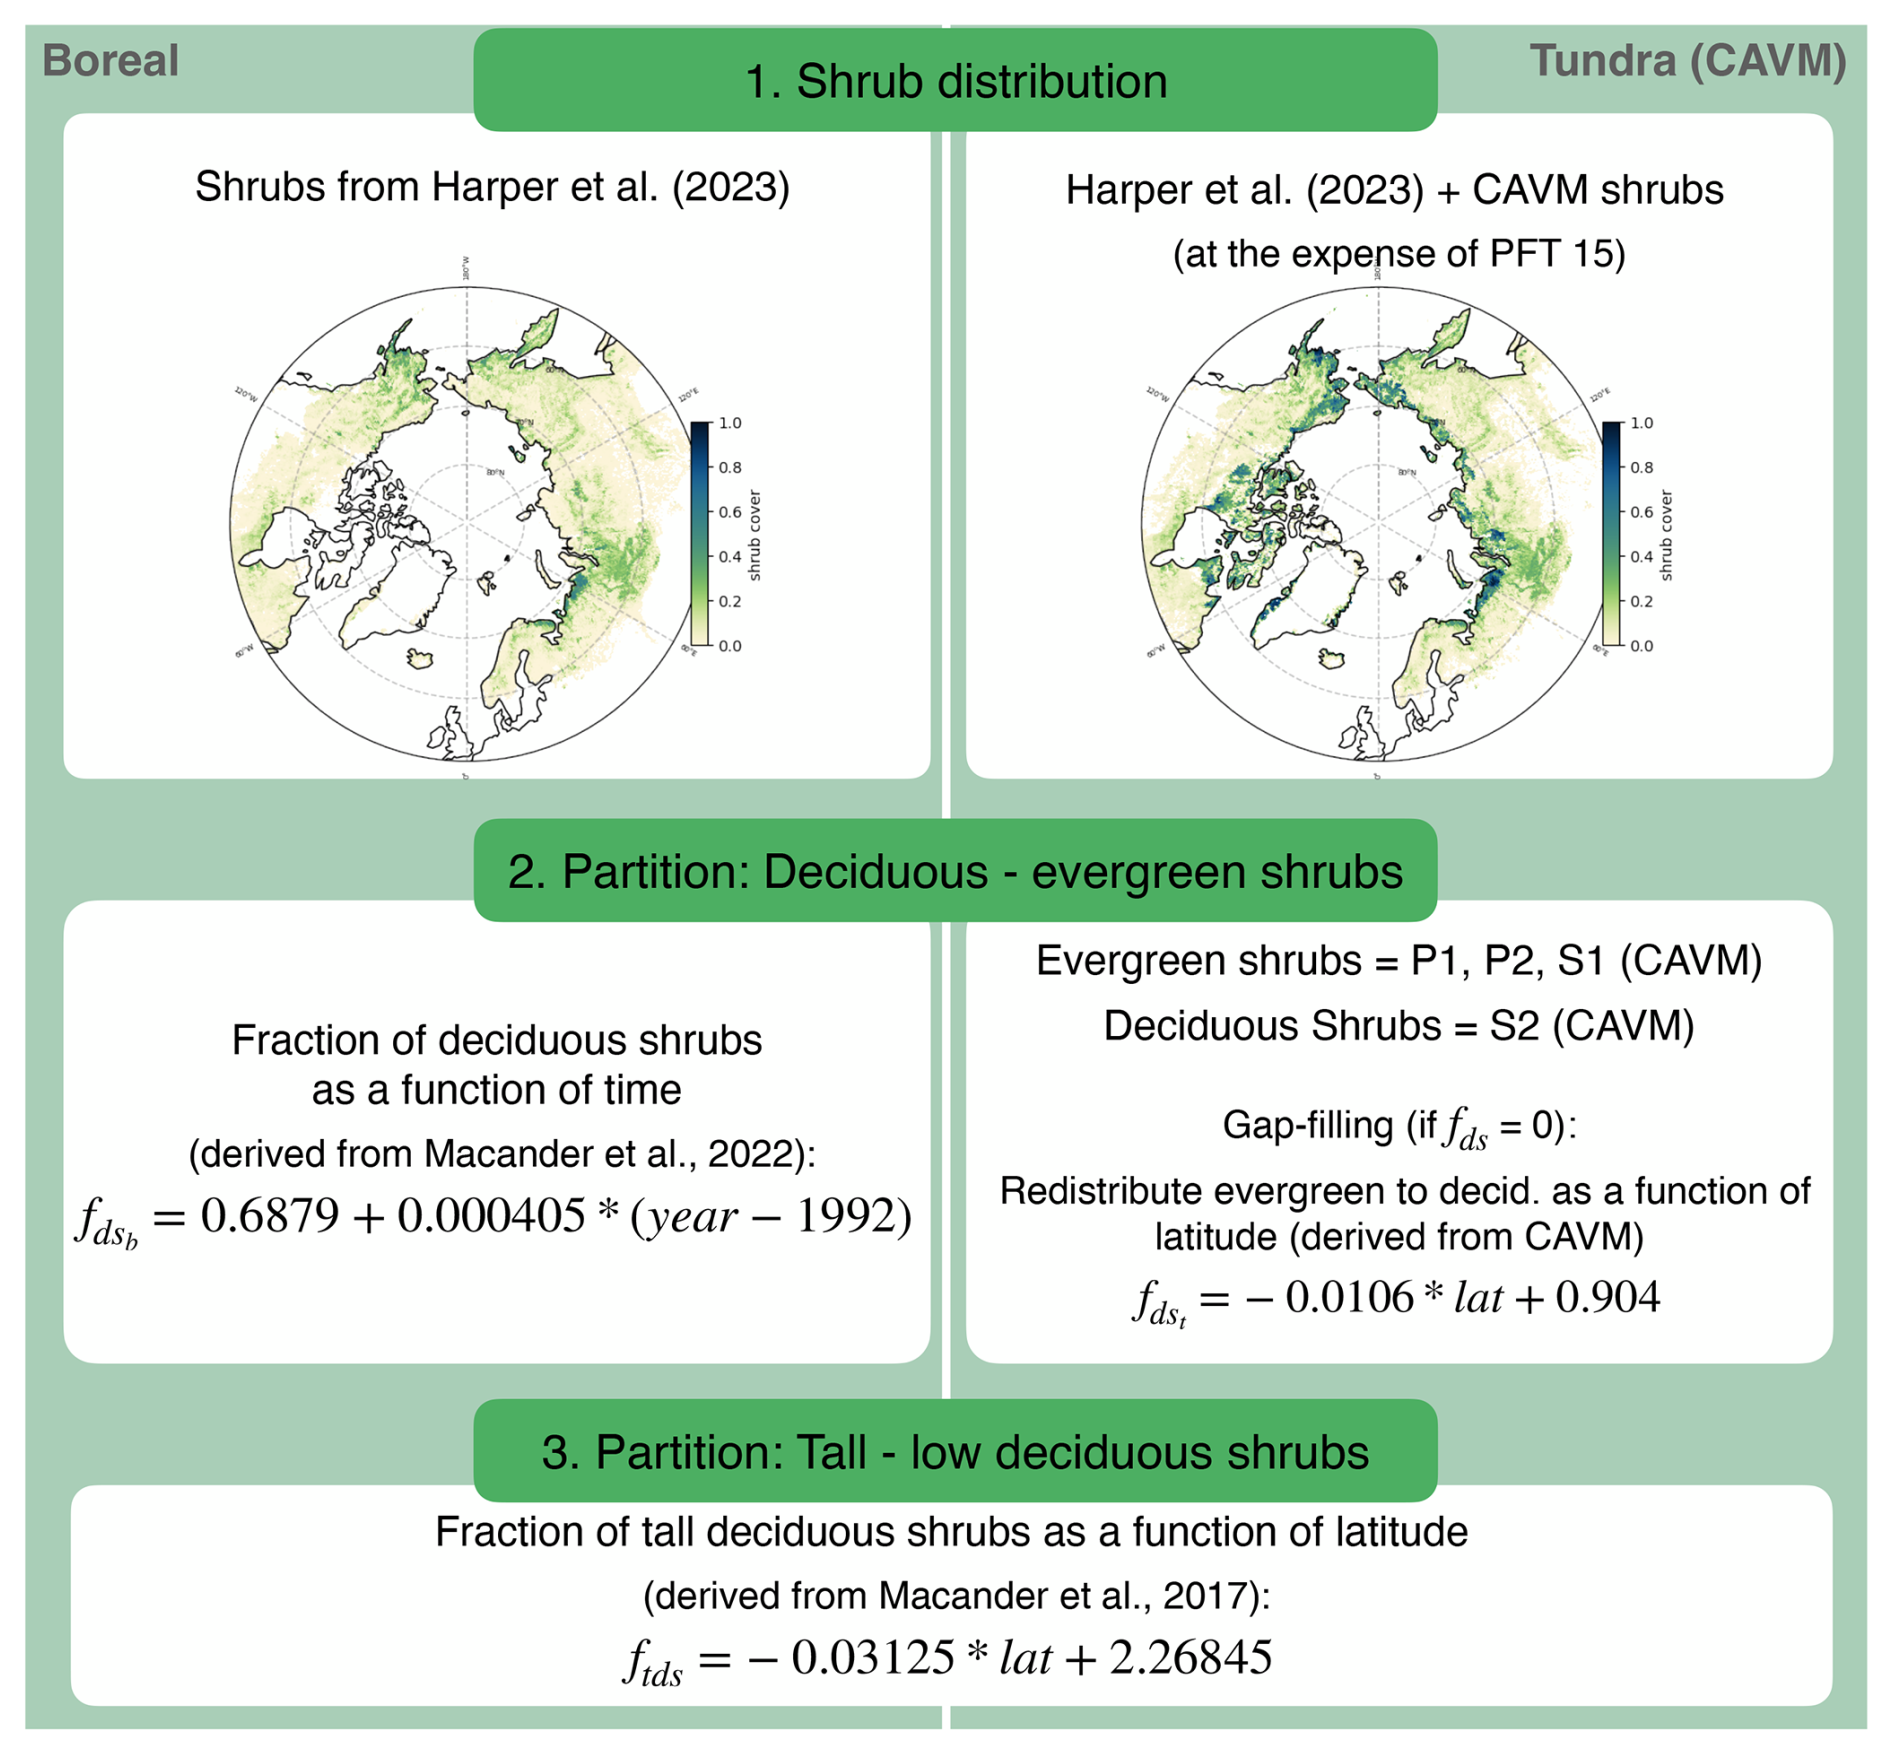
Figure 2Methodoloy used to include three shrub PFTs into the annual PFT maps for ORCHIDEE (1992–2020). Based on annual data by Harper et al. (2023), supplemented with shrub cover from the Circumpolar Arctic Vegetation Map (CAVM; Raynolds et al., 2019), and re-partitioned following functions derived from Macander et al. (2017) and Macander et al. (2022). Different approaches taken for the Boreal and Tundra subregions.
Similar to the sensitivity analysis, the optimisations were performed at grid cell level, mainly using the Toolik Lake grid cell. For each shrub PFT, a separate optimisation was performed, with prior best-guess parameter values and bounds derived from the initial sensitivity analyses. The GA was configured to use a population pool with at least 30 candidate parameter sets evolved over 30 generations following the principles of genetics and natural selection, and stopped after 30 iterations or when the cost function stabilised, which gives around 30 × 30 = 900 independent model evaluations across each optimisation run. Further details on the optimisation setup can be found in the appendix (Sect. A4).
2.3 Prescribed vegetation distributions (PFT maps)
In ORCHIDEE r9269, the spatial occurrence of PFTs is prescribed annually through PFT maps, derived from ESA CCI satellite-based land cover products (1992–2020) (Harper et al., 2023). Prior to the implementation of shrub PFTs in ORCHIDEE, the high-latitude shrub cover in Harper et al. (2023) was redistributed at grid cell level to boreal tree PFTs (80 %) and boreal grass (20 %), resulting in biased model outputs over the high-latitude region. We updated ORCHIDEE PFT maps to include three high-latitude shrub PFTs by combining multiple mapping products and applying simple partitioning rules (see Fig. 2).
In a first processing step, the total shrub cover was set, based on Harper et al. (2023) shrub cover. Since the high-latitude shrub mapping in Harper et al. (2023) has known caveats, including a general underestimation of shrub cover in the Arctic due to methodological constraints (Harper et al., 2023), we supplemented it with shrub cover from the Circumpolar Arctic Vegetation Map (CAVM) (Raynolds et al., 2019) in the Arctic tundra region. Where shrub cover on the Circumpolar Arctic Vegetation Map exceeded shrub cover on Harper et al. (2023), the shrub fraction was increased at the expense of boreal grass.
Subsequent processing steps partitioned the total shrub fraction into deciduous and evergreen shrubs. Within the CAVM domain (Arctic tundra), we mapped CAVM shrub classes to ORCHIDEE shrub PFTs as follows: P1 and P2 (prostrate shrub tundra) and S1 (erect dwarf shrub tundra) were assigned to evergreen dwarf shrubs (PFT 18), while S2 (low shrub tundra) was assigned to deciduous shrubs (PFTs 16 and 17). To avoid discontinuities introduced by the dominant-class mapping approach in CAVM, we gap-filled the deciduous fraction using a latitude-dependent relationship. The fraction of deciduous shrubs of total shrub cover, , was derived from a linear regression of the fraction of S2 to total CAVM shrub cover between 59 and 74° N:
where lat is latitude in degrees north and fS2 is the deciduous shrub fraction derived directly from mapped S2 cover.
South of the CAVM domain, shrub cover was prescribed by combining the four shrub types that are mapped in Harper et al. (2023) and redistributing the total shrub fraction between deciduous and evergreen shrubs, to correct the unequal distribution of shrub types in Harper et al. (2023). The deciduous shrub fraction south of the CAVM domain, , was set to approximately 70 %, increasing over time to reflect observed shrubification trends, using a relationship derived from Macander et al. (2022):
In the final processing step, deciduous shrubs were further partitioned by their height. Across the entire Arctic–Boreal domain, deciduous shrubs were divided between tall deciduous shrubs (PFT 16) and low deciduous shrubs (PFT 17) as a function of latitude to represent decreasing shrub height with increasing latitude (Pajunen, 2009). Latitude itself is not a driver of shrub height but was used as a proxy for growing season length and summer temperatures which correlate well with vegetation height (Gould et al., 2003; Myers-Smith et al., 2015a). We used Macander et al. (2017) data, which map tall (> 1.5 m) and low deciduous shrubs (0.2–1.5 m) in Arctic Alaska, aggregated the mapped region in 0.2°-wide latitudinal bands, and derived a linear relationship for the tall-shrub fraction of deciduous shrub cover, ftds, from 12.48 % at 68.6° N to 7.47 % at 70.2° N:
Values were clipped to [0,1], implying a northern limit for tall shrubs where the function reaches zero.
Finally, all PFT fractions were normalized to ensure their sum is equal to 1.
2.4 Model evaluation
2.4.1 High-latitude model simulations
To evaluate the new shrub PFTs and their impact on high-latitude carbon cycling, we ran regional simulations north of 50° N at 2°×2° spatial resolution. Like the site-level simulations (Sect. 2.2.2), the model was spun up for 340 years using cyclical 1901–1920 CRU JRA v2.4 forcing (University of East Anglia Climatic Research Unit and Harris, 2023), but followed by a transient simulation for 1861–1900 with increasing atmospheric CO2 concentrations. Subsequently, the TRENDY protocol (Sitch et al., 2024) was used to set-up a historical simulation for 1900–2020 forced by CRU JRA v2.4. From 1992, vegetation fractions were prescribed annually using PFT maps. For the simulation years before 1992, vegetation was set constant to the 1992 distribution. We ran a baseline simulation with ORCHIDEE r9269 with 15 PFTs and the default ORCHIDEE PFT maps (ORCHIDEE-15), as well as a simulation including the new shrub PFTs (ORCHIDEE-18), with the updated PFT maps (Sect. 2.3), but otherwise identical settings. The simulated years 1992–2020 were used for model evaluation.
2.4.2 High-latitude benchmarking data
The outputs of the regional simulations were evaluated against high-latitude data products to benchmark aboveground biomass and gross primary productivity. The evaluation was limited to the Arctic and Boreal (Arctic–Boreal) region, defined like the BAWLD (Boreal-Arctic Wetland and Lake Dataset) domain in Olefeldt et al. (2021a). This domain was subdivided into boreal and tundra zones following Dinerstein et al. (2017) for refined evaluation (see Fig. 1).
Simulated aboveground biomass across the Arctic–Boreal region was evaluated against two field- and satellite-based data products, by Spawn et al. (2020) for 2010 and Liu et al. (2015) for 1993–2012, remapped and converted to the 2° × 2° resolution used for the ORCHIDEE simulations using conservative remapping. Due to data availability (Spawn et al., 2020), 2010 was used as an example year for evaluation.
To ensure a robust evaluation of regional GPP, we benchmarked our simulations against an ensemble of three independent data-based products, all remapped to the ORCHIDEE grid. These were deliberately chosen to represent distinct methodological approaches: (1) the FLUXCOM product (Jung et al., 2019), representing a machine-learning approach that upscales FLUXNET eddy-covariance observations using remote-sensing and meteorological predictors; (2) the Virkkala et al. (2021) dataset, representing a statistical modelling approach to upscale synthesised CO2 flux data; and (3) CARDAMOM (Hugelius et al., 2024; López-Blanco et al., 2019), representing a model-data-fusion approach that assimilates remote sensing and gridded datasets into a structurally simple ecosystem carbon model, allowing for observation-constrained parameter retrieval. By utilising this structurally diverse ensemble, we mitigate the risk of evaluating our model against the biases or scaling assumptions inherent to any single upscaling method.
Table 4Selected PFT-specific model parameters, their function in ORCHIDEE, original values in the underlying forest PFTs and recalibrated values for the new shrub PFTs. The given values are the final values after parameter optimisation, except the parameter values marked with an asterisk, which were set manually. “–” indicates that a parameter value was not changed from the baseline. PFT 8, 16 and 17 are all based on metaclass (MTC) 8, while PFT 5 and 18 are based on MTC 5. All PFT-specific parameters not listed here were kept at the same values for shrub PFTs as in the underlying forest PFTs (8 and 5, for deciduous and evergreen, respectively).
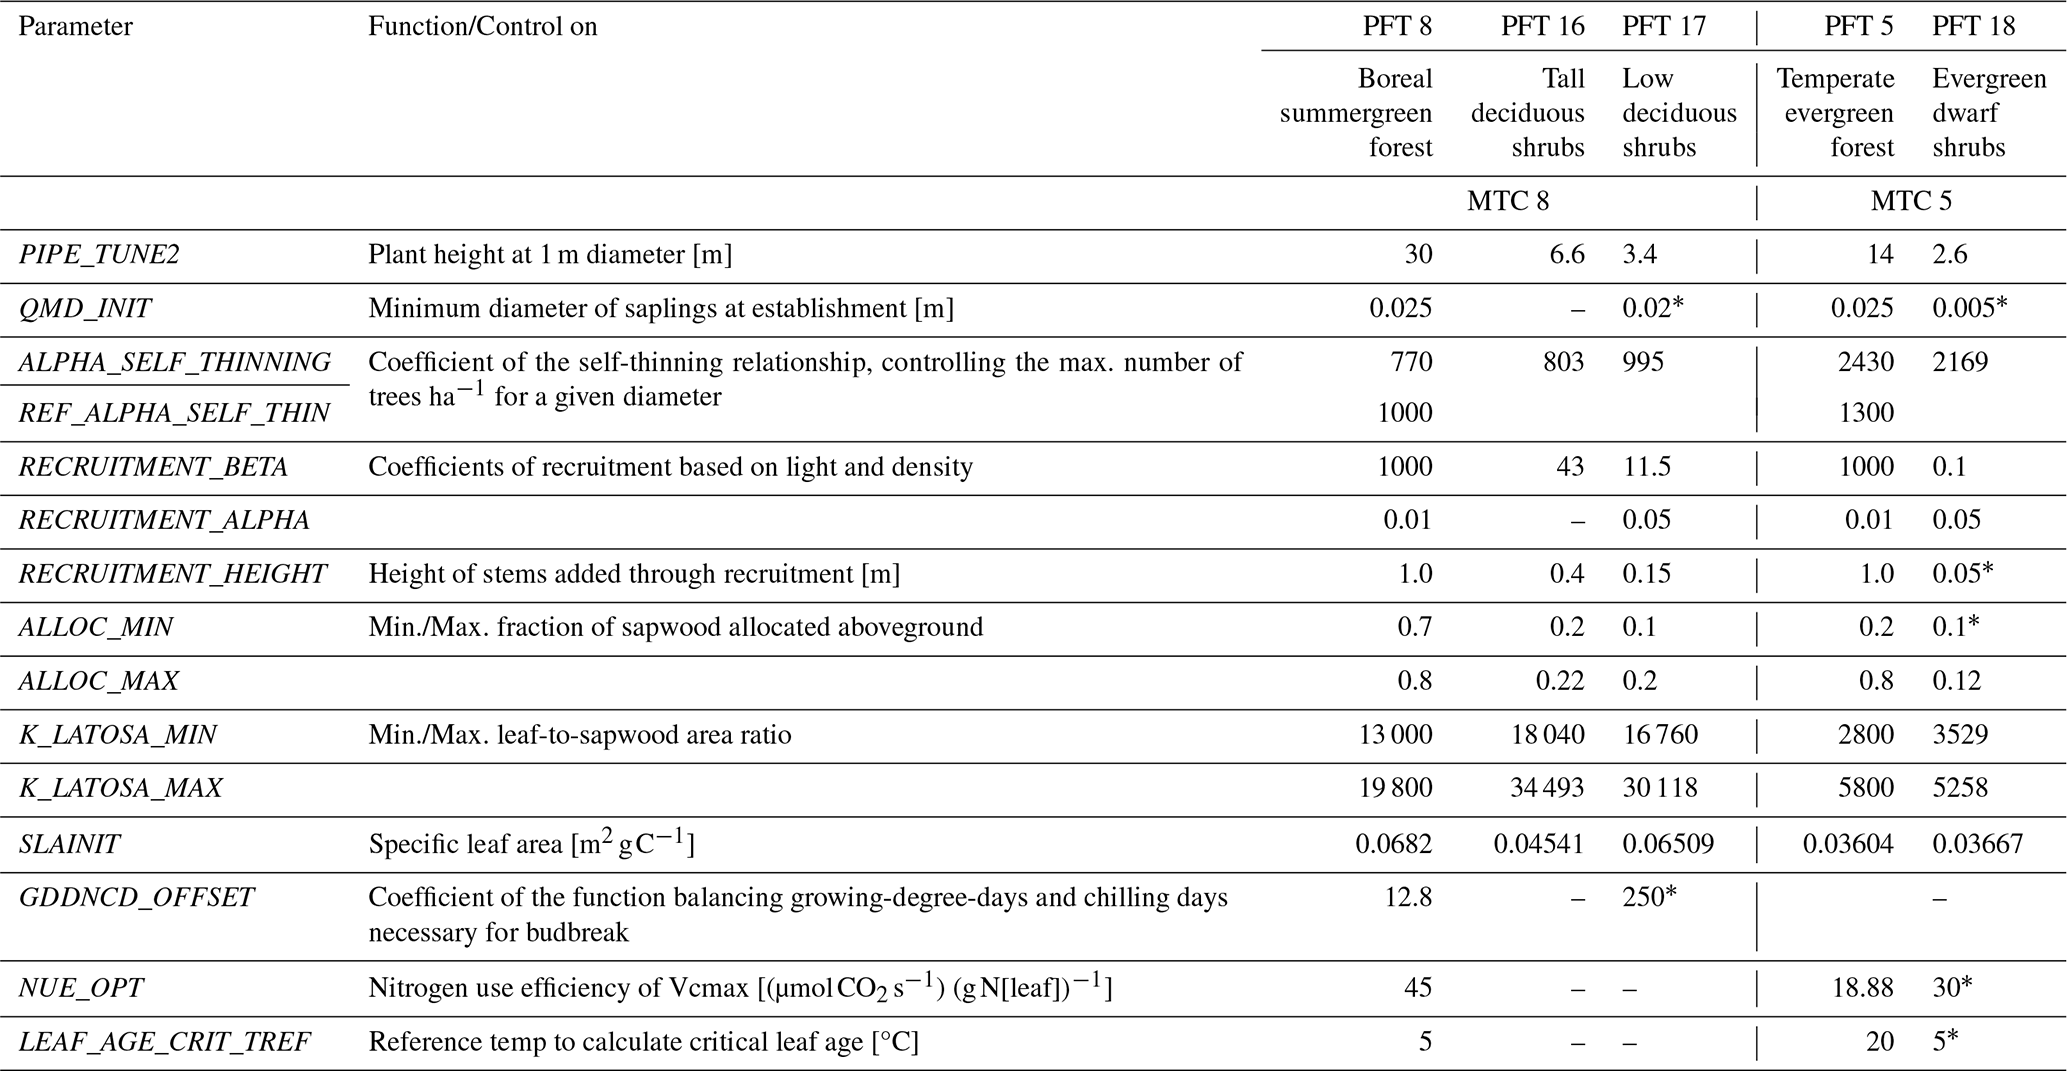
Table 5Simulated shrub structural attributes and biomass allocation for ORCHIDEE shrub plant functional types across the Arctic–Boreal region given as median (interquartile range) (1992–2020).

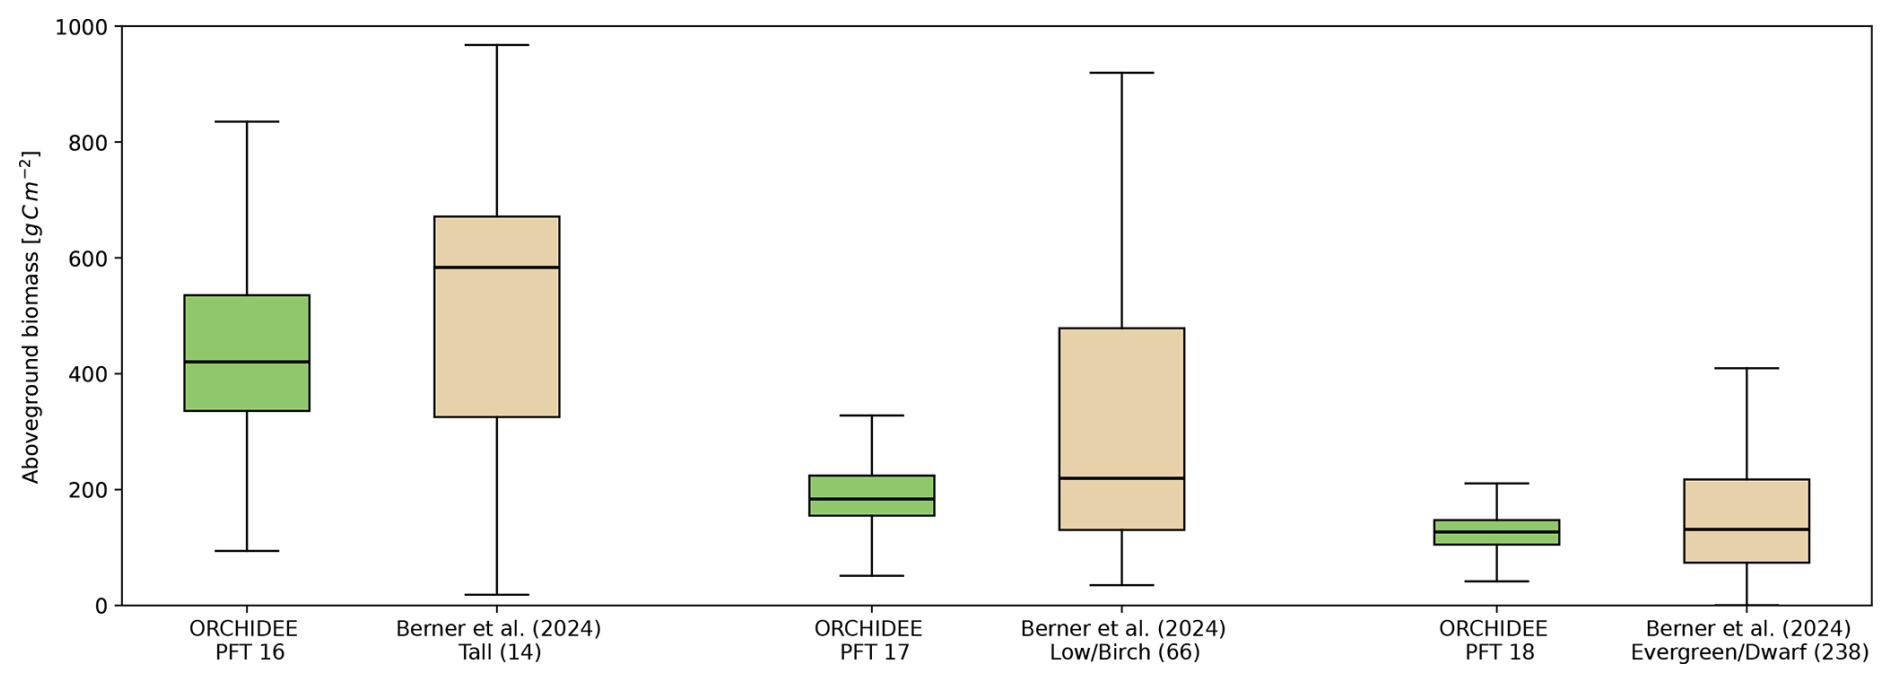
Figure 3Simulated (green, ORCHIDEE-18, 1992–2020) and observed (light brown, Berner et al., 2024) aboveground biomass for three shrub PFTs across the Arctic–Boreal region. Observed biomass from Berner et al. (2024) was filtered to match the ORCHIDEE shrub PFT classification. Numbers in parentheses indicate the number of field sites included after filtering. Boxplots show median (center line), interquartile range (boxes) and whiskers extend to the farthest data point lying within 1.5× the interquartile range. A complete visualisation including outliers is shown in Fig. B1.
3.1 Evaluation of shrub PFTs compared to field observations
Introducing three shrub PFTs and optimising key parameters against observational targets produced shrub stands with realistic structure and allocation dynamics across the Arctic–Boreal region. Up to 14 parameters were re-calibrated per shrub PFT to capture their growth form and carbon allocation. Table 4 summarises the optimised parameters and their values for the baseline tree PFTs and the new shrub PFTs after optimisation. The parameters with the highest change from tree PFTs include the controls on plant size, both directly (PIPE_TUNE2, up to 89 % reduction) and indirectly via recruitment (RECRUITMENT_BETA, up to 100 % reduction), which were significantly decreased to capture the difference in stature between tree and shrub PFTs.
The simulated shrub characteristics (Table 5) fall within the range determined from reported in situ field observations (see Table 1). For instance, median heights (1992–2020) are: 1.37 m (tall deciduous), 0.47 m (low deciduous) and 0.23 m (evergreen dwarf), and basal diameters 4.84 cm (tall deciduous), 2.23 cm (low deciduous) and 0.47 cm (evergreen dwarf), closely matching the literature-based aims established for the shrub PFTs. For all three shrub PFTs, a fraction of ∼ 64 %–66 % is allocated to belowground biomass, in line with ecological knowledge (Table 5). Overall, our estimates provide a physically plausible shrub baseline for evaluating high-latitude carbon stocks and flux dynamics in regional simulations.
3.1.1 Aboveground biomass
Simulated aboveground biomass differs between shrub PFTs, and closely aligns with Berner et al. (2024) observations (Fig. 3). Tall deciduous shrubs in ORCHIDEE (median (IQR): 420.48 (335.8–535.6) g C m−2) fall within the range of measured AGB at sites dominated by tall willow or alder shrubs (583.50 (325.2–671.3) g C m−2). Simulated low deciduous shrubs (183.74 (155.0–224.1) g C m−2) closely match observations at dwarf birch-dominated sites (219.50 (130.4–478.6) g C m−2). Modelled evergreen dwarf shrubs show similarly low AGB (126.77 (105.0–147.3) g C m−2) as observed at field sites dominated by evergreen dwarf shrubs species (131.25 (73.8–217.5) g C m−2). For each shrub type, observed variability from Berner et al. (2024) is larger than simulated, which is expected both because of the limited information available to accurately filter the observational data, and the limitations of model PFTs to fully represent observed heterogeneity.
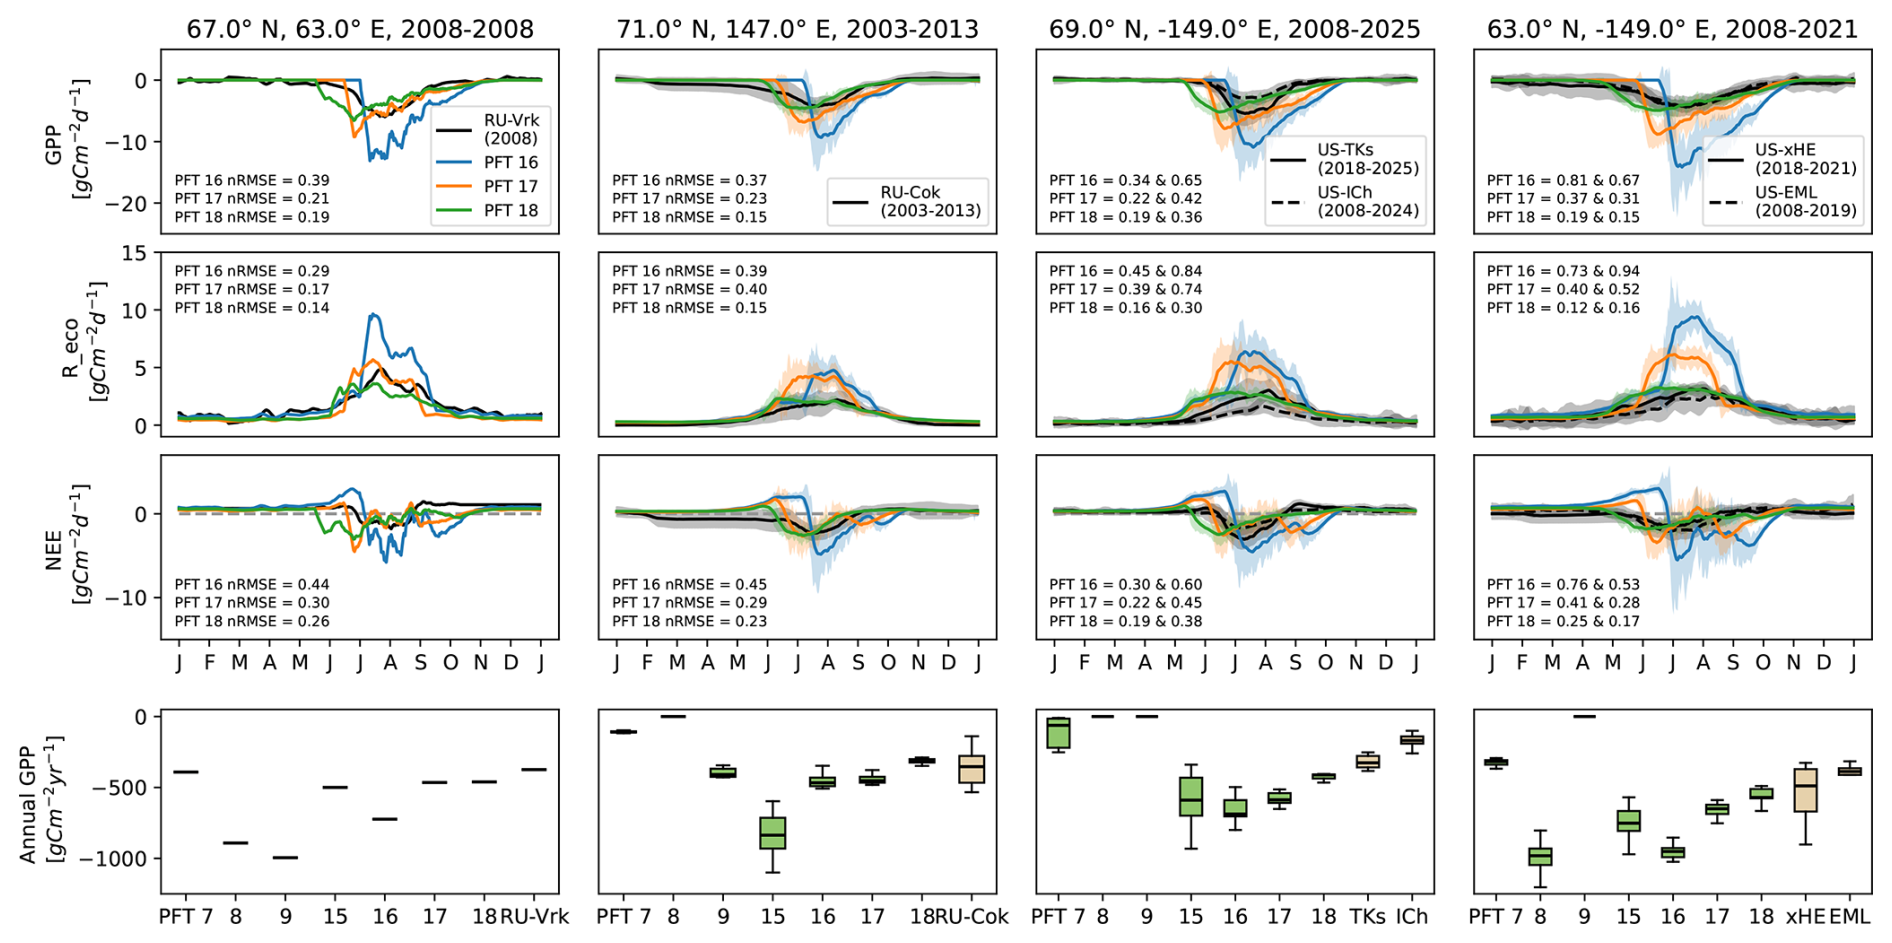
Figure 4Observed (black) CO2 fluxes at six shrub-tundra EC sites and simulated (color) shrub CO2 fluxes at four ORCHIDEE grid cells (columns, where the coordinates above the figures represent the centre of the 2° × 2° grid cells). Rows represent CO2 fluxes: gross primary productivity (GPP), ecosystem respiration (Reco), and net ecosystem exchange (NEE). Negative values indicate uptake of CO2 from the atmosphere by the vegetation, while positive values denote release. Shown is the average seasonal cycle and standard deviation (shading) in daily resolution, smoothed with a 10 d running mean. Goodness of fit is measured with root mean square error normalised by amplitude (nRMSE). Last row: annual sum of GPP simulated for all high-latitude PFTs in ORCHIDEE (green) and observed at the EC sites (brown). Note that where two EC sites are located in one ORCHIDEE grid cell, the observed fluxes shown represent different time frames and the ORCHIDEE fluxes are shown for the combined time frame.
3.1.2 Carbon fluxes
Comparing simulated seasonal cycles of CO2 fluxes to eddy-covariance observations at six shrub-tundra sites shows that the evergreen dwarf shrub PFT (PFT 18) best matches the observed fluxes, the low deciduous shrub PFT (PFT 17) scores reasonably well, and the tall deciduous shrub PFT (PFT 16) overestimates fluxes and mismatches timing (Fig. 4). This is in line with the vegetation descriptions of the EC sites pointing to dominance of low and dwarf shrubs. Modelled biases from gross primary productivity (GPP) and ecosystem respiration (Reco) propagate into simulated net ecosystem exchange (NEE), causing the largest mismatch in net carbon balance at some sites, while cancelling each other out at others. Despite their limitations to fully reproduce the observed seasonal cycle of CO2 fluxes, the shrub PFTs capture total annual GPP significantly better than the baseline high-latitude tree and grass PFTs (Fig. 4, see annual GPP). The diurnal and seasonal EC data were not used in the sensitivity test or the optimisation, making this a true data-model evaluation.
In terms of plant productivity (GPP), both the low deciduous (PFT 17) and evergreen dwarf shrub (PFT 18) PFTs capture the observed timing and magnitude of the average annual cycle reasonably well at all three sites (nRMSE: 0.15–0.36 (PFT 18); 0.21–0.42 (PFT 17)), while the tall deciduous shrub PFT (PFT 16) delays growing season onset and overestimates peak growing-season uptake substantially (nRMSE 0.34–0.81) (Fig. 4). A consistent mismatch across the three shrub PFTs is the overly abrupt spring onset of GPP, not matching the slow onset suggested by the field observations. In particular, the deciduous shrub PFTs experience a rapid increase in photosynthetic activity at the onset of the growing season – a behavior that can be traced to model functionality where leaf onset for deciduous PFTs occurs within one single day. As a consequence of the rapid onset, simulated GPP of PFT 17 and 18 peaks slightly earlier in the growing season than observed. The magnitude of peak C uptake is matched realistically by PFT 18 at five out of six sites, while the low and especially the tall deciduous shrubs overestimate peak GPP.
For our specific modelling purposes in this paper, more urgent than matching timing and magnitude, is to correctly reproduce total annual carbon uptake. Annual sums are best reproduced by the low deciduous and dwarf evergreen shrub PFTs, whereas boreal trees, grasses and tall shrub PFTs tend to overestimate GPP, and underestimate it outside of their optimal growth range (Fig. 4, last row). Over the entire tundra region, median (IQR) annual GPP (1992–2020) is 587 (414–791) for PFT 16, 453 (357–561) for PFT 17 and 321 (233–403) for PFT 18; the latter matching the 336 (209–413) estimated at the six EC flux sites best.
With respect to respiratory loses (Reco), the dwarf evergreen shrub PFT shows the best fits across sites (nRMSE: 0.12–0.30), whereas both deciduous shrub PFTs overestimate growing-season respiration, reflected in higher nRMSE values (0.17–0.74 (PFT 17), 0.29–0.94 (PFT 16); Fig. 4). This can likely be attributed to overestimated maintenance respiration, while the simulated heterotrophic respiration outside of the growing season matches the observations well (cf. Fig. B2).
In ORCHIDEE, NEE reflects the net balance between GPP and Reco, so biases in both gross fluxes propagate into NEE (Fig. 4). As a result of the underestimation of spring-time GPP, the shrub PFTs simulate weaker net C uptake than observed early in the year. The observed growing season NEE is matched well by the simulated evergreen dwarf shrubs in terms of magnitude, but the timing is shifted, with too early onset and end (nRMSE values of 0.19–0.38). For both deciduous shrub PFTs, the fit between simulated and observed NEE is less optimal (PFT 17: 0.22–0.45; PFT 16: 0.30–0.76). Both overestimate peak C uptake compared to four out of six site observations and misrepresent the seasonal pattern by simulating two peaks during the growing season. The first peak results from the strong onset of GPP, while the second arises from an abrupt decline in (maintenance) respiration at the end of the growing season. Due to the strong fluctuations and the underestimation of carbon uptake (GPP) outside of the growing season, the simulated total annual NEE is close to neutral for the shrub PFTs at all four grid cells (between -29 and 40 ), while the observed annual NEE shows a larger variation, from 197 at RU-Vrk (denoting net loss of CO2 to the atmosphere) to -142 at RU-Cok (cf. Fig. B3).
3.2 Updated vegetation distribution
The updated PFT maps used in this study allocate on average 9.9 % (2.14 Mkm2) of the Arctic–Boreal study area > 50° N (∼ 21.75 Mkm2) to the three shrub PFTs during the 1992–2020 period. 1.26 Mkm2 (∼ 5.8 % of the land area analysed) were allocated on average to evergreen dwarf shrub cover, 0.64 Mkm2 (∼ 3 %) to low deciduous shrub cover, and 0.25 Mkm2 (∼ 1.1 %) to tall deciduous shrubs. Introducing explicit shrub PFTs prevented the reassignment of shrub fractional cover to boreal tree and grass PFTs in ORCHIDEE PFT maps, thereby removing erroneously prescribed forest cover in tundra regions, and established the spatial baseline for subsequent changes in simulated carbon stocks and fluxes.
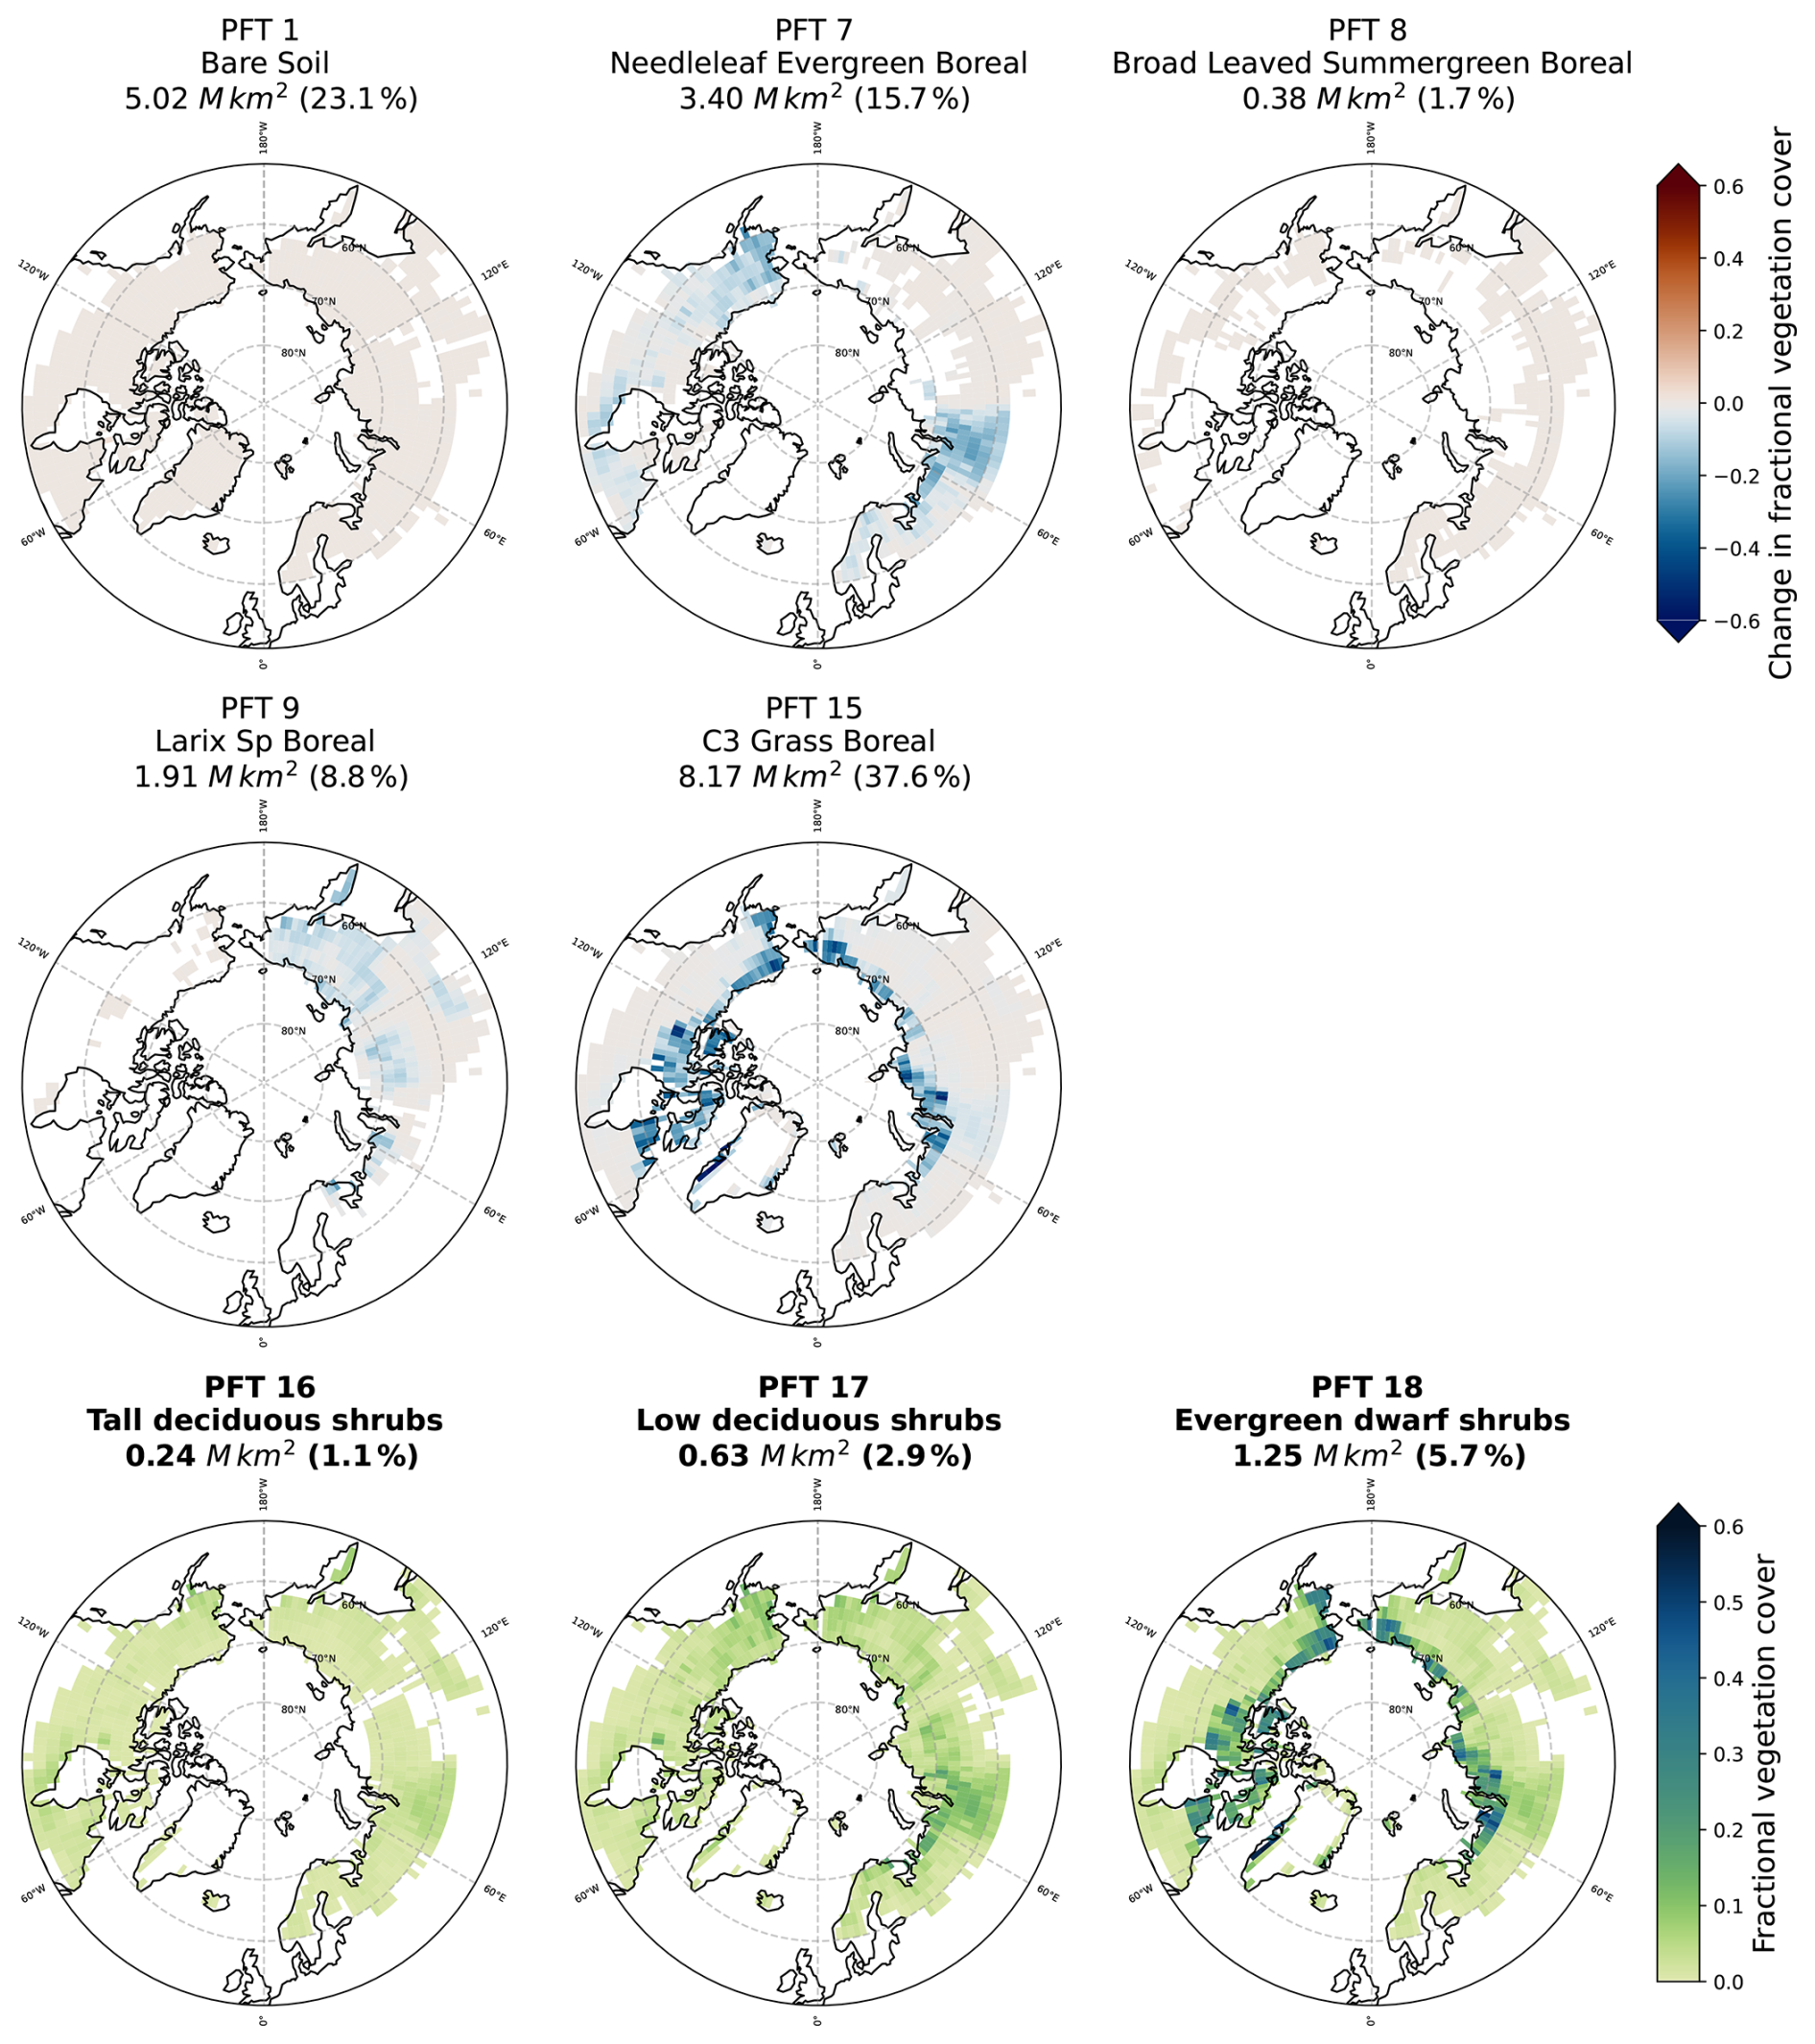
Figure 5Change in fractional cover of high-latitude PFTs in ORCHIDEE after the introduction of three shrub PFTs. Bottom row: Fractional cover of the three new shrub PFTs. Maps are based on the vegetation distribution in 2010. Numbers indicate respective total PFT cover over the study area in 2010.
Tall deciduous shrubs are located sparsely across the Arctic–Boreal region but are most abundant across the southern latitudes, with hotspots in southwestern Alaska and western Siberia (Fig. 5). While low deciduous shrubs display a similar spatial pattern, evergreen dwarf shrubs dominate further north and are widespread across Arctic tundra regions, reaching up to 67 % fractional vegetation cover in individual grid cells. Boreal tree and grass cover classes have been reduced compared to the baseline ORCHIDEE-15 PFT simulation, and are no longer prescribed in place of shrub tundra (Fig. 5).
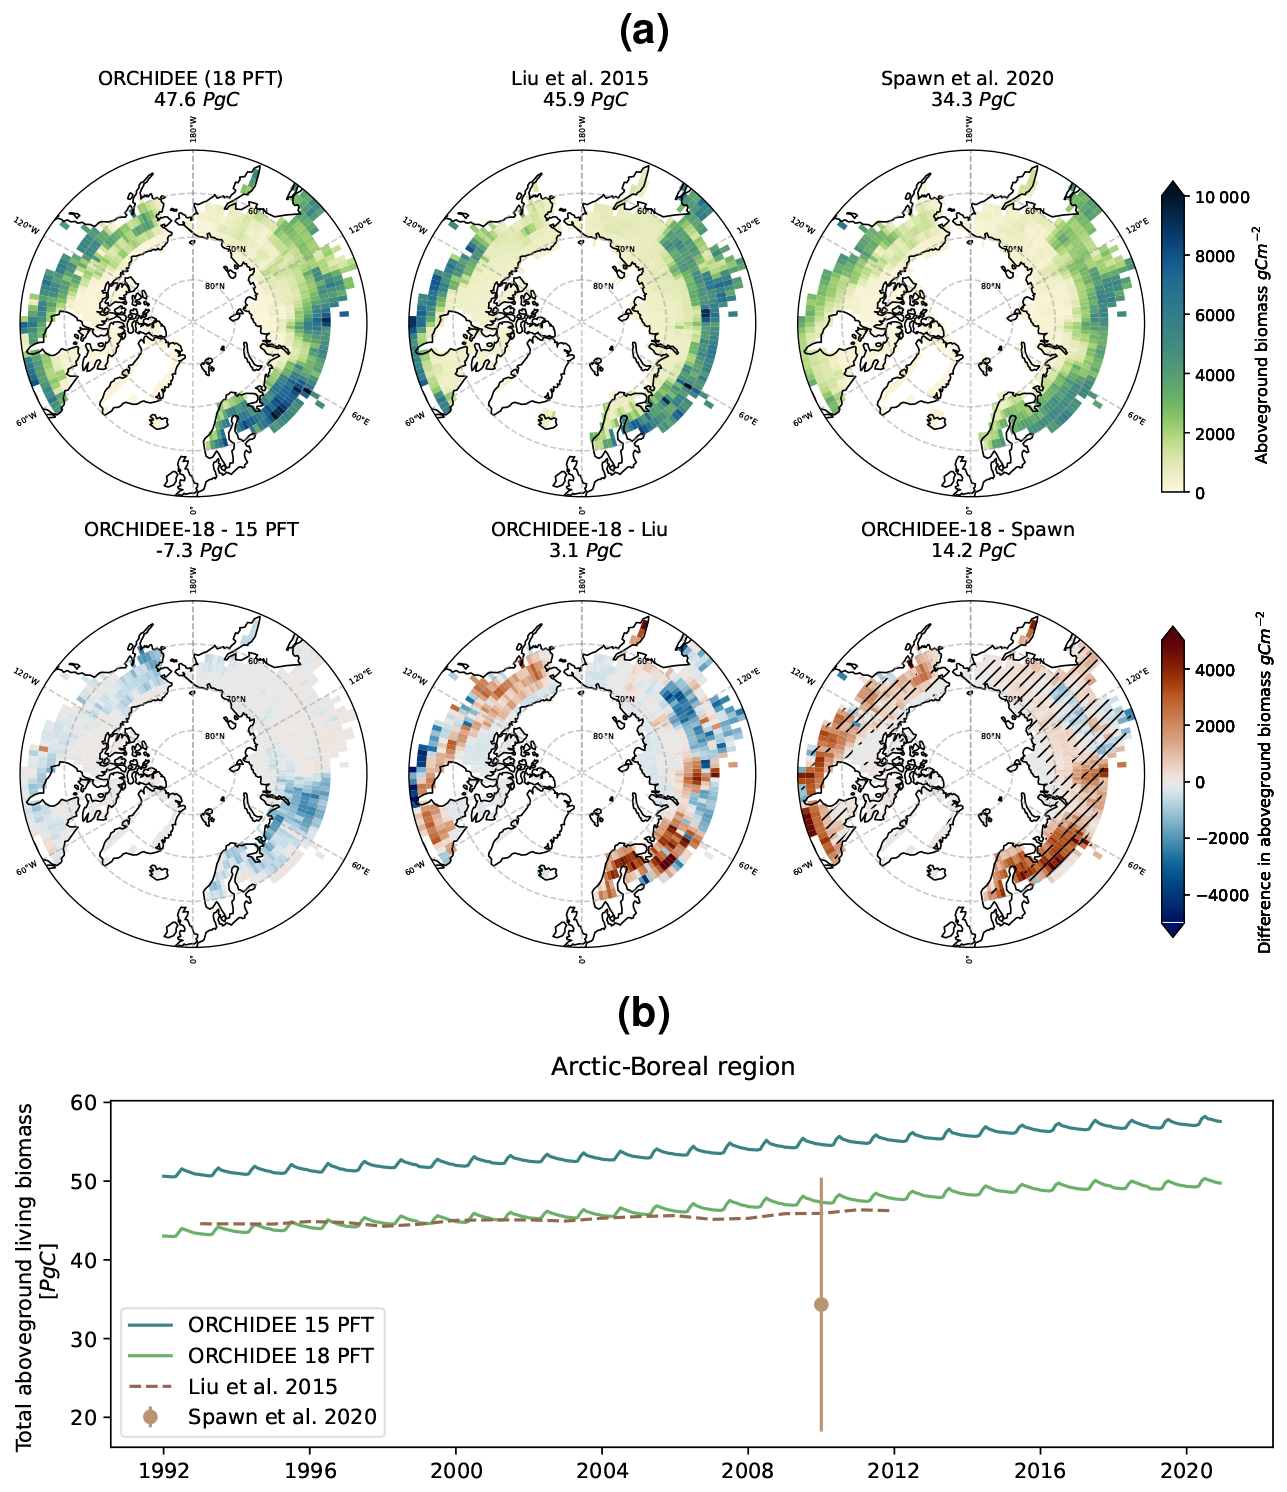
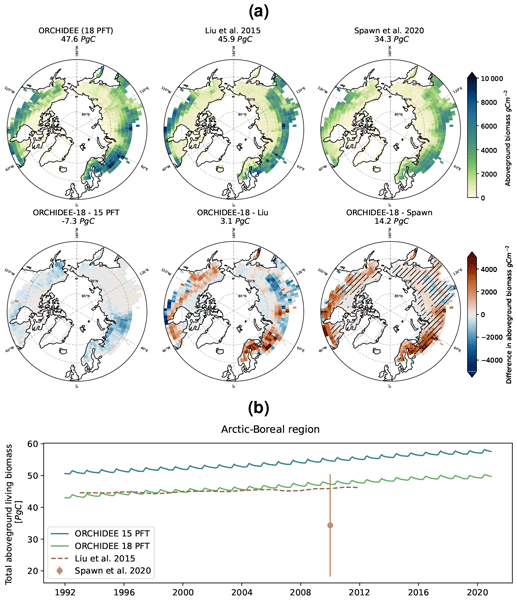
Figure 6Simulated and observation-based pan-Arctic aboveground biomass. (a) Simulated and observation-based (from Spawn et al. (2020) and Liu et al., 2015) total pan-Arctic AGB in 2010. Difference maps between ORCHIDEE with 18 PFTs and the previous (ORCHIDEE-15PFT) model version, as well as the observation-based products. Hatching indicates agreement with Spawn et al. (2020) standard error interval. Numbers indicate total AGB across the region (top row), and total difference (bottom row). (b) Simulated (blue/green) and observed (brown) total pan-Arctic AGB 1992–2020.
3.3 High-latitude aboveground biomass
Across the Arctic–Boreal region, adding shrub PFTs with realistic biomass reduced the overestimation of AGB previously caused by prescribing boreal forest in shrub-dominated landscapes. Our simulations bring simulated carbon stocks into the range of observation-based estimates and improve the spatial agreement of biomass patterns compared to two independent AGB datasets (Fig. 6).
The combination of implemented shrub PFTs with a new PFT map has reduced the simulated aboveground biomass by 13.5 % from 54 Pg C in ORCHIDEE-15 to 46.7 Pg C in ORCHIDEE-18 over the entire high-latitude region (1992–2020), now falling into the range of 34.3 ± 16.1 Pg C estimated by Spawn et al. (2020) for 2010, and closely matching the 45.2 Pg C estimate by Liu et al. (2015) for 1993–2012 (cf. to 53.1 and 45.8 Pg C for ORCHIDEE-15 and -18, respectively, for 1993–2012). Simulated AGB consistently increases over the historical time period, but the trend is slightly higher than estimated by Liu et al. (2015) (Fig. 6b). Spatially, agreement with Spawn et al. (2020) improved in 2010 to 633 out of 989 land grid cells, corresponding to 56.9 % of the domain, falling within one standard error, compared to 479 out of 989 land grid cells (42.9 % of the area) for ORCHIDEE-15 (see Figs. 6a and B4). The biomass reductions are largest in western Siberia and southwestern Alaska (see Fig. 6a), identical to the two areas with largest replacement of boreal forest with shrub cover (cf. Fig. 5). Thus, the reduction in estimated AGB is stronger if considering the tundra region separately, with 34.8 %, from 4.6 Pg C in ORCHIDEE-15 to 3 Pg C in ORCHIDEE-18 (1992–2020), now falling between the estimates by Spawn et al. (2020) (2.8 ± 1.1 Pg C in 2010) and Liu et al. (2015) (4 Pg C 1993–2012). Overall, adding shrub PFTs to ORCHIDEE reduces the bias in tundra carbon stocks and significantly increases model agreement with benchmarking data.
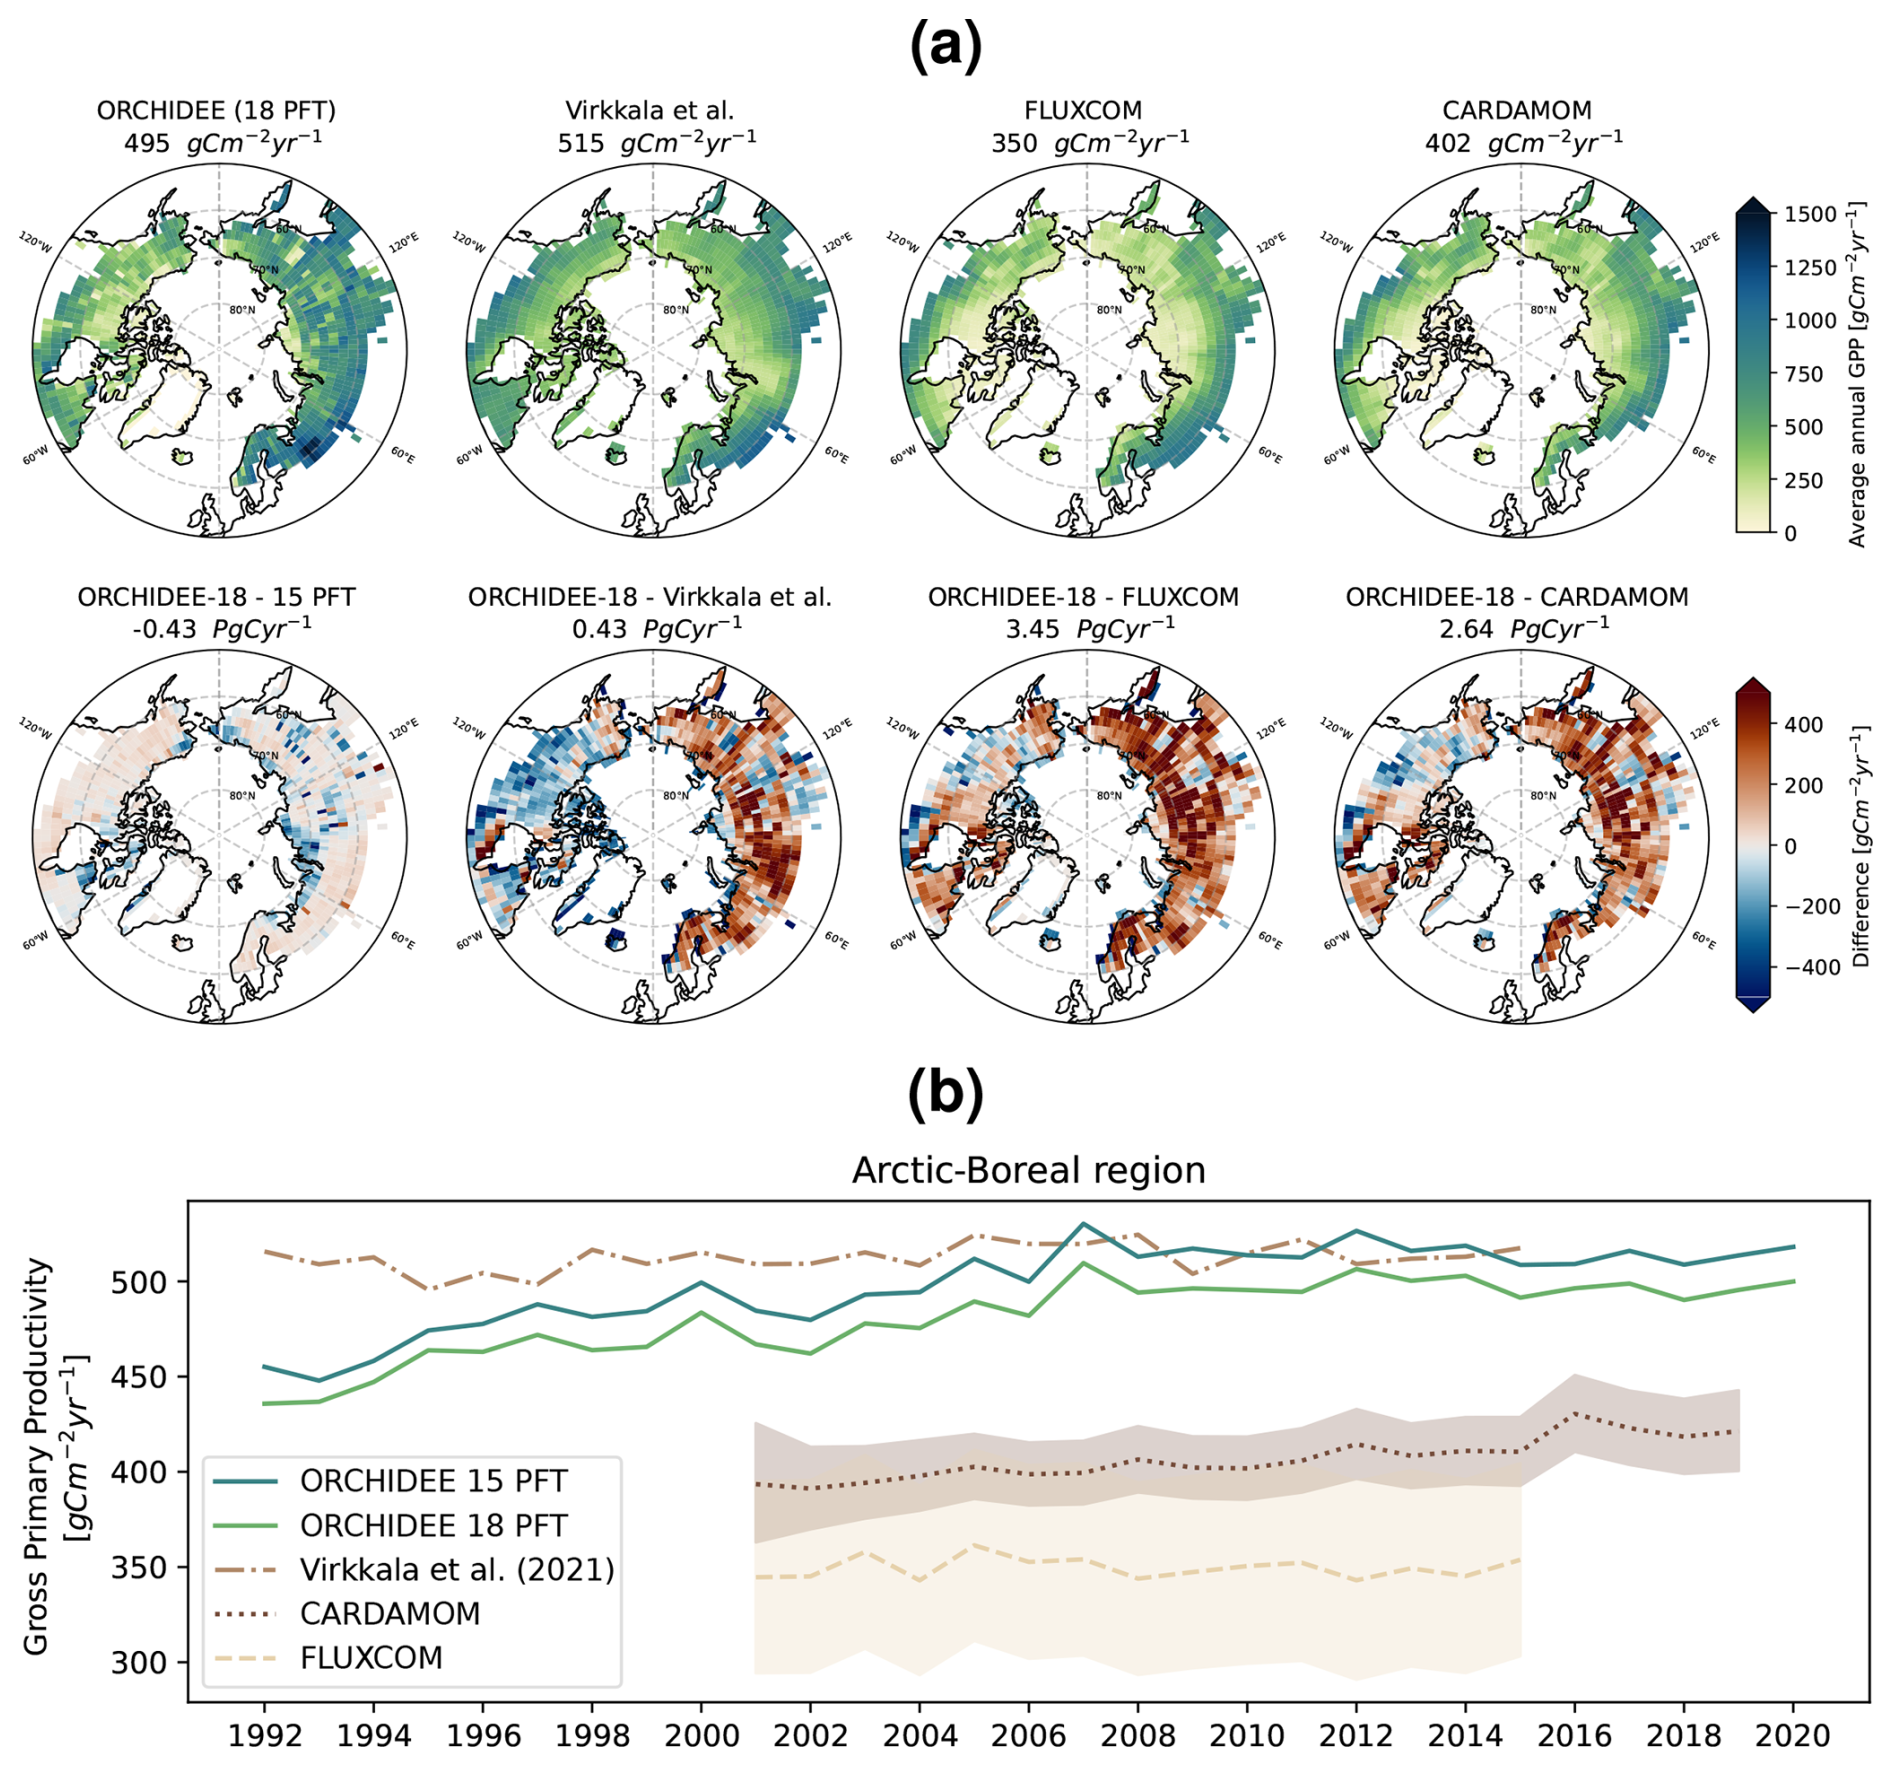
Figure 7Average annual GPP across the Arctic–Boreal region. (a) Distribution in ORCHIDEE-18 and different upscaled (Virkkala et al. (2021); FLUXCOM (Jung et al., 2019)) and data-constrained (CARDAMOM (Hugelius et al., 2024)) products, as well as difference maps with ORCHIDEE baseline and data-based products, in 2010. Numbers indicate area-weighted mean annual GPP across the region (top row), and total difference (bottom row). (b) Simulations (blue/green) and upscaled/data-constrained estimates (brown) of average annual GPP over the boreal and arctic region.(Virkkala et al. (2021): area-weighted mean of ensemble median of upscaled estimates (1992–2015); FLUXCOM: area-weighted mean and mean absolute derivation (2001–2015), CARDAMOM: area-weighted mean of model median and 95 % confidence interval (2001–2019)).
3.4 High-latitude carbon fluxes
Mean annual GPP across the Arctic–Boreal region (1992–2020) is reduced by 3.4 %, from 498 to 481 through the introduction of shrub PFTs, moving simulations toward the FLUXCOM estimate from upscaled flux observations (Jung et al. (2019): 350 ± 50.7 (mean ± mean absolute derivation, 2001–2015); cf. to ORCHIDEE-18 (2001–2015): 490 ) and an estimate using the data-constrained data-assimilation framework CARDAMOM (Hugelius et al. (2024): 407 (388–426) (weighted mean (95 % CI), 2001–2019); cf. to ORCHIDEE-18 (2001–2019): 491 ; Fig. 7b). Conversely, the upscaled Virkkala et al. (2021) estimate is closer to the higher GPP estimation from ORCHIDEE-15 (512 (Virkkala, mean 1992–2015); cf. to 495 and 478 (ORCHIDEE-15 and ORCHIDEE-18 1992–2015, respectively)). However, this high region average masks a spatially heterogeneous estimate by Virkkala et al. (2021), supporting the higher ORCHIDEE-15 estimate over some parts of the domain, and the lower ORCHIDEE-18 estimate over others. Spatially, all three data-based products agree that ORCHIDEE overestimates GPP over most of the Eurasian side of the domain (cf. difference maps in Fig. 7a). On the North American side, the difference is more heterogeneous and varies between the data products. FLUXCOM and CARDAMOM point to an overestimation in the higher latitudes and an underestimation at the southern edge of the domain, while the Virkkala et al. (2021) estimate indicates that ORCHIDEE underestimates GPP across Canada and Alaska. Compared to the baseline ORCHIDEE version, GPP was reduced primarily in the tundra region, concentrated largely in the areas with high evergreen dwarf shrub cover (ORCHIDEE-18–ORCHIDEE-15 difference map in Fig. 7a; cf. Fig 5).
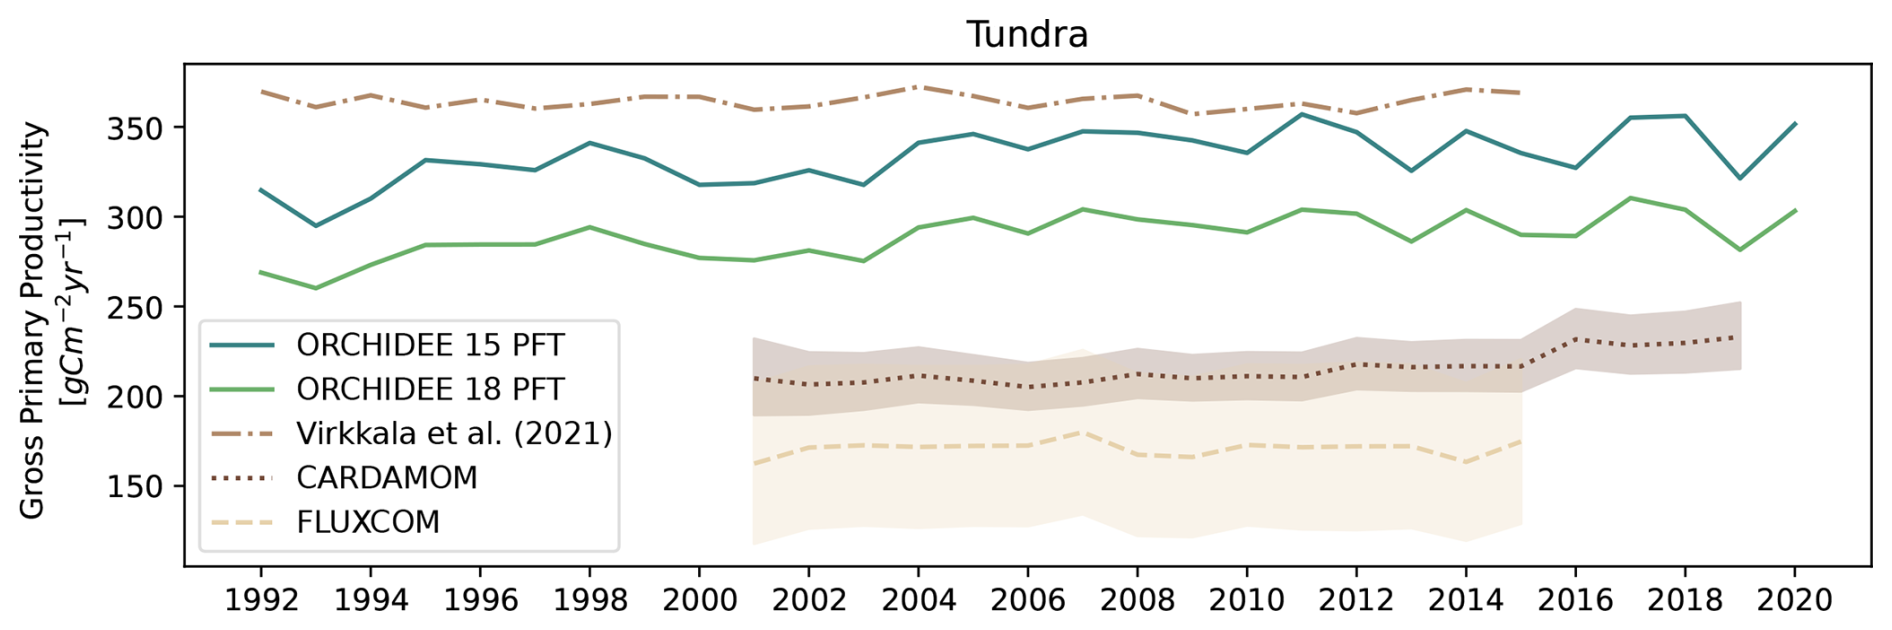
Figure 8Simulated (blue/green) and upscaled/data-constrained (brown; Virkkala et al., 2021; Jung et al., 2019; Hugelius et al., 2024) average annual GPP, like in Fig. 7b, but only for the Arctic tundra region.
Consequently, a separate evaluation of the tundra region shows a stronger improvement, with a 13.5 % reduction in mean annual GPP from 334 (ORCHIDEE-15) to 289 (ORCHIDEE-18) (1992–2020) and a closer yet imperfect agreement with FLUXCOM and CARDAMOM benchmarking data (FLUXCOM: 171 ± 45 ; CARDAMOM: 215 (201–231) ), while the Virkkala et al. (2021) estimate points to an underestimation (364 ; Fig. 8).
Overall, including shrubs reduced total Arctic–Boreal GPP, even more so in the tundra region, and improved agreement with 2out of 3 data-based evaluation products.
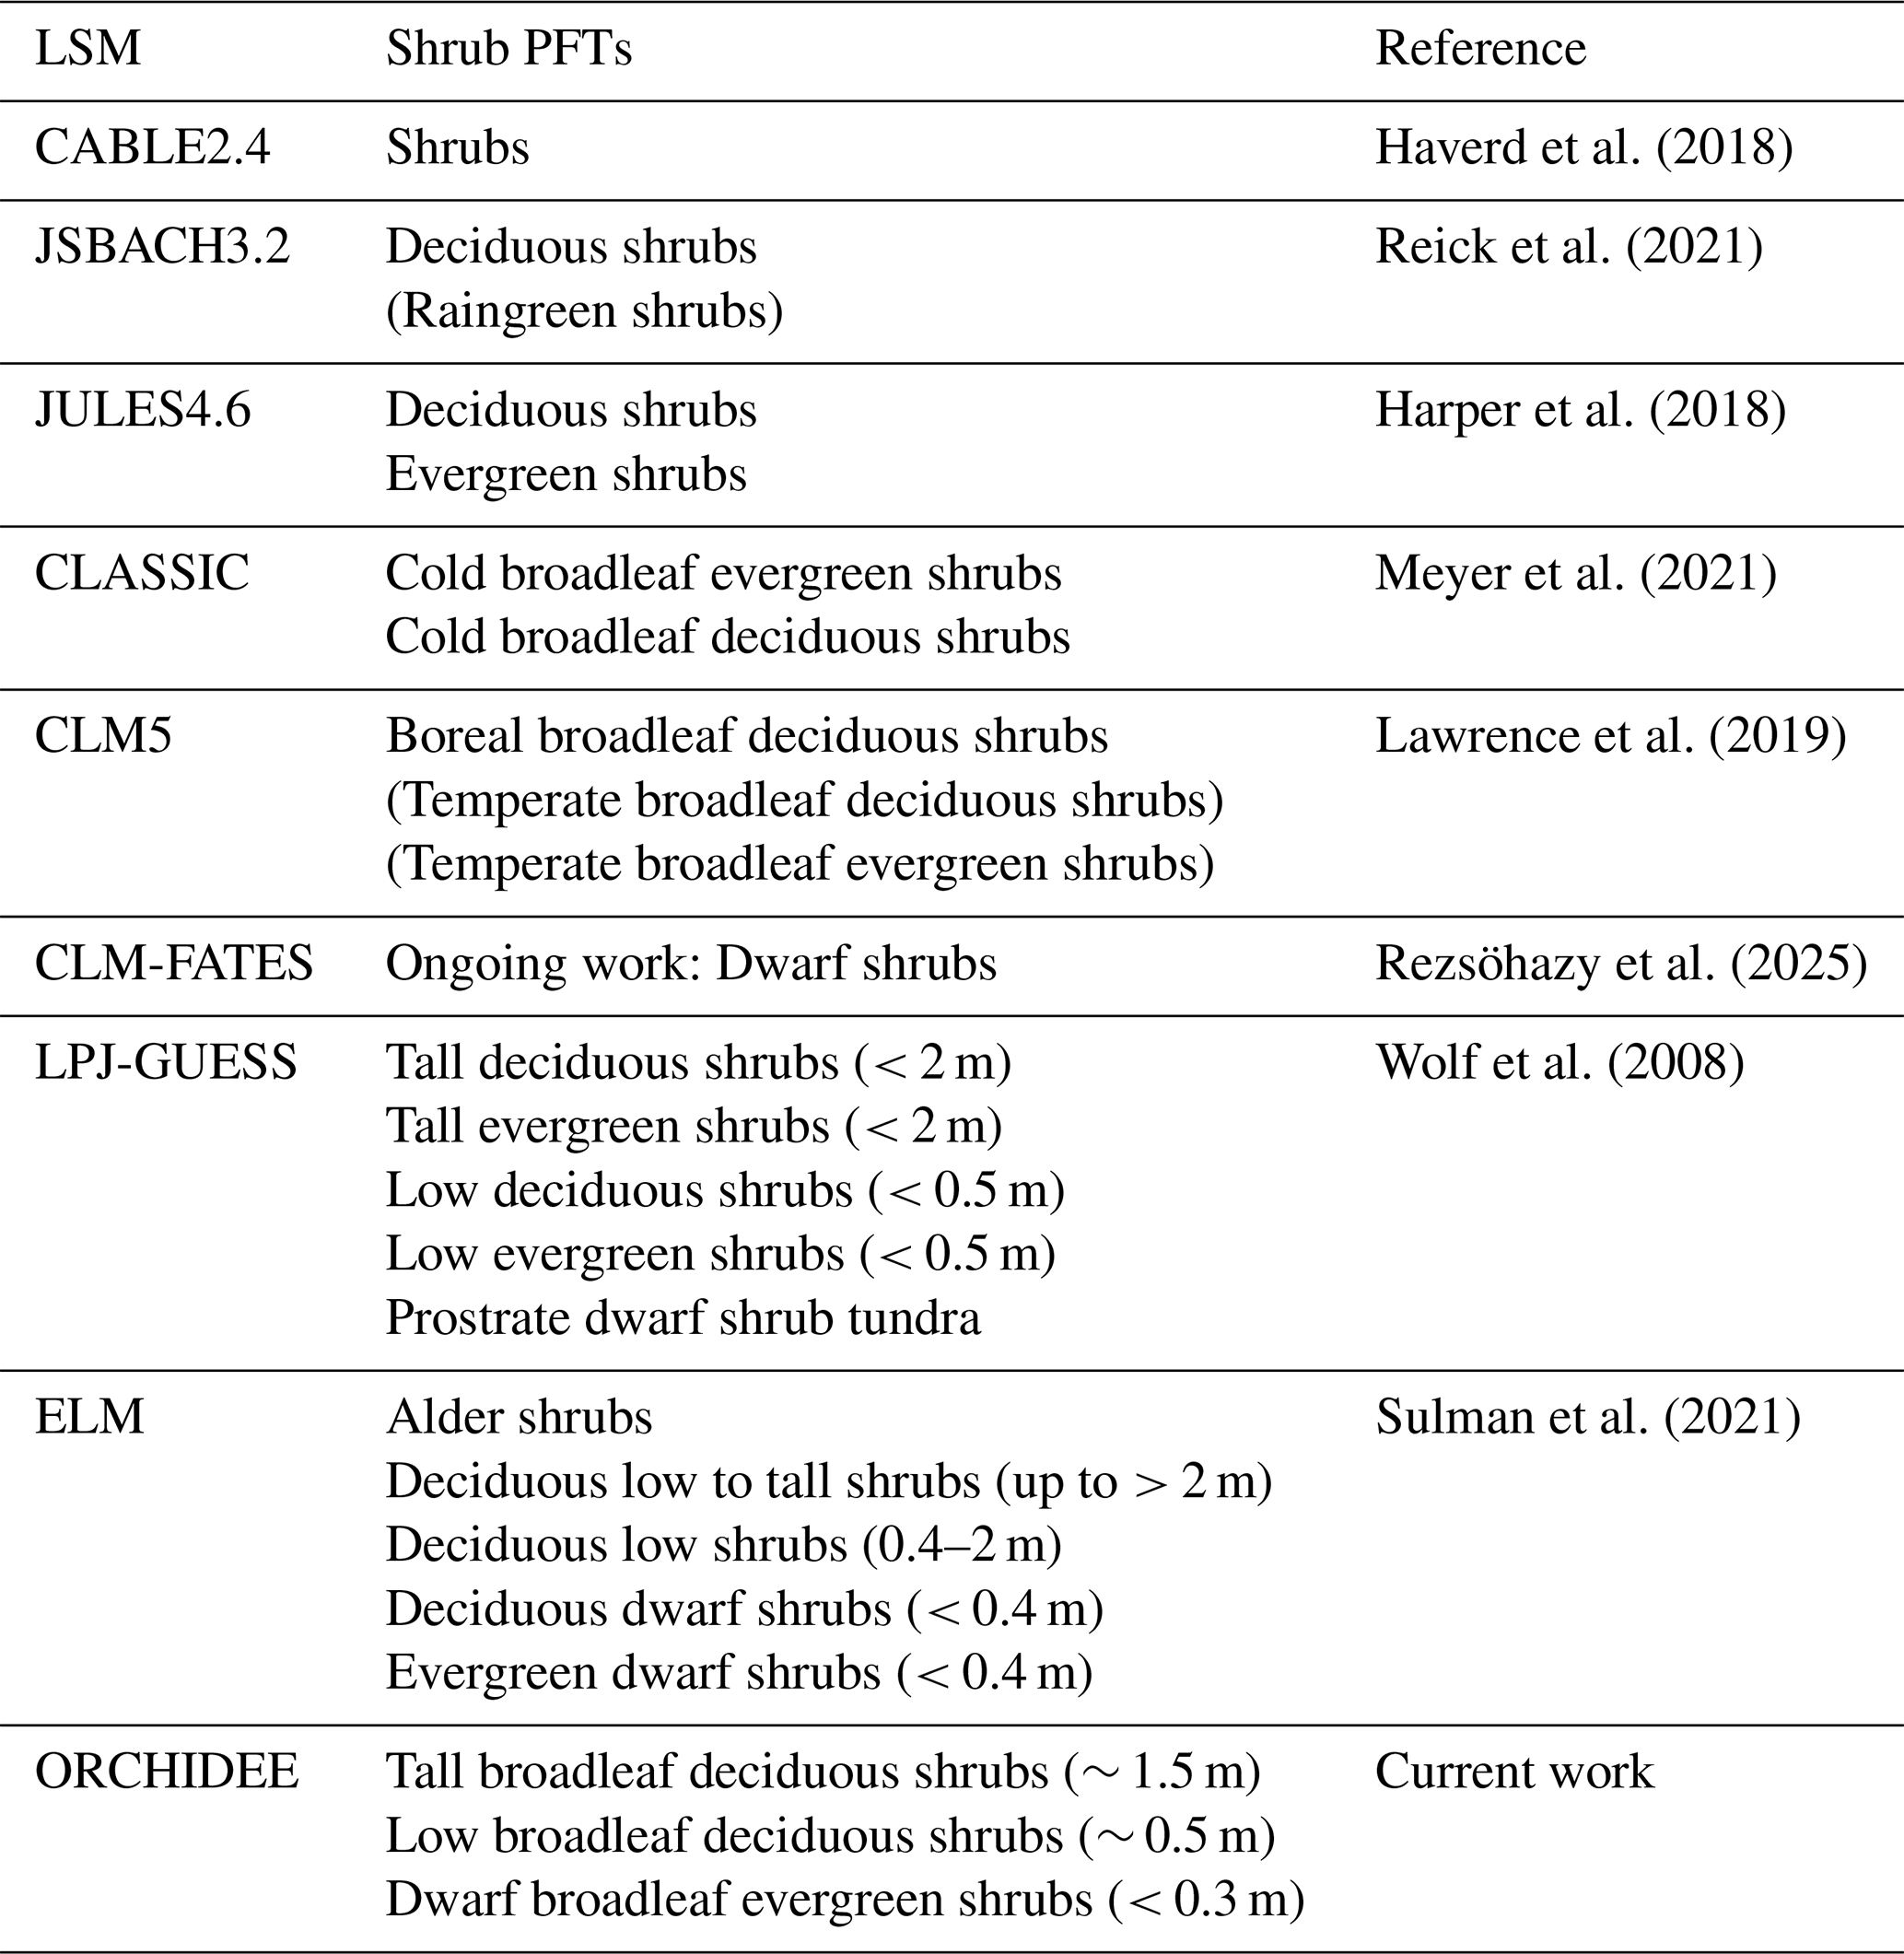
Haverd et al. (2018)Reick et al. (2021)Harper et al. (2018)Meyer et al. (2021)Lawrence et al. (2019)Rezsöhazy et al. (2025)Wolf et al. (2008)Sulman et al. (2021)Table 6Overview of high-latitude shrub PFTs in selected land models of ESMs. Parentheses indicate shrub PFTs explicitly designed for outside of the high-latitude region. Information on shrub PFT height thresholds is indicated in parentheses where known.
4.1 Shrub PFT classification and parameterisation
The new ORCHIDEE shrub PFT classification distinguishes shrub types by phenology (deciduous or evergreen) and plant height, following literature recommendations (Wullschleger et al., 2014; Mekonnen et al., 2021). Our classification captures the differing carbon cycle and ecosystem functions of the most prominent shrub types (Mekonnen et al., 2021) and lays the foundation for implementing distinct shrub-climate interactions and feedbacks. This categorisation balances real-world functional diversity with the computational constraints of a global LSM.
Our classification and parameterisation are more detailed than the shrub implementations in most other global LSMs, which often only differentiate between deciduous and evergreen shrubs and therefore are not able to capture growth-form-dependent differences and climate interactions (Bonfils et al., 2012; Wullschleger et al., 2014; Saccone et al., 2017; Mekonnen et al., 2021). A comparison of shrub implementations in different LSMs (Table 6; see Wullschleger et al. (2014) for further ecosystem models) shows that some models only include one generic shrub PFT in high-latitudes (e.g. CABLE2.4, CLM5, JSBACH3.2), while others at best differentiate between deciduous and evergreen (e.g. CLASSIC, JULES4.6). ELM and LPJ-GUESS, known for their high ecological realism (Martín Belda et al., 2022), include similar categorisations to the one presented in our study, differentiating between evergreen and deciduous shrubs and different heights (Wolf et al., 2008; Sulman et al., 2021). Our choice made for ORCHIDEE captures the same distinctions (evergreen-deciduous and height differences) and thus supports explicit representation of growth-form–dependent shrub–climate feedbacks (e.g., via phenology and canopy structure), while keeping the PFT space manageable given the current model complexity.
Contrary to the site-level calibrations in many other shrub implementations (e.g. Wolf et al., 2008; Meyer et al., 2021; Sulman et al., 2021), the ORCHIDEE shrub PFT classification and parameterisation are constrained by synthesised observations spanning the entire high-latitude region, increasing its transferability and limiting site-specific biases (Alton, 2011; Kuppel et al., 2014). This is in line with recent work by Murphy et al. (2025), highlighting the limitations of model parameterisations based on plot-level observations from a single site. Thus, the methodological choices, including the shrub PFT classification scheme, calibration targets and vegetation distribution, are applicable beyond the ORCHIDEE model.
While parameter selection and optimisation were mainly carried out in a single grid cell due to computational limitations, the results indicate that parameterisations can be considered regionally representative, since simulated shrub characteristics match synthesised observations not only in the optimisation grid cell, but across the entire region. Parameterisation in a single grid cell was further deemed sufficient for the targeted variables like height and biomass, because in ORCHIDEE they are less sensitive to local environmental conditions than the observed variability indicates (cf. the relatively narrow ranges of height, diameter and biomass over the entire region given in Table 5, and the smaller variability in AGB in ORCHIDEE compared to observations in Fig. 3). Notably, CO2 flux-variables, with a stronger variability based on site conditions, were carefully evaluated at several locations to avoid site-specific biases. While this limited reproduction of spatial variability justifies the methodological choices in the present work, it calls for an enhanced representation of environmental dependencies in ORCHIDEE shrub parameter calculations in future work.
Our shrub implementation follows a classical fixed PFT approach, instead of a more flexible trait-based PFT implementation, where PFT traits vary in response to environmental conditions. Dynamic trait-based approaches have been proposed as a useful mechanism to capture functional diversity within generalised PFTs and dynamic responses to climate change (Wullschleger et al., 2014; Verheijen et al., 2013; Bodegom et al., 2011) and several studies suggest that understanding and implementing trait variations of high-latitude shrubs in models can improve projections of changes in ecosystem function and climate change feedbacks (Myers-Smith et al., 2019; Iturrate-Garcia et al., 2020; Eldridge et al., 2011; Yang et al., 2022). However, a trait-based implementation is challenging given the limited availability of shrub-plant trait observations (Myers-Smith et al., 2019; Thomas et al., 2020; Iturrate-Garcia et al., 2020). Our chosen shrub PFT implementation is sufficient to capture the role of different shrub types in present-day high-latitude carbon uptake and storage, as demonstrated by our results. However, future developments aiming to improve plant phenology timings and magnitudes, and capture shrub-climate interactions and future expansion may benefit from adding trait-based variations to the existing shrub PFTs. Recent developments of ORCHIDEE already introduced dynamic parameter calculations, of e.g. dynamic tree height and mortality (Peylin et al., 2026), that may be extended to shrubs. One such example could be for the tundra–treeline ecotone, where the structural distinction between tall deciduous shrubs and small trees can be fluid, particularly for taxa such as mountain birch (Betula pubescens ssp. tortuosa) and green alder (Alnus viridis) (Mauri and Caudullo, 2016; Óskarsdóttir et al., 2022). These may occur in both shrub-like and tree-like forms depending on climatic conditions. In such cases, dynamic parameterisation could, in principle, allow gradual transitions between shrub and tree growth forms.
Overall, the shrub PFT categorisation by phenology and height captures key functional contrasts and is sufficiently constrained to support regional carbon-cycle evaluation (Figs. 6–8), while leaving trait-continuous responses as a clear next development step.
4.2 Shrub implementation in ORCHIDEE
A key strength of this new shrub functionality lies in its relative simplicity: it introduces shrub PFTs by relying largely on existing processes already used for woody vegetation, rather than adding new functional modules to an already complex model. Our experiment demonstrates the adaptability of the ORCHIDEE framework.
In ORCHIDEE, all woody PFTs share core process formulations for photosynthesis, respiration, and carbon allocation to leaves, stems, and roots, while functional differences are expressed through PFT-specific parameters controlling plant height, leaf area index, allometry, and phenology (Krinner et al., 2005; Naudts et al., 2015). Shrub PFTs were implemented relying on this shared functionality, maintaining process consistency, and minimizing added model complexity, but adjusting parameter values that control key differences in ecosystem functioning between shrubs and trees. This highlights that the carbon allocation scheme of the recent ORCHIDEE version, based on the pipe model (Shinozaki et al., 1964), is generic enough to represent trees and shrubs with only a few parameter changes.
Key shrub–tree contrasts that are directly targeted in our calibration and evaluation include: morphological differences, which have been addressed through an adaptation of the growth form to low heights and stem diameter and higher density of stems; and adaptability of shrubs to limited growth conditions, which have been addressed through reduced sizes, as well as earlier leaf onset in PFT 17 and higher nitrogen use efficiency in PFT 18 (cf. Sect. 2.1.1).
Furthermore, shrubs differ from trees in their interactions with high-latitude environments. While the newly implemented shrub PFTs improve high-latitude vegetation representation and carbon cycling in ORCHIDEE, further developments are needed to explicitly capture shrub-climate interactions and feedbacks. Central feedback processes to consider when modelling shrubs include their interactions with snow, impacts on soil thermal regimes and permafrost dynamics, as well as albedo changes (Wullschleger et al., 2014; Mekonnen et al., 2021). For instance, snow cover influences shrub growth, by insulating and protecting shrub buds and tissues from frost, and shaping shrub height and growth form (Myers-Smith et al., 2011; Wheeler et al., 2014). Conversely, shrub presence increases snow accumulation and reduces its compaction, with impacts on soil temperatures and permafrost through the thermal insulation of the snowpack (Myers-Smith et al., 2011; Domine et al., 2016; Heijmans et al., 2022). Depending on shrub height and stature, shrub branches protruding above the snowpack can reduce winter albedo and accelerate snow melt (Belke-Brea et al., 2020; Shuman et al., 2025). These dynamics may potentially represent feedbacks on shrub growth and climate warming, and will thus be important to capture in modelling efforts of future high-latitude ecosystem-climate interactions in ORCHIDEE. After implementation of shrub-climate interactions, the next step would be the representation of dynamic shrub expansion processes through competition with other high-latitude PFTs.
Overall, our implementation demonstrates that shrub-appropriate PFT traits can be represented within ORCHIDEE’s existing woody framework, reducing biases in high-latitude carbon cycling (Figs. 6–8), while laying the groundwork for dynamic shrub-climate interactions.
4.3 Vegetation distribution
As vegetation fractions are prescribed in ORCHIDEE, the PFT maps condition simulated regional carbon stocks and fluxes. Updating these maps to include three shrub PFTs reduces the extent of forest-prescribed tundra and introduces spatially explicit shrub fractions that contribute to the biomass and GPP changes reported in Sect. 3.3 and 3.4.
Our updated PFT maps combine the ESA CCI–based PFT product (Harper et al., 2023) with additional shrub cover information (Raynolds et al., 2019) and apply empirical partitioning rules derived from local to sub-regional shrub mapping (Macander et al., 2017, 2022) to distribute shrub cover among the three ORCHIDEE shrub PFTs (Sect. 2.3). These additional steps address the known limitations of high-latitude shrub cover representation in Harper et al. (2023), and provide the information needed to distinguish between the three ORCHIDEE shrub PFTs. While this approach improves shrub representation in high latitudes compared to Harper et al. (2023) alone, it introduces its own set of uncertainties that should be considered when interpreting regional results.
First, partitioning shrub cover among the three shrub PFTs relies partly on relationships derived from Alaska/Yukon mapping products that are applied at pan-Arctic scale (Sect. 2.3). This extrapolation is necessary due to the lack of pan-Arctic mapping products with comparable detail in their shrub categorisation, but it may misrepresent regional differences in shrub composition. Second, shrub type definitions differ among observational and remote-sensing products and do not map uniquely onto the three ORCHIDEE shrub PFTs. For example, Macander et al. (2017) define low deciduous shrubs as 0.2–1.5 m tall, and tall shrubs as > 1.5 m, whereas our tall/low cut-off lies between ∼ 0.5 and 1 m; this mismatch may lead to an underestimation of tall-shrub fractions.
Independent evaluation of shrub cover fractions remains challenging because no pan-Arctic benchmark product provides comparable detail on shrub type and height. Using a reconstruction of tall shrub cover across 11 regions of the Siberian tundra (Frost and Epstein, 2014), we obtain a mean tall shrub cover of 13.9 %, supporting that tall shrubs may be underestimated in our PFT maps (mean 1.3 %, max 10.2 %). In the absence of unified benchmarks, we evaluate shrub distributions indirectly through their impact on regional AGB and GPP patterns, and interpret model improvements as the combined effect of shrub traits and shrub spatial distributions.
Overall, the updated PFT maps provide a necessary spatial foundation for representing high-latitude shrubs in ORCHIDEE and contribute to improved AGB and GPP relative to benchmarking data. However, uncertainty in shrub distributions remains a primary source of uncertainty in regional pan-Arctic carbon simulations.
4.4 Improved Model performance
Including shrub PFTs improves high-latitude carbon cycling in ORCHIDEE, reducing both simulated AGB and GPP across the Arctic–Boreal region and improving model performance compared to benchmark data.
Comparing simulated GPP with different data products highlighted a general agreement between simulated and observed GPP, but also underscored uncertainties in the upscaled observational datasets (Sect. 3.4). Across the Arctic–Boreal region, FLUXCOM (Jung et al., 2019) and CARDAMOM (Hugelius et al., 2024) provide lower GPP estimates than ORCHIDEE (350 (FLUXCOM, 2001–2015) and 407 (CARDAMOM, 2001–2019) , compared to 498 and 481 , for ORCHIDEE-15 and ORCHIDEE-18, respectively, 1992–2020). In contrast, the Virkkala et al. (2021) upscaling yields estimates higher than ORCHIDEE-18 (512 , 1992–2015; Fig. 7b). This spread among upscaled products implies that absolute GPP bias cannot be uniquely diagnosed from any single regional benchmark, and our simulated estimates fall within the range of recent regional data-constrained estimates derived from independent approaches.
Virkkala et al. (2021)Virkkala et al. (2021)Virkkala et al. (2021)Virkkala et al. (2021)Virkkala et al. (2021)Virkkala et al. (2021)Table 7Mean (standard deviation) annual () and seasonal () GPP simulated in ORCHIDEE and observed/upscaled by different sources. (FLUXCOM (Jung et al., 2019), CARDAMOM (Hugelius et al., 2024), Virkkala et al. (2021) upscaled and observed, ABCflux database (Virkkala et al., 2022)). Seasons: spring = MAM, summer = JJA, autumn = SON, winter = DJF.
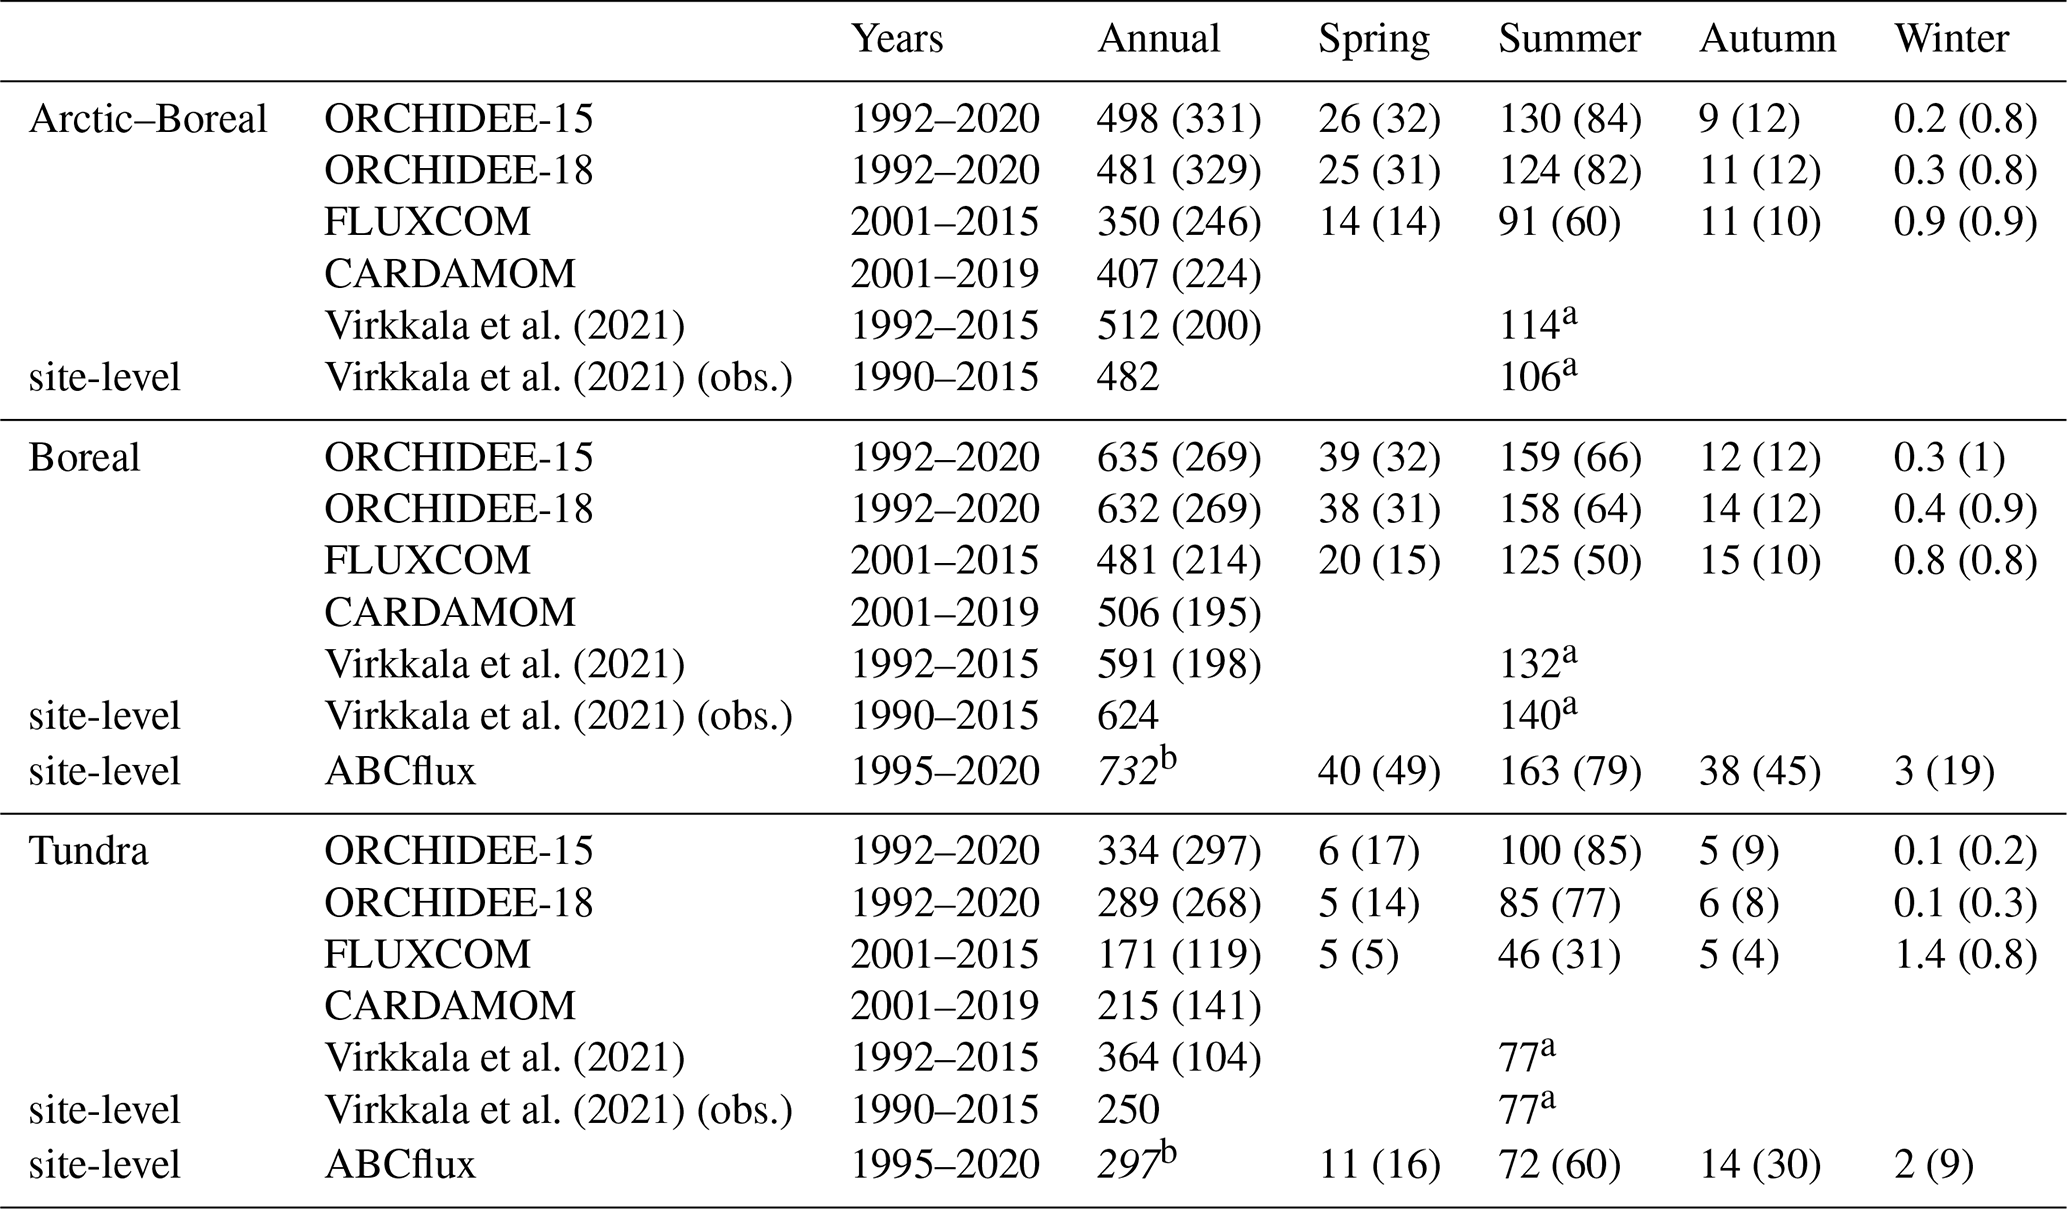
a Virkkala et al. (2021) report growing season values (not JJA summer) with unknown length, in , here divided by 3 assuming the growing season corresponds approximately to the three summer months (JJA). Values taken directly from the paper, reported over a larger area than examined in this study, resulting in an expected small overestimation. b Total annual values aggregated from reported seasonal means.
Differentiating between the tundra and boreal ecoregions (Dinerstein et al., 2017) and by seasonal fluxes, as well as adding synthesized site level observations to the comparison, provides a clearer picture of GPP biases (Table 7). In the boreal region, where the reduction in ORCHIDEE-18 relative to ORCHIDEE-15 is small (0.47 %), alignment between data-based products is high, indicating a modest positive bias in ORCHIDEE. A comparison with synthesized FLUXNET observations from Virkkala et al. (2021) further supports the overall high agreement between simulated GPP from both ORCHIDEE-versions and boreal zone site observations, with a slight improvement in ORCHIDEE-18. The FLUXNET synthesis in the ABCflux database suggests higher GPP values in the boreal region, mainly based on higher estimates outside of the growing season (Virkkala et al., 2022). The main disagreement among data-based products originates in the tundra region. There, the Virkkala et al. (2021) upscaled estimate and the synthesized flux observations of the ABCflux database point to higher GPP estimates than in ORCHIDEE-15, while the other products (FLUXCOM, CARDAMOM, Virkkala et al. (2021) synthesized observations) indicate an overestimation bias in both ORCHIDEE-15 and ORCHIDEE-18. Focusing on the growing season reveals a stronger and more consistent signal across all datasets: all data products agree that ORCHIDEE-15 overestimates GPP (100 ) in tundra summer (JJA), and that the introduction of shrubs reduces this bias (85 ), increasing agreement with upscaled and synthesized data products (see Table 7). In contrast, outside of the growing season, ORCHIDEE underestimates GPP relative to the ABCflux database and FLUXCOM. The stronger reduction in simulated GPP in the tundra region (13.5 %), particularly during the summer, can be explained with a higher shrub fraction in the ORCHIDEE PFT maps in the tundra region, combined with the fact that differences in simulated GPP among ORCHIDEE PFTs are most pronounced during the growing season. Overall, multiple benchmarks indicate that shrub PFTs reduce GPP toward observation-based ranges, especially in the Arctic tundra subregion.
Hugelius et al. (2024)Hugelius et al. (2024)Ramage et al. (2024)Virkkala et al. (2021)Virkkala et al. (2021)Virkkala et al. (2021)Virkkala et al. (2021)Table 8Mean high-latitude NEE, total (Tg C yr−1) and per area () simulated in ORCHIDEE and estimated by different sources (Hugelius et al., 2024; Ramage et al., 2024; Virkkala et al., 2022, 2021). Numbers in parentheses denote uncertainties, given as standard deviation (ORCHIDEE, ABCflux) or 95 % confidence interval (Hugelius et al., 2024; Ramage et al., 2024).
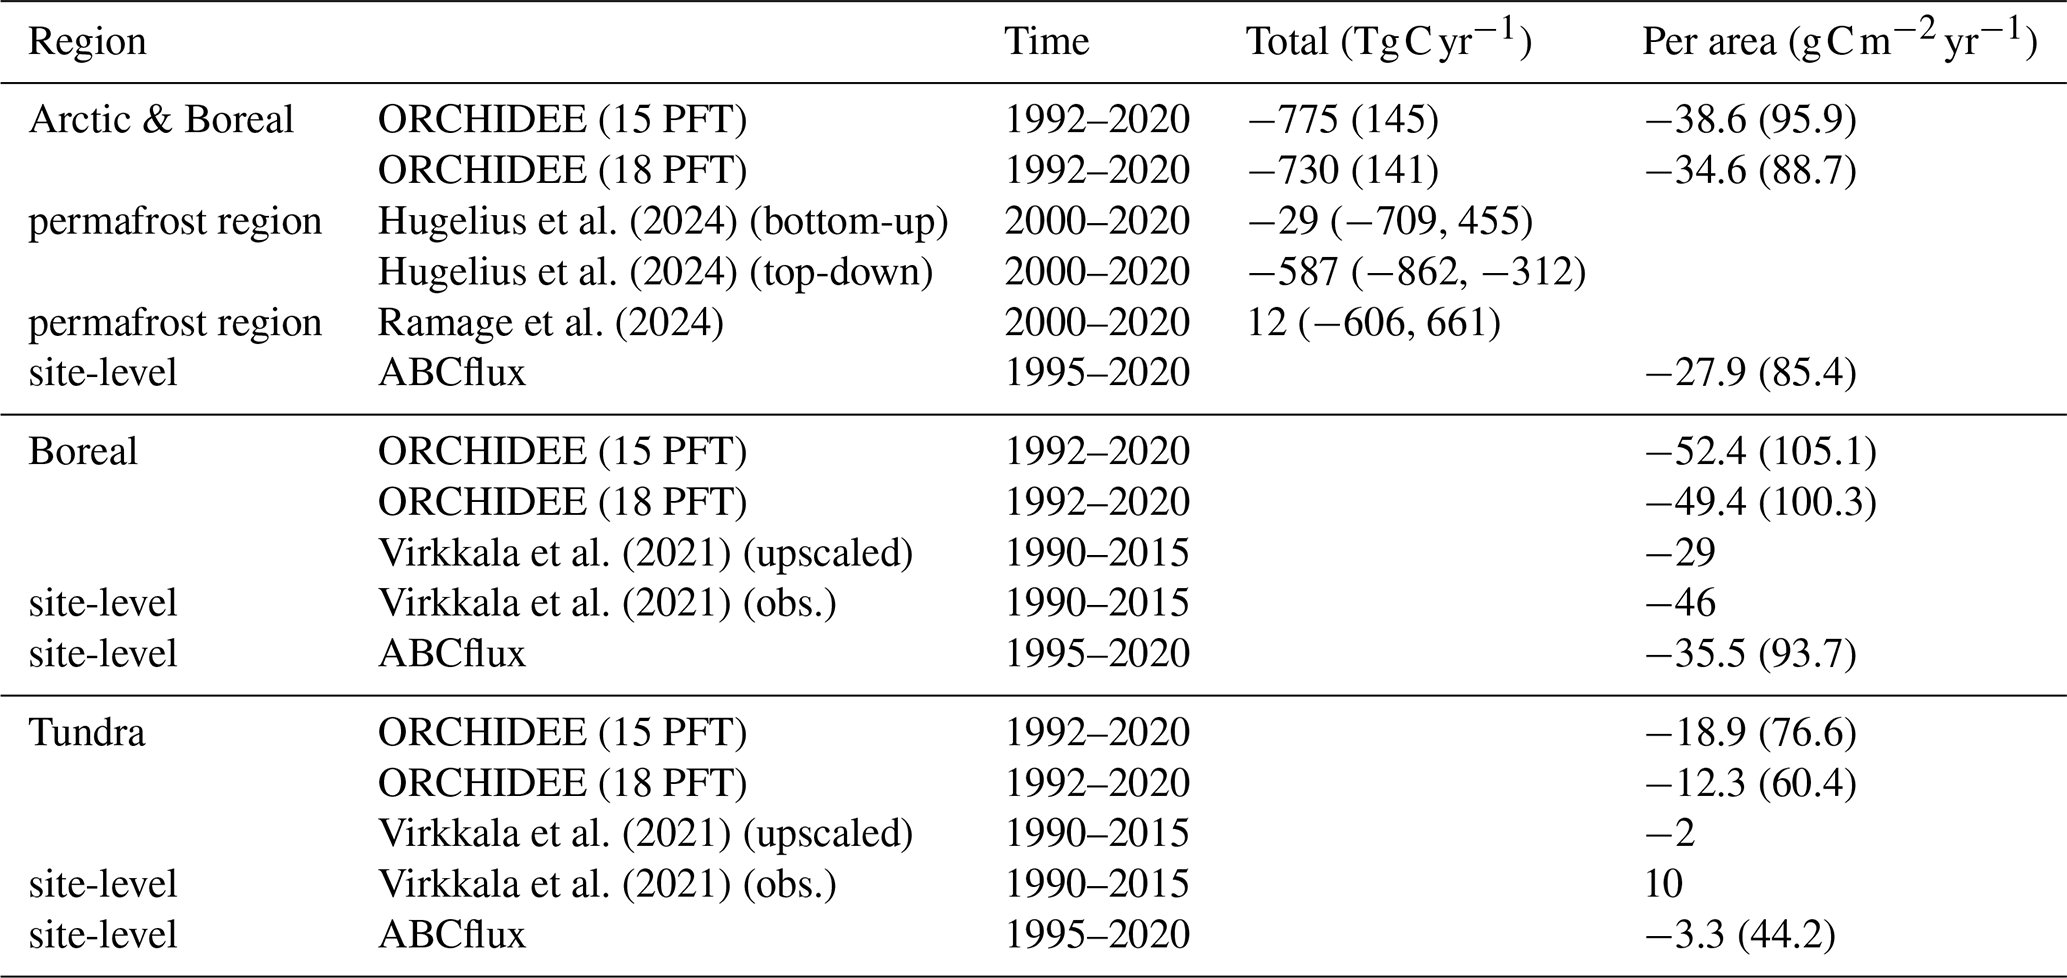
Reported Arctic–Boreal NEE estimates in the literature span a wide range (−587 (−862,-312) Tg C yr−1 in the top-down estimate of (Hugelius et al., 2024) to 12 (−606,661) Tg C yr−1 (Ramage et al., 2024)). Both ORCHIDEE setups simulate NEE at the higher end of this range (Table 8). In the boreal zone, both ORCHIDEE simulations are very similar and may overestimate NEE relative to observation-based estimates, whereas in the tundra, ORCHIDEE-18 simulates a reduced carbon uptake more consistent with observations. However, improvements in process representations governing Reco and the onset of the growing season are needed to increase confidence in simulated NEE.
This study represents the first implementation and evaluation of shrub PFTs in the trunk version of ORCHIDEE (based on v4), which forms the basis for upcoming model applications, including CMIP-7 FAST-TRACK and TRENDY (Peylin et al., 2026). Accordingly, diagnostics directly constrained by the new plant representation were prioritised, with a particular focus on shrub dynamics during the growing season. We therefore emphasise GPP and C stocks (e.g. AGB), which are mechanistically linked to the processes and parameters targeted in this study (phenology, canopy development, allometry and allocation), rather than the full suite of processes governing ecosystem respiration and net carbon balance (e.g. soil carbon turnover, litter and heterotrophic respiration), which were not explicitly addressed during this implementation stage.
Ecosystem respiration is generally reported to be more uncertain than GPP, because it is more difficult to constrain observationally and depends on flux partitioning and multiple temperature- and substrate-sensitive processes (López-Blanco et al., 2018, 2019). Consequently, NEE, defined as the balance between GPP and Reco, may appear unbiased due to compensating errors in photosynthesis and respiration. In our simulations, limitations in the seasonal dynamics of GPP – particularly an overly abrupt leaf onset for deciduous shrubs – propagate into Reco and thus into NEE, complicating process-level attribution. For this reason, we report Reco and NEE for completeness, but use GPP and biomass as the primary, more interpretable benchmarks for assessing whether the shrub PFTs improve high-latitude vegetation functioning at this stage of model development.
High-latitude vegetation has been under-represented in the global land surface model ORCHIDEE, contributing to biases in simulated carbon stocks and CO2 fluxes across the Arctic–Boreal region. Relying largely on existing model functionality and synthesised pan-Arctic observations, we introduced three high-latitude shrub PFTs (tall deciduous, low deciduous, and evergreen dwarf shrubs) into ORCHIDEE LSM (r9269) and updated prescribed vegetation distributions to include shrubs.
Our shrub PFT classification combines two key dimensions (phenology and stature) to capture divergent shrub ecosystem functions while keeping the framework tractable for global and coupled simulations. Shrub traits are constrained using synthesised pan-Arctic observations to favour regionally representative parameter values rather than site-specific tuning. We prescribed shrub cover distributions using updated PFT maps that combine ESA CCI–based products with Arctic shrub information and sub-regional partitioning approaches.
Our implementation produces shrub PFTs with realistic size, biomass, and C allocation characteristics and improves simulated carbon stocks and gross primary productivity across the Arctic–Boreal region compared to regional benchmark datasets, with the strongest gains in tundra areas, where shrubs are more dominant and replace previously prescribed forest. This represents an important improvement of ORCHIDEE's representation of high-latitude vegetation and carbon cycling.
Important priorities for future work include improving seasonal dynamics of photosynthesis and respiration (and hence net ecosystem exchange), reducing uncertainties in shrub-cover mapping and shrub-type partitioning, and representing shrub-climate interactions involving snow, soil thermal regimes, and permafrost. Building on the baseline established here, implementing dynamic shrub expansion and trait variability will be essential for projecting future Arctic–Boreal ecosystem–climate feedbacks. More broadly, our results highlight the value of combining regionally synthesised observations with land surface model development to improve high-latitude vegetation representation in Earth system models.
A1 ORCHIDEE model description
ORCHIDEE (Organising Carbon and Hydrology In Dynamic Ecosystems) is the land surface component of the French ESM IPSL-CM (Boucher et al., 2020) developed by the Institute Pierre Simon Laplace (IPSL). ORCHIDEE can be run in a coupled set-up interacting with the IPSL atmospheric, ocean and ice sheet models, or as a stand-alone model, offline, as done in this work. Inputs required for the simulations include atmospheric forcing (air temperature, humidity, wind speed, surface pressure, and radiation), land surface characteristics (PFT distribution and dominant soil type), and initial conditions for energy, water, carbon, and nitrogen pools. These inputs are sourced from global datasets such as atmospheric reanalysis products, land cover maps, and soil texture databases. ORCHIDEE simulates carbon, nitrogen, energy and water cycling within the terrestrial biosphere, and the exchanges along the soil–vegetation–atmosphere interface (Krinner et al., 2005; Vuichard et al., 2019). Different biomes are represented by fifteen generic PFTs, including forests, crops and grasslands. They are differentiated based on climate zone (tropical/temperate/boreal), leaf habit (evergreen/deciduous), leaf type (broadleaf/needleleaf) and photosynthetic pathway for grasses and crops (C3/C4) (Box, 1996) (see Table A1). Woody vegetation is represented using a dynamic, vertically discretised canopy scheme that enables explicit simulation of tree-scale demographic and growth processes, including light penetration allowing photosynthesis to be calculated at each canopy level, sapling establishment and density-dependent self-thinning (Naudts et al., 2015). Three diameter classes within each woody PFT allow simulation of different plant sizes within a stand. Mortality due to fire, wind, bark beetles and forest management are implemented in ORCHIDEE, but deactivated in this work (Chen et al., 2018; Marie et al., 2024; Yue et al., 2014, 2018). The terrestrial carbon cycle, including processes of photosynthesis, respiration, soil carbon dynamics and plant carbon allocation and phenology, is simulated in the STOMATE module. Carbon assimilation and stomatal conductance are described following the concepts of Farquhar et al. (1980) and Ball et al. (1987), as implemented through the analytical solution proposed by Yin and Struik (2009). Photosynthetic processes are resolved at a half-hourly temporal resolution, whereas the allocation of carbon and nitrogen to vegetation compartments (namely leaves, fruits, roots, above-and belowground sapwood and heartwood, labile, and carbohydrate reserve pool), litter, and soil pools is simulated on a daily time step. The allocation of carbon to leaves, roots and wood follows allometric relationships, based on the pipe model theory (Shinozaki et al., 1964). Soil mineral properties are prescribed at the grid cell scale based on the 12 class USDA soil taxonomy (Forbes et al., 1987). The hydrological and biophysical processes of water and energy exchange are described by the surface–vegetation–atmosphere transfer scheme SECHIBA (de Rosnay and Polcher, 1998; Ducoudre et al., 1993). Energy fluxes in the model are calculated uniformly at the grid cell scale, without explicit representation of sub-grid heterogeneity, with the exception of snow processes, for which a distinct energy balance is evaluated over the snow-covered fraction of each cell. In contrast, hydrological processes are simulated separately for different vegetation components within a grid cell, employing three distinct soil columns representing bare soil, tall vegetation (e.g. trees), and short vegetation (e.g. grasses). Vertical discretisation differs among model components: soil hydrology is represented using an 11-layer profile extending to a depth of 2 m, with layer thickness increasing with depth according to a geometric spacing. Thermal processes and soil carbon and nitrogen dynamics share the same grid, but extended downward by seven additional layers to a total depth of approximately 90 m.
A2 ORCHIDEE PFTs
Table A1ORCHIDEE plant functional types. PFTs 2 to 9 represent forest ecosystems. Bold: high-latitude PFTs; italics: shrub PFTs added in this study.
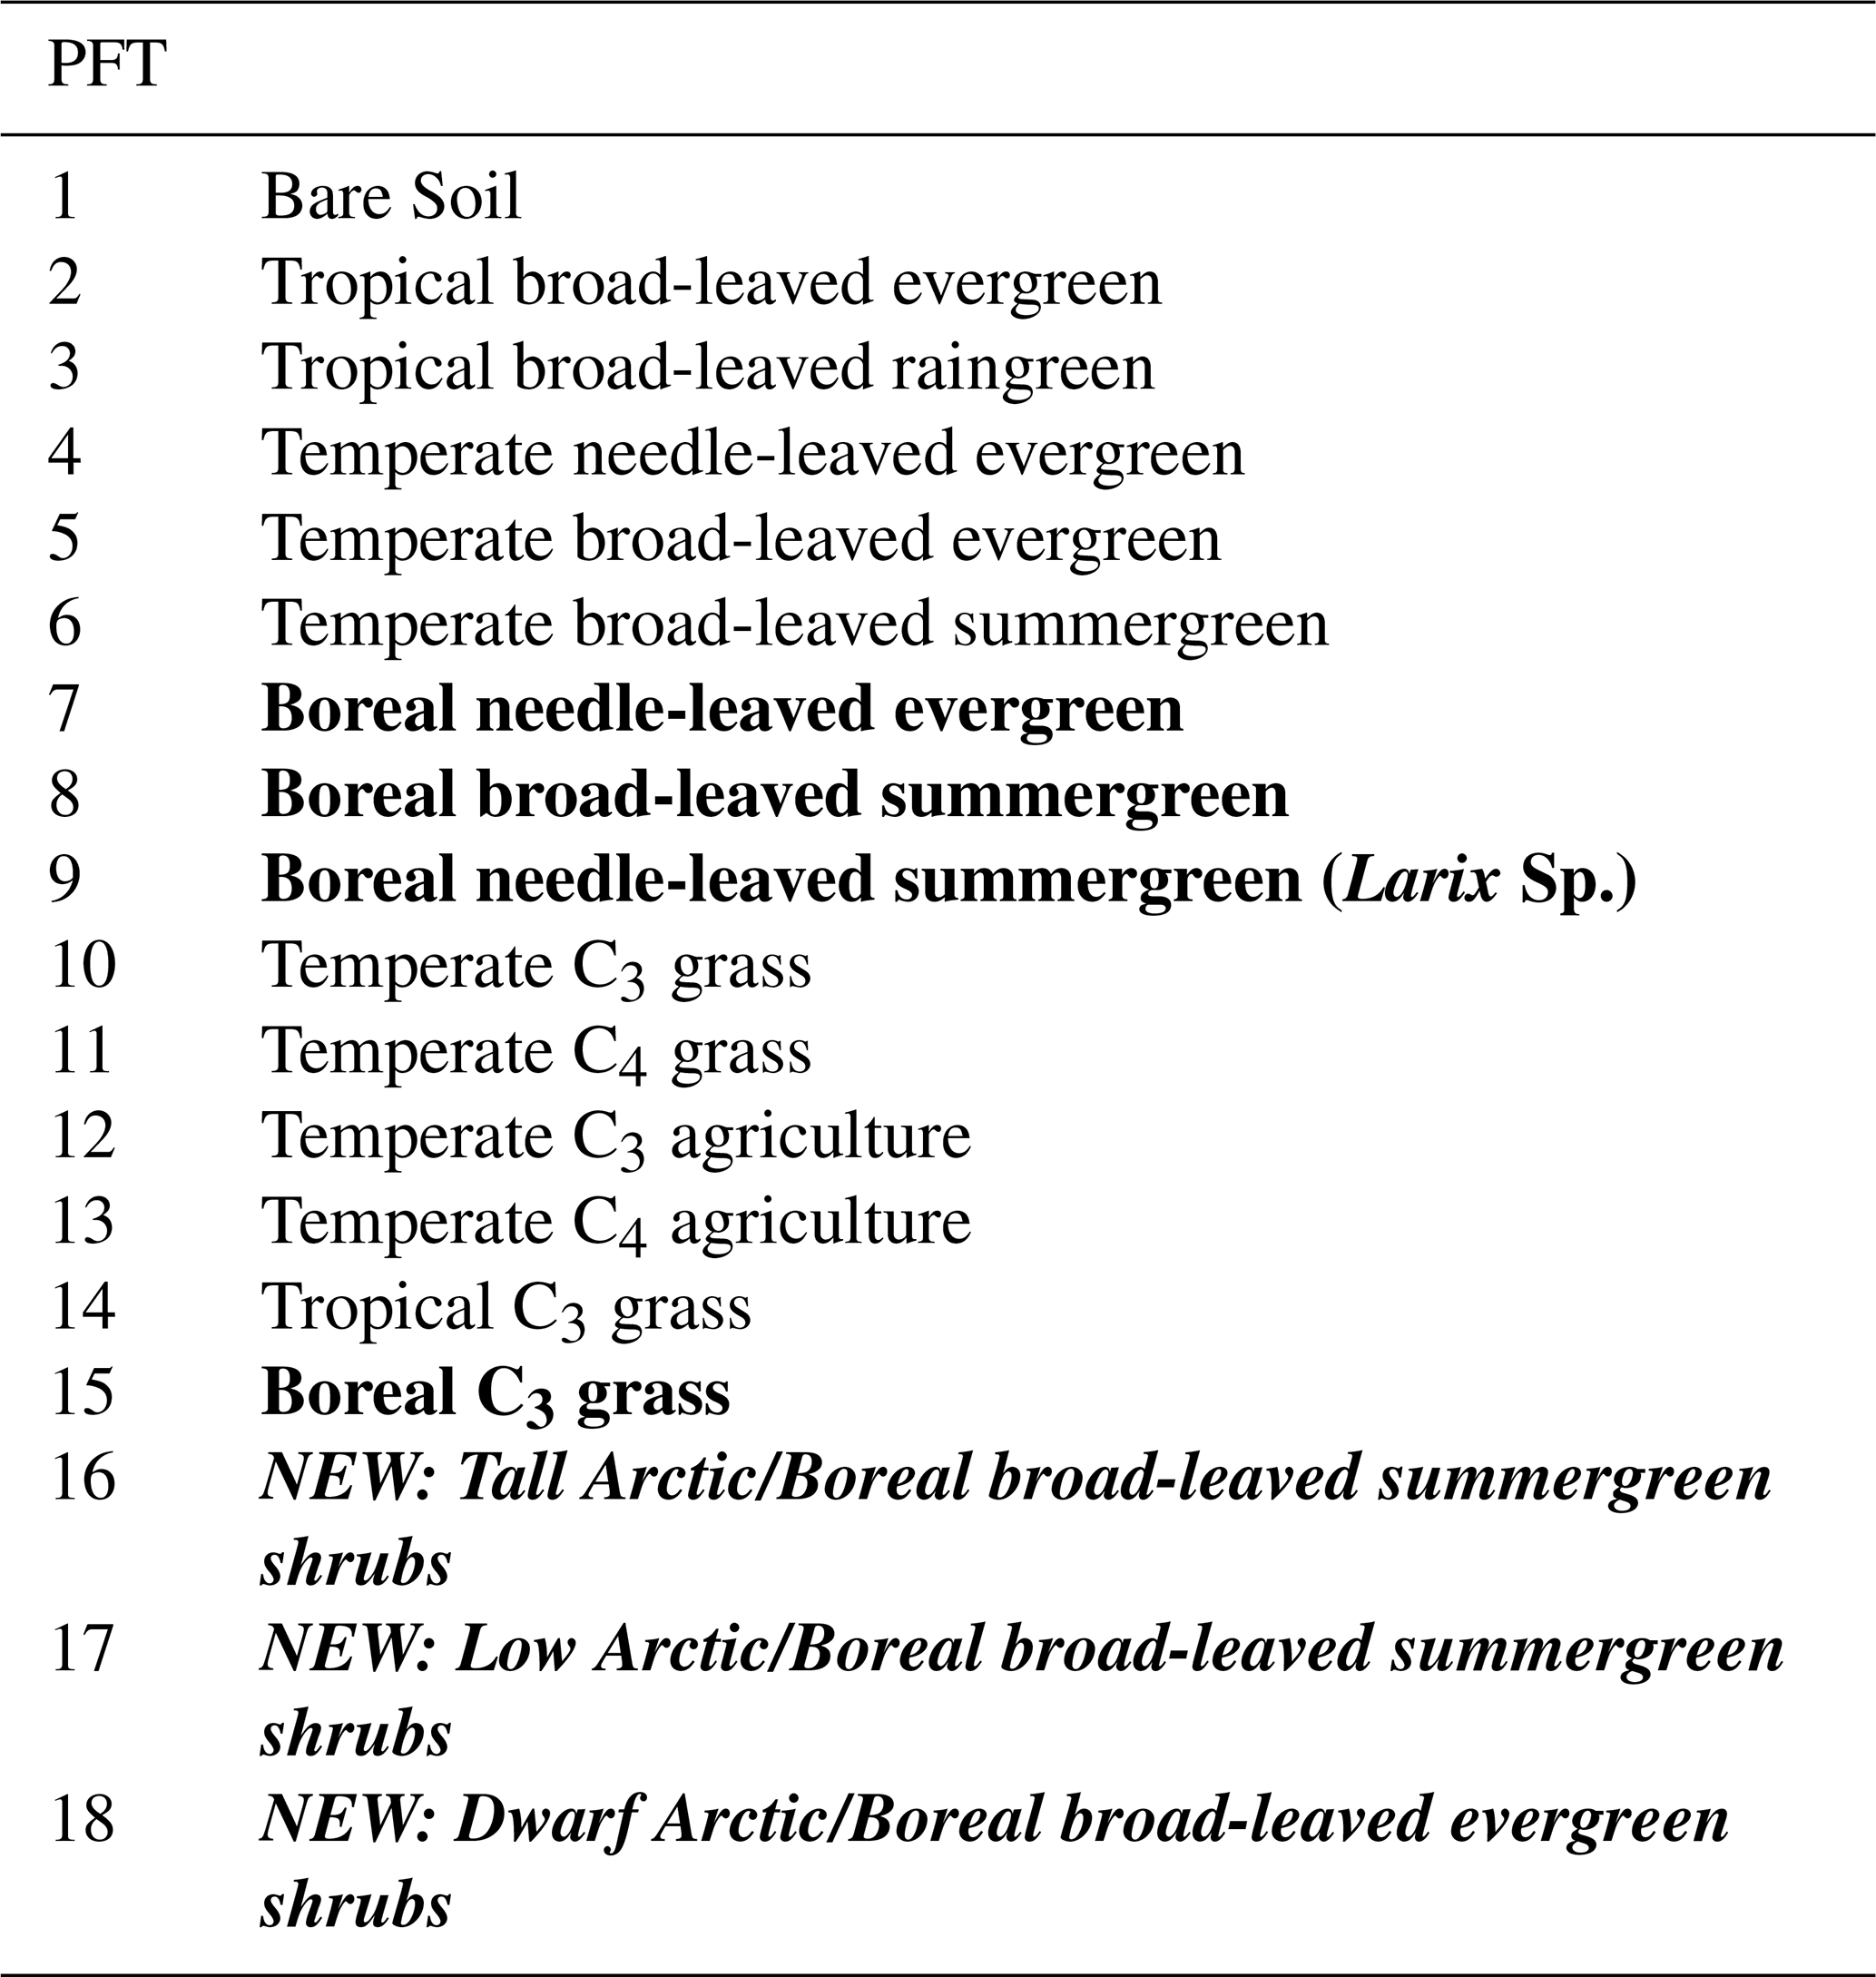
A3 Calibration data and targets
Height threshold values
Section 2.1.2 reports the final target heights for three ORCHIDEE shrub PFTs: a tall shrub PFT, including plants of 0.5 to 3 m height (typical shrub height being 1.5 m), a low shrub PFT, with a typical height of 0.5 m, and a dwarf shrub PFT covering heights below 30 cm (typical height: 20 cm). These are derived as a compromise among literature definitions, mapping products, and LPJ-GUESS. For transparency, the height thresholds in the sources considered are summarised below:
-
Myers-Smith et al. (2015b): dwarf shrubs < 20 cm; erect dwarf/low shrubs up to 50 cm; tall shrubs up to 3 m.
-
Elmendorf et al. (2012) (maximum potential height): dwarf shrubs < 15 cm; low shrubs 15–50 cm; tall shrubs > 50 cm.
-
Circumpolar Arctic Vegetation Map (CAVM; Raynolds et al., 2019): prostrate/hemiprostrate dwarf shrubs < 15 cm; erect dwarf shrubs < 40 cm; low shrubs 40–200 cm.
-
Alaska shrub mapping (Macander et al., 2017): dwarf shrubs up to 20 cm; low deciduous shrubs up to 1.5 m; tall deciduous shrubs > 1.5 m.
-
Toolik Lake vegetation map (Walker and Maier, 2008): low shrubs 40–100 cm; tall shrubs > 2 m.
-
LPJ-GUESS LSM (Wolf et al., 2008): dwarf shrubs up to 20 cm; low shrubs 20–50 cm; tall shrubs 50 cm–2 m.
Field survey used as an independent diameter check (Kobbefjord, Greenland)
Section 2.1.2 mentions a small survey of tall willow shrubs (Salix glauca) in Kobbefjord, Greenland, used to confirm that the diameter targets derived from Berner et al. (2015) are realistic. The measurements are provided in Table A2).
Table A2Results of a small survey of tall willow shrubs in Kobbefjord, Greenland. Height, basal diameter (BD), main stem diameter at different heights (D1.0, D1.0), crown area (CA) and number of branches were measured/counted.

Table A3Filter procedure applied to the vegetation-description fields in the Arctic Plant Aboveground Biomass Synthesis Dataset (Berner et al., 2024) to obtain PFT-specific shrub subsets. Counts refer to the shrub-dominated subset (≥ 80 % shrub AGB) before site-level aggregation. Biomass values shown are the site-level median across plots, summarised across sites (median and interquartile range) after conversion to g C m−2 (50 % C content).
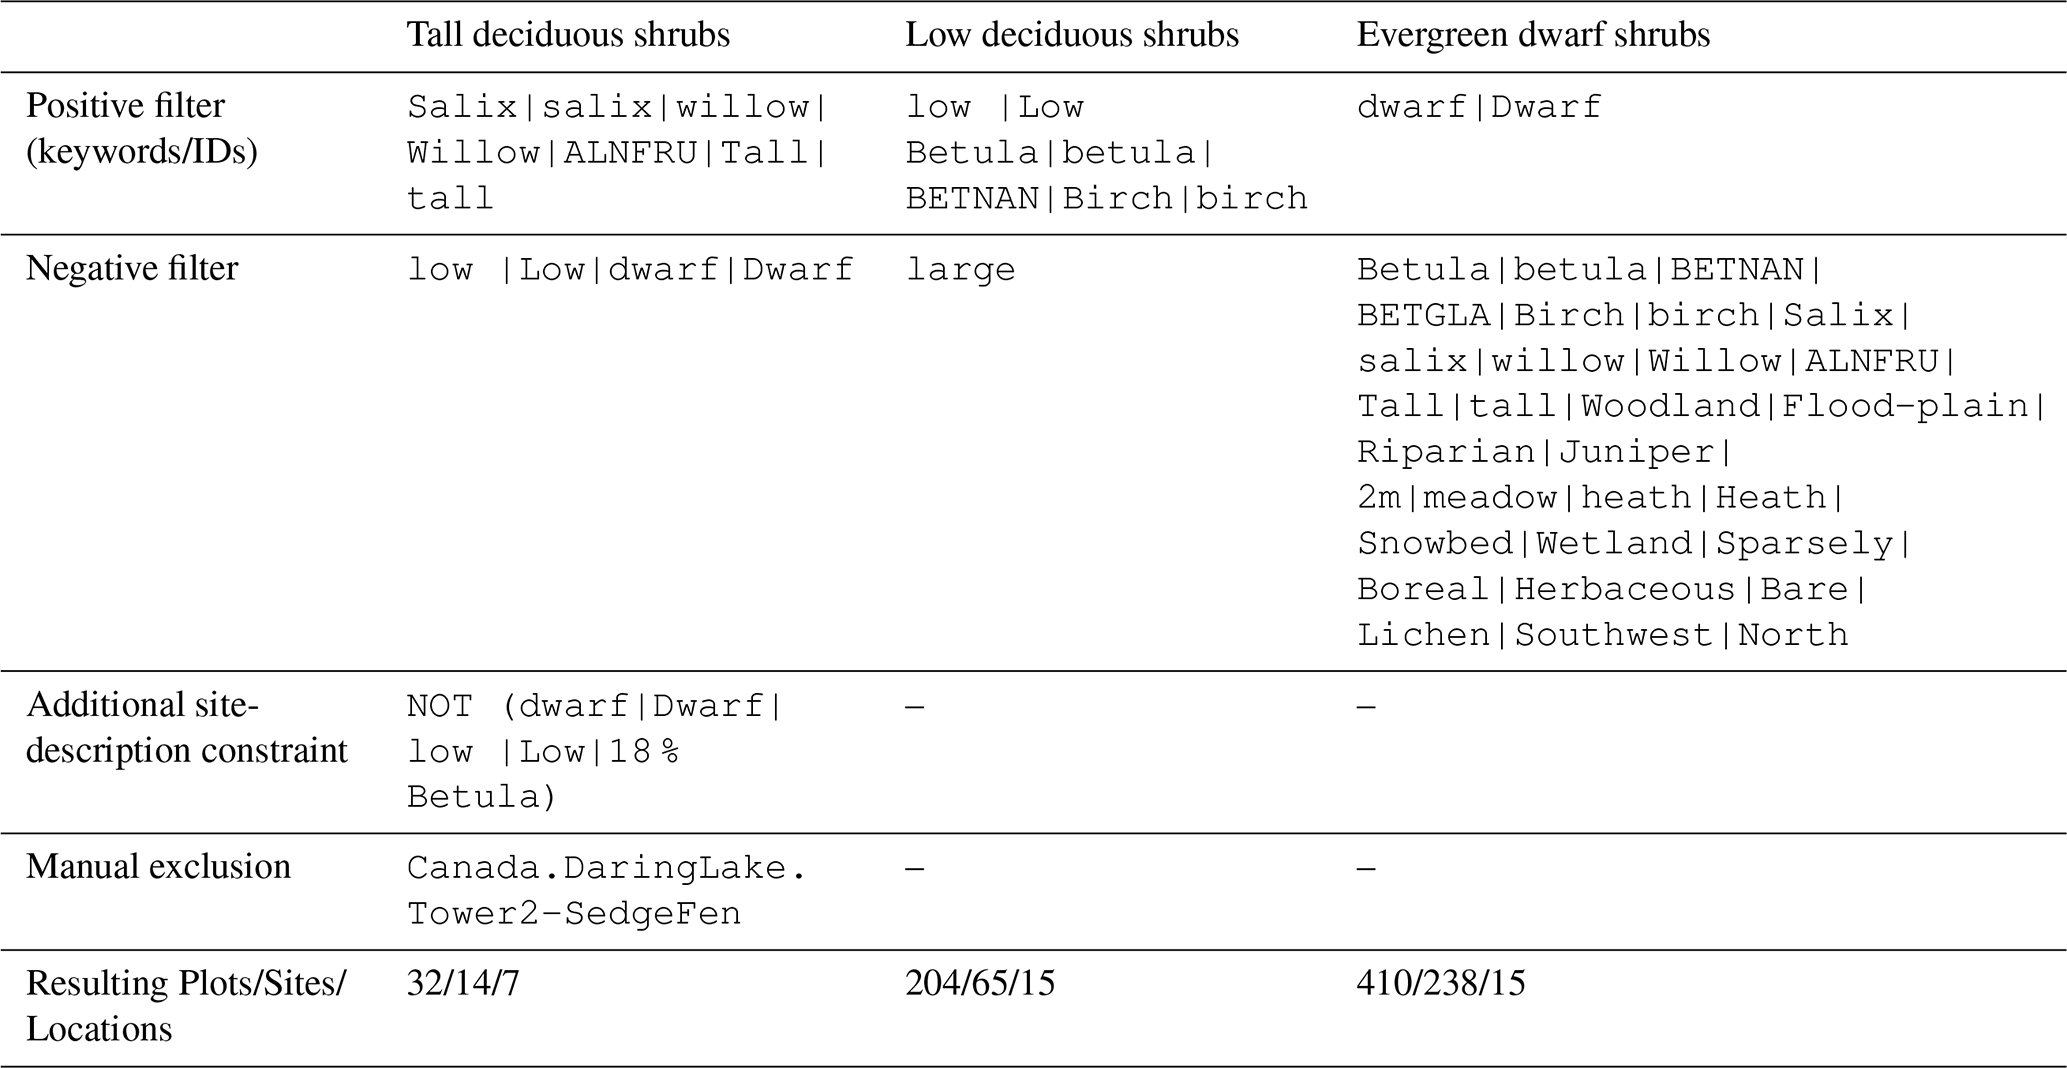
Aboveground biomass (Berner et al., 2024): exact filtering logic for shrub-PFT subsets
Section 2.1.2 describes the overall selection of shrub-dominated plots from the Arctic Plant Aboveground Biomass Synthesis Dataset (Berner et al., 2024), that compiles 32 individual datasets spanning 636 field sites across the Arctic region. The observations contain measurements of aboveground biomass of five different PFTs, including shrubs, mostly collected in peak summer season in 1998 to 2022, given in grams of oven-dried aboveground live biomass per square meter of ground surface. We extracted shrub biomass from the dataset by selecting the sample plots dominated by shrubs, using a selection criterion of at least 80 % of aboveground biomass being shrub biomass, well aware that this causes a slight underestimation of biomass compared to the model assumption that 100 % of a simulation site is covered by shrubs. We only considered shrub biomass from the resulting 677 plots at 331 field sites located within 24 larger areas. Following Berner et al. (2024), to avoid biases from sites with many plots, we calculated the median to group all sample plots at each field site, before calculating statistics across all field sites. To make the biomass data comparable to ORCHIDEE output, we converted the data to g C m−2 assuming that half of the dry biomass is carbon. We used the vegetation descriptions contained in the dataset for each plot to extract specific aboveground biomass estimates for the three shrub PFTs. Table A3 provides additional implementation details on the string-based filtering of plot vegetation descriptions used to approximate shrub types. For tall deciduous shrubs we selected plots that contain the word tall or references to willow (salix) or alder (alnus) in their vegetation description, and excluded plots characterised as low or dwarf, resulting in 32 plots at 14 sites at 7 locations, with a median biomass of 583.5 (325.25–671.3125) g C m−2, which is considerably higher than the overall shrub biomass. For low deciduous shrubs we filtered the vegetation description for a mention of low, not large, and Birch (betula or betula nana), finding 204 plots at 65 sites at 15 locations and a median biomass of 220 (130–479) g C m−2. Finally, filtering for evergreen dwarf shrubs returned data from 410 plots at 238 sites at 15 locations, by filtering for the word dwarf and excluding plots with mentions of birch (betula), willow (salix), alder (alnus), tall, and other selected criteria, resulting in a median biomass of 131 (74–218) g C m−2.
A4 Parameter optimisation
Optimisation was performed on site-level simulations at the Toolik Lake grid cell. The simulations were restarted from the end of a 340-years long spin-up simulation with prior best-guess parameter values, and then run with CRU JRA meteorological forcing from 2001–2010 for 110 years. The first 100 years served as additional spinup to allow the model to adjust to changed parameter values, and the final 10 years to calculate the cost function to minimise. If the cost function did not converge after 30 × 30 iterations, further iterations were added.
Table A4Optimisation target ranges for the three shrub PFTs and the output variables: Height [m], peak summer aboveground biomass [g C m−2], minimum belowground biomass fraction, mean gross primary productivity [], peak growing season leaf area index, and age [years].

Optimised parameters included: pipe_tune2, alpha_self_thinning, recruitment_beta, recruitment_alpha, alloc_max, recruitment_height, k_latosa_min, k_latosa_frac, slainit. Different parameter combinations were optimised for the different shrub PFTs.
The following model output variables were optimised against observation-based targets: height, peak summer AGB, minimum fraction of belowground biomass, mean GPP, peak summer leaf area index, age. The optimisation targets are defined as ranges of variation for a set of model variables and are listed in Table A4. During the optimization the cost-function value contribution (see Eq. 4) from a given variable was assumed to be zero (i.e., considered to be acceptable) if the simulated variable time-series falls within the prescribed range. Whenever the simulated time series fell outside the prescribed range of acceptable variability, the cost function was defined as the deviation between the simulated values and the mean of the specified minimum and maximum bounds. Consequently, the contribution to the cost function increases with the magnitude of the deviation from the prescribed range.
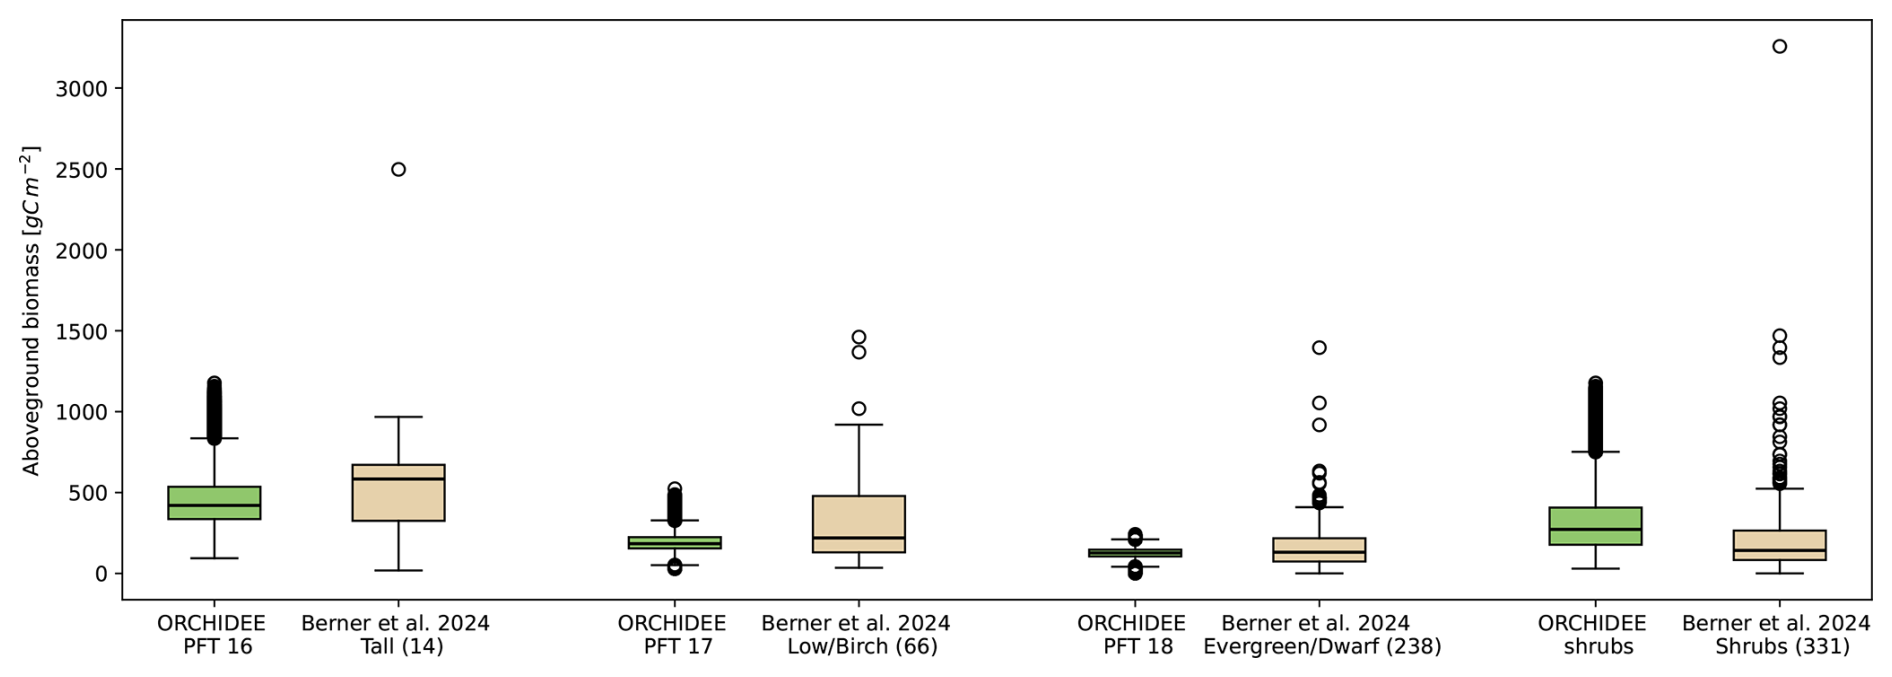
Figure B1Simulated (green, ORCHIDEE-18, 1992–2020) and observed (light brown, Berner et al., 2024) aboveground biomass for three shrub PFTs across the Arctic and Boreal region. Observed biomass from Berner et al. (2024) was filtered to match the ORCHIDEE shrub PFT classification. Numbers in parentheses indicate the number of field sites included after filtering. Boxplots show median (center line), interquartile range (boxes) and whiskers extend to the farthest data point lying within 1.5× the interquartile range. Complete visualisation including outliers of Fig. 3.
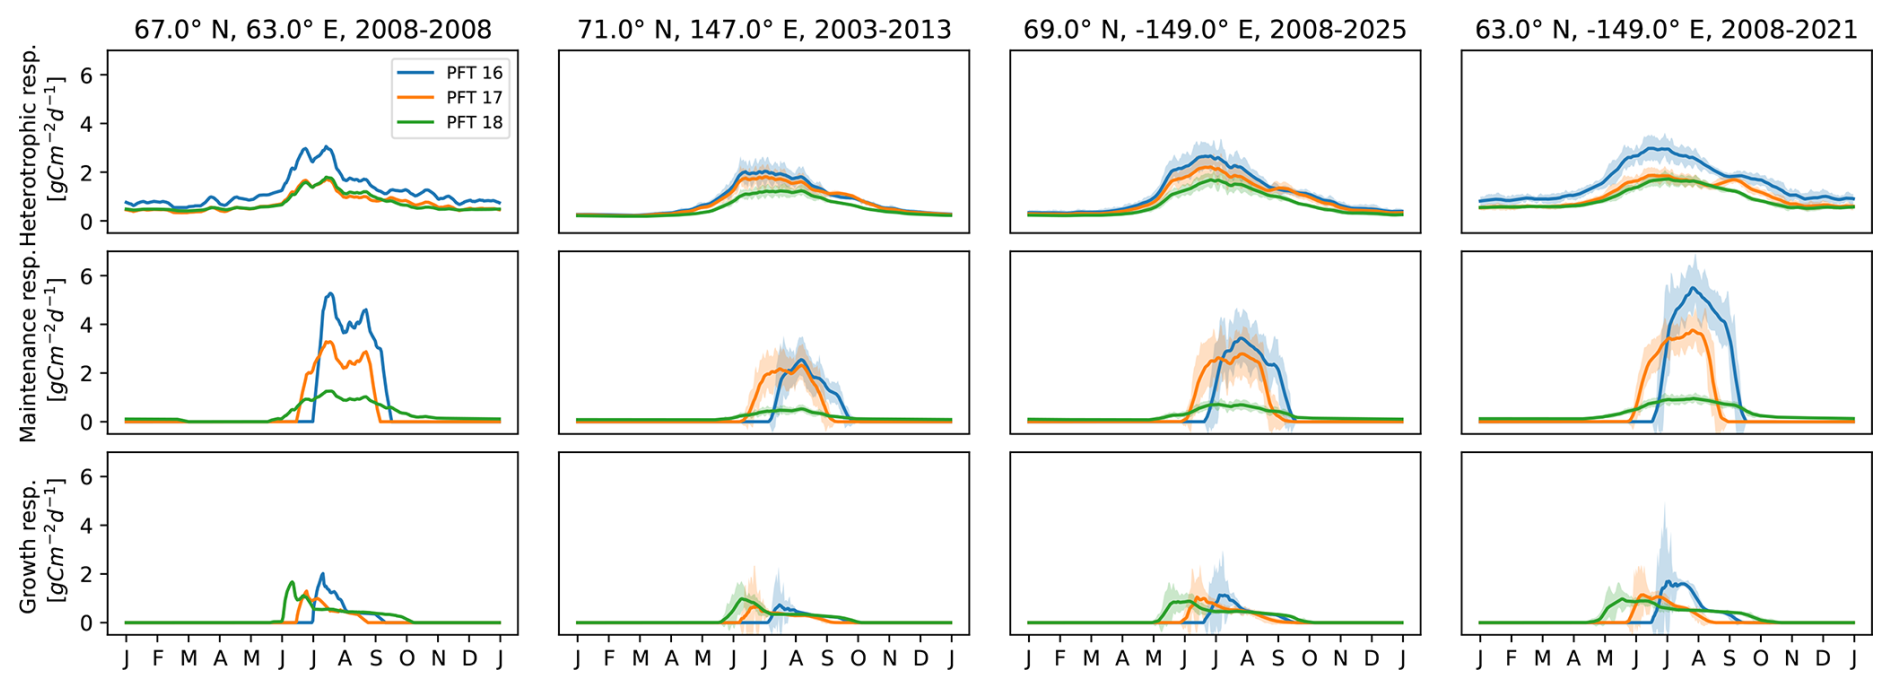
Figure B2Individual respiration fluxes of the ORCHIDEE shrub PFTs at the same grid cells as in Fig. 4 (columns). Rows represent respiration fluxes: heterotrophic respiration, maintenance respiration and growth respiration. Positive values indicate release of CO2 from the vegetation to the atmosphere. Shown is the average seasonal cycle and standard deviation (shading) in daily resolution, smoothed with a 10 d running mean.
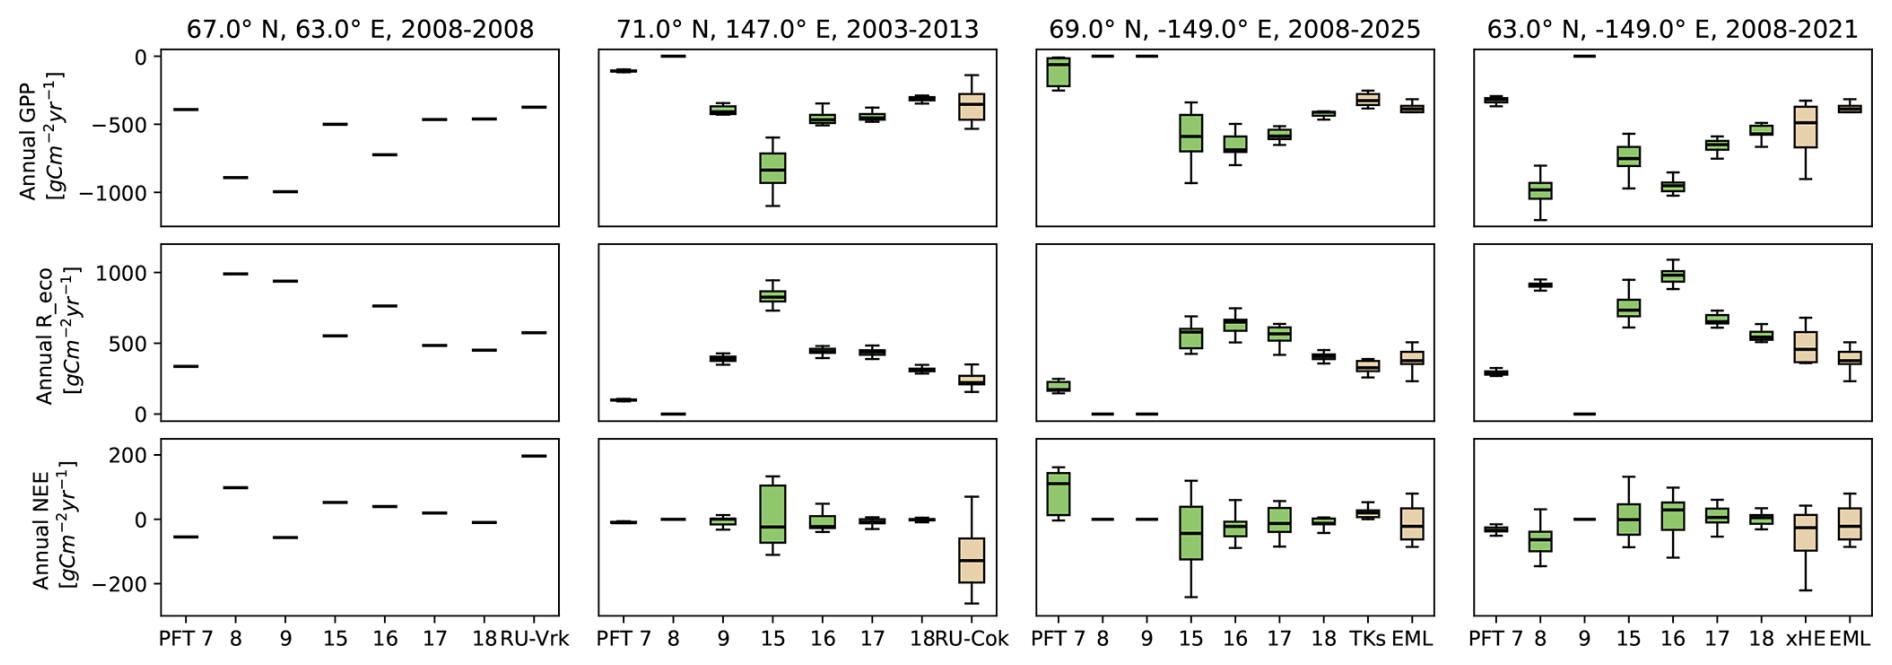
Figure B3Simulated (green) and observed (brown) annual sum of CO2 fluxes at four ORCHIDEE grid cells and six EC sites (as in Fig. 4). Rows represent CO2 fluxes: gross primary productivity (GPP), ecosystem repiration (Reco), and net ecosystem exchange (NEE). Negative values indicate uptake of CO2 from the atmosphere by the vegetation, while positive values denote release.
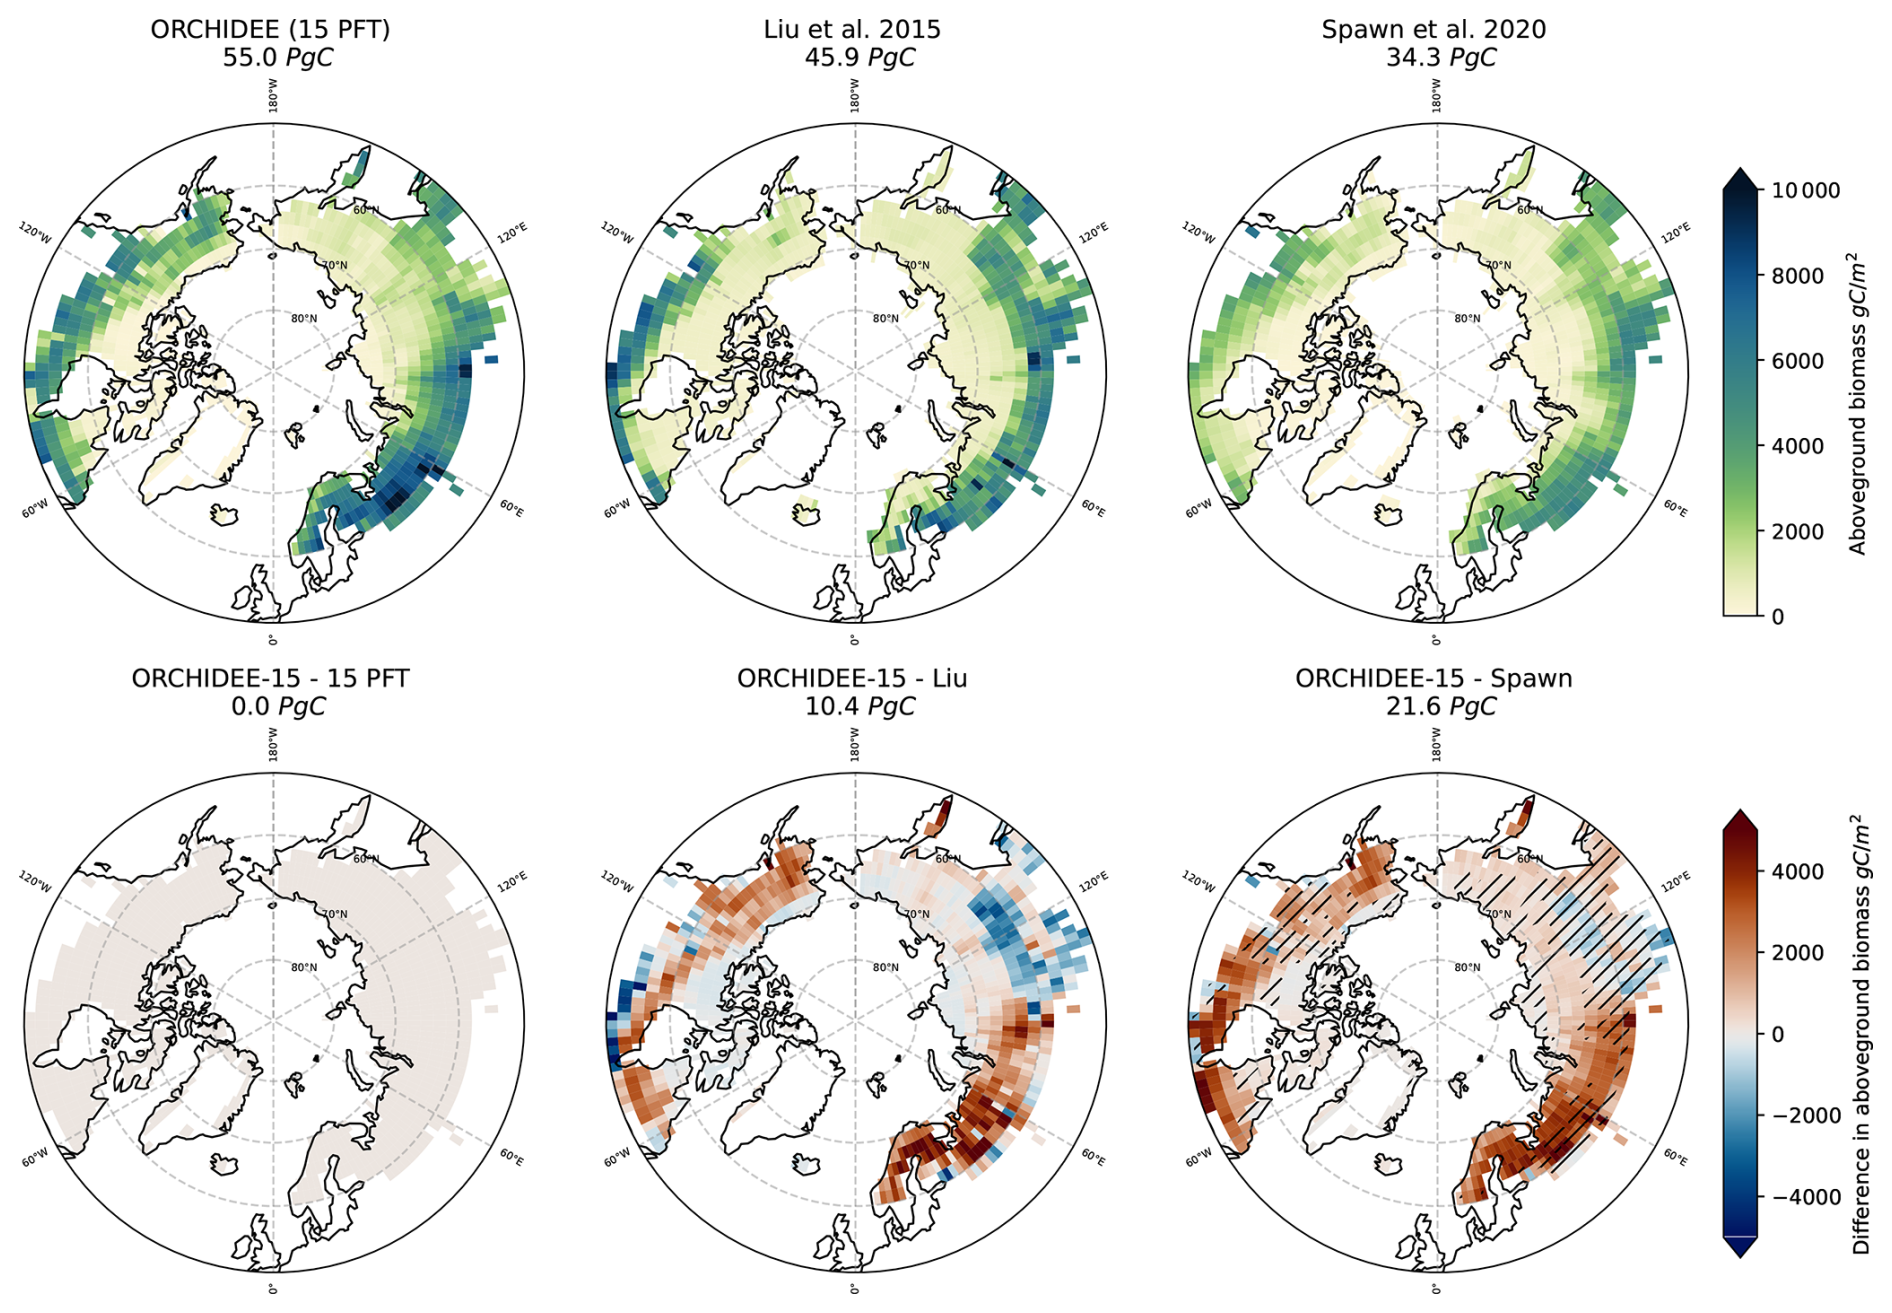
Figure B4Simulated (ORCHIDEE with 15 PFTs) and observation-based (from Spawn et al. (2020) and Liu et al., 2015) pan-Arctic AGB in 2010. Difference maps between ORCHIDEE with 15 PFTs and the observation-based products. Hatching indicates agreement with Spawn et al. (2020) standard error interval. Numbers indicate total AGB across the region (top row), and total difference (bottom row).
The analysis code used in this study is archived on Zenodo and available at https://doi.org/10.5281/zenodo.22283927 (Kirchner, 2026).
The ORCHIDEE data analysed in this study is archived on Zenodo and available at https://doi.org/10.5281/zenodo.22284046 (Kirchner et al., 2026).
AK devised the approach, conducted model experiments and data analysis, performed the final model simulations, and wrote the manuscript. ASL and ELB planned this study and were involved in every step of the execution through supervision and guidance. VB supported the parameter optimisation with ORCHIDAS and produced the updated PFT maps. SL and PP provided technical advice on ORCHIDEE functionality and contributed feedback on model implementation choices and manuscript revisions. All co-authors contributed to the final manuscript.
The contact author has declared that none of the authors has any competing interests.
Publisher's note: Copernicus Publications remains neutral with regard to jurisdictional claims made in the text, published maps, institutional affiliations, or any other geographical representation in this paper. The authors bear the ultimate responsibility for providing appropriate place names. Views expressed in the text are those of the authors and do not necessarily reflect the views of the publisher.
This work was performed using HPC resources from GENCI-TGCC on grant 2025-6328.
This research has been supported by the EU Horizon 2020 Framework Programme, H2020 Excellent Science (GreenFeedBack, grant no. 101056921; for AK, ELB and ASL), the NordForsk project Nordic Borealization Network (NordBorN, grant no. 164079; for ELB), and the EU HORIZON EUROPE Climate, Energy and Mobility (NextGenCarbon, grant no. 101184989; for SL and PP).
This paper was edited by Ying Sun and reviewed by Wu Sun and two anonymous referees.
Alton, P.: How useful are plant functional types in global simulations of the carbon, water, and energy cycles?, J. Geophys. Res.-Biogeo., 116, https://doi.org/10.1029/2010JG001430, 2011. a, b
AMAP: AMAP Arctic Climate Change Update 2021: Key Trends and Impacts, Arctic Monitoring and Assessment Programme (AMAP), Tromsø, Norway, 2021. a
Ball, J. T., Woodrow, I. E., and Berry, J. A.: A Model Predicting Stomatal Conductance and its Contribution to the Control of Photosynthesis under Different Environmental Conditions, Springer Netherlands, Dordrecht, pp. 221–224, https://doi.org/10.1007/978-94-017-0519-6_48, 1987. a
Bastrikov, V., MacBean, N., Bacour, C., Santaren, D., Kuppel, S., and Peylin, P.: Land surface model parameter optimisation using in situ flux data: comparison of gradient-based versus random search algorithms (a case study using ORCHIDEE v1.9.5.2), Geosci. Model Dev., 11, 4739–4754, https://doi.org/10.5194/gmd-11-4739-2018, 2018. a
Belke-Brea, M., Domine, F., Barrere, M., Picard, G., and Arnaud, L.: Impact of Shrubs on Winter Surface Albedo and Snow Specific Surface Area at a Low Arctic Site: In Situ Measurements and Simulations, J. Climate, 33, 597–609, https://doi.org/10.1175/JCLI-D-19-0318.1, 2020. a
Berner, L., Alexander, H., Loranty, M., Ganzlin, P., Mack, M., Davydov, S., and Goetz, S.: Biomass allometry for alder, dwarf birch, and willow in boreal forest and tundra ecosystems of far northeastern Siberia and north-central Alaska, Forest Ecol. Manag., 337, 110–118, https://doi.org/10.1016/j.foreco.2014.10.027, 2015. a, b, c
Berner, L., Massey, R., Jantz, P., Forbes, B., Macias-Fauria, M., Myers-Smith, I., Kumpula, T., Gauthier, G., Andreu-Hayles, L., Gaglioti, B., Burns, P., Zetterberg, P., D'Arrigo, R., and Goetz, S.: Summer warming explains widespread but not uniform greening in the Arctic tundra biome, Nat. Commun., 11, 4621, https://doi.org/10.1038/s41467-020-18479-5, 2020. a
Berner, L., Orndahl, K., Rose, M., Tamstorf, M., Arndal, M., Alexander, H., Humphreys, E., Loranty, M., Ludwig, S., Nyman, J., Juutinen, S., Aurela, M., Happonen, K., Mikola, J., Mack, M., Vankoughnett, M., Iversen, C., Salmon, V., Yang, D., Kumar, J., Grogan, P., Danby, R., Scott, N., Olofsson, J., Siewert, M., Deschamps, L., Lévesque, E., Maire, V., Morneault, A., Gauthier, G., Gignac, C., Boudreau, S., Gaspard, A., Kholodov, A., Bret-Harte, M., Greaves, H., Walker, D., Gregory, F., Michelsen, A., Kumpula, T., Villoslada, M., Ylänne, H., Luoto, M., Virtanen, T., Forbes, B., Hölzel, N., Epstein, H., Heim, R., Bunn, A., Holmes, R., Hung, J., Natali, S., Virkkala, A.-M., and Goetz, S.: The Arctic Plant Aboveground Biomass Synthesis Dataset, Sci. Data, 11, 305, https://doi.org/10.1038/s41597-024-03139-w, 2024. a, b, c, d, e, f, g, h, i, j, k, l, m
Bodegom, P., Douma, J., Witte, J., Ordóñez, J., Bartholomeus, R., and Aerts, R.: Going beyond limitations of plant functional types when predicting global ecosystem–atmosphere fluxes: exploring the merits of traits-based approaches, Global Ecol. Biogeogr., 21, 625–636, https://doi.org/10.1111/j.1466-8238.2011.00717.x, 2011. a
Bonfils, C., Phillips, T., Lawrence, D., Cameron-Smith, P., Riley, W., and Subin, Z.: On the influence of shrub height and expansion on northern high latitude climate, Environ. Res. Lett., 7, 015503, https://doi.org/10.1088/1748-9326/7/1/015503, 2012. a, b, c
Botta, A., Viovy, N., Ciais, P., Friedlingstein, P., and Monfray, P.: A global prognostic scheme of leaf onset using satellite data, Glob. Change Biol., 6, 709–725, https://doi.org/10.1046/j.1365-2486.2000.00362.x, 2000. a
Boucher, O., Servonnat, J., Albright, A. L., Aumont, O., Balkanski, Y., Bastrikov, V., Bekki, S., Bonnet, R., Bony, S., Bopp, L., Braconnot, P., Brockmann, P., Cadule, P., Caubel, A., Cheruy, F., Codron, F., Cozic, A., Cugnet, D., D'Andrea, F., Davini, P., de Lavergne, C., Denvil, S., Deshayes, J., Devilliers, M., Ducharne, A., Dufresne, J.-L., Dupont, E., Éthé, C., Fairhead, L., Falletti, L., Flavoni, S., Foujols, M.-A., Gardoll, S., Gastineau, G., Ghattas, J., Grandpeix, J.-Y., Guenet, B., Guez, L. E., Guilyardi, E., Guimberteau, M., Hauglustaine, D., Hourdin, F., Idelkadi, A., Joussaume, S., Kageyama, M., Khodri, M., Krinner, G., Lebas, N., Levavasseur, G., Lévy, C., Li, L., Lott, F., Lurton, T., Luyssaert, S., Madec, G., Madeleine, J.-B., Maignan, F., Marchand, M., Marti, O., Mellul, L., Meurdesoif, Y., Mignot, J., Musat, I., Ottlé, C., Peylin, P., Planton, Y., Polcher, J., Rio, C., Rochetin, N., Rousset, C., Sepulchre, P., Sima, A., Swingedouw, D., Thiéblemont, R., Traore, A. K., Vancoppenolle, M., Vial, J., Vialard, J., Viovy, N., and Vuichard, N.: Presentation and Evaluation of the IPSL-CM6A-LR Climate Model, J. Adv. Model. Earth Sy., 12, e2019MS002010, https://doi.org/10.1029/2019MS002010, 2020. a
Box, E. O.: Plant Functional Types and Climate at the Global Scale, J. Veg. Sci., 7, 309–320, https://doi.org/10.2307/3236274, 1996. a
CAVM Team: Raster Circumpolar Arctic Vegetation Map. Scale , Conservation of Arctic Flora and Fauna, Akureyri, Iceland, 2024. a
Chapin III, F., Bret-Harte, M., Hobbie, S., and Zhong, H.: Plant functional types as predictors of transient responses of arctic vegetation to global change, J. Veg. Sci., 7, 347–358, https://doi.org/10.2307/3236278, 1996. a, b
Chen, Y.-Y., Gardiner, B., Pasztor, F., Blennow, K., Ryder, J., Valade, A., Naudts, K., Otto, J., McGrath, M. J., Planque, C., and Luyssaert, S.: Simulating damage for wind storms in the land surface model ORCHIDEE-CAN (revision 4262), Geosci. Model Dev., 11, 771–791, https://doi.org/10.5194/gmd-11-771-2018, 2018. a
Chu, H., Christianson, D., Cheah, Y.-W., Pastorello, G., O'Brien, F., Geden, J., Ngo, S.-T., Hollowgrass, R., Leibowitz, K., Beekwilder, N., Sandesh, M., Dengel, S., Chan, S., Santos, A., Delwiche, K., Yi, K., Buechner, C., Baldocchi, D., Papale, D., Keenan, T., Biraud, S., Agarwal, D., and Torn, M.: AmeriFlux BASE data pipeline to support network growth and data sharing, Sci. Data, 10, 614, https://doi.org/10.1038/s41597-023-02531-2, 2023. a
Chuine, I.: A unified model for budburst of trees, J. Theor. Biol., 207, 337–347, https://doi.org/10.1006/jtbi.2000.2178, 2000. a
de Rosnay, P. and Polcher, J.: Modelling root water uptake in a complex land surface scheme coupled to a GCM, Hydrol. Earth Syst. Sci., 2, 239–255, https://doi.org/10.5194/hess-2-239-1998, 1998. a
Dinerstein, E., Olson, D., Joshi, A., Vynne, C., Burgess, N., Wikramanayake, E., Hahn, N., Palminteri, S., Hedao, P., Noss, R., Hansen, M., Locke, H., Ellis, E., Jones, B., Barber, C., Hayes, R., Kormos, C., Martin, V., Crist, E., Sechrest, W., Price, L., Baillie, J., Weeden, D., Suckling, K., Davis, C., Sizer, N., Moore, R., Thau, D., Birch, T., Potapov, P., Turubanova, S., Tyukavina, A., de Souza, N., Pintea, L., Brito, J., Llewellyn, O., Miller, A., Patzelt, A., Ghazanfar, S., Timberlake, J., Klöser, H., Shennan-Farpón, Y., Kindt, R., Lillesø, J.-P., van Breugel, P., Graudal, L., Voge, M., Al-Shammari, K., and Saleem, M.: An Ecoregion-Based Approach to Protecting Half the Terrestrial Realm, BioScience, 67, 534–545, https://doi.org/10.1093/biosci/bix014, 2017. a, b, c
Dobbert, S., Pape, R., and Löffler, J.: Contrasting growth response of evergreen and deciduous arctic-alpine shrub species to climate variability, Ecosphere, 12, e03688, https://doi.org/10.1002/ecs2.3688, 2021. a
Domine, F., Barrere, M., and Morin, S.: The growth of shrubs on high Arctic tundra at Bylot Island: impact on snow physical properties and permafrost thermal regime, Biogeosciences, 13, 6471–6486, https://doi.org/10.5194/bg-13-6471-2016, 2016. a
Druel, A., Peylin, P., Krinner, G., Ciais, P., Viovy, N., Peregon, A., Bastrikov, V., Kosykh, N., and Mironycheva-Tokareva, N.: Towards a more detailed representation of high-latitude vegetation in the global land surface model ORCHIDEE (ORC-HL-VEGv1.0), Geosci. Model Dev., 10, 4693–4722, https://doi.org/10.5194/gmd-10-4693-2017, 2017. a, b
Ducoudre, N., Laval, K., and Perrier, A.: SECHIBA, a new set of parameterizations of the hydrologic exchanges at the land-atmosphere interface within the LMD atmospheric general circulation model, J. Climate, 6, 248–273, https://doi.org/10.1175/1520-0442(1993)006<0248:SANSOP>2.0.CO;2, 1993. a
Eldridge, D., Bowker, M., Maestre, F., Roger, E., Reynolds, J., and Whitford, W.: Impacts of shrub encroachment on ecosystem structure and functioning: towards a global synthesis, Ecol. Lett., 14, 709–722, https://doi.org/10.1111/j.1461-0248.2011.01630.x, 2011. a
Elmendorf, S., Henry, G., Hollister, R., Björk, R., Bjorkman, A., Callaghan, T., Collier, L., Cooper, E., Cornelissen, J., Day, T., Fosaa, A., Gould, W., Grétarsdóttir, J., Harte, J., Hermanutz, L., Hik, D., Hofgaard, A., Jarrad, F., Jónsdóttir, I., Keuper, F., Klanderud, K., Klein, J., Koh, S., Kudo, G., Lang, S., Loewen, V., May, J., Mercado, J., Michelsen, A., Molau, U., Myers-Smith, I., Oberbauer, S., Pieper, S., Post, E., Rixen, C., Robinson, C., Schmidt, N., Shaver, G., Stenström, A., Tolvanen, A., Totland, Ø., Troxler, T., Wahren, C.-H., Webber, P., Welker, J., and Wookey, P.: Global assessment of experimental climate warming on tundra vegetation: heterogeneity over space and time, Ecol. Lett., 15, 164–175, https://doi.org/10.1111/j.1461-0248.2011.01716.x, 2012. a, b, c
Farquhar, G. D., von Caemmerer, S., and Berry, J. A.: A biochemical model of photosynthetic CO2 assimilation in leaves of C3 species, Planta, 149, 78–90, https://doi.org/10.1007/BF00386231, 1980. a
Forbes, T., Rossiter, D., and Van Wambeke, A.: Guidelines for evaluating the adequacy of soil resource inventories, vol. 4, Cornell University, Department of Agronomy, 1987. a
Frost, G. V. and Epstein, H. E.: Tall shrub and tree expansion in Siberian tundra ecotones since the 1960s, Glob. Change Biol., 20, 1264–1277, https://doi.org/10.1111/gcb.12406, 2014. a
Goldberg, D.: Genetic Algorithms in Search, Optimization, and Machine Learning, Addison-Wesley, New York, ISBN 978-0-201-15767-3, 1989. a
Götmark, F., Götmark, E., and Jensen, A. M.: Why Be a Shrub? A Basic Model and Hypotheses for the Adaptive Values of a Common Growth Form, Front. Plant Sci., 7, 1095, https://doi.org/10.3389/fpls.2016.01095, 2016. a
Gould, W., Raynolds, M., and Walker, D.: Vegetation, plant biomass, and net primary productivity patterns in the Canadian Arctic, J. Geophys. Res.-Atmos., 108, https://doi.org/10.1029/2001jd000948, 2003. a
Hänninen, H. and Kramer, K.: A framework for modelling the annual cycle of trees in boreal and temperate regions, Silva Fenn., 41, 167–205, https://doi.org/10.14214/sf.313, 2007. a
Harper, A. B., Cox, P. M., Friedlingstein, P., Wiltshire, A. J., Jones, C. D., Sitch, S., Mercado, L. M., Groenendijk, M., Robertson, E., Kattge, J., Bönisch, G., Atkin, O. K., Bahn, M., Cornelissen, J., Niinemets, Ü., Onipchenko, V., Peñuelas, J., Poorter, L., Reich, P. B., Soudzilovskaia, N. A., and Bodegom, P. V.: Improved representation of plant functional types and physiology in the Joint UK Land Environment Simulator (JULES v4.2) using plant trait information, Geosci. Model Dev., 9, 2415–2440, https://doi.org/10.5194/gmd-9-2415-2016, 2016. a
Harper, A. B., Wiltshire, A. J., Cox, P. M., Friedlingstein, P., Jones, C. D., Mercado, L. M., Sitch, S., Williams, K., and Duran-Rojas, C.: Vegetation distribution and terrestrial carbon cycle in a carbon cycle configuration of JULES4.6 with new plant functional types, Geosci. Model Dev., 11, 2857–2873, https://doi.org/10.5194/gmd-11-2857-2018, 2018. a, b
Harper, K. L., Lamarche, C., Hartley, A., Peylin, P., Ottlé, C., Bastrikov, V., San Martín, R., Bohnenstengel, S. I., Kirches, G., Boettcher, M., Shevchuk, R., Brockmann, C., and Defourny, P.: A 29-year time series of annual 300 m resolution plant-functional-type maps for climate models, Earth Syst. Sci. Data, 15, 1465–1499, https://doi.org/10.5194/essd-15-1465-2023, 2023. a, b, c, d, e, f, g, h, i, j, k, l, m
Haverd, V., Smith, B., Nieradzik, L., Briggs, P. R., Woodgate, W., Trudinger, C. M., Canadell, J. G., and Cuntz, M.: A new version of the CABLE land surface model (Subversion revision r4601) incorporating land use and land cover change, woody vegetation demography, and a novel optimisation-based approach to plant coordination of photosynthesis, Geosci. Model Dev., 11, 2995–3026, https://doi.org/10.5194/gmd-11-2995-2018, 2018. a
Heijmans, M., Magnússon, R., Lara, M., Frost, G., Myers-Smith, I., van Huissteden, J., Jorgenson, M., Fedorov, A., Epstein, H., Lawrence, D., and Limpens, J.: Tundra vegetation change and impacts on permafrost, Nat. Rev. Earth Environ., 3, 68–84, https://doi.org/10.1038/s43017-021-00233-0, 2022. a, b
Hugelius, G., Ramage, J., Burke, E., Chatterjee, A., Smallman, T., Aalto, T., Bastos, A., Biasi, C., Canadell, J., Chandra, N., Chevallier, F., Ciais, P., Chang, J., Feng, L., Jones, M., Kleinen, T., Kuhn, M., Lauerwald, R., Liu, J., López-Blanco, E., Luijkx, I., Marushchak, M., Natali, S., Niwa, Y., Olefeldt, D., Palmer, P., Patra, P., Peters, W., Potter, S., Poulter, B., Rogers, B., Riley, W., Saunois, M., Schuur, E., Thompson, R., Treat, C., Tsuruta, A., Turetsky, M., Virkkala, A.-M., Voigt, C., Watts, J., Zhu, Q., and Zheng, B.: Permafrost Region Greenhouse Gas Budgets Suggest a Weak CO2 Sink and CH4 and N2O Sources, But Magnitudes Differ Between Top-Down and Bottom-Up Methods, Global Biogeochem. Cy., 38, e2023GB007969, https://doi.org/10.1029/2023GB007969, 2024. a, b, c, d, e, f, g, h, i, j, k
Hurtt, G., Chini, L., Frolking, S., Betts, R., Feddema, J., Fischer, G., Fisk, J., Hibbard, K., Houghton, R., Janetos, A., Jones, C., Kindermann, G., Kinoshita, T., Klein Goldewijk, K., Riahi, K., Shevliakova, E., Smith, S., Stehfest, E., Thomson, A., Thornton, P., van Vuuren, D., and Wang, Y.: Harmonization of land-use scenarios for the period 1500–2100: 600 years of global gridded annual land-use transitions, wood harvest, and resulting secondary lands, Climatic Change, 109, 117, https://doi.org/10.1007/s10584-011-0153-2, 2011. a
Iturrate-Garcia, M., Heijmans, M. M. P. D., Cornelissen, J. H. C., Schweingruber, F. H., Niklaus, P. A., and Schaepman-Strub, G.: Plant trait response of tundra shrubs to permafrost thaw and nutrient addition, Biogeosciences, 17, 4981–4998, https://doi.org/10.5194/bg-17-4981-2020, 2020. a, b
Iversen, C., Sloan, V., Sullivan, P., Euskirchen, E., McGuire, A., Norby, R., Walker, A., Warren, J., and Wullschleger, S.: The unseen iceberg: plant roots in arctic tundra, New Phytol., 205, 34–58, https://doi.org/10.1111/nph.13003, 2015. a, b, c
Jung, M., Koirala, S., Weber, U., Ichii, K., Gans, F., Camps-Valls, G., Papale, D., Schwalm, C., Tramontana, G., and Reichstein, M.: The FLUXCOM ensemble of global land-atmosphere energy fluxes, Sci. Data, 6, 74, https://doi.org/10.1038/s41597-019-0076-8, 2019. a, b, c, d, e, f
Kattge, J., Knorr, W., Raddatz, T., and Wirth, C.: Quantifying photosynthetic capacity and its relationship to leaf nitrogen content for global-scale terrestrial biosphere models, Glob. Change Biol., 15, 976–991, 2009. a, b
Kirchner, A.: Anna-Ida/Introducing-shrubs-in-the-ORCHIDEE-LSM: Analysis code version 1.0.0 accompanying Kirchner et al. (2026) (Version v1.0.0), Zenodo [computer software], https://doi.org/10.5281/zenodo.22283927, 2026. a
Kirchner, A., Lansø, A. S., Bastrikov, V., López-Blanco, E., Luyssaert, S., and Peylin, P.: ORCHIDEE model outputs before and after adding three high-latitude shrub PFTs, Zenodo [data set], https://doi.org/10.5281/zenodo.22284047, 2026. a
Krinner, G., Viovy, N., de Noblet-Ducoudré, N., Ogée, J., Polcher, J., Friedlingstein, P., Ciais, P., Sitch, S., and Prentice, I. C.: A dynamic global vegetation model for studies of the coupled atmosphere-biosphere system, Global Biogeochem. Cy., 19, https://doi.org/10.1029/2003GB002199, 2005. a, b, c
Kuppel, S., Peylin, P., Maignan, F., Chevallier, F., Kiely, G., Montagnani, L., and Cescatti, A.: Model–data fusion across ecosystems: from multisite optimizations to global simulations, Geosci. Model Dev., 7, 2581–2597, https://doi.org/10.5194/gmd-7-2581-2014, 2014. a
Lardy, R., Bellocchi, G., and Soussana, J.-F. J.-F.: A new method to determine soil organic carbon equilibrium, Environ. Model. Softw., 26, 1759 – 1763, https://doi.org/10.1016/j.envsoft.2011.05.016, 2011. a
Lawrence, D. M., Fisher, R. A., Koven, C. D., Oleson, K. W., Swenson, S. C., Bonan, G., Collier, N., Ghimire, B., van Kampenhout, L., Kennedy, D., Kluzek, E., Lawrence, P. J., Li, F., Li, H., Lombardozzi, D., Riley, W. J., Sacks, W. J., Shi, M., Vertenstein, M., Wieder, W. R., Xu, C., Ali, A. A., Badger, A. M., Bisht, G., van den Broeke, M., Brunke, M. A., Burns, S. P., Buzan, J., Clark, M., Craig, A., Dahlin, K., Drewniak, B., Fisher, J. B., Flanner, M., Fox, A. M., Gentine, P., Hoffman, F., Keppel-Aleks, G., Knox, R., Kumar, S., Lenaerts, J., Leung, L. R., Lipscomb, W. H., Lu, Y., Pandey, A., Pelletier, J. D., Perket, J., Randerson, J. T., Ricciuto, D. M., Sanderson, B. M., Slater, A., Subin, Z. M., Tang, J., Thomas, R. Q., Val Martin, M., and Zeng, X.: The Community Land Model Version 5: Description of New Features, Benchmarking, and Impact of Forcing Uncertainty, J. Adv. Model. Earth Sy., 11, 4245–4287, https://doi.org/10.1029/2018MS001583, 2019. a
Liu, Y., van Dijk, A., de Jeu, R., Canadell, J., McCabe, M., Evans, J., and Wang, G.: Recent reversal in loss of global terrestrial biomass, Nat. Clim. Change, 5, 470–474, https://doi.org/10.1038/nclimate2581, 2015. a, b, c, d, e, f
López-Blanco, E., Lund, M., Christensen, R., Tamstorf, P., Smallman, L., Slevin, D., Westergaard-Nielsen, A., Hansen, U., Abermann, J., and Williams, M.: Plant Traits are Key Determinants in Buffering the Meteorological Sensitivity of Net Carbon Exchanges of Arctic Tundra, J. Geophys. Res.-Biogeo., 123, 2675–2694, https://doi.org/10.1029/2018JG004386, 2018. a
López-Blanco, E., Exbrayat, J.-F., Lund, M., Christensen, T. R., Tamstorf, M. P., Slevin, D., Hugelius, G., Bloom, A. A., and Williams, M.: Evaluation of terrestrial pan-Arctic carbon cycling using a data-assimilation system, Earth Syst. Dynam., 10, 233–255, https://doi.org/10.5194/esd-10-233-2019, 2019. a, b
Loranty, M. and Goetz, S.: Shrub expansion and climate feedbacks in Arctic tundra, Environ. Res. Lett., 7, 011005, https://doi.org/10.1088/1748-9326/7/1/011005, 2012. a
Macander, M., Frost, G., Nelson, P., and Swingley, C.: Regional Quantitative Cover Mapping of Tundra Plant Functional Types in Arctic Alaska, Remote Sens., 9, https://doi.org/10.3390/rs9101024, 2017. a, b, c, d, e, f, g
Macander, M., Nelson, P., Nawrocki, T., Frost, G., Orndahl, K., Palm, E., Wells, A., and Goetz, S.: Time-series maps reveal widespread change in plant functional type cover across Arctic and boreal Alaska and Yukon, Environ. Res. Lett., 17, https://doi.org/10.1088/1748-9326/ac6965, 2022. a, b, c
Marie, G., Jeong, J., Jactel, H., Petter, G., Cailleret, M., McGrath, M. J., Bastrikov, V., Ghattas, J., Guenet, B., Lansø, A. S., Naudts, K., Valade, A., Yue, C., and Luyssaert, S.: Simulating Ips typographus L. outbreak dynamics and their influence on carbon balance estimates with ORCHIDEE r8627, Geosci. Model Dev., 17, 8023–8047, https://doi.org/10.5194/gmd-17-8023-2024, 2024. a
Martín Belda, D., Anthoni, P., Wårlind, D., Olin, S., Schurgers, G., Tang, J., Smith, B., and Arneth, A.: LPJ-GUESS/LSMv1.0: a next-generation land surface model with high ecological realism, Geosci. Model Dev., 15, 6709–6745, https://doi.org/10.5194/gmd-15-6709-2022, 2022. a
Mauri, A. and Caudullo, G.: Alnus viridis in Europe: distribution, habitat, usage and threats, in: European Atlas of Forest Tree Species, edited by: San-Miguel-Ayanz, J., de Rigo, D., Caudullo, G., Houston Durrant, T., and Mauri, A., Publication Office of the European Union, Luxembourg, https://doi.org/10.2788/4251, 2016. a
Mekonnen, Z., Riley, W., Berner, L., Bouskill, N., Torn, M., Iwahana, G., Breen, A., Myers-Smith, I., Criado, M., Liu, Y., Euskirchen, E., Goetz, S., Mack, M., and Grant, R.: Arctic tundra shrubification: a review of mechanisms and impacts on ecosystem carbon balance, Environ. Res. Lett., 16, 055003, https://doi.org/10.1088/1748-9326/abf28b, 2021. a, b, c, d, e, f, g, h, i
Meyer, G., Humphreys, E. R., Melton, J. R., Cannon, A. J., and Lafleur, P. M.: Simulating shrubs and their energy and carbon dioxide fluxes in Canada's Low Arctic with the Canadian Land Surface Scheme Including Biogeochemical Cycles (CLASSIC), Biogeosciences, 18, 3263–3283, https://doi.org/10.5194/bg-18-3263-2021, 2021. a, b, c, d, e
Murphy, B. A., Sulman, B. N., Yuan, F., Salmon, V. G., Yang, D., Kumar, J., Dengel, S., Herndon, E., Fettrow, S., Brown, C., Torn, M. S., Chafe, O. E., Pegoraro, E. F., and Iversen, C. M.: Integrating Characteristic Arctic Vegetation in a Land Surface Model Improves Representation of Carbon Dynamics Across a Tundra Landscape, J. Geophys. Res.-Biogeo., 130, e2025JG009039, https://doi.org/10.1029/2025JG009039, 2025. a
Myers-Smith, I., Forbes, B., Wilmking, M., Hallinger, M., Lantz, T., Blok, D., Tape, K., Macias-Fauria, M., Sass-Klaassen, U., Lévesque, E., Boudreau, S., Ropars, P., Hermanutz, L., Trant, A., Collier, L., Weijers, S., Rozema, J., Rayback, S., Schmidt, N., Schaepman-Strub, G., Wipf, S., Rixen, C., Ménard, C., Venn, S., Goetz, S., Andreu-Hayles, L., Elmendorf, S., Ravolainen, V., Welker, J., Grogan, P., Epstein, H., and Hik, D.: Shrub expansion in tundra ecosystems: dynamics, impacts and research priorities, Environ. Res. Lett., 6, 045509, https://doi.org/10.1088/1748-9326/6/4/045509, 2011. a, b, c, d, e, f, g
Myers-Smith, I., Elmendorf, S., Beck, P., Wilmking, M., Hallinger, M., Blok, D., Tape, K., Rayback, S., Macias-Fauria, M., Forbes, B., Speed, J., Boulanger-Lapointe, N., Rixen, C., Lévesque, E., Schmidt, N., Baittinger, C., Trant, A., Hermanutz, L., Collier, L., Dawes, M., Lantz, T., Weijers, S., Jørgensen, R., Buchwal, A., Buras, A., Naito, A., Ravolainen, V., Schaepman-Strub, G., Wheeler, J., Wipf, S., Guay, K., Hik, D., and Vellend, M.: Climate sensitivity of shrub growth across the tundra biome, Nat. Clim. Change, 5, 887–891, https://doi.org/10.1038/nclimate2697, 2015a. a, b
Myers-Smith, I., Hallinger, M., Blok, D., Sass-Klaassen, U., Rayback, S., Weijers, S., J. Trant, A., Tape, K., Naito, A., Wipf, S., Rixen, C., Dawes, M., A. Wheeler, J., Buchwal, A., Baittinger, C., Macias-Fauria, M., Forbes, B., Lévesque, E., Boulanger-Lapointe, N., Beil, I., Ravolainen, V., and Wilmking, M.: Methods for measuring arctic and alpine shrub growth: A review, Earth-Sci. Rev., 140, 1–13, https://doi.org/10.1016/j.earscirev.2014.10.004, 2015b. a, b, c, d, e
Myers-Smith, I., Thomas, H., and Bjorkman, A.: Plant traits inform predictions of tundra responses to global change, New Phytol., 221, 1742–1748, https://doi.org/10.1111/nph.15592, 2019. a, b
Naudts, K., Ryder, J., McGrath, M. J., Otto, J., Chen, Y., Valade, A., Bellasen, V., Berhongaray, G., Bönisch, G., Campioli, M., Ghattas, J., De Groote, T., Haverd, V., Kattge, J., MacBean, N., Maignan, F., Merilä, P., Penuelas, J., Peylin, P., Pinty, B., Pretzsch, H., Schulze, E. D., Solyga, D., Vuichard, N., Yan, Y., and Luyssaert, S.: A vertically discretised canopy description for ORCHIDEE (SVN r2290) and the modifications to the energy, water and carbon fluxes, Geosci. Model Dev., 8, 2035–2065, https://doi.org/10.5194/gmd-8-2035-2015, 2015. a, b, c, d, e
NEON: Field site: Healy NEON, National Ecological Observatory Network, https://www.neonscience.org/field-sites/heal, last access: 16 February 2026. a
Oehri, J., Schaepman-Strub, G., Kim, J.-S., Grysko, R., Kropp, H., Grünberg, I., Zemlianskii, V., Sonnentag, O., Euskirchen, E., Reji Chacko, M., Muscari, G., Blanken, P., Dean, J., di Sarra, A., Harding, R., Sobota, I., Kutzbach, L., Plekhanova, E., Riihelä, A., Boike, J., Miller, N., Beringer, J., López-Blanco, E., Stoy, P., Sullivan, R., Kejna, M., Parmentier, F.-J., Gamon, J., Mastepanov, M., Wille, C., Jackowicz-Korczynski, M., Karger, D., Quinton, W., Putkonen, J., van As, D., Christensen, T., Hakuba, M., Stone, R., Metzger, S., Vandecrux, B., Frost, G., Wild, M., Hansen, B., Meloni, D., Domine, F., te Beest, M., Sachs, T., Kalhori, A., Rocha, A., Williamson, S., Morris, S., Atchley, A., Essery, R., Runkle, B., Holl, D., Riihimaki, L., Iwata, H., Schuur, E., Cox, C., Grachev, A., McFadden, J., Fausto, R., Göckede, M., Ueyama, M., Pirk, N., de Boer, G., Bret-Harte, M., Leppäranta, M., Steffen, K., Friborg, T., Ohmura, A., Edgar, C., Olofsson, J., and Chambers, S.: Vegetation type is an important predictor of the arctic summer land surface energy budget, Nat. Commun., 13, 6379, https://doi.org/10.1038/s41467-022-34049-3, 2022. a
Olefeldt, D., Hovemyr, M., Kuhn, M. A., Bastviken, D., Bohn, T. J., Connolly, J., Crill, P., Euskirchen, E. S., Finkelstein, S. A., Genet, H., Grosse, G., Harris, L. I., Heffernan, L., Helbig, M., Hugelius, G., Hutchins, R., Juutinen, S., Lara, M. J., Malhotra, A., Manies, K., McGuire, A. D., Natali, S. M., O'Donnell, J. A., Parmentier, F.-J. W., Räsänen, A., Schädel, C., Sonnentag, O., Strack, M., Tank, S. E., Treat, C., Varner, R. K., Virtanen, T., Warren, R. K., and Watts, J. D.: The Boreal–Arctic Wetland and Lake Dataset (BAWLD), Earth Syst. Sci. Data, 13, 5127–5149, https://doi.org/10.5194/essd-13-5127-2021, 2021a. a, b
Olefeldt, D., Hovemyr, M., Kuhn, M., Bastviken, D., Bohn, T., Connolly, J., Crill, P., Euskirchen, E., Finkelstein, S., Genet, H., Grosse, G., Harris, L., Heffernan, L., Helbig, M., Hugelius, G., Hutchins, R., Juutinen, S., Lara, M., Malhotra, A., Manies, K., McGuire, D., Natali, S., O'Donnell, J., Parmentier, F.-J., Räsänen, A., Schädel, C., Sonnentag, O., Strack, M., Tank, S., Treat, C., Varner, R., Virtanen, T., Warren, R., and Watts, J.: The Fractional Land Cover Estimates from the Boreal-Arctic Wetland and Lake Dataset (BAWLD), Arctic Data Center, https://doi.org/10.18739/A2C824F9X, 2021b. a
ORCHIDAS team: ORCHIDEE Data Assimilation Systems, Laboratoire des Sciences du Climat et de l'Environnement (LSCE), Institut Pierre-Simon Laplace (IPSL), https://orchidas.lsce.ipsl.fr/ (last access: 24 February 2026), 2024. a, b
Orlandi, F., Garcia-Mozo, H., Vazquez Ezquerra, L., Romano, B., Dominguez, E., Galan, C., and Fornaciari, M.: Phenological olive chilling requirements in Umbria (Italy) and Andalusia (Spain), Plant Biosyst., 138, 111–116, https://doi.org/10.1080/11263500412331283762, 2004. a
Óskarsdóttir, G., Thórhallsdóttir, T. E., Jónsdóttir, A. H., Birkisdóttir, H. M., and Svavarsdóttir, K.: Establishment of mountain birch (Betula pubescens ssp. tortuosa) on a glacial outwash plain: Spatial patterns and decadal processes, Ecol. Evol., 12, e9430, https://doi.org/10.1002/ece3.9430, 2022. a
Pajunen, A.: Environmental and Biotic Determinants of Growth and Height of Arctic Willow Shrubs along a Latitudinal Gradient, Arct. Antarct. Alp. Res., 41, 478–485, https://doi.org/10.1657/1938-4246-41.4.478, 2009. a
Parmesan, C., Morecroft, M., Trisurat, Y., Adrian, R., Anshari, G., Arneth, A., Gao, Q., Gonzalez, P., Harris, R., Price, J., Stevens, N., and Talukdarr, G.: Terrestrial and Freshwater Ecosystems and Their Services, chap. 2, in: Climate Change 2022: Impacts, Adaptation and Vulnerability. Contribution of Working Group II to the Sixth Assessment Report of the Intergovernmental Panel on Climate Change, edited by: Pörtner, H., Roberts, D., Tignor, M., Poloczanska, E., Mintenbeck, K., Alegría, A., Craig, M., Langsdorf, S., Löschke, S., Möller, V., Okem, A., and Rama, B., Cambridge University Press, https://doi.org/10.1017/9781009325844.004, 2022. a
Pastorello, G., Trotta, C., Canfora, E., Chu, H., Christianson, D., Cheah, Y.-W., Poindexter, C., Chen, J., Elbashandy, A., Humphrey, M., Isaac, P., Polidori, D., Ribeca, A., van Ingen, C., Zhang, L., Amiro, B., Ammann, C., Arain, M., Ardö, J., Arkebauer, T., Arndt, S., Arriga, N., Aubinet, M., Aurela, M., Baldocchi, D., Barr, A., Beamesderfer, E., Marchesini, L., Bergeron, O., Beringer, J., Bernhofer, C., Berveiller, D., Billesbach, D., Black, T., Blanken, P., Bohrer, G., Boike, J., Bolstad, P., Bonal, D., Bonnefond, J.-M., Bowling, D., Bracho, R., Brodeur, J., Brümmer, C., Buchmann, N., Burban, B., Burns, S., Buysse, P., Cale, P., Cavagna, M., Cellier, P., Chen, S., Chini, I., Christensen, T., Cleverly, J., Collalti, A., Consalvo, C., Cook, B., Cook, D., Coursolle, C., Cremonese, E., Curtis, P., D'Andrea, E., da Rocha, H., Dai, X., Davis, K., De Cinti, B., de Grandcourt, A., De Ligne, A., De Oliveira, R., Delpierre, N., Desai, A., Di Bella, C., di Tommasi, P., Dolman, H., Domingo, F., Dong, G., Dore, S., Duce, P., Dufrêne, E., Dunn, A., Dušek, J., Eamus, D., Eichelmann, U., ElKhidir, H., Eugster, W., Ewenz, C., Ewers, B., Famulari, D., Fares, S., Feigenwinter, I., Feitz, A., Fensholt, R., Filippa, G., Fischer, M., Frank, J., Galvagno, M., Gharun, M., Gianelle, D., Gielen, B., Gioli, B., Gitelson, A., Goded, I., Goeckede, M., Goldstein, A., Gough, C., Goulden, M., Graf, A., Griebel, A., Gruening, C., Grünwald, T., Hammerle, A., Han, S., Han, X., Hansen, B., Hanson, C., Hatakka, J., He, Y., Hehn, M., Heinesch, B., Hinko-Najera, N., Hörtnagl, L., Hutley, L., Ibrom, A., Ikawa, H., Jackowicz-Korczynski, M., Janouš, D., Jans, W., Jassal, R., Jiang, S., Kato, T., Khomik, M., Klatt, J., Knohl, A., Knox, S., Kobayashi, H., Koerber, G., Kolle, O., Kosugi, Y., Kotani, A., Kowalski, A., Kruijt, B., Kurbatova, J., Kutsch, W., Kwon, H., Launiainen, S., Laurila, T., Law, B., Leuning, R., Li, Y., Liddell, M., Limousin, J.-M., Lion, M., Liska, A., Lohila, A., López-Ballesteros, A., López-Blanco, E., Loubet, B., Loustau, D., Lucas-Moffat, A., Lüers, J., Ma, S., Macfarlane, C., Magliulo, V., Maier, R., Mammarella, I., Manca, G., Marcolla, B., Margolis, H., Marras, S., Massman, W., Mastepanov, M., Matamala, R., Matthes, J., Mazzenga, F., McCaughey, H., McHugh, I., McMillan, A., Merbold, L., Meyer, W., Meyers, T., Miller, S., Minerbi, S., Moderow, U., Monson, R., Montagnani, L., Moore, C., Moors, E., Moreaux, V., Moureaux, C., Munger, J., Nakai, T., Neirynck, J., Nesic, Z., Nicolini, G., Noormets, A., Northwood, M., Nosetto, M., Nouvellon, Y., Novick, K., Oechel, W., Olesen, J., Ourcival, J.-M., Papuga, S., Parmentier, F.-J., Paul-Limoges, E., Pavelka, M., Peichl, M., Pendall, E., Phillips, R., Pilegaard, K., Pirk, N., Posse, G., Powell, T., Prasse, H., Prober, S., Rambal, S., Rannik, Ø., Raz-Yaseef, N., Reed, D., de Dios, V., Restrepo-Coupe, N., Reverter, B., Roland, M., Sabbatini, S., Sachs, T., Saleska, S., Sánchez-Cañete, E., Sanchez-Mejia, Z., Schmid, H., Schmidt, M., Schneider, K., Schrader, F., Schroder, I., Scott, R., Sedlák, P., Serrano-Ortíz, P., Shao, C., Shi, P., Shironya, I., Siebicke, L., Šigut, L., Silberstein, R., Sirca, C., Spano, D., Steinbrecher, R., Stevens, R., Sturtevant, C., Suyker, A., Tagesson, T., Takanashi, S., Tang, Y., Tapper, N., Thom, J., Tiedemann, F., Tomassucci, M., Tuovinen, J.-P., Urbanski, S., Valentini, R., van der Molen, M., van Gorsel, E., van Huissteden, K., Varlagin, A., Verfaillie, J., Vesala, T., Vincke, C., Vitale, D., Vygodskaya, N., Walker, J., Walter-Shea, E., Wang, H., Weber, R., Westermann, S., Wille, C., Wofsy, S., Wohlfahrt, G., Wolf, S., Woodgate, W., Li, Y., Zampedri, R., Zhang, J., Zhou, G., Zona, D., Agarwal, D., Biraud, S., Torn, M., and Papale, D.: The FLUXNET2015 dataset and the ONEFlux processing pipeline for eddy covariance data, Sci. Data, 7, 225, https://doi.org/10.1038/s41597-020-0534-3, 2020. a
Peylin, P., Abadie, C., Alléon, J., Ardaneh Kazem, B., Jonathan, B. V., Cadule, P., Calix, L.-G., Chaste, E., Cheruy, F., Cuynet, A., Ducharne, A., Dumas, C., Gaillard, R., Ghattas, J., Goll, D. S., Guenet, B., Jeong, J., Kiałka, F., Kirchner, A., Lanet, M., Lansø, A. S., Lathière, J., Lippmann, T. J. R., MacBean, N., McGrath, M. J., Maignan, F., Maugis, P., Marie, G., Naudts, K., Ottlé, C., Polcher, J., Salmon, E., Tartaglione, V., Tiengou, P., Valade, A., Vuichard, N., Viovy, N., Wang, X., Yue, C., Zhang, P., and Luyssaert, S.: Evaluation of the global land surface model ORCHIDEE v4.2, in preparation, 2026. a, b, c, d
Ramage, J., Kuhn, M., Virkkala, A.-M., Voigt, C., Marushchak, M., Bastos, A., Biasi, C., Canadell, J., Ciais, P., López-Blanco, E., Natali, S., Olefeldt, D., Potter, S., Poulter, B., Rogers, B., Schuur, E., Treat, C., Turetsky, M., Watts, J., and Hugelius, G.: The Net GHG Balance and Budget of the Permafrost Region (2000–2020) From Ecosystem Flux Upscaling, Global Biogeochem. Cy., 38, e2023GB007953, https://doi.org/10.1029/2023GB007953, 2024. a, b, c, d
Rantanen, M., Karpechko, A. Y., Lipponen, A., Nordling, K., Hyvärinen, O., Ruosteenoja, K., Vihma, T., and Laaksonen, A.: The Arctic has warmed nearly four times faster than the globe since 1979, Commun. Earth Environ., 3, https://doi.org/10.1038/s43247-022-00498-3, 2022. a
Raynolds, M., Walker, D., Balser, A., Bay, C., Campbell, M., Cherosov, M., Daniëls, F., Eidesen, P., Ermokhina, K., Frost, G., Jedrzejek, B., Jorgenson, M., Kennedy, B., Kholod, S., Lavrinenko, I., Lavrinenko, O., Magnússon, B., Matveyeva, N., Metúsalemsson, S., Nilsen, L., Olthof, I., Pospelov, I., Pospelova, E., Pouliot, D., Razzhivin, V., Schaepman-Strub, G., Šibík, J., Telyatnikov, M., and Troeva, E.: A raster version of the Circumpolar Arctic Vegetation Map (CAVM), Remote Sens. Environ., 232, 111297, https://doi.org/10.1016/j.rse.2019.111297, 2019. a, b, c, d, e, f, g
Reick, C. H., Gayler, V., Goll, D., Hagemann, S., Heidkamp, M., Nabel, J. E. M. S., Raddatz, T., Zaehle, S., Evans, J., Hagemann, S., Huth, R., Kautz, M., Kutsch, W., Lavorel, S., Müller, M., Pihlainen, S., Prestele, R., Rödenbeck, C., Röckmann, M., Stenzel, F., Thonicke, K., van der Laan-Luijkx, I., von Buttlar, J., Zaehle, S., Zietsch, B., Zier, F., Ziemianski, M., and Zscheischler, J.: JSBACH 3 – The land component of the MPI Earth System Model: documentation of version 3.2, Berichte zur Erdsystemforschung 240, Max Planck Institute for Meteorology, https://doi.org/10.17617/2.3279802, 2021. a
Reineke, L.: Perfecting a stand-density index for even-aged forests, J. Agric. Res., 46, 627–638, 1933. a
Rezsöhazy, J., Fisher, R. A., Geange, S. R., Halbritter, A. H., Tang, H., and Vandvik, V.: A new implementation of dwarf-shrub plant functional type within the CLM-FATES land-surface model, EGU General Assembly 2025, Vienna, Austria, 27 Apr–2 May 2025, EGU25-13087, https://doi.org/10.5194/egusphere-egu25-13087, 2025. a
Saccone, P., Hoikka, K., and Virtanen, R.: What if plant functional types conceal species-specific responses to environment? Study on arctic shrub communities, Ecology, 98, 1600–1612, https://doi.org/10.1002/ecy.1817, 2017. a, b
Shinozaki, K., Yoda, K., Hozumi, K., and Kira, T.: A quantitative Analysis of Plant Form-The Pipe Model Theory, Japanese Journal of Ecology, 14, 97–105, The Ecological Society of Japan, 1964. a, b
Shuman, I. N. C., Serbin, S. P., Erb, A. M., Schaaf, C. B., and Yang, D.: Fine-scale vegetation composition and structure shape spatiotemporal variation in surface albedo across a low Arctic tundra landscape, Environ. Res.-Ecology, 4, 045001, https://doi.org/10.1088/2752-664X/ae04ef, 2025. a
Sitch, S., O’Sullivan, M., Robertson, E., Friedlingstein, P., Albergel, C., Anthoni, P., Arneth, A., Arora, V. K., Bastos, A., Bastrikov, V., Bellouin, N., Canadell, J. G., Chini, L., Ciais, P., Falk, S., Harris, I., Hurtt, G., Ito, A., Jain, A. K., Jones, M. W., Joos, F., Kato, E., Kennedy, D., Klein Goldewijk, K., Kluzek, E., Knauer, J., Lawrence, P. J., Lombardozzi, D., Melton, J. R., Nabel, J. E. M. S., Pan, N., Peylin, P., Pongratz, J., Poulter, B., Rosan, T. M., Sun, Q., Tian, H., Walker, A. P., Weber, U., Yuan, W., Yue, X., and Zaehle, S.: Trends and Drivers of Terrestrial Sources and Sinks of Carbon Dioxide: An Overview of the TRENDY Project, Glob. Biogeochem. Cy., 38, https://doi.org/10.1029/2024GB008102, 2024. a, b
Spawn, S., Sullivan, C., Lark, T., and Gibbs, H.: Harmonized global maps of above and belowground biomass carbon density in the year 2010, Sci. Data, 7, 112, https://doi.org/10.1038/s41597-020-0444-4, 2020. a, b, c, d, e, f, g, h, i
Sulman, B. N., Salmon, V. G., Iversen, C. M., Breen, A. L., Yuan, F., and Thornton, P. E.: Integrating Arctic Plant Functional Types in a Land Surface Model Using Above- and Belowground Field Observations, J. Adv. Model. Earth Sy., 13, e2020MS002396, https://doi.org/10.1029/2020MS002396, 2021. a, b, c
Sweet, S., Gough, L., Griffin, K., and Boelman, N.: Tall Deciduous Shrubs Offset Delayed Start of Growing Season Through Rapid Leaf Development in the Alaskan Arctic Tundra, Arc. Antarct. Alp. Res., 46, 682–697, https://doi.org/10.1657/1938-4246-46.3.682, 2014. a
Thomas, H., Bjorkman, A., Myers-Smith, I., Elmendorf, S., Kattge, J., Diaz, S., Vellend, M., Blok, D., Cornelissen, J., Forbes, B., Henry, G., Hollister, R., Normand, S., Prevéy, J., Rixen, C., Schaepman-Strub, G., Wilmking, M., Wipf, S., Cornwell, W., Beck, P., Georges, D., Goetz, S., Guay, K., Rüger, N., Soudzilovskaia, N., Spasojevic, M., Alatalo, J., Alexander, H., Anadon-Rosell, A., Angers-Blondin, S., te Beest, M., Berner, L., Björk, R., Buchwal, A., Buras, A., Carbognani, M., Christie, K., Collier, L., Cooper, E., Elberling, B., Eskelinen, A., Frei, E., Grau, O., Grogan, P., Hallinger, M., Heijmans, M., Hermanutz, L., Hudson, J., Johnstone, J., Hülber, K., Iturrate-Garcia, M., Iversen, C., Jaroszynska, F., Kaarlejarvi, E., Kulonen, A., Lamarque, L., Lantz, T., Lévesque, E., Little, C., Michelsen, A., Milbau, A., Nabe-Nielsen, J., Nielsen, S., Ninot, J., Oberbauer, S., Olofsson, J., Onipchenko, V., Petraglia, A., Rumpf, S., Shetti, R., Speed, J., Suding, K., Tape, K., Tomaselli, M., Trant, A., Treier, U., Tremblay, M., Venn, S., Vowles, T., Weijers, S., Wookey, P., Zamin, T., Bahn, M., Blonder, B., van Bodegom, P., Bond-Lamberty, B., Campetella, G., Cerabolini, B., Chapin, F., Craine, J., Dainese, M., Green, W., Jansen, S., Kleyer, M., Manning, P., Niinemets, Ø., Onoda, Y., Ozinga, W., Peñuelas, J., Poschlod, P., Reich, P. B., Sandel, B., Schamp, B. S., Sheremetiev, S. N., and de Vries, F. T.: Global plant trait relationships extend to the climatic extremes of the tundra biome, Nat. Commun., 11, 1351, https://doi.org/10.1038/s41467-020-15014-4, 2020. a
Treml, V., Hejda, T., and Kašpar, J.: Differences in growth between shrubs and trees: How does the stature of woody plants influence their ability to thrive in cold regions?, Agr. Forest Meteorol., 271, 54–63, https://doi.org/10.1016/j.agrformet.2019.02.036, 2019. a
University of East Anglia Climatic Research Unit and Harris, I.: CRU JRA v2.4: A forcings dataset of gridded land surface blend of Climatic Research Unit (CRU) and Japanese reanalysis (JRA) data; January 1901–December 2022, NERC EDS Centre for Environmental Data Analysis, https://catalogue.ceda.ac.uk/uuid/aed8e269513f446fb1b5d2512bb387ad/ (last access: 24 January 2026), 2023. a, b
van der Molen, M. K., van Huissteden, J., Parmentier, F. J. W., Petrescu, A. M. R., Dolman, A. J., Maximov, T. C., Kononov, A. V., Karsanaev, S. V., and Suzdalov, D. A.: The growing season greenhouse gas balance of a continental tundra site in the Indigirka lowlands, NE Siberia, Biogeosciences, 4, 985–1003, https://doi.org/10.5194/bg-4-985-2007, 2007. a
Verheijen, L. M., Brovkin, V., Aerts, R., Bönisch, G., Cornelissen, J. H. C., Kattge, J., Reich, P. B., Wright, I. J., and van Bodegom, P. M.: Impacts of trait variation through observed trait–climate relationships on performance of an Earth system model: a conceptual analysis, Biogeosciences, 10, 5497–5515, https://doi.org/10.5194/bg-10-5497-2013, 2013. a
Virkkala, A.-M., Aalto, J., Rogers, B., Tagesson, T., Treat, C., Natali, S., Watts, J., Potter, S., Lehtonen, A., Mauritz, M., Schuur, E., Kochendorfer, J., Zona, D., Oechel, W., Kobayashi, H., Humphreys, E., Goeckede, M., Iwata, H., Lafleur, P., and Luoto, M.: Statistical upscaling of ecosystem CO2 fluxes across the terrestrial tundra and boreal domain: Regional patterns and uncertainties, Glob. Change Biol., 27, 4040–4059, https://doi.org/10.1111/gcb.15659, 2021. a, b, c, d, e, f, g, h, i, j, k, l, m, n, o, p, q, r, s, t, u, v, w, x, y
Virkkala, A.-M., Natali, S. M., Rogers, B. M., Watts, J. D., Savage, K., Connon, S. J., Mauritz, M., Schuur, E. A. G., Peter, D., Minions, C., Nojeim, J., Commane, R., Emmerton, C. A., Goeckede, M., Helbig, M., Holl, D., Iwata, H., Kobayashi, H., Kolari, P., López-Blanco, E., Marushchak, M. E., Mastepanov, M., Merbold, L., Parmentier, F.-J. W., Peichl, M., Sachs, T., Sonnentag, O., Ueyama, M., Voigt, C., Aurela, M., Boike, J., Celis, G., Chae, N., Christensen, T. R., Bret-Harte, M. S., Dengel, S., Dolman, H., Edgar, C. W., Elberling, B., Euskirchen, E., Grelle, A., Hatakka, J., Humphreys, E., Järveoja, J., Kotani, A., Kutzbach, L., Laurila, T., Lohila, A., Mammarella, I., Matsuura, Y., Meyer, G., Nilsson, M. B., Oberbauer, S. F., Park, S.-J., Petrov, R., Prokushkin, A. S., Schulze, C., St. Louis, V. L., Tuittila, E.-S., Tuovinen, J.-P., Quinton, W., Varlagin, A., Zona, D., and Zyryanov, V. I.: The ABCflux database: Arctic–boreal CO2 flux observations and ancillary information aggregated to monthly time steps across terrestrial ecosystems, Earth Syst. Sci. Data, 14, 179–208, https://doi.org/10.5194/essd-14-179-2022, 2022. a, b, c
Vowles, T. and Björk, R.: Implications of evergreen shrub expansion in the Arctic, J. Ecol., 107, 650–655, https://doi.org/10.1111/1365-2745.13081, 2019. a
Vowles, T., Gunnarsson, B., Molau, U., Hickler, T., Klemedtsson, L., and Björk, R.: Expansion of deciduous tall shrubs but not evergreen dwarf shrubs inhibited by reindeer in Scandes mountain range, J. Ecol., 105, 1547–1561, https://doi.org/10.1111/1365-2745.12753, 2017. a
Vuichard, N., Messina, P., Luyssaert, S., Guenet, B., Zaehle, S., Ghattas, J., Bastrikov, V., and Peylin, P.: Accounting for carbon and nitrogen interactions in the global terrestrial ecosystem model ORCHIDEE (trunk version, rev 4999): multi-scale evaluation of gross primary production, Geosci. Model Dev., 12, 4751–4779, https://doi.org/10.5194/gmd-12-4751-2019, 2019. a, b, c
Walker, D. and Maier, H.: Vegetation in the vicinity of the Toolik Field Station, Alaska, Tech. Rep. 28, Institute of Arctic Biology, University of Alaska Fairbanks, Fairbanks, Alaska, 2008. a, b, c
Walker, D., Raynolds, M., Daniëls, F., Einarsson, E., Elvebakk, A., Gould, W., Katenin, A., Kholod, S., Markon, C., Melnikov, E., Moskalenko, N., Talbot, S., Yurtsev, B., and Team, T.: The Circumpolar Arctic vegetation map, J. Veg. Sci., 16, 267–282, https://doi.org/10.1111/j.1654-1103.2005.tb02365.x, 2005. a
Wang, P., Heijmans, M., Mommer, L., van Ruijven, J., Maximov, T., and Berendse, F.: Belowground plant biomass allocation in tundra ecosystems and its relationship with temperature, Environ. Res. Lett., 11, 055003, https://doi.org/10.1088/1748-9326/11/5/055003, 2016. a, b, c
Wang, T., Ottlé, C., Boone, A., Ciais, P., Brun, E., Morin, S., Krinner, G., Piao, S., and Peng, S.: Evaluation of an improved intermediate complexity snow scheme in the ORCHIDEE land surface model, J. Geophys. Res.-Atmos., 118, 6064–6079, https://doi.org/10.1002/jgrd.50395, 2013. a
Wheeler, J., Hoch, G., Cortés, A., Sedlacek, J., Wipf, S., and Rixen, C.: Increased spring freezing vulnerability for alpine shrubs under early snowmelt, Oecologia, 175, 219–229, https://doi.org/10.1007/s00442-013-2872-8, 2014. a
Wolf, A., Callaghan, T., and Larson, K.: Future changes in vegetation and ecosystem function of the Barents Region, Climatic Change, 87, 51–73, https://doi.org/10.1007/s10584-007-9342-4, 2008. a, b, c, d, e, f, g
Wullschleger, S., Epstein, H., Box, E., Euskirchen, E., Goswami, S., Iversen, C., Kattge, J., Norby, R., van Bodegom, P., and Xu, X.: Plant functional types in Earth system models: past experiences and future directions for application of dynamic vegetation models in high-latitude ecosystems, Ann. Bot., 114, 1–16, https://doi.org/10.1093/aob/mcu077, 2014. a, b, c, d, e, f, g, h, i, j, k
Yang, D., Hantson, W., Davidson, K., Lamour, J., Morrison, B., Salmon, V., Zhang, T., Ely, K., Miller, C., Hayes, D., Baines, S., Rogers, A., and Serbin, S.: Topography and functional traits shape the distribution of key shrub plant functional types in low-Arctic tundra, Front. Plant Sci., 16, https://doi.org/10.3389/fpls.2025.1724838, 2026. a
Yang, J., Su, P., Zhou, Z., Shi, R., and Qin, Y.: Shrub Expansion is Mainly Affected by Climate-Dominated Functional Traits in Alpine Meadow, Front. Environ. Sci., 10, https://doi.org/10.3389/fenvs.2022.917597, 2022. a
Yin, X. and Struik, P. C.: C3 and C4 photosynthesis models: An overview from the perspective of crop modelling, NJAS: Wageningen J. Life Sci., 57, 27–38, https://doi.org/10.1016/j.njas.2009.07.001, 2009. a
Yoda, K., Kira, T., Ogawa, H., and Hozumi, K.: Self-thinning in overcrowded pure stands under cultivated and natural conditions, Journal of the Institute of Polytechnics (Osaka University), 14, 107–129, 1963. a
Yue, C., Ciais, P., Cadule, P., Thonicke, K., Archibald, S., Poulter, B., Hao, W. M., Hantson, S., Mouillot, F., Friedlingstein, P., Maignan, F., and Viovy, N.: Modelling the role of fires in the terrestrial carbon balance by incorporating SPITFIRE into the global vegetation model ORCHIDEE – Part 1: simulating historical global burned area and fire regimes, Geosci. Model Dev., 7, 2747–2767, https://doi.org/10.5194/gmd-7-2747-2014, 2014. a
Yue, C., Ciais, P., Luyssaert, S., Li, W., McGrath, M. J., Chang, J., and Peng, S.: Representing anthropogenic gross land use change, wood harvest, and forest age dynamics in a global vegetation model ORCHIDEE-MICT v8.4.2, Geosci. Model Dev., 11, 409–428, https://doi.org/10.5194/gmd-11-409-2018, 2018. a
Zhu, D., Peng, S. S., Ciais, P., Viovy, N., Druel, A., Kageyama, M., Krinner, G., Peylin, P., Ottlé, C., Piao, S. L., Poulter, B., Schepaschenko, D., and Shvidenko, A.: Improving the dynamics of Northern Hemisphere high-latitude vegetation in the ORCHIDEE ecosystem model, Geosci. Model Dev., 8, 2263–2283, https://doi.org/10.5194/gmd-8-2263-2015, 2015. a
- Abstract
- Introduction
- Methods
- Results
- Discussion
- Conclusion
- Appendix A: Supplementary information for methods
- Appendix B: Supplementary information for results
- Code availability
- Data availability
- Author contributions
- Competing interests
- Disclaimer
- Acknowledgements
- Financial support
- Review statement
- References
- Abstract
- Introduction
- Methods
- Results
- Discussion
- Conclusion
- Appendix A: Supplementary information for methods
- Appendix B: Supplementary information for results
- Code availability
- Data availability
- Author contributions
- Competing interests
- Disclaimer
- Acknowledgements
- Financial support
- Review statement
- References