
the Creative Commons Attribution 4.0 License.
the Creative Commons Attribution 4.0 License.
 | 21 Sep 2026
Plant belowground traits indicate increased plant-mediated methane transport along a peatland permafrost thaw gradient

Samantha H. Bosman
Jeffrey P. Chanton
Patrick Crill
Suzanne B. Hodgkins
Jalisha Theanutti Kallingal
Rachel M. Wilson
Ruth Varner
Avni Malhotra
Permafrost thaw alters methane (CH4) fluxes from subarctic peatland ecosystems. Collapsing permafrost palsas change hydrology, interstitial oxygen availability, and vegetation composition, and each of these factors contribute to net CH4 flux by influencing CH4 production, consumption and transport. Changes in plant-mediated CH4 fluxes have mostly been estimated using aboveground characteristics, such as biomass and leaf area, leaving belowground parts (roots and rhizomes) understudied despite their direct contact to depth-dependent CH4 flux processes. Here, we explored the potential of using root and rhizome traits as proxies for plant-mediated CH4 cycling along a peatland permafrost thaw gradient in subarctic Sweden. We investigated changes in root and rhizome biomass, surface area (SA), diameter, tissue density (TD), and specific root length (SRL) along the permafrost thaw gradient, and how these traits relate to early-, middle-, peak- and season median CH4 fluxes. We utilized chamber CH4 flux and pore water CH4 concentration and isotopic measurements during the productive season. Shrub SRL, diameter and isotopic data suggested increased plant-mediated carbon substrates available for acetoclastic methanogenesis across the thaw gradient. Root TD, proxy for root porosity, decreased with thaw and had negative correlations with CH4 fluxes throughout the season. Simultaneously, herbaceous rhizome SA-CH4 flux correlations were positive and pore water CH4 concentrations were lowest in the fully thawed stage. These results indicated increasing herbaceous plant-mediated transport of acetoclastically-produced CH4 with thaw. Our study demonstrates that integrating plant belowground traits with environmental and biogeochemical data can help improve CH4 flux predictions in thawing landscapes and revealed key mechanistic insights regarding the interplay between substrate availability for methanogenesis and gas transport.
- Article
(6866 KB) - Full-text XML
- BibTeX
- EndNote


Northern peatlands are significant net methane (CH4) emitters primarily due to the predominance of anoxia throughout the peat depth profile (Gorham, 1991; McGuire et al., 2009; Zhuang et al., 2004). Owing to high organic carbon accumulation, high-latitude peatlands store approximately a third of the global carbon stock (Gorham, 1991), with a substantial fraction preserved in and beneath permafrost (Schuur et al., 2008). In the high latitudes, increasing air temperatures drive permafrost thaw, which can expose the previously frozen organic matter to soil decomposers, including methanogens. Together with altered hydrological and thermal conditions, these processes may increase CH4 emissions and lead to positive climate feedback (Olefeldt et al., 2013; Schuur et al., 2008). Palsa mires with permafrost plateaus (palsas) are especially vulnerable to increasing temperatures and changes in precipitation (Luoto et al., 2004). Palsas are approximately 0.5–10 m high peat hummocks with a frozen core of peat and mineral soil. They form as a result of water-saturated peat freezing in winter and the dry surface peat protecting the frozen peat in summer, raising the peat above the surrounding mire (Luoto et al., 2004). In northern Fennoscandia, permafrost thaw has formed transitional gradients from frozen palsas and peat plateau to permafrost-free bogs and fens (Luoto et al., 2004; Olvmo et al., 2020). Following palsa collapse, soil moisture increases, shifting the system from an ombrotrophic bog-like system to a minerotrophic fen. Vegetation composition shifts from shrub-dominated on palsas to graminoid-dominated in fens, and soil redox and pH change, influencing methanogenic CH4 production, methanotrophic CH4 consumption, and CH4 transport from the soil to the atmosphere, and net CH4 fluxes (Perryman et al., 2020; Turetsky et al., 2014; Varner et al., 2022). Almost all arctic permafrost has been estimated to degrade and result in 120 ± 85 Gt of carbon emissions by 2100 (Lawrence et al., 2008; Schaefer et al., 2014). Together with the inevitable disappearance of palsa mires (Luoto et al., 2004; Olvmo et al., 2020), this highlights the urgent need to investigate the network of CH4 flux controls in thawing palsa mires.
One of the key biotic CH4 flux drivers in permafrost peatlands are wetland plants and the traits reflecting their adaptive and resource acquisition strategies. In general, plants contribute to CH4 fluxes by mediating gas transport, providing carbon substrates for methanogens, and modifying the physicochemical properties of the rhizosphere (Chanton and Dacey, 1991; Laanbroek, 2010; Määttä and Malhotra, 2024; Noyce et al., 2014). As an adaptive strategy to anoxia, many wetland plant species develop aerenchyma which are air spaces within the plant stem, roots and rhizomes that transport oxygen (O2) from the atmosphere to the roots and the surrounding soil (Armstrong et al., 1991; Končalová, 1990; Vroom et al., 2022). This plant-mediated gas transport mechanism enhances rhizosphere oxygenation and CH4 consumption, but also simultaneously increases CH4 transport from anoxic peat to the atmosphere (Laanbroek, 2010; Noyce et al., 2014; Ström et al., 2005). While peatlands store vast quantities of carbon, much of it is too recalcitrant to be directly utilized by methanogens particularly in deep peat (Hogg, 1993; Ström et al., 2005). The release of labile carbon substrates such as acetate and other organic acids by plant roots stimulates CH4 production and emission (Joabsson and Christensen, 2001; Ström et al., 2003).
Studies using plant functional traits to predict CH4 fluxes have primarily focused on aboveground features, such as plant green area, even though plant belowground biomass can exceed that aboveground especially in (sub)arctic ecosystems (Iversen et al., 2015; Malhotra and Roulet, 2015). Often, the aboveground traits have been used to estimate belowground characteristics, such as root porosity, based on the plant species or functional type (PFT) (e.g., Bouchard et al., 2007; Greenup et al., 2000; Iversen et al., 2015). However, above- and belowground plant traits and the functional connections between them have not been adequately studied in relation to carbon cycling and the use of aboveground traits as proxies for plant-mediated belowground carbon functioning remains unresolved (Iversen et al., 2015; Määttä and Malhotra, 2024).
Many studies have used above- and/or belowground biomass as CH4 flux predictors but the direction of the relationship varies strongly between studies, species, and PFTs (e.g., Greenup et al., 2000; Joabsson and Christensen, 2001; Koelbener et al., 2010). While above and belowground biomass may reflect plant productivity, quantification of plant-mediated CH4 fluxes may be better served by a knowledge of belowground traits more directly related to CH4 production, consumption and transport. For example, root exudation in some instances can explain CH4 flux variation better than biomass (Ström et al., 2005; Waldo et al., 2019). Because belowground traits, such as rooting depth, change with a deepening active layer (Blume-Werry et al., 2016; Iversen et al., 2015), assessing these trait variations and their effects on CH4 fluxes along permafrost thaw gradients is essential.
Wetland CH4 fluxes can be driven by plant-mediated carbon release and CH4 and O2 transport (Knox et al., 2021), which can be reflected in root and rhizome traits. Increases in root and rhizome tissue porosity (i.e., lower tissue density and larger diameter; Freschet et al., 2021a; Visser et al., 2000) can enhance plant-mediated gas transport and, depending on species and environmental conditions (e.g., water table level), can lead to increased CH4 transport and net flux (Bhullar et al., 2013; Henneberg et al., 2016; van den Berg et al., 2020) or rhizospheric CH4 oxidation and decreased net CH4 flux (e.g., Fritz et al., 2011; Noyce et al., 2023). CH4 production can be stimulated by increased labile carbon provision particularly from root exudation (Ström et al., 2003, 2012; Waldo et al., 2019) but also from rhizome and root decomposition (Hackney and De La Cruz, 1980; Scheffer and Aerts, 2000). Specific root length (SRL), the relationship between root length and dry mass, could be a proxy for carbon substrate provision, as high SRL is associated with low tissue density, shorter lifespan, high turnover rates (Bergmann et al., 2020; Eissenstat et al., 2000), and root exudation (Wen et al., 2022). However, studies on the relationships between different root traits, especially SRL and tissue density, in wetlands are rare (Iversen et al., 2015; Pan et al., 2019).
Here, we investigated (1) how root (biomass, surface area, diameter, tissue density, and SRL) and rhizome (biomass, surface area, diameter, and tissue density) traits vary along a peatland permafrost thaw gradient, (2) the correlation of these belowground traits with CH4 fluxes, and (3) whether root and rhizome traits are strong predictors of CH4 flux during early, middle and peak CH4 flux during the productive season. We expected that root biomass, surface area and SRL would be highest at the intact and partly thawed permafrost stages due to lower soil moisture and high species diversity (Hough et al., 2022; Iversen et al., 2015; Keuper et al., 2017). We hypothesized that shrub rhizomes would be most abundant in the intact permafrost stage, whereas most herbaceous rhizome biomass would be found in the more thawed permafrost stage (Hough et al., 2022). We hypothesized that root and rhizome tissue density would decrease from intact to fully thawed permafrost due to increased soil moisture. We also expected that SRL would increase CH4 flux (Saarnio et al., 2004; Ström and Christensen, 2007; Wen et al., 2022), while tissue density would have negative relationships with CH4 fluxes throughout the productive season. We expected the trait-CH4 flux relationships to be stronger for herbaceous plants than for shrubs at the middle and peak CH4 flux periods, because herbaceous plants increase root biomass throughout the growing season in the tundra (Billings et al., 1978; Kummerow and Russell, 1980; Wang et al., 2016) whereas shrub root biomass can remain relatively constant (Wang et al., 2016).
2.1 Study area
The study area is the Stordalen mire in northern Sweden (68°22′ N 19°03′ E; Fig. 1). The mean annual temperature of the area was −0.5 °C and mean annual precipitation sum was 204 mm for period 1985–2023, based on measurements from a nearby meteorological station (Polarforskningssekretariatet and SMHI, 2025a, b). The area contains a permafrost thaw gradient ranging from palsa with intact permafrost to partly and fully thawed permafrost, each of which includes hydrological conditions and vegetation compositions typical for each thaw stage. The permafrost is largely intact in drained palsa with ericaceous shrubs (e.g., Empetrum nigrum, Andromeda polifolia, Rubus chamaemorus), hummock-forming Eriophorum vaginatum, mosses (e.g., Dicranum sp.) and lichens (Holmes et al., 2022; Hough et al., 2022; Malhotra and Roulet, 2015). In the partly thawed hydrologically perched stage, the vegetation is dominated by Sphagnum spp. and feather mosses as well as sedges, such as Eriophorum vaginatum and Carex rotundata, typical for ombrotrophic bogs (Holmes et al., 2022; Malhotra and Roulet, 2015). The fully thawed stage includes wet minerotrophic fens that have generally higher pH and their dominant vegetation includes Eriophorum angustifolium, Equisetum fluviatile and Carex rostrata (Holmes et al., 2022; Johansson et al., 2006; Malhotra and Roulet, 2015). In general, moisture increases from intact to fully thawed permafrost stages, due to improved connections to the ground water (2007–2017 mean annual water table level ± standard deviation at partly thawed stage: 9.1 ± 4.6 cm below peat surface, fully thawed stage: 2.1 ± 4.4 cm above peat surface) (Crill et al., 2023; Holmes et al., 2022; Malhotra and Roulet, 2015). The peat depth reaches down to 3 m and is underlain by silt (Johansson et al., 2006).
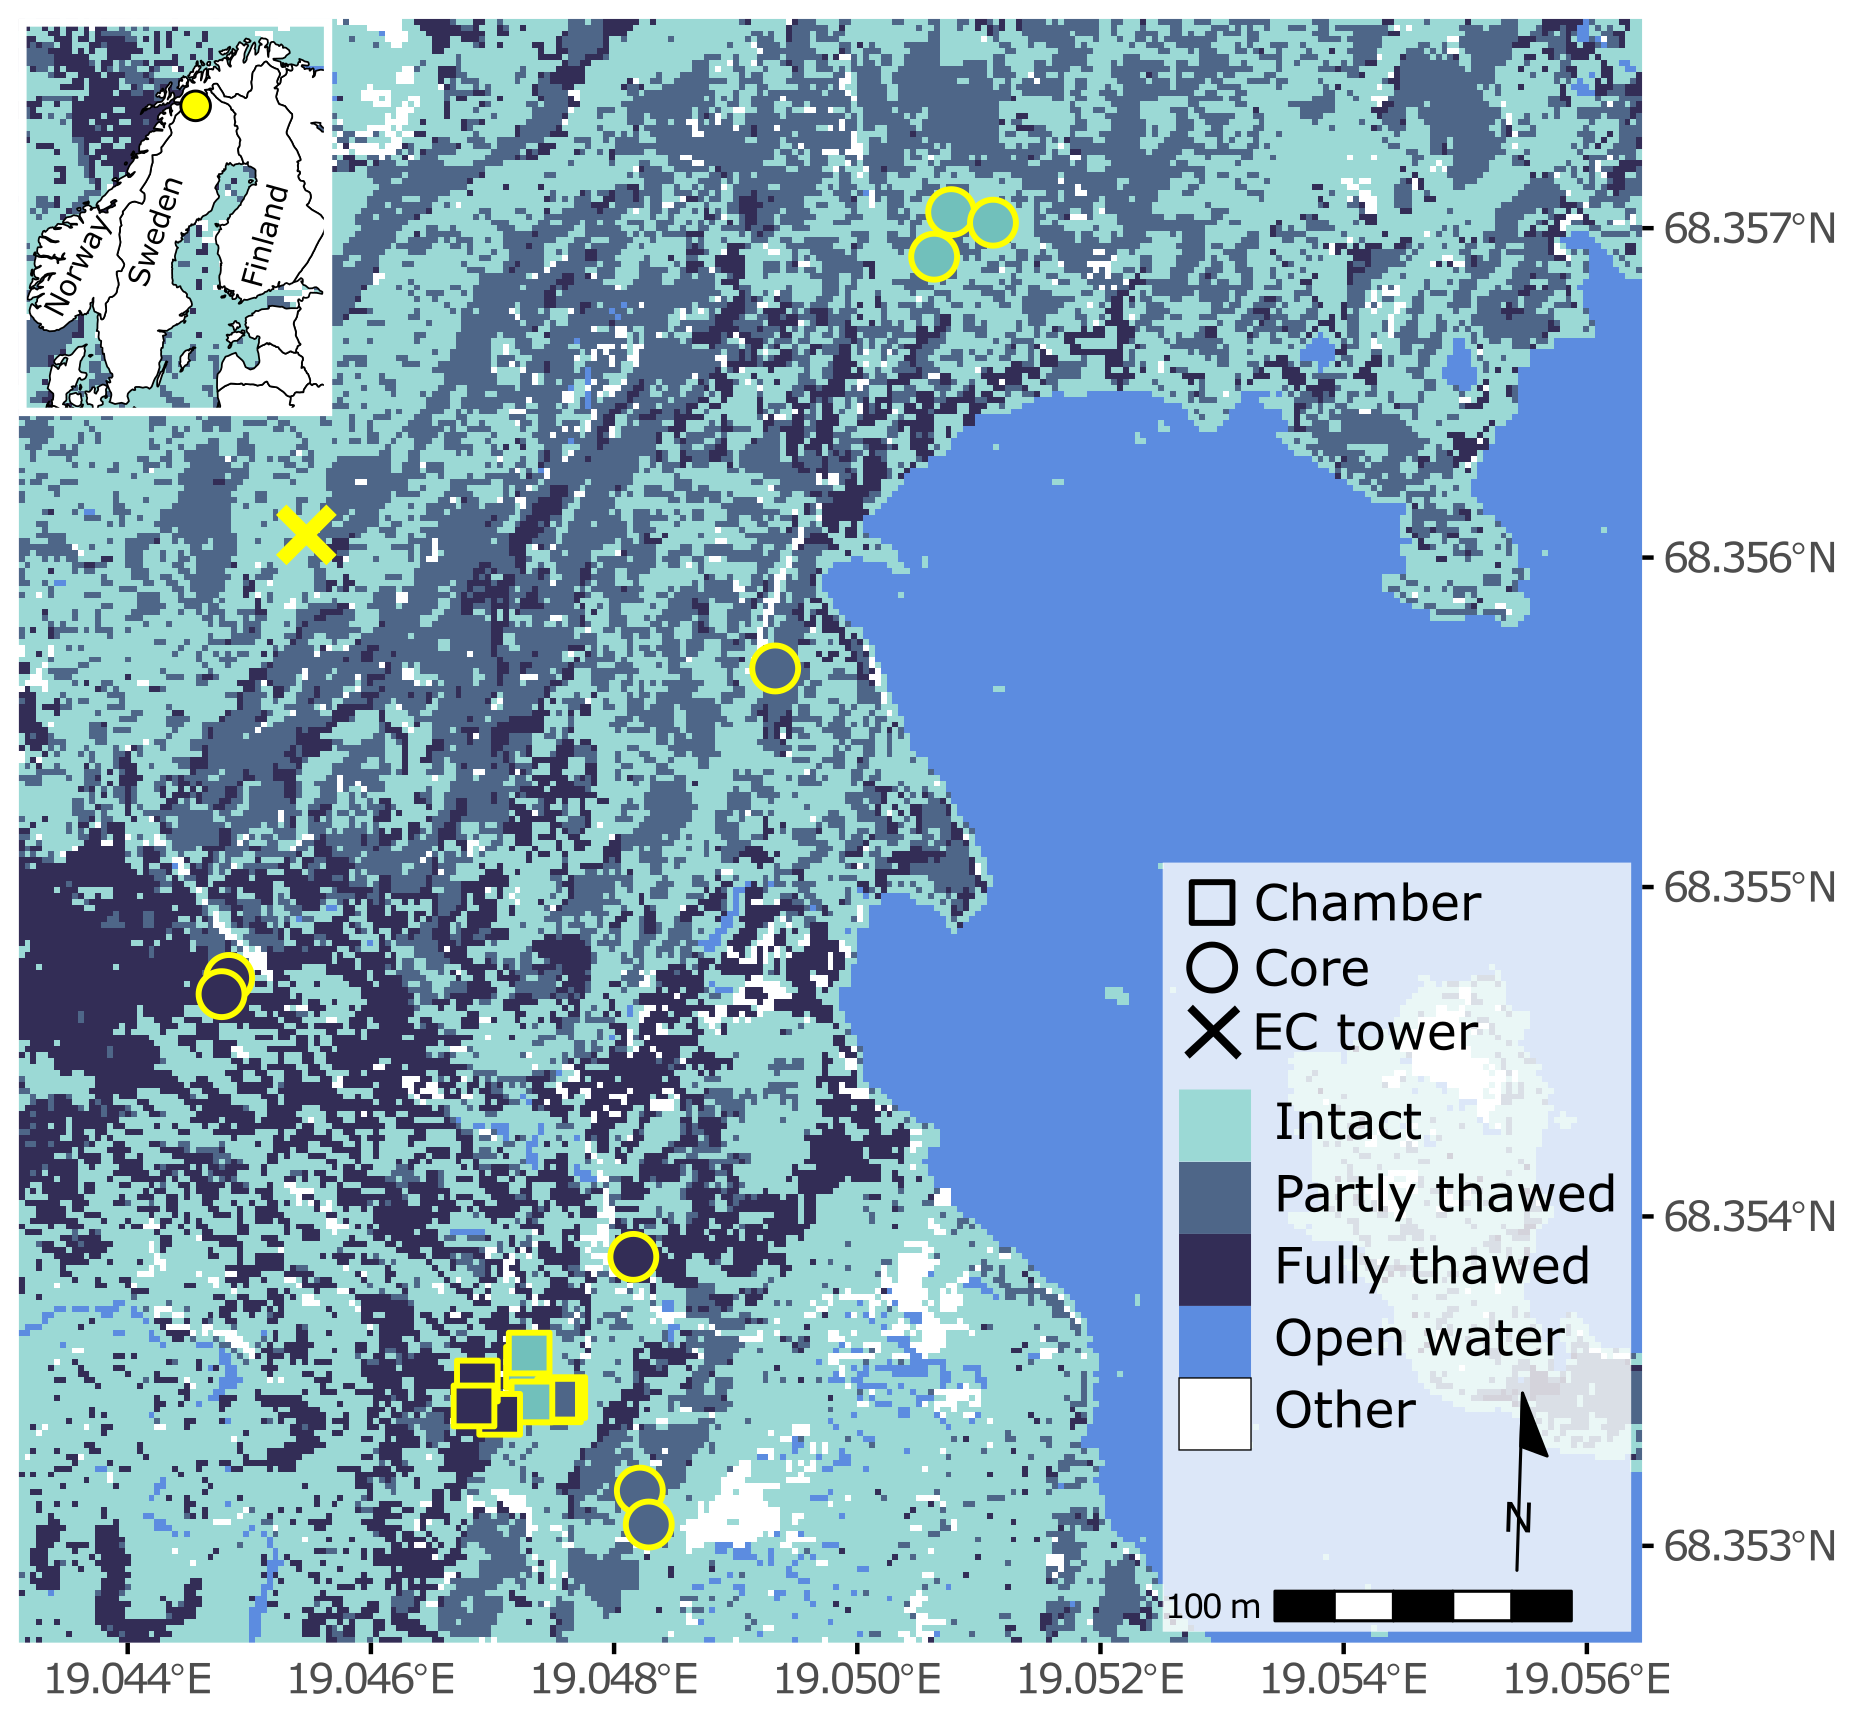
Figure 1Location of the Stordalen mire and CH4 flux and peat coring plots within the study area. Based on vegetation classification in 2014, the study area was classified into intact permafrost (tall shrub and hummock, in light blue), partly thawed permafrost (semi-wet and wet, in dark gray), fully thawed permafrost (tall graminoid, in dark blue), open water (bright blue) and other (rock and anthropogenic surfaces, in white) (Palace et al., 2018, 2022; Varner et al., 2022). Rectangles indicate automated chamber CH4 flux measurement plots, circles indicate peat coring plots, and the cross represents the eddy covariance tower (ICOS: SE-Sto).
2.2 Peat cores
We took peat cores using a push corer (d= 12 cm, length = 45 cm) to obtain plant material for belowground trait measurements. Despite destructive sampling being restricted, we were able to obtain three cores per thaw stage (n= 9 cores in total). In addition, peat coring was not possible next to the CH4 flux chambers and within the eddy covariance footprint, so we estimated the vegetation composition (vascular plant and moss species) in the chamber collars with vegetation surveys (point intercept method; Sect. A1, Table C1) and found representative vegetation patches for each chamber outside of the footprint. In the plot selection, emphasis was put on vascular plant species and secondarily on moss species cover. The peat cores were collected on the 21 July 2023. The tightly packed samples were put into a cooler with ice packs and stored frozen for four days. The samples were transported from Sweden to University of Zurich, Switzerland (11 h), and stored in a freezer in −20 °C until further processing.
2.3 Plant green area measurements
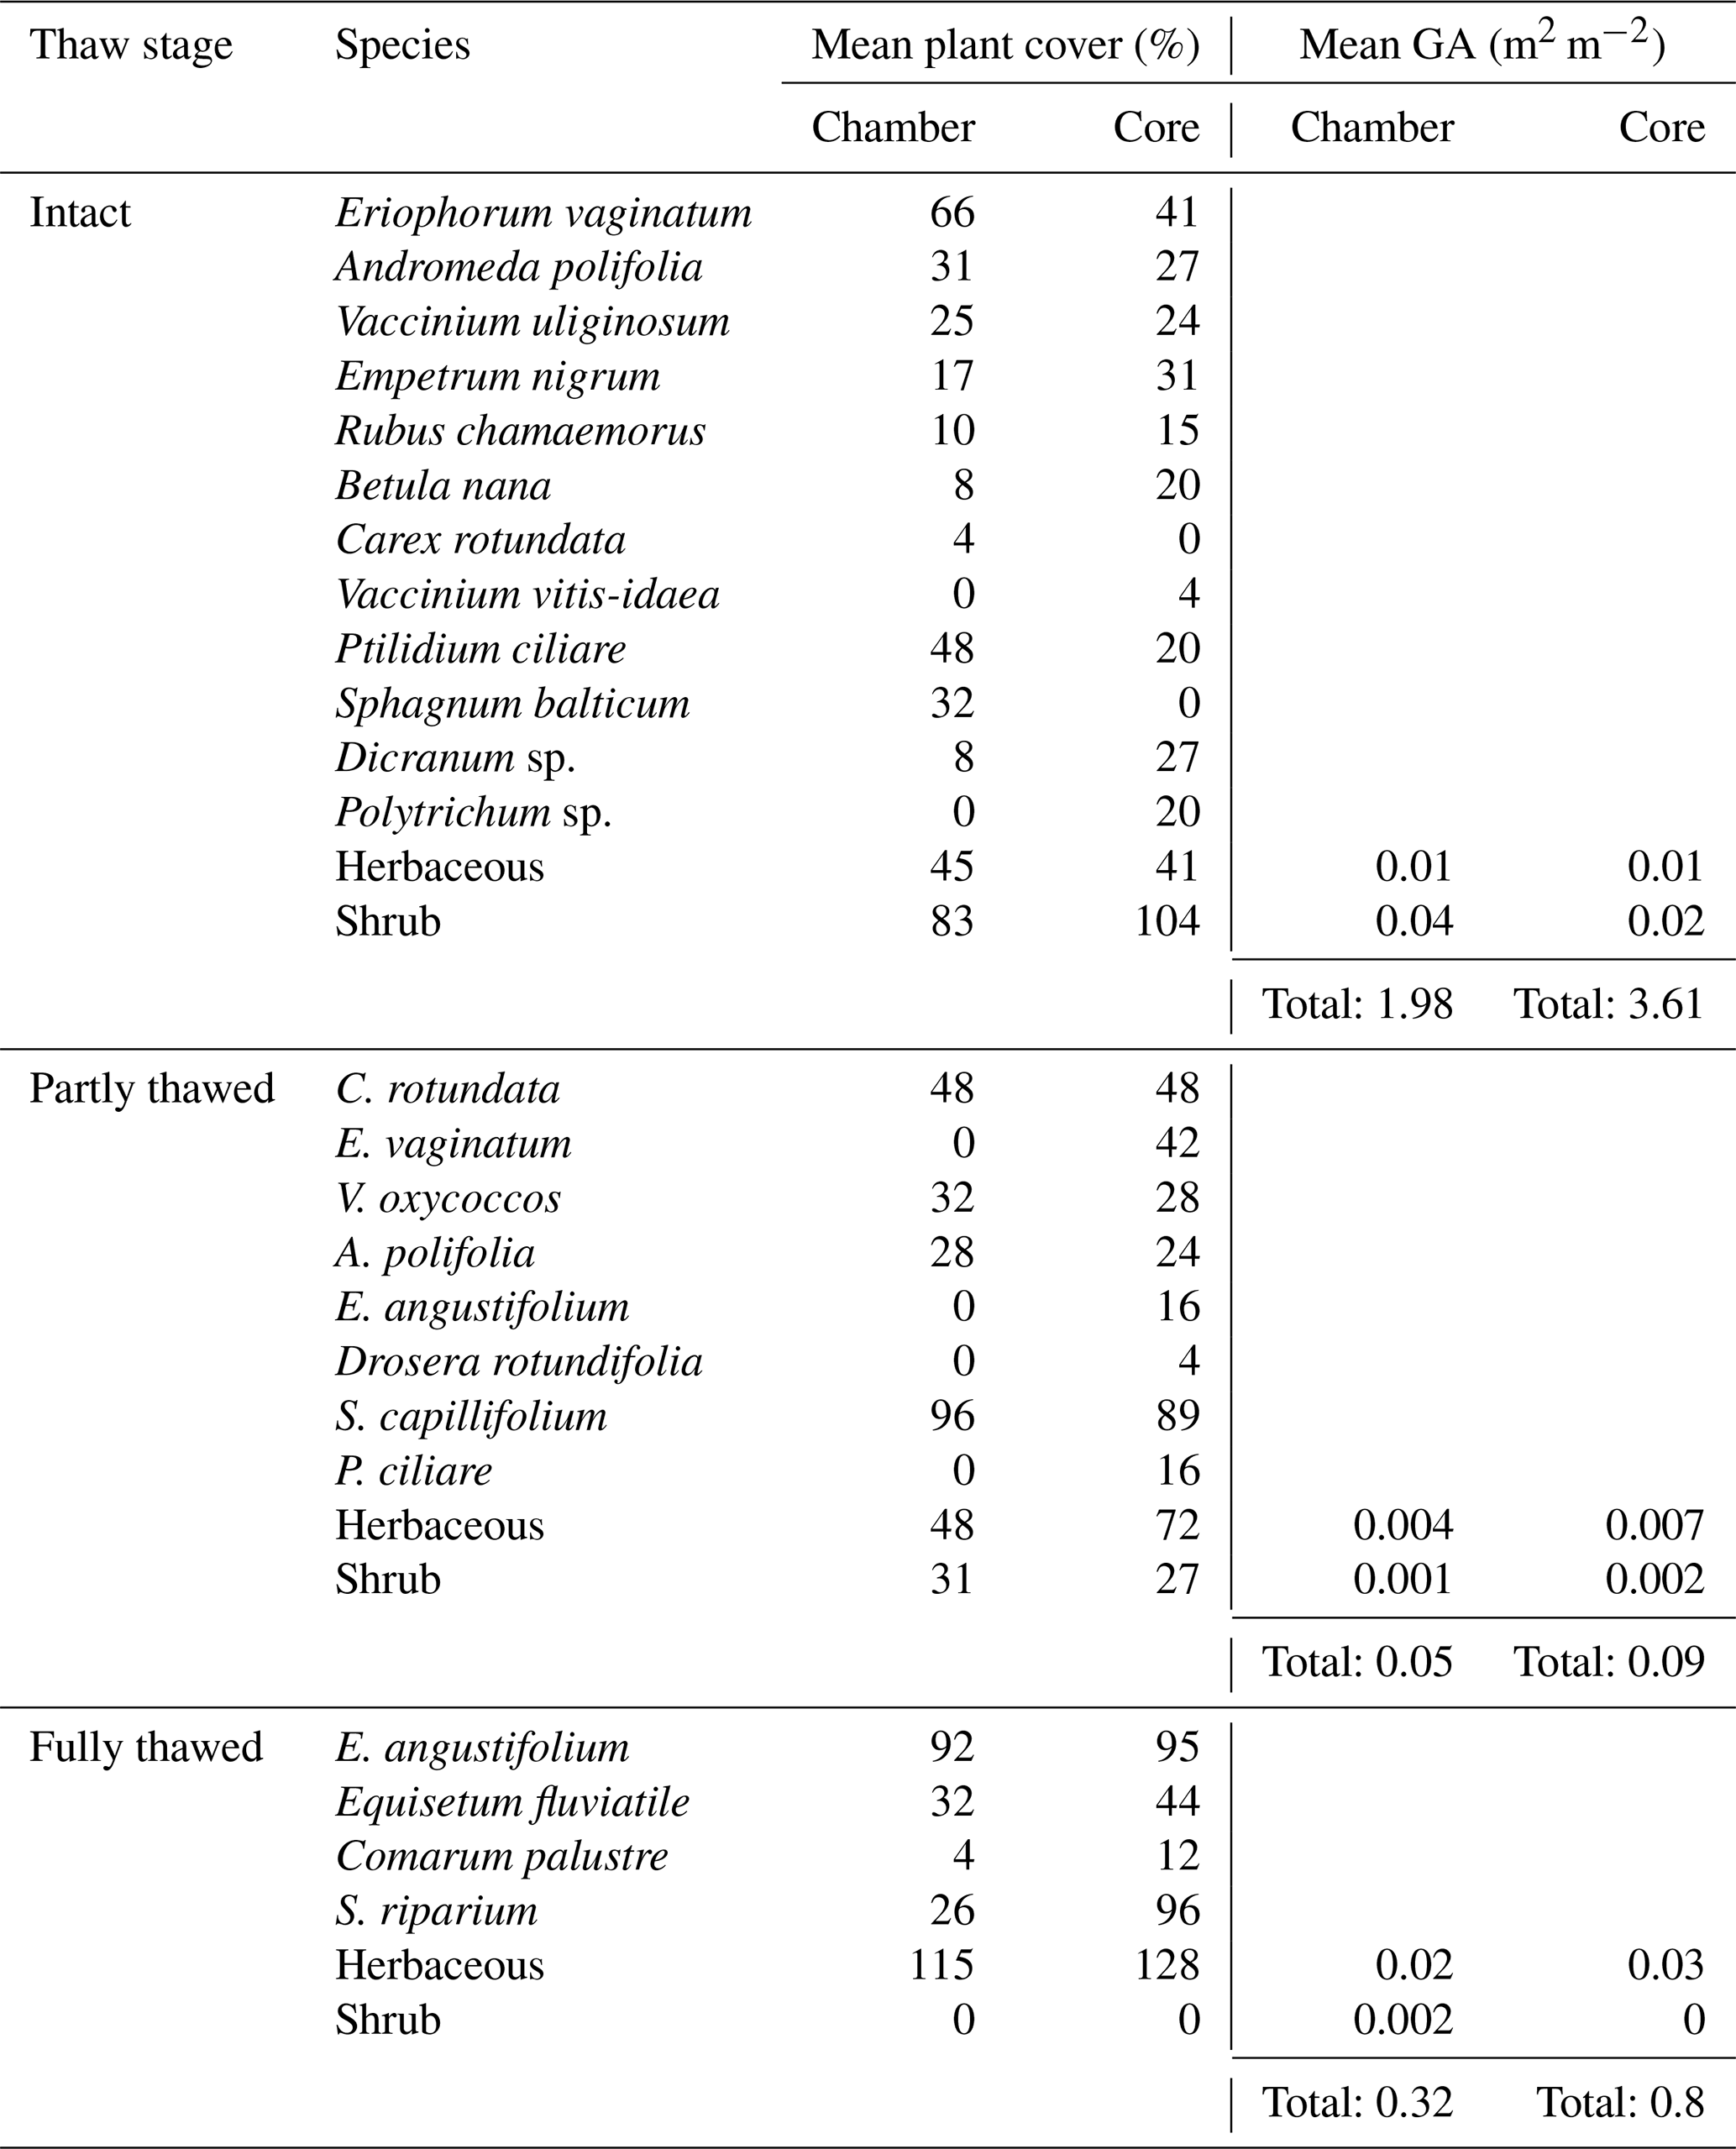
To compare the chamber and peat coring plots, and to provide a non-destructive aboveground plant trait comparison to the belowground traits, we estimated species-specific vascular plant green area (GA; Tables 1 and C2). We randomly assigned three (peat coring plots) to five (chamber plots) subquadrats (16.8×16.8 cm) of the vegetation survey grid (Sect. A1) for GA measurements using the function sample in R (R Core Team, 2025). We measured green leaf and stem dimensions (leaf width and length, stem length and diameter) per species within each subquadrat. We measured 10 leaves per species per subquadrat, with the exception of fully thawed stage chamber plots where we measured all leaves and stems. For E. nigrum, we estimated the total number of leaves by counting all the leaves of three stems roughly representing the majority of the stems within the subquadrat. We calculated species-specific leaf and stem area (m2) based on geometric formulae, and GA was estimated based on the average number of green leaves and stems per m2 multiplied by green leaf and stem area per m2 (Wilson et al., 2007). Since the leaves of Rubus chamaemorus did not fit into a simple geometric formula, we estimated their green area using photos taken above the survey grid and ImageJ.JS v0.5.8 (Ouyang et al., 2019; Schneider et al., 2012) (see mean GA per species in Table C2).
Table 1Vegetation characteristics at CH4 flux chambers and corresponding peat coring plots at each permafrost thaw stage (intact, partly and fully thawed). “Core” refers to the plots where peat cores were taken for root and rhizome samples. “Species” includes the species encountered in the vegetation survey (Sect. A1), while vascular plant green area (GA) measurements also included species that were not included in the plant cover measurements. “Total” in GA is the mean vascular plant GA across plots per thaw stage. See vegetation coverage at the plot level in Table C1.
2.4 Environmental variables
In order to compare the abiotic environmental characteristics of the peat coring plots with the chamber plots, we measured peat temperature (°C), pH, water table level (cm) and active layer depth (cm) at the individual plots (Table 2). Peat temperature was measured 2–3 times a day (08:00 a.m., 12:00 p.m., 05:00 p.m.) at 10 cm depth over a three-day period (23–25 July 2023) using a soil temperature probe (Testo 720, SN 03679207, Testo, Titisee-Neustadt, Germany). Active layer depth was measured with a metal rod.
Table 2Peat characteristics at CH4 flux chambers and peat coring plots per permafrost thaw stage (intact, partly and fully thawed). “Core” refers to the plots where peat cores were taken for root and rhizome samples. See peat characteristics at the plot level in Table C1. ± denotes one standard deviation of the mean. Peat temperature was measured at 10 cm depth. WTD = water table depth (cm from peat surface), VWC = volumetric water content. Note that WTD for chamber plots is the mean annual WTD across the 2007–2017 period per thaw stage (Crill et al., 2023), and that peat moisture was estimated as overall chamber medians of the 2024–2025 period (see Sect. 2.4).

We measured pH on 25 July 2023. For the intact and partly thawed plots, we took ca. 8.5 g of peat from 0.5 m distance from the chamber collar at ca. 5 cm depth (intact) or 7–10 cm depth (partly thawed). The pH was measured using a pH meter (826 pH mobile, SN 1826001012160, Metrohm, Herisau, Switzerland) and pH electrode (Polyplast, Ref 238380, SN13208, Hamilton, Reno, USA) by mixing the peat sample with CaCl2 solution (10 mL 0.01 mol L−1 CaCl2 per sample). At fully thawed plots, pH was measured directly from open water at ca. 5 cm depth. The electrode was always kept in liquid and when not in measurement solution, it was kept in a protective tube with KCl.
Half-hourly peat temperature data was measured with thermocouples installed at each chamber and acquired with CR10x data logger (Campbell Scientific Inc., UT, USA) (Bäckstrand et al., 2008; McCalley et al., 2014; Varner et al., 2026). As continuous soil moisture and water table level data were not available for the productive season in 2023, we used 10-year (2007–2017) water table depth (WTD) means and standard deviations per thaw stage from Crill et al. (2023) for a rough background estimate in soil moisture conditions. To estimate relationships between peat moisture and CH4 fluxes, we also obtained soil moisture (volumetric water content, %VWC; Biasi et al., 2026) estimates for each chamber using soil moisture sensors (TMS-4 Standard, TOMST s.r.o., Prague, Czech Republic; Wild et al., 2019) at ca. 8 cm depth at ca. 1 m distance from the chambers. The soil moisture values were calibrated to peat using the myClim R package (Man et al., 2023; Wild et al., 2019). To obtain a representative estimate of the central tendency of the dominant peat moisture conditions at each chamber, we used overall chamber medians of daily-aggregated values (non-normal and distributions varied between chambers) from the May–August 2024 and 2025 periods.
2.5 Root and rhizome trait quantification
We cut the frozen peat cores horizontally into minimum 10 cm increments, and then further into four vertical parts (ca. 25 %) using a bandsaw. We randomly chose one of the quarters as a subsample for trait measurements. We thawed the subsamples in a refrigerator over 2–3 d and separated the aboveground vascular plants (see species-specific biomass in Table C3). We picked all living roots (light in color and elastic) and rhizomes (stiff, firm bark) from the subsample using tweezers and jeweler's glasses (2.5× magnification). Due to the very high amount of shrub roots, we took a further subsample (ca. 15 g fresh weight) from which we picked all shrub roots. We cleaned the roots and rhizomes with deionized water and grouped them into herbaceous and shrub PFTs based on a combination of branching patterns, color, and thickness (e.g., shrub roots were generally thinner and had higher branching density than herbaceous roots). The forb Rubus chamaemorus was grouped into shrub PFT (e.g., Blume-Werry et al., 2019), due to root identification challenges. We did not separate coarse and fine roots but instead focused on the average root system properties. The picked roots were stored in 70 % ethanol in a refrigerator (4 °C, max. 4 months).
We put the cleaned roots and rhizomes on a transparent tray filled with deionized water and scanned them with an Epson Perfection V700 Photo scanner (Epson, Japan), and analyzed them for root length, surface area and volume using WinRhizo Pro software (v. 2003b, Regent Instruments Inc., Québec, Canada). We used 1400 dpi for shrub roots with very fine roots (< 1 mm), 600 dpi for herbaceous roots, and 100–300 dpi for rhizomes. When rhizome length and diameter were not accurately calculated by WinRhizo, we measured them manually using ImageJ.JS. Then, all roots and herbaceous rhizomes were dried in 70 °C and woody shrub rhizomes in 102 °C for 4 d and weighed at 0.00001 g precision to obtain root and rhizome dry weight. To obtain a proxy of belowground gas transport potential (i.e., porosity), we calculated root and rhizome tissue density (TD, g cm−3) by dividing their dry weight by fresh volume. For shrub rhizomes, the TD represents all the different rhizome tissues (e.g., bark, wood and pith). While this is not a direct measurement of the gas transport ability of a woody rhizome, low tissue density could indicate increased rhizome aeration (e.g., pith cavities) and possibly gas transport (Vroom et al., 2022). Specific root length (SRL, m g−1) was calculated by dividing total root length by its dry weight.
Since peat core depths varied between plots, we standardized root total length (m m−2), biomass (g m−2) and surface area (SA, m2 m−2) to 30 cm depth by taking into account core volume and peat bulk density. We also standardized the traits to 10 cm depth for depth-specific analyses. In addition, shrub root and rhizome biomass, length and SA were scaled from the sub-subsample to the increment level and to 30 cm standardized depth. We calculated root and rhizome volumes by summing diameter-class-specific volumes from WinRhizo (Rose, 2017). All traits were calculated per PFT but also summed (biomass, length, and SA) or biomass-weighted (TD, SRL, diameter) to get an across-PFTs trait estimate. We used the rest of the peat core sample (remaining ca. 75 %) to determine peat bulk density and gravimetric water content (GWC). We thawed the sample in a refrigerator over 2–3 d, removed the aboveground vascular plants, took a 5 ± 0.2 g subsample, and took its fresh and dry weight to obtain bulk density and GWC.
2.6 CH4 flux measurements
CH4 flux data were obtained from automated chambers (Varner et al., 2026). The details of the chamber measurement system in general are presented in Bäckstrand et al. (2008). In 2012, the chambers were replaced to similar design as in Bubier et al. (2003). In each thaw stage (intact, partly and fully thawed), three transparent automated gas flux chambers (basal area: 0.2 m2, height: 15–75 cm) measured CH4 and CO2 every three hours with 5–8 min enclosure time and 5 min air flushing before and after closure (Bäckstrand et al. 2008; Holmes et al. 2022). The CH4 concentrations were measured with a Los Gatos Research Fast Greenhouse Gas Analyzer (Los Gatos Research Inc, Los Gatos, CA, USA) and the timing control and data acquisition was done with Campbell CR10x data logger (Campbell Scientific, Logan, UT, USA), which was located inside a temperature-controlled cabin. The CH4 flux data were fit using linear regression. The data were quality-checked using regression diagnostics where CH4 fluxes outside of significance thresholds at 95 % and 90 % confidence levels were filtered out (Snedecor and Cochran, 1989), as well as manual quality flags that were used to filter out data points affected by known instrumental issues.
We aggregated the higher frequency CH4 flux data to daily scale by taking the daily CH4 flux median. Median was chosen to estimate the central tendency of CH4 fluxes due to skewed and non-normal flux data distributions, and to avoid the disproportionate influence of short-lived high CH4 flux events that may not be related to belowground plant-mediated CH4 cycling processes that were the main perspective of this study. Then, we subset the daily-aggregated chamber CH4 flux data to contain the dates of the productive season in 2023. We defined the productive season as the period between the first and last passing of daily median net ecosystem CO2 exchange (NEE) past zero, as this can be considered as the plant active season relevant for plant-mediated CH4 fluxes (Körner et al., 2023). For NEE, we utilized the half-hourly gap-filled NEE (NEE_VUT: estimated across 40 friction velocity threshold realizations for each year according to FLUXNET data processing protocols; quality flags = 3 filtered out) from the ICOS Abisko-Stordalen Palsa Bog (SE-Sto) eddy covariance data processed with FLUXNET standards (Lundin et al., 2023; Pastorello et al., 2020). The resulting productive season used for CH4 flux data subsetting was 19 May 2023 to 30 August 2023 (Fig. B1). As a background proxy for potential plant carbon substrate provision and plant-mediated gas transport (Knox et al., 2021), we also utilized the half-hourly gap-filled gross primary production (GPP; GPP_NT_VUT: nighttime partitioning at the daily scale and GPP_DT_VUT: daytime partitioning with light response curves at the hourly scale, with variable friction velocity thresholds implemented as an ensemble of 40 friction velocity thresholds by the FLUXNET team; see Lundin et al., 2023 and Pastorello et al., 2020 for details) data from Lundin et al. (2023). However, it is important to note that the EC tower footprint covers only intact and partly thawed stages and does not estimate the NEE and GPP for the fully thawed stage (Łakomiec et al., 2021). To explore the possible diurnal-scale plant-mediated CH4 transport as a supporting analysis, we also aggregated CH4 fluxes to the hourly scale using means and medians (Fig. B1).
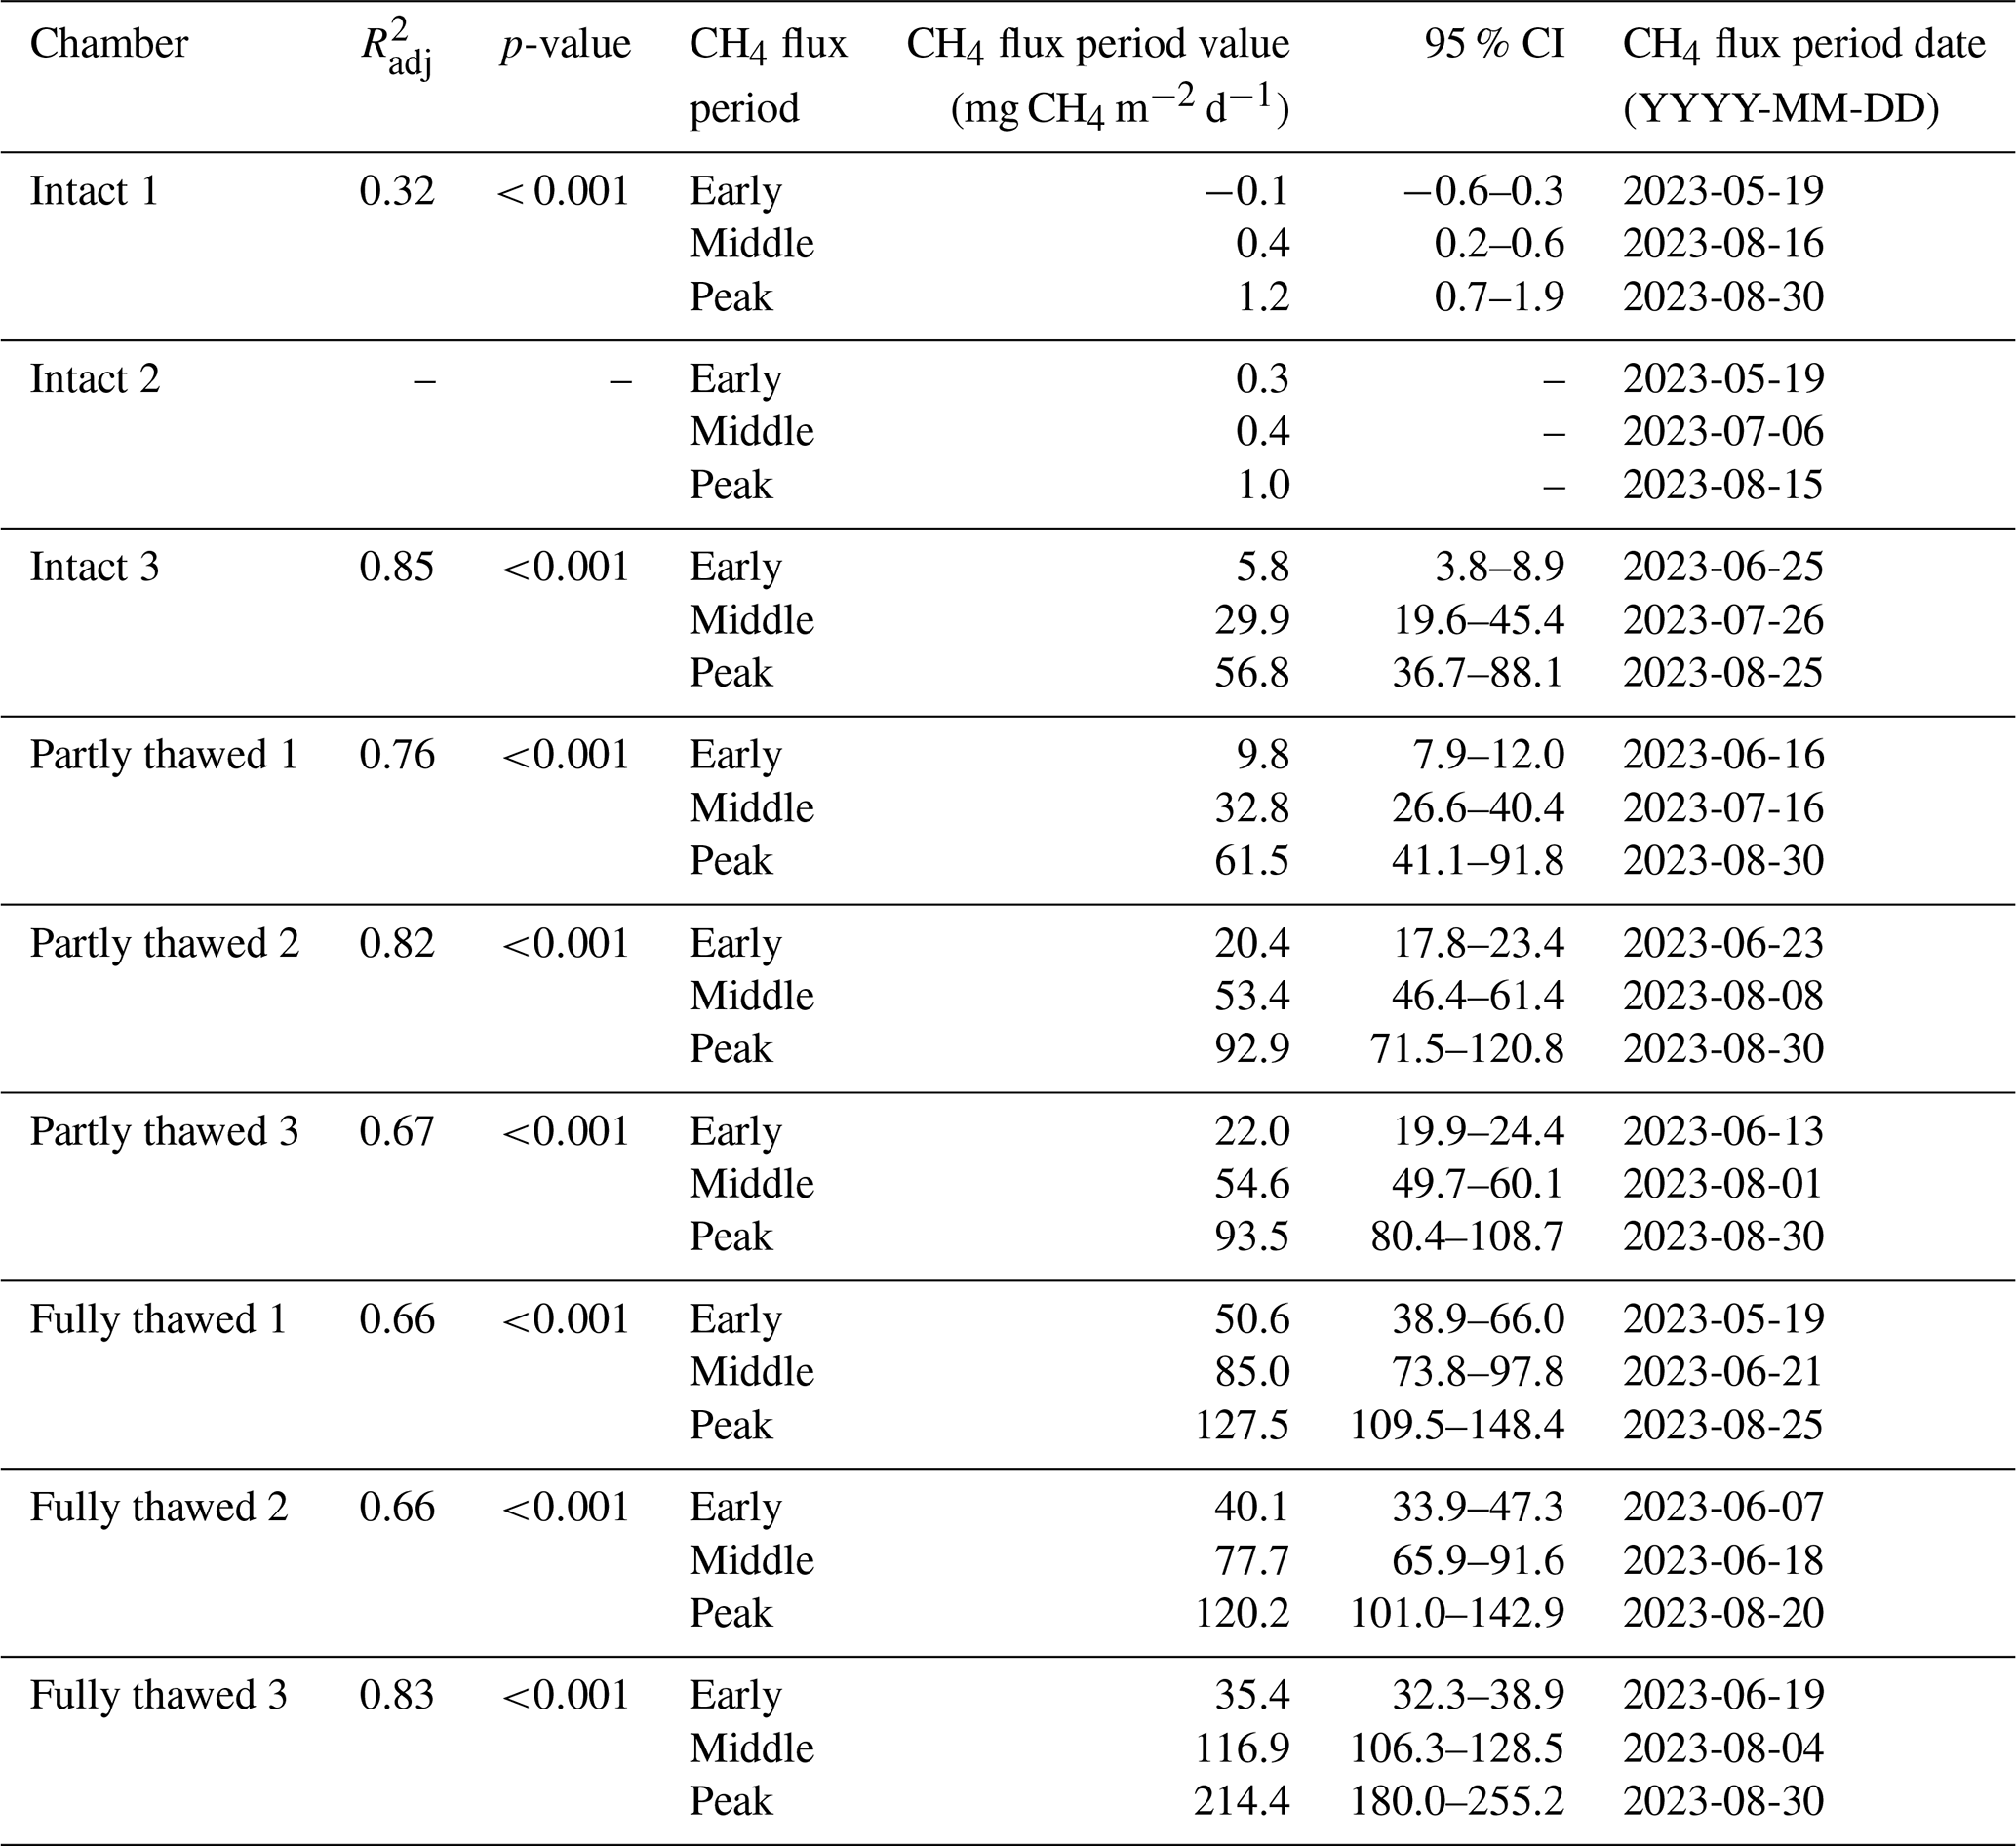
To explore the variation in the trait-CH4 flux relationships during the productive season, we calculated CH4 flux period values (early, middle and peak CH4 flux) by fitting Gaussian generalized additive models (GAM) with identity link function for daily median CH4 flux data per chamber with function gam from package mgcv (Wood, 2011, 2017). In the models used for determining CH4 flux period values, CH4 flux (response variable) was transformed to approximate normality using inverse hyperbolic sine and date was included as an explanatory variable in a thin plate regression spline. Following an approach similar to TIMESAT (Eklundh and Jönsson, 2015; Jönsson and Eklundh, 2002) and Delwiche et al. (2021), CH4 flux period values were calculated as follows: (1) peak CH4 flux: the highest predicted CH4 flux value during the productive season, (2) early CH4 flux: the point where the predicted daily CH4 flux reached 10 % of the peak CH4 flux for the first time, and (3) middle CH4 flux: the point where the predicted daily CH4 flux reached 50 % of the peak CH4 flux for the first time. We also calculated the whole season median to represent the whole productive season CH4 flux estimate per chamber. Since one chamber at intact permafrost thaw stage had GAM R2 < 0.1, we used a moving 7 d median to estimate the early, middle and peak CH4 season values. See details of GAM fit in Table C4.
2.7 Porewater CH4 concentration and isotopic measurements
Data of porewater CH4 and CO2 concentrations, δ13CH4 and δ13CO2 were obtained from Wilson et al. (2026). The porewater samples were collected from the field near the automated flux chambers using stainless steel sippers on 25 and 26 July 2023. The bottom of the sippers is perforated, and a syringe is attached to the top of the sipper via a stopcock. The sipper was inserted in the peat to the desired depth (0–4, 10–14, 20–24, 30–34, 40–44, 50–54, 60–64, 70–74, and 80–84 cm below peat surface) and the syringe was used to carefully draw up 30 mL of porewater. The porewater was then injected into pre-evacuated sealed glass serum vials. Phosphoric acid (1 mL, 10 %) was added to each vial to preserve the samples and ensure that all dissolved inorganic carbon was in the form of dissolved CO2 in equilibrium with gaseous CO2. Porewater CO2 and CH4 concentrations and isotopes were analyzed simultaneously via headspace analysis, corrected for solubility using Henry's Law, on a Finnigan Mat Delta V Isotope Ratio Mass Spectrometer coupled to a gas chromatograph (Merritt et al., 1995). The analytical uncertainty based on repeated measurements of a standard was < 0.15 ‰ for δ13CO2 and δ13CH4 and <5 % for CO2 and CH4 concentrations. To obtain a robust estimate of the isotopic fractionation between CO2 and CH4, we calculated the isotope fractionation factor (αC) (e.g., Hodgkins et al., 2014; McCalley et al., 2014) with the following formula:
2.8 Statistical analysis
To confirm the similarity of the peat core (n= 9) and CH4 flux plots (n= 9), we used principal component analyses (function PCA from package FactoMineR; Lê et al., 2008), PERMANOVA (function adonis2 from package vegan; Oksanen et al., 2025), and Euclidean distances between plots within thaw stages, using normalized plot herbaceous and shrub plant cover and GA, mean peat temperature and pH (see Fig. B2).
For assessing general differences in daily median CH4 flux between thaw stages across the productive season, we built linear mixed effects models where CH4 flux was the response variable and thaw stage (factor) was the explanatory variable, and chamber (n= 3 per thaw stage) was the random effect. To account for the normality of residuals and chamber-dependent temporal autocorrelation, we applied inverse hyperbolic sine transformation to CH4 fluxes, and modeled temporal autocorrelation with autoregressive autocorrelation structure of order 1 (corAR1). We built three different models, where each had either intact, partly or fully thawed permafrost stage as the reference level and fit the model with restricted maximum likelihood and obtained p-values (α= 0.05) from Wald t-test. Linear mixed effects models were built with function lme from package nlme (Pinheiro and Bates, 2000; Pinheiro et al., 2023).
Due to the small sample size (n= 3 per thaw stage), we were unable to test for statistical differences in belowground traits between thaw stages and sampling depths (traits, porewater CH4 concentration and isotopic data) and relied on descriptive methods. However, to explore the general direction and strength of the relationships between root and rhizome traits and CH4 fluxes (early, middle, peak, and season median) across the thaw stages, we used linear regressions with centered and scaled trait and CH4 flux values. Only models which did not violate assumptions of homoscedasticity, linearity and normality of residuals were included in the analyses. In cases with little trait variation within each thaw stage, pseudoreplication was considered too severe for reliable model estimates, and these model results were not reported. We focused on model R2, slopes, and model p-values. In cases where linear regressions were unreliable or violated the model assumptions, we explored the relationship strength with Kendall τ correlation coefficients. We acknowledge that the model and correlation estimates can be unstable with small sample size and thus use them as descriptive exploratory tools for estimating the changes in the general directions of the trait-CH4 flux relationships across thaw stages during the productive season. All data processing and statistical analyses were conducted in R v4.5.1 (R Core Team, 2025).
3.1 More herbaceous roots with decreasing tissue density
Belowground traits varied between thaw stages, and the biomass-weighted traits followed shifts from shrub- to herbaceous-dominated plant communities (Fig. 2, Table C1). Summed root biomass and surface area (SA) were 22.2× and 17.0× lower, respectively, at the fully thawed than intact stage, but herbaceous root biomass (mean: 238.3 ± 172 g m−2) and SA (mean: 19.9 ± 13 m2 m−2) were highest at partly thawed stage. Total shrub root length reached a very high mean of 178.62 km m−2 and a maximum of 199.7 km m−2 in the intact stage, substantially higher values than for herbaceous roots (mean: 19.79 km m−2 and max 33.33 km m−2 in the partly thawed stage) (Fig. B4). While shrub rhizome biomass and SA decreased from intact to partly thawed stage, herbaceous rhizomes showed an opposite trend (e.g., mean SA 0.13 ± 0 to 3.41 ± 0.08 m2 m−2, 26-fold increase). Notably, herbaceous root and rhizome tissue density (TD) were 1.5× and 2.4× lower in fully thawed than in intact permafrost, respectively (mean ± standard deviation root 0.004 ± 0.0008 to 0.003 ± 0.0002 g cm−3; rhizome 0.2 g cm−3 ± 0 to 0.08 ± 0.01 g cm−3), and these decreases were reflected in the biomass-weighted values (root: 1.5× lower, rhizome: 7.4× lower). While specific root length (SRL) was highest at partly thawed stage (mean shrub 193.6 ± 32 m g−1, 1.4× higher than at intact; mean herbaceous 71.6 ± 35 m g−1, 2.3× and 1.2× higher than at intact and fully thawed, respectively), the biomass-weighted means showed a 2.2-fold decrease from intact to fully thawed stage.

Figure 2Belowground traits varied between thaw stages. Root traits (a–e) are shown in the top row and rhizome traits (f–i) in the bottom row. Large points represent group means, small points plot-scale measurements, and error bars ±1 standard deviation of the mean. The colors represent plant functional types (PFT; dark grey: herbaceous, light grey: shrub, white: PFTs combined). Trait values for combined PFTs were summed herbaceous and shrub values (a, b, f, g) or biomass-weighted means between herbaceous and shrub PFTs (c–e, h, i).
Most of the root biomass was found in the top 10 cm for shrub (coefficient of variation CV and mean for intact: 69 %, 766.0 ± 155 g m−2; partly thawed: 67 %, 65.1 ± 28 g m−2) and herbaceous PFTs (CV and mean intact: 56 %, 17.5 ± 9 g m−2, partly thawed: 45 %, 86.4 ± 89 g m−2, fully thawed: 73 %, 27.7 ± 20 g m−2) (Fig. B3). Shrub roots reached the maximum total length of 167.3 km m−2 at top 10 cm at the intact stage (Fig. B4). SRL and root TD varied less with depth across thaw stages (max CV SRL: 51 %, TD: 31 %; partly thawed herbaceous). All herbaceous rhizomes were present in the top 10 cm (mean biomass intact: 11.5 ± 0 g m−2, partly thawed: 101.9±109 g m−2, fully thawed: 107.8 ± 12 g m−2, Fig. B5). Most of the shrub rhizomes were located in the top 10 cm (CV and mean biomass intact: 78.5 %, 392.4 ± 227 g m−2; partly thawed: 66.7 %, 93.9 ± 15 g m−2), but they were also found in 10–20 cm depth (mean intact: 109.4 ± 154 g m−2, partly thawed: 28.9±0 g m−2).
3.2 Root tissue density, specific root length and diameter correlated best with CH4 fluxes
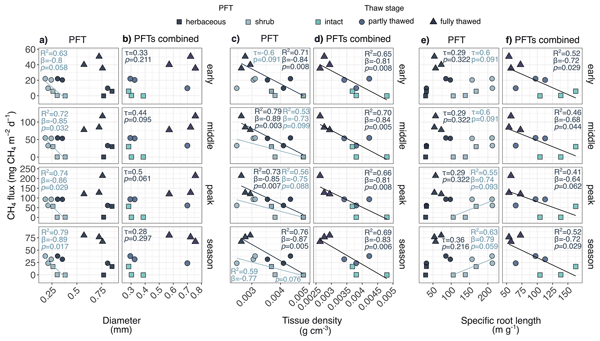
The relationships between root traits and CH4 fluxes (CH4 flux difference between intact, partly and fully thawed p<0.01, fully and partly thawed p>0.05, Sect. A2) differed between PFTs but with little temporal variation. Increasing root TD was associated with decreasing CH4 flux for herbaceous (min standardized regression beta coefficient, β at peak CH4, max β at middle CH4) and shrub PFTs (min β at middle CH4, max β at CH4 season median) (Fig. 3). Shrub root diameter had negative (min β at early CH4, max β at CH4 season median) and SRL positive (min β at peak CH4, max β at CH4 season median) associations with CH4 fluxes. In general, the direction and strength of the relationships between root traits and CH4 fluxes did not vary strongly across CH4 flux season values (Figs. 3, B6).
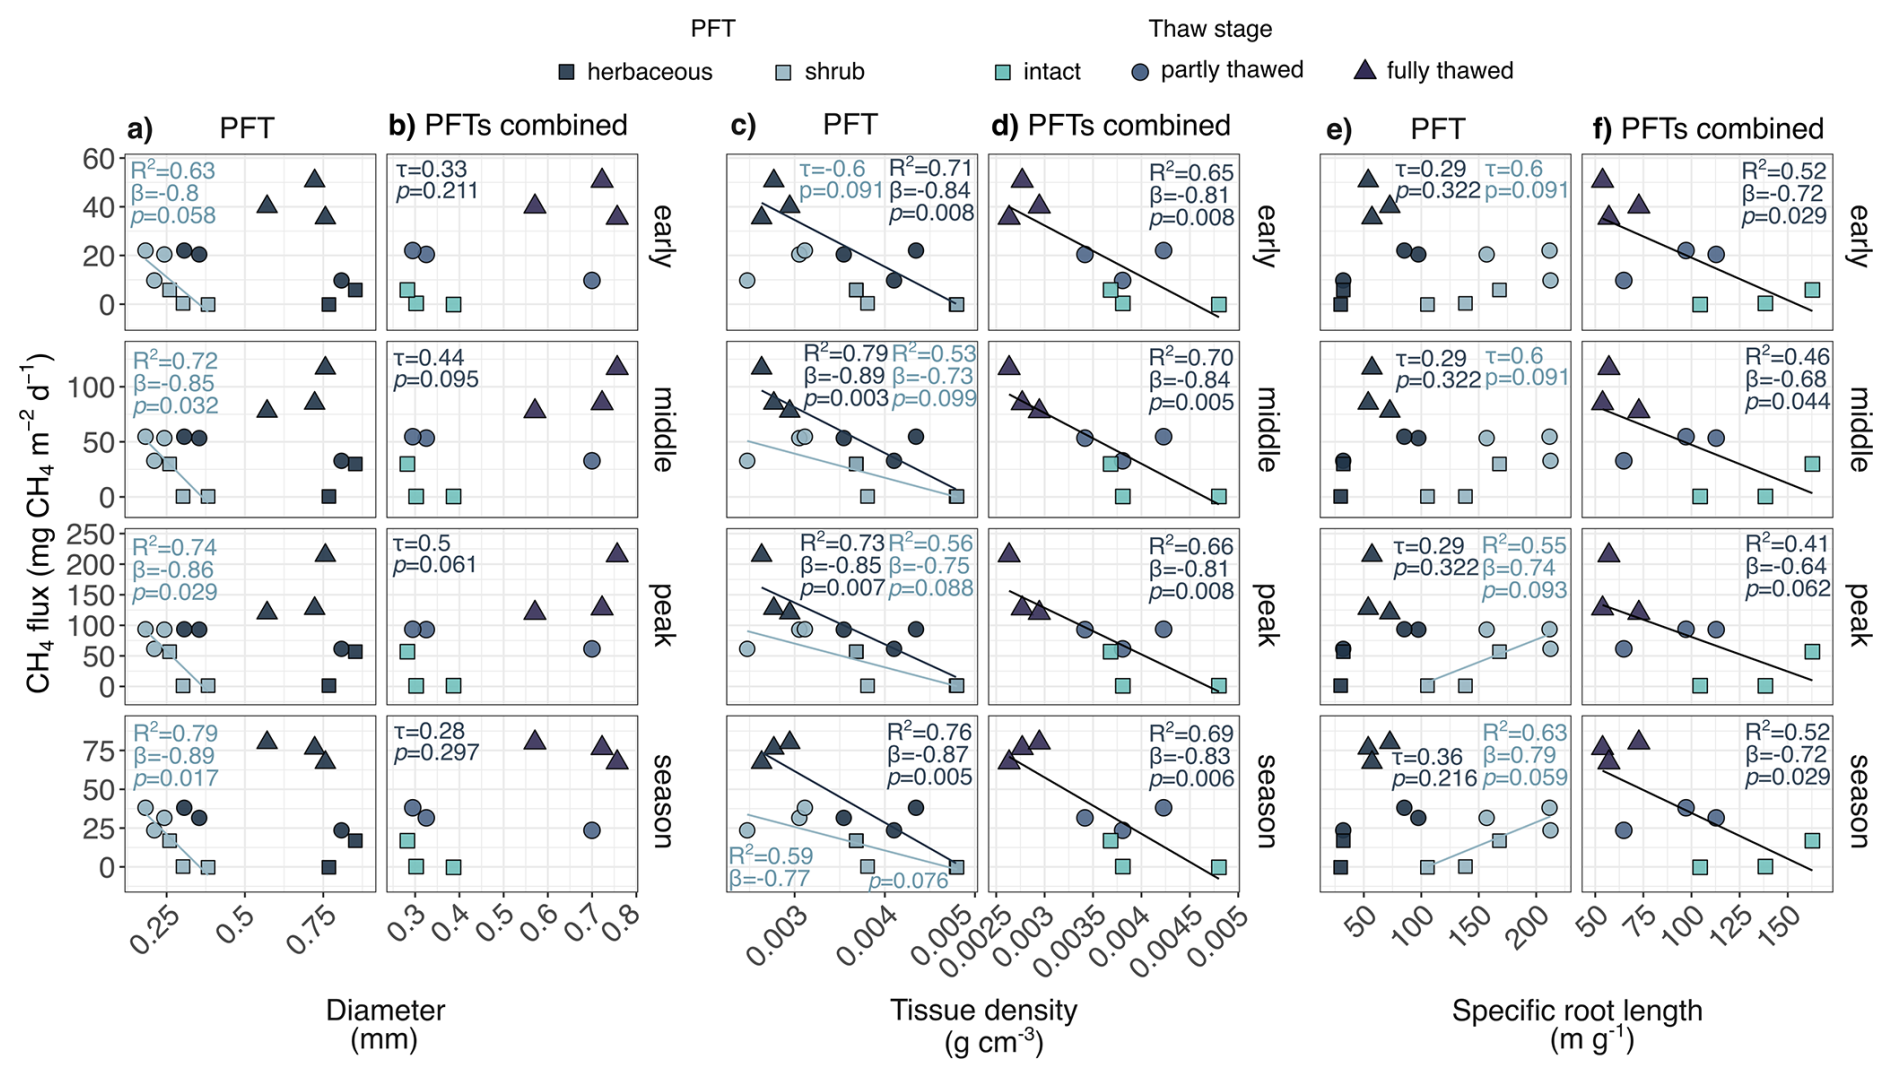
Figure 3Root tissue density, diameter, and specific length showed strongest relationships with CH4 fluxes. (a–b) Relationships between root diameter and CH4 fluxes (early, middle, peak and season) per plant functional type (PFT; a) and across PFTs (biomass-weighted means; b). (c–d) Relationships between root tissue density and CH4 fluxes per PFT (c) and across PFTs (biomass-weighted means; d). (e–f) Relationships between specific root length and CH4 fluxes per PFT (e) and across PFTs (biomass-weighted means; f). In (a), (c) and (e), dark gray: herbaceous plants, light gray: shrubs. In (b), (d) and (f), light blue rectangle: intact, grey circle: partly thawed, dark purple triangle: fully thawed stage. In all plots (a–f), lines represent linear regression for visualization, while R2 and standardized effect size/slope (β) are based on linear regressions with centered and scaled trait and CH4 flux values (lines, R2 and β are only shown when R2>0.2, model p<0.1, and the linear regression model assumptions were met). Kendall's τ is shown for relationships where linear regression model assumptions were not met and τ≥0.2 (note that due to the low sample size, p-values should be interpreted with caution). See relationships between root biomass, surface area and CH4 fluxes in Fig. B6.
PFTs combined, all root traits except diameter showed negative trends, where the strongest relationships were for root TD (min β at early and peak CH4, max β at middle CH4) (Fig. 3). In addition, summed root biomass and SA showed relatively strong negative relationships, with biomass showing slightly stronger negative relationships than SA (biomass: min Kendall's τ at early CH4, max τ at middle CH4; SA: min τ at early CH4, max τ at peak CH4) (Fig. B6).
Herbaceous and shrub rhizome traits showed contrasting relationships with CH4 fluxes (Figs. 4, B7). Herbaceous rhizome biomass and SA showed positive relationships with CH4 fluxes, with stronger trends for SA (SA: min β at peak CH4, max β at CH4 season median). Increases in herbaceous rhizome diameter were also associated with slightly higher CH4 fluxes (min τ at early to peak CH4, max τ at CH4 season median). In contrast, shrubs had negative trends between rhizome biomass and CH4 fluxes (min τ at early, middle and season median CH4, max τ at peak CH4; Fig. B7). While summed rhizome SA did not show clear trends (Fig. 4), higher summed rhizome biomass was associated with lower CH4 fluxes (nonsignificant β at early CH4, max β at peak CH4; Fig. B7), while the relationship between rhizome diameter and CH4 flux was positive (min τ at early and middle CH4, max τ at peak and season median CH4) (Fig. 4).
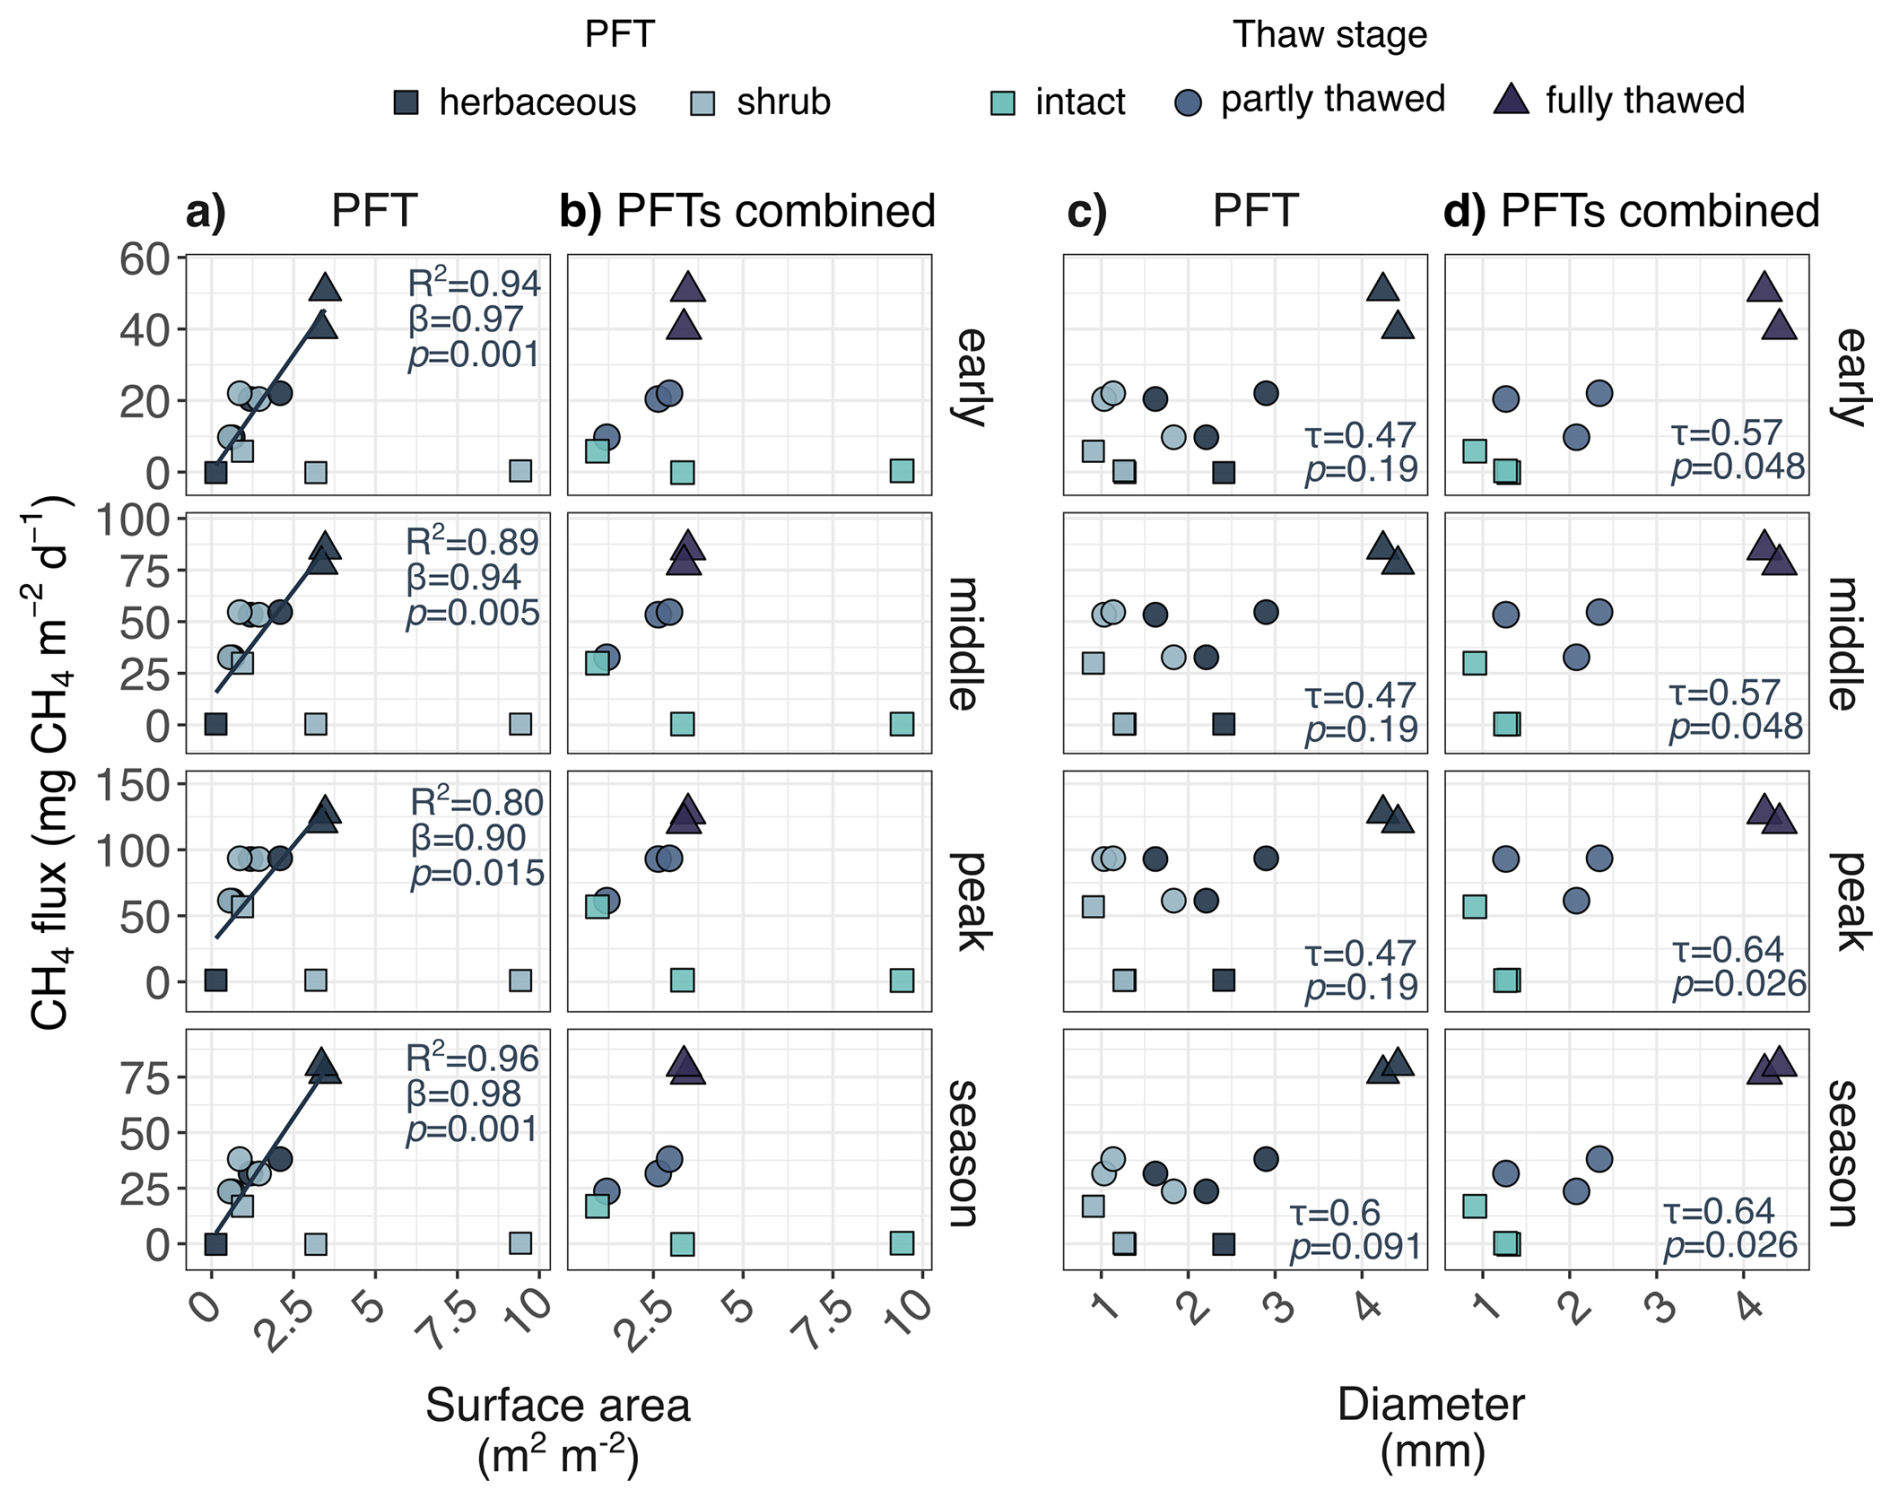
Figure 4Relationships between rhizome traits and CH4 fluxes were strongest for surface area and diameter. Columns (a–b) Relationships between rhizome surface area and CH4 fluxes (early, middle, peak and season; rows) per plant functional type (PFT; a) and across PFTs (summed; b). Columns (c–d) Relationships between rhizome diameter and CH4 fluxes per PFT (c) and across PFTs (biomass-weighted means; (d). In (a) and (c), dark gray color represents herbaceous plants while light gray represents shrubs. In (b) and (d), light blue rectangles represent the intact permafrost, dark blue circles represent the partly thawed stage, and dark purple triangles represent the fully thawed stage. Lines represent linear regressions for visualization, while R2 and standardized effect size/slope (β) are based on linear regressions with centered and scaled trait and CH4 flux values (lines, R2 and β are only shown when R2>0.2, model p<0.1, and the linear regression model assumptions were met). Kendall's τ is shown for relationships where linear regression model assumptions were not met and τ>0.2. See relationships between rhizome biomass, tissue density and CH4 fluxes in Fig. B7.
In comparison with belowground trait relationships, CH4 fluxes were weakly and positively correlated with plant green area (GA) and peat temperature (Fig. B8). GA, which also did not show clear trends with permafrost thaw (Fig. B9), showed no clear relationships with CH4 fluxes (max τ for shrub at peak CH4; Fig. B8). Peat temperature did not show clear relationships with CH4 fluxes (max τ at middle CH4; Fig. B8). However, increases in peat moisture were generally associated with higher CH4 fluxes (τ= 0.73 at early, middle and season median CH4; Fig. B8), with the highest CH4 fluxes occurring in the wettest plots in the fully thawed stage (median VWC = 100 %), and lowest CH4 fluxes in the drier intact stage (median VWC = 43.4 %).
Permafrost thaw in subarctic peatlands can lead to substantial alterations in peatland hydrology, vegetation composition and carbon cycling, and higher CH4 emissions with higher water table level and more anoxic conditions belowground (Johnston et al., 2014; Knoblauch et al., 2018; Turetsky et al., 2014; Varner et al., 2022). These trends were visible in the Stordalen Mire where CH4 fluxes increased significantly from intact to fully thawed permafrost stage with maximum CH4 fluxes in August (Sect. A2 and Fig. B10), and porewater CH4 concentrations increased with depth and CH4 production slightly shifted from hydrogenotrophic to acetoclastic methanogenesis (Fig. B11), as has been observed previously at Stordalen (Hodgkins et al., 2014; Holmes et al., 2022; McCalley et al., 2014; Perryman et al., 2020; Varner et al., 2022). Shifts from hydrogenotrophic to acetoclastic methanogenesis can indicate increased root exudate-driven CH4 production (see Sect. 4.2) (Saarnio et al., 2004; Ström et al., 2003).
The increased CH4 fluxes with permafrost thaw in Stordalen are driven by a complex network consisting of drivers such as higher water table level and increased anoxia (Holmes et al., 2022; Malhotra and Roulet, 2015), higher peat temperatures at the end of growing season (Mollenkopf et al., 2026), increased labile carbon availability (Hodgkins et al., 2014; Holmes et al., 2022; Hough et al., 2022), shifts in microbial communities from hydrogenotrophic to acetoclastic methanogens (McCalley et al., 2014), and increasing dominance and productivity of graminoid vegetation (Christensen et al., 2004; Johansson et al., 2006; Malhotra and Roulet, 2015; Öquist and Svensson, 2002; Varner et al., 2022). For the first time in Stordalen and, to our knowledge, in other thawing permafrost peatlands, we explored the effect of belowground plant traits on CH4 fluxes. In general, root and rhizome traits reflected plant community transitions and were consistent with an increase in plant-mediated transport of acetoclastically-produced CH4.
4.1 Root and rhizome traits reflect plant community shifts along permafrost thaw gradient
The vegetation composition in Stordalen follows the changing hydrology and soil nutrient availability. The vegetation shifts from shrub-dominated (intact stage; e.g., R. chamaemorus, B. nana, and E. nigrum) palsas to increasingly more graminoid- and Sphagnum-dominated semi-wet bogs (partly thawed; e.g., V. oxycoccos, C. rotundata, and S. capillifolium) and wet fens (fully thawed; E. angustifolium, E. fluviatile, and S. riparium; Tables C1 and C2) (Hough et al., 2022; Johansson et al., 2006; Malhotra and Roulet, 2015; Varner et al., 2022). Following these vegetation transitions, plant traits reflect plant adaptation to the changing environmental conditions (Dong et al., 2020; Moor et al., 2017; Pan et al., 2019). While studying plant trait variation and its influence on ecosystem functioning often requires species-specificity to capture changes in diversity (Kichenin et al., 2013; Violle et al., 2014) and separation into fine and coarse root fractions (Freschet et al., 2021b; McCormack et al., 2015), CH4 flux models often utilize PFTs which have been found to adequately represent the collective trait effects on CH4 fluxes in peatlands (Gray et al., 2013; Laine et al., 2022). Thus, we here focused on root and rhizome traits at the PFT (herbaceous and shrub) level. This approach provides empirical constraints on plant-mediated carbon substrate provision and CH4 transport that can inform parameterization and sensitivity analyses in process-based wetland CH4 models, such as LPJ-GUESS (Smith et al., 2001, 2014), and HIMMELI (Raivonen et al., 2017).
Following vegetation community shifts, most belowground shrub biomass and total length were found in the intact stage while herbaceous biomass increased from intact to fully thawed stage. The shrub root biomass values were lower than previous estimates for R. chamaemorus, E. nigrum and A. polifolia (total > 2000 g m−2) in Stordalen (Wallén, 1986), but are much higher than recent belowground biomass estimates (∼ 280 g m−2; Hough et al., 2022). In addition, Hough et al. (2022) reported higher total root biomass at the fully thawed (∼ 218 g m−2) than partly thawed stage (∼ 146 g m−2), whereas this study showed the opposite (Fig. 2). These differences could arise from different root biomass standardization and sampling methods, a problem highlighted in root ecology (Freschet et al., 2021a): Wallén (1986) calculated fine root biomass based on 14C activity which can lead to overestimations (Wallén, 1986), while Hough et al. (2022) sampled a larger area (625 cm2) than in our study (∼ 79 cm2), leading to differences particularly at the fully thawed stage, where graminoids root more vertically than laterally. In addition, our root samples may have consisted of a different mix of species than in Hough et al. (2022), which together with the low sample size, may have influenced these results. Nonetheless, root biomass decreased by depth, as is common particularly for shrubs (Iversen et al., 2015; Wallén, 1986). As we observed R. chamaemorus roots up to 30 cm depth, similar to Wallén (1986) and Keuper et al. (2017) in Stordalen and by Metsävainio (1931) in Finnish peatlands, and as E. angustifolium and E. fluviatile roots have been found at 40 cm depth (Iversen et al., 2015; Metsävainio, 1931; Shaver and Billings, 1975), the maximum rooting may occur deeper than our sampling depth (ca. 30 cm). In general, these findings, and particularly the remarkably high total shrub root length values, showed that permafrost-affected peat soils are rich in plant roots and likely contribute to the carbon cycling of these ecosystems (Bardgett et al., 2014; Iversen et al., 2015).
Variation in tissue density (TD) and specific root length (SRL) (Fig. 2) with thaw suggest changes in plant gas transport and resource acquisition. Increasing soil moisture with thaw (via higher water table level; Table 2 and Fig. B8) and subsequent aerenchyma formation (e.g., Jackson and Armstrong, 1999) may have decreased TD. The increase in herbaceous rhizome SA may reflect greater aerenchyma proportion, confirming rhizome SA as a proxy for plant gas transport capacity. SRL was highest and root diameter lowest at the partly thawed stage, which could reflect increased resource acquisition particularly for shrubs (Bergmann et al., 2020), but further research with larger sample sizes is needed to investigate the potential changes in shrub resource acquisition . As the peat C N ratio is highest in the partly thawed stage (Hodgkins et al., 2014), the high SRL may reflect low N availability, shifts in species and species-specific resource acquisition (Hewitt et al., 2019; Keuper et al., 2017). However, as fine root SRL is more meaningful for resource acquisition (Bergmann et al., 2020; McCormack et al., 2015), our results based on the whole root system provide only a rough estimate. Nonetheless, 99% of total shrub root length was < 2 mm in diameter (vs. 31 %, 75 %, and 63 % in intact to fully thawed stages, respectively, for herbaceous), and thus within the traditional fine root definition (McCormack et al., 2015).
4.2 Belowground traits reflect increasing plant-mediated CH4 transport
The increasing peat moisture and associated changes in belowground plant traits contributed to the increasing CH4 fluxes along the permafrost thaw gradient. Given our exploratory results (see Sect. 3.2 and Fig. B8) and earlier studies conducted at Stordalen (Holmes et al., 2022; Malhotra and Roulet, 2015), the increasing peat moisture was likely one of the primary drivers of the increasing CH4 fluxes along the thaw gradient. However, due to the low sample size we were unable to separate the effects of plant traits and peat moisture in multivariate models, and larger sample sizes are recommended to analyze the interactions between peat moisture and plant belowground traits in future studies. Nonetheless, the univariate relationships between plant belowground traits and CH4 fluxes indicated (1) maintained carbon substrate provision and (2) increasing plant-mediated CH4 transport across the permafrost thaw gradient. In Stordalen, permafrost thaw has led to increasing plant-derived labile carbon availability and acetoclastic methanogenesis (Hodgkins et al., 2014; Holmes et al., 2022; McCalley et al., 2014; Ström and Christensen, 2007), but plant-mediated CH4 transport has so far been mostly assumed based on literature and plant aboveground characteristics and activity, such as number of shoots and gross photosynthetic rates (Öquist and Svensson, 2002).
Shrub roots suggested increasing carbon substrate provision. The higher CH4 fluxes with increasing shrub SRL (and smaller diameter; Bergmann et al., 2020) may be related to increased root exudation (Guyonnet et al., 2018; Wen et al., 2022). The negative root TD-CH4 flux relationships support this, as higher root TD may be associated with lower root exudation (Wen et al., 2022). In contrast, herbaceous SRL was weakly associated with CH4 fluxes, possibly due to decoupling of root exudation and SRL in some Cyperaceae species in nutrient-limited environments (Wen et al., 2022), and the SRL also including coarse roots (Picon-Cochard et al., 2012). However, based on the 13C-depleted δ13CH4 and high αC, hydrogenotrophic methanogenesis may have dominated in the topmost peat, and most of the dissolved, less bioavailable organic carbon possibly originated from Sphagnum in the partly thawed stage (Hodgkins et al., 2014; McCalley et al., 2014; Mondav et al., 2014; Wilson et al., 2022). Nonetheless, the lower αC, more enriched δ13CH4, and higher CH4 concentrations below the root sampling depth (30–44 cm) indicated acetoclastic methanogenesis (Fig. B11) (e.g., by Methanosarcina; McCalley et al., 2014), possibly fueled by root exudates (Saarnio et al., 2004; Ström et al., 2003; Ström and Christensen, 2007). Indeed, based on photosynthetic rates, the partly thawed stage has been estimated to have more labile carbon for methanogenesis (Öquist and Svensson, 2002), and E. angustifolium and E. vaginatum have high potential root exudation rates in Stordalen (Ström and Christensen, 2007) and graminoid root exudation rates can exceed that of shrubs in the partly and fully thawed stages (Mollenkopf et al., 2026). Based on these previous studies, it is possible that the SRL based on the whole heterogeneous root system did not represent the potential root exudation accurately for herbaceous plants. Thus, roots (including herbaceous) may have exuded labile carbon, but with shrubs having a lesser effect on the net CH4 flux.
Herbaceous plant coverage increased with thaw, which was reflected in traits indicating plant-mediated CH4 transport (Fig. 2, Table C1). Higher herbaceous rhizome SA was positively associated with greater CH4 fluxes, which, together with the positive diameter-CH4 flux trends, could indicate enhanced CH4 transport via larger and more porous rhizomes (Määttä and Malhotra, 2024). Rhizome-mediated CH4 transport could be particularly relevant for plants with pressurized gas transport, such as Equisetum spp., where pressure gradients between the atmosphere, leaves, and rhizomes can drive CH4 emission via old leaves and broken stems (Vroom et al., 2022). As shrub rhizomes were not associated with CH4 fluxes (Figs. 4, B8), they may not drive plant–mediated CH4 cycling in Stordalen, though standardized measurements of, e.g., rhizome length and biomass are needed to confirm this (e.g., Freschet et al., 2021a).
Plant-mediated CH4 transport may have been pronounced in the fully thawed stage with high peat moisture, herbaceous plant coverage, and low porewater CH4 concentrations (Table C1 and Figs. B8, B11), indicating plant CH4 uptake. As low root and rhizome TD indicates higher porosity (Ye and Ryser, 2022), the negative relationships between root TD and CH4 flux suggest increased plant-mediated CH4 transport in response to increasing peat moisture. The isotopic evidence (heavier δ13CH4 and lower αC) may further suggest plant-mediated transport of acetoclastically-produced CH4 at the fully thawed stage (Chanton, 2005). This supports previous findings of higher herbaceous shoot numbers increasing CH4 flux in the fully thawed stage (Öquist and Svensson, 2002). However, a recent study conducted in the same productive season found that 30 % of the CH4 flux in the fully thawed stage consisted of graminoid plant-mediated CH4 transport and the rest of CH4 production stimulated by graminoid root exudation, while in the partly thawed stage plant-mediated CH4 transport dominated the CH4 flux (80 %) (Mollenkopf et al., 2026). Nonetheless, both this and the study by Mollenkopf et al. (2026) together suggest increased herbaceous plant-mediated CH4 transport and carbon substrate provision in the fully thawed stage. In Stordalen, most of the plant-mediated CH4 transport likely occurs via diffusion, typical for Carex spp., E. angustifolium, and E. vaginatum (e.g., Ge et al., 2025; Noyce et al., 2014; Bhullar et al., 2013). CH4 diffusion may be more efficient through E. angustifolium with low root branching in the fully thawed than at partly thawed stage with more densely rooted Carex species (Schimel, 1995; Shaver and Billings, 1975; Table C1). However, pressurized CH4 transport via Equisetum fluviatile (in fully thawed stage) could be negligible and requires further investigation as we did not separate the belowground material into species (Hyvönen et al., 1998; Kankaala and Bergström, 2004). As graminoid (e.g., E. angustifolium) roots have low bioavailability in the fully thawed stage (Hough et al., 2022), and root porosity and decomposability may be decoupled (Pan et al., 2019; Ye and Ryser, 2022), the low root and rhizome TD were unlikely to lead to increased decomposition and carbon substrate provision.
Simultaneously to plant-mediated CH4 transport, herbaceous roots may have enhanced rhizospheric CH4 oxidation. Previous studies at Stordalen have reported shifts in methanotroph communities with thaw as well as an increase in CH4 consumption, which may result from greater plant-mediated rhizospheric oxidation (i.e., more O2 transport with lower root TD) and acetoclastic methanogenesis (Perryman et al., 2020; Singleton et al., 2018). In addition, Sphagnum spp. can host methanotrophic CH4-consuming bacteria (e.g., Larmola et al., 2010; Putkinen et al., 2014), which may have increased CH4 consumption in the more O2-rich intact and partly thawed stages dominated by S. balticum and S. capillifolium, with intact stage chambers possibly having higher CH4 consumption rates than peat cores with no S. balticum (Table 1). However, the average δ13CH4 emitted from the partly thawed chamber plots was −79.6 ± 0.9 ‰ in 2011, similar to or 13C-depleted relative to the porewater CH4 at the same sites, indicating little CH4 oxidation (McCalley et al., 2014). Thus, the heavier δ13CH4 in the fully and partly thawed stages could also indicate increased CH4 oxidation close to O2-rich air at the topmost peat or in the oxidized rhizosphere at ca. 20–44 cm depth (Perryman et al., 2020; Singleton et al., 2018). In addition, during CH4 oxidation, methanotrophs preferentially consume lighter 12CH4, enriching the remaining CH4 pool in 13C while producing isotopically light CO2 (Whiticar, 1999). However, isotopically light CO2 could also indicate less methanogenesis instead of increased methanotrophy, and rhizospheric δ13CH4 enrichment can also result from faster plant 12CH4 uptake and increased plant-mediated CH4 transport (Chanton, 2005). Thus, based on the lower αC (i.e., maintained acetoclastic methanogenesis) at 20–44 cm depth, and the strongly negative relationships between root TD and CH4 fluxes (i.e., decreasing amount of aerenchyma is related with lower CH4 fluxes and vice versa), it seems that the CH4-oxidizing effect of herbaceous plants particularly in the fully thawed stage is overshadowed by increased carbon provision for methanogenesis and enhanced plant-mediated CH4 transport.
4.3 Belowground trait relationships with CH4 fluxes did not vary within the productive season
The relationships between the static belowground traits and CH4 fluxes (early, middle, peak, and season median) did not vary strongly within the productive season. This may result from the lack of temporal root and rhizome sampling within the productive season. However, as an exploratory analysis, our results may indicate higher herbaceous plant-mediated CH4 transport at the middle CH4 flux period (Fig. 3). In contrast to our hypotheses, shrub root traits were more strongly related (i.e., higher linear regression β and R2) with peak and season median CH4 fluxes whereas herbaceous root (TD) and rhizome (SA) traits were strongly related with CH4 fluxes throughout the season. This could result from the lack of temporal sampling, but also from low temporal variation in coarse root diameter (diameter is used for determining root TD; see Sect. 2.5) (Picon-Cochard et al., 2012), possibly contributing to the lack of temporal trends between root diameter and CH4 fluxes. The root TD-CH4 flux relationships may have reflected higher CH4-transporting herbaceous root biomass at the middle and peak CH4 flux period (July–September; Shaver and Billings, 1977) instead of temporal TD and diameter variation. Indeed, diffusive plant-mediated CH4 transport via Carex spp. could be high during the mid- and peak-growing season, as for example Carex rostrata (present at the partly and fully thawed stages but not captured by our aboveground measurements; see Table C1 and e.g., Hough et al., 2022) has been found to transport most CH4 at high summer and early autumn (Ge et al., 2025; Noyce et al., 2014). Furthermore, a study conducted in Stordalen during the same productive season found that plant-mediated CH4 transport and carbon substrate provision via graminoids was highest in August and September, further confirming these results (Mollenkopf et al., 2026). In addition, gross primary production (GPP), a proxy for plant-mediated gas transport (Knox et al., 2021), peaked in July and August (max monthly medians: 3.87 and 2.79 µmol CO2 m−2 s−1, respectively; Fig. B1). Concurrently, CH4 fluxes at the partly and fully thawed stages were slightly higher during nighttime (Fig. B1). Both of these GPP and CH4 flux trends could further indicate seasonally (via higher herbaceous plant biomass) and diurnally- (via stomatal opening and closure) varying plant-mediated CH4 transport . However, as GPP and CH4 flux peaks did not coincide in the same hourly time periods, further research into diel CH4 fluxes and plant-mediated CH4 transport is needed (Fig. B1) (Knox et al., 2021). As Carex, Eriophorum and Equisetum rhizomes are perennial (Husby, 2013; Shaver, 1976), the pre-existing rhizomes may have contributed to CH4 transport particularly in the beginning of the productive season with active root growth (esp. E. angustifolium; Shaver and Billings, 1975), resulting in strong rhizome-CH4 flux relationships (Figs. 4, B7).
Our exploratory analyses suggested stronger shrub carbon substrate provision (SRL and diameter) at peak CH4 flux period and across the season (season median; Fig. 3). While uncertain due to the static trait values, these results could be supported by the greater GPP at the intact and partly thawed stages (Łakomiec et al., 2021) in July and August (Fig. B1), as GPP can also be a proxy for root exudation and correlates with increased wetland CH4 emissions (Knox et al., 2021). In addition, in a separate study within the same productive season, shrubs and graminoids were found to release more root-derived carbon at the end of the season (Mollenkopf et al., 2026). However, the biomass-weighted SRL trends were negative, which could result from species-specific SRL variation and the heterogeneous herbaceous root system (Gao et al., 2024; Picon-Cochard et al., 2012). The stronger negative trends in the beginning of the productive season may arise from increased plant carbon investment into herbaceous root growth in comparison with shrubs (Billings et al., 1978; Kummerow and Russell, 1980; Wang et al., 2016). However, within the intact and partly thawed stages and in a mixture of herbaceous and shrub plants, the SRL-CH4 flux trends could in fact be positive (Fig. 3), but inferential statistics with larger sample sizes per thaw stage are required to investigate this further. As temporal variation in SRL and its relationship with root exudation can be negligible throughout growing season (Gao et al., 2024) and studies in (sub)arctic peatlands are lacking (Iversen et al., 2015), the negative trends between biomass-weighted SRL and CH4 fluxes across the thaw gradient remain uncertain.
Taken together, the temporal variation in root and rhizome traits may have contributed to CH4 fluxes but belowground trait sampling with larger sample sizes throughout the productive season is needed to investigate these relationships further. Given the uncertain herbaceous SRL and root diameter relationships, future studies could benefit from separating the roots into coarse and fine fractions, measuring the associated root exudation rates, and utilizing minirhizotrons (Iversen et al., 2012; Phillips et al., 2008) to disentangle the temporal variation in root carbon substrate provision and CH4 transport across the permafrost thaw gradient.
Permafrost thaw alters peatland methane (CH4) fluxes through changes in soil anoxia, nutrient and labile carbon availability, and vegetation composition. Here, we explored the relationships between plant root and rhizome traits and CH4 fluxes along a permafrost thaw gradient in a subarctic peatland. The belowground traits reflected vegetation community shifts along the thaw gradient from shrub- to herbaceous-dominated, with decreasing shrub belowground biomass and root tissue density with increasing thaw. Root tissue density showed a strong negative correlation with CH4 fluxes, and increasing herbaceous rhizome surface area was associated with higher CH4 fluxes. These relationships indicated increasing plant-mediated CH4 transport with thaw, which was supported by lower pore water CH4 concentrations in the fully thawed stage. Simultaneously, shrub specific root length (SRL) was positively, and root diameter negatively related with CH4 fluxes, suggesting increased labile carbon substrate provision for acetoclastic methanogenesis. The relationships did not vary strongly during the productive season, but this was likely a result of the static belowground trait data, warranting further temporal trait sampling.
We encourage further observational and experimental research particularly into the relationships between root and rhizome tissue density, SRL and CH4 fluxes. The observed relationships could be further investigated with larger sample sizes and by combining temporal root trait sampling, root separation into fine and coarse fractions, and root exudation measurements to especially quantify the relationship between SRL and root exudation. Nonetheless, as root and rhizome trait data are scarce particularly from permafrost peatlands, and as the contribution of roots and rhizomes on plant-mediated CH4 fluxes is understudied, this study provided valuable belowground proxies for plant-mediated CH4 transport and fluxes. These proxies can inform future observational and experimental studies, as well as process-based wetland models by improving parameterization particularly related to plant-mediated CH4 transport and helping fill gaps in our understanding of plant-mediated CH4 cycling.
A1 Vegetation surveys
To evaluate the similarity between the CH4 flux chamber plots and peat core plots, we conducted vegetation surveys using the point-intercept method on 19–23 July 2023. We used a 1.01 m2 survey grid divided into 36 subquadrats (16.8 cm × 16.8 cm = 0.03 m2) and 25 intercept points. We lowered a dowel (60 cm long, 0.5 cm diameter) at each intercept point and noted the presence (i.e., “hit”) of each vascular plant and moss species that the dowel touched. At the peat core plots, the grid was always positioned towards northeast from the measurer and with the core in the middle of the grid. At the chamber plots, the grid was positioned so that the chamber collar was approximately in the middle of the northeast edge of the grid (due to the chamber structure, we were unable to set the collar perfectly in the middle of the grid). The ground cover (e.g., litter and water), plant and moss species were surveyed separately. For ground cover data, if the measuring dowel hit multiple classes, only the class that touched the dowel first was recorded. Species and ground cover percentages were obtained by dividing the sum of hits for a species, vegetation (herbaceous, shrub and moss) or ground cover class by the total number of intercepts (n= 25), multiplied by 100.
A2 Chamber CH4 flux analyses
The fully thawed permafrost stage had the highest CH4 flux (season median = 75.2 mg CH4 m−2 d−1, IQR = 60.6 mg CH4 m−2 d−1), followed by partly thawed stage (season median = 30.0 mg CH4 m−2 d−1, IQR = 33.6 mg CH4 m−2 d−1) but CH4 fluxes at partly and fully thawed stages did not differ significantly (p>0.05). Intact stage had the lowest CH4 fluxes (season median = 0.3 mg CH4 m−2 d−1, IQR = 2.1 mg CH4 m−2 d−1, p<0.01). At all thaw stages, CH4 flux increased from the beginning to the end of the productive season: the maximum monthly median CH4 fluxes were observed in August (max CH4 flux: fully thawed 375.9 mg CH4 m−2 d−1, partly thawed 160.4 mg CH4 m−2 d−1, intact 96.4 mg CH4 m−2 d−1), while minima were reached in June at intact (−1.9 mg CH4 m−2 d−1) and fully thawed (10.3 mg CH4 m−2 d−1) stages, and in May at the partly thawed stage (2.0 mg CH4 m−2 d−1). In general, variation in CH4 flux (coefficient of variation, CV) was larger between thaw stages (94 %; May: 109 %, August: 79 %) than within them but the intact stage had large within-stage CH4 flux variation (148 %) which increased from May and June (125 % and 124 %, respectively) to August (165 %), while the other stages had relatively low variation (partly thawed: 37 %, fully thawed: 29 %).

Figure B1Daily net ecosystem CO2 exchange (NEE; µmol CO2 m−2 s−1) (a) and gross primary production (GPP; µmol CO2 m−2 s−1) (b), and hourly GPP and CH4 fluxes during the productive season in 2023. (a) The productive season was defined as the period between the first and last passing of daily median NEE past zero (highlighted in gray; 19 May 2023 to 30 August 2023) (Körner et al., 2023). (b) Daily median GPP (based on nighttime partitioning) is shown for reference as a proxy for plant-mediated carbon substrate provision at the ecosystem scale (Knox et al., 2021). (c) Hourly GPP medians (based on daytime partitioning with light response curves for better estimation of diurnal trends). The error bars represent the ranges between 25th and 75th percentiles around the hourly medians. (d) Hourly CH4 flux medians (in red) and means (in blue) at each permafrost thaw stage. The error bars represent the ranges between 25th and 75th percentiles around the hourly medians. Hourly means are shown in addition to medians to reflect short-term CH4 pulses at the diurnal scale. NEE and GPP data: Lundin et al. (2023). Note that the NEE and GPP data likely mostly originate from intact and partly thawed permafrost stages and do not cover the fully thawed stage (Łakomiec et al., 2021).
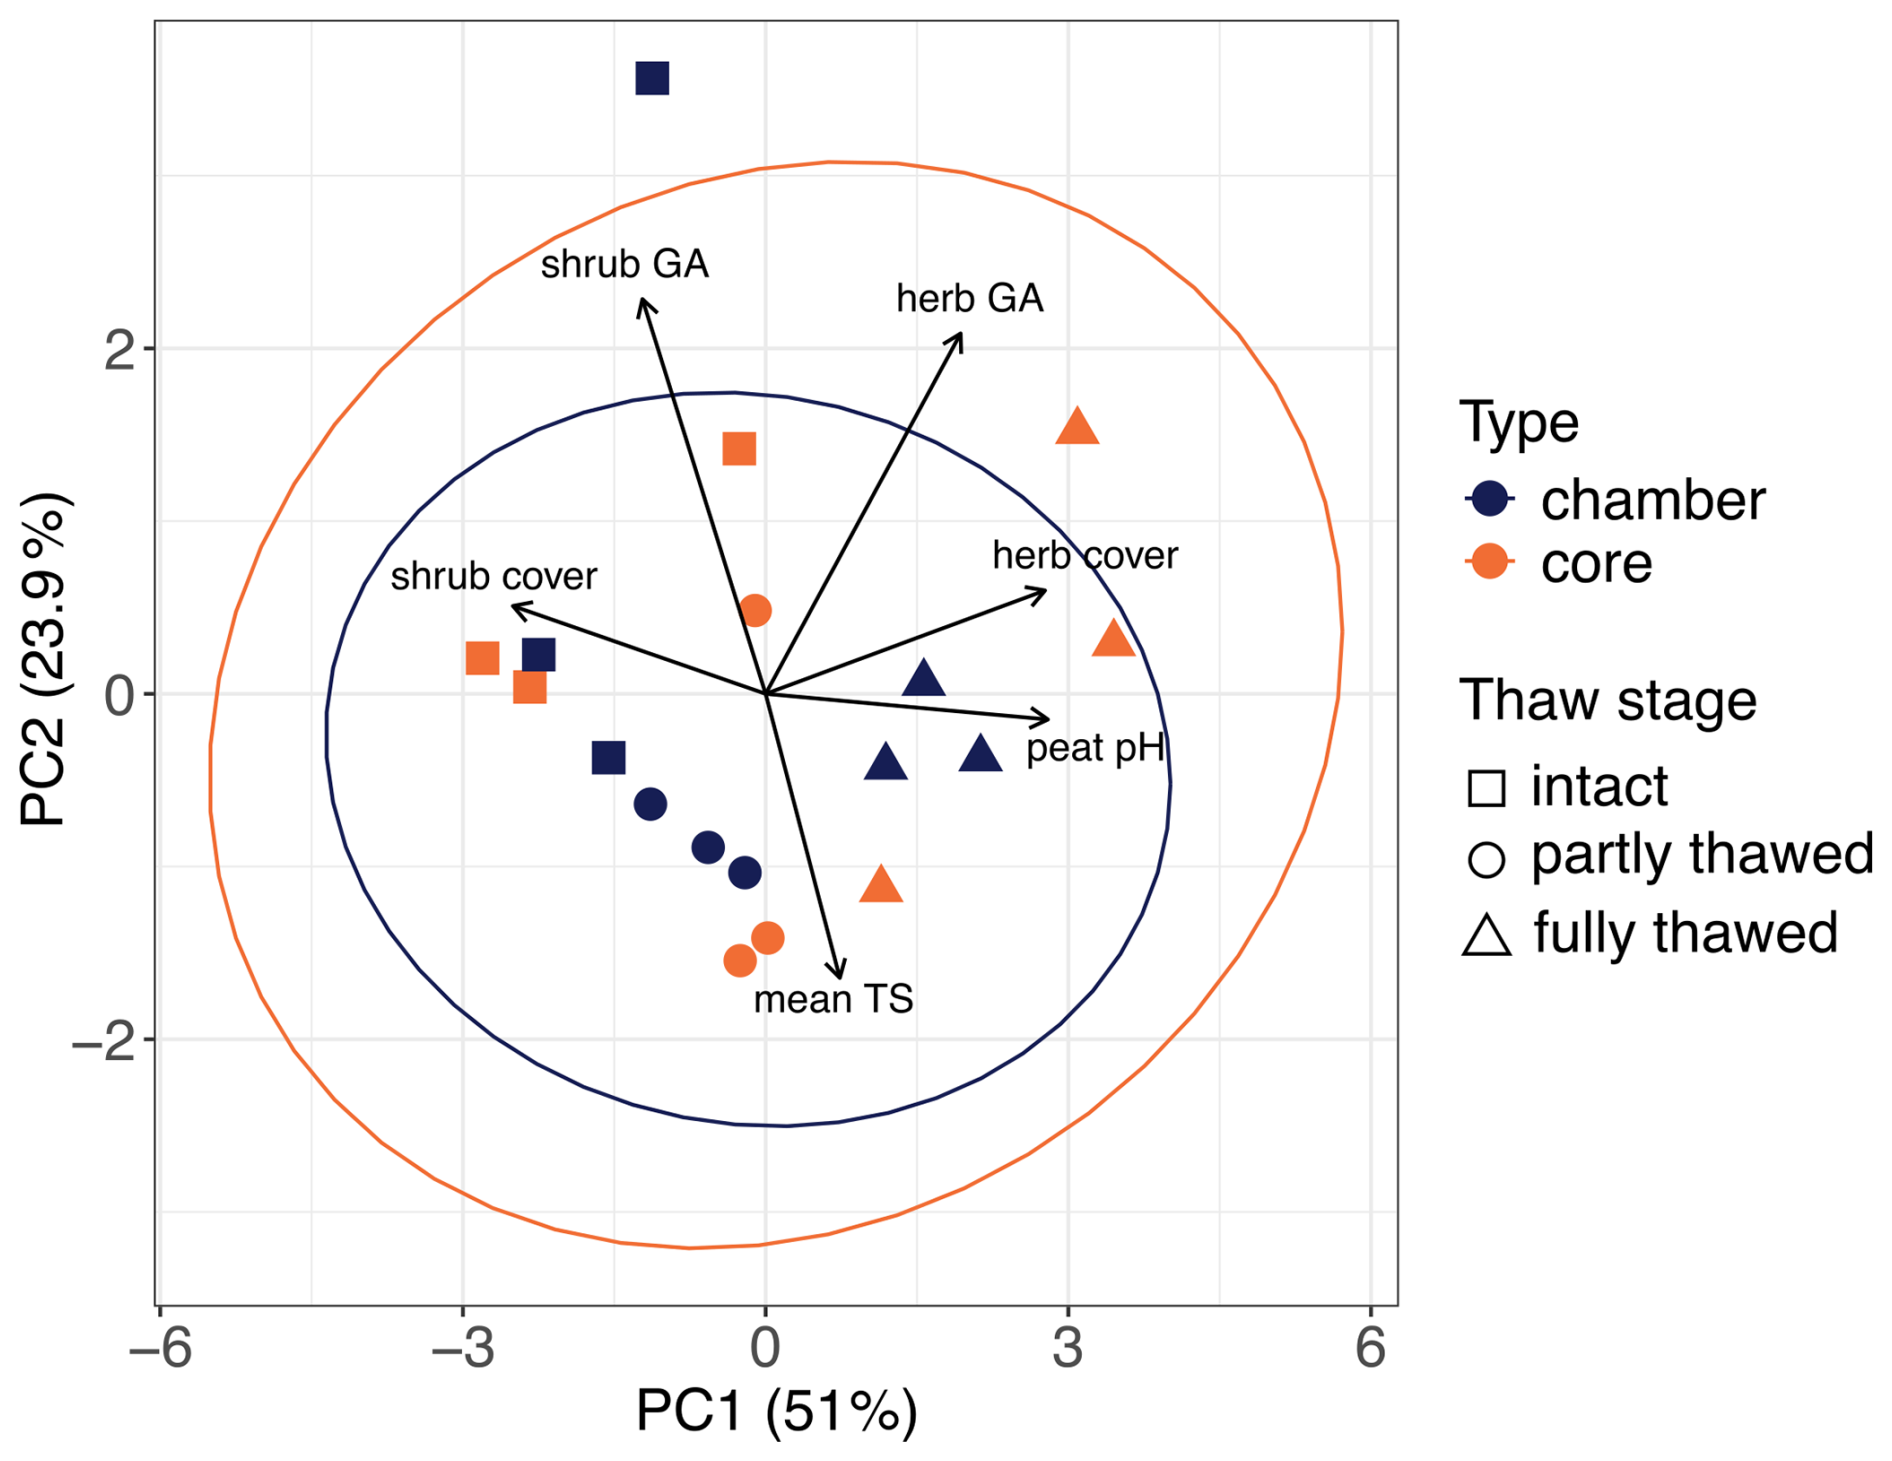
Figure B2The similarity of peat core (n= 9) and automated chamber CH4 flux measurement (n= 9) plots based on principal component analysis (PCA). In the figure, chamber and core plots are represented by dark purple and orange points, respectively, while thaw stages are shown in different shapes (rectangle = intact permafrost, circle = partly thawed permafrost, triangle = fully thawed permafrost). The ellipses represent 95 % data ellipses for the chamber and core plots within the multivariate space defined by the first two principal components (chamber = dark purple, orange = core). The PCA was based on normalized plot herbaceous and shrub plant cover and green area (GA), mean peat temperature (mean TS) and peat or porewater pH (here, referred to as peat pH), using function PCA from package FactoMineR (Lê et al., 2008) (results shown in the figure). In addition, we used PERMANOVA with function adonis2 from package vegan (Oksanen et al., 2025) and Euclidean distances between plots within thaw stages to estimate the similarity between core and chamber plots based on the same environmental variables. Based on these assessments, the peat core plots had a larger spread in multivariate space than CH4 flux plots mostly due to slightly higher shrub or herbaceous plant cover in one plot within each thaw stage, but the differences were not significant with the sample size n= 9 (p= 0.94). Thus, the root and rhizome measurements could be used to roughly represent belowground traits in the CH4 flux measurement plots. However, we acknowledge that the measured root and rhizome traits do not exactly correspond to those within the CH4 flux plots and took this into account in the result interpretation.
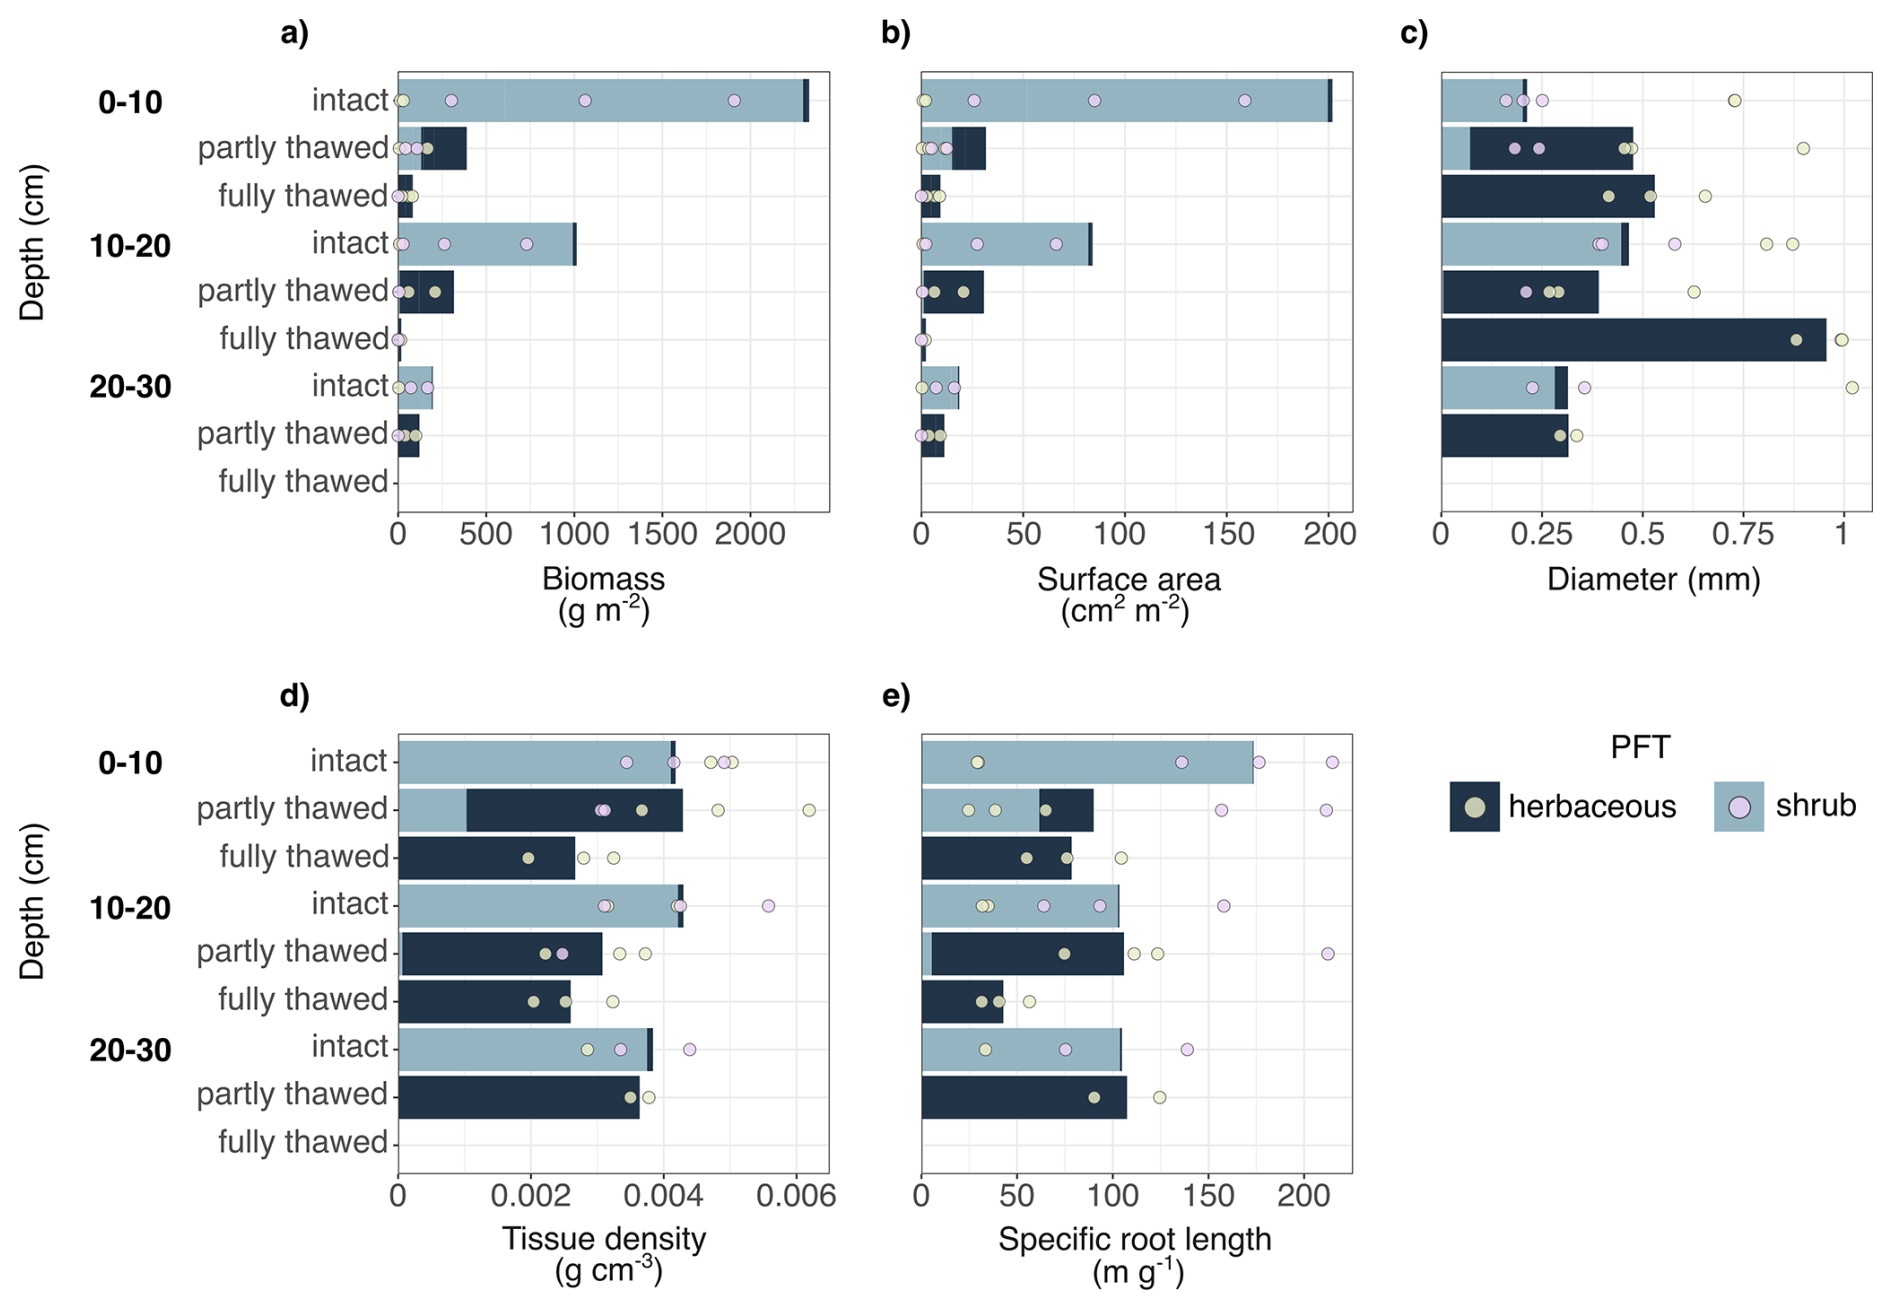
Figure B3Root traits across the depth profile (0–10, 10–20, 20–30 cm) per thaw stage and plant functional type (PFT). The stacked bar colors (dark blue: herbaceous, light blue: shrub) represent the proportion of the PFT on the total biomass (a) or surface area (b), or the contribution of each PFT on the biomass-weighted trait mean (c–e). The points (light green: herbaceous, light purple: shrub) represent depth-per-plot measurements. (a–b) and (e) Root biomass, surface area and length were standardized to 10 cm depth increments. (c)–(e) Biomass-weighted trait means.
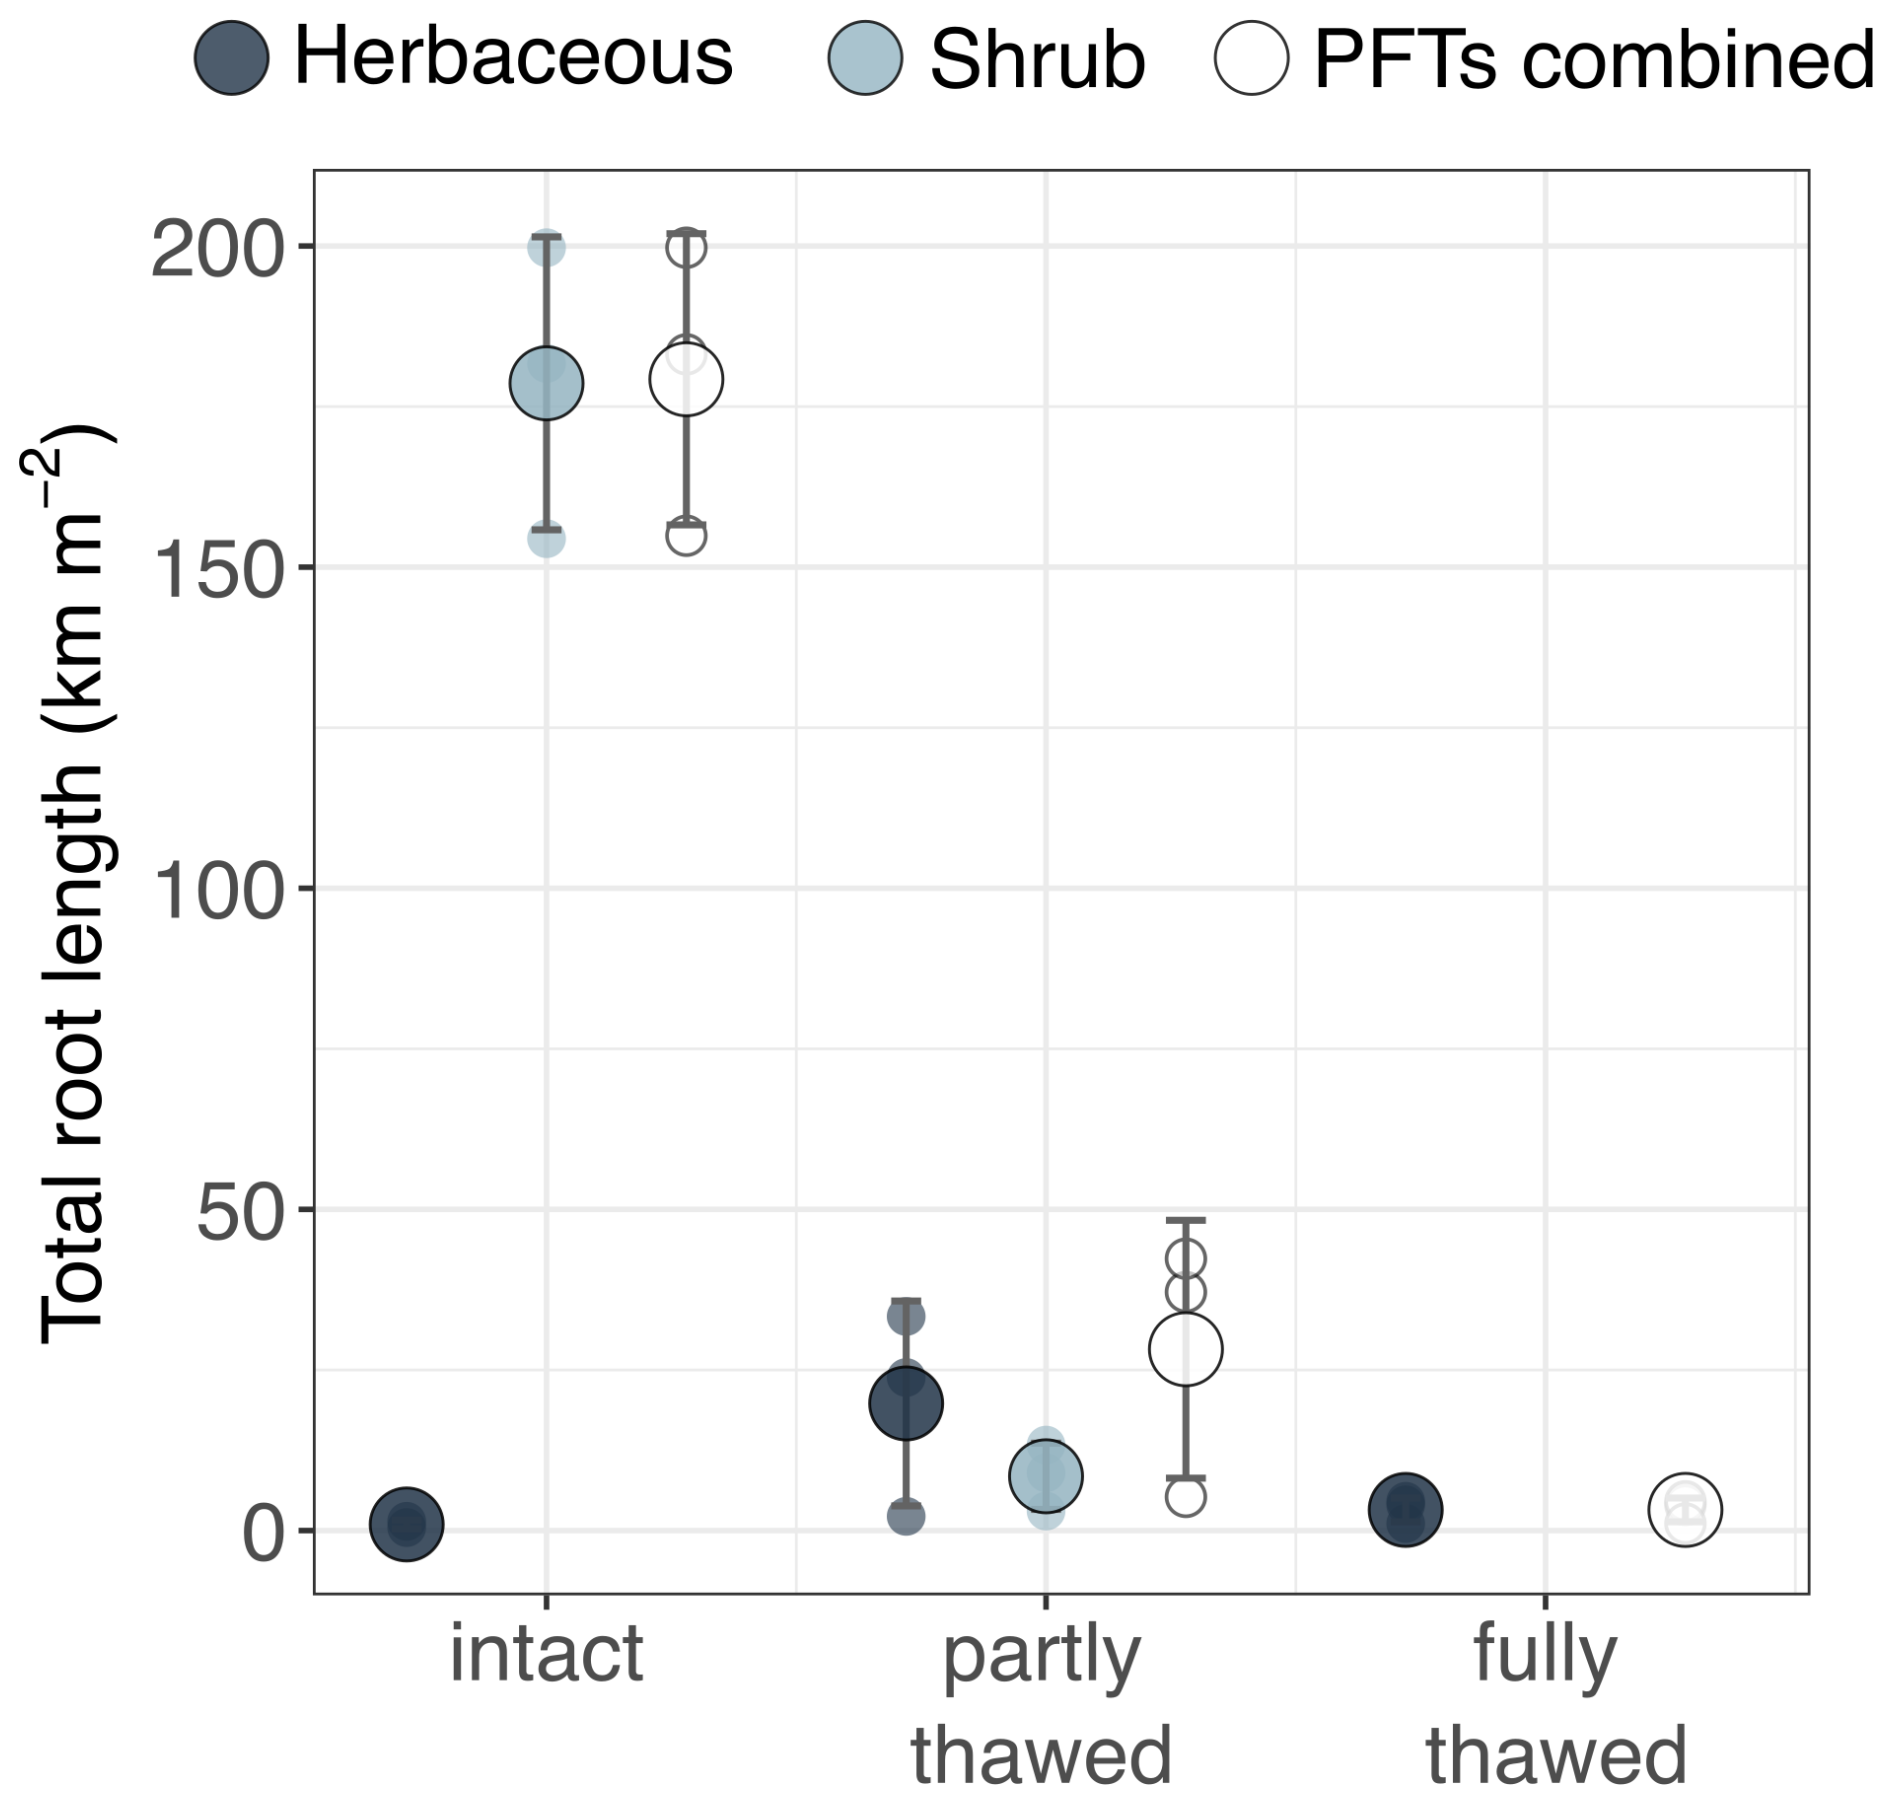
Figure B4Root total length (km m−2) across thaw stages per and across plant functional types (PFT). Large points indicate thaw stage mean and small points plot-scale measurements. Colors indicate PFTs (dark grey: herbaceous, light grey: shrub, white: PFTs summed). Error bars represent 1 standard deviation of the mean. Root total length was standardized to 30 cm depth in all plots.
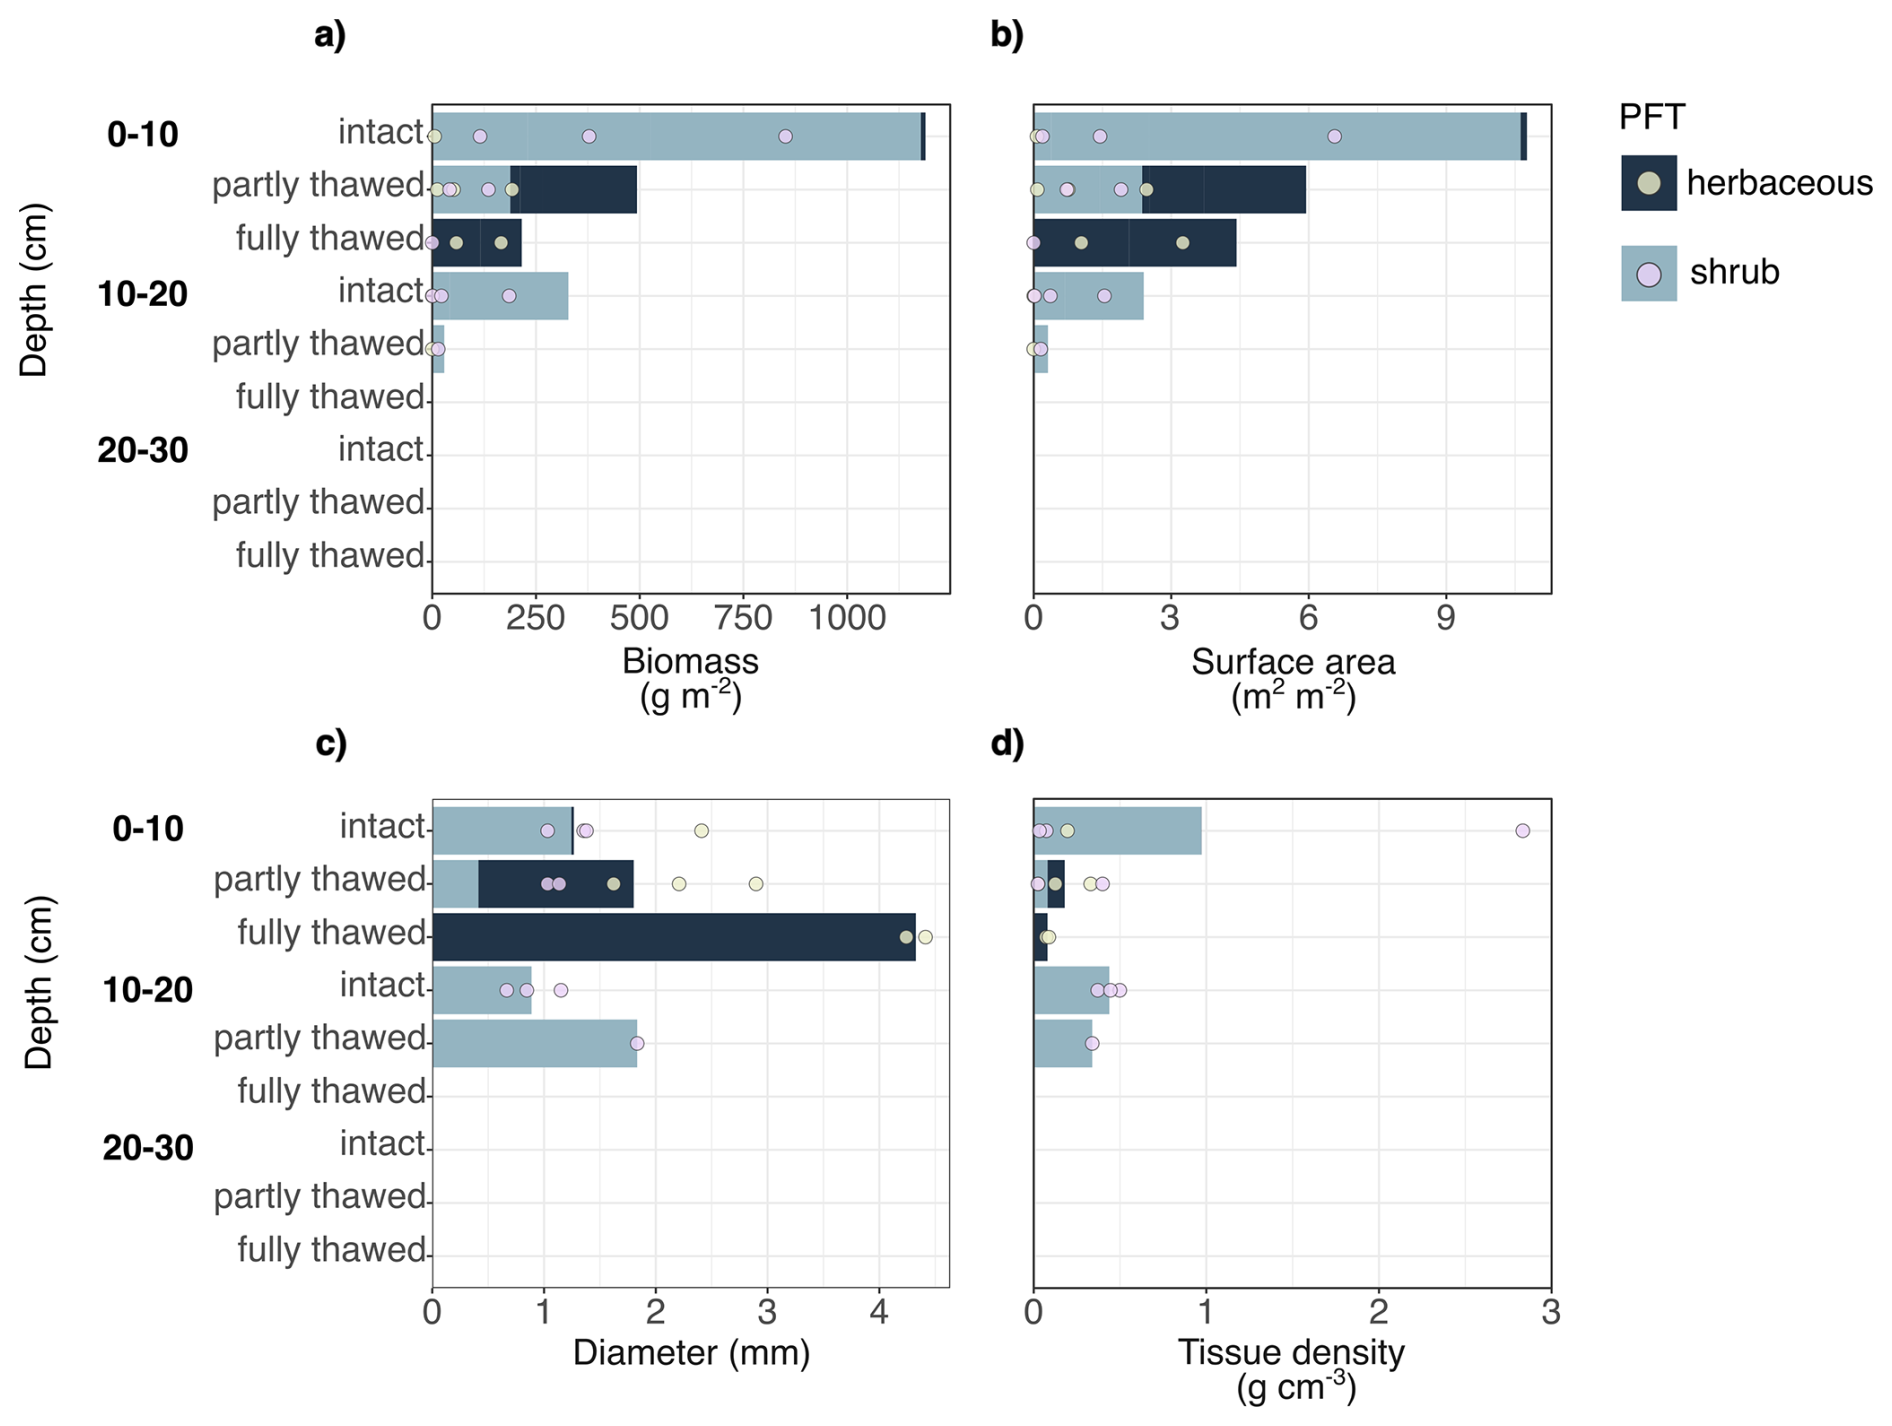
Figure B5Rhizome traits across the depth profile (0–10, 10–20, 20–30 cm) per thaw stage and plant functional type (PFT). The stacked bar colors (dark blue: herbaceous, light blue: shrub) represent the proportion of the PFT on the total biomass (a) or surface area (b), or the contribution of each PFT on the biomass-weighted trait mean (c–d). The points (light green: herbaceous, light purple: shrub) represent depth-per-plot measurements. (a–b) and (e) Root biomass, surface area and length were standardized to 10 cm depth increments. (c–d) Biomass-weighted trait means.
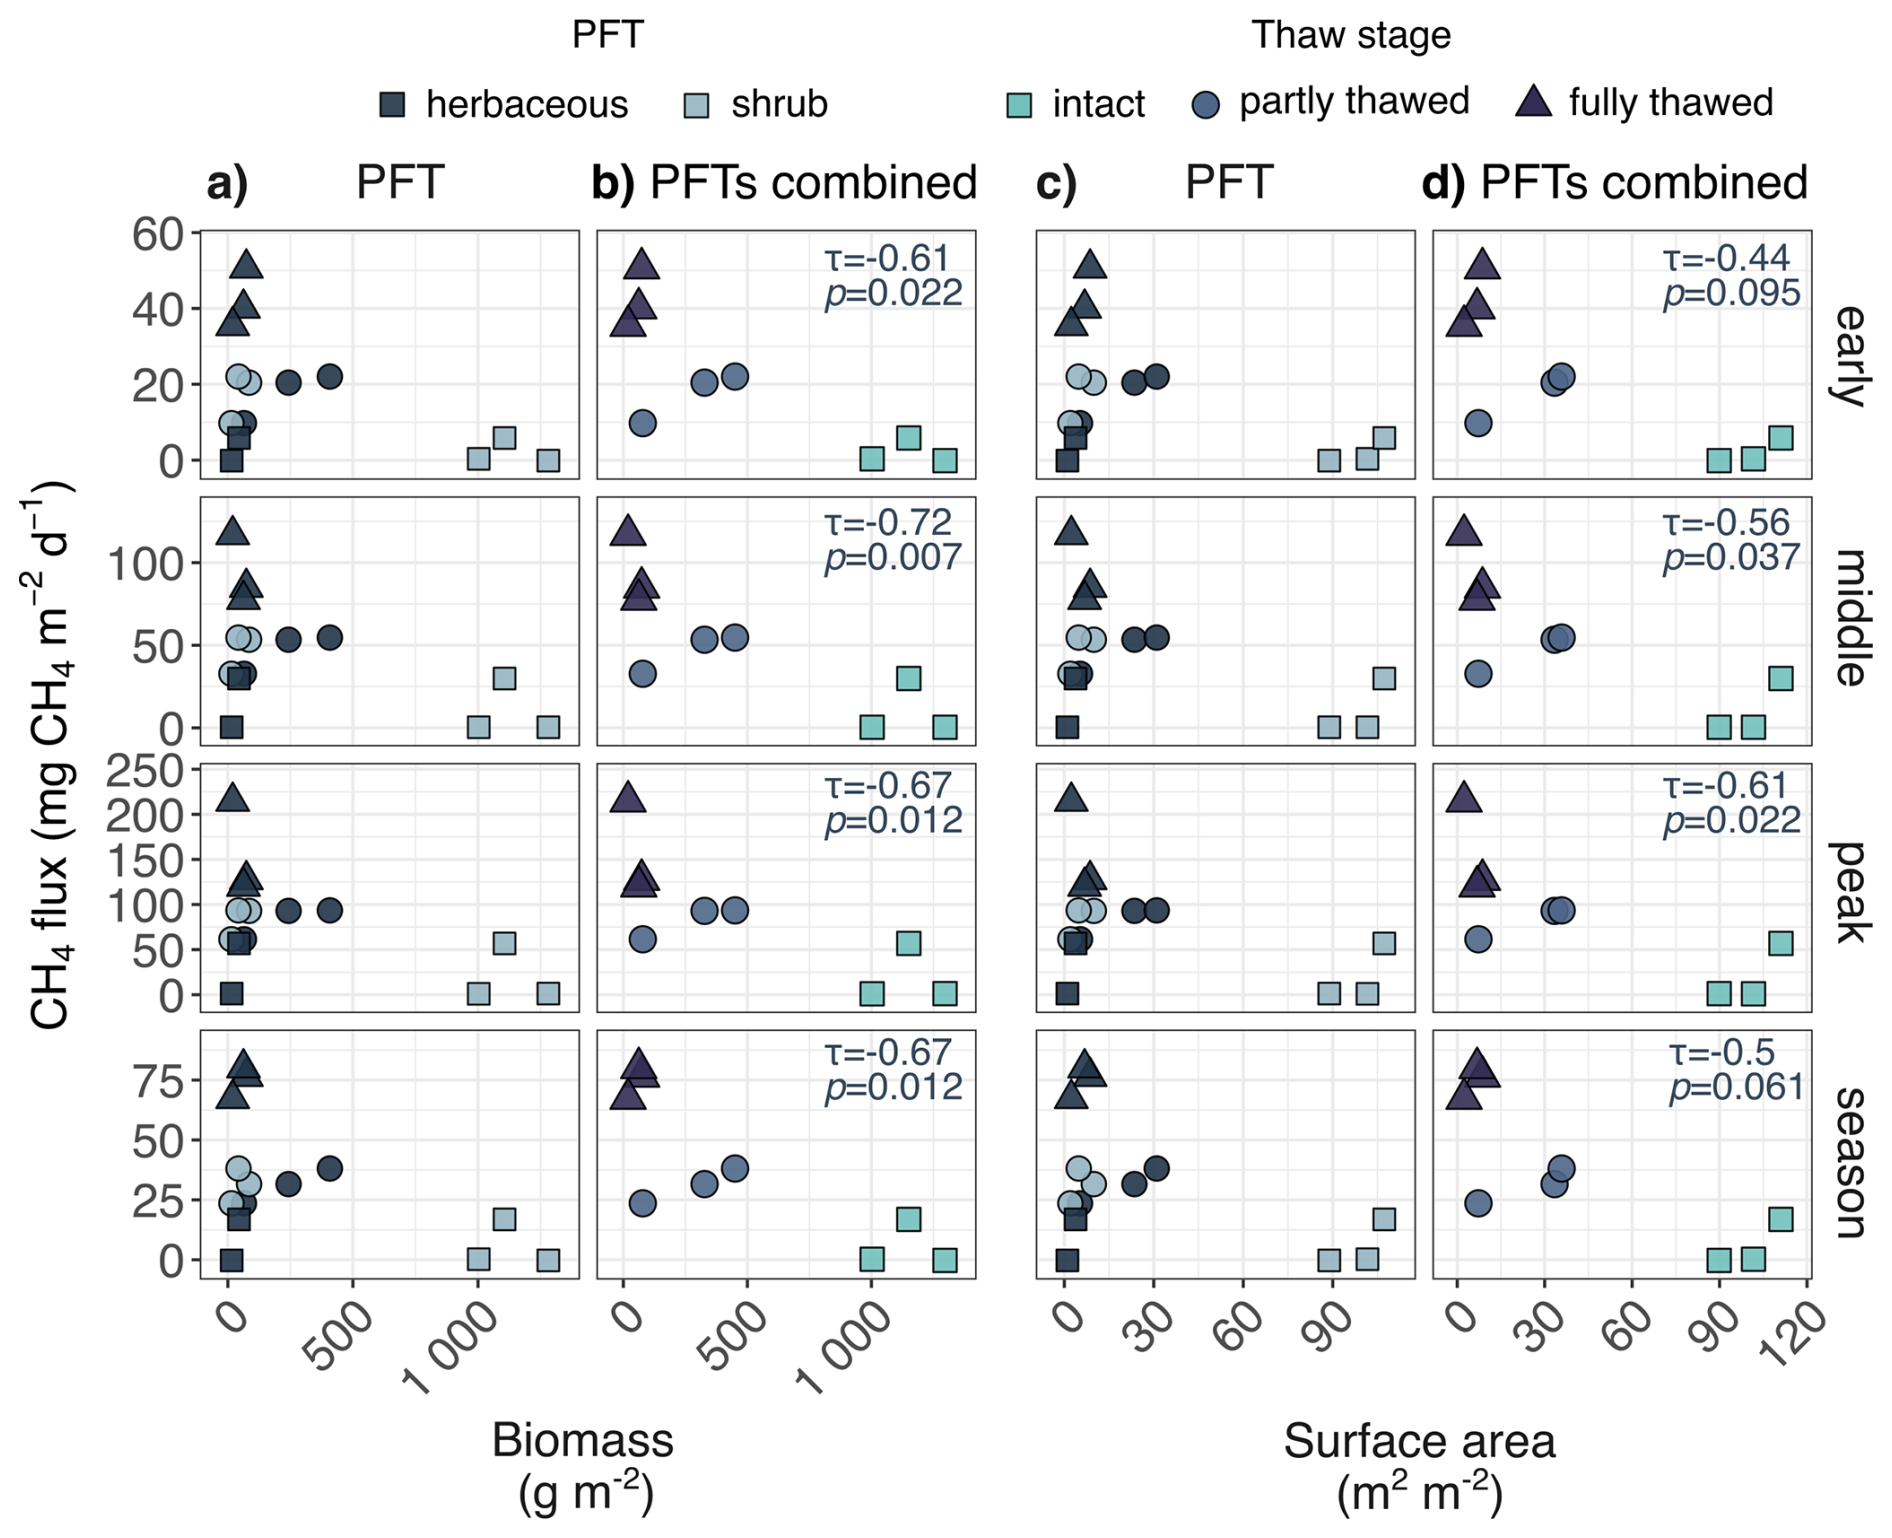
Figure B6Relationship between root biomass (columns a–b), surface area (columns c–d) and CH4 fluxes (early, middle, peak and season; rows). (a, c) Relationships between root traits and CH4 fluxes per plant functional type (PFT), where dark gray: herbaceous plants, light gray: shrubs. (b, d) Relationships between root traits and CH4 fluxes across PFTs (biomass and surface area summed), where light blue rectangle: intact, gray circle: partly thawed, and dark purple triangle: fully thawed stage. Kendall's τ is shown for relationships where τ≥0.2 (note that due to the low sample size, p-values should be interpreted with caution). Linear regression model assumptions were not met for any of the relationships.
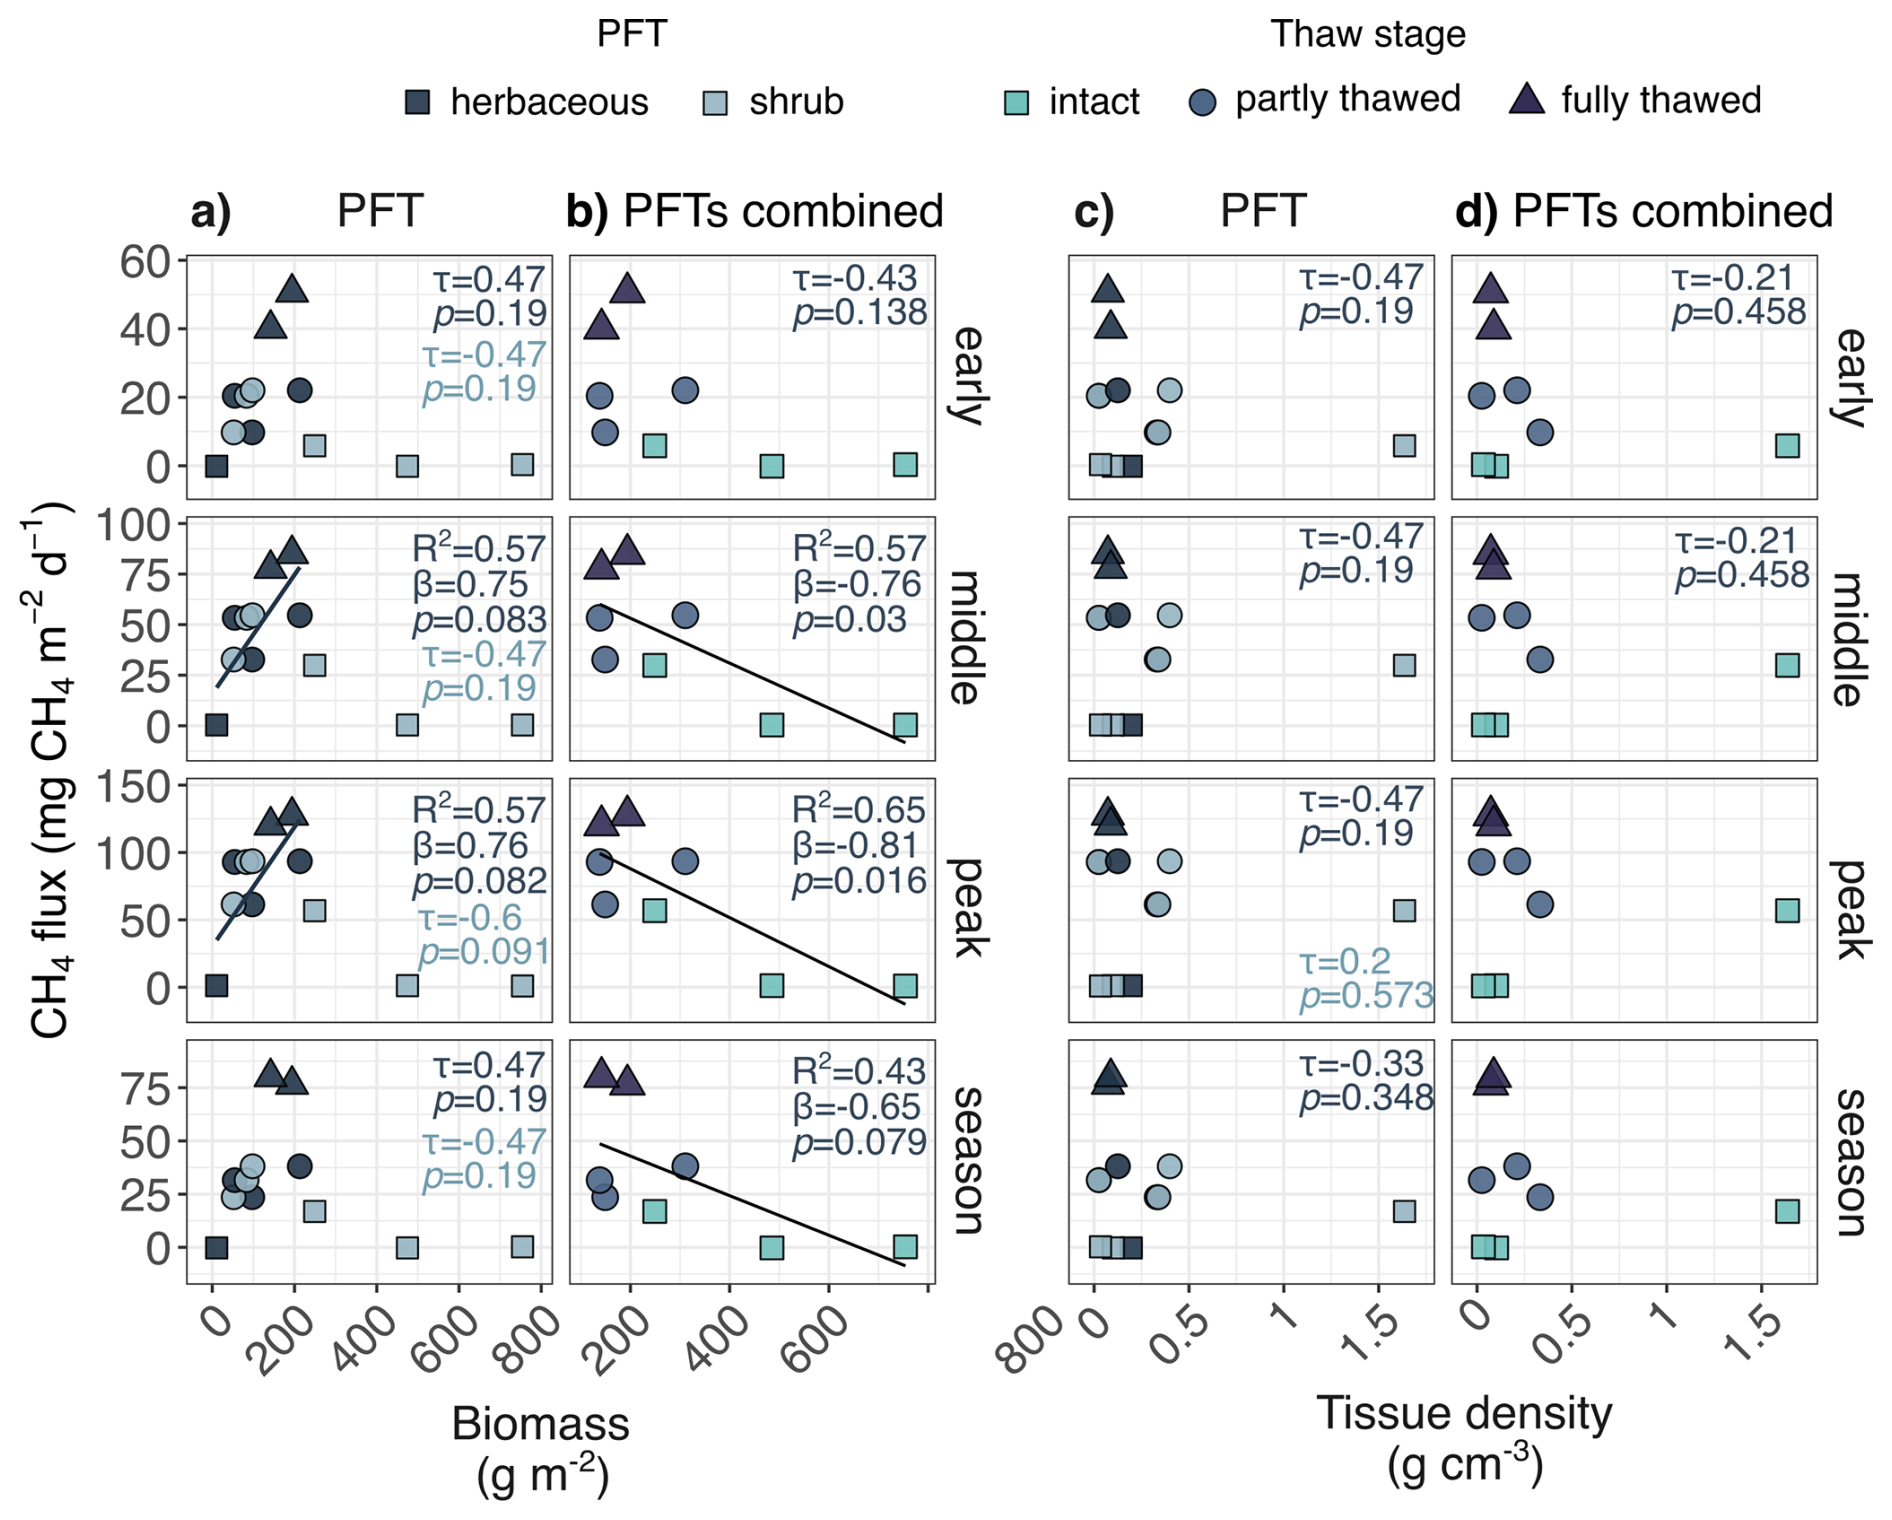
Figure B7Relationship between rhizome biomass (columns a–b), tissue density (columns c–d) and CH4 fluxes (early, middle, peak and season; rows). (a, c) Relationships between rhizome traits and CH4 fluxes per plant functional type (PFT), where dark gray: herbaceous plants, light gray: shrubs. (b, d) Relationships between rhizome traits and CH4 fluxes across PFTs (summed biomass, biomass-weighted tissue density), where light blue rectangle: intact, gray circle: partly thawed, and dark purple triangle: fully thawed stage. The lines represent linear regression fit used for visualization, while R2 and effect size (β) are reported for linear regressions with centered and scaled CH4 flux and trait values (when R2>0.2, model p<0.1, and linear regression model assumptions were met). Kendall's τ is shown for relationships where τ≥0.2 (note that due to the low sample size, p-values should be interpreted with caution).
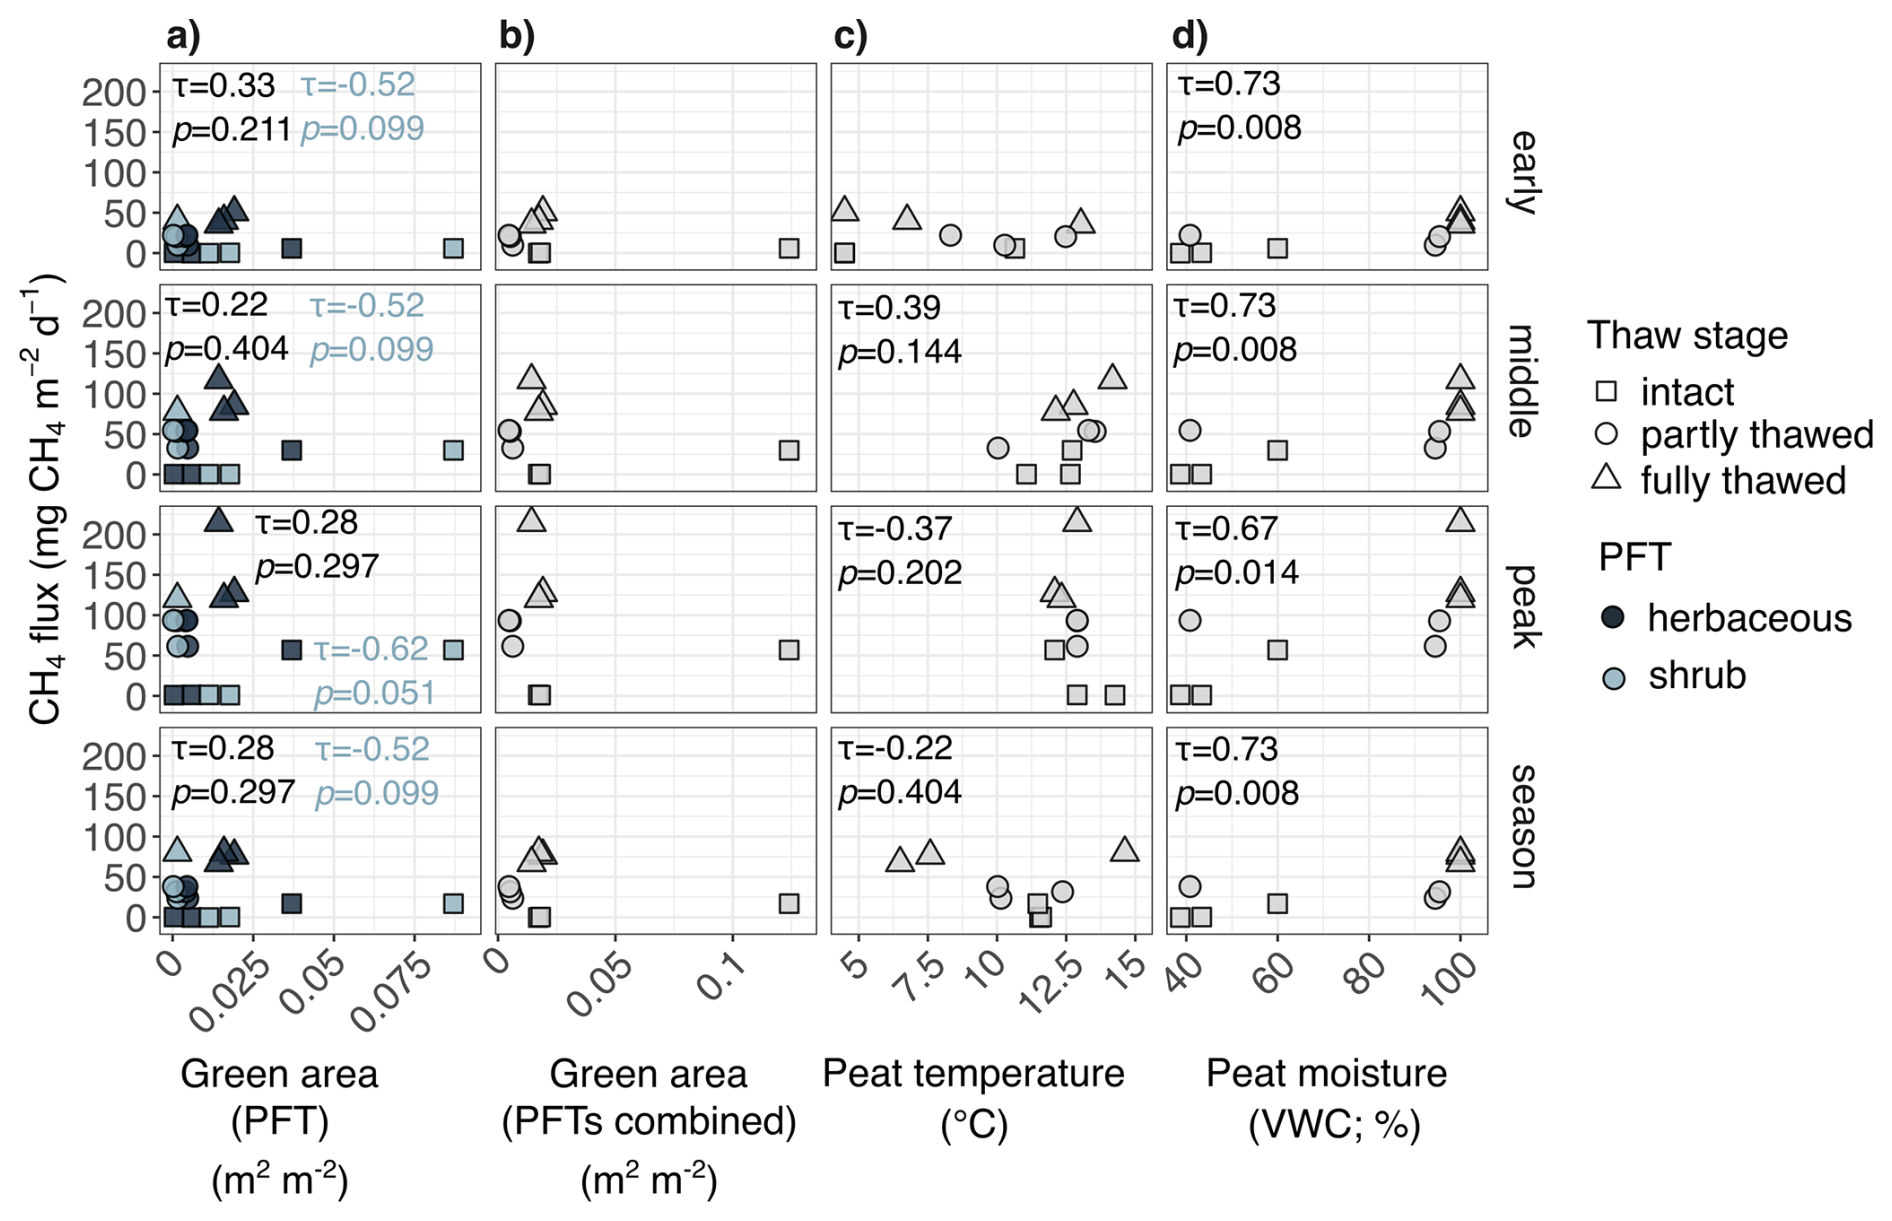
Figure B8Relationship between plant functional type (PFT)-specific plant green area (column a), plant green area summed across PFTs (column b), peat temperature (column c), peat moisture (volumetric water content VWC; column d), and CH4 flux season values (rows). Kendall τ correlation coefficient (τ) is reported for the relationship when τ>0.2 (note that due to sample n= 9, the correlation p-values should be interpreted with caution). The different point shapes represent thaw stages (rectangle = intact permafrost, circle = partly thawed permafrost, and triangle = fully thawed permafrost). (a) Colors represent different PFTs (dark blue = herbaceous plants, light blue = shrubs).

Figure B9The plant green area (GA; m2 m−2) varied slightly between thaw stages. Large points represent group means, small points plot-scale measurements, and error bars ±1 standard deviation. The colors represent plant functional type (PFT) groups: dark grey is herbaceous, light grey is shrub, and white is the sum of PFT GAs. Herbaceous GA coefficient of variation (CV) was highest within intact permafrost (137 %), while shrub GA varied most within intact permafrost (109 %). Note that shrubs (Betula nana) were only found in one plot and were only 3 % of the total GA in the fully thawed permafrost stage.
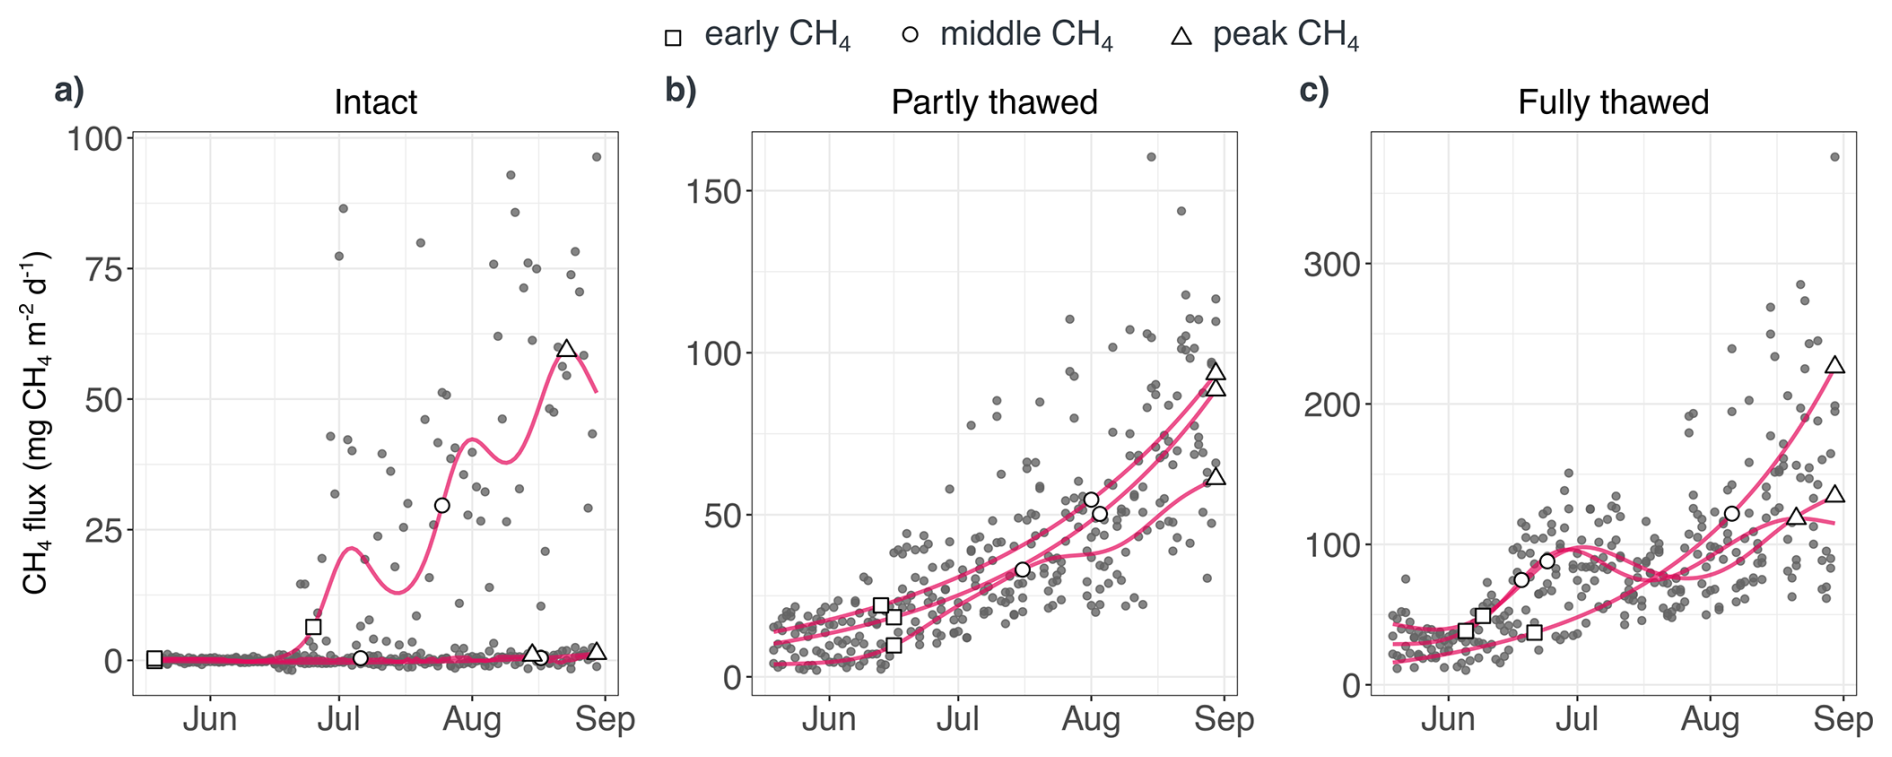
Figure B10Daily median CH4 flux with CH4 flux period values over the productive season at intact (a), partly thawed (b) and fully thawed (c) stages. (a–c) Red lines represent chamber-specific GAM fit (R2≥0.3), except for one chamber in a) where GAM R2<0.1, and the line represents the moving 7 d median CH4 flux. Squares represent early, circles middle and triangles peak CH4 flux season. See chamber GAM R2 in Table C4.

Figure B11Porewater CH4 concentration (mM) (a), δ13C-CH4 (‰) (b), CO2 concentration (c), δ13C-CO2 (‰) (d), and carbon isotope fractionation factor (αC CO2 CH4) (e) from peat surface to 84 cm depth at partly and fully thawed permafrost stages. Line and point colors represent thaw stages. (c) αC: higher values indicate larger fractionation (i.e., more hydrogenotrophy) and vice versa (i.e., more acetoclasty). Briefly, mean CH4 concentrations increased from 0.027 ± 0.004 (standard deviation) mM to 0.533 ± 0.0007 mM at 70–74 cm depth at the partly thawed stage and from 0.017 ± 0.007 mM to 0.238 ± 0.213 mM at 80–84 cm depth at the fully thawed stage. δ13C-CH4 values became enriched at ca. 30–44 cm (partly thawed ca. −56.4 ‰, fully thawed ca. −46 ‰), and this enrichment was associated with a decrease in αC (ca. 1.048 partly thawed, ca. 1.03 fully thawed). Mean CO2 concentrations increased from 1.758 ± 0.284 mM to 11.454±0.766 at 60–64 cm depth and 10.923 ± 1.51 at 70–74 cm depth at the partly thawed stage (with a decrease at 30–44 cm depth, with means of 3.951 and 4.430 mM), and from 1.322 ± 0.089 to 3.576 ± 1.725 mM at 80–84 cm at the fully thawed stage. δ13C-CO2 became more enriched with depth particularly at the partly thawed stage (from −19.398 ‰ to −3.394 ‰).
Table C1Plant cover (%) by species and herbaceous and shrub vegetation classes, litter and water surface cover (%), and peat characteristics in each chamber and peat coring (“core”) plot (as peat cores were selected to represent each individual chamber, the core and chamber plots have the same ID number). Note that the intact 1 chamber plot was on a collapsing palsa. Chamber plot WTD is the mean annual WTD across the 2007–2017 period per thaw stage (Crill et al., 2023). Values after “±” are one standard deviation of the mean. WTD = water table depth (cm; from the peat surface).
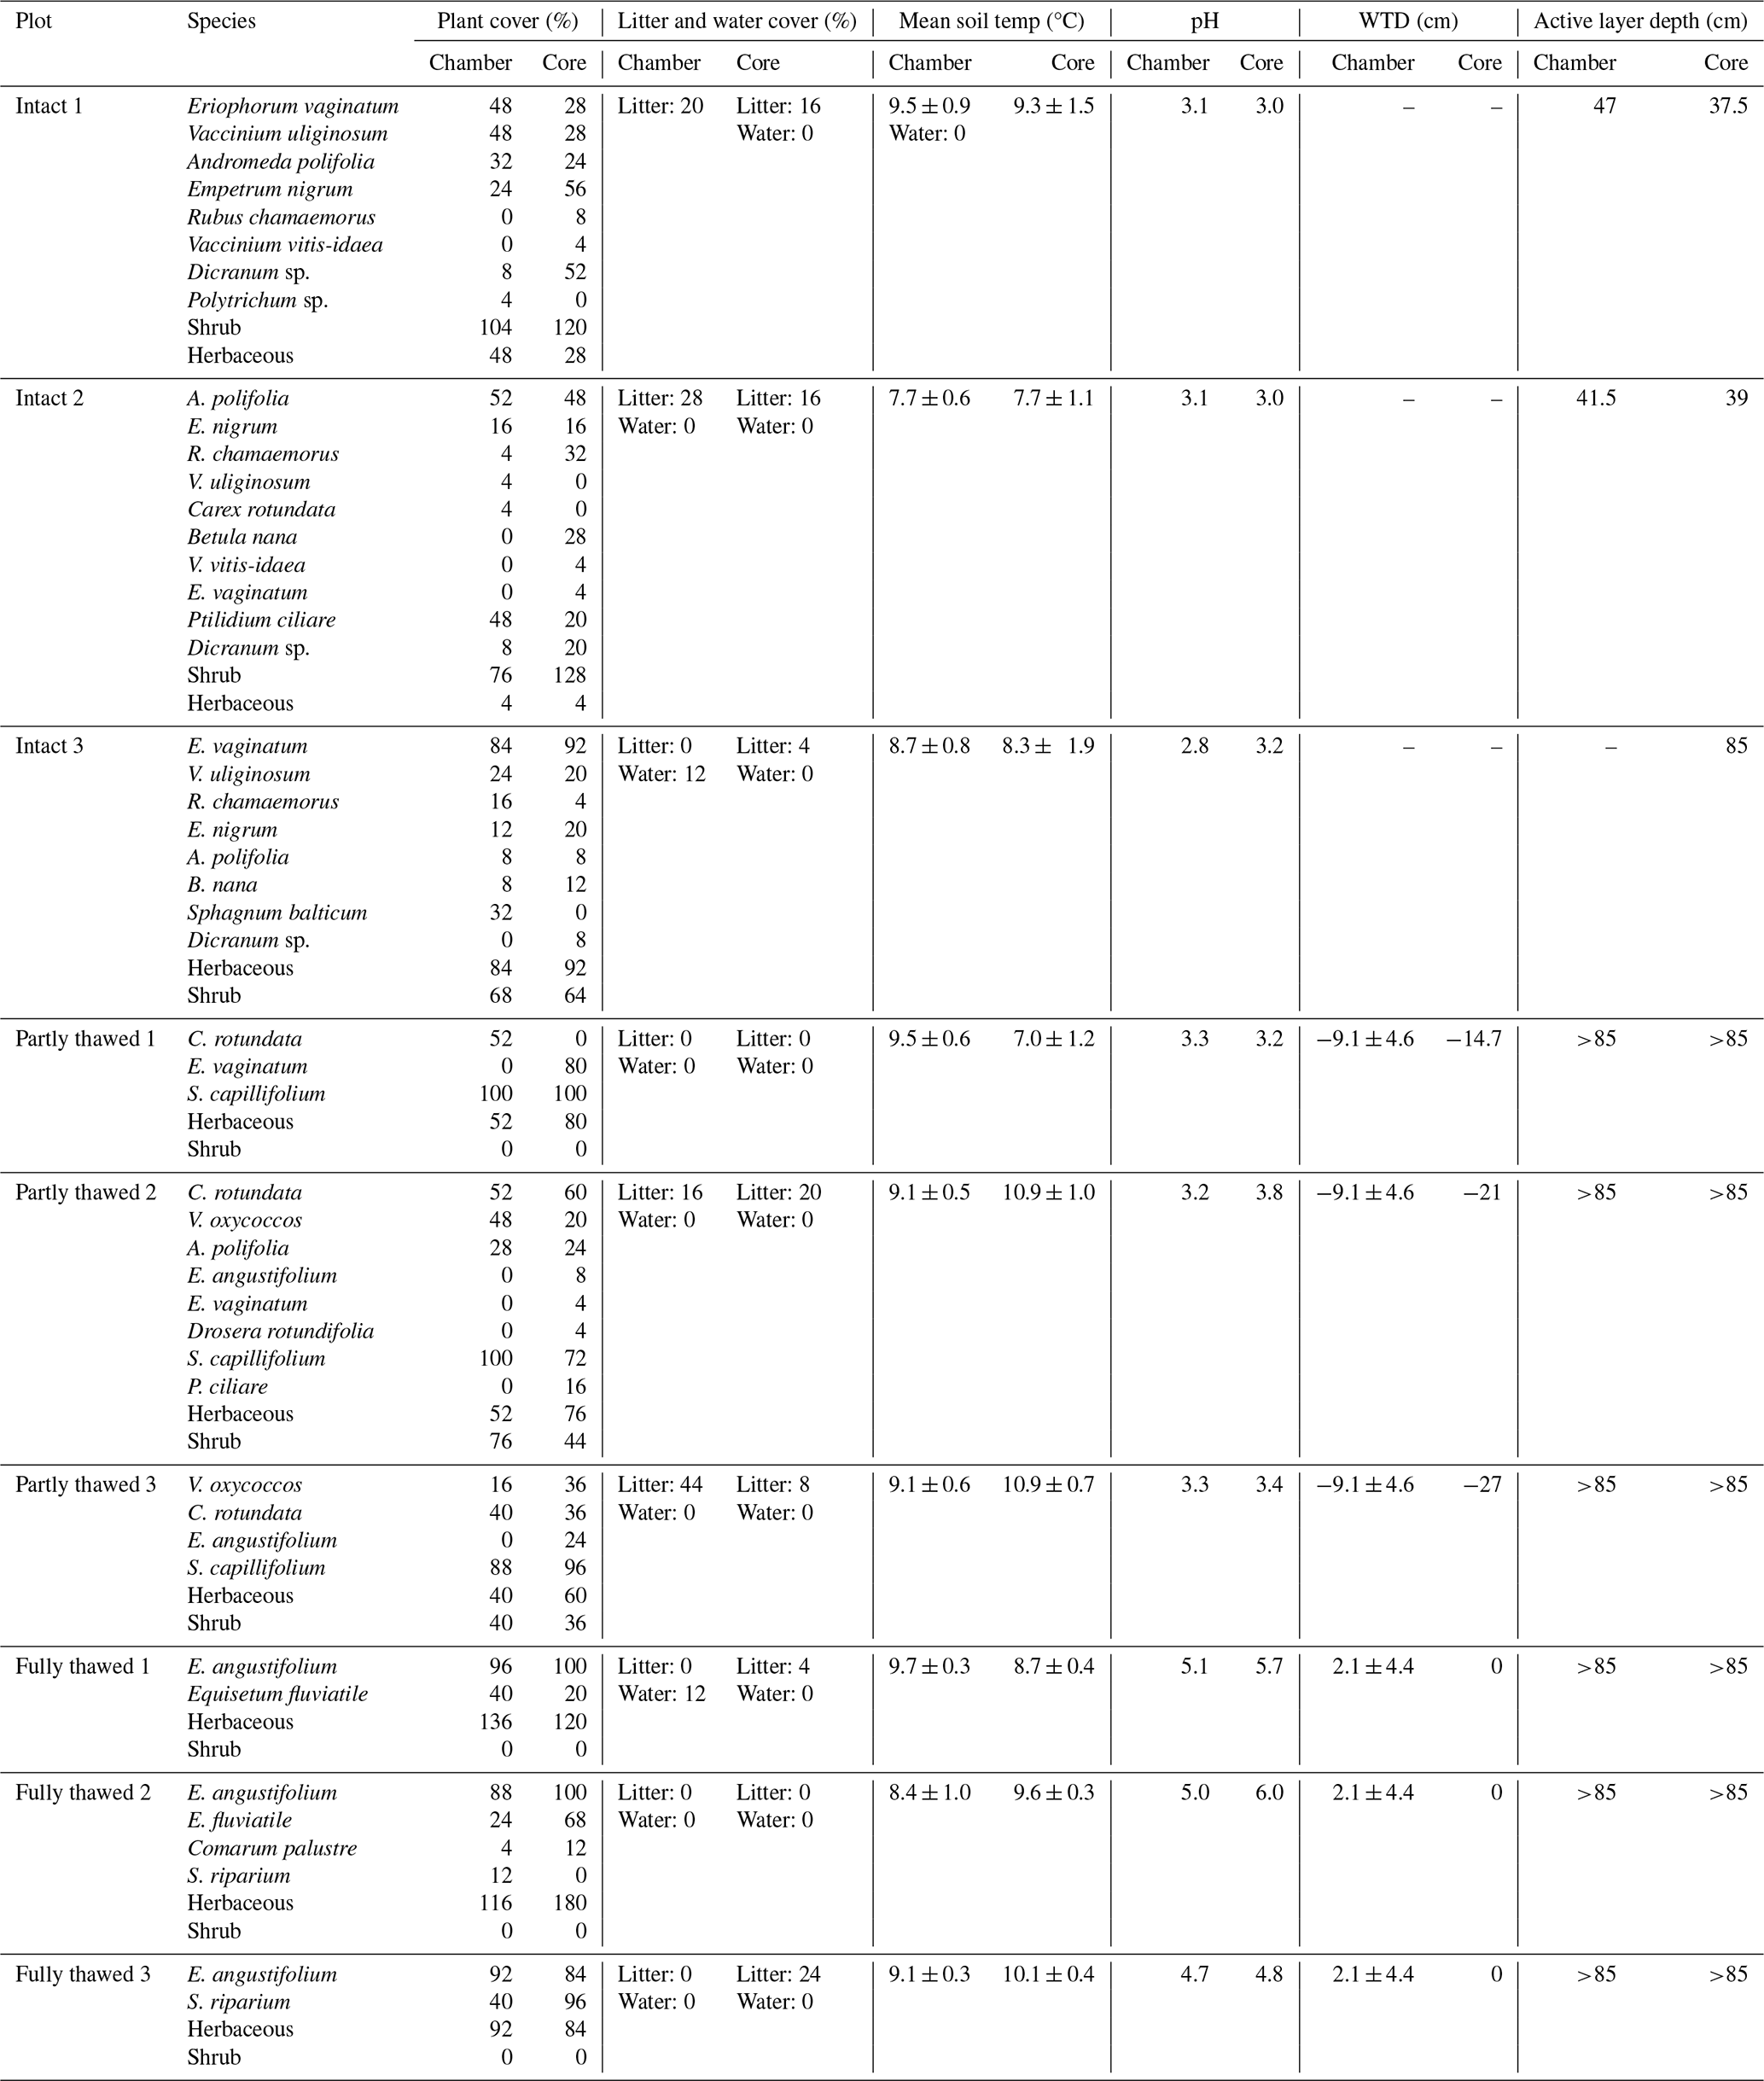
Table C2Species included in the vegetation green area (GA) measurements per thaw stage. Mean GA (with standard deviation) is reported for each species across the three plots per thaw stage, and comprises the sum of stem and leaf green area (m2 m−2).
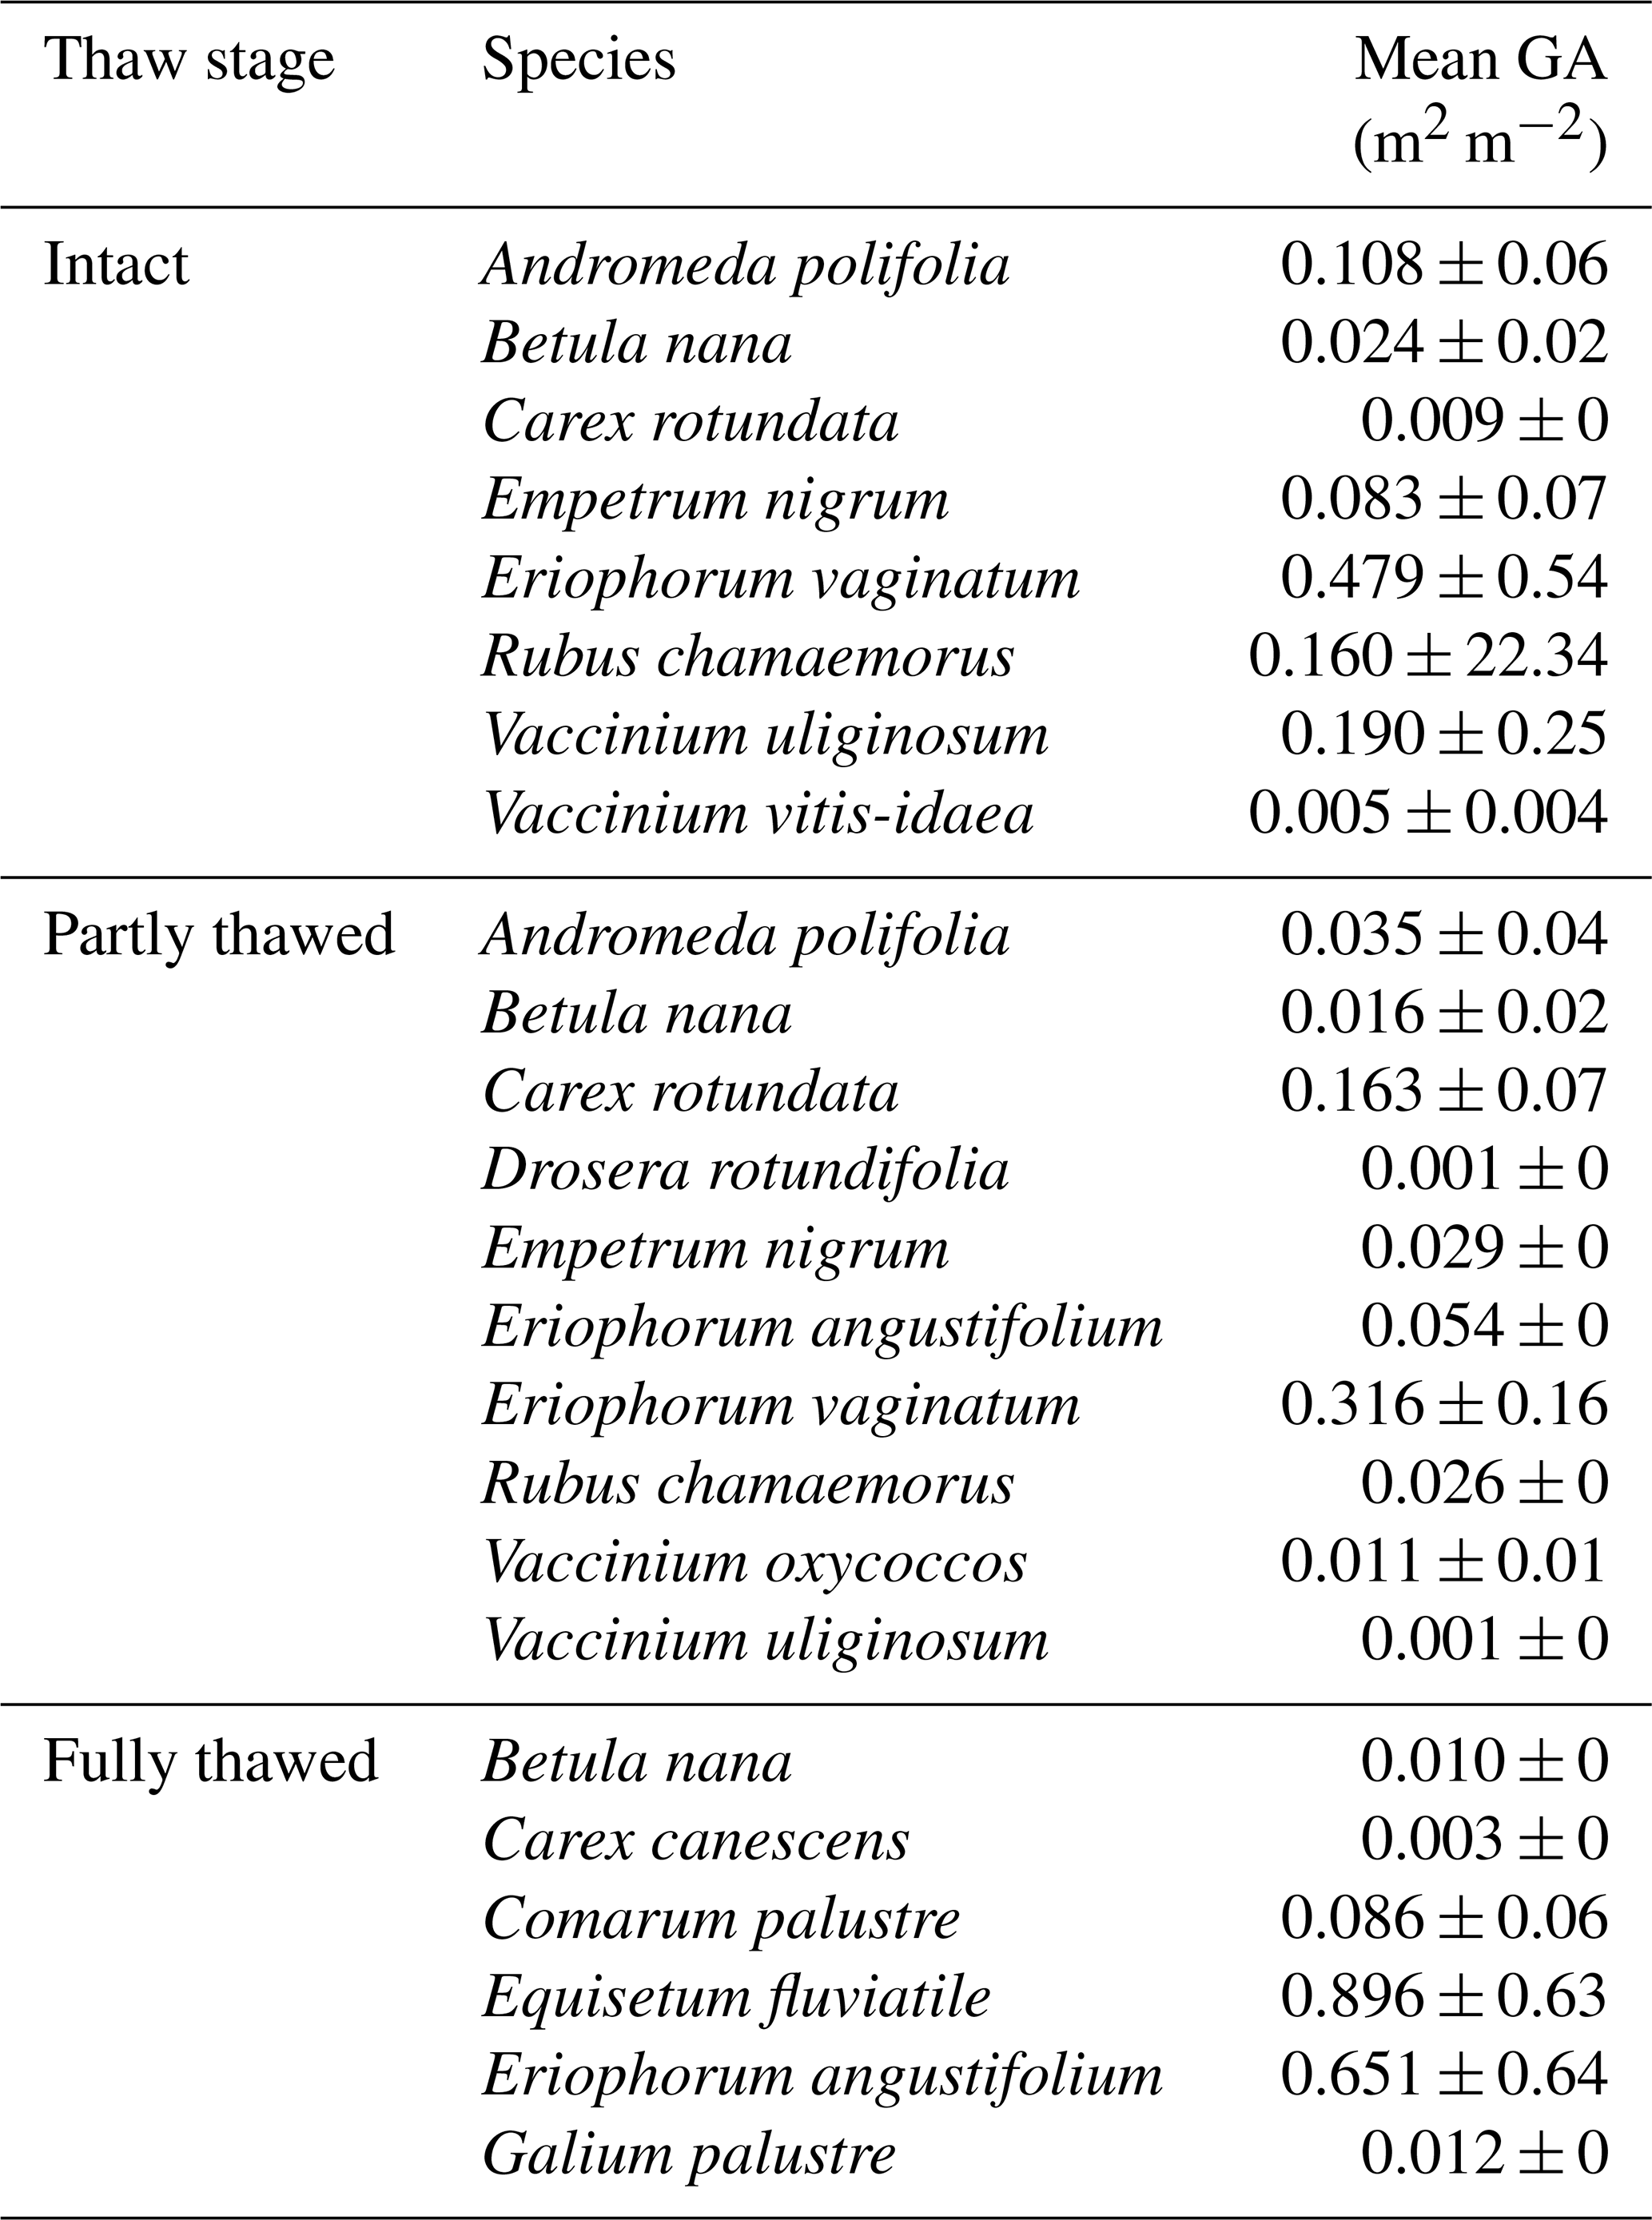
Table C3Vascular plant species growing directly on the peat cores and their leaf, stem, and flower biomass. As peat cores were selected to represent each individual chamber, the core and chamber plots have the same ID number. Note that the biomass estimates are likely underestimations due to some plant material being lost in the field. We show this table primarily for the species list. n/a: not applicable.
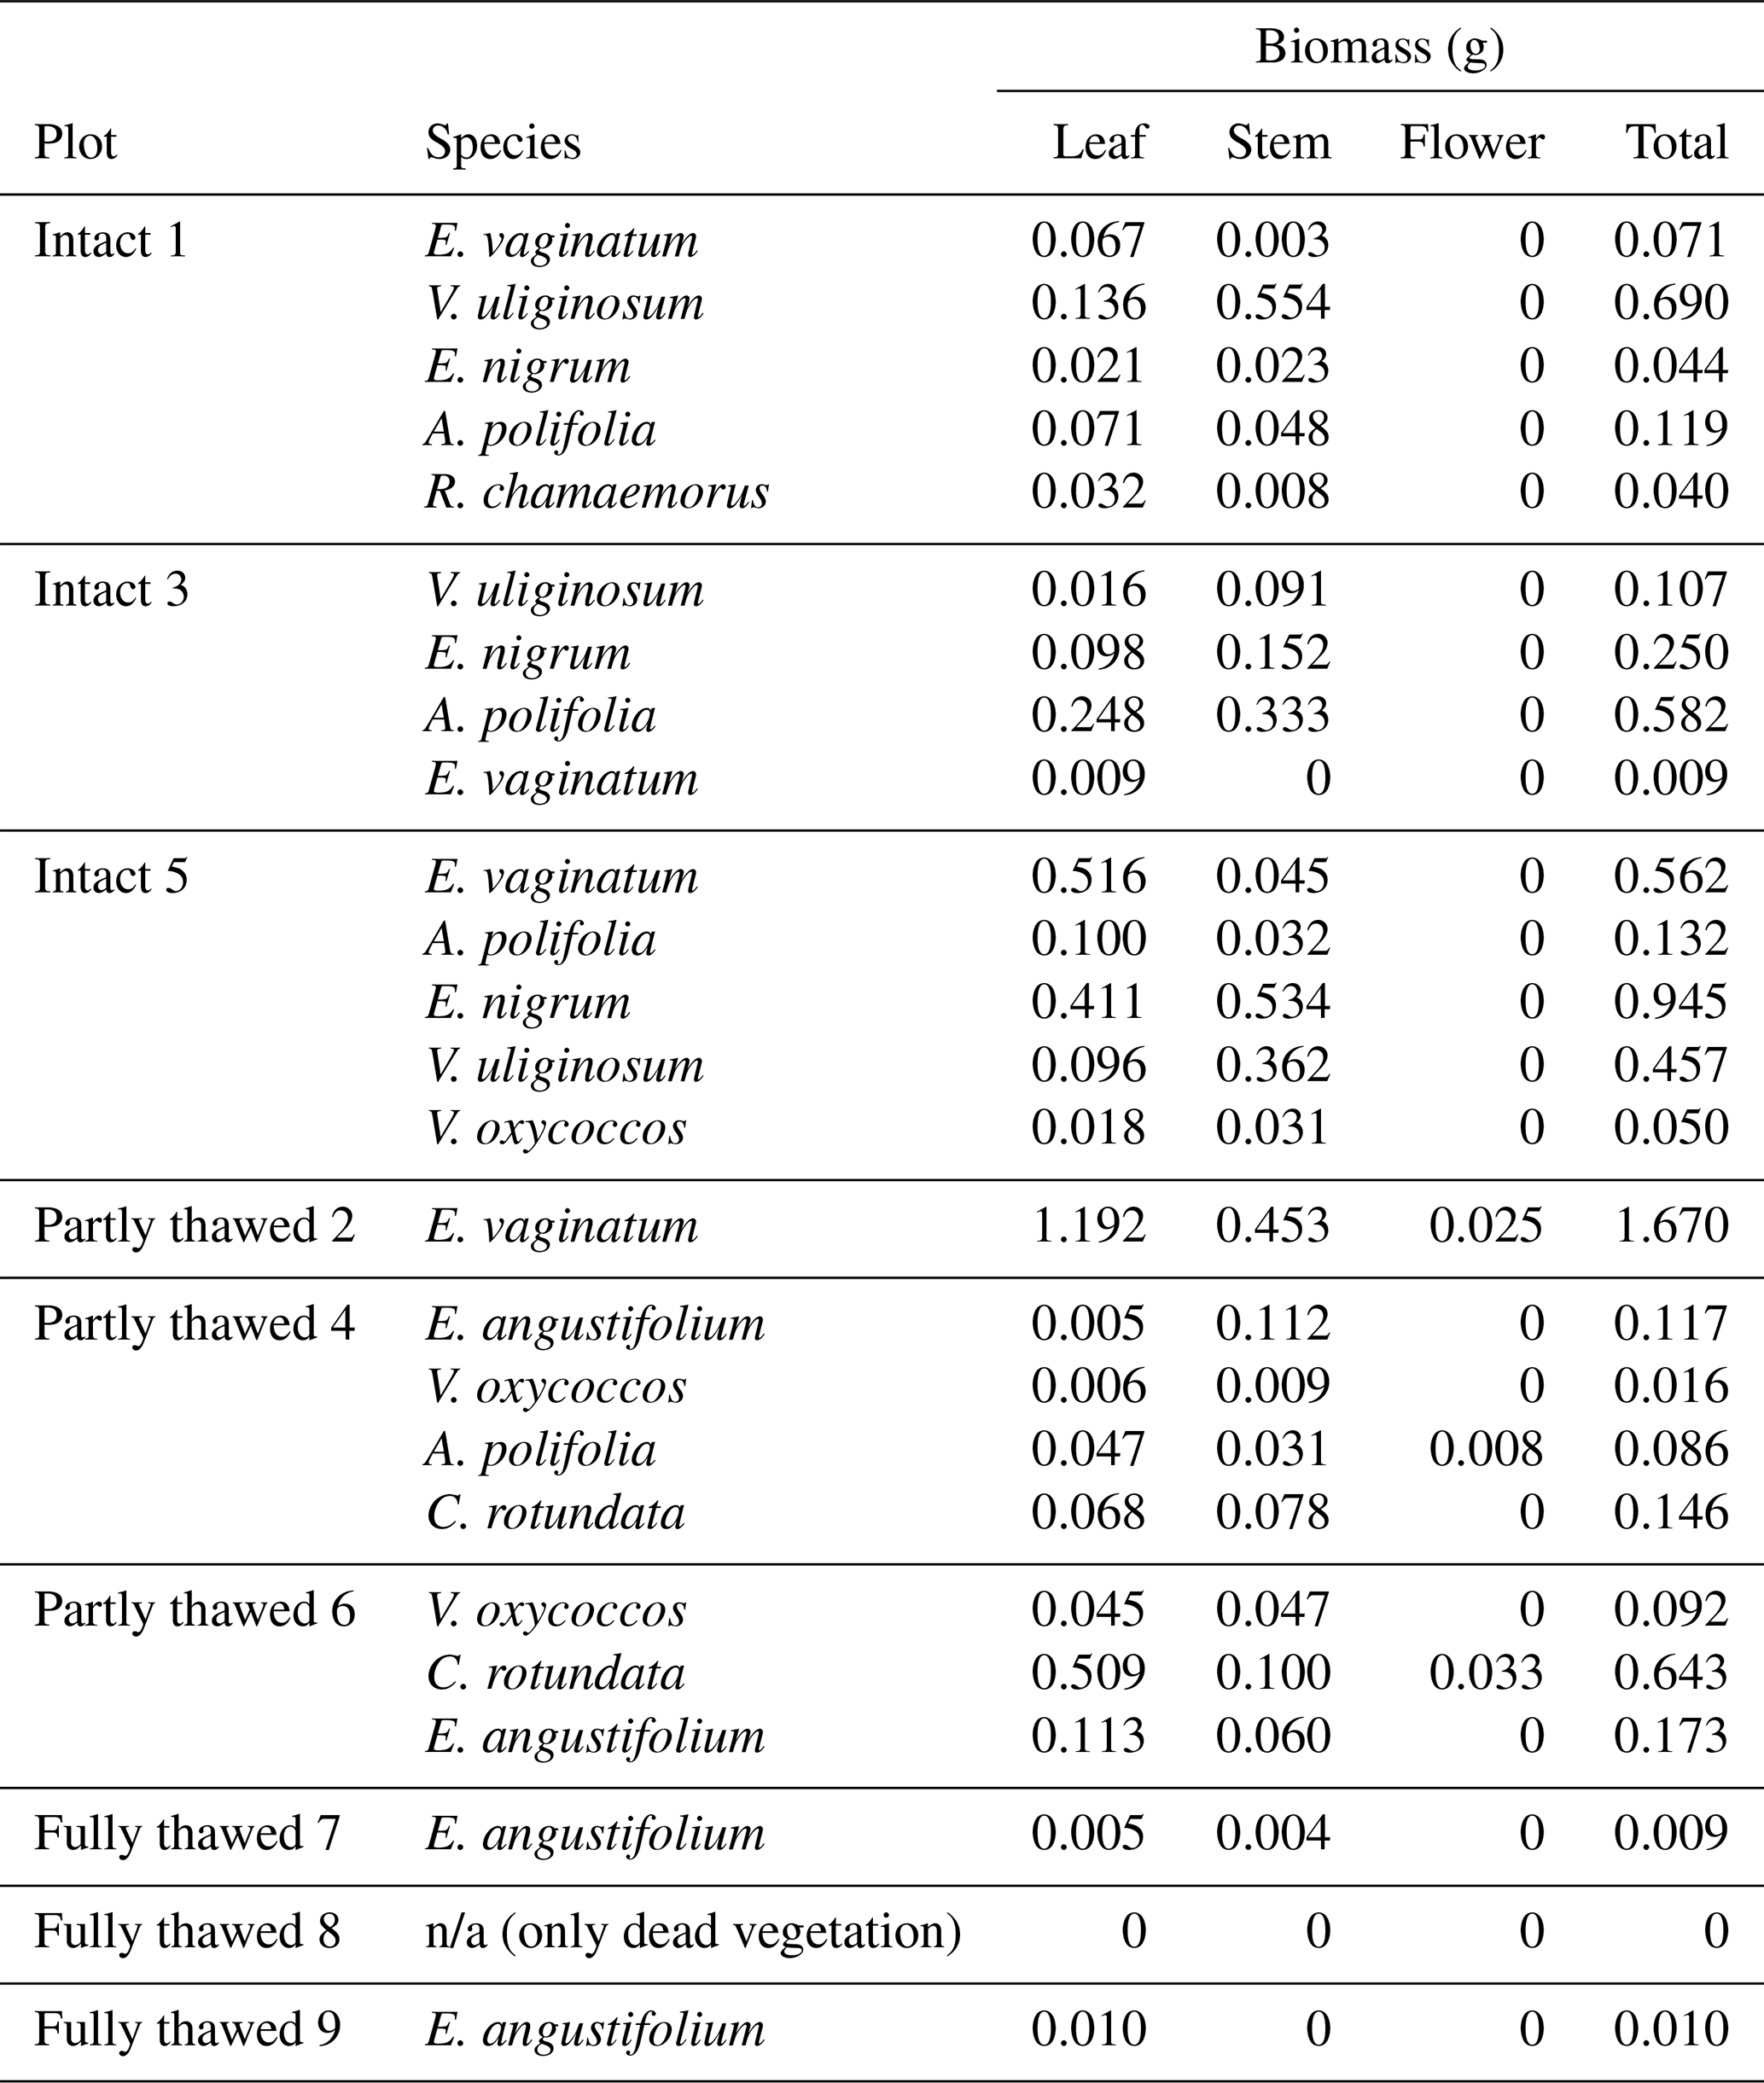
Table C4Results of generalized additive models (GAM) used for determining CH4 flux season values. Note: Intact 2 plot GAM , and the CH4 flux periods are based on moving 7 d medians. CI = 95 % confidence interval.
The R code used for data processing and analysis can be accessed via Zenodo (https://doi.org/10.5281/zenodo.20718440, Määttä, 2026).
The belowground trait and vegetation survey data together with edaphic variables (Määttä and Malhotra, 2026) can be openly accessed at https://doi.org/10.5281/zenodo.18269229. The porewater CH4 and δ13C data (Wilson et al., 2026) is available with open access at https://doi.org/10.5281/zenodo.18363867 (Wilson et al., 2026). The daily-aggregated automated chamber CH4 flux data from 2023 is available with open access at https://doi.org/10.5281/zenodo.22086216 (Varner et al., 2026). The daily-aggregated peat moisture data from 2024 and 2025 is available with open access at https://doi.org/10.5281/zenodo.22091373 (Biasi et al., 2026).
TM and AM conceptualized the study and prepared the original manuscript draft. Data curation and provision of resources was done by TM, RV, PC, SH, RW, SB, and JC. TM conducted the formal analysis, investigation, and visualization, and collected and processed the belowground trait data. Chamber CH4 flux data was collected and provided by RV and PC, and porewater gas data by SH, SB, RW and JC. AM and TM acquired funding for the study and coordinated the project. AM supervised the project. All authors contributed to the review and editing of the manuscript.
The contact author has declared that none of the authors has any competing interests.
Publisher's note: Copernicus Publications remains neutral with regard to jurisdictional claims made in the text, published maps, institutional affiliations, or any other geographical representation in this paper. The authors bear the ultimate responsibility for providing appropriate place names. Views expressed in the text are those of the authors and do not necessarily reflect the views of the publisher.
We thank Melina Bucher and Charmaine Bassfeld for their assistance in the field and laboratory work. We are grateful to Yves Brügger and Thomas Keller for their help in the laboratory at the University of Zurich, and also to Martina Peter, Felix Zimmermann, and Mara Wieser for providing access to, and support in, the laboratory at the Swiss Federal Research Institute WSL. We also thank Christina Biasi and Maija Marushchak for providing the peat moisture data, and Apryl Perry, Carmody McCalley and Cheristy Jones for automated chamber CH4 flux data, and Nitin Chaudhary for valuable insights. We thank Alisa Heuchel, the Swedish Polar Research Secretariat and SITES for the support of the work done at the Abisko Scientific Research Station. SITES is supported by the Swedish Research Council. Porewater and automated chamber flux data were collected and analyzed using funding from the EMERGE Biology Integration Institute, funded by the National Science Foundation, Biology Integration Institutes Program, Award #2022070 awarded to Virginia Rich and RV.
This research has been supported by the Schweizerischer Nationalfonds zur Förderung der Wissenschaftlichen Forschung (grant no. 200021_215214 to AM), the Universität Zürich, Foundation for Research in Science and the Humanities (grant no. STWF-22-028 to AM), the Swiss Polar Institute Polar Access Grant (grant no. PAF-2023-001 to TM) and an Early Career Award from the U.S. Department of Energy, Office of Science, Biological and Environmental Research to AM. RV was funded by the US Department of Energy's Genomic Sciences Program grant (grant no. DE-SC0023456).
This paper was edited by Jack Middelburg and reviewed by Tim Moore and one anonymous referee.
Armstrong, W., Justin, S. H. F. W., Beckett, P. M., and Lythe, S.: Root adaptation to soil waterlogging, Aquat. Bot., 39, 57–73, https://doi.org/10.1016/0304-3770(91)90022-w, 1991.
Bardgett, R. D., Mommer, L., and De Vries, F. T.: Going underground: root traits as drivers of ecosystem processes, Trends Ecol. Evol., 29, 692–699, https://doi.org/10.1016/j.tree.2014.10.006, 2014.
Bäckstrand, K., Crill, P. M., Mastepanov, M., Christensen, T. R., and Bastviken, D.: Non-methane volatile organic compound flux from a subarctic mire in Northern Sweden, Tellus B, 60, 226, https://doi.org/10.1111/j.1600-0889.2007.00331.x, 2008.
Bergmann, J., Weigelt, A., van der Plas, F., Laughlin, D. C., Kuyper, T. W., Guerrero-Ramirez, N., Valverde-Barrantes, O. J., Bruelheide, H., Freschet, G. T., Iversen, C. M., Kattge, J., McCormack, M. L., Meier, I. C., Rillig, M. C., Roumet, C., Semchenko, M., Sweeney, C. J., van Ruijven, J., York, L. M., and Mommer, L.: The fungal collaboration gradient dominates the root economics space in plants, Sci. Adv., 6, https://doi.org/10.1126/sciadv.aba3756, 2020.
Bhullar, G. S., Edwards, P. J., and Olde Venterink, H.: Variation in the plant-mediated methane transport and its importance for methane emission from intact wetland peat mesocosms, J. Plant Ecol., 6, 298–304, https://doi.org/10.1093/jpe/rts045, 2013.
Biasi, C., Kou, D., Määttä, T., Malhotra, A., and Marushchak, M. E.: Daily peat moisture data associated with automated chamber CH4 flux measurements at the Stordalen mire 2024–2025, Zenodo [data set], https://doi.org/10.5281/zenodo.22091373, 2026.
Billings, W. D., Peterson, K. M., and Shaver, G. R.: Growth, turnover, and respiration rates of roots and tillers in tundra graminoids, in: Ecological Studies, Springer New York, New York, NY, 415–434, https://doi.org/10.1007/978-1-4612-6307-4_18, 1978.
Blume-Werry, G., Wilson, S. D., Kreyling, J., and Milbau, A.: The hidden season: growing season is 50 % longer below than above ground along an arctic elevation gradient, New Phytol., 209, 978–986, https://doi.org/10.1111/nph.13655, 2016.
Blume-Werry, G., Milbau, A., Teuber, L. M., Johansson, M., and Dorrepaal, E.: Dwelling in the deep – strongly increased root growth and rooting depth enhance plant interactions with thawing permafrost soil, New Phytol., 223, 1328–1339, https://doi.org/10.1111/nph.15903, 2019.
Bolduc, B., Hodgkins, S. B., Varner, R. K., Crill, P. M., McCalley, C. K., Chanton, J. P., Tyson, G. W., Riley, W. J., Palace, M., Duhaime, M. B., Hough, M. A., Saleska, S. R., Sullivan, M. B., Rich, V. I., and IsoGenie Project Coordinators, IsoGenie Project Team, A2A Project Team: The IsoGenie database: an interdisciplinary data management solution for ecosystems biology and environmental research, PeerJ, 8, e9467, https://doi.org/10.7717/peerj.9467, 2020.
Bouchard, V., Frey, S. D., Gilbert, J. M., and Reed, S. E.: Effects of macrophyte functional group richness on emergent freshwater wetland functions, Ecology, 88, 2903–2914, https://doi.org/10.1890/06-1144.1, 2007.
Bubier, J., Crill, P., Mosedale, A., Frolking, S., and Linder, E.: Peatland responses to varying interannual moisture conditions as measured by automatic CO2 chambers, Global Biogeochem. Cy., 17, https://doi.org/10.1029/2002gb001946, 2003.
Chanton, J. P.: The effect of gas transport on the isotope signature of methane in wetlands, Org. Geochem., 36, 753–768, https://doi.org/10.1016/j.orggeochem.2004.10.007, 2005.
Chanton, J. P. and Dacey, J. W. H.: Effects of vegetation on methane flux, reservoirs, and carbon isotopic composition, in: Trace Gas Emissions by Plants, Elsevier, 65–92, https://doi.org/10.1016/b978-0-12-639010-0.50008-x, 1991.
Christensen, T. R., Johansson, T., Åkerman, H. J., Mastepanov, M., Malmer, N., Friborg, T., Crill, P., and Svensson, B. H.: Thawing sub-arctic permafrost: Effects on vegetation and methane emissions, Geophys. Res. Lett., 31, https://doi.org/10.1029/2003gl018680, 2004.
Crill, P., McCalley, C., and Crew, A. F.: Manual active layer and and water table depth measurements from the autochamber sites at Stordalen Mire, northern Sweden (2003–2017), https://doi.org/10.5281/zenodo.10420396, 2023.
Delwiche, K. B., Knox, S. H., Malhotra, A., Fluet-Chouinard, E., McNicol, G., Feron, S., Ouyang, Z., Papale, D., Trotta, C., Canfora, E., Cheah, Y.-W., Christianson, D., Alberto, Ma. C. R., Alekseychik, P., Aurela, M., Baldocchi, D., Bansal, S., Billesbach, D. P., Bohrer, G., Bracho, R., Buchmann, N., Campbell, D. I., Celis, G., Chen, J., Chen, W., Chu, H., Dalmagro, H. J., Dengel, S., Desai, A. R., Detto, M., Dolman, H., Eichelmann, E., Euskirchen, E., Famulari, D., Fuchs, K., Goeckede, M., Gogo, S., Gondwe, M. J., Goodrich, J. P., Gottschalk, P., Graham, S. L., Heimann, M., Helbig, M., Helfter, C., Hemes, K. S., Hirano, T., Hollinger, D., Hörtnagl, L., Iwata, H., Jacotot, A., Jurasinski, G., Kang, M., Kasak, K., King, J., Klatt, J., Koebsch, F., Krauss, K. W., Lai, D. Y. F., Lohila, A., Mammarella, I., Belelli Marchesini, L., Manca, G., Matthes, J. H., Maximov, T., Merbold, L., Mitra, B., Morin, T. H., Nemitz, E., Nilsson, M. B., Niu, S., Oechel, W. C., Oikawa, P. Y., Ono, K., Peichl, M., Peltola, O., Reba, M. L., Richardson, A. D., Riley, W., Runkle, B. R. K., Ryu, Y., Sachs, T., Sakabe, A., Sanchez, C. R., Schuur, E. A., Schäfer, K. V. R., Sonnentag, O., Sparks, J. P., Stuart-Haëntjens, E., Sturtevant, C., Sullivan, R. C., Szutu, D. J., Thom, J. E., Torn, M. S., Tuittila, E.-S., Turner, J., Ueyama, M., Valach, A. C., Vargas, R., Varlagin, A., Vazquez-Lule, A., Verfaillie, J. G., Vesala, T., Vourlitis, G. L., Ward, E. J., Wille, C., Wohlfahrt, G., Wong, G. X., Zhang, Z., Zona, D., Windham-Myers, L., Poulter, B., and Jackson, R. B.: FLUXNET-CH4: a global, multi-ecosystem dataset and analysis of methane seasonality from freshwater wetlands , Earth Syst. Sci. Data, 13, 3607–3689, https://doi.org/10.5194/essd-13-3607-2021, 2021.
Dong, N., Prentice, I. C., Wright, I. J., Evans, B. J., Togashi, H. F., Caddy-Retalic, S., McInerney, F. A., Sparrow, B., Leitch, E., and Lowe, A. J.: Components of leaf-trait variation along environmental gradients, New Phytol., 228, 82–94, https://doi.org/10.1111/nph.16558, 2020.
Eissenstat, D. M., Wells, C. E., Yanai, R. D., and Whitbeck, J. L.: Building roots in a changing environment: implications for root longevity, New Phytol., 147, 33–42, https://doi.org/10.1046/j.1469-8137.2000.00686.x, 2000.
Eklundh, L. and Jönsson, P.: TIMESAT: A software package for time-series processing and assessment of vegetation dynamics, in: Remote Sensing Time Series, Springer International Publishing, Cham, 141–158, https://doi.org/10.1007/978-3-319-15967-6_7, 2015.
Freschet, G. T., Pagès, L., Iversen, C. M., Comas, L. H., Rewald, B., Roumet, C., Klimešová, J., Zadworny, M., Poorter, H., Postma, J. A., Adams, T. S., Bagniewska-Zadworna, A., Bengough, A. G., Blancaflor, E. B., Brunner, I., Cornelissen, J. H. C., Garnier, E., Gessler, A., Hobbie, S. E., Meier, I. C., Mommer, L., Picon-Cochard, C., Rose, L., Ryser, P., Scherer-Lorenzen, M., Soudzilovskaia, N. A., Stokes, A., Sun, T., Valverde-Barrantes, O. J., Weemstra, M., Weigelt, A., Wurzburger, N., York, L. M., Batterman, S. A., Gomes de Moraes, M., Janeček, Š., Lambers, H., Salmon, V., Tharayil, N., and McCormack, M. L.: A starting guide to root ecology: strengthening ecological concepts and standardising root classification, sampling, processing and trait measurements, New Phytol., 232, 973–1122, https://doi.org/10.1111/nph.17572, 2021a.
Freschet, G. T., Roumet, C., Comas, L. H., Weemstra, M., Bengough, A. G., Rewald, B., Bardgett, R. D., De Deyn, G. B., Johnson, D., Klimešová, J., Lukac, M., McCormack, M. L., Meier, I. C., Pagès, L., Poorter, H., Prieto, I., Wurzburger, N., Zadworny, M., Bagniewska-Zadworna, A., Blancaflor, E. B., Brunner, I., Gessler, A., Hobbie, S. E., Iversen, C. M., Mommer, L., Picon-Cochard, C., Postma, J. A., Rose, L., Ryser, P., Scherer-Lorenzen, M., Soudzilovskaia, N. A., Sun, T., Valverde-Barrantes, O. J., Weigelt, A., York, L. M., and Stokes, A.: Root traits as drivers of plant and ecosystem functioning: current understanding, pitfalls and future research needs, New Phytol., 232, 1123–1158, https://doi.org/10.1111/nph.17072, 2021b.
Fritz, C., Pancotto, V. A., Elzenga, J. T. M., Visser, E. J. W., Grootjans, A. P., Pol, A., Iturraspe, R., Roelofs, J. G. M., and Smolders, A. J. P.: Zero methane emission bogs: extreme rhizosphere oxygenation by cushion plants in Patagonia, New Phytol., 190, 398–408, https://doi.org/10.1111/j.1469-8137.2010.03604.x, 2011.
Gao, Y., Wang, H., Yang, F., Dai, X., Meng, S., Hu, M., Kou, L., and Fu, X.: Relationships between root exudation and root morphological and architectural traits vary with growing season, Tree Physiol., 44, 118, https://doi.org/10.1093/treephys/tpad118, 2024.
Ge, M., Korrensalo, A., Putkinen, A., Laiho, R., Kohl, L., Pihlatie, M., Lohila, A., Mäkiranta, P., Siljanen, H., Tuittila, E.-S., Wang, J., and Koskinen, M.: CH4 transport in wetland plants under controlled environmental conditions – separating the impacts of phenology from environmental variables, Plant Soil, 507, 671–691, https://doi.org/10.1007/s11104-024-06756-x, 2025.
Gorham, E.: Northern peatlands: Role in the carbon cycle and probable responses to climatic warming, Ecol. Appl., 1, 182–195, https://doi.org/10.2307/1941811, 1991.
Gray, A., Levy, P. E., Cooper, M. D. A., Jones, T., Gaiawyn, J., Leeson, S. R., Ward, S. E., Dinsmore, K. J., Drewer, J., Sheppard, L. J., Ostle, N. J., Evans, C. D., Burden, A., and Zieliński, P.: Methane indicator values for peatlands: a comparison of species and functional groups, Glob. Change Biol., 19, 1141–1150, https://doi.org/10.1111/gcb.12120, 2013.
Greenup, A., Bradford, M., Mcnamara, N., Ineson, P., and Lee, J.: The role of Eriophorum vaginatum in CH4 flux from an ombrotrophic peatland, Plant Soil, 227, 265–272, 2000.
Guyonnet, J. P., Cantarel, A. A. M., Simon, L., and Haichar, F. E. Z.: Root exudation rate as functional trait involved in plant nutrient-use strategy classification, Ecol. Evol., 8, 8573–8581, https://doi.org/10.1002/ece3.4383, 2018.
Hackney, C. T. and De La Cruz, A. A.: In situ decomposition of roots and rhizomes of two tidal marsh plants, Ecology, 61, 226–231, https://doi.org/10.2307/1935178, 1980.
Henneberg, A., Brix, H., and Sorrell, B. K.: The interactive effect of Juncus effusus and water table position on mesocosm methanogenesis and methane emissions, Plant Soil, 400, 45–54, https://doi.org/10.1007/s11104-015-2707-y, 2016.
Hewitt, R. E., Taylor, D. L., Genet, H., McGuire, A. D., and Mack, M. C.: Below-ground plant traits influence tundra plant acquisition of newly thawed permafrost nitrogen, J. Ecol., 107, 950–962, https://doi.org/10.1111/1365-2745.13062, 2019.
Hodgkins, S. B., Tfaily, M. M., McCalley, C. K., Logan, T. A., Crill, P. M., Saleska, S. R., Rich, V. I., and Chanton, J. P.: Changes in peat chemistry associated with permafrost thaw increase greenhouse gas production, P. Natl. Acad. Sci. USA, 111, 5819–5824, https://doi.org/10.1073/pnas.1314641111, 2014.
Hogg, E. H.: Decay potential of hummock and hollow sphagnum peats at different depths in a Swedish raised bog, Oikos, 66, 269, https://doi.org/10.2307/3544814, 1993.
Holmes, M. E., Crill, P. M., Burnett, W. C., McCalley, C. K., Wilson, R. M., Frolking, S., Chang, K.-Y., Riley, W. J., Varner, R. K., Hodgkins, S. B., McNichol, A. P., Saleska, S. R., Rich, V. I., Chanton, J. P., IsoGenie Project Coordinators, and IsoGenie Field Team: Carbon accumulation, flux, and fate in stordalen mire, a permafrost peatland in transition, Global Biogeochem. Cy., 36, https://doi.org/10.1029/2021gb007113, 2022.
Hough, M., McCabe, S., Vining, S. R., Pickering Pedersen, E., Wilson, R. M., Lawrence, R., Chang, K.-Y., Bohrer, G., IsoGenie Coordinators, Riley, W. J., Crill, P. M., Varner, R. K., Blazewicz, S. J., Dorrepaal, E., Tfaily, M. M., Saleska, S. R., and Rich, V. I.: Coupling plant litter quantity to a novel metric for litter quality explains C storage changes in a thawing permafrost peatland, Glob. Change Biol., 28, 950–968, https://doi.org/10.1111/gcb.15970, 2022.
Husby, C.: Biology and functional ecology of Equisetum with emphasis on the giant horsetails, Bot. Rev., 79, 147–177, https://doi.org/10.1007/s12229-012-9113-4, 2013.
Hyvönen, T., Ojala, A., Kankaala, P., and Martikainen, P. J.: Methane release from stands of water horsetail (Equisetum fluviatile) in a boreal lake, Freshwater Biol., 40, 275–284, https://doi.org/10.1046/j.1365-2427.1998.00351.x, 1998.
Iversen, C. M., Murphy, M. T., Allen, M. F., Childs, J., Eissenstat, D. M., Lilleskov, E. A., Sarjala, T. M., Sloan, V. L., and Sullivan, P. F.: Advancing the use of minirhizotrons in wetlands, Plant Soil, 352, 23–39, https://doi.org/10.1007/s11104-011-0953-1, 2012.
Iversen, C. M., Sloan, V. L., Sullivan, P. F., Euskirchen, E. S., McGuire, A. D., Norby, R. J., Walker, A. P., Warren, J. M., and Wullschleger, S. D.: The unseen iceberg: plant roots in arctic tundra, New Phytol., 205, 34–58, https://doi.org/10.1111/nph.13003, 2015.
Jackson, M. and Armstrong, W.: Formation of aerenchyma and the processes of plant ventilation in relation to soil flooding and submergence, Plant Biol.-Stuttg., 1, 274–287, https://doi.org/10.1055/s-2007-978516, 1999.
Joabsson, A. and Christensen, T. R.: Methane emissions from wetlands and their relationship with vascular plants: an Arctic example: METHANE EMISSION and VASCULAR PLANTS, Glob. Change Biol., 7, 919–932, https://doi.org/10.1046/j.1354-1013.2001.00044.x, 2001.
Johansson, T., Malmer, N., Crill, P. M., Friborg, T., Åkerman, J. H., Mastepanov, M., and Christensen, T. R.: Decadal vegetation changes in a northern peatland, greenhouse gas fluxes and net radiative forcing, Glob. Change Biol., 12, 2352–2369, https://doi.org/10.1111/j.1365-2486.2006.01267.x, 2006.
Johnston, C. E., Ewing, S. A., Harden, J. W., Varner, R. K., Wickland, K. P., Koch, J. C., Fuller, C. C., Manies, K., and Jorgenson, M. T.: Effect of permafrost thaw on CO2 and CH4 exchange in a western Alaska peatland chronosequence, Environ. Res. Lett., 9, 085004, https://doi.org/10.1088/1748-9326/9/8/085004, 2014.
Jönsson, P. and Eklundh, L.: Seasonality extraction by function fitting to time-series of satellite sensor data, IEEE T. Geosci. Remote, 40, 1824–1832, https://doi.org/10.1109/tgrs.2002.802519, 2002.
Kankaala, P. and Bergström, I.: Emission and oxidation of methane in Equisetum fluviatile stands growing on organic sediment and sand bottoms, Biogeochemistry, 67, 21–37, https://doi.org/10.1023/b:biog.0000015277.17288.7a, 2004.
Keuper, F., Dorrepaal, E., van Bodegom, P. M., van Logtestijn, R., Venhuizen, G., van Hal, J., and Aerts, R.: Experimentally increased nutrient availability at the permafrost thaw front selectively enhances biomass production of deep-rooting subarctic peatland species, Glob. Change Biol., 23, 4257–4266, https://doi.org/10.1111/gcb.13804, 2017.
Kichenin, E., Wardle, D. A., Peltzer, D. A., Morse, C. W., and Freschet, G. T.: Contrasting effects of plant inter- and intraspecific variation on community-level trait measures along an environmental gradient, Funct. Ecol., 27, 1254–1261, https://doi.org/10.1111/1365-2435.12116, 2013.
Knoblauch, C., Beer, C., Liebner, S., Grigoriev, M. N., and Pfeiffer, E.-M.: Methane production as key to the greenhouse gas budget of thawing permafrost, Nat. Clim. Change, 8, 309–312, https://doi.org/10.1038/s41558-018-0095-z, 2018.
Knox, S. H., Bansal, S., McNicol, G., Schafer, K., Sturtevant, C., Ueyama, M., Valach, A. C., Baldocchi, D., Delwiche, K., Desai, A. R., Euskirchen, E., Liu, J., Lohila, A., Malhotra, A., Melling, L., Riley, W., Runkle, B. R. K., Turner, J., Vargas, R., Zhu, Q., Alto, T., Fluet-Chouinard, E., Goeckede, M., Melton, J. R., Sonnentag, O., Vesala, T., Ward, E., Zhang, Z., Feron, S., Ouyang, Z., Alekseychik, P., Aurela, M., Bohrer, G., Campbell, D. I., Chen, J., Chu, H., Dalmagro, H. J., Goodrich, J. P., Gottschalk, P., Hirano, T., Iwata, H., Jurasinski, G., Kang, M., Koebsch, F., Mammarella, I., Nilsson, M. B., Ono, K., Peichl, M., Peltola, O., Ryu, Y., Sachs, T., Sakabe, A., Sparks, J. P., Tuittila, E.-S., Vourlitis, G. L., Wong, G. X., Windham-Myers, L., Poulter, B., and Jackson, R. B.: Identifying dominant environmental predictors of freshwater wetland methane fluxes across diurnal to seasonal time scales, Glob. Change Biol., 27, 3582–3604, https://doi.org/10.1111/gcb.15661, 2021.
Koelbener, A., Ström, L., Edwards, P. J., and Olde Venterink, H.: Plant species from mesotrophic wetlands cause relatively high methane emissions from peat soil, Plant Soil, 326, 147–158, https://doi.org/10.1007/s11104-009-9989-x, 2010.
Končalová, H.: Anatomical adaptations to waterlogging in roots of wetland graminoids: limitations and drawbacks, Aquat. Bot., 38, 127–134, https://doi.org/10.1016/0304-3770(90)90102-q, 1990.
Körner, C., Möhl, P., and Hiltbrunner, E.: Four ways to define the growing season, Ecol. Lett., 26, 1277–1292, https://doi.org/10.1111/ele.14260, 2023.
Kummerow, J. and Russell, M.: Seasonal root growth in the arctic tussock tundra, Oecologia, 47, 196–199, https://doi.org/10.1007/BF00346820, 1980.
Laanbroek, H. J.: Methane emission from natural wetlands: interplay between emergent macrophytes and soil microbial processes. A mini-review, Ann. Bot., 105, 141–153, https://doi.org/10.1093/aob/mcp201, 2010.
Laine, A. M., Korrensalo, A., and Tuittila, E.-S.: Plant functional traits play the second fiddle to plant functional types in explaining peatland CO2 and CH4 gas exchange, Sci. Total Environ., 834, 155352, https://doi.org/10.1016/j.scitotenv.2022.155352, 2022.
Łakomiec, P., Holst, J., Friborg, T., Crill, P., Rakos, N., Kljun, N., Olsson, P.-O., Eklundh, L., Persson, A., and Rinne, J.: Field-scale CH4 emission at a subarctic mire with heterogeneous permafrost thaw status, Biogeosciences, 18, 5811–5830, https://doi.org/10.5194/bg-18-5811-2021, 2021.
Larmola, T., Tuittila, E.-S., Tiirola, M., Nykänen, H., Martikainen, P. J., Yrjälä, K., Tuomivirta, T., and Fritze, H.: The role of Sphagnum mosses in the methane cycling of a boreal mire, Ecology, 91, 2356–2365, https://doi.org/10.1890/09-1343.1, 2010.
Lawrence, D. M., Slater, A. G., Romanovsky, V. E., and Nicolsky, D. J.: Sensitivity of a model projection of near-surface permafrost degradation to soil column depth and representation of soil organic matter, J. Geophys. Res., 113, https://doi.org/10.1029/2007jf000883, 2008.
Lê, S., Josse, J., and Husson, F.: FactoMineR: AnRPackage for Multivariate Analysis, J. Stat. Softw., 25, https://doi.org/10.18637/jss.v025.i01, 2008.
Lundin, E., Crill, P., Grudd, H., Holst, J., Kristoffersson, A., Meire, A., Mölder, M., and Rakos, N.: ETC L2 Fluxnet (half-hourly) from Abisko-Stordalen Palsa Bog, 2021-12-31–2023-08-31, ICOS RI [data set], https://hdl.handle.net/11676/JFtuqWbso4iTRa0UFYalE-4X (last access: 15 November 2025), 2023
Luoto, M., Heikkinen, R. K., and Carter, T. R.: Loss of palsa mires in Europe and biological consequences, Environ. Conserv., 31, 30–37, https://doi.org/10.1017/s0376892904001018, 2004.
Määttä, T.: Code for Increased plant mediated methane transport along a peatland permafrost thaw gradient, version v1, Zenodo [code], https://doi.org/10.5281/zenodo.20718440, 2026.
Määttä, T. and Malhotra, A.: The hidden roots of wetland methane emissions, Glob. Change Biol., 30, e17127, https://doi.org/10.1111/gcb.17127, 2024.
Määttä, T. and Malhotra, A.: Plant belowground trait and vegetation survey data from the Stordalen mire 2023, Zenodo [data set], https://doi.org/10.5281/zenodo.18269229, 2026.
Malhotra, A. and Roulet, N. T.: Environmental correlates of peatland carbon fluxes in a thawing landscape: do transitional thaw stages matter?, Biogeosciences, 12, 3119–3130, https://doi.org/10.5194/bg-12-3119-2015, 2015.
Man, M., Kalčík, V., Macek, M., Brůna, J., Hederová, L., Wild, J., and Kopecký, M.: myClim: Microclimate data handling and standardised analyses in R, Methods Ecol. Evol., 14, 2308–2320, 2023.
McCalley, C. K., Woodcroft, B. J., Hodgkins, S. B., Wehr, R. A., Kim, E.-H., Mondav, R., Crill, P. M., Chanton, J. P., Rich, V. I., Tyson, G. W., and Saleska, S. R.: Methane dynamics regulated by microbial community response to permafrost thaw, Nature, 514, 478–481, https://doi.org/10.1038/nature13798, 2014.
McCormack, M. L., Dickie, I. A., Eissenstat, D. M., Fahey, T. J., Fernandez, C. W., Guo, D., Helmisaari, H.-S., Hobbie, E. A., Iversen, C. M., Jackson, R. B., Leppälammi-Kujansuu, J., Norby, R. J., Phillips, R. P., Pregitzer, K. S., Pritchard, S. G., Rewald, B., and Zadworny, M.: Redefining fine roots improves understanding of below-ground contributions to terrestrial biosphere processes, New Phytol., 207, 505–518, https://doi.org/10.1111/nph.13363, 2015.
McGuire, A. D., Anderson, L. G., Christensen, T. R., Dallimore, S., Guo, L., Hayes, D. J., Heimann, M., Lorenson, T. D., Macdonald, R. W., and Roulet, N.: Sensitivity of the carbon cycle in the Arctic to climate change, Ecol. Monogr., 79, 523–555, https://doi.org/10.1890/08-2025.1, 2009.
Merritt, D. A., Hayes, J. M., and Des Marais, D. J.: Carbon isotopic analysis of atmospheric methane by isotope-ratio-monitoring gas chromatography-mass spectrometry, J. Geophys. Res., 100, 1317–1326, https://doi.org/10.1029/94jd02689, 1995.
Metsävainio, K.: Untersuchungen über das Wurzelsystem der Moorpflanzen, Annales Botanici Societatis Zoologicae-Botanicae Fennicae Vanamo, 1, 1–422, 1931.
Mollenkopf, M., Lenge, K., Drabesch, S., Monteux, S., van Grinsven, S., Joshi, P., Dorrepaal, E., Wild, B., Kappler, A., and Muehe, E. M.: Graminoids increase greenhouse gas emissions from thawed permafrost at the end of the growing season, Glob. Change Biol., 32, e70783, https://doi.org/10.1111/gcb.70783, 2026.
Mondav, R., Woodcroft, B. J., Kim, E.-H., McCalley, C. K., Hodgkins, S. B., Crill, P. M., Chanton, J., Hurst, G. B., VerBerkmoes, N. C., Saleska, S. R., Hugenholtz, P., Rich, V. I., and Tyson, G. W.: Discovery of a novel methanogen prevalent in thawing permafrost, Nat. Commun., 5, 3212, https://doi.org/10.1038/ncomms4212, 2014.
Moor, H., Rydin, H., Hylander, K., Nilsson, M. B., Lindborg, R., and Norberg, J.: Towards a trait-based ecology of wetland vegetation, J. Ecol., 105, 1623–1635, https://doi.org/10.1111/1365-2745.12734, 2017.
Noyce, G. L., Varner, R. K., Bubier, J. L., and Frolking, S.: Effect ofCarex rostrataon seasonal and interannual variability in peatland methane emissions, J. Geophys. Res.-Biogeo., 119, 24–34, https://doi.org/10.1002/2013jg002474, 2014.
Noyce, G. L., Smith, A. J., Kirwan, M. L., Rich, R. L., and Megonigal, J. P.: Oxygen priming induced by elevated CO2 reduces carbon accumulation and methane emissions in coastal wetlands, Nat. Geosci., 16, 63–68, https://doi.org/10.1038/s41561-022-01070-6, 2023.
Oksanen, J., Simpson, G. L., Blanchet, F. G., Kindt, R., Legendre, P., Minchin, P. R., O'Hara, R. B., Solymos, P., Stevens, M. H. H., Szoecs, E., Wagner, H., Barbour, M., Bedward, M., Bolker, B., Borcard, D., Carvalho, G., Chirico, M., De Caceres, M., Durand, S., Evangelista, H., FitzJohn, R., Friendly, M., Furneaux, B., Hannigan, G., Heida, I., Hill, M. O., Lahti, L., Martino, C., McGlinn, D., Ouellette, M.-H., Ribeiro Cunha, E., Smith, T., Stier, A., Ter Braak, C. J. F., and Weedon, J.: vegan: Community Ecology Package, R package version 2.7-2, CRAN [code], https://doi.org/10.32614/CRAN.package.vegan, 2025.
Olefeldt, D., Turetsky, M. R., Crill, P. M., and McGuire, A. D.: Environmental and physical controls on northern terrestrial methane emissions across permafrost zones, Glob. Change Biol., 19, 589–603, https://doi.org/10.1111/gcb.12071, 2013.
Olvmo, M., Holmer, B., Thorsson, S., Reese, H., and Lindberg, F.: Sub-arctic palsa degradation and the role of climatic drivers in the largest coherent palsa mire complex in Sweden (Vissátvuopmi), 1955–2016, Sci. Rep., 10, 8937, https://doi.org/10.1038/s41598-020-65719-1, 2020.
Öquist, M. G. and Svensson, B. H.: Vascular plants as regulators of methane emissions from a subarctic mire ecosystem, J. Geophys. Res.-Atmos., 107, ACL 10-1–ACL 10-10, https://doi.org/10.1029/2001JD001030, 2002.
Ouyang, W., Mueller, F., Hjelmare, M., Lundberg, E., and Zimmer, C.: ImJoy: an open-source computational platform for the deep learning era, Nat. Methods, 16, 1199–1200, https://doi.org/10.1038/s41592-019-0627-0, 2019.
Palace, M., Herrick, C., DelGreco, J., Finnell, D., Garnello, A. J., McCalley, C., McArthur, K., Sullivan, F., and Varner, R. K.: Determining subarctic peatland vegetation using an unmanned aerial system (UAS), Remote Sens.-Basel, 10, 1498, https://doi.org/10.3390/rs10091498, 2018.
Palace, M., Varner, R., Crill, P. M., Frolking, S., McCalley, C. K., Burke, S. A., Chanton, J. P., and Holmes, M. E.: Isogenie Project Coordinators, and Saleska, S.: Stordalen Mire ground cover classifications, based on 2014 WorldView-2 satellite imagery (version 0.0.0), EMERGE Biology Integration Institute, Ohio State University [data set], https://emerge-db.asc.ohio-state.edu/datasources/0145_Wv2-2014_GroundCoverClassifications (last access: 9 July 2025), 2022.
Pan, Y., Cieraad, E., and van Bodegom, P. M.: Are ecophysiological adaptive traits decoupled from leaf economics traits in wetlands?, Funct. Ecol., 33, 1202–1210, https://doi.org/10.1111/1365-2435.13329, 2019.
Pastorello, G., Trotta, C., Canfora, E., Chu, H., Christianson, D., Cheah, Y.-W., Poindexter, C., Chen, J., Elbashandy, A., Humphrey, M., Isaac, P., Polidori, D., Reichstein, M., Ribeca, A., van Ingen, C., Vuichard, N., Zhang, L., Amiro, B., Ammann, C., Arain, M. A., Ardö, J., Arkebauer, T., Arndt, S. K., Arriga, N., Aubinet, M., Aurela, M., Baldocchi, D., Barr, A., Beamesderfer, E., Belelli Marchesini, L., Bergeron, O., Beringer, J., Bernhofer, C., Berveiller, D., Billesbach, D., Black, T. A., Blanken, P. D., Bohrer, G., Boike, J., Bolstad, P. V., Bonal, D., Bonnefond, J.-M., Bowling, D. R., Bracho, R., Brodeur, J., Brümmer, C., Buchmann, N., Burban, B., Burns, S. P., Buysse, P., Cale, P., Cavagna, M., Cellier, P., Chen, S., Chini, I., Christensen, T. R., Cleverly, J., Collalti, A., Consalvo, C., Cook, B. D., Cook, D., Coursolle, C., Cremonese, E., Curtis, P. S., D'Andrea, E., da Rocha, H., Dai, X., Davis, K. J., De Cinti, B., de Grandcourt, A., De Ligne, A., De Oliveira, R. C., Delpierre, N., Desai, A. R., Di Bella, C. M., di Tommasi, P., Dolman, H., Domingo, F., Dong, G., Dore, S., Duce, P., Dufrêne, E., Dunn, A., Dušek, J., Eamus, D., Eichelmann, U., ElKhidir, H. A. M., Eugster, W., Ewenz, C. M., Ewers, B., Famulari, D., Fares, S., Feigenwinter, I., Feitz, A., Fensholt, R., Filippa, G., Fischer, M., Frank, J., Galvagno, M., Gharun, M., Gianelle, D., Gielen, B., Gioli, B., Gitelson, A., Goded, I., Goeckede, M., Goldstein, A. H., Gough, C. M., Goulden, M. L., Graf, A., Griebel, A., Gruening, C., Grünwald, T., Hammerle, A., Han, S., Han, X., Hansen, B. U., Hanson, C., Hatakka, J., He, Y., Hehn, M., Heinesch, B., Hinko-Najera, N., Hörtnagl, L., Hutley, L., Ibrom, A., Ikawa, H., Jackowicz-Korczynski, M., Janouš, D., Jans, W., Jassal, R., Jiang, S., Kato, T., Khomik, M., Klatt, J., Knohl, A., Knox, S., Kobayashi, H., Koerber, G., Kolle, O., Kosugi, Y., Kotani, A., Kowalski, A., Kruijt, B., Kurbatova, J., Kutsch, W. L., Kwon, H., Launiainen, S., Laurila, T., Law, B., Leuning, R., Li, Y., Liddell, M., Limousin, J.-M., Lion, M., Liska, A. J., Lohila, A., López-Ballesteros, A., López-Blanco, E., Loubet, B., Loustau, D., Lucas-Moffat, A., Lüers, J., Ma, S., Macfarlane, C., Magliulo, V., Maier, R., Mammarella, I., Manca, G., Marcolla, B., Margolis, H. A., Marras, S., Massman, W., Mastepanov, M., Matamala, R., Matthes, J. H., Mazzenga, F., McCaughey, H., McHugh, I., McMillan, A. M. S., Merbold, L., Meyer, W., Meyers, T., Miller, S. D., Minerbi, S., Moderow, U., Monson, R. K., Montagnani, L., Moore, C. E., Moors, E., Moreaux, V., Moureaux, C., Munger, J. W., Nakai, T., Neirynck, J., Nesic, Z., Nicolini, G., Noormets, A., Northwood, M., Nosetto, M., Nouvellon, Y., Novick, K., Oechel, W., Olesen, J. E., Ourcival, J.-M., Papuga, S. A., Parmentier, F.-J., Paul-Limoges, E., Pavelka, M., Peichl, M., Pendall, E., Phillips, R. P., Pilegaard, K., Pirk, N., Posse, G., Powell, T., Prasse, H., Prober, S. M., Rambal, S., Rannik, Ü., Raz-Yaseef, N., Rebmann, C., Reed, D., Resco de Dios, V., Restrepo-Coupe, N., Reverter, B. R., Roland, M., Sabbatini, S., Sachs, T., Saleska, S. R., Sánchez-Cañete, E. P., Sanchez-Mejia, Z. M., Schmid, H. P., Schmidt, M., Schneider, K., Schrader, F., Schroder, I., Scott, R. L., Sedlák, P., Serrano-Ortíz, P., Shao, C., Shi, P., Shironya, I., Siebicke, L., Šigut, L., Silberstein, R., Sirca, C., Spano, D., Steinbrecher, R., Stevens, R. M., Sturtevant, C., Suyker, A., Tagesson, T., Takanashi, S., Tang, Y., Tapper, N., Thom, J., Tomassucci, M., Tuovinen, J.-P., Urbanski, S., Valentini, R., van der Molen, M., van Gorsel, E., van Huissteden, K., Varlagin, A., Verfaillie, J., Vesala, T., Vincke, C., Vitale, D., Vygodskaya, N., Walker, J. P., Walter-Shea, E., Wang, H., Weber, R., Westermann, S., Wille, C., Wofsy, S., Wohlfahrt, G., Wolf, S., Woodgate, W., Li, Y., Zampedri, R., Zhang, J., Zhou, G., Zona, D., Agarwal, D., Biraud, S., Torn, M., and Papale, D.: The FLUXNET2015 dataset and the ONEFlux processing pipeline for eddy covariance data, Sci. Data, 7, 225, https://doi.org/10.1038/s41597-020-0534-3, 2020.
Perryman, C. R., McCalley, C. K., Malhotra, A., Fahnestock, M. F., Kashi, N. N., Bryce, J. G., Giesler, R., and Varner, R. K.: Thaw transitions and redox conditions drive methane oxidation in a permafrost peatland, J. Geophys. Res.-Biogeo., 125, https://doi.org/10.1029/2019jg005526, 2020.
Phillips, R. P., Erlitz, Y., Bier, R., and Bernhardt, E. S.: New approach for capturing soluble root exudates in forest soils, Funct. Ecol., 22, 990–999, https://doi.org/10.1111/j.1365-2435.2008.01495.x, 2008.
Picon-Cochard, C., Pilon, R., Tarroux, E., Pagès, L., Robertson, J., and Dawson, L.: Effect of species, root branching order and season on the root traits of 13 perennial grass species, Plant Soil, 353, 47–57, https://doi.org/10.1007/s11104-011-1007-4, 2012.
Pinheiro, J. and Bates, D. M.: Mixed-effects models in S and S-PLUS, 1st edn., Springer, New York, NY, 528 pp., https://doi.org/10.1007/b98882, 2000.
Pinheiro, J., Bates, D., and R Core Team: nlme: Linear and Nonlinear Mixed Effects Models, CRAN [code], https://doi.org/10.32614/CRAN.package.nlme, 2023.
Polarforskningssekretariatet and SMHI: Abisko Aut (ID 188790) Lufttemperatur (dygn) 1985–2025, SMHI Öppna data: meteorologiska observationer, SMHI, Sveriges meteorologiska och hydrologiska institut [data set], https://www.smhi.se/data/hitta-data-for-en-plats/ladda-ner-vaderobservationer/airtemperatureMean24h/188790 (last access: 9 July 2025), 2025a.
Polarforskningssekretariatet and SMHI: Abisko Aut (ID 188790) Nederbördsmängd (dygn) 1985–2025, SMHI Öppna data: meteorologiska observationer, SMHI, Sveriges meteorologiska och hydrologiska institut [data set], https://www.smhi.se/data/hitta-data-for-en-plats/ladda-ner-vaderobservationer/precipitation24HourSum/188790 (last access: 9 July 2025), 2025b.
Putkinen, A., Larmola, T., Tuomivirta, T., Siljanen, H. M., Bodrossy, L., Tuittila, E.-S., and Fritze, H.: Peatland succession induces a shift in the community composition of Sphagnum-associated active methanotrophs, FEMS Microbiol. Ecol., 88, 596–611, https://doi.org/10.1111/1574-6941.12327, 2014.
Raivonen, M., Smolander, S., Backman, L., Susiluoto, J., Aalto, T., Markkanen, T., Mäkelä, J., Rinne, J., Peltola, O., Aurela, M., Lohila, A., Tomasic, M., Li, X., Larmola, T., Juutinen, S., Tuittila, E.-S., Heimann, M., Sevanto, S., Kleinen, T., Brovkin, V., and Vesala, T.: HIMMELI v1.0: HelsinkI Model of MEthane buiLd-up and emIssion for peatlands, Geosci. Model Dev., 10, 4665–4691, https://doi.org/10.5194/gmd-10-4665-2017, 2017.
R Core Team: R: A Language and Environment for Statistical Computing, R Foundation for Statistical Computing, Vienna, Austria, https://www.R-project.org (last access: 15 May 2026), 2025.
Rose, L.: Pitfalls in root trait calculations: How ignoring diameter heterogeneity can lead to overestimation of functional traits, Front. Plant Sci., 8, 898, https://doi.org/10.3389/fpls.2017.00898, 2017.
Saarnio, S., Wittenmayer, L., and Merbach, W.: Rhizospheric exudation of Eriophorum vaginatum L. – Potential link to methanogenesis, Plant Soil, 267, 343–355, https://doi.org/10.1007/s11104-005-0140-3, 2004.
Schaefer, K., Lantuit, H., Romanovsky, V. E., Schuur, E. A. G., and Witt, R.: The impact of the permafrost carbon feedback on global climate, Environ. Res. Lett., 9, 085003, https://doi.org/10.1088/1748-9326/9/8/085003, 2014.
Scheffer, R. A. and Aerts, R.: Root decomposition and soil nutrient and carbon cycling in two temperate fen ecosystems, Oikos, 91, 541–549, https://doi.org/10.1034/j.1600-0706.2000.910316.x, 2000.
Schimel, J. P.: Plant transport and methane production as controls on methane flux from arctic wet meadow tundra, Biogeochemistry, 28, 183–200, https://doi.org/10.1007/BF02186458, 1995.
Schneider, C. A., Rasband, W. S., and Eliceiri, K. W.: NIH Image to ImageJ: 25 years of image analysis, Nat. Methods, 9, 671–675, https://doi.org/10.1038/nmeth.2089, 2012.
Schuur, E. A. G., Bockheim, J., Canadell, J. G., Euskirchen, E., Field, C. B., Goryachkin, S. V., Hagemann, S., Kuhry, P., Lafleur, P. M., Lee, H., Mazhitova, G., Nelson, F. E., Rinke, A., Romanovsky, V. E., Shiklomanov, N., Tarnocai, C., Venevsky, S., Vogel, J. G., and Zimov, S. A.: Vulnerability of permafrost carbon to climate change: Implications for the global carbon cycle, Bioscience, 58, 701–714, https://doi.org/10.1641/b580807, 2008.
Shaver, G. R.: Ecology of roots and rhizomes in graminoid plants of the Alaskan coastal tundra, PhD thesis, Duke University, Durham, NC, USA, https://www.proquest.com/openview/ad750e00eb95eeb7721530f62152090f/1?cbl=18750&diss=y (last access: 20 January 2026), 1976.
Shaver, G. R. and Billings, W. D.: Root production and root turnover in a wet tundra ecosystem, barrow, Alaska, Ecology, 56, 401–409, https://doi.org/10.2307/1934970, 1975.
Shaver, G. R. and Billings, W. D.: Effects of daylength and temperature on root elongation in tundra graminoids, Oecologia, 28, 57–65, https://doi.org/10.1007/BF00346836, 1977.
Singleton, C. M., McCalley, C. K., Woodcroft, B. J., Boyd, J. A., Evans, P. N., Hodgkins, S. B., Chanton, J. P., Frolking, S., Crill, P. M., Saleska, S. R., Rich, V. I., and Tyson, G. W.: Methanotrophy across a natural permafrost thaw environment, ISME J., 12, 2544–2558, https://doi.org/10.1038/s41396-018-0065-5, 2018.
Smith, B., Prentice, C., and Sykes, M. T.: Representation of vegetation dynamics in the modelling of terrestrial ecosystems: comparing two contrasting approaches within European climate space, Global Ecol. Biogeogr., 10, 621–637, https://doi.org/10.1046/j.1466-822X.2001.t01-1-00256.x, 2001.
Smith, B., Wårlind, D., Arneth, A., Hickler, T., Leadley, P., Siltberg, J., and Zaehle, S.: Implications of incorporating N cycling and N limitations on primary production in an individual-based dynamic vegetation model, Biogeosciences, 11, 2027–2054, https://doi.org/10.5194/bg-11-2027-2014, 2014.
Snedecor, G. W. and Cochran, W. G.: Statistical Methods, 8th Edn., Iowa State University Press, Ames, ISBN 0-8138-1561-4, 1989.
Ström, L. and Christensen, T. R.: Below ground carbon turnover and greenhouse gas exchanges in a sub-arctic wetland, Soil Biol. Biochem., 39, 1689–1698, https://doi.org/10.1016/j.soilbio.2007.01.019, 2007.
Ström, L., Ekberg, A., Mastepanov, M., and Røjle Christensen, T.: The effect of vascular plants on carbon turnover and methane emissions from a tundra wetland, Glob. Change Biol., 9, 1185–1192, https://doi.org/10.1046/j.1365-2486.2003.00655.x, 2003.
Ström, L., Mastepanov, M., and Christensen, T. R.: Species-specific Effects of Vascular Plants on Carbon Turnover and Methane Emissions from Wetlands, Biogeochemistry, 75, 65–82, https://doi.org/10.1007/s10533-004-6124-1, 2005.
Ström, L., Tagesson, T., Mastepanov, M., and Christensen, T. R.: Presence of Eriophorum scheuchzeri enhances substrate availability and methane emission in an Arctic wetland, Soil Biol. Biochem., 45, 61–70, https://doi.org/10.1016/j.soilbio.2011.09.005, 2012.
Turetsky, M. R., Kotowska, A., Bubier, J., Dise, N. B., Crill, P., Hornibrook, E. R. C., Minkkinen, K., Moore, T. R., Myers-Smith, I. H., Nykänen, H., Olefeldt, D., Rinne, J., Saarnio, S., Shurpali, N., Tuittila, E.-S., Waddington, J. M., White, J. R., Wickland, K. P., and Wilmking, M.: A synthesis of methane emissions from 71 northern, temperate, and subtropical wetlands, Glob. Change Biol., 20, 2183–2197, https://doi.org/10.1111/gcb.12580, 2014.
van den Berg, M., van den Elzen, E., Ingwersen, J., Kosten, S., Lamers, L. P. M., and Streck, T.: Contribution of plant-induced pressurized flow to CH4 emission from a Phragmites fen, Sci. Rep., 10, 12304, https://doi.org/10.1038/s41598-020-69034-7, 2020.
Varner, R. K., Crill, P. M., Frolking, S., McCalley, C. K., Burke, S. A., Chanton, J. P., Holmes, M. E., Isogenie Project Coordinators, Saleska, S., and Palace, M. W.: Permafrost thaw driven changes in hydrology and vegetation cover increase trace gas emissions and climate forcing in Stordalen Mire from 1970 to 2014, Philos. T. R. Soc. A, 380, 20210022, https://doi.org/10.1098/rsta.2021.0022, 2022.
Varner, R., Perry, A., and Crill, P.: Daily CH4 fluxes (from LGR at autochamber sites) and associated peat temperatures at 5 cm, during the productive period of 2023 (2023-05-19 to 2023-08-30), Zenodo [data set], https://doi.org/10.5281/zenodo.22086216, 2026.
Violle, C., Reich, P. B., Pacala, S. W., Enquist, B. J., and Kattge, J.: The emergence and promise of functional biogeography, P. Natl. Acad. Sci. USA, 111, 13690–13696, https://doi.org/10.1073/pnas.1415442111, 2014.
Visser, E. J. W., Bögemann, G. M., van de Steeg, H. M., Pierik, R., and Blom, C. W. P. M.: Flooding tolerance of Carex species in relation to field distribution and aerenchyma formation: RESEARCH Flooding tolerance of Carex species, New Phytol., 148, 93–103, https://doi.org/10.1046/j.1469-8137.2000.00742.x, 2000.
Vroom, R. J. E., van den Berg, M., Pangala, S. R., van der Scheer, O. E., and Sorrell, B. K.: Physiological processes affecting methane transport by wetland vegetation – A review, Aquat. Bot., 182, 103547, https://doi.org/10.1016/j.aquabot.2022.103547, 2022.
Waldo, N. B., Hunt, B. K., Fadely, E. C., Moran, J. J., and Neumann, R. B.: Plant root exudates increase methane emissions through direct and indirect pathways, Biogeochemistry, 145, 213–234, https://doi.org/10.1007/s10533-019-00600-6, 2019.
Wallén, B.: Above and below ground dry mass of the three main vascular plants on hummocks on a subarctic peat bog, Oikos, 46, 51, https://doi.org/10.2307/3565379, 1986.
Wang, P., Mommer, L., van Ruijven, J., Berendse, F., Maximov, T. C., and Heijmans, M. M. P. D.: Seasonal changes and vertical distribution of root standing biomass of graminoids and shrubs at a Siberian tundra site, Plant Soil, 407, 55–65, https://doi.org/10.1007/s11104-016-2858-5, 2016.
Wen, Z., White, P. J., Shen, J., and Lambers, H.: Linking root exudation to belowground economic traits for resource acquisition, New Phytol., 233, 1620–1635, https://doi.org/10.1111/nph.17854, 2022.
Whiticar, M. J.: Carbon and hydrogen isotope systematics of bacterial formation and oxidation of methane, Chem. Geol., 161, 291–314, 1999.
Wild, J., Kopecký, M., Macek, M., Šanda, M., Jankovec, J., and Haase, T.: Climate at ecologically relevant scales: A new temperature and soil moisture logger for long-term microclimate measurement, Agr. Forest Meteorol., 268, 40–47, 2019.
Wilson, D., Alm, J., Riutta, T., Laine, J., Byrne, K. A., Farrell, E. P., and Tuittila, E.-S.: A high resolution green area index for modelling the seasonal dynamics of CO2 exchange in peatland vascular plant communities, Plant Ecol., 190, 37–51, https://doi.org/10.1007/s11258-006-9189-1, 2007.
Wilson, R., Bosman, S., and Chanton, J.: CH? and DIC concentrations and δ13C from porewater at Stordalen Mire, July 2023, Zenodo, https://doi.org/10.5281/zenodo.18363867, 2026.
Wilson, R. M., Hough, M. A., Verbeke, B. A., Hodgkins, S. B., IsoGenie Coordinators, Chanton, J. P., Saleska, S. D., Rich, V. I., and Tfaily, M. M.: Plant organic matter inputs exert a strong control on soil organic matter decomposition in a thawing permafrost peatland, Sci. Total Environ., 820, 152757, https://doi.org/10.1016/j.scitotenv.2021.152757, 2022.
Wood, S. N.: Fast stable restricted maximum likelihood and marginal likelihood estimation of semiparametric generalized linear models, J. R. Stat. Soc. B, 73, 3–36, https://doi.org/10.1111/j.1467-9868.2010.00749.x, 2011.
Wood, S. N.: Generalized additive models: An introduction with R, Chapman and Hall/CRC, https://doi.org/10.1201/9781315370279, 2017.
Ye, Z. and Ryser, P.: Root porosity contributes to root trait space of wetland monocotyledons independently of economics traits, Plant Soil, 471, 301–314, https://doi.org/10.1007/s11104-021-05186-3, 2022.
Zhuang, Q., Melillo, J. M., Kicklighter, D. W., Prinn, R. G., McGuire, A. D., Steudler, P. A., Felzer, B. S., and Hu, S.: Methane fluxes between terrestrial ecosystems and the atmosphere at northern high latitudes during the past century: A retrospective analysis with a process-based biogeochemistry model, Global Biogeochem. Cy., 18, https://doi.org/10.1029/2004gb002239, 2004.