
the Creative Commons Attribution 4.0 License.
the Creative Commons Attribution 4.0 License.
 | 29 Sep 2026
Tree-microbe-soil interactions affecting soil organic carbon fractions in Mediterranean forest soils

Assaf Yaakobi
David Yalin
Dagan Sade
Efrat Dener
Yaara Oppenheimer-Shaanan
Tamir Klein
Soil organic carbon (SOC) represents a major terrestrial carbon pool, yet the processes that regulate its storage remain uncertain, particularly in water-limited shallow-soil ecosystems. Partitioning SOC into mineral-associated organic carbon (MAOC), considered more persistent, and particulate organic carbon (POC), which is more labile, can provide insight into the mechanisms controlling soil C storage. We investigated how SOC and its fractions were influenced by tree species composition, soil physicochemical properties, and microbial communities in mature Mediterranean forests dominated by Pinus halepensis (canopy conifer), Quercus calliprinos (sub-canopy broadleaf), and Pistacia lentiscus (understory woody shrub), either in monospecific or mixed stands. We further examined how these relationships varied among forest microsites (i.e., beneath the tree canopies and adjacent forest gaps). Across microsites, SOC concentrations were up to twofold higher under tree canopies compared to forest gaps with Quercus plots storing 10 %–30 % more SOC than Pinus and Pistacia plots. SOC variation was primarily explained by POC, which tended to be higher in mixed compared to monospecific plots. In contrast, MAOC showed an apparent saturation pattern, reaching approximately 45 g C kg−1 soil, and was strongly constrained by clay and silt content, indicating limited potential for additional mineral-associated C storage in soils approaching saturation. Tree-associated changes in soil C were accompanied by shifts in microbial community composition that depended strongly on microsite conditions. In particular, bacterial communities beneath tree canopies represented subsets of the more diverse communities occurring in forest gaps, suggesting that tree-induced changes in soil conditions act as an environmental filter on microbial assemblages. However, variation in microbial richness itself was not consistently associated with changes in SOC, POC, or MAOC. Together, these results show that tree effects on SOC emerge through interactions among species identity, microsite conditions, soil physicochemical constraints, and microbial community composition, with different controls operating on labile and mineral-associated C pools. Mixed forests were estimated to store approximately 6.1 Mg C ha−1 more SOC than monospecific pine stands, with this difference primarily associated with the labile POC pool, particularly where MAOC was already close to saturation.
- Article
(2612 KB) - Full-text XML
-
Supplement
(1159 KB) - BibTeX
- EndNote


Soil organic carbon (SOC) comprises one of the largest terrestrial carbon pools, containing more carbon than terrestrial vegetation and the atmosphere combined (Lal et al., 2021). The distribution of SOC varies widely across latitudes, with the highest concentrations in northern regions, followed by tropical, temperate, and Mediterranean forests being the poorest (Crowther et al., 2019).
Ongoing and predicted climate changes, induced by rising atmospheric CO2 concentrations and land use changes, are expected to significantly impact terrestrial ecosystems and specifically the SOC pools (Gregorich et al., 2017; Nissan et al., 2023). However, the fate of SOC is still poorly constrained in land-models, in large part due to lack of empirical data from specific ecosystems and especially drylands (Arora et al., 2013; Stell et al., 2021). To this end, there is great importance in better understanding the drivers behind SOC dynamics in these ecosystems. Additionally, because afforestation and improved forest management are proposed as some of the leading natural climate mitigation options, there is need to understand how these can be best adapted for enhanced SOC capturing (Griscom et al., 2017).
SOC dynamics are governed by a complex interplay between plant carbon inputs, microbial activity, soil fauna, and the soil matrix (Cotrufo and Lavallee, 2022). The critical role of soil properties in determining SOC accumulation in soil has been demonstrated in several global studies. Doetterl et al. (2015), for example found that soil properties such as clay + silt were the main predictors for SOC storage (exceeding the role of climate) along a 4000 km climate transect of natural grassland and shrubland in Chile and the Antarctic Peninsula. Later work examining data from continental USA has shown that other soil factors than clay + silt such as exchangeable calcium strongly predicted soil organic matter (SOM) content in water-limited, alkaline soils for example (Rasmussen et al., 2018).
To decipher the mechanisms behind SOC storage, the distinction between the mineral-associated organic carbon (MAOC) and particulate organic carbon (POC) can be highly informative (Cotrufo et al., 2019). The interactions of MAOC with the soil mineral phase protects it from microbial decomposition, resulting in prolonged cycling time of up to millennia (Schmidt et al., 2011). MAOC is mostly comprised of small organic molecules with a low ratio (e.g. polysaccharides, proteins, lipids) originating in microbial necromass and root exudates (Whalen et al., 2022). In contrast, POC is mainly comprised of more complex organic molecules (e.g. lignin, cellulose, hemicellulose) with a high ratio, and goes through faster cycling (typically decades) due to high exposure to decomposition. Globally, MAOC comprises approximately 65 % (∼840–1540 Pg C) of the total SOC (Sokol et al., 2022) and this dominance of the MAOC pool was also reported specifically in drylands (Díaz-Martínez et al., 2024).
Because of their different nature, the accumulation of POC is governed by different ecosystem properties as compared to MAOC. For instance, a meta-analysis by Hansen et al. (2024) found that the POC fraction across ecosystems was dominated by temperature and pH, seemingly due to the strong effect of these parameters on microbial degradation. Contrastingly, MAOC has shown strong correlation to the fine mineral fraction (clay + silt) content.
It has been argued that MAOC has a finite capacity that is the upper limit for its accumulation in soils, which may in part explain the close relation between MAOC and soil texture. The specific soil capacity according to this perception is related to its clay + silt content and the mineralogy of these fractions (Georgiou et al., 2025). Based on data from soils in the USA it was estimated that soil with high reactivity minerals have a capacity of 86 g C kg−1 clay + silt, whereas soils with low activity clays have a capacity of 48 g C kg−1 clay + silt (Georgiou et al., 2022). These capacity values also correspond with findings from other studies showing a saturation of MAOC in a wide array of soils at values close to 40 g C kg−1 soil (Cotrufo et al., 2019). However, it is unclear if MAOC capacity can be a true limiting factor for MAOC accumulation and especially in low productivity ecosystems.
Forest composition affects SOC storage in many levels – tree species deliver varying amounts of organic matter to soil through leaf litter, root exudates, and also support distinct microbial communities (Lindahl and Tunlid, 2015; Obersteiner and Klein, 2022). The effects of forests and afforestation on SOC is therefore context dependent. In a study of over 600 control and afforested plot pairs in China, afforestation was found to increase SOC only in SOC-depleted soils, while high-SOC soils responded to afforestation with SOC losses (Hong et al., 2020). In that study, tree species had a significant effect on SOC accumulation or loss. Similar context-dependent SOC accumulation was also shown in other meta-analysis studying the effects of afforestation (Ll et al., 2012). Díaz-Pinés et al. (2011) demonstrated variations in SOC content across three different forest types, with pine forests showing the highest levels of MAOC and POC, while oak forests showing the lowest. Mixed forests fall in between, indicating a moderate carbon accumulation. In another meta-analysis encompassing a wide variety of ecosystems, plant diversity was shown to have a general positive effect on SOC storage, especially in dry regions (Spohn et al., 2023).
Rog et al. (2022), has previously shown that the composition of forest ecosystems can play a critical role in shaping belowground dynamics. Avital et al. (2022) observed asymmetric C transfer between different tree species cohabitating Mediterranean mixed forests. These patterns could potentially lead to increased SOM accumulation in mixed forest settings as compared to monoculture forests. However, it should also be considered that trees typically form complex, mutualistic symbioses with both fungi and bacteria, influencing their community composition and the SOC and nitrogen dynamics (Lucas-Borja et al., 2012).
Overall, despite significant advances in understanding SOM dynamics, including the development of next-generation biogeochemical models and large-scale datasets, the interactions between tree species composition, soil properties and microbial communities, and their effects on SOC pools remain inadequately understood (Cotrufo and Lavallee, 2022). The limited and sometimes contradictory empirical evidence points to the need for more rigorous, species-specific research to elucidate these relationships. Clarifying how forest composition influences SOC storage and turnover is crucial for developing informed forest management practices that maximize carbon sequestration in response to climate change (Amelung et al., 2020).
This study aims to evaluate the influence of tree and forest composition (tree species and mixing) on SOC pools. We sampled soil in mixed and monospecific plots of various compositions in a Mediterranean forest, focusing on tree species representing the key functional groups in this ecosystem. Specifically, we included Pinus halepensis (a canopy conifer), Quercus calliprinos (a sub-canopy broadleaf), and Pistacia lentiscus (an understory woody shrub). The studied plots were managed by the local forest service (Jewish National Fund (KKL)) with native tree species and minimal intervention. The key research questions are: (1) How does forest type (tree species and mixing) influence total SOC stocks and the distribution between MAOC and POC? And how does this relate to soil microbial diversity? (2) Is soil limited in its capacity to store MAOC?
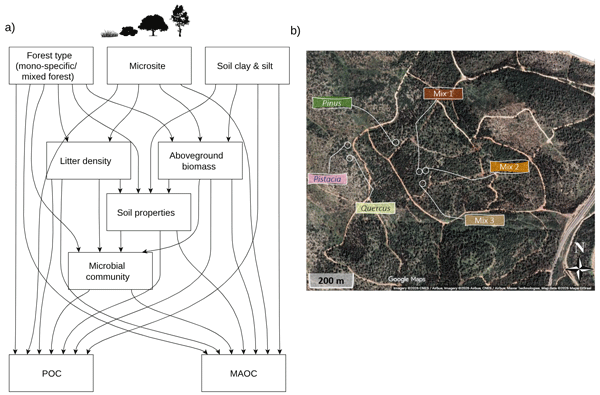
We hypothesize that mixed forests will exhibit higher total SOC stocks, with a greater proportion of MAOC compared to mono-specific forests. We expect this pattern to result from greater and more diverse plant-derived C inputs and their microbial processing, which may enhance the production of microbial-derived organic compounds that can be stabilized through association with soil minerals. We further hypothesize that the capacity for MAOC accumulation will be constrained by soil mineral properties, particularly clay and silt content, such that soils with greater mineral-associated C storage capacity will support larger MAOC pools. At the microsite scale, we hypothesize that forest gaps, will contain lower total SOC than soils beneath tree canopies because of reduced litter and root-derived C inputs. Lower C inputs in forest gaps may either reduce microbial decomposition and favor POC accumulation, or, if decomposition exceeds C inputs, preferentially deplete POC and increase the relative contribution of MAOC. To test these hypotheses, we used structural equation modeling (SEM) to explore the direct and indirect effects of forest mixing, microsite, tree traits, and soil properties on SOC dynamics (Fig. 1a), thereby providing insights into the complex interactions that drive carbon storage in Mediterranean forests.
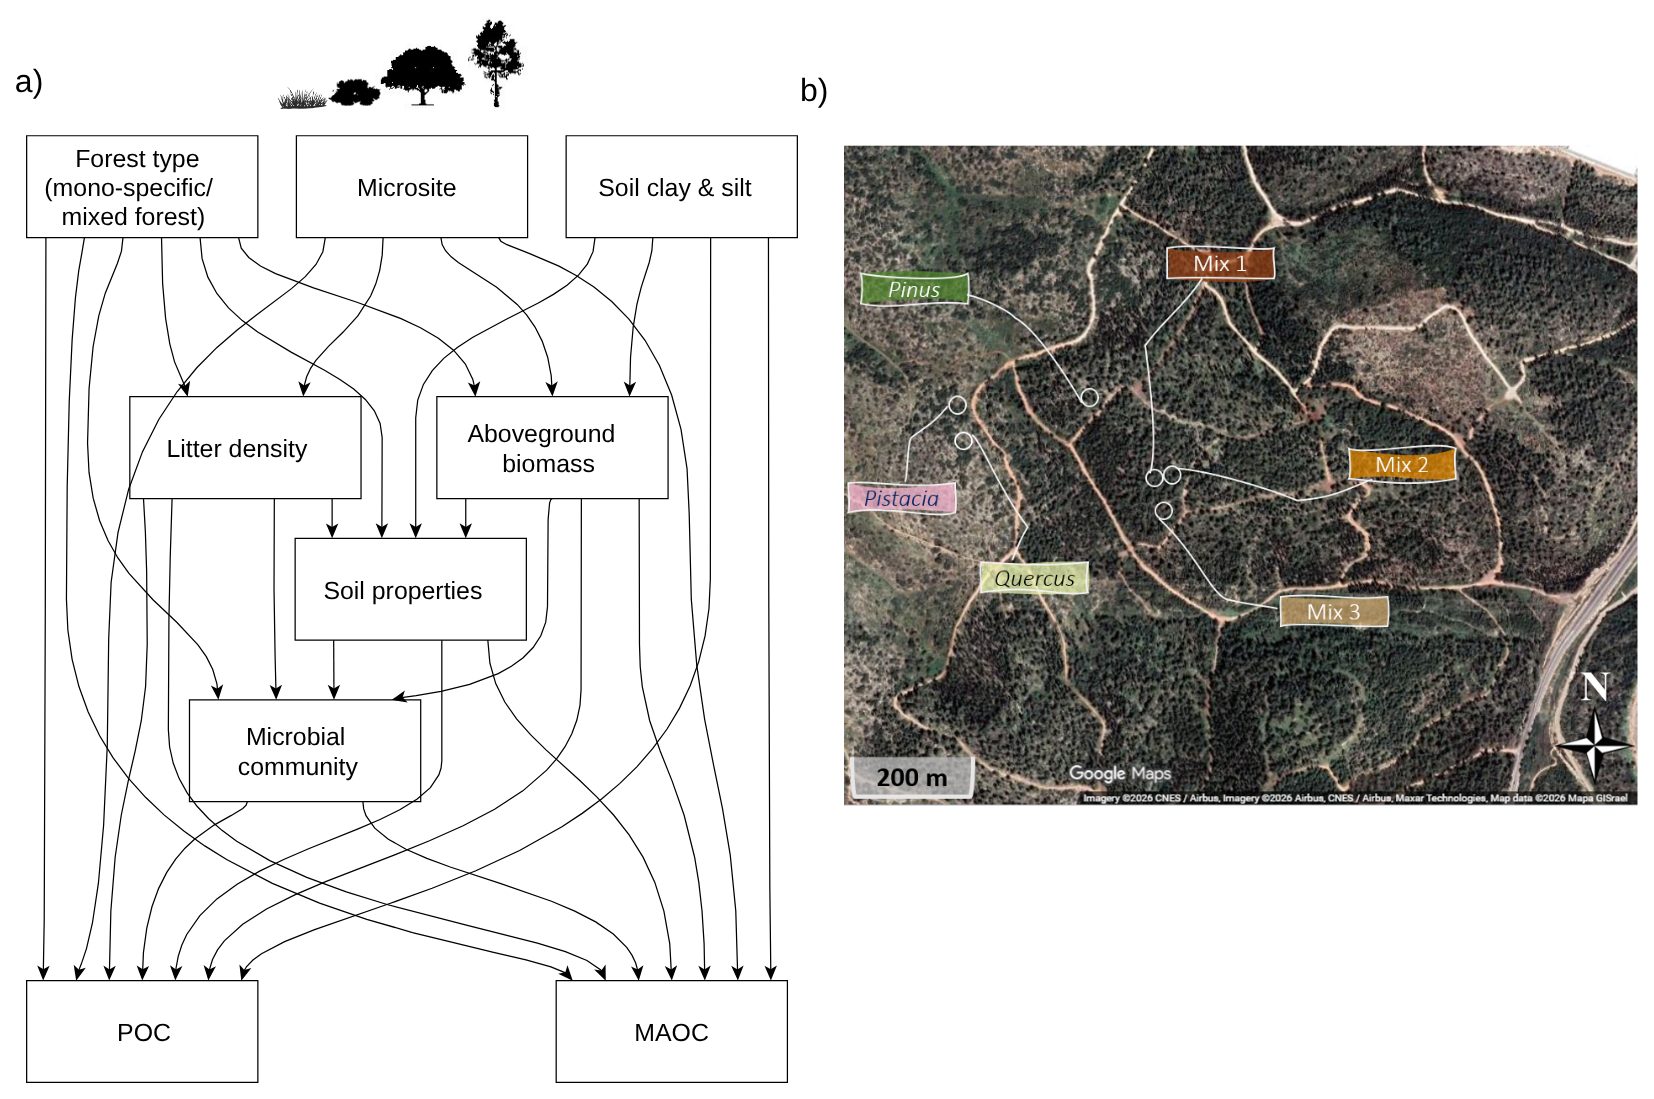
Figure 1(a) a path diagram. We hypothesized that forest characteristics (mono-specific/mixed forest) and microsite (Pistacia, Pinus, Quercus) or forest gap, affect MAOC and POC concentrations either directly or indirectly by affecting tree species traits (biomass and litter density), soil properties and the microbial community. Also, we hypothesized that the soil C capacity will be constrained by the soil clay + silt content. (b) an aerial map displaying six plots within Yishi Forest (mono-specific plots dominated by Pistacia, Pinus or Quercus trees, n=39, and three mixed forest plots, n=27). Background imagery from Google Maps. Map data and imagery attribution are shown in the panel.
2.1 Study site and experimental design
Field measurements were conducted in Yishi Forest in the Judean foothills, Israel (Fig. 1b; Rog et al., 2021a). The climate in this area is characterized as hot Mediterranean, with a mean annual precipitation of 510 mm between September and May and mean annual temperature of 20 °C, fluctuating between 16 °C in February and 25 °C in August. The predominant soil types in the study area are Ustolls (Mollisols; Itkin et al., 2025), forming a thin soil layer (5–20 cm) over a limestone bedrock. The vegetation is dominated by the gymnosperm tree species Pinus halepensis, which forms the forest canopy, partly with the lesser canopy gymnosperm tree species, Cupressus sempervirens. The sub-canopy layer is dominated by the angiosperm tree species Quercus calliprinos, and the understory is dominated by the angiosperm woody shrub Pistacia lentiscus. Additionally, a variety of annual plants flourish from winter to spring in gaps between trees at the forest floor. These smaller plants have biomass of kg C m−2, compared with 61.8 kg C m−2 of e.g., the Pinus trees, and hence a disproportionally smaller contribution to the forest C cycle (for additional information on the tree species, see Table S1 in the Supplement). Annual plant biomass was measured on the total plant amount sampled from each plot at the same locations used for forest-gap sampling, in the spring of 2023. Plants were collected within a 0.3 m × 0.3 m frame, brought to the lab, dried in an oven at 60.0 °C for 3 d and then weighed. Root and litter C content and flux were calculated for each of the three species. Root system in the soil layer was calculated as described in Rog et al. (2021b) by integrating (1) sampling of forest soil cores around each of the study trees and measurement of lateral root biomass in each core; (2) identification of excavated roots (5–20 cm depth) around each of the study trees, based on DNA barcodes (Jakoby et al., 2020); (3) upscaling the measurements in (1) and (2) to the entire soil layer based on stand density information and allometric relationships for each of the species, based on stem diameter and height and applying asymptotic equations for the distribution of root biomass in depth (Jackson et al., 1996). Root system in the rock layer was estimated based on the difference between the soil root biomass calculated in (3) and the total root biomass, calculated by species-specific allometric equations. Annual root growth was measured using the ingrowth core method (Rog et al., 2024). Annual root litter was estimated using our root biomass calculations (above) and the global patterns of root turnover in terrestrial ecosystem database (Gill and Jackson, 2000). Annual aboveground litter was quantified using litter traps installed below the canopy of each tree species and collected bi-monthly (Rog et al., 2024). Annual root exudation was calculated in Rog et al. (2024), based on in situ and ex situ root exudation measurements (Jakoby et al., 2020; Dror and Klein, 2022, respectively). For simplicity, we will refer to the species by their genus names: Pinus, Quercus and Pistacia. We chose representative plots for the mixed forest with a combination of all three species mentioned above, and three monospecific plots, each composed of only one of the three tree species. The term “mixed” refers to plots containing multiple tree species, rather than, for example, soil samples pooled from different plots (not done here). As for the monospecific plots, for Pinus, Quercus, and Pistacia, we found plots that were dominated by these species rather than pure monospecific (Fig. 1b; Table S2). The Pinus plot was planted in 1968; the Quercus and the Pistacia plots were naturally germinated; and the mixed plots were planted the same year as the Pinus but developed into a mixed forest. Although no active fire suppression has been implemented by the local forest service, no fire has occurred at the study site during the past 50 years. To account for the effect of tree diversity, we chose five individual representative trees in each plot. At each tree, two soil sampling points were established 0–1 m from the trunk in opposite directions. At each sampling point, soil was collected for carbon, physicochemical and microbial community analyses, together with the corresponding measurements and samples described below. In addition, we sampled three soil samples from a forest gap (2–3 m from the canopy) in each plot. All soil samples were collected at a depth of 0–10 cm, representing the thin soil layer at the site. Across the four microsites, beneath Pinus, Quercus, and Pistacia canopies and in forest gaps within each plot, a total of 104 soil samples were collected.
2.2 Soil sampling and plot characteristics
In September 2022, sampling was conducted across all designated plots (For the complete description of the experimental design see Fig. S1 in the Supplement).
Plant litter was removed from an area of 0.3 m × 0.3 m (using a metal frame) and collected prior to soil excavation at each designated sampling point. The collected litter was then placed in individual paper bags and subsequently dried at 60 °C for several days until it reached a constant weight. Soil samples for carbon and chemical analysis were collected at the site of litter collection. Due to the site limitations, undisturbed soil cores were extracted in adjacent points to each disturbed sample (less than 1 m away) using a stainless-steel soil corer with a radius of 4.8 cm. The soil within each core was air-dried for at least 7 d. After the drying period, samples were sieved to <2 mm. The mass and volume of coarse fragments (rocks) were determined and subtracted from the total core measurements, to calculate the bulk density specifically for the fine earth fraction (<2 mm). In the spring of 2023, measurements of annual plant richness were taken from each plot at the same locations used for forest-gap sampling. Plants were collected within a 0.3 m × 0.3 m frame, and the number of species and individuals within each species were recorded (Table S2).
2.3 Soil fractionation methods and carbon analysis
The soil samples were air-dried in the lab for at least 7 d at ambient room temperature with proper ventilation. Wet separation of the soil was performed following Poeplau et al. (2018). The fraction >50 µm is operationally referred to hereafter as “sand” and the fraction <50 µm as “silt + clay. 0.5 % Na-hexametaphosphate, and agitation with glass beads were used for the degradation of soil aggregates. In tandem soil texture analysis was performed using PARIO (Meter, Munich, Germany) following the manufacturer's protocol (Fig. S2). SOC, total nitrogen and soil inorganic carbon in the separate fractions and bulk soil samples were determined using ramped combustion (EA; Elementar, Cheadle, UK, Model: soli TOC cube). SOC values reported include the sum of the total organic carbon combusted at 400 and 600 °C. Measurements with the elemental analyzer were conducted on both bulk soil and the fine fraction (particles <50 µm). For the coarse fraction, organic carbon content was derived by subtracting the fine fraction from the bulk soil. Comparing the results for MAOC and SOC from the elemental analyzer to those obtained by traditional loss on ignition (Fig. S3) revealed a strong linear relationship, particularly for MAOC. Consequently, further analyses and data presented in this paper focus on the results from the elemental analyzer.
2.4 Soil structure, moisture, and nutrient content
Soil water content (%, ) and soil temperature (°C) were measured over depths of 0–15 cm (i.e., the entire soil profile in our shallow soil site) using a portable soil sensor (Acclima, Meridian, ID, USA; SDI-12 Sensor Reader RD1200). Measurements were taken at two time points: summer and spring. All records were collected during the day, and measurements from all plots were taken on the same day to avoid temporal effects. Three data points were recorded from each plot at each position (forest gap and under trees), except in the mixed plots, where data were recorded from under all five trees. All records were obtained from the same locations where the soil samples were collected. Soil nutrient analysis (excluding phosphorus), electrical conductivity (EC), and pH were performed using water extracts of 8 g air-dried soil with 32 mL of deionized distilled water shaken overnight. pH measurements were conducted using a pH meter (VWR phenomenal, PH 1100 L, UK; n=104). EC was measured using an EC Meter (Model 4510, Jenway, England; n=104). Major anions, including chloride (Cl−) and nitrate (NO), as well as major cations, including ammonium (NH) and magnesium (Mg2+), were analyzed using the Gallery Analyzer (Thermo Scientific, Germering, Germany). Available phosphorus (P) was extracted following Olsen et al. (1954) and analyzed using the Gallery Analyzer. Summary statistics for all soil nutrient measurements and related soil parameters across forest types and microsites are provided in Table S3.
2.5 MAOC capacity and saturation
MAOC capacity (i.e., the specific capacity of the silt and clay fraction to hold MAOC) was estimated using the methodology described by Six et al. (2024). To represent conditions closest to physical saturation, we selected data from under-canopy locations in forest stands and plotted their MAOC concentrations against the silt and clay content. A 95th percentile regression line was then computed, forcing the intercept to 0, to yield the MAOC capacity value. As a reference value for dryland forests, we applied the same analysis to the dataset published by Díaz-Martínez et al. (2024). Within their dataset, we similarly selected data representing MAOC concentrations strictly from under tree canopies in forest sites. This provided 67 independent measurements spanning precipitation levels of 266 to 891 mm, all of which fell within an aridity index (annual precipitation/potential evapotranspiration) <0.5. MAOC saturation values were expressed as the percentage of the MAOC capacity currently filled in each sampling point.
2.6 Analysis of microbial community composition
To survey soil microbial communities, we employed a hybrid approach for large-scale, high-resolution microbial profiling of novel environmental niches (Fuks et al., 2018; Knafo et al., 2026). The analysis is described below, step by step.
2.6.1 Sample Collection, Preservation, and DNA Extraction
Soil subsamples were collected from the previously described “bulk soil” using sterile 2 mL tubes, kept on ice during transport to the laboratory. Upon arrival, samples were immediately stored at −80 °C and later transferred into specialized perforated tubes for 3 d lyophilization. Lyophilized samples were then stored at −20 °C until DNA extraction.
Soil samples were collected in two sampling campaigns: once in summer 2022 and again in spring 2023. The collection protocol was consistent across both seasons and locations: surface litter was removed, the upper 0–10 cm of soil was excavated, homogenized, and placed into sterile 2 mL tubes. DNA was extracted from approximately 250 mg of soil using an automated extraction workflow on a Tecan liquid-handling robot, employing the ZymoBIOMICS™ 96 MagBead DNA Kit (Zymo Research, Irvine, CA, USA; Cat. No. D4308) according to the manufacturer's protocol.
2.6.2 Short Reads Library Preparation and Sequencing
Short-read amplicon libraries were prepared using a two-step PCR strategy. The first PCR was designed to linearly amplify targeted regions of the 16S rRNA gene (six variable regions: V1V2, V2V3, V3V4, V4V5, V5V7, and V7V9). This amplification incorporated an Illumina-compatible read sequence, a stepper sequence to introduce sequence diversity, and a Unique Molecular Identifier (UMI) for error correction and duplicate removal (Rezenman et al., 2023). The second PCR was performed to add Illumina i5/i7 indexes and further amplify the amplicons. All libraries were then pooled and concentrated using KAPA beads (0.65X) and sequenced on the Illumina NovaSeq platform using a cycle configuration, yielding between 12.5 K and 1.5 M reads per sample.
2.6.3 Amplicon Processing and Data Analysis
Each sample was demultiplexed by variable region using Cutadapt (Martin, 2011), as described in the CoSMIC pipeline (Knafo et al., 2026), excluding any long, non-specific amplicons generated during PCR. Paired-end reads (R1 and R2) were then quality-filtered and denoised using the DADA2 package in R (Callahan et al., 2016), which corrects for sequencing errors and generates high-resolution amplicon sequence variants (ASVs). The resulting bacterial sequences were subsequently submitted for taxonomic profiling using the Short multi-Region Framework (SMURF) algorithm (Fuks et al., 2018). Libraries for 16S rRNA gene were prepared following a custom 16S region protocol developed in Reich lab (Weizmann Institute of Science). This amplification aimed at capturing a broad representation of the microbial community by targeting multiple variable regions in the 16S gene. The resulting amplicons were indexed to create a next-generation sequencing (NGS) library, with each index corresponding to a unique sample. Sequencing was carried out on an Illumina NovaSeq platform (2×150-bp paired ends), generating short, high-quality reads. Reads were analyzed using the SMURF algorithm to generate the most likely microbial composition and ratios of a given sample (Fuks et al., 2018). To attain a detailed description of a given population, SMURF algorithm requires the full-length small subunit (SSU) to appear in the given data set. Given that environmental samples are often underrepresented in common databases, a long-read sequencing application using PacBio was developed to retrieve full-length SSU sequences from pooled samples. This approach allows for a more accurate resolution of microbiome composition (Knafo et al., 2026). 16S rRNA full-length amplicons, obtained from the LNA amplification of microbial communities in soil samples, were used as a starting template for the SMRTbell Express template Prep Kit 2.0 kit (Product PN. 100-938-900). The sequencing was done on the PacBio Sequel Sequencer. An initial analysis step of demultiplexing, filtering, and removal of chimeric reads was performed using the SMRT analysis software. We used the SILVA database standard threshold for their NR99 database and clustered our samples with 99 % identity. Short reads sequencing was subsequently analyzed by the augmented-database SMURF. All Scripts and usage instructions appear in the GitHub repository rezenman/CoSMIC. The amplicon sequence variants (ASVs) were derived from the provided dataset, with taxonomic data including Kingdom, Phylum, Class, Order, Family, Genus, and Species. Bacterial richness, diversity, and composition were processed and analyzed using the phyloseq R package. The resulting sequences and their respective frequencies were then used to assess the richness and diversity of the samples and compare the microbial communities among and between forest types and microsites.
2.7 Statistical analysis
To assess differences in all response variables (including SOC, its fractions MAOC and POC, carbon stocks, carbon saturation, bacterial richness, and diversity), a mixed-effects model was fitted using the “lmer” function from the “lme4” R package. Fixed effects for “forest type” (Mixed forest vs. Monospecific forest), “microsite” (Forest gap, under Pistacia, under Pinus or under Quercus canopies), and their interaction were included in the model, along with a random effect for “tree” to account for repeated measures of individual trees within plots. The significance of the fixed effects was assessed through an analysis of variance (ANOVA) conducted using the “Anova” function from the “car” package, which allowed for the evaluation of the main effects and interactions within the model. Post-hoc pairwise comparisons were performed using Tukey's Honest Significant Difference (HSD) test to explore differences among levels of the “forest type” and “microsite” factors. Estimated marginal means for the interaction between “forest type” and “microsite” were obtained using the “emmeans” package. Specific comparisons (i.e., contrasting forest gaps with all other tree canopy samples) were adjusted for multiple comparisons using the False Discovery Rate (FDR) method.
In addition, to identify potential drivers of SOC and its fractions, we analyzed the relationships between twelve measured soil properties (e.g., bulk density, pH, soil temperature, nutrient levels) and SOC, MAOC, and POC. Each soil property was tested in individual mixed-effects models with the same structure (forest type and microsite as fixed effects; tree as a random effect). Continuous variables were scaled to improve comparability. Multicollinearity among predictors was visualized using a correlation plot (Fig. S4). We then performed Principal Component Analysis (PCA) on standardized soil physicochemical variables to summarize multivariate patterns among samples. Ellipses representing 95 % confidence intervals were added to visualize group separation by forest type (see Table S4 for the PCA loadings and magnitude).
Finally, microbial diversity analyses were conducted in R (version 4.2.2). Taxonomic data and abundance matrices were processed using the phyloseq (version 1.42.0; (McMurdie and Holmes, 2013) and microViz (version 0.11.0) packages (Barnett et al., 2021). Beta diversity was assessed using Principal Coordinates Analysis (PCoA) based on Bray–Curtis dissimilarities, calculated with the microViz package (version 0.11.0). Ordination plots were generated using functions from both microViz and phyloseq. Permutational multivariate analysis of variance (PERMANOVA) and tests of multivariate dispersion (beta-dispersion) were conducted to assess the effects of forest type, microsite, and season on community structure. To examine taxonomic composition, phylum-level relative abundances were calculated, and the top 10 most abundant phyla were visualized in a proportional stacked bar plot across microsites. Differentially abundant bacterial genera between under canopies and forest gaps were identified using ANCOM-BC (Lin and Peddada, 2020). Results were visualized using a bar plot of log-fold changes, highlighting top taxa showing significant differences based on false discovery rate (FDR)-adjusted P values. Relationships between ecological diversity indices (bacterial species richness and Shannon diversity in spring and summer) and SOC, MAOC, and POC were assessed using linear regressions with Pearson correlation coefficients, and were visualized using faceted scatterplots.
2.8 Path modeling
To examine the complex relationships between ecological variables across hierarchical levels in our dataset, we utilized structural equation modeling (SEM), allowing us to simultaneously assess multiple direct, indirect, and overall total effects of the tested variables on soil carbon fractions (Fig. 1a). The model was built a priori to reflect the hierarchical structure of our data, testing biologically plausible paths among variables. Specifically, we tested the effects of forest type (mono vs. mixed), microsite (e.g., Pinus, Pistacia, Quercus, and forest gap), tree species traits (aboveground biomass and litter density), soil properties (using the PC1 axis from the soil physicochemical PCA, see above) as well as the soil clay + silt content, and microbial community richness on the soil carbon fractions (MAOC, POC).The SEM was conducted using complete cases only, requiring measurements for all variables included in the model; consequently, 62 of the 104 soil samples were included in the analysis.
The relationships between forest type, microsite, and ecological variables were specified through direct effects, with additional paths including biomass, litter density, and other soil properties influencing carbon pool variables. Additional effects across hierarchical levels, such as the effect of microsite on soil properties, were modeled as well, but only appear in the final model if their contribution to the total effects was significant. Forest type was treated as a dummy-coded exogenous variable (0 = Mono, 1 = Mixed), and microsite was modeled as an ordered factor, with the order determined by canopy cover (). All continuous dependent variables were centered.
The initial model fit was assessed using several indices, including the Comparative Fit Index (CFI), Tucker-Lewis Index (TLI), and Root Mean Square Error of Approximation (RMSEA). To achieve a better model fit, we then ran a refined version of the model in which we removed the non-significant correlations. Bootstrapped standard errors and p values were used to evaluate the significance of the paths. All analyses were conducted using R (version 4.0.0) with the lavaan and semTools packages (Rosseel, 2012; Jorgensen et al., 2012).
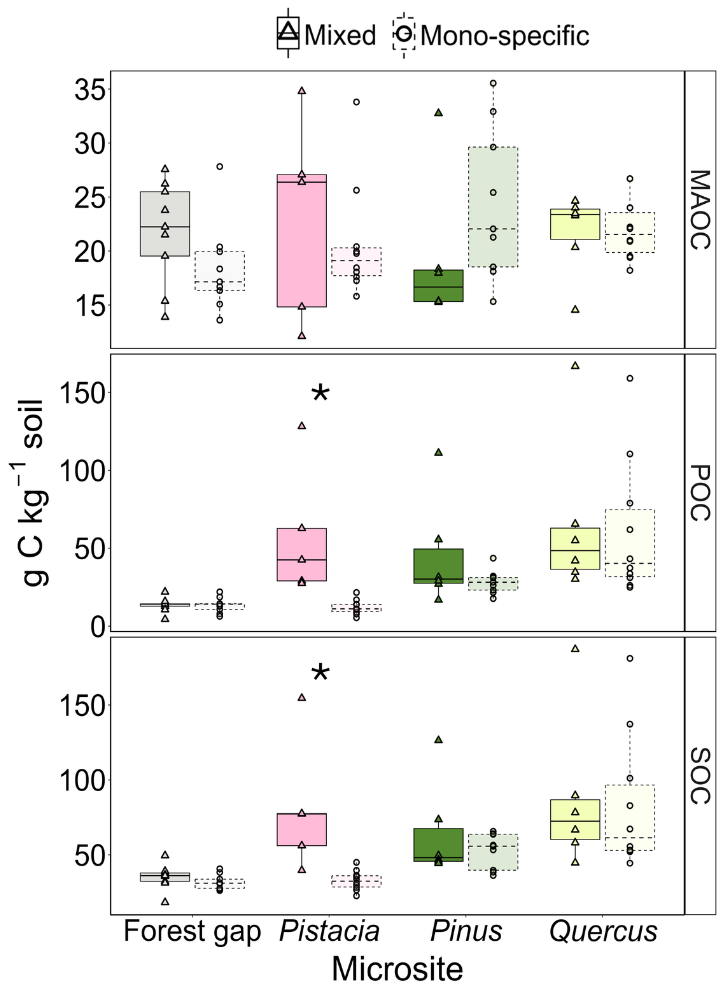
Figure 2SOC concentrations partitioned across different forest types and microsites within the forest in Yishi (from top to bottom: mineral-associated (MAOC), particulate (POC) and total soil organic carbon (SOC)). Box Plots are categorized by the microsite under the dominant tree canopy (i.e., Pistacia, Pinus, Quercus, or open forest gaps (n=66)). Box plots are further categorized into two groups based on forest composition: mono-specific forest (faded color, dashed, plus shape, n=39) and mixed forest (fully saturated color, plain, round shape, n=27). Box plots display the median, first and third quartiles, and whiskers extending to 1.5 times the interquartile range. Asterisks indicate significant contrasts (p<0.05) between mixed and mono-specific forest plots within microsites. *** p<0.001; ** p<0.01; * p<0.05.
3.1 Forest composition effect on soil organic carbon and litter pools
Soil organic carbon (SOC) concentrations in our shallow soil site ranged between 18.3 and 187.1 g C kg−1 soil across tree species and microsites, with the highest values recorded under Quercus and the lowest in a forest gap in a mixed plot (Fig. 2; Table S3). SOC significantly varied among forest microsites (microsite: χ3=18.8, p<0.001). Notably, SOC under tree canopies was up to 2-fold higher than in forest gaps (Fig. 2; Table S3), with the effect being most pronounced under Quercus in monospecific plots (contrast forest gap vs. under Quercus canopy: , p=0.021). Monospecific plots had an overall lower SOC than mixed forest plots but this pattern was only marginally non-significant (Fig. 2, χ1=3.30, p=0.069), and this was mainly attributed to elevated SOC under Pistacia canopies in the mixed plot as compared to the mono specific plot (contrast mixed vs. mono-forests: t25.5=2.60, p=0.015). Considering in situ soil depths, densities, and stone fractions, we calculated SOC stocks for each plot. SOC stocks to a depth of 10 cm (most of the entire, 15 cm deep profile) ranged from 1 kg C m−2 in monospecific forest gaps and Pistacia plots, to 2 and almost 3 kg C m−2 in Pinus and mixed Quercus plots, respectively (Fig. S5). The MAOC fraction did not significantly differ among forest types nor between microsites (Fig. 2). Therefore, the trends in SOC mainly reflected those in the POC fraction. Yet, the trends in POC were more marginal so that the difference in mixed-forest plots under canopies of Pistacia and Quercus were minor compared to forest gaps (contrast forest gap vs. under Quercus canopy: , p=0.062; contrast forest gap vs. under Pistacia canopy: , p=0.096). In the monospecific plots, there was only a significant difference between the POC under the tree canopies and forest gaps for Quercus (contrast forest gap vs. under Quercus canopy: , p=0.027).
Litter dry mass significantly differed among microsites (χ3=38.91, p<0.001), with higher values observed under Pistacia, Pinus, and Quercus canopies compared to forest gaps (Fig. S6a). There was no significant difference among forest types (χ1=0.15, p=0.69) however there was a significant interaction between forest type and microsite (χ3=8.23, p=0.041). Overall, Quercus tended to accumulate more litter compared to all other tree species, especially in mixed plots (contrast mixed vs. mono-forests: , p=0.049).
The ratios of the bulk soil organic matter (SOM), and of the fine fraction organic matter (i.e., mineral-associated organic matter, MAOM) showed variable responses to forest type and microsite (Fig. S6b). For SOM, there was a significant difference among microsites (χ3=8.89, p=0.030) and a marginally non-significant effect of forest type (χ1=3.31, p=0.068), indicating context-dependent differences across microsites and forest compositions.
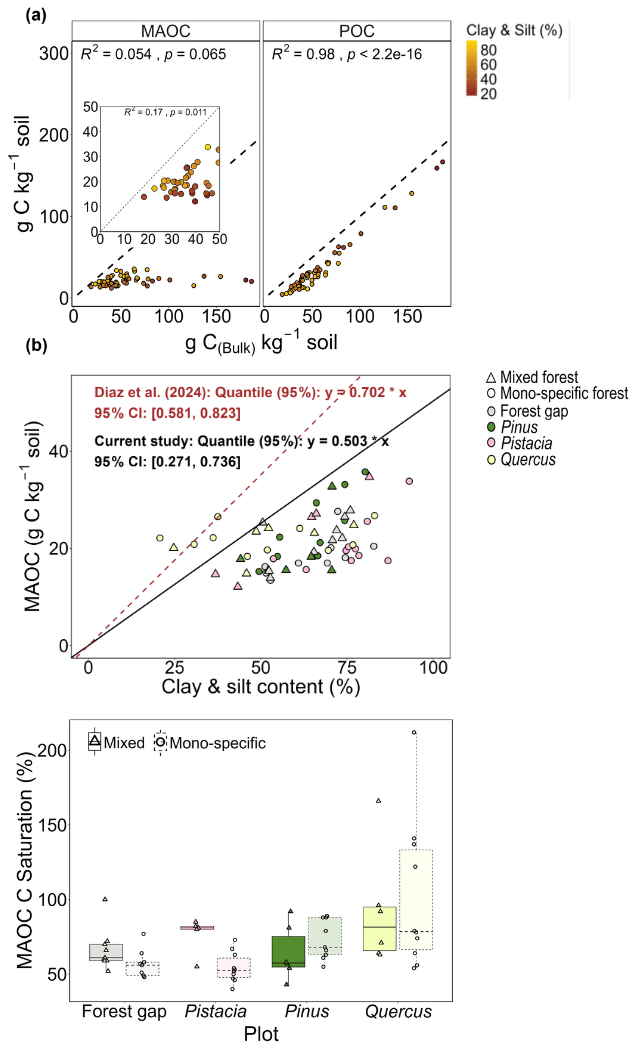
Figure 3Mineral-associated and particulate organic carbon in our observational synthesis. (a) Mineral-associated organic carbon (MAOC) and particulate organic carbon (POC) as functions of total soil organic carbon (SOC). The color gradient represents varying percentages of clay and silt content, and the dashed lines represent 1:1 relationships. (b) Mineral-associated organic carbon (MAOC; g C kg−1 soil) as a function of clay and silt content (%). The maximum slope (fit as the 95th quantile) represents the intrinsic capacity of minerals to store carbon, which depends on mineral composition. The dashed line represents a similar calculation based on data from Díaz-Martínez et al. (2024) (c) Percent mineralogical C saturation-the proximity of a soil to its mineralogical carbon capacity (MAOCmax)-was calculated for each measurement. % C saturation is grouped by the soil sample location under the dominant tree canopy (i.e., Pistacia, Pinus or Quercus, n=48) or open forest gaps (n=18) and by forest composition: mono-specific forest (faded color, dashed, plus shape, n=39) and mixed forest (fully saturated color, plain, round shape, n=27).
3.2 Mineral associated organic carbon saturation behavior
Overall, the clay + silt content in our forest soil averaged around 63 %, ranging from 28 % to 92 %. MAOC exhibited a saturation-type relationship with increasing SOC across sites (Fig. 3a), reaching a maximum of 35.5 g C kg−1 soil. At lower SOC levels, MAOC comprised nearly 80 % of the SOC pool, but its saturation behavior led to a declining relative contribution, so that POC accounted for more than 90 % of total SOC at high-SOC sites. Across plots, MAOC increased linearly with clay + silt content (χ1=21.29, p<0.001; Fig. 3b). The soil MAOC capacity for the research area was established using previously described methodology (Six et al., 2024), to yield a value of 50.3 g C kg−1 clay + silt (according to the top 95th percentile of the data). The C saturation, i.e., the measured MAOC as a percentage of the maximum predicted MAOC per plot was then calculated. C saturation according to this methodology ranged 40 %–212 % and varied among microsites (χ3=12.07, p=0.007). Additionally, a significant difference was observed between the C saturation under the tree canopies and forest gaps for Quercus (contrast forest gap vs. under Quercus canopy: , p=0.043; Fig. 3c).
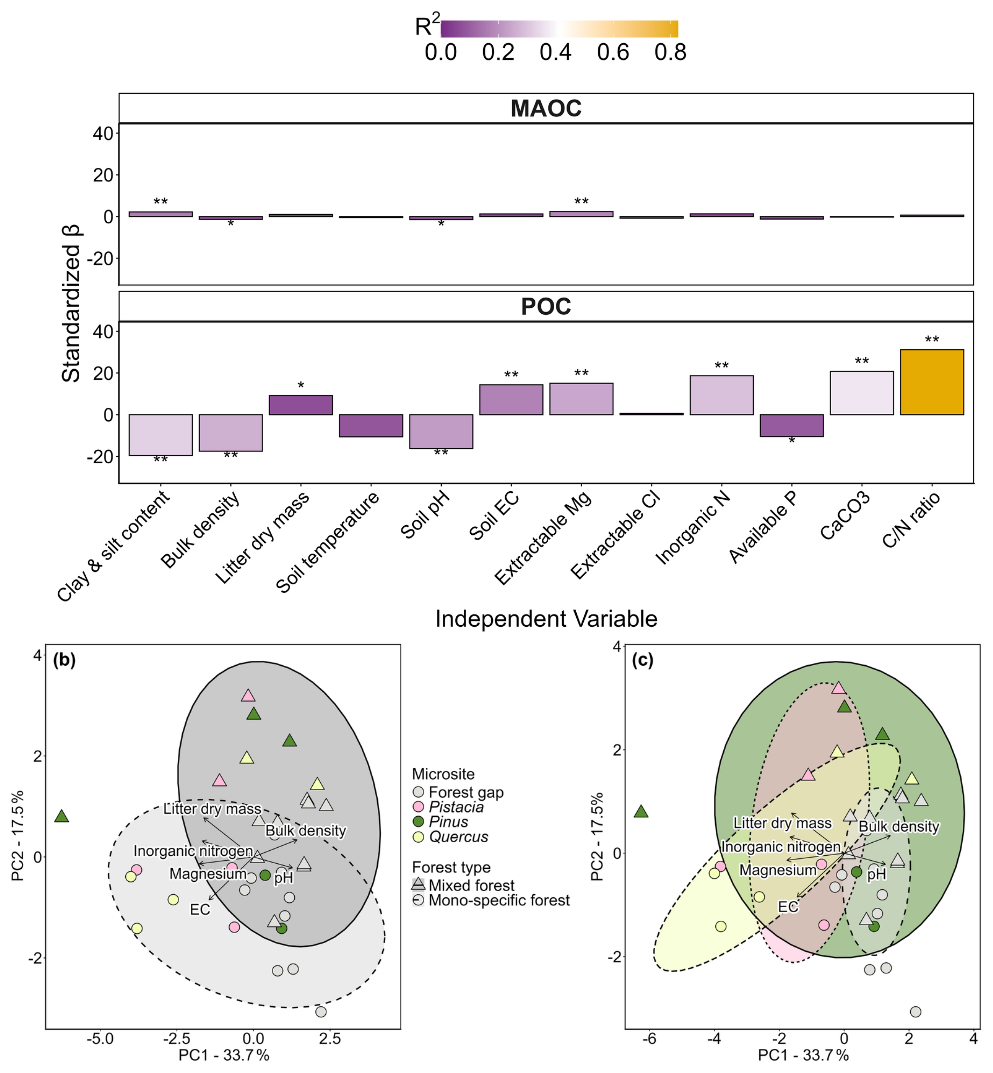
Figure 4Models of the effects of soil physical and chemical properties. (a) Individual mixed regression models assessed the relationship between each predictor variable and the response variable. Standardized estimated coefficients of the explanatory variables (β) are represented by bar heights, with a color gradient indicating the R2 values, and significance levels indicated above/below each bar (* p<0.05, ** p<0.01, *** p<0.001). (b, c) Principal component analysis (PCA) biplot showing soil physicochemical properties. Points represent individual samples colored by microsite and shaped by forest type. Ellipses indicate the 95 % confidence intervals for either forest type (b) or microsite (c). Vectors represent the loadings of selected soil variables (loading magnitude >0.4) on the first two principal components (PC1 and PC2), with arrow length indicating the strength and direction of contribution.
3.3 Underlying soil properties influencing soil organic carbon fractions
Twelve soil parameters were tested for their individual effects on POC and MAOC using a set of individual mixed regression models (Fig. 4a). For MAOC, there was a significant increase in MAOC with increasing clay + silt content. The soil bulk-density, soil pH and soluble magnesium were also significant predictors of the MAOC content. For POC, the bulk soil ratio was the strongest predictor of C content. Other parameters like litter dry mass, soil EC, water-soluble magnesium, water-soluble inorganic nitrogen, and carbonates content (CaCO3 equivalent), showed a positive relation to POC, while others demonstrated a negative relationship (clay + silt content, bulk-density, soil temperature, soil pH and extractable phosphate).
Principal component analysis (PCA) revealed a clear separation of forest plots along PC1 and PC2, which together explained 51.2 % of the total variance (Fig. 4b, c). Along with PC1, positive scores were associated with higher bulk-density, pH, and extractable phosphate, whereas negative scores reflected higher litter dry mass, inorganic nitrogen, EC, and magnesium. PC2 primarily contrasted higher carbonates content and ratio (positive loadings) with higher temperature, phosphate, and chloride (negative loadings). PERMANOVA tests showed that forest plots significantly differed among forest types (, p=0.002, R2=0.11) and microsites (, p=0.021, R2=0.17), with mono-specific Quercus plots showing a significant contrast to forest gaps (PERMANOVA pairwise contrast: , padjust=0.030, R2=0.44).
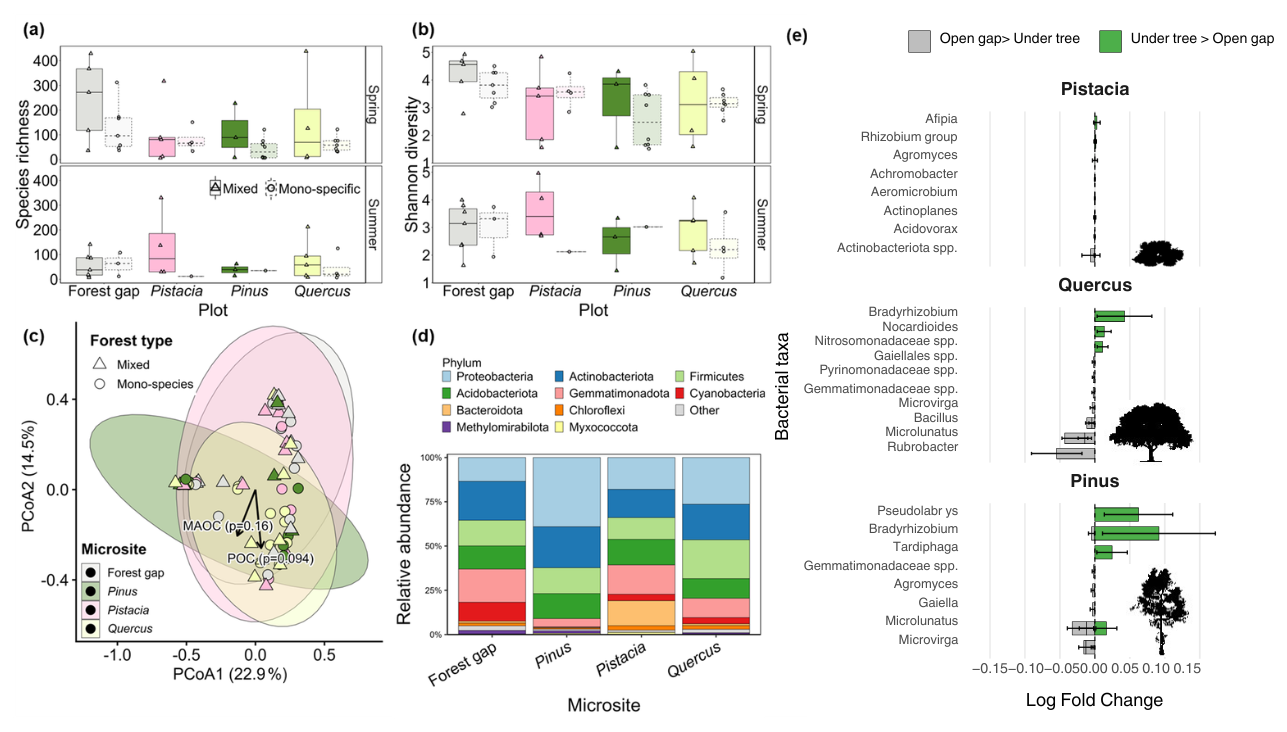
Figure 5Bacterial community structure and diversity across microsites and forest types in Yishi. (a) Species richness and (b) Shannon diversity index of bacterial communities, categorized by microsite (forest gap, Pistacia, Pinus, and Quercus) and season (spring, summer). Box plots are further divided by forest composition: mono-specific forests (faded color, dashed box, plus symbol, n=39) and mixed forests (fully saturated color, solid box, circle symbol, n=27). (c) Principal Coordinates Analysis (PCoA) plot based on beta diversity, showing clustering by microsite and forest type. Points represent individual samples (circles: mixed forests; triangles: mono-specific forests), colored by microsite. Ellipses represent 95 % confidence intervals around group centroids. The axes indicate the percentage of variation explained (PCoA1: 22.9 %, PCoA2: 14.5 %). (d) Relative composition of the top 10 bacterial genera, displayed as 100 % stacked horizontal bars per genus, showing the proportion contributed by each microsite. Genus names are listed on the right. (e) Log fold change in the relative abundance of the top 10 bacterial taxa beneath tree canopies compared with open forest gaps for Pistacia, Quercus, and Pinus. Positive values (green) indicate taxa with higher relative abundance beneath tree canopies, whereas negative values (grey) indicate taxa with higher relative abundance in open gaps. Samples were collected from six plots in Yishi Forest during spring (n=43) and summer (n=28). Microsites include dominant tree canopies (Pistacia, Pinus, Quercus; n=48) or open forest gaps (n=18). Box plots display the median, interquartile range (IQR), and whiskers extending to 1.5× IQR.
3.4 Soil microbial communities in different forest compositions
The sequencing of the 16S rRNA gene yielded a total of 1531 ASVs, belonging to 20 phyla, 48 classes, 101 orders, 153 families, 265 genera and 2003 species. Our database enrichment using PacBio analysis revealed 413 novel full-length SSU sequences, representing unidentified bacterial species that were not present in the existing database. Considering the contrasting in situ wet/dry season conditions, samples were taken in spring and summer, respectively. Overall, soil microbial richness was higher in spring (107.4±17.5) than summer (65.2±13.8; season: χ1=6.74, p<0.001; Fig. 5a). Generally, mixed forest plots tended to have higher microbial richness vs. the monospecific plots (74.9±18.9 vs. 44.7±14.7 and 155±37.4 vs. 76.3±13.1 for summer and spring, respectively; Fig. 5a). However, this difference was not significant, likely due to the large variations among seasons and tree species. The highest soil microbial richness was in forest gaps in mixed forest plots, reaching >200 species. Microbial Shannon diversity demonstrated similar patterns to those of microbial richness. No clear or consistent patterns were observed between any of the diversity indices and SOC or its fractions (MAOC and POC; Fig. S7). There was a significant compositional difference among microsites (i.e., under Pistacia, Pinus, Quercus trees or forest gaps) (PERMANOVA: microsite; Pseudo , p=0.004; Fig. 5b). This effect did not appear to result from differences in dispersion (, p=0.47) but rather from differences in group centroids. Overall, bacterial communities collected under trees (Pistacia, Pinus, or Quercus) were subsets of the bacterial communities found in forest gaps (Fig. 5c). By contrast, there were no significant differences between forest types (mixed vs. monospecific forest) (PERMANOVA: Forest type; Pseudo , p=0.423; Fig. 5c) nor sampling seasons (spring vs. summer) (PERMANOVA: Season; Pseudo , p=0.298). However, there was a significant three-way interaction among forest type, microsite, and sampling season (PERMANOVA: Interaction; , p=0.023). Consistent with this, bacterial composition based on Bray–Curtis distances showed a weak, marginally non-significant correlation with POC (p=0.094) and an even weaker association with MAOC (p=0.16). The top ten most common bacterial phyla partitioned well among the microsites, with Pinus soils hosting a higher proportion of proteobacteria and Quercus soils hosting a relatively higher proportion of firmicutes (Fig. 5d). ANCOM-BC analysis found no significant differences between Pistacia samples collected under canopies and those in forest gaps. In Quercus, under-canopy soils showed higher differential abundance of Bradyrhizobium, Nocardioides, and a genus within Nitrosomonadaceae. Pinus exhibited the largest log2-fold changes, with higher under-canopy abundance of Pseudolabrys, Bradyrhizobium, and Tardiphaga relative to forest gaps (Fig. 5e).
3.5 The direct and indirect effects of forest characteristics on POC and MAOC
We used structural equation modeling (SEM) to assess the direct, indirect, and total effects of forest type, microsite, tree-related variables, soil properties (clay + silt content as a separate variable), and microbial community richness on MAOC and POC. The final model (N=62) showed acceptable fit (, p=0.262; CFI = 0.983; TLI = 0.980; RMSEA = 0.056; SRMR = 0.061; scaled CFI = 0.926; scaled TLI = 0.909; scaled RMSEA = 0.095) and explained 43.0 % and 66.3 % of the variation in MAOC and POC, respectively.
The strongest direct controls on MAOC were soil properties (PC1; β=0.544, p<0.001) and clay + silt content (β=0.650, p<0.001). POC was directly positively associated with soil properties (β=0.639, p=0.001) and microsite (β=0.659, p=0.005), whereas its direct relationships with litter density (, p=0.095) and clay + silt content (, p=0.083) were negative and only marginally significant. Microsite also strongly increased aboveground biomass (β=0.615, p<0.001) and litter density (β=0.766, p<0.001), while soil properties were positively related to litter density (β=0.657, p<0.001) and negatively related to clay + silt content (, p<0.001). Forest type was positively associated with microbial richness (β=0.376, p=0.002), unlike the non-significant univariate result, likely reflecting the multivariate framework and complete-case subset. Nevertheless, microbial richness had no significant direct effect on either carbon fraction and was therefore excluded from the final model.
The full set of indirect and total effects is given in Table S5; most followed directly from the relationships above. Two cases, however, revealed contrasting direct and indirect pathways. For MAOC, the strong positive direct effect of clay + silt content was partly offset by a negative indirect effect through other soil properties (PC1; , p=0.006), resulting in a smaller but still positive total effect (β=0.427, p<0.001). For POC, litter density showed a negative direct relationship (, p=0.095) and a positive indirect effect of comparable magnitude through soil properties (β=0.419, p=0.037), the two effectively offsetting one another and leaving no significant total effect (, p=0.350).
This study provides a comprehensive analysis of organic carbon storage in forest soils, exploring the roles of tree species and their mixing, through physical, chemical, and biological perspectives on SOC and its fractions. Overall, we estimate that mixed forest plots stored ∼ 0.61 kg C m−2 (∼6.1 Mg C ha−1) more than monospecific plots under these Mediterranean conditions. Our holistic approach allowed us to identify key factors influencing soil carbon storage in Mediterranean shallow-soil forests (Fig. 6).
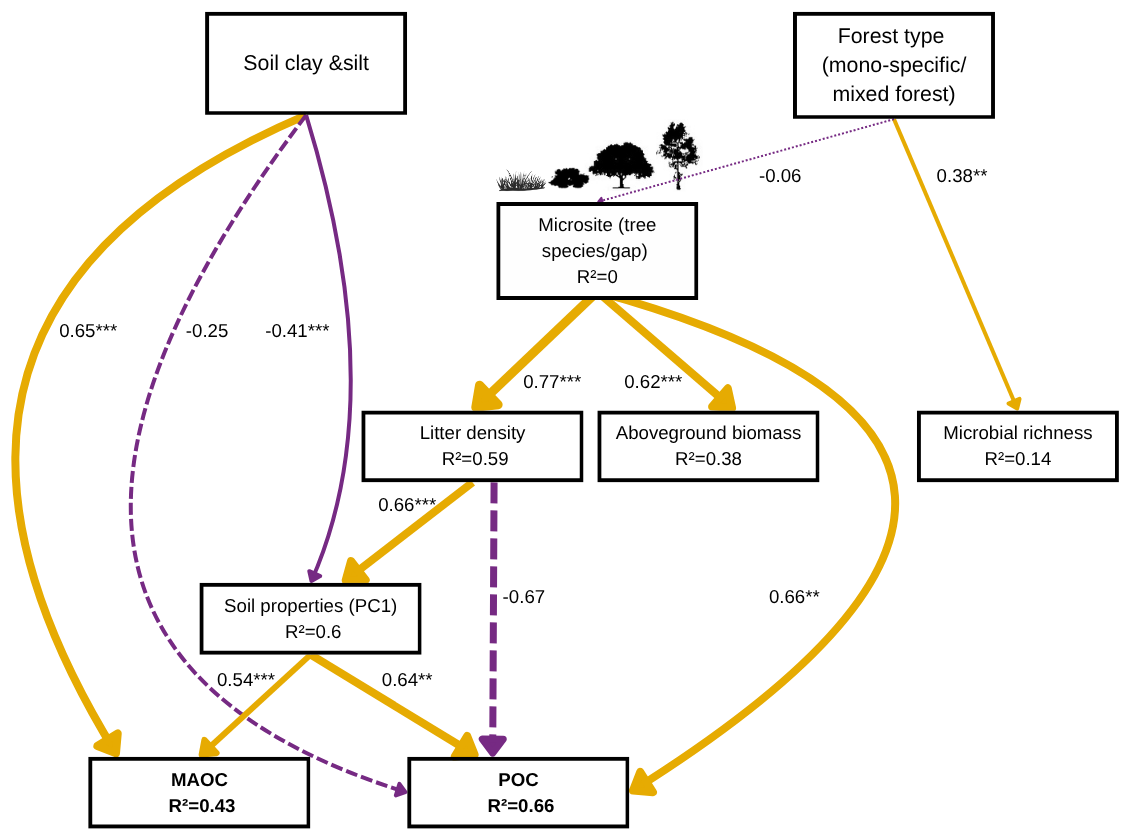
Figure 6Structural equation model showing the direct effects retained in the final model. Boxes represent measured variables and arrows represent direct paths, with arrow width scaled to the magnitude of the standardized regression coefficient. yellow arrows indicate positive effects and purple arrows negative effects; solid and dashed lines indicate significant (p≤0.05), marginally significant (p≤0.1) and n.s. (p≥0.05) paths, respectively. “Soil properties” represents PC1 summarizing the measured soil physicochemical variables, excluding clay + silt content, which was treated separately because of its importance for MAOC formation. All hypothesized pathways are shown in Fig. 1, and complete direct, indirect, and total effects are reported in Table S4.
4.1 Contrasting controls on mineral-associated and particulate organic carbon
Our findings underscore how different controls dominate the accumulation of POC as compared to MAOC. POC tended to be higher in mixed plots, accompanied by a marginal increase in SOC compared to monospecific plots, providing partial support for our first hypothesis. The significant control of soil factors such as pH, carbonates content and Mg on the POC and the relatively high POC values measured here may point at unique POC preservation mechanisms occurring in calcareous dryland soils as suggested by Rasmussen et al. (2018). However, studies relating to unique preservation mechanisms of SOC in calcareous soils are scarce (Rowley et al., 2018). Our findings suggest that higher nitrogen, whether organic, inorganic, or mixed, can increase POC more than MAOC, as reported in other studies (Wu et al., 2023; Averill and Waring, 2018). The significant effect of ratio found in our analysis might also point at N deficiency as a driver retarding POC degradation, because nitrogen availability plays a crucial role in regulating carbon cycling and storage in terrestrial ecosystems (Vitousek and Howarth, 1991; Ye et al., 2018). In addition, litter with lower ratios is more readily transformed into MAOC through microbial activity or direct absorption to mineral surfaces (Lavallee et al., 2018). Notwithstanding, it may also be the result of an artifact created by the weighted increase in high POC. Overall, our mixed forest plots demonstrated a higher ratio than the mono-specific plots (42.26±5.3 for mixed vs. 31.27±2.5 in mono-specific forests), which might contribute to the observed tendency toward higher POC in mixed forests.
Counter to POC, MAOC showed saturation behavior, peaking at ∼ 45 g C kg−1 soil in this study. This is in good correspondence with the work of Cotrufo et al. (2019) who showed similar saturation of MAOC at around 40 g C kg−1 for an extensive set of soils from across Europe. This saturation pattern and the strong dependence of MAOC on clay + silt content, both support the notion that MAOC accumulation can be constrained by the finite capacity of soil minerals for association (Georgiou et al., 2025). As MAOC is considered the more recalcitrant and larger SOC fraction, these findings further reinforce the view that soil texture is a dominant control on long-term organic carbon accumulation in soil (Doetterl et al., 2015; Rasmussen et al., 2018).
4.2 Saturation of the MAOC fraction
Using the top 95th percentile as an estimate of the soil MAOC capacity, we established a value of 50.3 g C kg−1 soil for the research area. This value is close to 48 g C kg−1 established by Georgiou et al. (2022) for “low activity” mineral soils. This matches the high content of carbonate minerals in our site, typically less reactive compared to Fe and Al oxides.
Georgiou et al. (2025) noted that systems may reach an apparent saturation at values below the mineral capacity to carry MAOC due to ecosystem constraints such as water limitation. To assess whether water was the factor limiting the MAOC capacity at our site, we examined the MAOC capacity in a large set of dryland forests using the recently published data of Díaz-Martínez et al. (2024). That dataset yields a significantly higher MAOC capacity of 70.2 g C kg−1 clay + silt, supporting the idea that at our site, mineral properties, rather than climate, were the limiting factor on MAOC accumulation. MAOC saturation values, expressed as the percentage of the MAOC capacity currently filled in each sampling point, exceeded 50 % even in the forest gaps. These values were above the global average for forest soils (Georgiou et al., 2022). Under such saturated conditions, it is not surprising that differences between forest gaps and under-canopy soils do not emerge as previously reported in other dryland forests (Díaz-Martínez et al., 2024). Notwithstanding, while plots with oaks (mixed and monospecific) and Pistacia in mixed plots were at 80 %–90 % of MAOC saturation, plots with pines were around 70 %, and other plots (forest gaps and monospecific Pistacia) were at 60 % (Fig. 3c) perhaps demonstrating the importance of organic matter quality on its accumulation (Castellano et al., 2015; Córdova et al., 2018). Notably, saturation values exceeding 100 % were observed in some Quercus stands. Such values are an inherent consequence of defining MAOC capacity using the 95th percentile, as observations in the upper tail of the distribution will by definition exceed the saturation threshold estimated this way. Nonetheless, it has often been proposed that organo-organic interactions can lead to accumulation of MAOC beyond the expected mineral capacity to bind it (Georgiou et al., 2025), which may also be the case in these organic-rich microsites.
4.3 Soil microbial richness and diversity across different forest types
In contrast to our hypothesis, in the univariate analysis, microbial richness and diversity were not significantly higher in mixed compared to monospecific plots. However, we observed higher species richness and diversity in forest gaps compared to samples taken under tree canopies, particularly in mixed forests and during spring. This pattern may be attributed to reduced competitive exclusion and niche specialization under more variable conditions. Conversely, the more stable microenvironment under tree canopies likely favors a few dominant genera, leading to reduced bacterial richness (Fig. 5a). Importantly, our analysis reflects the soil's total profile of microbial species, not only decomposers, indicating a broader ecological role of microbial communities beyond organic matter breakdown. Interestingly, neither bacterial richness nor diversity correlated with any of the SOC pools, regardless of the season (Fig. S7). However, community composition appears to be weakly correlated with POC, yet this pattern was non-significant (Fig. 5c; p=0.094). This underscores the importance of overall microbial composition and specific microbial groups in C cycling.
Previous studies have shown that tree roots actively recruit specific soil bacteria, as demonstrated in Cupressus sempervirens (Oppenheimer-Shaanan et al., 2022). Further, increased root exudation rates during the dry season have been observed in the tree species studied at the mixed plots, which may promote bacterial growth (Oppenheimer-Shaanan et al., 2022; Jakoby et al., 2020). This aligns with Yuste et al. (2014), who found more pronounced drought responses in summer, but contrasts with Yuste et al. (2011), who did not find a correlation between bacterial biomass and SOC. Our study revealed that soil bacterial community composition was significantly shaped by microsite conditions, whereas forest type and season alone had no overall significant effects. Similarly, the bacterial communities growing on the roots of the trees in the mixed plots changed with host tree species but not with season (Obersteiner et al., 2026). Specifically, the tree species-specific abundant bacterial taxa (Fig. 5e) are known to play key roles in nitrogen fixation (Bradyrhizobium; Peoples et al., 2021, and Microvirga; Wolińska et al., 2017), nitrification (Nitrosomonadaceae; Hayatsu et al., 2021), and degradation of aromatic compounds (Nocardioides; Ma et al., 2023), highlighting the ability of each tree species to select microbial partners that meet its nutritional and ecological needs. Conversely, under tree canopies, we observed a decrease in general soil bacteria and fewer rhizosphere-associated taxa, such as Microlunatus, involved in phosphate cycling, and Microvirga and Gaiella, known for diverse soil functions (Fierer and Jackson, 2006; Ardley et al., 2012). Notably, we observed significant interactive effects on community composition among forest type, microsite, and season, suggesting context-dependent community dynamics. Pairwise comparisons further clarified these patterns: in monospecific forests, bacterial communities exhibited significant seasonal shifts (p=0.008), indicating lower compositional stability. In contrast, mixed forests maintained similar bacterial community composition across spring and summer (p=0.294), reflecting higher seasonal stability. This greater stability in mixed forests may result from diverse tree species providing more continuous or heterogeneous resource inputs and buffering microenvironmental fluctuations, as suggested in this forest system (Rog et al., 2021b) and others (e.g., Urbanová et al., 2015; Baldrian, 2017).
4.4 Integrating the direct and indirect effects on MAOC and POC fractions
The structural equation model partially supported our hypotheses regarding the controls on SOC partitioning (Fig. 6). Consistent with expectations, soil properties (PC1) exerted strong total effects on both MAOC and POC, and clay + silt content was positively associated with MAOC while showing a negative total effect on POC, supporting the hypothesis that higher soil capacity favors mineral-associated carbon storage. Litter density contributed to MAOC indirectly through soil properties, in line with the expectation that organic inputs promote MAOC formation via soil-mediated pathways but showed no total effect on POC. Contrary to our hypothesis that the microbial community would play an indirect role in SOC fractionation, microbial richness, despite being significantly affected by forest type, did not explain variation in either carbon fraction (MAOC, POC) and was therefore excluded from downstream pathways. Similar non-significant qualitative results were obtained when including other metrics of the microbial community in the path analysis (i.e., microbial diversity/composition indexes). Microsite (i.e., tree species or under-tree vs. forest gap) effects on SOC were largely indirect and mediated by litter density and soil properties; however, the presence of a direct microsite effect on POC indicates that vegetation type-associated differences influence POC beyond aboveground litter inputs. This pattern is consistent with an additional contribution of belowground inputs that differ among vegetation types, including interspecific variation in root exudation and root turnover. Although belowground traits were not quantified at a resolution that enabled inclusion in the SEM, measurements from adjacent plots indicate substantial differences in root exudation rates among the studied tree species (Obersteiner et al., 2026). Overall, these results suggest that SOC fractionation in this system is primarily governed by soil physical properties and vegetation-mediated inputs, with limited support for a direct role of microbial diversity in regulating MAOC and POC stocks at the scale examined.
In discussing the limitations of this study, several key factors must be considered. First, our sampling was restricted to the top 10 cm of soil, which, while capturing the most biologically active layer, may not fully represent deeper soil processes or variations in organic matter distribution that could affect overall findings. Second, some monospecific plots were not entirely pure (Table S2), potentially introducing variability from the presence of non-target species, which could confound the results and complicate the interpretation of tree species' influence on soil properties. Third, absence of data on litter quality, such as nitrogen content and micronutrient levels, further limits our understanding of how different tree species affect decomposition and soil organic matter dynamics. Finally, our microbial analyses characterize community composition and richness rather than microbial activity. Consequently, active taxa involved in SOC formation and turnover may not be fully represented by these metrics, and approaches such as quantitative stable isotope probing (Hungate et al., 2015) could provide a more direct assessment of microbial contributions to SOC cycling. Nevertheless, these limitations do not undermine the validity of our study. Variability from non-target species does not overshadow the clear trends associated with tree species. While the lack of litter quality data and a direct assessment of microbial activity are constraints, the observed relationships between tree species and soil organic matter dynamics remain strong. Overall, we show that forest type can affect soil C pools through specific microsites and tree-species characteristics. Moreover, our study establishes a solid foundation for future research, contributing to a deeper understanding of the complex interactions between tree species, soil organic matter, and microbial communities.
All data used in this study are provided in the main manuscript and the Supplement. Sequence data was submitted to the National Center for Biotechnology Information Sequence Read Archive with the accession codes: Bioproject PRJNA1533853.
The supplement related to this article is available online at https://doi.org/10.5194/bg-23-6763-2026-supplement.
AY led the study under the supervision of TK, SLL, and YOS. SLL and AY performed the data analysis. DY instructed the soil analysis; DS instructed the microbial analysis; YOS instructed the chemical analysis; AY, SLL, DY and TK wrote the manuscript with help from all authors.
The contact author has declared that none of the authors has any competing interests.
Publisher's note: Copernicus Publications remains neutral with regard to jurisdictional claims made in the text, published maps, institutional affiliations, or any other geographical representation in this paper. The authors bear the ultimate responsibility for providing appropriate place names. Views expressed in the text are those of the authors and do not necessarily reflect the views of the publisher.
The authors would like to thank the Jewish National Fund (KKL) for providing access to the study plots. Assaf Yaakobi thanks Yuval Steinberg and The Weizmann Tree Lab members for assistance in field sampling and lab measurements. We also wish to thank Jose Grunzweig for his friendly review of earlier drafts of this article. We thank Vered Zavaro for her bioinformatic assistance with the CoSMIC analysis.
The study was supported by the Israel Council for Higher Education (VATAT project “Negative Emissions Testing Center: Standardized Evaluation of Existing and Emerging CO2 Removal Technologies”).
This paper was edited by Sara Vicca and reviewed by two anonymous referees.
Amelung, W., Bossio, D., de Vries, W., Kögel-Knabner, I., Lehmann, J., Amundson, R., Bol, R., Collins, C., Lal, R., and Leifeld, J.: Towards a global-scale soil climate mitigation strategy, Nat. Commun., 11, 5427, https://doi.org/10.1038/s41467-020-18887-7, 2020.
Ardley, J. K., Parker, M. A., De Meyer, S. E., Trengove, R. D., O'Hara, G. W., Reeve, W. G., Yates, R. J., Dilworth, M. J., Willems, A., and Howieson, J. G.: Microvirga lupini sp. nov., Microvirga lotononidis sp. nov. and Microvirga zambiensis sp. nov. are alphaproteobacterial root-nodule bacteria that specifically nodulate and fix nitrogen with geographically and taxonomically separate legume hosts, Int. J. Syst. Evol. Micr., 62, 2579–2588, https://doi.org/10.1099/ijs.0.035097-0, 2012.
Arora, V. K., Boer, G. J., Friedlingstein, P., Eby, M., Jones, C. D., Christian, J. R., Bonan, G., Bopp, L., Brovkin, V., and Cadule, P.: Carbon–concentration and carbon–climate feedbacks in CMIP5 Earth system models, J. Climate, 26, 5289–5314, https://doi.org/10.1175/JCLI-D-12-00494.1, 2013.
Averill, C. and Waring, B.: Nitrogen limitation of decomposition and decay: how can it occur?, Glob. Change Biol., 24, 1417–1427, https://doi.org/10.1111/gcb.13980, 2018.
Avital, S., Rog, I., Livne‐Luzon, S., Cahanovitc, R., and Klein, T.: Asymmetric belowground carbon transfer in a diverse tree community, Mol. Ecol., 31, 3481–3495, https://doi.org/10.1111/mec.16477, 2022.
Baldrian, P.: Forest microbiome: diversity, complexity and dynamics, FEMS Microbiol. Rev., 41, 109–130, https://doi.org/10.1093/femsre/fuw040, 2017.
Barnett, D. J., Arts, I. C., and Penders, J.: microViz: an R package for microbiome data visualization and statistics, J. Open Source Softw., 6, 3201, https://doi.org/10.21105/joss.03201, 2021.
Callahan, B. J., McMurdie, P. J., Rosen, M. J., Han, A. W., Johnson, A. J. A., and Holmes, S. P.: DADA2: High-resolution sample inference from Illumina amplicon data, Nat. Methods, 13, 581–583, https://doi.org/10.1038/nmeth.3869, 2016.
Castellano, M. J., Mueller, K. E., Olk, D. C., Sawyer, J. E., and Six, J.: Integrating plant litter quality, soil organic matter stabilization, and the carbon saturation concept, Glob. Change Biol., 21, 3200–3209, https://doi.org/10.1111/gcb.12982, 2015.
Córdova, S. C., Olk, D. C., Dietzel, R. N., Mueller, K. E., Archontouilis, S. V., and Castellano, M. J.: Plant litter quality affects the accumulation rate, composition, and stability of mineral-associated soil organic matter, Soil Biol. Biochem., 125, 115–124, https://doi.org/10.1016/j.soilbio.2018.07.010, 2018.
Cotrufo, M. F. and Lavallee, J. M.: Soil organic matter formation, persistence, and functioning: A synthesis of current understanding to inform its conservation and regeneration, Adv. Agron., 172, 1–66, https://doi.org/10.1016/bs.agron.2021.11.002, 2022.
Cotrufo, M. F., Ranalli, M. G., Haddix, M. L., Six, J., and Lugato, E.: Soil carbon storage informed by particulate and mineral-associated organic matter, Nat. Geosci., 12, 989–994, https://doi.org/10.1038/s41561-019-0484-6, 2019.
Crowther, T. W., Van den Hoogen, J., Wan, J., Mayes, M. A., Keiser, A., Mo, L., Averill, C., and Maynard, D. S.: The global soil community and its influence on biogeochemistry, Science, 365, eaav0550, https://doi.org/10.1126/science.aav0550, 2019.
Díaz-Martínez, P., Maestre, F. T., Moreno-Jiménez, E., Delgado-Baquerizo, M., Eldridge, D. J., Saiz, H., Gross, N., Le Bagousse-Pinguet, Y., Gozalo, B., and Ochoa, V.: Vulnerability of mineral-associated soil organic carbon to climate across global drylands, Nat. Clim. Change, 14, 976–982, https://doi.org/10.1038/s41558-024-02087-y, 2024.
Díaz-Pinés, E., Rubio, A., Van Miegroet, H., Montes, F., and Benito, M.: Does tree species composition control soil organic carbon pools in Mediterranean mountain forests?, Forest Ecol. Manage., 262, 1895–1904, https://doi.org/10.1016/j.foreco.2011.02.004, 2011.
Doetterl, S., Stevens, A., Six, J., Merckx, R., Van Oost, K., Casanova Pinto, M., Casanova-Katny, A., Muñoz, C., Boudin, M., and Zagal Venegas, E.: Soil carbon storage controlled by interactions between geochemistry and climate, Nat. Geosci., 8, 780–783, https://doi.org/10.1038/ngeo2516, 2015.
Dror, D. and Klein, T.: The effect of elevated CO2 on aboveground and belowground carbon allocation and eco-physiology of four species of angiosperm and gymnosperm forest trees, Tree Physiol., 42, 831–847, https://doi.org/10.1093/treephys/tpab136, 2022.
Fierer, N. and Jackson, R. B.: The diversity and biogeography of soil bacterial communities, P. Natl. Acad. Sci. USA, 103, 626–631, https://doi.org/10.1073/pnas.0507535103, 2006.
Fuks, G., Elgart, M., Amir, A., Zeisel, A., Turnbaugh, P. J., Soen, Y., and Shental, N.: Combining 16S rRNA gene variable regions enables high-resolution microbial community profiling, Microbiome, 6, 17, https://doi.org/10.1186/s40168-017-0396-x, 2018.
Georgiou, K., Jackson, R. B., Vindušková, O., Abramoff, R. Z., Ahlström, A., Feng, W., Harden, J. W., Pellegrini, A. F., Polley, H. W., and Soong, J. L.: Global stocks and capacity of mineral-associated soil organic carbon, Nat. Commun., 13, 3797, https://doi.org/10.1038/s41467-022-31540-9, 2022.
Georgiou, K., Angers, D., Champiny, R. E., Cotrufo, M. F., Craig, M. E., Doetterl, S., Grandy, A. S., Lavallee, J. M., Lin, Y., and Lugato, E.: Soil carbon saturation: what do we really know?, Glob. Change Biol., 31, e70197, https://doi.org/10.1111/gcb.70197, 2025.
Gill, R. A. and Jackson, R. B.: Global patterns of root turnover for terrestrial ecosystems, New Phytologist, 147, 13–31, https://doi.org/10.1046/j.1469-8137.2000.00681.x, 2000.
Gregorich, E. G., Janzen, H., Ellert, B. H., Helgason, B. L., Qian, B., Zebarth, B. J., Angers, D. A., Beyaert, R. P., Drury, C. F., and Duguid, S. D.: Litter decay controlled by temperature, not soil properties, affecting future soil carbon, Glob. Change Biol., 23, 1725–1734, https://doi.org/10.1111/gcb.13502, 2017.
Griscom, B. W., Adams, J., Ellis, P. W., Houghton, R. A., Lomax, G., Miteva, D. A., Schlesinger, W. H., Shoch, D., Siikamäki, J. V., and Smith, P.: Natural climate solutions, P. Natl. Acad. Sci. USA, 114, 11645–11650, https://doi.org/10.1073/pnas.1710465114, 2017.
Hansen, P. M., Even, R., King, A. E., Lavallee, J., Schipanski, M., and Cotrufo, M. F.: Distinct, direct and climate‐mediated environmental controls on global particulate and mineral‐associated organic carbon storage, Glob. Change Biol., 30, e17080, https://doi.org/10.1111/gcb.17080, 2024.
Hayatsu, M., Katsuyama, C., and Tago, K.: Overview of recent researches on nitrifying microorganisms in soil, Soil Sci. Plant Nutr., 67, 619–632, https://doi.org/10.1080/00380768.2021.1981119, 2021.
Hong, S., Yin, G., Piao, S., Dybzinski, R., Cong, N., Li, X., Wang, K., Peñuelas, J., Zeng, H., and Chen, A.: Divergent responses of soil organic carbon to afforestation, Nature Sustainability, 3, 694–700, https://doi.org/10.1038/s41893-020-0557-y, 2020.
Hungate, B. A., Mau, R. L., Schwartz, E., Caporaso, J. G., Dijkstra, P., Van Gestel, N., Koch, B. J., Liu, C. M., McHugh, T. A., and Marks, J. C.: Quantitative microbial ecology through stable isotope probing, Appl. Environ. Microbiol., 81, 7570–7581, https://doi.org/10.1128/AEM.02280-15, 2015.
Itkin, D., Ronen, A., Needelman, B., Crouvi, O., and Eshel, G.: Israel Soil Taxonomy GIS (online version 2, January 2025), https://experience.arcgis.com/experience/a3e2530b0f474f43bb5c7b14e7d27010/?locale=he (last access: 16 September 2026), 2025.
Jackson, R. B., Canadell, J., Ehleringer, J. R., Mooney, H. A., Sala, O. E., and Schulze, E. D.: A global analysis of root distributions for terrestrial biomes, Oecologia, 108, 389–411, https://doi.org/10.1007/BF00333714, 1996.
Jakoby, G., Rog, I., Megidish, S., and Klein, T.: Enhanced root exudation of mature broadleaf and conifer trees in a Mediterranean forest during the dry season, Tree Physiol., 40, 1595–1605, https://doi.org/10.1093/treephys/tpaa092, 2020.
Jorgensen, T. D., Pornprasertmanit, S., Schoemann, A. M., and Rosseel, Y.: semTools: Useful tools for structural equation modeling, R package [code], https://CRAN.R-project.org/package=semTools (last access: 18 September 2026), 2012.
Knafo, M., Rezenman, S., Idan, T., Elgart, M., Dagan, S., Zavaro, V., Reich, Z., Kapon, R., Sade, D., and Shental, N.: CoSMIC: A hybrid approach for large-scale, high-resolution microbial profiling of novel niches, PLOS One, 21, e0340349, https://doi.org/10.1371/journal.pone.0340349, 2026.
Lal, R., Monger, C., Nave, L., and Smith, P.: The role of soil in regulation of climate, Philos. T. R. Soc. B, 376, 20210084, https://doi.org/10.1098/rstb.2021.0084, 2021.
Lavallee, J., Conant, R., Paul, E., and Cotrufo, M.: Incorporation of shoot versus root-derived 13C and 15N into mineral-associated organic matter fractions: results of a soil slurry incubation with dual-labelled plant material, Biogeochemistry, 137, 379–393, https://doi.org/10.1007/s10533-018-0428-z, 2018.
Lin, H. and Peddada, S. D.: Analysis of compositions of microbiomes with bias correction, Nat. Commun., 11, 3514, https://doi.org/10.1038/s41467-020-17041-7, 2020.
Lindahl, B. D. and Tunlid, A.: Ectomycorrhizal fungi–potential organic matter decomposers, yet not saprotrophs, New Phytologist, 205, 1443–1447, https://doi.org/10.1111/nph.13201, 2015.
Lucas-Borja, M. E., Candel, D., Jindo, K., Moreno, J., Andrés, M., and Bastida, F.: Soil microbial community structure and activity in monospecific and mixed forest stands, under Mediterranean humid conditions, Plant Soil, 354, 359–370, https://doi.org/10.1007/s11104-011-1072-8, 2012.
Ma, Y., Wang, J., Liu, Y., Wang, X., Zhang, B., Zhang, W., Chen, T., Liu, G., Xue, L., and Cui, X.: Nocardioides: “specialists” for hard-to-degrade pollutants in the environment, Molecules, 28, 7433, https://doi.org/10.3390/molecules28217433, 2023.
Martin, M.: Cutadapt removes adapter sequences from high-throughput sequencing reads, EMBnet.journal, 17, 10–12, https://doi.org/10.14806/ej.17.1.200, 2011.
McMurdie, P. J. and Holmes, S.: phyloseq: an R package for reproducible interactive analysis and graphics of microbiome census data, PloS One, 8, e61217, https://doi.org/10.1371/journal.pone.0061217, 2013.
Nissan, A., Alcolombri, U., Peleg, N., Galili, N., Jimenez-Martinez, J., Molnar, P., and Holzner, M.: Global warming accelerates soil heterotrophic respiration, Nat. Commun., 14, 3452, https://doi.org/10.1038/s41467-023-38981-w, 2023.
Obersteiner, S. and Klein, T.: Closing in on the last frontier: C allocation in the rhizosphere, Glob. Change Biol., 28, 6835–6837, https://doi.org/10.1111/gcb.16432, 2022.
Obersteiner, S., Oppenheimer-Shaanan, Y., Yalin, D., Sade, D., Zavaro, V., Reich, Z., and Klein, T.: Pine root exudate terpenoids associate with Mycobacterium sp. under summer drought in a mixed Mediterranean forest, Environmental Microbiome, https://doi.org/10.1186/s40793-026-00921-8, 2026.
Olsen, S. R., Cole, C. V., Watanabe, F. S., and Dean, L. A.: Estimation of available phosphorus in soils by extraction with sodium bicarbonate, U.S. Department of Agriculture Circular 939, Washington, D.C., 1–19, https://archive.org/details/estimationofavai939olse/page/n1/mode/2up (last access: 26 September 2026), 1954.
Oppenheimer-Shaanan, Y., Jakoby, G., Starr, M. L., Karliner, R., Eilon, G., Itkin, M., Malitsky, S., and Klein, T.: A dynamic rhizosphere interplay between tree roots and soil bacteria under drought stress, Elife, 11, e79679, https://doi.org/10.7554/eLife.79679, 2022.
Peoples, M. B., Giller, K. E., Jensen, E. S., and Herridge, D. F.: Quantifying country-to-global scale nitrogen fixation for grain legumes: I. Reliance on nitrogen fixation of soybean, groundnut and pulses, Plant Soil, 469, 1–14, https://doi.org/10.1007/s11104-021-05167-6, 2021.
Poeplau, C., Don, A., Six, J., Kaiser, M., Benbi, D., Chenu, C., Cotrufo, M. F., Derrien, D., Gioacchini, P., and Grand, S.: Isolating organic carbon fractions with varying turnover rates in temperate agricultural soils–A comprehensive method comparison, Soil Biol. Biochem., 125, 10–26, https://doi.org/10.1016/j.soilbio.2018.06.025, 2018.
Rasmussen, C., Heckman, K., Wieder, W. R., Keiluweit, M., Lawrence, C. R., Berhe, A. A., Blankinship, J. C., Crow, S. E., Druhan, J. L., and Hicks Pries, C. E.: Beyond clay: towards an improved set of variables for predicting soil organic matter content, Biogeochemistry, 137, 297–306, https://doi.org/10.1007/s10533-018-0424-3, 2018.
Rezenman, S., Knafo, M., Tsigalnitski, I., Barad, S., Jona, G., Levi, D., Dym, O., Reich, Z., and Kapon, R.: gUMI-BEAR, a modular, unsupervised population barcoding method to track variants and evolution at high resolution, Plos One, 18, e0286696, https://doi.org/10.1371/journal.pone.0286696, 2023.
Rog, I., Jakoby, G., and Klein, T.: Carbon allocation dynamics in conifers and broadleaved tree species revealed by pulse labeling and mass balance, Forest Ecol. Manage., 493, 119258, https://doi.org/10.1016/j.foreco.2021.119258, 2021a.
Rog, I., Tague, C., Jakoby, G., Megidish, S., Yaakobi, A., Wagner, Y., and Klein, T.: Interspecific soil water partitioning as a driver of increased productivity in a diverse mixed Mediterranean forest, J. Geophys. Res.-Biogeo., 126, e2021JG006382, https://doi.org/10.1029/2021JG006382, 2021b.
Rog, I., Lewin-Epstein, O., Livne-Luzon, S., Hadany, L., and Klein, T.: Prosperity of the commons: Generalist mycorrhizal species dominate a mixed forest and may promote forest diversity by mediating resource sharing among trees, bioRxiv [preprint], https://doi.org/10.1101/2022.08.01.502298, 2022.
Rog, I., Hilman, B., Fox, H., Yalin, D., Qubaja, R., and Klein, T.: Increased belowground tree carbon allocation in a mature mixed forest in a dry versus a wet year, Glob. Change Biol., 30, e17172, https://doi.org/10.1111/gcb.17172, 2024.
Rosseel, Y.: lavaan: An R package for structural equation modeling, J. Stat. Softw., 48, 1–36, https://doi.org/10.18637/jss.v048.i02, 2012.
Rowley, M. C., Grand, S., and Verrecchia, É. P.: Calcium-mediated stabilisation of soil organic carbon, Biogeochemistry, 137, 27–49, https://doi.org/10.1007/s10533-017-0410-1, 2018.
Schmidt, M. W., Torn, M. S., Abiven, S., Dittmar, T., Guggenberger, G., Janssens, I. A., Kleber, M., Kögel-Knabner, I., Lehmann, J., and Manning, D. A.: Persistence of soil organic matter as an ecosystem property, Nature, 478, 49–56, https://doi.org/10.1038/nature10386, 2011.
Six, J., Doetterl, S., Laub, M., Müller, C. R., and Van de Broek, M.: The six rights of how and when to test for soil C saturation, SOIL, 10, 275–279, https://doi.org/10.5194/soil-10-275-2024, 2024.
Sokol, N. W., Whalen, E. D., Jilling, A., Kallenbach, C., Pett‐Ridge, J., and Georgiou, K.: Global distribution, formation and fate of mineral‐associated soil organic matter under a changing climate: A trait‐based perspective, Funct. Ecol., 36, 1411–1429, https://doi.org/10.1111/1365-2435.14040, 2022.
Spohn, M., Bagchi, S., Biederman, L. A., Borer, E. T., Bråthen, K. A., Bugalho, M. N., Caldeira, M. C., Catford, J. A., Collins, S. L., and Eisenhauer, N.: The positive effect of plant diversity on soil carbon depends on climate, Nat. Commun., 14, 6624, https://doi.org/10.1038/s41467-023-42340-0, 2023.
Stell, E., Warner, D., Jian, J., Bond‐Lamberty, B., and Vargas, R.: Spatial biases of information influence global estimates of soil respiration: How can we improve global predictions?, Glob. Change Biol., 27, 3923–3938, https://doi.org/10.1111/gcb.15666, 2021.
Urbanová, M., Šnajdr, J., and Baldrian, P.: Composition of fungal and bacterial communities in forest litter and soil is largely determined by dominant trees, Soil Biol. Biochem., 84, 53–64, https://doi.org/10.1016/j.soilbio.2015.02.011, 2015.
Vitousek, P. M. and Howarth, R. W.: Nitrogen limitation on land and in the sea: how can it occur?, Biogeochemistry, 13, 87–115, https://doi.org/10.1007/BF00002772, 1991.
Whalen, E. D., Grandy, A. S., Sokol, N. W., Keiluweit, M., Ernakovich, J., Smith, R. G., and Frey, S. D.: Clarifying the evidence for microbial‐and plant‐derived soil organic matter, and the path toward a more quantitative understanding, Glob. Change Biol., 28, 7167–7185, https://doi.org/10.1111/gcb.16413, 2022.
Wolińska, A., Kuźniar, A., Zielenkiewicz, U., Banach, A., Izak, D., Stępniewska, Z., and Błaszczyk, M.: Metagenomic analysis of some potential nitrogen-fixing bacteria in arable soils at different formation processes, Microb. Ecol., 73, 162–176, https://doi.org/10.1007/s00248-016-0837-2, 2017.
Wu, J., Zhang, H., Pan, Y., Cheng, X., Zhang, K., and Liu, G.: Particulate organic carbon is more sensitive to nitrogen addition than mineral-associated organic carbon: A meta-analysis, Soil Till. Res., 232, 105770, https://doi.org/10.1016/j.still.2023.105770, 2023.
Ye, C., Chen, D., Hall, S. J., Pan, S., Yan, X., Bai, T., Guo, H., Zhang, Y., Bai, Y., and Hu, S.: Reconciling multiple impacts of nitrogen enrichment on soil carbon: plant, microbial and geochemical controls, Ecol. Lett., 21, 1162–1173, https://doi.org/10.1111/ele.13083, 2018.
Yuste, J. C., Peñuelas, J., Estiarte, M., GARCIA‐MAS, J., Mattana, S., Ogaya, R., Pujol, M., and Sardans, J.: Drought‐resistant fungi control soil organic matter decomposition and its response to temperature, Glob. Change Biol., 17, 1475–1486, https://doi.org/10.1111/j.1365-2486.2010.02300.x, 2011.
Yuste, J. C., Fernandez-Gonzalez, A., Fernandez-Lopez, M., Ogaya, R., Penuelas, J., Sardans, J., and Lloret, F.: Strong functional stability of soil microbial communities under semiarid Mediterranean conditions and subjected to long-term shifts in baseline precipitation, Soil Biol. Biochem., 69, 223–233, https://doi.org/10.1016/j.soilbio.2013.10.045, 2014.