
the Creative Commons Attribution 4.0 License.
the Creative Commons Attribution 4.0 License.
 | 07 Oct 2026
Physicochemical and urban land-use characteristics associated with resistance to precipitation in estuaries vary across scales

Nicole G. Dix
Hannah Nicklay
Matthew C. Ferner
Estuaries are subject to frequent stressors, including elevated nutrient loading and extreme hydrologic events, which impact water quality and disrupt ecosystem stability and function. The capacity of an estuary to resist changes in function in response to precipitation events is an important descriptor of ecosystem response dynamics, especially when interpreted within the context of baseline system condition and ecological state. However, the factors related to estuarine responses to extreme precipitation remain poorly constrained. This knowledge gap complicates our ability to identify estuaries that are more likely to undergo major shifts in ecosystem services and predict the effects of urban and precipitation disturbances on estuarine water quality. We investigate which physicochemical and land-use characteristics are associated with ecological resistance to precipitation – defined as the magnitude of ecosystem change induced by an event – in five disparate estuaries distributed across the continental United States. Using long-term meteorological and water quality data from the National Estuarine Research Reserve System along with land use/land cover and population data, we examine relationships between the resistance index – a proxy for ecosystem stability calculated using dissolved oxygen – and physicochemical and urban land use characteristics on local-to-continental scales. Contrary to our initial hypothesis, we found that more urbanized estuaries tended to be more resistant to precipitation events in this dataset, possibly due to persistent disturbances to their baseline dissolved oxygen levels, and that water temperature, water column depth, turbidity, nitrogen, and chlorophyll a showed significant but variable associations with resistance at the continental scale. These continental-scale patterns were modulated by estuarine salinity and varied across individual estuaries, where additional relationships between resistance and salinity, phosphate concentrations, N : P, tree cover, and cropland emerged. Our findings suggest that the relationships between urbanization and estuarine stability are complex and context-dependent, and thus management strategies need to consider both broad generalizations and local conditions. Considering emerging stressors from new environmental scenarios and from urbanization, these results may help improve representation of the impacts of disturbances in large-scale models and inform management decisions regarding estuarine water quality.
- Article
(2629 KB) - Full-text XML
-
Supplement
(3238 KB) - BibTeX
- EndNote


Estuaries are highly dynamic environments that often connect freshwater and saltwater systems, cycle organic matter and nutrients from land to oceans, and provide essential ecosystem services (Bianchi, 2007; He and Silliman, 2019). The function of estuarine ecosystems as unique sites for carbon and nutrient cycling, and habitats for macro- and micro-flora and fauna, relies on stability of a predictable range of dynamic processes like temperature fluctuations, hydrology and nutrient mixing. However, anthropogenic activities and extreme precipitation events threaten estuarine ecosystem stability and function (Kemp et al., 2009; Zhang et al., 2010). Predicted increases in urban population size and in the frequency and intensity of precipitation events highlight the urgency to understand the response of estuaries to urbanization and new precipitation patterns (Kyzar et al., 2021; Li et al., 2019; Martínez et al., 2007; Pickett et al., 2011). Yet, the factors that impact urban estuaries' response to precipitation are not fully understood.
When combined with intense precipitation, watershed urbanization and associated changes in land use/land cover (LULC) often result in increased stream hydrological flashiness (Gannon et al., 2022; Grimm et al., 2008; Reisinger et al., 2017). Hydrological flashiness induces high flow rates that cause changes in channel morphology (Booth and Jackson, 1997; Gregory, 2011; Leopold, 1968; Vietz et al., 2016), habitat destruction (Walsh et al., 2005), and disruption of microbial metabolic processes (Reisinger et al., 2017; Uehlinger, 2000). Flashiness can also drastically affect primary production – a regulatory component of dissolved oxygen (DO) dynamics in aquatic environments – through increases in flow velocity, transport of phytoplankton, sediment migration, and light limitation through increased turbidity (Bernot et al., 2010; Fisher et al., 1982; McSweeney et al., 2017; Reisinger et al., 2017; Uehlinger, 2000).
While DO is dynamic and depends on myriad biological, chemical, and physical processes, it is essential for many estuarine processes and has been widely used as an indicator for overall ecosystem function (Abdul-Aziz et al., 2007; Abdul-Aziz and Gebreslase, 2023; Chapra, 2008; Cox, 2003; Kannel et al., 2007; Zhi et al., 2021). Dissolved oxygen is critical to maintaining the life cycles of macro- and micro-fauna, and supports the biogeochemical cycling of carbon and nutrients by serving as a terminal electron acceptor (Bernhardt et al., 2018; Chapra, 2008; Zarnetske et al., 2012). Urban areas in particular have been linked to altered aquatic DO concentrations and other water quality parameters (Bernhardt et al., 2008; Chang, 2005; Freeman et al., 2019; Vietz et al., 2016). Given the tight link between aquatic DO, land use, and diverse ecosystem functions, DO is an important indicator and holistic measure of estuarine condition.
In addition to impacts on hydrology, extreme precipitation events can increase nutrient delivery and salinity change, both of which influence DO dynamics, particularly in waterways adjacent to urban-type LULC (Walsh et al., 2005). Elevated nitrogen (N) influx can overstimulate primary production leading to short-term DO increases followed by spikes in microbial respiration and DO demand. Freshwater influx (i.e., runoff) and storm surges can alter salinity, strengthen stratification, reduce DO replenishment to bottom waters, and induce hypoxia (Rabalais et al., 2010; Wetz and Yoskowitz, 2013; Zhang et al., 2010). However, the relative importance of these processes is expected to vary among estuaries and across spatial scales. For example, in well-mixed estuaries, precipitation-driven mixing may temporarily increase DO through reaeration, whereas in stratified or poorly flushed estuaries, enhanced nutrient loading combined with reduced vertical mixing may promote sustained DO depletion.
Identifying common responses to major precipitation events across disparate estuaries can help project long-term estuarine function under increasing urbanization and more extreme precipitation events. However, such commonalities have been difficult to discern and decipher, in part, due to the complex and interconnected dynamics within individual estuaries and their varied responses to precipitation. While Ombadi and Varadharajan (2022) report contrasting effects of urbanization on salinity during flood events when regional dynamics are considered, a continental-scale study by Kaushal et al. (2018) suggests that anthropogenic activity is associated with increasing salinity in waterways. However, Kaushal et al. (2018) recognize that regional, weather-related, LULC, and geologic variabilities also influence salinization patterns. Similarly, continental-scale evaluations showed that small watersheds appear consistently less flashy than large watersheds and that there is a substantial amount of variability in these relationships at regional scale (Baker et al., 2004; Gannon et al., 2022; Hopkins et al., 2015; Poff et al., 2006). Such variation in relationships across scales may be particularly prevalent in ecosystems influenced by anthropogenic activities (Hopkins et al., 2015; Poff et al., 2006), which demonstrates the importance of considering multiple spatial scales in understanding estuarine responses to changes in precipitation patterns and watershed land use.
We aim to uncover generalizable responses to large precipitation events across five estuaries that span a gradient of urbanization and physicochemical characteristics. Using DO as an integrative indicator of ecosystem function (Abdul-Aziz and Gebreslase, 2023), we evaluate estuarine resistance to precipitation – defined here as the ability of estuaries to maintain DO stability (Isbell et al., 2015; Lake, 2013; McCluney et al., 2014; Pimm, 1984; Utz et al., 2016; Van Meerbeek et al., 2021). In the context of physicochemical and land-use factors, we evaluate estuarine resistance at: (1) the continental scale (i.e., across all estuaries); (2) across estuaries grouped by salinity; and (3) within each estuary. We hypothesize that urbanization decreases estuarine resistance to precipitation, and that relationships between resistance and physicochemical and land-use factors will vary with spatial scale and ambient salinity. This study helps advance understanding of how ongoing changes in the Earth system influence estuarine ecosystem function.
2.1 Estuaries and monitoring locations
We used long-term water quality monitoring data from five estuaries in the National Estuarine Research Reserve System (NOAA NERRS, 2019) to understand factors associated with their resistance to precipitation events. Lake Superior (LKS), NERR WI; Chesapeake Bay Maryland (CBM), NERR MD (Jug Bay only); Guana Tolomato Matanzas (GTM), NERR FL; Weeks Bay (WKB), NERR AL; and San Francisco Bay (SFB), NERR CA span ecoregions, land uses, and salinity (0.1–35 ppt) (Fig. 1, Table 1). Across all estuaries, there were a total of 19 monitoring locations.
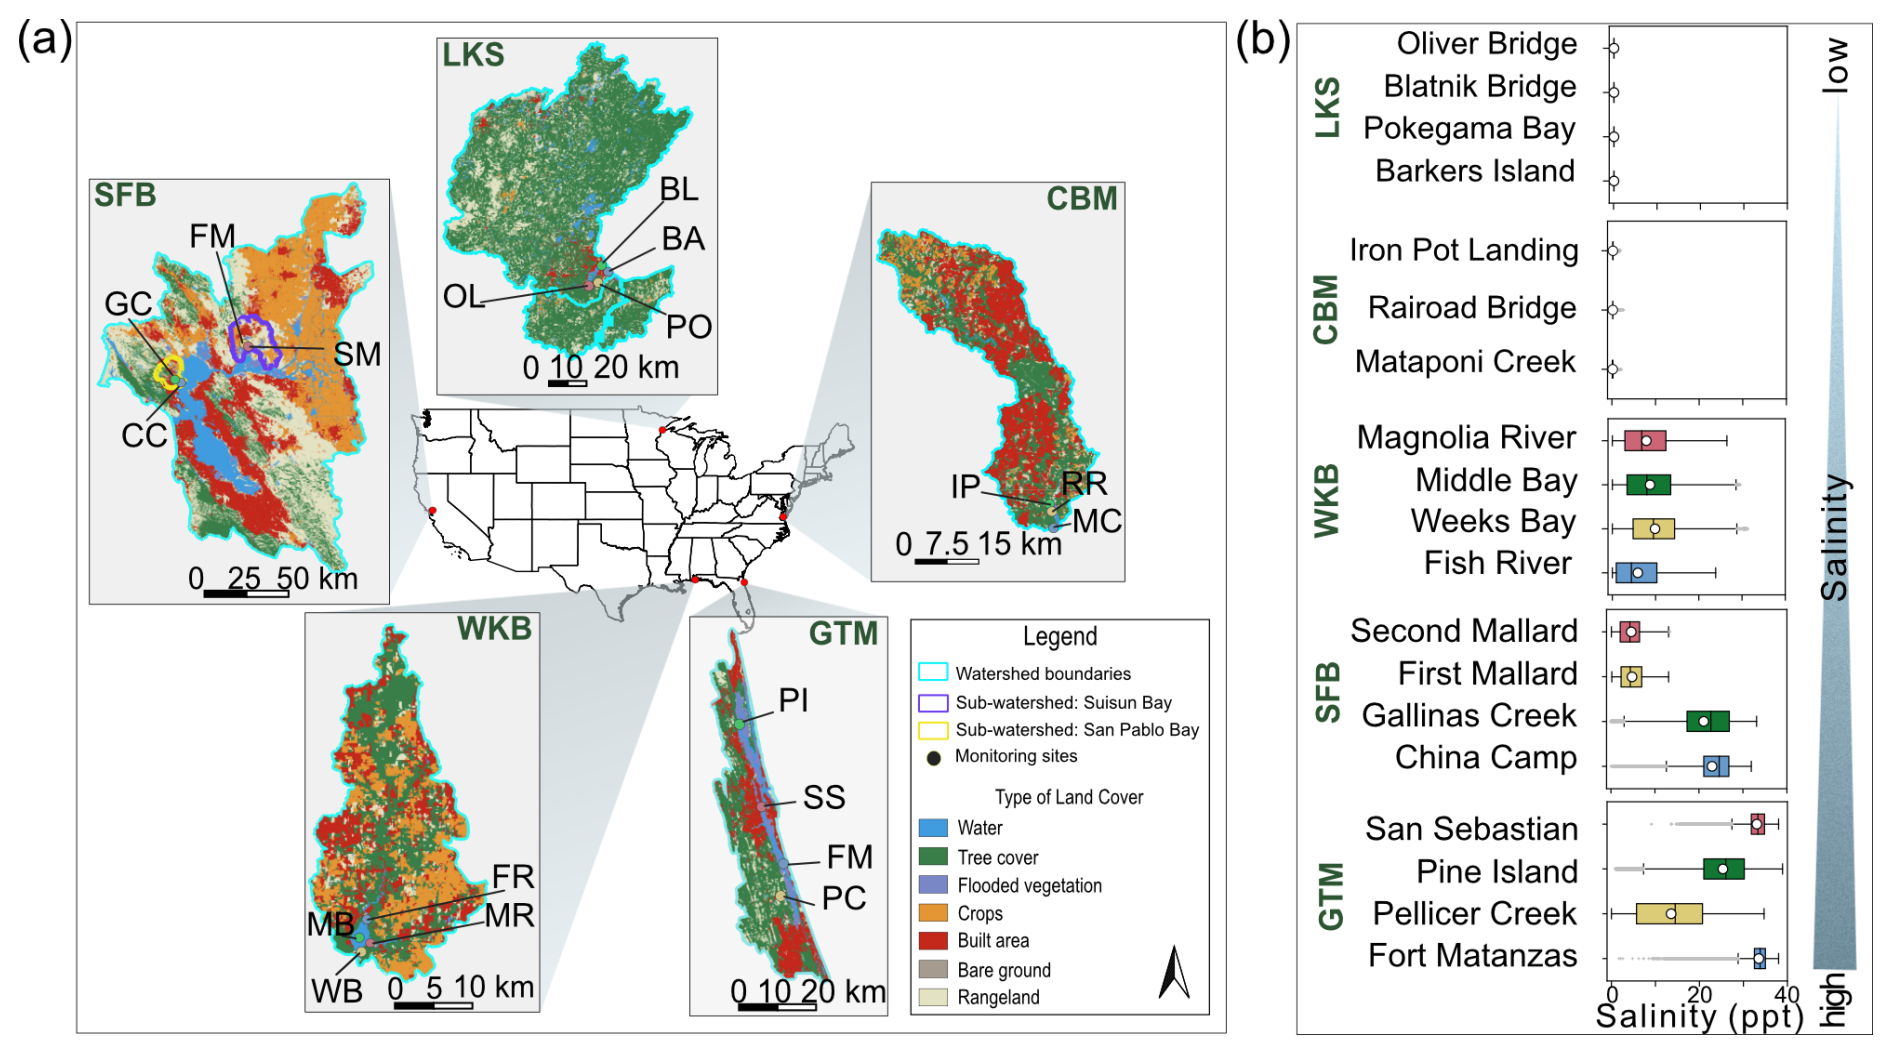
Figure 1Selected National Estuarine Research Reserve (NERR) stations. (a) Map of monitoring locations and land use/land cover within associated watersheds at Lake Superior (LKS) NERR, Chesapeake Bay, Maryland (CBM – Jug Bay) NERR, Guana Tolomato Matanzas (GTM) NERR, Weeks Bay (WKB) NERR, and San Francisco Bay (SFB) NERR. (b) Salinity from 2012 to 2022 for each monitoring location at each NERR (all n>150 000). Boxes indicate interquartile range. Means are shown in white circles. Black lines inside the boxes indicate medians.
Table 1Land use/land cover (LULC) and population density in five National Estuarine Research Reserve System (NERRS) estuaries within 10 km of water quality and nutrient monitoring locations.
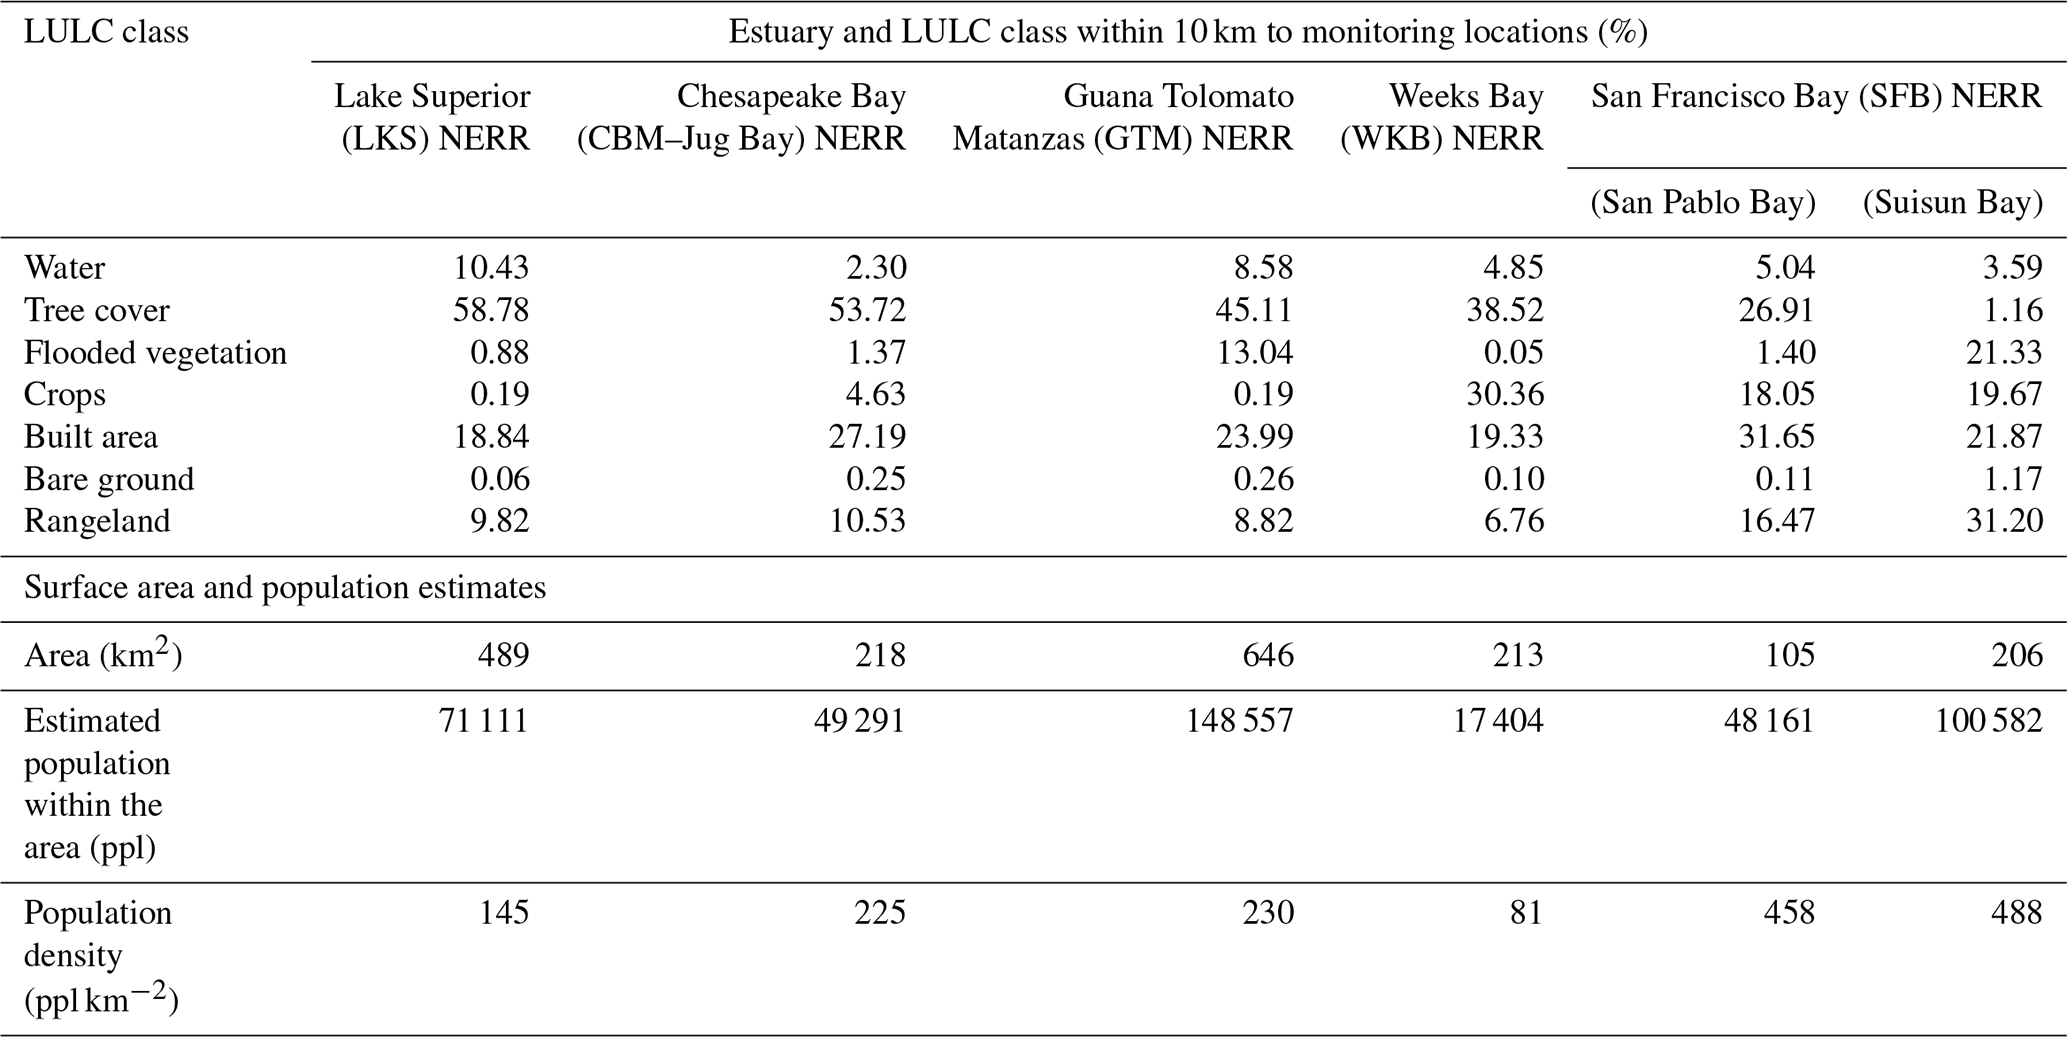
LULC definitions per ESRI (Karra et al., 2021): Water – areas where water is present throughout the year, excluding human-made structures like docks. Tree cover – vegetation with a closed or dense canopy ≥ 15 m in height. Flooded vegetation – areas where water and vegetation intermix, which are flooded seasonally or predominantly throughout the year. Crops – human-planted vegetation (e.g., cereals, grasses, and crops) that does not reach tree height. Built area – human-made structures, including roads, railroad networks, parking spaces, and industrial and residential buildings. Bare ground – areas dominated by rock, soil, sand (e.g., deserts) with sparse-to-no vegetation throughout the year. Rangeland – homogeneous grasses, mixes of vegetation below tree-height with rock and soil, or forest clearings.
Briefly, LKS NERR is a freshwater estuary situated at the confluence of the St. Louis River and Lake Superior, and includes four continuous water quality monitoring locations influenced by lake seiche: Blatnik Bridge, Oliver Bridge, Pokegama Bay, and Barker's Island. CBM NERR at Jug Bay is a semi-diurnal minimally tidal estuary. Jug Bay is located in the upper tidal reaches of the Patuxent River. It is dominated by tidal freshwater marsh, and it comprises Railroad Bridge, Iron Pot Landing, and Mataponi Creek monitoring locations. WKB NERR is a partially-mixed (i.e., lagoonal/ semi-isolated), diurnal micro-tidal estuary located on the eastern shore of the Mobile Bay. WKB NERR comprises Fish River, Weeks Bay, Middle Bay, and Magnolia River monitoring locations. SFB NERR estuary is a mixed, semi-diurnal tidal system comprising four monitoring locations across two embayments. The locations include China Camp and Gallinas Creek in the San Pablo Bay embayment within the China Camp State Park, and First Mallard and Second Mallard in the Suisun Bay embayment within the Rush Ranch Open Space Preserve. GTM NERR is a mixed, semi-diurnal tidal estuary associated with the Tolomato and Guana River estuarine systems to the north and the Matanzas River estuary to the south. Monitoring locations include Pine Island, Fort Matanzas, San Sebastian, and Pellicer Creek, with the latter site noted to experience stratification (i.e., salt-wedge).
Upstream reservoirs are reported for several monitoring locations across the set of estuaries (Table S1 in the Supplement).
2.2 Land use and land cover
To assess the relationship between resistance and urbanization, we used LULC data at 10 m resolution from ESRI (2017–2020) (Karra et al., 2021) and population density data at 100 m resolution from World Population Hub (Bondarenko et al., 2020). The NERR watersheds shapefiles were obtained from NERRS (NOAA NERRS, 2019). We analyzed LULC and population density using QGIS 3.30.3 (QGIS Geographic Information System, 2024) equipped with a semi-automatic classification plug-in, which generates percentages of each class within a given area based on the classification raster. The resulting breakdown of LULC and population density within watersheds is shown in Table S2.
Further, because the resistance index was calculated for precipitation events across short time-scales (days), large watershed areas could overrepresent hydrologic contributions to water quality at monitoring locations (watershed area range: 114–11 704 km2, Table S2). To better match the temporal scale of precipitation responses, we restricted watershed characterization to a 10 km proximity zone surrounding each monitoring location. This approach captures watershed areas most likely to influence water quality over short time scales, and improves comparability among estuaries (Table 1). LULC and population density were quantified within these proximity zones. For the SFB NERR watershed, separate 10 km proximity zones were delineated for San Pablo and Suisun embayments to account for different hydrologic dynamics.
All data were collected using NERRS standard operating procedures. Briefly, water column DO (mg L−1, calculated from % air saturation, temperature, and salinity at the time of measurement; thereby accounting for the impacts of temperature and salinity fluctuations on DO concentration), temperature, turbidity, salinity, and depth were measured at 15 min intervals using synchronized YSI EXO2 multiparameter sondes. Meteorological conditions, including precipitation, were also measured at 15 min intervals using NERRS standard weather station instrumentation. PO, NO, NH, NO, and chlorophyll a (Chl a) were measured monthly from grab samples and analyzed in the lab (NOAA NERRS, 2019). Samples for nutrients were analyzed following the U.S. Environmental Protection Agency (EPA) methods (O'Dell, 1996b, a; U.S. EPA., 1993a). For Chl a analysis, the samples were collected as whole water, then filtered onto 0.45 µm pore size glass-fiber filters (0.7 µm at GTM NERR) and processed following APHA (2001) and U.S. EPA. (1993b) methods. While Chl a is also measured as chlorophyll fluorescence using an optical sensor with YSI sondes, these data were not included in our analysis due to the confounding effects of temperature, turbidity, fluorescent dissolved organic matter and other factors on sensor-based Chl a measurements (and sensor and lab-based measurements often do not correspond to each other; Dix et al., 2026). We omitted all data flagged as “suspect” or “out of range”.
Additionally, we calculated water column depth as the sum of measured water depth plus the distance between the sonde and sediment bed (Table S1). We also calculated the sum of NO, NO, and NH to assess dissolved inorganic nitrogen (DIN) concentrations and the ratio of DIN to PO (hereafter, N : P).
2.3 Determination of major precipitation events
Because hydrologic dynamics and related estuarine functions can vary dramatically with annual weather conditions, we first selected one “wet” and one “dry” year for each estuary using precipitation records from nearby airports. The purpose of selecting years with disparate rainfall patterns was to encompass the maximum range of variability in expected estuarine resistance. Following Murrell et al. (2018), we calculated the long-term interquartile range (IQR, 1990–2020) of total monthly precipitation for each estuary and then selected relatively wet/dry years based on the number of months plotting above/below IQR and total annual precipitation. Possible wet and dry years were further filtered based on the completeness of NERRS data available for each estuary (Fig. S1). Long-term precipitation records included: Duluth International, Washington Reagan International, Jacksonville International, Birmingham, and San Francisco International airports available from the National Centers for Environmental Information.
Further, we selected major precipitation events within each wet and dry year by plotting daily precipitation using data from NERR meteorological stations (Fig. S2). Specifically, because the definition of “major” precipitation events is hard to quantify and it varies across estuaries, we first considered hurricanes, tropical storms, Nor'easters, atmospheric rivers, and other major storm events noted within NERR metadata sheets when selecting precipitation events. For example, at GTM NERR we focused on tropical storms Colin, Julia, and Hermine, hurricanes Matthew and Irma, and two Nor'easters (Table S3). Data availability was a second consideration – we removed possible events for which there was a substantial amount of missing data. Lastly, because metabolic and hydrologic processes vary across seasons, we chose to focus on warm season events, with the exception of SFB NERR where most precipitation occurs in the cool season but seasonal temperature fluctuations are generally lower than in other systems (Figs. S2 and S3, Table S3).
2.4 Calculation of resistance
To investigate physicochemical and urban land-use characteristics associated with estuarine responses to precipitation events, we calculated the resistance index described in Orwin and Wardle (2004). The resistance index is a normalized parameter (−1 to +1) describing the magnitude of shift in a response variable from an initial condition. It has been used across a wide variety of ecosystems and response variables, including aquatic ecosystems (Thayne et al., 2022, 2023; Tsai et al., 2011). The resistance index is calculated as:
where C0= concentration of the response variable pre-disturbance and D0= difference between the concentration of the response variable pre- and post-disturbance (P0) (i.e., P0). An index value of +1 indicates the highest possible resistance. Index values between 0 and 1 show that the magnitude of response variable shift is less than the magnitude of the baseline (i.e., ). A resistance index of 0 indicates that the shift in the response variable is equivalent to the magnitude of the baseline (i.e., ), whereas index values between 0 and −1 reflect that change in the response variable is greater than the magnitude of the baseline (i.e., ). Overall, index values closer to 1 indicate more resistant systems (Orwin and Wardle, 2004).
While the resistance index is indicative of the ability of a system to maintain its pre-disturbance functions and ecological state (i.e., ecosystem stability), we emphasize that it is a normalized value that does not in itself convey information about overall estuarine function. Similarly, the resistance index alone cannot infer if a shift has a positive or a negative effect on ecosystem function. The resistance index enables the comparison of the amount of change induced by disturbance across vastly different estuaries.
In parallel, it is also useful to consider the absolute value of the response variable (in this case DO) pre- and post-disturbance, which conveys information on the ambient state of an estuary and the directionality of its response to the disturbance. We therefore present C0 and P0 (Figs. 2a–e and S4, Table S4) to define differences in DO within and across estuaries. We also present the resistance index, which pairs C0 and P0 values for the same event (Fig. 2f–j), to understand the ecosystem stability within and across estuaries after precipitation.
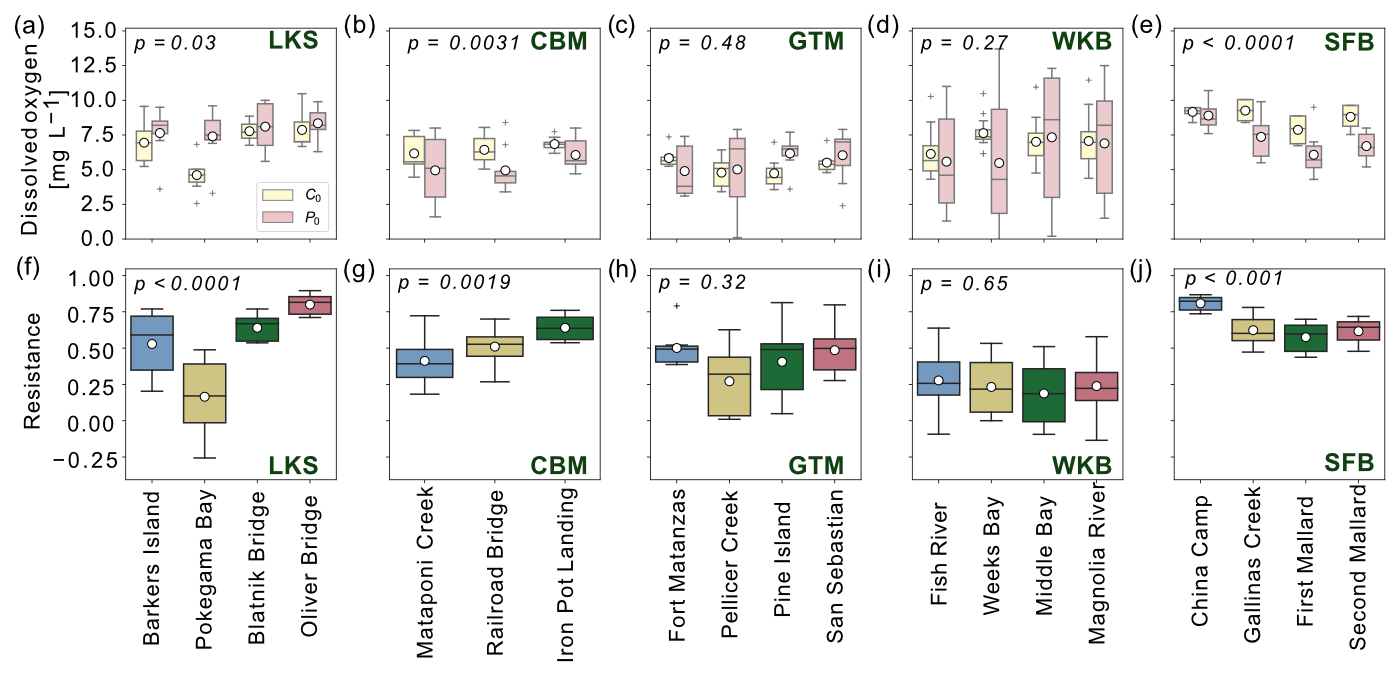
Figure 2Variation in pre- and post-disturbance distribution of dissolved oxygen and resistance within individual estuaries. Boxes show the quartiles of the dataset and the whiskers show the rest of the distribution. Means are shown in white circles, and medians are shown in black solid lines. (a–e) Distribution of dissolved oxygen concentrations prior to (C0, yellow boxes) and post- (P0, pink boxes) precipitation. (f–j) Resistance index across monitoring locations at: Lake Superior (LKS) NERR (all n=7), Chesapeake Bay, Maryland (CBM – Jug Bay) NERR (all n=10), Guana Tolomato-Matanzas (GTM) NERR (all n=7), Weeks Bay (WKB) NERR (all n=15), San Francisco Bay (SFB) NERR (n=8 except Second Mallard n=7).
Because DO is critical to myriad functions that regulate aquatic ecosystems (Abdul-Aziz et al., 2007; Abdul-Aziz and Gebreslase, 2023; Caffrey, 2004; Mulholland et al., 2001; Murrell et al., 2018; Odum, 1956) and because bi-directional flow makes estuarine metabolism virtually impossible to model (Loken et al., 2021), we calculated the resistance index using temperature- and salinity-adjusted DO (mg L−1). Additionally, the resistance index is highly sensitive to the researcher-defined baseline and post-disturbance time periods that are used to calculate C0 and D0. Therefore, we calculated C0 as the average DO during a manually-curated timespan preceding each precipitation event (∼24 h to 6 d, without precipitation) where DO dynamics looked unremarkable (Fig. S5, Table S3). The timespan for estimating P0 was also manually selected in the context of each event, defined here as the maximum displacement from C0 during and after the event (Fig. S5, Table S3). We also verified that the resistance index calculated using DO (mg L−1) versus DO (% sat.) showed no notable differences (Fig. S6).
2.5 Statistical analysis
To compare resistance, nutrient concentrations, and concentrations of DO pre- and post-precipitation within and among estuaries, we used ANOVA with post-hoc Tukey HSD or Kruskal-Wallis test, as appropriate based on the Shapiro-Wilk normality test.
To test specific physicochemical and land-use factor associations with estuarine resistance, we used linear regressions at continental and local scales independently (i.e., all estuaries combined versus within each individual estuary) and within salinity-based groups (i.e., using a threshold of average annual salinity <10 or ≥10 ppt calculated for wet and dry years separately). Specifically, we tested the relationships between resistance and turbidity, salinity, water temperature, water column depth, DIN, PO, N : P, Chl a, percent trees, percent crops, percent built area, and population density. For linear regressions that involved land-use factors, we used LULC and population density from the 10 km proximity zone (Table 1). Because of discrepancies in the temporal intervals at which measurements were collected, we conducted separate regressions involving turbidity, salinity, water temperature, water column depth (collected at 15 min intervals) versus DIN, PO, N : P, and Chl a (collected at monthly intervals) predictors. The low-salinity group included all LKS NERR and CBM NERR locations, First Mallard and Second Mallard locations at SFB NERR during wet and dry years, as well as Fish River, Middle Bay, Magnolia River, and Weeks Bay (Weeks Bay during the dry year only) at WKB NERR estuary. The high-salinity group included all monitoring locations at GTM NERR, China Camp and Gallinas Creek at SFB NERR estuary for wet and dry years, and Weeks Bay at WKB NERR during the wet year.
We used annual mean values for continental-scale, local-scale, and salinity-based groups regressions involving nutrients and Chl a because monthly sampling intervals of lab-based measurements did not always correspond with selected precipitation events. This resulted in two data points per monitoring location for nutrients and Chl a regressions. While not directly associated with any particular precipitation event, relationships of nutrients and Chl a with resistance values analyzed on an annual basis carry valuable information about how the ambient conditions of the system can impact an estuary's response to precipitation. This knowledge is essential for deriving and testing hypotheses that describe why a certain estuary may respond to a storm event in a particular way.
For regressions involving sensor-based measurements, we attempted to provide as much resolution as possible into specific events. We therefore used values averaged over the event-specific baseline periods (Table S3) for sensor measurements across scales and salinity-based groupings. Values averaged over event-specific baseline periods were matched with corresponding event-specific resistance index resulting in one data point per precipitation event for each monitoring location. We did not include LULC and population density as predictors of resistance at individual estuaries because of the close proximity of some monitoring locations to one another (<800 m).
To ensure the robustness of linear regression analysis, we assessed the dataset for multicollinearity (Fig. S7) and conducted principal component analysis (PCA) with Varimax rotation on loadings (Fig. S8). For PCA, we used sensor-based, 15 min interval measurements (temperature, salinity, turbidity, water column depth) and omitted the nutrient data collected at monthly intervals to keep most data points in our analysis while remaining consistent with continental-scale linear regressions. Most variables were largely uncorrelated and the PCA results agreed with continental-scale linear regressions.
Statistical analyses and visualizations were performed in Python 3.10.11 using scipy, statsmodels, seaborn, scikit-learn, and matplotlib libraries.
3.1 Land use/land cover and nutrient concentrations across estuaries
The five study estuaries spanned strong gradients in LULC and nutrient concentrations. Both embayments of the SFB NERR had higher percentages of urban-type land (e.g., built area) and population density than any other estuary, followed by CBM NERR (Table 1). Agricultural land was more prevalent at WKB NERR (30.36 %) compared to other estuaries. GTM NERR and LKS NERR had more mixed LULC, with high proportions of tree cover. SFB and CBM NERRs had high DIN concentrations compared to LKS and GTM NERRs (p<0.01). Mean DIN values at all SFB and CBM NERRs monitoring locations were >0.50 mg-N L−1 versus <0.16 mg-N L−1 at LKS and GTM NERRs (Fig. S9). Phosphate concentrations were the highest at SFB NERR (mean across all monitoring locations =0.135 mg-P L−1, SD =0.08; means at all other estuaries <0.03 mg-P L−1, p<0.001, Fig. S9). Overall, mean N : P across LKS, CBM, GTM, WKB, and SFB NERRs estuaries was 28.04 (SD =28.08), 26.56 (SD =10.75), 2.84 (SD =0.91), 83.82 (SD =55.27), and 5.10 (SD =1.4), respectively (Fig. S10), with GTM and SFB NERRs indicating N-limiting conditions based on a mass-based 7.2N : 1P Redfield ratio (Redfield, 1934).
3.2 Changes in dissolved oxygen and resistance to precipitation across estuaries and monitoring locations
Dissolved oxygen concentrations pre- and post-precipitation differed across all estuaries, when evaluating the overall directionality (pre- [C0]: F=45.6, p<0.0001; post- [P0] : F=17.1, p<0.0001; Fig. 2a–e). Across all precipitation events (i.e., non-specific to an event), SFB NERR had the highest pre-precipitation DO concentration of all estuaries. Generally, at SFB and CBM NERRs (more urban) DO declined following precipitation (p<0.01). At LKS NERR, precipitation events significantly increased DO concentration (F=5.1, p=0.03). There was no significant difference between the overall pre- and post-precipitation DO concentrations at GTM and at WKB NERRs (more agricultural) (GTM NERR: F=0.5, p=0.48; WKB NERR: F=1.23, p=0.27).
Resistance also differed across estuaries (, p<0.0001, Fig. 2). SFB NERR monitoring locations had the highest mean resistance (mean =0.66), while monitoring locations at WKB NERR were the least resistant (mean =0.23). Within individual estuaries, resistance varied across monitoring locations at LKS NERR (, p<0.0001), CBM NERR (, p<0.01), and SFB NERR (, p<0.001) but was not significantly different between monitoring locations within GTM NERR (H(3)=3.5, p=0.32) and WKB NERR (, p=0.65) (Fig. 2f–j). Resistance was most variable across monitoring locations at LKS NERR (−0.26 to 0.89) and least variable across locations at SFB NERR (0.44 to 0.86).
3.3 Continental, salinity-based, and local relationships between resistance and physicochemical factors, land use/land cover, and population density
When data from the five estuaries were considered together (i.e., continental scale), we found generally weak but significant positive relationships between resistance and water column depth (p<0.0001, R2=0.11), turbidity (p=0.0014, R2=0.06), log(DIN) (p=0.037, R2=0.12), percent built area (p=0.014, R2=0.16), and population density (p<0.001, R2=0.29), as well as significant negative relationships with water temperature (p<0.0001, R2=0.42) and Chl a (p<0.0001, R2=0.43) (Fig. 3, Table S5).
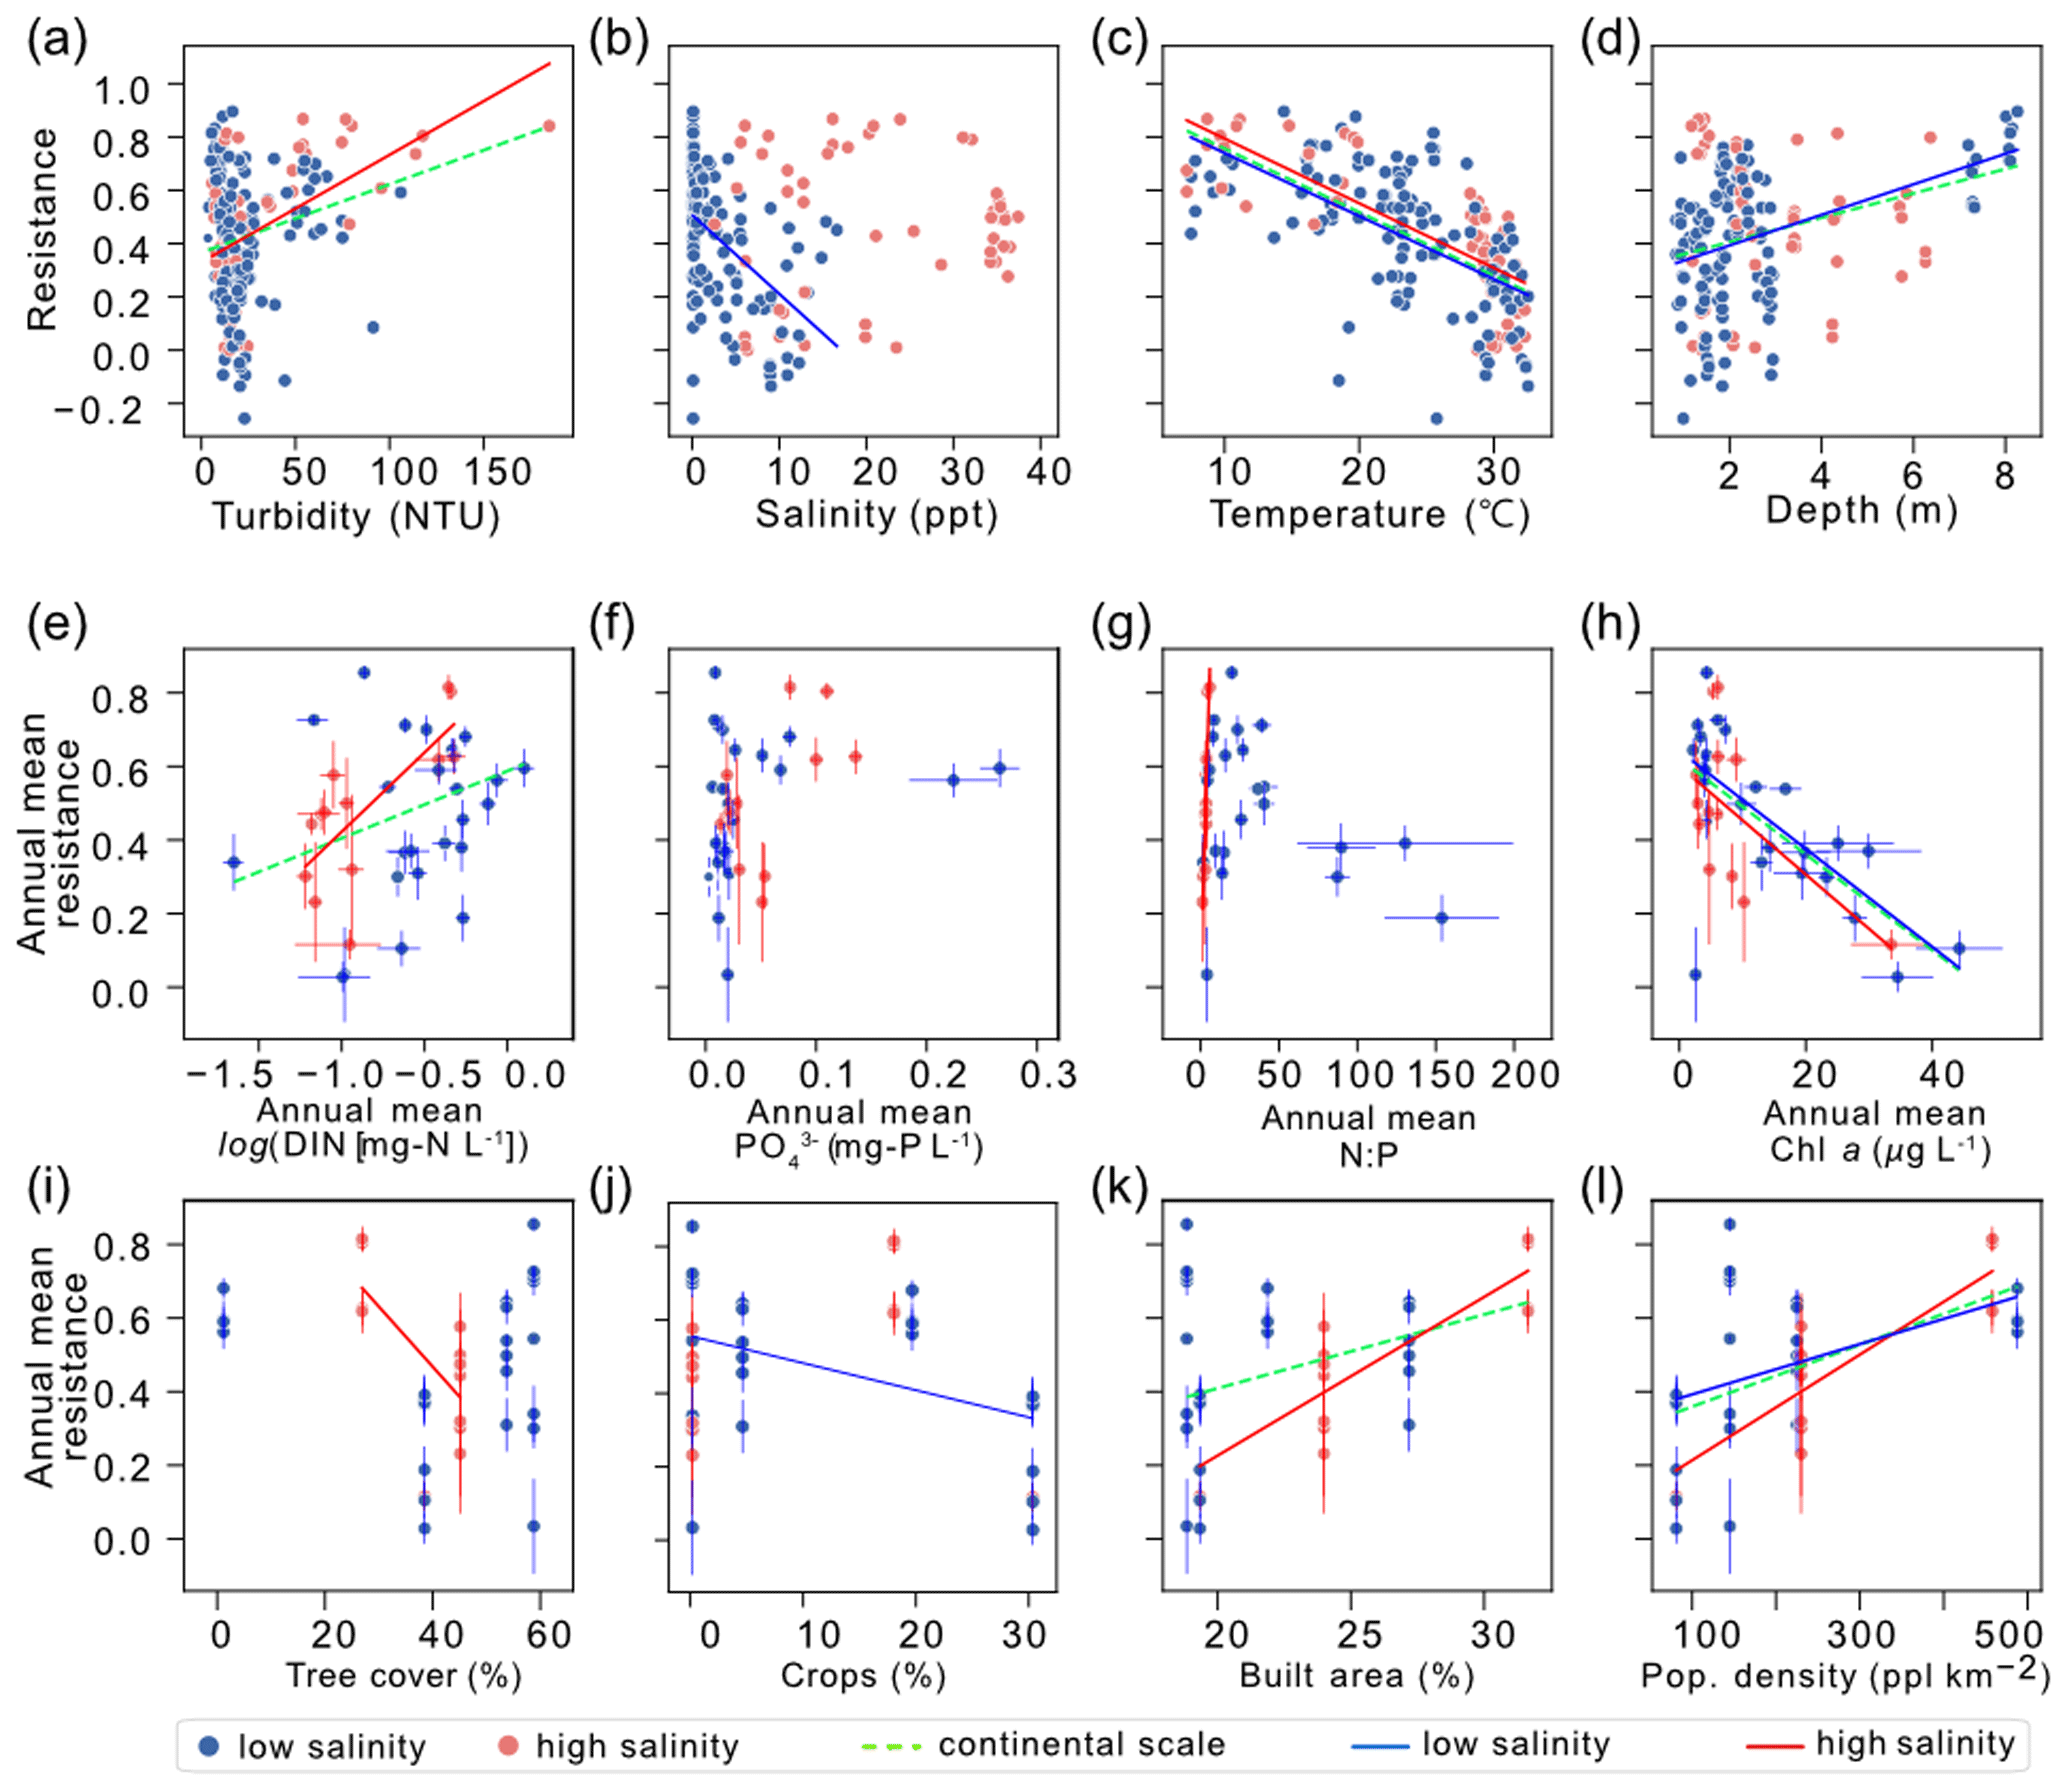
Figure 3Continental-scale and salinity-based relationships of resistance with physicochemical factors, land use/land cover, and population density. Continental-scale regressions considered all monitoring locations across all estuaries. Significant relationships (p<0.05) are shown in dotted green, solid red, and solid blue lines for continental scale, high-salinity and low-salinity estuaries, respectively. Standard errors of the mean are shown in vertical and horizontal lines. The LULC parameters and population density were used from within the 10 km proximity zone adjoined to the monitoring locations. Please refer to Table S5 for resulting statistics and to Fig. S7 for information on covariance among predictor variables.
When grouped by salinity, estuarine resistance was more strongly related to physicochemical and land-use factors (Fig. 3, Table S5). Within low-salinity estuaries, resistance was positively related to depth of the water column (p<0.0001, R2=0.20), which is consistent with continental-scale results; and negatively related to salinity and percent cropland (p<0.0001, R2=0.23, and p=0.031, R2=0.19, respectively), relationships not found on continental scale. Within high-salinity estuaries, mean resistance showed positive relationships with annual mean log(DIN) (p=0.004, R2=0.54) and percent built area (p<0.001, R2=0.73), consistent with continental-scale results. Also, resistance in high-salinity estuaries was positively related to turbidity (p<0.0001, R2=0.28). Observations present in high-salinity estuaries but absent from continental-scale evaluations included a negative relationship between mean resistance and tree cover (p=0.012, R2=0.45), as well as a positive relationship with N : P (p<0.0001, R2=0.80). Additionally, mean resistance in both low- and high-salinity groups was positively related to population density (p=0.033, R2=0.18, and p<0.001, R2=0.73, respectively), and negatively related to water temperature (p<0.0001, R2=0.36, and p<0.0001, R2=0.58, respectively) and Chl a (p<0.001, R2=0.49, and p=0.042, R2=0.32, respectively). The temperature and Chl a relationships were consistent with continental-scale results. Generally, the low-salinity estuaries had fewer significant relationships between resistance and physicochemical factors, LULC, and population density compared to high-salinity estuaries. The strength of the relationships between resistance, physicochemical and LULC factors generally increased with estuarine salinity. In the high-salinity group, the coefficient of determination (R2) was above 0.5 in five of eight significant relationships, whereas all significant relationships identified in the low-salinity group and in the continental-scale analysis had R2 values below 0.5.
At local scales (i.e., within each estuary), resistance was related to some physicochemical factors not observed in continental-scale or salinity-based groups. The number, strength, and direction of relationships between local-scale resistance and physicochemical factors varied substantially across estuaries (Figs. 4, S11, S12). GTM NERR had the highest number of significant relationships between resistance and physicochemical factors. Resistance was negatively related to water temperature (p<0.001, R2=0.52), PO (p=0.013, R2=0.67) and Chl a concentrations (p=0.009, R2=0.71), as well as positively related to salinity and N : P (p=0.02, R2=0.19 and p=0.009, R2=0.71, respectively). In contrast, at CBM NERR, resistance was related only to water column depth (positive, p=0.013, R2=0.21). At LKS NERR, resistance was positively related to water column depth (p<0.0001, R2=0.50) and negatively related to turbidity (p=0.004, R2=0.28). At WKB NERR, relationships between resistance and water temperature, salinity, turbidity, and Chl-aconcentrations were all negative (p<0.001, R2=0.41; p=0.047, R2=0.07; p=0.002, R2=0.16; and p=0.03, R2=0.58, respectively). At SFB NERR, resistance was negatively related to water column depth (p<0.0001, R2=0.48), and positively related to salinity (p=0.00016, R2=0.42). There was no overarching relationship between resistance and total precipitation amount of each event, except for significant but weak negative relationships at GTM and WKB NERRs estuaries (at GTM NERR: p=0.026, R2=0.18; at WKB NERR: p=0.002, R2=0.15; Fig. S13).
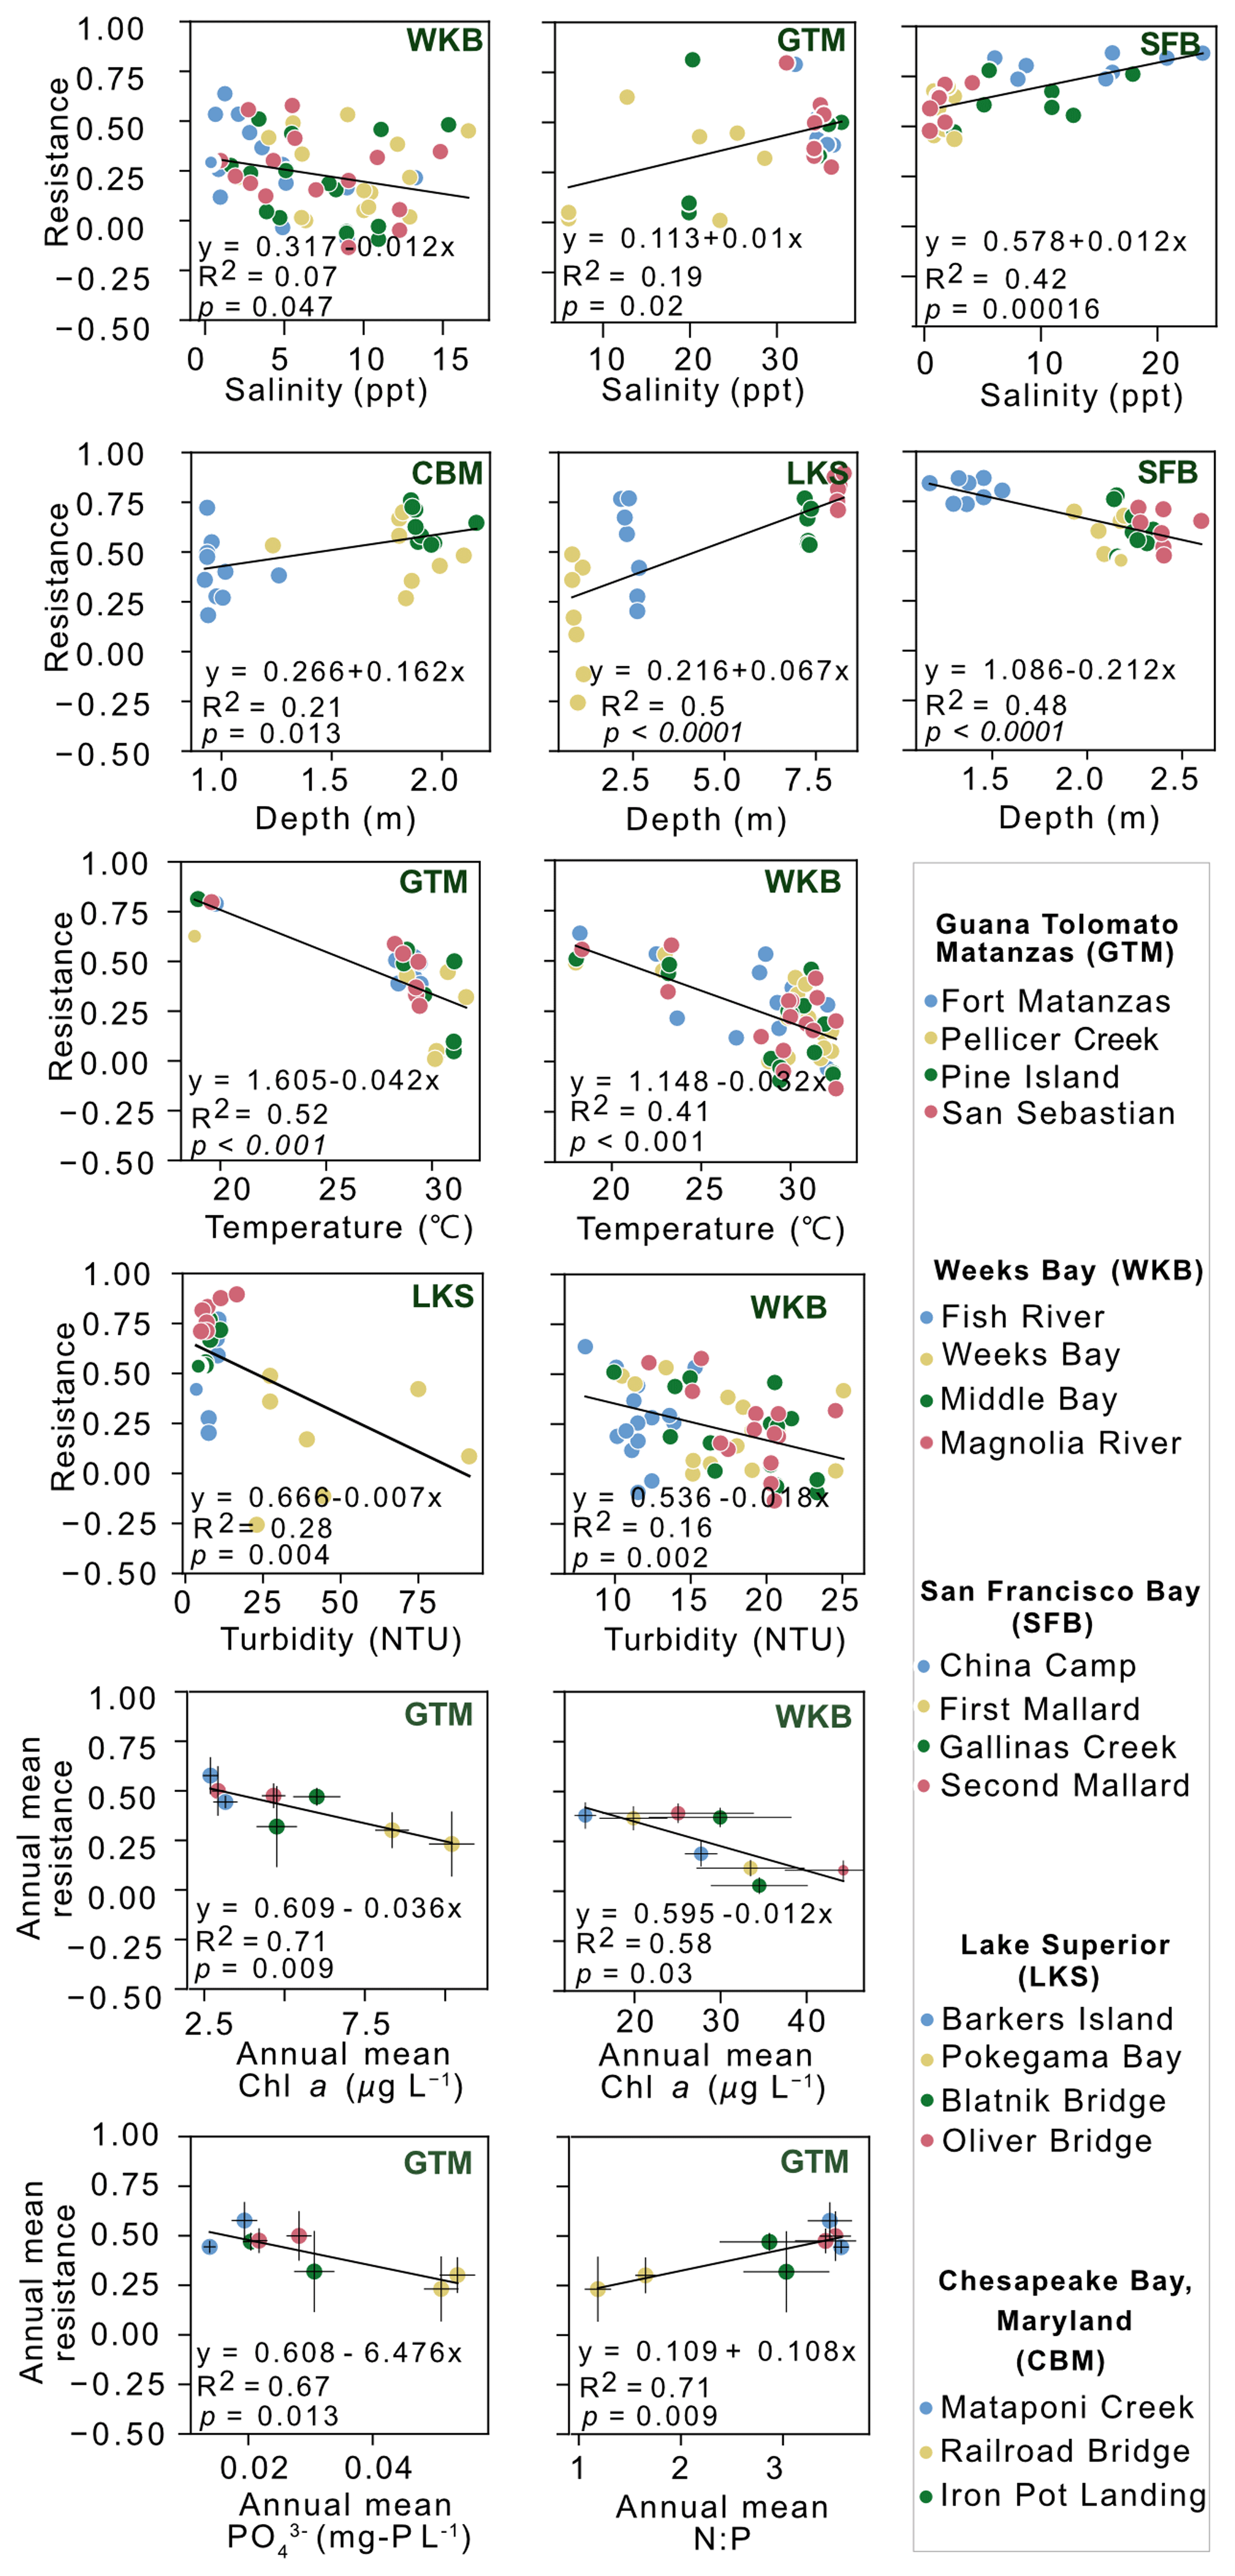
Figure 4Relationships between resistance and physicochemical factors for each estuary. Significant correlations (p<0.05) are shown with black lines. Standard errors of the mean are shown in vertical and horizontal black lines for relationships using annual means for chlorophyll a (Chl a), PO, and N : P. For additional results see Figs. S11, S12, and S14.
In summary, some relationships between estuarine resistance and physicochemical factors and urban land use appeared to be more generalizable while others varied across scales (Fig. 5). For instance, resistance was related to water temperature, water column depth, turbidity, and Chl a across continental and local scales, and within salinity-based estuary groups. Dissolved inorganic N, percent built area, and population density were all related to resistance at the continental scale and in salinity-based groups. Both local and salinity-based evaluations revealed that N : P, salinity, and turbidity were related to resistance. Unique relationships included PO at the local scale (GTM NERR only), tree cover in high-salinity and percent cropland in low-salinity estuaries. The strength of the relationships varied among groups, with higher coefficients of determination present in the high-salinity estuarine group (i.e., most R2>0.5, Fig. 3, Table S5).
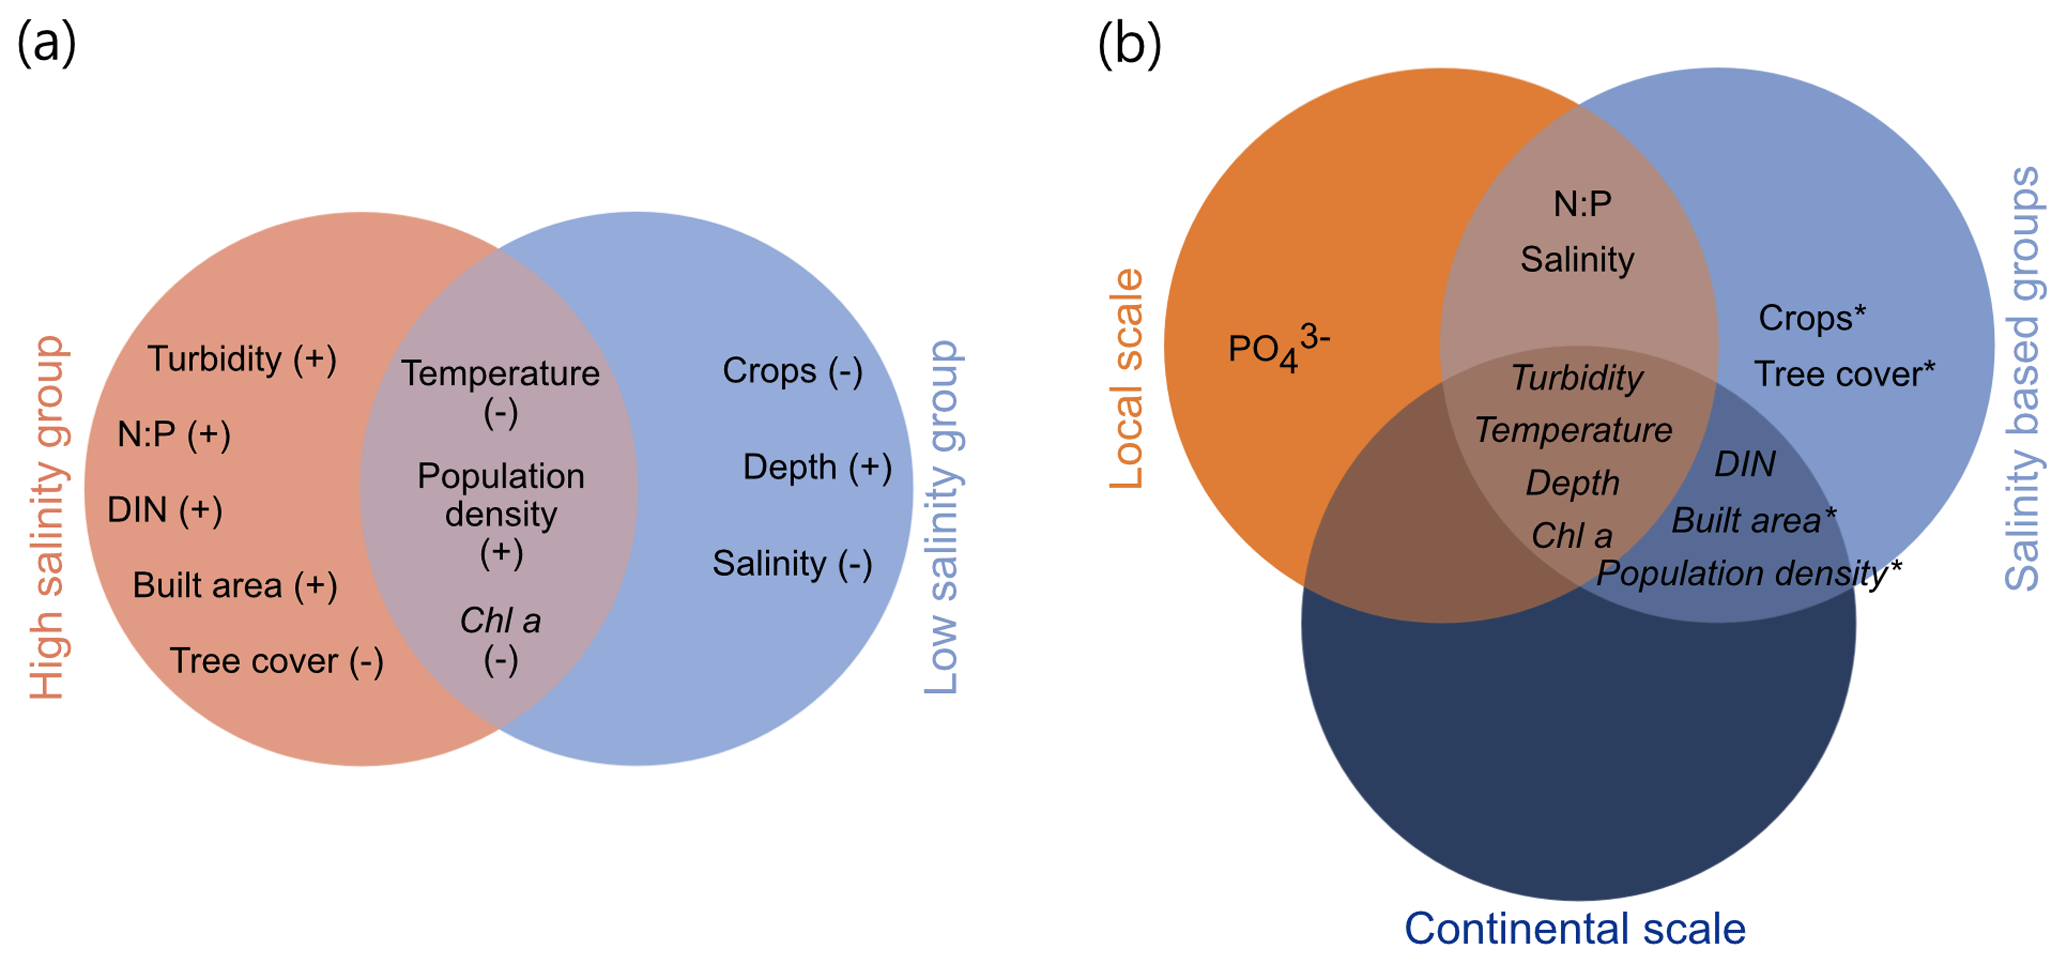
Figure 5Cross-scale significant relationships between estuarine resistance and physicochemical and land-use factors. (a) Venn diagram of resistance relationships with physicochemical and land-use factors in high- vs. low-salinity estuaries. Positive or negative relationships are indicated with “+” and “−”, respectively. Italicized text identifies relationships with coefficient of determination (R2)<0.5 across both high- and low-salinity groups. Factors in the overlap zone with regular text have contrasting R2 across groups. (b) Venn diagram of relationships between resistance and physicochemical and land-use factors in continental, local, and salinity-based groups. Estuarine resistance with land use/land cover and population density marked with asterisks (*) were not evaluated at local scale due to overlap in the spatial domains of some monitoring locations. Italicized text identifies continental-scale relationships with R2<0.5.
Discerning estuarine response patterns following precipitation is important for predicting future impacts of urbanization and changing global weather patterns on estuarine ecosystems. Previous studies have shown that patterns identified at large scales may not be applicable across different ecoregions, geologies, and/or other ecosystem factors (Baker et al., 2004; Gannon et al., 2022; Hopkins et al., 2015; Kaushal et al., 2018; Ombadi and Varadharajan, 2022; Poff et al., 2006). Our results underscore the importance of cross-scale evaluations that can elucidate commonalities in estuarine response to precipitation, as well as variability in the factors associated with resistance across individual estuaries.
We show that while relationships between estuarine resistance, urbanization, and DIN may exist at the continental scale, they do not consistently apply within individual estuaries. This is because an estuary's resistance depends on myriad specific factors in addition to many factors identified at larger scales. In contrast to our overarching hypothesis, we found that urbanized estuaries tend to have higher resistance than pristine estuaries. These results suggest that the effects of watershed urbanization may impact estuarine stability either by providing a mechanism that allows estuaries to dampen large shifts in DO in response to major precipitation events; or by disturbing the baseline DO to an extent where even a major precipitation event would not produce a significant shift in DO, making the system appear highly resistant.
4.1 Dissolved oxygen dynamics differ between estuaries influenced by urban or agricultural land use and those with minimal urbanization
There were vast differences in geometry, circulation, and hydrologic conditions between urbanized estuaries and estuaries surrounded by agricultural land in this study. Yet, despite these differences, several estuaries exhibited similar DO responses to precipitation. Precipitation generally reduced DO concentrations at SFB and CBM NERRs (Fig. 2a–e), whereas LKS NERR, the estuary with the lowest proportion of urbanized land cover, experienced an overall increase in DO concentration following precipitation.
While a wide range of physical factors can impact DO in estuaries including channel geometry, river discharge, circulation, wind patterns, residence time, and upstream reservoirs (Kemp and Boynton, 1980; Raimonet and Cloern, 2017; Raymond et al., 2012; Raymond and Cole, 2001; Scully, 2010; Zheng et al., 2024), urban estuaries in particular are often impacted by a combination of these processes. Urban estuaries often serve as basins for wastewater treatment outflows, which can supply continued freshwater discharge and nutrients during baseflow. Both urban and agriculturally influenced estuaries are prone to increased nutrient loading during and shortly after precipitation events (Chapin et al., 2004; Costanzo et al., 2003; Mallin et al., 2009), which impacts primary production and microbial metabolism and may lead to declines in DO concentrations (e.g., algal blooms). Similarly, power-generating dams and other large reservoirs often present in urban estuaries can strongly influence DO dynamics through their regulation of flow conditions, salinity, temperature, microbial processes, and solute residence time (Abbott et al., 2022; Ferencz et al., 2021b, a).
Therefore, closely examining the directionality of the change in DO response to precipitation is important for informing the environmental significance of storm events for a specific estuary. An increase in DO following precipitation could reduce hypoxia through water column reaeration (Bianucci et al., 2018; Bohórquez-Bedoya et al., 2024) and have positive effects on nutrient cycling and growth conditions for macro- and micro-fauna (Harris et al., 2015). A decrease in DO following precipitation may reflect the opposite effects (e.g., hypoxia), leading to changes in microbial community structure, disruptions in nutrient cycles, and fish die-off (Diaz et al., 1992; Llansó, 1992). Further, the extent to which ecosystem function is linked to DO changes is intertwined with its ambient ecological state and the magnitude of the DO change. An increase in DO following a storm may be less consequential for estuaries with DO-replete ambient conditions as compared to estuaries with chronically depleted DO. This implies that a comprehensive assessment of storm impacts on estuarine ecosystem stability and function should consider resistance index alongside historical DO conditions and the magnitude and directionality of DO change.
For example, resistance index values for the more pristine and tree-cover dominated Pokegama Bay at LKS NERR were comparable to most monitoring locations at WKB NERR, which were associated with agriculture. However, Pokegama Bay and WKB NERR experienced different patterns in DO change following precipitation (Fig. 2). While the full nature of the causes and impacts of DO change in each estuary is beyond the scope of this study, the differences in absolute DO change suggest that different underlying processes influence stability in estuarine dynamics in response to precipitation across different estuaries. Our goal is to identify common predictors of estuarine resistance at the continental scale despite substantial variability in processes, while also identifying salinity-dependent and estuary-specific predictors that help elucidate dynamics that may be particularly influential in individual systems.
4.2 Urbanization and dissolved inorganic nitrogen correspond with elevated resistance to precipitation at the continental scale
Higher resistance to precipitation in the most urbanized estuaries and overarching relationships between urban LULC and resistance across all estuaries reflect that estuaries within urban watersheds typically experience relatively small shifts in DO following precipitation (Figs. 2, 3). These results contradict our hypothesis that urban estuaries should show low resistance to precipitation because of greater physical and chemical disturbances like flashiness, streambed scouring, N loading, and turbidity that impact DO dynamics (Bernhardt et al., 2008; Groffman et al., 2004; Hession et al., 2003; Hopkinson and Vallino, 1995; Walsh et al., 2005).
It is possible that watershed urbanization could equip estuaries with adaptations that help dampen precipitation impacts on shifts in DO. For instance, an increase in flashiness in waterways would increase flow velocity and water column reaeration (Raymond et al., 2012; Raymond and Cole, 2001) and contribute to phytoplankton removal via transport or turbidity-driven light attenuation (Caffrey, 2004; Pennock and Sharp, 1986). This impact may be particularly important for estuaries whose baseline DO conditions are influenced by algal blooms, which induce large diel DO fluctuations by overproducing DO during the day and severely depleting it at night (Chapin et al., 2004; Ni et al., 2020). Managing phytoplankton overgrowth could help maintain DO closer to baseline conditions. Supporting this explanation, turbidity-driven limitations on phytoplankton were previously reported for the SFB estuary (Cloern, 1987). We also found that turbidity was positively related to built area, Chl a was negatively related to population density, and PO concentration was negatively related to tree-cover (Figs. S7, S15). Tree-populated riparian zones, often reduced or absent in urban environments, can help regulate phytoplankton overgrowth and DO dynamics by significantly reducing PO concentrations (Keller and Fox, 2019).
Relatively high levels of ambient DIN concentrations and altered baseline DO dynamics in urban estuaries may also contribute to smaller DO responses to precipitation. Here, estuarine DIN concentrations were positively associated with urbanization and were significantly, but weakly, related to resistance at the continental scale (Fig. 3, S15). While moderate levels of N support biological metabolisms (Howarth, 1988; Howarth and Marino, 2006; Vitousek and Howarth, 1991; Zhang et al., 2021), nutrient loading, including N, is a significant problem for urban aquatic environments (Beman et al., 2005; Bernot et al., 2010; Bettez et al., 2015; Black et al., 2011; Hopkinson and Vallino, 1995; Mulholland et al., 2008; Reisinger et al., 2016). For urban estuaries, where N loading is associated with chronically low DO availability, this could mean that precipitation-driven increases in DO under simultaneous high N input would be small, which would result in higher resistance. Nitrogen limitation, in contrast, is prevalent in coastal marine systems and can negatively impact overall estuarine function by constraining biological activity (Elser et al., 2007; Guildford and Hecky, 2000; Paerl, 2018; Paerl and Piehler, 2008). Relationships of resistance with N and urbanization were particularly evident in more coastal (high-salinity) estuaries where we found positive relationships between resistance, N : P, and built area (Fig. 3). Thus, altered N dynamics in urban estuaries may be key to understanding their comparatively small changes in response to precipitation.
While the mechanisms behind the positive relationship between resistance and N are not clear, changes in concentrations of NH were previously suggested to regulate algal blooms in the SFB estuary (Dugdale et al., 2007; Parker et al., 2012). Elevated NH concentrations resulting from changes in water-treatment practices in San Francisco were shown to inhibit NO uptake and suppress algal blooms, thereby altering a major control on DO dynamics in SFB. Therefore, the prevalent N species and shifts in DIN composition following precipitation events should be considered in attempts to explain the underlying mechanisms behind the positive relationship between DIN and resistance.
Alternatively, we also consider whether baseline DO concentrations in urban estuaries are already disturbed to such an extent that precipitation events cause minimal further disruption. Urbanization itself can promote large diel DO fluctuations, as suggested by Gold et al. (2020), and if a precipitation event induces fluctuations that are similar in magnitude, the post-precipitation DO concentrations will not deviate significantly from baseline conditions. Under such a scenario, urban estuaries will appear more resistant to precipitation events compared to more pristine systems.
4.3 Water column depth, temperature, turbidity, and Chl a are related to resistance across all scales
We found generalizable patterns (across all scales), in which resistance was positively but weakly related to water column depth and turbidity and negatively related to water temperature and Chl a (Figs. 3–5). As discussed above, phytoplankton dynamics may be an important factor in regulating DO in response to disturbance due to their tight linkage with N loading, which is consistent with results previously reported by others (Thayne et al., 2023). This is further underscored by the existence of a relationship between Chl a and resistance across continental, salinity-based, and local analyses. In parallel, the relationship between resistance and turbidity was positive at the continental scale and in the high-salinity group (Fig. 3), while at LKS resistance and turbidity correlated negatively (Figs. 3, 4). The positive relationship between resistance and turbidity and simultaneous negative relationship with Chl a can be attributed to turbidity-driven light attenuating conditions that restrict phytoplankton growth, which is further supported by a negative relationship between turbidity and Chl a (Fig. S7).
Water column depth can also influence estuarine resistance to precipitation through its effects on DO dynamics. Through dilution, deeper estuaries may show a more buffered response to short-term hydrologic changes following precipitation by attenuating changes associated with freshwater inflow, nutrient loading, turbulence, and gas exchange. Similarly, deeper estuaries generally have longer equilibration time with environmental conditions and less diel variability in parameters like temperature (Caissie, 2006; Macan, 1958). These characteristics can contribute to more stable baseline DO conditions and more moderate responses to precipitation. However, greater depth can also enhance vertical stratification and reduce oxygen replenishment to bottom waters, potentially increasing susceptibility to hypoxia (Cloern, 2001; Cloern and Jassby, 2010). Deeper estuarine channels are frequently associated with urbanization, which exhibited high resistance in this study, because channel incision, dredging, and altered sediment transport are more common in urban and agricultural watersheds (O'Driscoll et al., 2010; Simon and Rinaldi, 2006; Walsh et al., 2005). Accordingly, water column depth appears to be an important factor influencing estuarine resistance to precipitation, although its effects on DO dynamics depend on interactions with stratification, hydrodynamics, and watershed characteristics.
Lastly, because temperature controls various chemical and biological processes that impact DO availability (e.g., microbial growth, oxygen solubility), many studies have focused on the impact of rising temperature on DO dynamics in estuaries (Apple et al., 2006; Caffrey, 2003; Caffrey et al., 2014). Previous studies have linked changes in weather patterns to thermal pollution of aquatic systems following rain events (Zahn et al., 2021) and link elevated global temperatures to decreased primary production (Song et al., 2018). As such, estuaries with elevated ambient temperatures may have a decreased capacity to resist disturbances to DO dynamics relative to estuaries with more moderate temperatures.
4.4 High variability in factors associated with resistance at local scales
The substantial differences in physicochemical factors linked to resistance across individual estuaries highlight the need to consider both generalized and local estuarine patterns when predicting and managing the effects of major precipitation events and watershed urbanization on water quality (Figs. 3–5). Although several factors were significantly associated with resistance, these relationships explained relatively little of the observed variance and may have been influenced by non-independence among reported observations from the same monitoring sites and estuaries. Individual estuaries may require consideration of factors beyond water temperature, water column depth, turbidity, and Chl a – identified here as generalizable at the continental scale – and be mindful of differences in the directionality of relationships between physicochemical factors and resistance among estuaries. For example, we found that resistance at CBM NERR is related to one factor (water column depth), while at GTM NERR, resistance is related to five factors (salinity, water temperature, Chl a, PO, and N : P), of which three were not identified at the continental scale. Similarly, although resistance and salinity are positively related at GTM and SFB NERRs, at WKB NERR this relationship is negative. Likewise, while the relationship between resistance and water column depth is negative at SFB NERR, at CBM and LKS NERRs this relationship is positive.
Variability in responses to stressors, at both the system and individual factor levels, is common. Understanding how individual physicochemical factors respond to precipitation broadly and within each system provides insight into the observed relationships between those factors and resistance. For example, Chl a and dissolved inorganic phosphorus have been shown to respond more strongly to storms in some estuaries than in others due to differences in light availability, grazing, and nutrient concentrations (Chen et al., 2015; Cloern, 2001; Cloern and Jassby, 2010; Dix et al., 2013; Liao et al., 2021; Zhang et al., 2022). Likewise, water temperature and salinity also have variable responses to precipitation (Buelo et al., 2023; Chen et al., 2015; Dix et al., 2008), leading to differences in biological processes and phytoplankton activity across estuaries (Apple et al., 2008). System dependencies on groundwater discharge – as a driver of nutrient inputs and a regulator of DO dynamics (Brookfield et al., 2021; Kornelsen and Coulibaly, 2014) – or on microbial community structure (Cheng et al., 2021) should also be appraised when evaluating factors associated with urban estuaries' resistance to precipitation.
4.5 Conceptual model for resistance to precipitation based on estuary characteristics
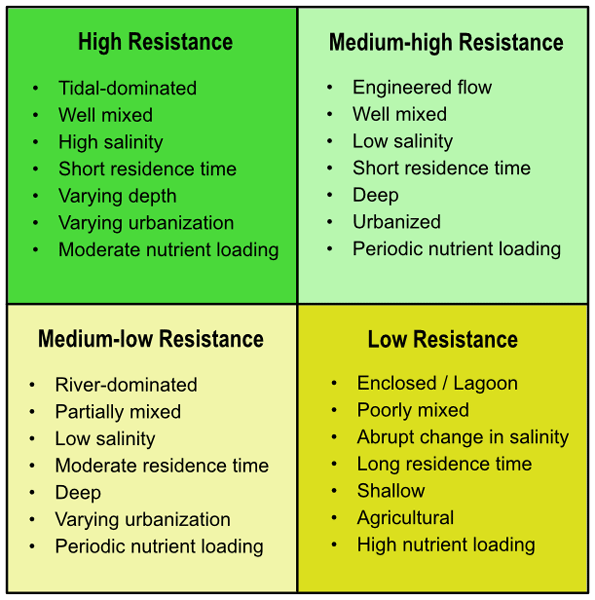
Through observed associations between resistance and physicochemical and land-use factors in this dataset, we propose the following conceptual model for expected resistance based on estuarine characteristics (Fig. 6, Table S1). This conceptual model is intended as a hypothesis-generating framework for future work rather than a deterministic classification of estuarine behavior. We suggest that the highest resistance may occur in tidal/marine-dominated or urban-influenced estuaries that are well-mixed and have relatively short residence time, similar to SFB NERR. In such estuaries, the disturbances to DO dynamics driven by precipitation events, riverine freshwater inputs and/or terrestrial-aquatic exchange across mixed land uses (e.g., changes in salinity, turbidity, and/or nutrients), are mediated by tidal mixing. In contrast, the lowest resistance index could be expected in enclosed, shallow, poorly mixed (i.e., stratified) estuaries with long residence time, strong influence from river systems, and/or surrounded by agricultural LULC, similar to WKB NERR, Pellicer Creek (GTM NERR), or Pokegama Bay (LKS NERR). In such estuaries, the abrupt disruptions to ambient salinity, turbidity, and/or nutrient concentrations driven by precipitation events are expected to be associated with longer-lasting changes and larger fluctuations in DO, which in turn would result in low resistance.
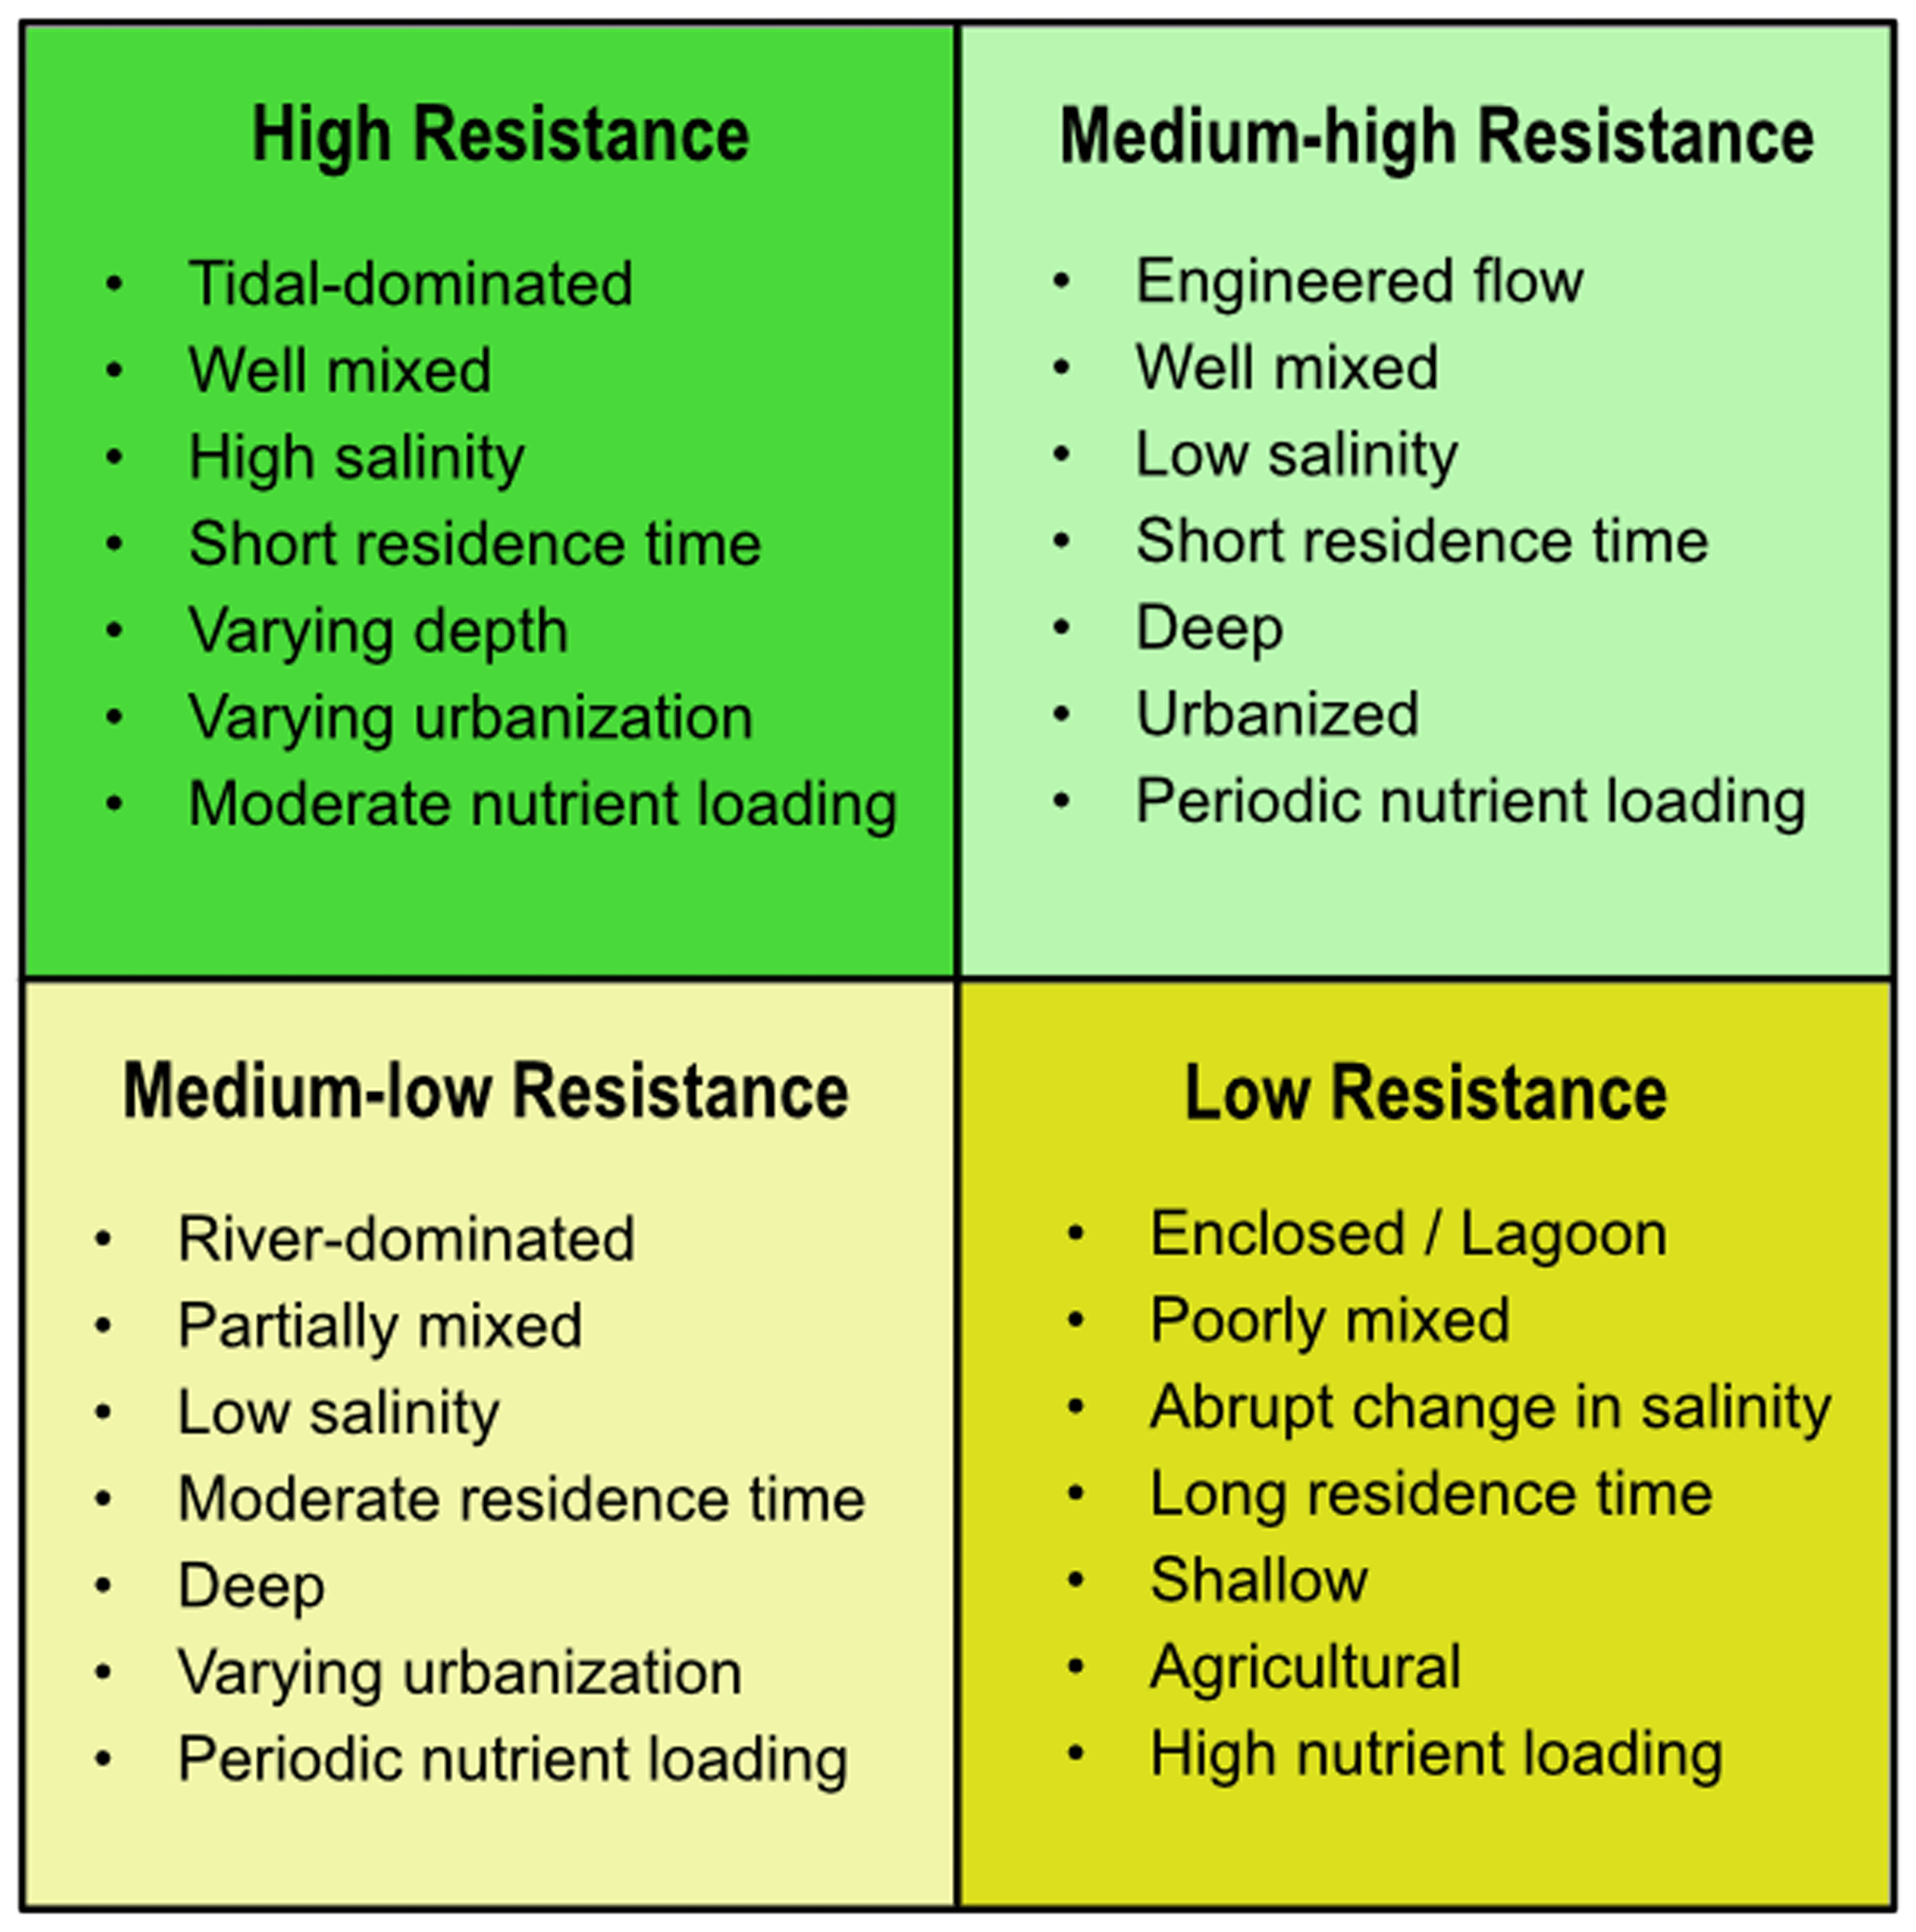
Figure 6Conceptual model for expected estuarine resistance to precipitation events based on estuarine characteristics.
Because estuaries are characterized by a continuum of interacting variables, we expect that many estuaries will show moderate resistance that varies with precipitation events of different sizes. Based on the associations revealed in this dataset, medium-high resistance may occur in well-mixed estuarine systems with engineered flow, relatively short residence time, and periodic nutrient loading conditions (e.g., CBM NERR, remaining LKS and GTM NERRs sites). Conversely, medium-low resistance may be more common in systems with partial stratification, periodic nutrient loading and moderate residence time. However, these patterns are context-dependent and likely influenced by additional interacting factors not explicitly resolved here.
Although numerous estuary-specific interactions can produce different responses to stressors, our results provide a framework for understanding generalizable responses to precipitation based on measurable characteristics, while also highlighting the importance of system variability in determining estuarine resistance. We recognize that additional scales of investigation (e.g., regional) and other ecological, hydrological and environmental factors could further refine predictions of estuarine resistance. Incorporating these elements in future studies could strengthen our ability to anticipate estuarine responses to disturbances.
In light of increasing urbanization and changing rainfall patterns, cross-scale evaluations of estuarine responses to precipitation events are imperative for developing effective management strategies. We observed that urban estuaries tended to show higher resistance to changes in DO in response to precipitation than more pristine estuaries; although the relationships varied across systems. Cross-scale analyses identified that water column depth, water temperature, turbidity, and Chl a variables broadly associate with estuarine resistance. However, across different scales, we found that system variability results in additional factors that are important to consider when managing the responses to major precipitation events of individual estuaries. Based on our results, we suggest that investigations targeting N, nutrient delivery mechanisms, and microbial activity could help understand what makes urban estuaries more resistant to large shifts in DO following precipitation. We also highlight that high-resolution water quality and nutrient data surrounding precipitation events, along with careful consideration of local variability and models for system responses to precipitation, are needed to help elucidate the underlying mechanisms for high resistance of urban estuaries. This study provides a basis for improving guidelines and predictive capabilities addressing system response to future weather and urbanization scenarios.
This study used publicly available datasets, which included: (1) Long-term estuarine water quality, nutrients and meteorological conditions, and watershed boundaries for Lake Superior (LKS) NERR, Chesapeake Bay, Maryland (CBM) NERR, Guana Tolomato Matanzas (GTM) NERR, Weeks Bay (WKB) NERR, and San Francisco Bay (SFB) NERR stations from https://doi.org/10.25921/vw8a-8031 (NOAA NERRS, 2019). (2) Long-term precipitation data from U.S. airports from https://doi.org/10.7289/V5D21VHZ (Menne et al., 2012). (3) Land use/land cover maps from https://livingatlas.arcgis.com/landcoverexplorer/#mapCenter=-83.21000%2C34.33200%2C4.00&mode=step&timeExtent=2017%2C2021&year=2017&downloadMode=true (Karra et al., 2021). (4) U.S. population data from https://doi.org/10.5258/SOTON/WP00684 (Bondarenko et al., 2020). For data and processing code see https://doi.org/10.6084/m9.figshare.25050197 (Tureţcaia et al., 2024).
The supplement related to this article is available online at https://doi.org/10.5194/bg-23-7009-2026-supplement.
E.B.G. and A.B.T. developed the study and interpreted the results. A.B.T. performed data analysis and drafted the manuscript. All authors contributed to conceptualization and manuscript editing.
The contact author has declared that none of the authors has any competing interests.
Publisher's note: Copernicus Publications remains neutral with regard to jurisdictional claims made in the text, published maps, institutional affiliations, or any other geographical representation in this paper. The authors bear the ultimate responsibility for providing appropriate place names. Views expressed in the text are those of the authors and do not necessarily reflect the views of the publisher.
This material is based upon work supported by the U.S. Department of Energy, Office of Science, Biological and Environmental Research program Early Career award to EBG. The work was performed by Pacific Northwest National Laboratory, operated by Battelle Memorial Institute for the U.S. Department of Energy under Contract DE-AC05-76RL01830. We thank the National Estuarine Research Reserve System (NERRS), supported by awards from the Office for Coastal Management, National Oceanographic and Atmospheric Administration (NOAA), and Kyle Derby and Dr. Scott Phipps from Chesapeake Bay, Maryland NERR and Weeks Bay NERR, respectively, for maintaining water quality monitoring locations and providing publicly available data upon which this publication is based. We also thank Drs. Alexander J. Reisinger and Matthew H. Kaufman for their insight into metabolism models for aquatic environments.
This research was supported by the U.S. Department of Energy, Office of Science, Biological and Environmental Research program Early Career award to EBG (grant no. 79480). Pacific Northwest National Laboratory is operated by Battelle for the U. S. Department of Energy under Contract DE-AC05-76RL01830.
This paper was edited by Anja Rammig and reviewed by Laurel Larsen and one anonymous referee.
Abbott, K. M., Zaidel, P. A., Roy, A. H., Houle, K. M., and Nislow, K. H.: Investigating impacts of small dams and dam removal on dissolved oxygen in streams, PLOS ONE, 17, https://doi.org/10.1371/journal.pone.0277647, 2022.
Abdul-Aziz, O. I. and Gebreslase, A. K.: Emergent Scaling of Dissolved Oxygen (DO) in Freshwater Streams Across Contiguous USA, Water Resour. Res., 59, https://doi.org/10.1029/2022WR032114, 2023.
Abdul-Aziz, O. I., Wilson, B. N., and Gulliver, J. S.: Calibration and Validation of an Empirical Dissolved Oxygen Model, J. Environ. Eng., 133, 698–710, https://doi.org/10.1061/(ASCE)0733-9372(2007)133:7(698), 2007.
APHA: Standard Methods for the Examination of Water and Wastewater, (SM10200H), 20th edn., United Book Press, Inc., Baltimore, Maryland, https://www.standardmethods.org/doi/10.2105/SMWW.2882.207 (last access: 28 July 2023), 2001.
Apple, J. K., del Giorgio, P. A. , and Kemp, W. M.: Temperature regulation of bacterial production, respiration, and growth efficiency in a temperate salt-marsh estuary, Aquat. Microb. Ecol., 43, 243–254, https://doi.org/10.3354/ame043243, 2006.
Apple, J. K., Smith, E. M., and Boyd, T. J.: Temperature, Salinity, Nutrients, and the Covariation of Bacterial Production and Chlorophyll-a in Estuarine Ecosystems, J. Coast. Res., 2008, 59–75, https://doi.org/10.2112/SI55-005.1, 2008.
Baker, D. B., Richards, R. P., Loftus, T. T., and Kramer, J. W.: A New Flashiness Index: Characteristics and Applications to Midwestern Rivers and Streams1, JAWRA J. Am. Water Resour. Assoc., 40, 503–522, https://doi.org/10.1111/j.1752-1688.2004.tb01046.x, 2004.
Beman, M. J., Arrigo, K. R., and Matson, P. A.: Agricultural runoff fuels large phytoplankton blooms in vulnerable areas of the ocean, Nature, 434, 211–214, https://doi.org/10.1038/nature03370, 2005.
Bernhardt, E. S., Band, L. E., Walsh, C. J., and Berke, P. E.: Understanding, Managing, and Minimizing Urban Impacts on Surface Water Nitrogen Loading, Ann. N. Y. Acad. Sci., 1134, 61–96, https://doi.org/10.1196/annals.1439.014, 2008.
Bernhardt, E. S., Heffernan, J. B., Grimm, N. B., Stanley, E. H., Harvey, J. W., Arroita, M., Appling, A. P., Cohen, M. J., McDowell, W. H., Hall Jr., R. O., Read, J. S., Roberts, B. J., Stets, E. G., and Yackulic, C. B.: The metabolic regimes of flowing waters, Limnol. Oceanogr., 63, S99–S118, https://doi.org/10.1002/lno.10726, 2018.
Bernot, M. J., Sobota, D. J., Hall Jr., R. O., Mulholland, P. J., Dodds, W. K., Webster, J. R., Tank, J. L., Ashkenas, L. R., Cooper, L. W., Dahm, C. N., Gregory, S. V., Grimm, N. B., Hamilton, S. K., Johnson, S. L., Mcdowell, W. H., Meyer, J. L., Peterson, B., Poole, G. C., Valett, H. M., Arango, C., Beaulieu, J. J., Burgin, A. J., Crenshaw, C., Helton, A. M., Johnson, L., Merriam, J., Niederlehner, B. R., O'brien, J. M., Potter, J. D., Sheibley, R. W., Thomas, S. M., and Wilson, K.: Inter-regional comparison of land-use effects on stream metabolism, Freshw. Biol., 55, 1874–1890, https://doi.org/10.1111/j.1365-2427.2010.02422.x, 2010.
Bettez, N. D., Duncan, J. M., Groffman, P. M., Band, L. E., O'neil-dunne, J., Kaushal, S. S., Belt, K. T., and Law, N.: Climate Variation Overwhelms Efforts to Reduce Nitrogen Delivery to Coastal Waters, Ecosystems, 18, 1319–1331, https://doi.org/10.1007/s10021-015-9902-9, 2015.
Bianchi, T. S.: Biogeochemistry of Estuaries, Oxford University Press, USA, 721 pp., https://doi.org/10.1093/oso/9780195160826.001.0001, 2007.
Bianucci, L., Balaguru, K., Smith, R. W., Leung, L. R., and Moriarty, J. M.: Contribution of hurricane-induced sediment resuspension to coastal oxygen dynamics, Sci. Rep., 8, 15740, https://doi.org/10.1038/s41598-018-33640-3, 2018.
Black, R. W., Moran, P. W., and Frankforter, J. D.: Response of algal metrics to nutrients and physical factors and identification of nutrient thresholds in agricultural streams, Environ. Monit. Assess., 175, 397–417, https://doi.org/10.1007/s10661-010-1539-8, 2011.
Bohórquez-Bedoya, E., Rovelli, L., and Lorke, A.: Rainfall as a driver for near-surface turbulence and air-water gas exchange in freshwater aquatic systems, PLOS ONE, 19, https://doi.org/10.1371/journal.pone.0299998, 2024.
Bondarenko, M., Kerr, D., Sorichetta, A., and Tatem, A.: Census/projection-disaggregated gridded population datasets for 189 countries in 2020 using Built-Settlement Growth Model (BSGM) outputs, University of Southampton [data set], https://doi.org/10.5258/SOTON/WP00684, 2020.
Booth, D. B. and Jackson, C. R.: Urbanization of Aquatic Systems: Degradation Thresholds, Stormwater Detection, and the Limits of Mitigation1, JAWRA J. Am. Water Resour. Assoc., 33, 1077–1090, https://doi.org/10.1111/j.1752-1688.1997.tb04126.x, 1997.
Brookfield, A. E., Hansen, A. T., Sullivan, P. L., Czuba, J. A., Kirk, M. F., Li, L., Newcomer, M. E., and Wilkinson, G.: Predicting algal blooms: Are we overlooking groundwater?, Sci. Total Environ., 769, 144442, https://doi.org/10.1016/j.scitotenv.2020.144442, 2021.
Buelo, C. D., Besterman, A. F., Walter, J. A., Pace, M. L., Ha, D. T., and Tassone, S. J.: Quantifying Disturbance and Recovery in Estuaries: Tropical Cyclones and High-Frequency Measures of Oxygen and Salinity, Estuaries Coasts, 47, 18–31, https://doi.org/10.1007/s12237-023-01255-1, 2023.
Caffrey, J. M.: Production, Respiration and Net Ecosystem Metabolism in U.S. Estuaries, in: Coastal Monitoring through Partnerships: Proceedings of the Fifth Symposium on the Environmental Monitoring and Assessment Program (EMAP) Pensacola Beach, FL, USA, April 24–27, 2001, edited by: Melzian, B. D., Engle, V., McAlister, M., Sandhu, S., and Eads, L. K., Springer Netherlands, Dordrecht, 207–219, https://doi.org/10.1007/978-94-017-0299-7_19, 2003.
Caffrey, J. M.: Factors controlling net ecosystem metabolism in U.S. estuaries, Estuaries, 27, 90–101, https://doi.org/10.1007/BF02803563, 2004.
Caffrey, J. M., Murrell, M. C., Amacker, K. S., Harper, J. W., Phipps, S., and Woodrey, M. S.: Seasonal and Inter-annual Patterns in Primary Production, Respiration, and Net Ecosystem Metabolism in Three Estuaries in the Northeast Gulf of Mexico, Estuaries Coasts, 37, 222–241, https://doi.org/10.1007/s12237-013-9701-5, 2014.
Caissie, D.: The thermal regime of rivers: a review, Freshw. Biol., 51, 1389–1406, https://doi.org/10.1111/j.1365-2427.2006.01597.x, 2006.
Chang, H.: Spatial and Temporal Variations of Water Quality in the Han River and Its Tributaries, Seoul, Korea, 1993–2002, Water. Air. Soil Pollut., 161, 267–284, https://doi.org/10.1007/s11270-005-4286-7, 2005.
Chapin, T. P., Caffrey, J. M., Jannasch, H. W., Coletti, L. J., Haskins, J. C., and Johnson, K. S.: Nitrate sources and sinks in Elkhorn Slough, California: Results from long-term continuous in situ nitrate analyzers, Estuaries, 27, 882–894, https://doi.org/10.1007/BF02912049, 2004.
Chapra, S. C.: Surface Water-Quality Modeling, Waveland Press, 865 pp., ISBN 978-1-4786-0830-1, 2008.
Chen, N., Wu, Y., Chen, Z., and Hong, H.: Phosphorus export during storm events from a human perturbed watershed, southeast China: Implications for coastal ecology, Estuar. Coast. Shelf Sci., 166, 178–188, https://doi.org/10.1016/j.ecss.2015.03.023, 2015.
Cheng, Y., Bhoot, V. N., Kumbier, K., Sison-Mangus, M. P., Brown, J. B., Kudela, R., and Newcomer, M. E.: A novel random forest approach to revealing interactions and controls on chlorophyll concentration and bacterial communities during coastal phytoplankton blooms, Sci. Rep., 11, 19944, https://doi.org/10.1038/s41598-021-98110-9, 2021.
Cloern, J. E.: Turbidity as a control on phytoplankton biomass and productivity in estuaries, Cont. Shelf Res., 7, 1367–1381, https://doi.org/10.1016/0278-4343(87)90042-2, 1987.
Cloern, J. E.: Our evolving conceptual model of the coastal eutrophication problem, Mar. Ecol. Prog. Ser., 210, 223–253, https://doi.org/10.3354/meps210223, 2001.
Cloern, J. E. and Jassby, A. D.: Patterns and Scales of Phytoplankton Variability in Estuarine–Coastal Ecosystems, Estuaries Coasts, 33, 230–241, https://doi.org/10.1007/s12237-009-9195-3, 2010.
Costanzo, S. D., O'Donohue, M. J., and Dennison, W. C.: Assessing the seasonal influence of sewage and agricultural nutrient inputs in a subtropical river estuary, Estuaries, 26, 857–865, https://doi.org/10.1007/BF02803344, 2003.
Cox, B.: A review of currently available in-stream water-quality models and their applicability for simulating dissolved oxygen in lowland rivers, Sci. Total Environ., 314–316, 335–377, https://doi.org/10.1016/S0048-9697(03)00063-9, 2003.
Diaz, R. J., Neubauer, R. J., Schaffner, L. C., Pihl, L., and Baden, S. P.: Continuous monitoring of dissolved oxygen in an estuary experiencing periodic hypoxia and the effect of hypoxia on macrobenthos and fish, in: Marine Coastal Eutrophication, edited by: Vollenweider, R. A., Marchetti, R., and Viviani, R., Elsevier, Amsterdam, 1055–1068, https://doi.org/10.1016/B978-0-444-89990-3.50091-2, 1992.
Dix, N., Phlips, E., and Suscy, P.: Factors Controlling Phytoplankton Biomass in a Subtropical Coastal Lagoon: Relative Scales of Influence, Estuaries Coasts, 36, 981–996, https://doi.org/10.1007/s12237-013-9613-4, 2013.
Dix, N., Nicklay, H., Cianci-Gaskill, J., Dunnigan Kimmel, S., Tanner, J. S., Cressman, K., McMurray, S. E., Rii, Y. M., Jeppesen, R., Guy, R., and Smith, E.: Refining techniques for high-frequency monitoring of chlorophyll a fluorescence in estuarine systems, Limnol. Oceanogr. Methods, n/a, e70065, https://doi.org/10.1002/lom3.70065, 2026.
Dix, N. G., Phlips, E. J., and Gleeson, R. A.: Water Quality Changes in the Guana Tolomato Matanzas National Estuarine Research Reserve, Florida, Associated with Four Tropical Storms, J. Coast. Res., 2008, 26–37, https://doi.org/10.2112/SI55-008.1, 2008.
Dugdale, R. C., Wilkerson, F. P., Hogue, V. E., and Marchi, A.: The role of ammonium and nitrate in spring bloom development in San Francisco Bay, Estuar. Coast. Shelf Sci., 73, 17–29, https://doi.org/10.1016/j.ecss.2006.12.008, 2007.
Elser, J. J., Bracken, M. E. S., Cleland, E. E., Gruner, D. S., Harpole, W. S., Hillebrand, H., Ngai, J. T., Seabloom, E. W., Shurin, J. B., and Smith, J. E.: Global analysis of nitrogen and phosphorus limitation of primary producers in freshwater, marine and terrestrial ecosystems, Ecol. Lett., 10, 1135–1142, https://doi.org/10.1111/j.1461-0248.2007.01113.x, 2007.
Ferencz, S. B., Cardenas, M. B., and Neilson, B. T.: Aerobic respiration in riparian exchange zones of regulated river corridors, Hydrol. Process., 35, https://doi.org/10.1002/hyp.14386, 2021a.
Ferencz, S. B., Muñoz, S., Neilson, B. T., and Cardenas, M. B.: Riverbed Temperature and Heat Transport in a Hydropeaked River, Water Resour. Res., 57, https://doi.org/10.1029/2021WR029609, 2021b.
Fisher, S. G., Gray, L. J., Grimm, N. B., and Busch, D. E.: Temporal Succession in a Desert Stream Ecosystem Following Flash Flooding, Ecol. Monogr., 52, 93–110, https://doi.org/10.2307/2937346, 1982.
Freeman, L. A., Corbett, D. R., Fitzgerald, A. M., Lemley, D. A., Quigg, A., and Steppe, C. N.: Impacts of Urbanization and Development on Estuarine Ecosystems and Water Quality, Estuaries Coasts, 42, 1821–1838, https://doi.org/10.1007/s12237-019-00597-z, 2019.
Gannon, J. P., Kelleher, C., and Zimmer, M.: Controls on watershed flashiness across the continental US, J. Hydrol., 609, 127713, https://doi.org/10.1016/j.jhydrol.2022.127713, 2022.
Gold, A., Thompson, S., Magel, C., and Piehler, M.: Urbanization alters coastal plain stream carbon export and dissolved oxygen dynamics, Sci. Total Environ., 747, 141132, https://doi.org/10.1016/j.scitotenv.2020.141132, 2020.
Gregory, K. J.: Wolman MG (1967) A cycle of sedimentation and erosion in urban river channels. Geografiska Annaler 49A: 385-395., Prog. Phys. Geogr., 35, 831–841, https://doi.org/10.1177/0309133311414527, 2011.
Grimm, N. B., Faeth, S. H., Golubiewski, N. E., Redman, C. L., Wu, J., Bai, X., and Briggs, J. M.: Global Change and the Ecology of Cities, Science, 319, 756–760, 2008.
Groffman, P. M., Law, N. L., Belt, K. T., Band, L. E., and Fisher, G. T.: Nitrogen Fluxes and Retention in Urban Watershed Ecosystems, Ecosystems, 7, 393–403, https://doi.org/10.1007/s10021-003-0039-x, 2004.
Guildford, S. J. and Hecky, R. E.: Total nitrogen, total phosphorus, and nutrient limitation in lakes and oceans: Is there a common relationship?, Limnol. Oceanogr., 45, 1213–1223, https://doi.org/10.4319/lo.2000.45.6.1213, 2000.
Harris, L. A., Hodgkins, C. L. S., Day, M. C., Austin, D., Testa, J. M., Boynton, W., Van Der Tak, L., and Chen, N. W.: Optimizing recovery of eutrophic estuaries: Impact of destratification and re-aeration on nutrient and dissolved oxygen dynamics, Ecol. Eng., 75, 470–483, https://doi.org/10.1016/j.ecoleng.2014.11.028, 2015.
He, Q. and Silliman, B. R.: Climate Change, Human Impacts, and Coastal Ecosystems in the Anthropocene, Curr. Biol., 29, R1021–R1035, https://doi.org/10.1016/j.cub.2019.08.042, 2019.
Hession, W. C., Pizzuto, J. E., Johnson, T. E., and Horwitz, R. J.: Influence of bank vegetation on channel morphology in rural and urban watersheds, Geology, 31, 147–150, https://doi.org/10.1130/0091-7613(2003)031<0147:IOBVOC>2.0.CO;2, 2003.
Hopkins, K. G., Morse, N. B., Bain, D. J., Bettez, N. D., Grimm, N. B., Morse, J. L., Palta, M. M., Shuster, W. D., Bratt, A. R., and Suchy, A. K.: Assessment of Regional Variation in Streamflow Responses to Urbanization and the Persistence of Physiography, Environ. Sci. Technol., 49, 2724–2732, https://doi.org/10.1021/es505389y, 2015.
Hopkinson, C. S. and Vallino, J. J.: The relationships among man's activities in watersheds and estuaries: A model of runoff effects on patterns of estuarine community metabolism, Estuaries, 18, 598–621, https://doi.org/10.2307/1352380, 1995.
Howarth, R. W.: Nutrient Limitation of Net Primary Production in Marine Ecosystems, Annu. Rev. Ecol. Syst., 19, 89–110, 1988.
Howarth, R. W. and Marino, R.: Nitrogen as the limiting nutrient for eutrophication in coastal marine ecosystems: Evolving views over three decades, Limnol. Oceanogr., 51, 364–376, https://doi.org/10.4319/lo.2006.51.1_part_2.0364, 2006.
Isbell, F., Craven, D., Connolly, J., Loreau, M., Schmid, B., Beierkuhnlein, C., Bezemer, T. M., Bonin, C., Bruelheide, H., de Luca, E., Ebeling, A., Griffin, J. N., Guo, Q., Hautier, Y., Hector, A., Jentsch, A., Kreyling, J., Lanta, V., Manning, P., Meyer, S. T., Mori, A. S., Naeem, S., Niklaus, P. A., Polley, H. W., Reich, P. B., Roscher, C., Seabloom, E. W., Smith, M. D., Thakur, M. P., Tilman, D., Tracy, B. F., van der Putten, W. H., van Ruijven, J., Weigelt, A., Weisser, W. W., Wilsey, B., and Eisenhauer, N.: Biodiversity increases the resistance of ecosystem productivity to climate extremes, Nature, 526, 574–577, https://doi.org/10.1038/nature15374, 2015.
Kannel, P. R., Lee, S., Lee, Y.-S., Kanel, S. R., and Khan, S. P.: Application of Water Quality Indices and Dissolved Oxygen as Indicators for River Water Classification and Urban Impact Assessment, Environ. Monit. Assess., 132, 93–110, https://doi.org/10.1007/s10661-006-9505-1, 2007.
Karra, K., Kontgis, C., Statman-Weil, Z., Mazzariello, J. C., Mathis, M., and Brumby, S. P.: Global land use/land cover with Sentinel 2 and deep learning, in: 2021 IEEE International Geoscience and Remote Sensing Symposium IGARSS, IGARSS 2021 – 2021 IEEE International Geoscience and Remote Sensing Symposium, 4704–4707, https://doi.org/10.1109/IGARSS47720.2021.9553499, 2021 (data available at: https://livingatlas.arcgis.com/landcoverexplorer/#mapCenter=-83.21000%2C34.33200%2C4.00&mode=step&timeExtent=2017%2C2021&year=2017&downloadMode=true, last access: 2 August, 2023).
Kaushal, S. S., Likens, G. E., Pace, M. L., Utz, R. M., Haq, S., Gorman, J., and Grese, M.: Freshwater salinization syndrome on a continental scale, Proc. Natl. Acad. Sci., 115, E574–E583, https://doi.org/10.1073/pnas.1711234115, 2018.
Keller, A. A. and Fox, J.: Giving credit to reforestation for water quality benefits, PLOS ONE, 14, https://doi.org/10.1371/journal.pone.0217756, 2019.
Kemp, W. M. and Boynton, W. R.: Influence of biological and physical processes on dissolved oxygen dynamics in an estuarine system: Implications for measurement of community metabolism, Estuar. Coast. Mar. Sci., 11, 407–431, https://doi.org/10.1016/S0302-3524(80)80065-X, 1980.
Kemp, W. M., Testa, J. M., Conley, D. J., Gilbert, D., and Hagy, J. D.: Temporal responses of coastal hypoxia to nutrient loading and physical controls, Biogeosciences, 6, 2985–3008, https://doi.org/10.5194/bg-6-2985-2009, 2009.
Kornelsen, K. C. and Coulibaly, P.: Synthesis review on groundwater discharge to surface water in the Great Lakes Basin, J. Gt. Lakes Res., 40, 247–256, https://doi.org/10.1016/j.jglr.2014.03.006, 2014.
Kyzar, T., Safak, I., Cebrian, J., Clark, M. W., Dix, N., Dietz, K., Gittman, R. K., Jaeger, J., Radabaugh, K. R., Roddenberry, A., Smith, C. S., Sparks, E. L., Stone, B., Sundin, G., Taubler, M., and Angelini, C.: Challenges and opportunities for sustaining coastal wetlands and oyster reefs in the southeastern United States, J. Environ. Manage., 296, 113178, https://doi.org/10.1016/j.jenvman.2021.113178, 2021.
Lake, P. S.: Resistance, Resilience and Restoration, Ecol. Manag. Restor., 14, 20–24, https://doi.org/10.1111/emr.12016, 2013.
Leopold, L. B.: Hydrology for urban land planning – A guidebook on the hydrologic effects of urban land use, Circular, U.S. Geological Survey, https://doi.org/10.3133/cir554, 1968.
Li, C., Zwiers, F., Zhang, X., Chen, G., Lu, J., Li, G., Norris, J., Tan, Y., Sun, Y., and Liu, M.: Larger Increases in More Extreme Local Precipitation Events as Climate Warms, Geophys. Res. Lett., 46, 6885–6891, https://doi.org/10.1029/2019GL082908, 2019.
Liao, A., Han, D., Song, X., and Yang, S.: Impacts of storm events on chlorophyll-a variations and controlling factors for algal bloom in a river receiving reclaimed water, J. Environ. Manage., 297, 113376, https://doi.org/10.1016/j.jenvman.2021.113376, 2021.
Llansó, R. J.: Effects of hypoxia on estuarine benthos: the lower Rappahannock River (Chesapeake Bay), a case study, Estuar. Coast. Shelf Sci., 35, 491–515, https://doi.org/10.1016/S0272-7714(05)80027-7, 1992.
Loken, L. C., Van Nieuwenhuyse, E. E., Dahlgren, R. A., Lenoch, L. E. K., Stumpner, P. R., Burau, J. R., and Sadro, S.: Assessment of multiple ecosystem metabolism methods in an estuary, Limnol. Oceanogr.-Methods, 19, 741–757, https://doi.org/10.1002/lom3.10458, 2021.
Macan, T. T.: The temperature of a small stony stream, Hydrobiologia, 12, 89–106, https://doi.org/10.1007/BF00034143, 1958.
Mallin, M. A., Johnson, V. L., and Ensign, S. H.: Comparative impacts of stormwater runoff on water quality of an urban, a suburban, and a rural stream, Environ. Monit. Assess., 159, 475–91, https://doi.org/10.1007/s10661-008-0644-4, 2009.
Martínez, M. L., Intralawan, A., Vázquez, G., Pérez-Maqueo, O., Sutton, P., and Landgrave, R.: The coasts of our world: Ecological, economic and social importance, Ecol. Econ., 63, 254–272, https://doi.org/10.1016/j.ecolecon.2006.10.022, 2007.
McCluney, K. E., Poff, N. L., Palmer, M. A., Thorp, J. H., Poole, G. C., Williams, B. S., Williams, M. R., and Baron, J. S.: Riverine macrosystems ecology: sensitivity, resistance, and resilience of whole river basins with human alterations, Front. Ecol. Environ., 12, 48–58, https://doi.org/10.1890/120367, 2014.
McSweeney, J. M., Chant, R. J., Wilkin, J. L., and Sommerfield, C. K.: Suspended-Sediment Impacts on Light-Limited Productivity in the Delaware Estuary, Estuaries Coasts, 40, 977–993, https://doi.org/10.1007/s12237-016-0200-3, 2017.
Menne, M. J., Durre, I., Korzeniewski, B., McNeill, S., Thomas, K., Yin, X., Anthony, S., Ray, R., Vose, R. S., Gleason B. E., and Houston, T. G.: Global Historical Climatology Network – Daily (GHCN-Daily) (Version 3), NOAA National Centers for Environmental Information [data set], https://doi.org/10.7289/V5D21VHZ, 2012.
Mulholland, P. J., Fellows, C. S., Tank, J. L., Grimm, N. B., Webster, J. R., Hamilton, S. K., Martí, E., Ashkenas, L., Bowden, W. B., Dodds, W. K., Mcdowell, W. H., Paul, M. J., and Peterson, B. J.: Inter-biome comparison of factors controlling stream metabolism, Freshw. Biol., 46, 1503–1517, https://doi.org/10.1046/j.1365-2427.2001.00773.x, 2001.
Mulholland, P. J., Helton, A. M., Poole, G. C., Hall, R. O., Hamilton, S. K., Peterson, B. J., Tank, J. L., Ashkenas, L. R., Cooper, L. W., Dahm, C. N., Dodds, W. K., Findlay, S. E. G., Gregory, S. V., Grimm, N. B., Johnson, S. L., McDowell, W. H., Meyer, J. L., Valett, H. M., Webster, J. R., Arango, C. P., Beaulieu, J. J., Bernot, M. J., Burgin, A. J., Crenshaw, C. L., Johnson, L. T., Niederlehner, B. R., O'Brien, J. M., Potter, J. D., Sheibley, R. W., Sobota, D. J., and Thomas, S. M.: Stream denitrification across biomes and its response to anthropogenic nitrate loading, Nature, 452, 202–205, https://doi.org/10.1038/nature06686, 2008.
Murrell, M. C., Caffrey, J. M., Marcovich, D. T., Beck, M. W., Jarvis, B. M., and Hagy, J. D.: Seasonal oxygen dynamics in a warm temperate estuary: effects of hydrologic variability on measurements of primary production, respiration, and net metabolism, Estuaries Coasts J. Estuar. Res. Fed., 41, 690–707, https://doi.org/10.1007/s12237-017-0328-9, 2018.
Ni, W., Li, M., and Testa, J. M.: Discerning effects of warming, sea level rise and nutrient management on long-term hypoxia trends in Chesapeake Bay, Sci. Total Environ., 737, 139717, https://doi.org/10.1016/j.scitotenv.2020.139717, 2020.
NOAA National Estuarine Research Reserve System (NERRS): NOAA National Estuarine Research Reserve (NERR) System-Wide Monitoring Program Meteorological, Water Quality, Nutrient/Pigment, and Geospatial Data from 1994 to 2024 (NCEI Accession 0200366), CBMNERR, LSNERR, GTMNERR, SFBNERR, and WKBNERR, NOAA NERRS [data set], https://doi.org/10.25921/vw8a-8031, 2019.
O'Dell, J. W.: Determination Of Nitrate-Nitrite Nitrogen by Automated Colorimetry, in: Methods for the Determination of Metals in Environmental Samples, Elsevier, 464–478, https://doi.org/10.1016/B978-0-8155-1398-8.50026-4, 1996a.
O'Dell, J. W.: Determination of Phosphorus by Semi-Automated Colorimetry, in: Methods for the Determination of Metals in Environmental Samples, Elsevier, 479–495, https://doi.org/10.1016/B978-0-8155-1398-8.50027-6, 1996b.
O'Driscoll, M., Clinton, S., Jefferson, A., Manda, A., and McMillan, S.: Urbanization Effects on Watershed Hydrology and In-Stream Processes in the Southern United States, Water, 2, 605–648, https://doi.org/10.3390/w2030605, 2010.
Odum, H. T.: Primary Production in Flowing Waters, Limnol. Oceanogr., 1, 102–117, https://doi.org/10.4319/lo.1956.1.2.0102, 1956.
Ombadi, M. and Varadharajan, C.: Urbanization and aridity mediate distinct salinity response to floods in rivers and streams across the contiguous United States, Water Res., 220, 118664, https://doi.org/10.1016/j.watres.2022.118664, 2022.
Orwin, K. H. and Wardle, D. A.: New indices for quantifying the resistance and resilience of soil biota to exogenous disturbances, Soil Biol. Biochem., 36, 1907–1912, https://doi.org/10.1016/j.soilbio.2004.04.036, 2004.
Paerl, H. W.: Why does N-limitation persist in the world's marine waters?, Mar. Chem., 206, 1–6, https://doi.org/10.1016/j.marchem.2018.09.001, 2018.
Paerl, H. W. and Piehler, M. F.: Nitrogen and Marine Eutrophication, Chap. 11, in: Nitrogen in the Marine Environment, 2nd Edn., edited by: Capone, D. G., Bronk, D. A., Mulholland, M. R., and Carpenter, E. J., Academic Press, San Diego, 529–567, https://doi.org/10.1016/B978-0-12-372522-6.00011-6, 2008.
Parker, A. E., Hogue, V. E., Wilkerson, F. P., and Dugdale, R. C.: The effect of inorganic nitrogen speciation on primary production in the San Francisco Estuary, Estuar. Coast. Shelf Sci., 104–105, 91–101, https://doi.org/10.1016/j.ecss.2012.04.001, 2012.
Pennock, J. R. and Sharp, J. H.: Phytoplankton production in the Delaware Estuary: temporal and spatial variability, Mar. Ecol. Prog. Ser., 34, 143–155, 1986.
Pickett, S. T. A., Cadenasso, M. L., Grove, J. M., Boone, C. G., Groffman, P. M., Irwin, E., Kaushal, S. S., Marshall, V., McGrath, B. P., Nilon, C. H., Pouyat, R. V., Szlavecz, K., Troy, A., and Warren, P.: Urban ecological systems: Scientific foundations and a decade of progress, J. Environ. Manage., 92, 331–362, https://doi.org/10.1016/j.jenvman.2010.08.022, 2011.
Pimm, S. L.: The complexity and stability of ecosystems, Nature, 307, 321–326, https://doi.org/10.1038/307321a0, 1984.
Poff, N. L., Bledsoe, B. P., and Cuhaciyan, C. O.: Hydrologic variation with land use across the contiguous United States: Geomorphic and ecological consequences for stream ecosystems, Geomorphology, 79, 264–285, https://doi.org/10.1016/j.geomorph.2006.06.032, 2006.
QGIS Geographic Information System: https://www.qgis.org/en/site/, last access: 30 January 2024.
Rabalais, N. N., Díaz, R. J., Levin, L. A., Turner, R. E., Gilbert, D., and Zhang, J.: Dynamics and distribution of natural and human-caused hypoxia, Biogeosciences, 7, 585–619, https://doi.org/10.5194/bg-7-585-2010, 2010.
Raimonet, M. and Cloern, J. E.: Estuary–ocean connectivity: fast physics, slow biology, Glob. Change Biol., 23, 2345–2357, https://doi.org/10.1111/gcb.13546, 2017.
Raymond, P. A. and Cole, J. J.: Gas exchange in rivers and estuaries: Choosing a gas transfer velocity, Estuaries, 24, 312–317, https://doi.org/10.2307/1352954, 2001.
Raymond, P. A., Zappa, C. J., Butman, D., Bott, T. L., Potter, J., Mulholland, P., Laursen, A. E., McDowell, W. H., and Newbold, D.: Scaling the gas transfer velocity and hydraulic geometry in streams and small rivers: Gas transfer velocity and hydraulic geometry, Limnol. Oceanogr. Fluids Environ., 2, 41–53, https://doi.org/10.1215/21573689-1597669, 2012.
Redfield, A. C.: On the Properties of Organic Derivatives in Sea Water and Their Relation to Composition of the Phytoplankton, in: James Johnstone Memorial Volume, edited by: University of Liverpool, University Press of Liverpool, 176–192, 1934.
Reisinger, A. J., Groffman, P. M., and Rosi-Marshall, E. J.: Nitrogen-cycling process rates across urban ecosystems, FEMS Microbiol. Ecol., 92, fiw198, https://doi.org/10.1093/femsec/fiw198, 2016.
Reisinger, A. J., Rosi, E. J., Bechtold, H. A., Doody, T. R., Kaushal, S. S., and Groffman, P. M.: Recovery and resilience of urban stream metabolism following Superstorm Sandy and other floods, Ecosphere, 8, https://doi.org/10.1002/ecs2.1776, 2017.
Scully, M. E.: Wind Modulation of Dissolved Oxygen in Chesapeake Bay, Estuaries Coasts, 33, 1164–1175, https://doi.org/10.1007/s12237-010-9319-9, 2010.
Simon, A. and Rinaldi, M.: Disturbance, stream incision, and channel evolution: The roles of excess transport capacity and boundary materials in controlling channel response, Geomorphology, 79, 361–383, https://doi.org/10.1016/j.geomorph.2006.06.037, 2006.
Song, C., Dodds, W. K., Rüegg, J., Argerich, A., Baker, C. L., Bowden, W. B., Douglas, M. M., Farrell, K. J., Flinn, M. B., Garcia, E. A., Helton, A. M., Harms, T. K., Jia, S., Jones, J. B., Koenig, L. E., Kominoski, J. S., McDowell, W. H., McMaster, D., Parker, S. P., Rosemond, A. D., Ruffing, C. M., Sheehan, K. R., Trentman, M. T., Whiles, M. R., Wollheim, W. M., and Ballantyne, F.: Continental-scale decrease in net primary productivity in streams due to climate warming, Nat. Geosci., 11, 415–420, https://doi.org/10.1038/s41561-018-0125-5, 2018.
Thayne, M. W., Kraemer, B. M., Mesman, J. P., Ibelings, B. W., and Adrian, R.: Antecedent lake conditions shape resistance and resilience of a shallow lake ecosystem following extreme wind storms, Limnol. Oceanogr., 67, S101–S120, https://doi.org/10.1002/lno.11859, 2022.
Thayne, M. W., Kraemer, B. M., Mesman, J. P., Pierson, D., Laas, A., de Eyto, E., Ibelings, B. W., and Adrian, R.: Lake surface water temperature and oxygen saturation resistance and resilience following extreme storms: chlorophyll a shapes resistance to storms, Inland Waters, 13, 339–361, https://doi.org/10.1080/20442041.2023.2242081, 2023.
Tsai, J.-W., Kratz, T. K., Hanson, P. C., Kimura, N., Liu, W.-C., Lin, F.-P., Chou, H.-M., Wu, J.-T., and Chiu, C.-Y.: Metabolic changes and the resistance and resilience of a subtropical heterotrophic lake to typhoon disturbance, Can. J. Fish. Aquat. Sci., 68, 768–780, https://doi.org/10.1139/f2011-024, 2011.
Tureţcaia, A. B., Dix, N. G., Nicklay, H., Ferner, M. C., and Graham, E. B.: Physicochemical Factors and Urban Land-Use Characteristics Associated with Resistance to Precipitation in Estuaries Vary Across Scales, Figshare [data set], https://doi.org/10.6084/m9.figshare.25050197, 2024.
Uehlinger, U.: Resistance and resilience of ecosystem metabolism in a flood-prone river system, Freshw. Biol., 45, 319–332, https://doi.org/10.1111/j.1365-2427.2000.00620.x, 2000.
U.S. EPA: Method 350.1: Nitrogen, Ammonia (Colorimetric, Automated Phenate), https://www.epa.gov/esam/epa-method-3501-determination-ammonia-nitrogen-semi-automated-colorimetry (last access: 29 May 2024), 1993a.
U.S. EPA: Method 446.0: In Vitro Determination of Chlorophylls a, b, c1+c2 and Pheopigments in Marine and Freshwater Algae by Visible Spectrophotometry, https://nepis.epa.gov/Exe/ZyPURL.cgi?Dockey=P100PMTG.TXT (last access: 29 May 2024), 1993b.
Utz, R. M., Hopkins, K. G., Beesley, L., Booth, D. B., Hawley, R. J., Baker, M. E., Freeman, M. C., and L. Jones, K.: Ecological resistance in urban streams: the role of natural and legacy attributes, Freshw. Sci., 35, 380–397, https://doi.org/10.1086/684839, 2016.
Van Meerbeek, K., Jucker, T., and Svenning, J.-C.: Unifying the concepts of stability and resilience in ecology, J. Ecol., 109, 3114–3132, https://doi.org/10.1111/1365-2745.13651, 2021.
Vietz, G. J., Walsh, C. J., and Fletcher, T. D.: Urban hydrogeomorphology and the urban stream syndrome: Treating the symptoms and causes of geomorphic change, Prog. Phys. Geogr. Earth Environ., 40, 480–492, https://doi.org/10.1177/0309133315605048, 2016.
Vitousek, P. M. and Howarth, R. W.: Nitrogen limitation on land and in the sea: How can it occur?, Biogeochemistry, 13, 87–115, https://doi.org/10.1007/BF00002772, 1991.
Walsh, C. J., Roy, A. H., Feminella, J. W., Cottingham, P. D., Groffman, P. M., and Morgan, R. P.: The urban stream syndrome: current knowledge and the search for a cure, J. North Am. Benthol. Soc., 24, 706–723, https://doi.org/10.1899/04-028.1, 2005.
Wetz, M. S. and Yoskowitz, D. W.: An `extreme' future for estuaries? Effects of extreme climatic events on estuarine water quality and ecology, Mar. Pollut. Bull., 69, 7–18, https://doi.org/10.1016/j.marpolbul.2013.01.020, 2013.
Zahn, E., Welty, C., Smith, J. A., Kemp, S. J., Baeck, M.-L., and Bou-Zeid, E.: The Hydrological Urban Heat Island: Determinants of Acute and Chronic Heat Stress in Urban Streams, JAWRA J. Am. Water Resour. Assoc., 57, 941–955, https://doi.org/10.1111/1752-1688.12963, 2021.
Zarnetske, J. P., Haggerty, R., Wondzell, S. M., Bokil, V. A., and González-Pinzón, R.: Coupled transport and reaction kinetics control the nitrate source-sink function of hyporheic zones, Water Resour. Res., 48, https://doi.org/10.1029/2012WR011894, 2012.
Zhang, J., Gilbert, D., Gooday, A. J., Levin, L., Naqvi, S. W. A., Middelburg, J. J., Scranton, M., Ekau, W., Peña, A., Dewitte, B., Oguz, T., Monteiro, P. M. S., Urban, E., Rabalais, N. N., Ittekkot, V., Kemp, W. M., Ulloa, O., Elmgren, R., Escobar-Briones, E., and Van der Plas, A. K.: Natural and human-induced hypoxia and consequences for coastal areas: synthesis and future development, Biogeosciences, 7, 1443–1467, https://doi.org/10.5194/bg-7-1443-2010, 2010.
Zhang, M., Krom, M. D., Lin, J., Cheng, P., and Chen, N.: Effects of a Storm on the Transformation and Export of Phosphorus Through a Subtropical River-Turbid Estuary Continuum Revealed by Continuous Observation, J. Geophys. Res.-Biogeo., 127, e2022JG006786, https://doi.org/10.1029/2022JG006786, 2022.
Zhang, Q., Fisher, T. R., Trentacoste, E. M., Buchanan, C., Gustafson, A. B., Karrh, R., Murphy, R. R., Keisman, J., Wu, C., Tian, R., Testa, J. M., and Tango, P. J.: Nutrient limitation of phytoplankton in Chesapeake Bay: Development of an empirical approach for water-quality management, Water Res., 188, 116407, https://doi.org/10.1016/j.watres.2020.116407, 2021.
Zheng, Y., Huang, J., Feng, Y., Xue, H., Xie, X., Tian, H., Yao, Y., Luo, L., Guo, X., and Liu, Y.: The Effects of Seasonal Wind Regimes on the Evolution of Hypoxia in Chesapeake Bay: Results from A Terrestrial-Estuarine-Ocean Biogeochemical Modeling System, Prog. Oceanogr., 103207, https://doi.org/10.1016/j.pocean.2024.103207, 2024.
Zhi, W., Feng, D., Tsai, W.-P., Sterle, G., Harpold, A., Shen, C., and Li, L.: From Hydrometeorology to River Water Quality: Can a Deep Learning Model Predict Dissolved Oxygen at the Continental Scale?, Environ. Sci. Technol., 55, 2357–2368, https://doi.org/10.1021/acs.est.0c06783, 2021.