
the Creative Commons Attribution 4.0 License.
the Creative Commons Attribution 4.0 License.
 | 08 Oct 2026
Technical note: How well do evapotranspiration partitioning approaches perform in moss-covered wetlands?

Richard M. Petrone
Lei Zhang
Evapotranspiration (ET) is the dominant hydrologic flux in wetlands, and partitioning into transpiration (T) and evaporation (E) is essential for understanding water and carbon dynamics, guiding sustainable water management practices, and predicting responses to climate change in these systems. However, the presence of moss layers and the dynamic hydrological condition in many wetlands challenges the assumptions of commonly used partitioning methods. This study evaluates ten eddy covariance (EC)-based ET partitioning approaches representing three methodological groups, namely high-frequency EC-based, ecosystem carbon-water coupling, and machine learning approaches, across four moss-covered wetlands in the boreal region and the Canadian Rocky Mountains. Evapotranspiration partitioning estimates were evaluated against independent measurement-based T : ET estimates derived from flux chambers, micro-lysimeters, sap flow sensors, and EC measurements, and against the ensemble mean of all ET partitioning approaches. Results showed that none of the evaluated approaches consistently outperformed the others across sites or under both flooded and non-flooded conditions, and no methodological group demonstrated a clear overall advantage. Evapotranspiration partitioning performance is likely influenced by the combined effects of multiple environmental and methodological factors, including moss cover, flooding conditions, canopy structure, ecosystem heterogeneity, EC measurement configuration and data quality, and the assumptions underlying each approach. In addition, the evaluation results are also influenced by the choice of reference dataset, which highlights the uncertainty associated with benchmarking ET partitioning methods. These findings suggest that applying multiple ET partitioning approaches concurrently, whenever possible, can help identify sources of uncertainty and potential errors. The study also highlights the need to develop wetland-specific ET partitioning approaches that better represent moss-mediated carbon uptake, dynamic carbon-water coupling, and transitions between unsaturated and flooded conditions.
- Article
(2481 KB) - Full-text XML
-
Supplement
(1123 KB) - BibTeX
- EndNote


Evapotranspiration (ET) represents the total water flux from terrestrial ecosystems to the atmosphere through vegetation transpiration (T) and direct evaporation (E) from canopy and ground surfaces. Distinguishing the contributions of T and E is important for understanding the terrestrial carbon cycle, as T is directly related to vegetation carbon assimilation processes (Jarvis and Mcnaughton, 1986; Farquhar et al., 1980; Farquhar and Sharkey, 1982). Despite its importance, there is a broad consensus within the biogeosciences community that accurately quantifying T and E, whether through direct measurements or computational methods, remains a challenge (Kool et al., 2014; Stoy et al., 2019; Nelson et al., 2020; Zahn et al., 2024). Briefly, directly quantifying T and E involves a combination of multiple field-based measurements, such as stable isotope analysis, lysimeters, porometers, flux chambers, sap flow measurements, and eddy covariance systems (Kool et al., 2014). These methods can be labor-intensive, require site-specific instrumentation, and are often constrained in both spatial (e.g., plot-scale) and temporal (e.g., depending on measurement frequency) resolutions (Albert-Saiz et al., 2025). In contrast, modelling approaches, especially the eddy covariance (EC)-based ET partitioning methods to partitioning ET into E and T at the ecosystem level, may be convenient and enable the exploration of temporal variability for estimating E and T at the ecosystem scale. However, they rely on assumptions that are ecosystem-dependent, require accurate parameterization, and model validation is not always available due to the lack of on-site measurements (Eichelmann et al., 2022; Zhou et al., 2016; Stoy et al., 2019). As reviewed by Stoy et al. (2019), these limitations highlight the need for ecosystem-scale experiments using multiple methods to measure E and T to understand their distinct responses to climate variability and change across diverse ecosystems and also to evaluate and refine the assumptions underlying ET partitioning approaches (Stoy et al., 2019).
Currently, research specifically addressing ET partitioning within wetland ecosystems remains notably scarce, even though wetlands, especially peatlands, are critical carbon sinks and play a critical role in regulating regional hydrology and global climate (Mitra et al., 2005; Leifeld and Menichetti, 2018; Strack et al., 2022; Frolking et al., 2006). Consequently, there is limited field data available to develop and evaluate reliable ET partitioning approaches for wetland ecosystems. Moreover, most of the existing studies have focused on hydroperiods where E mostly comes from standing water or saturated soils (Xu et al., 2011; Allen et al., 2017; Zhang et al., 2018; Hussey and Odum, 1992; Burba et al., 1999; Goulden et al., 2007; Kiniry et al., 2023; Bijoor et al., 2011; Eichelmann et al., 2022). However, it should be noted that many wetlands are not consistently in a saturated state (e.g., Jacobs et al., 2002; Wu et al., 2010; Kettridge et al., 2017; and Streich and Westbrook, 2020), which raises concerns about whether methods developed under flooded conditions can be applied reliably to non-flooded conditions or to estimate ET partitioning under changing environmental conditions. Furthermore, current studies report varying results regarding the dominance of T or E in wetland ET and their controlling environmental factors, which suggests that ET partitioning in wetland ecosystems is regulated by both structural properties including vegetation composition, density, and areas of open water, and environmental conditions such as climatic variables and water table (Goulden et al., 2007; Kiniry et al., 2023; Warren et al., 2018; Allen et al., 2017; Eichelmann et al., 2022; Admiral and Lafleur, 2007). Given that many ET partitioning approaches rely on assumptions about T dominance or dominant environmental controls, it remains uncertain if there is a universally reliable ET partitioning method for wetland ecosystems.
Despite the limited research focused specifically on wetlands, ET partitioning approaches are relatively abundant, particularly those based on EC data, as EC systems have been widely deployed across diverse ecosystems. Several of these EC-based methods have been tested across a range of ecosystems, including forests, grasslands, woody savannas, and croplands, and have shown broad applicability, not restricted to water-limited ecosystems (Yu et al., 2022; Nelson et al., 2020; Zhou et al., 2016; Li et al., 2019; Zahn et al., 2024). However, most of these methods have not been evaluated in wetlands. In fact, it cannot be guaranteed that these methods are suitable for wetlands, as the unique characteristics of wetlands, particularly moss-covered ground surfaces in many peatlands, may not only influence the evaporative response of the wetlands to environmental drivers (Speranskaya et al., 2024), but also violate key assumptions on which these ET partitioning approaches primarily rely. Specifically, mosses can photosynthesize and contribute to ecosystem carbon sequestration (Pacheco-Cancino et al., 2024; Street et al., 2013; Badorek et al., 2011; Kokkonen et al., 2022), but they do not contribute to T fluxes. This decoupling may violate the assumption in some methods that photosynthesis and T share identical sources and sinks. Moreover, most mosses cannot actively regulate water transport and water fluxes; instead, they rely on passive capillary rise to transport water (Proctor, 1982). When free capillary rise is limited by low soil-water pressures, the water potential of moss cells can rapidly equilibrate with the surrounding air, reducing both E and photosynthetic activity, even when atmospheric demand for evaporation remains high (Goetz and Price, 2015; McCarter and Price, 2012; Proctor, 1982; Kettridge and Waddington, 2013; Ketcheson and Price, 2013). In addition, mosses can absorb water directly from their surroundings through their leaves and stems, and store water equivalent to 300 % to 500 % of their dry weight for extended periods (Rouse, 2000; Bayfield, 1973). This remarkable water storage capacity, combined with their ability to rapidly equilibrate their water content with ambient humidity, helps conserve moisture in deeper soil layers during dry periods (Ketcheson and Price, 2013; Kettridge and Waddington, 2013), and cools the soil surface (Chen et al., 2019). These unique behaviors of mosses may therefore violate assumptions about key environmental controls on T or E fluxes, as well as the assumed relationships between carbon uptake and water exchange used by some methods to separate T and E fluxes.
Although the presence of mosses may violate some of the assumptions used in EC-based ET partitioning approaches, it is uncertain whether these violations render the methods completely unsuitable for wetland research, or whether these methods can still offer insights into the dynamics of T and E fluxes. Intuitively, the extent to which these violations affect the accuracy of EC-based ET partitioning approaches depends on the relative contribution of mosses to wetland gross primary production (GPP) compared to vascular plants at a given site. Although multi-site analyses have shown a positive correlation between peatland carbon assimilation and moss cover percentage (Strack et al., 2016; Pacheco-Cancino et al., 2024), quantitative data on moss contributions to ecosystem-level GPP remains extremely scarce. Limited evidence suggests that mosses can play a considerable role: for instance, a field study in a raised mire complex in southern Finland reported moss contributions to cumulative community-level photosynthesis of about 1.5 %, 35.2 % and 41.2 % in the undrained area in rich fen, poor fen, and bog, respectively (Kokkonen et al., 2022). Similarly, in a drained forested peatland dominated by moss on the forest floor, CO2 assimilation by the forest floor represented 20 % to 30 % of the forest's total CO2 uptake (Badorek et al., 2011). But these findings also indicate that while mosses can substantially contribute to ecosystem GPP, vascular plants generally dominate, accounting for over 50 % of the ecosystem GPP. Consequently, the presence of mosses may not markedly compromise the performance of EC-based ET partitioning methods. Regardless of these considerations, there remains a need to evaluate the performance of ET partitioning approaches in moss-covered wetlands.
The ET partitioning approaches discussed above, whose fundamental assumptions may be violated by the presence of moss cover, are all physically based methods. In contrast, machine learning (ML)-based ET partitioning methods have recently been developed for wetland ecosystems, and are based on assumptions that are, in principle, unaffected by the presence of mosses. For example, the approach proposed by Eichelmann et al. (2022) and subsequently extended by Stapleton et al. (2022) trained ML models to predict E using nighttime EC measurements under the assumption that nighttime T is negligible. Transpiration is then estimated as the difference between measured ET and the predicted E. These ML models performed well in four freshwater marshes in northern California. Their predicted E agreed closely with EC-derived ET during flooding periods and winter, when T was also assumed to be negligible (Stapleton et al., 2022; Eichelmann et al., 2022). In addition, Eichelmann et al. (2022) showed good agreement between model-estimated T and leaf-level T measurements of the two dominant plant species, tule and cattail.
Although the presence of mosses does not violate the assumption underlying these ML models, the assumption of negligible nighttime T may not be universally applicable across wetland ecosystems with different vegetation communities. Increasing evidence indicates that nighttime T occurs in a wide range of grasses, shrubs and trees (Daley and Phillips, 2006; Caird et al., 2007; Fisher et al., 2007), where it typically accounts for 10 %–30 % of the total daily T (Novick et al., 2009). Furthermore, nighttime EC measurements are generally subject to greater uncertainty because of weak atmospheric turbulence and reduced mixing within the nocturnal boundary layer (Baldocchi, 2003; Aubinet et al., 2012). Although nighttime T may indeed be small relative to E in many wetlands as suggested in Eichelmann et al. (2022), this assumption has not been directly validated. Moreover, these ML approaches have so far been evaluated only in four freshwater marshes, and their applicability to other wetland types remains uncertain. Despite these limitations, ML approaches have emerged as powerful tools in Earth system science because of their ability to identify complex, nonlinear relationships between environmental drivers and target variables without requiring explicit process-based formulations (Reichstein et al., 2019). Therefore, although this study primarily focuses on ET partitioning approaches whose underlying assumptions may be challenged by the presence of moss cover, ML-based approaches are also included to assess their robustness and general applicability in wetland ecosystems.
The overall objective of this study is to evaluate the performance of existing EC-based ET partitioning methods in moss-covered wetlands. Specifically, we address the following research questions: (1) Is there any ET partitioning approach that consistently outperforms the others across different wetland sites? (2) Do these approaches perform well under both flooded and non-flooded conditions? (3) Do ML-based approaches outperform physically based approaches? And (4) What factors influence the performance of ET partitioning approaches in the studied wetlands?
2.1 Overview of eddy covariance-based evapotranspiration partitioning approaches considered
Evapotranspiration partitioning approaches selected for this study were chosen based on three criteria: (1) they rely primarily on EC-based CO2 and H2O fluxes, (2) focus on the ecosystem level with daily or finer temporal resolution, are not restricted to water-limited conditions, and (3) have publicly available formulations or programming codes. Based on these criteria, ten methods were selected for evaluation (Table 1). Several existing approaches were excluded, including the method of Wei et al. (2017), which was not developed for daily or finer temporal scales; the methods of Scott and Biederman (2017) and Reich et al. (2024), which were developed for water-limited ecosystems; Rigden et al. (2018), which primarily relies on weather data rather than EC-based measurements; and Eichelmann et al. (2022), for which no source code is available.
To the best of the authors' knowledge, the ET partitioning methods evaluated in this study cover most of the existing EC-based approaches. Based on the type of EC data they utilize, either high-frequency measurements or fluxes aggregated to a half-hourly timestep, and the partitioning formulations they employed, either ecosystem carbon-water coupling or machine learning based, these approaches are grouped into three categories: (1) high-frequency EC data-based methods (Group 1), (2) ecosystem carbon-water coupling methods (Group 2), and (3) machine learning (ML) methods (Group 3). These approaches and their required data and limitations for application in moss-covered wetland ecosystems are summarized in Table 1. Note that the Transpiration Estimation Algorithm (TEA) is based on both the ecosystem carbon-water coupling and the Random Forest model which is an ML algorithm. Consequently, TEA is classified as both a Group 2 and Group 3 approach.
It should also be noted that Group 3 does not represent a collection of individual ET partitioning methods, but rather a framework developed by Stapleton et al. (2022) that comprises seven ML algorithms. The framework identifies the best performing machine learning algorithm from the candidate models, determines the optimal combination of predictor variables, and ranks these variables according to their importance to predictive accuracy. It extends the ET partitioning approach proposed by Eichelmann et al. (2022), who applied an artificial neural network (ANNs) to partition ET. Although the ANN model and its source code are not publicly available, the underlying assumptions governing ET partitioning are consistent between the two studies.
The seven candidate ML algorithms included in the Stapleton et al. (2022) framework are Linear Regression, Ridge Regression, K-nearest Neighbors, Decision Trees, Gradient Boosting Decision Trees, LightGBM and XGBoost (Stapleton et al., 2022). Following the procedure described by Stapleton et al. (2022), only the ET partitioning predictions generated by the best-performing model identified by this framework were retained for evaluation in this study. Details of the performance of each candidate ML model and the rankings of the importance of the predictor variables are provided in Sect. S1 of the Supplement.
Table 1Overview of data requirements and potential limitations of eddy covariance (EC)-based evapotranspiration (ET) partitioning methods in moss-covered wetlands. Group 1 includes methods using high-frequency EC data, Group 2 and Group 3 includes methods using EC data aggregated at specific timesteps.
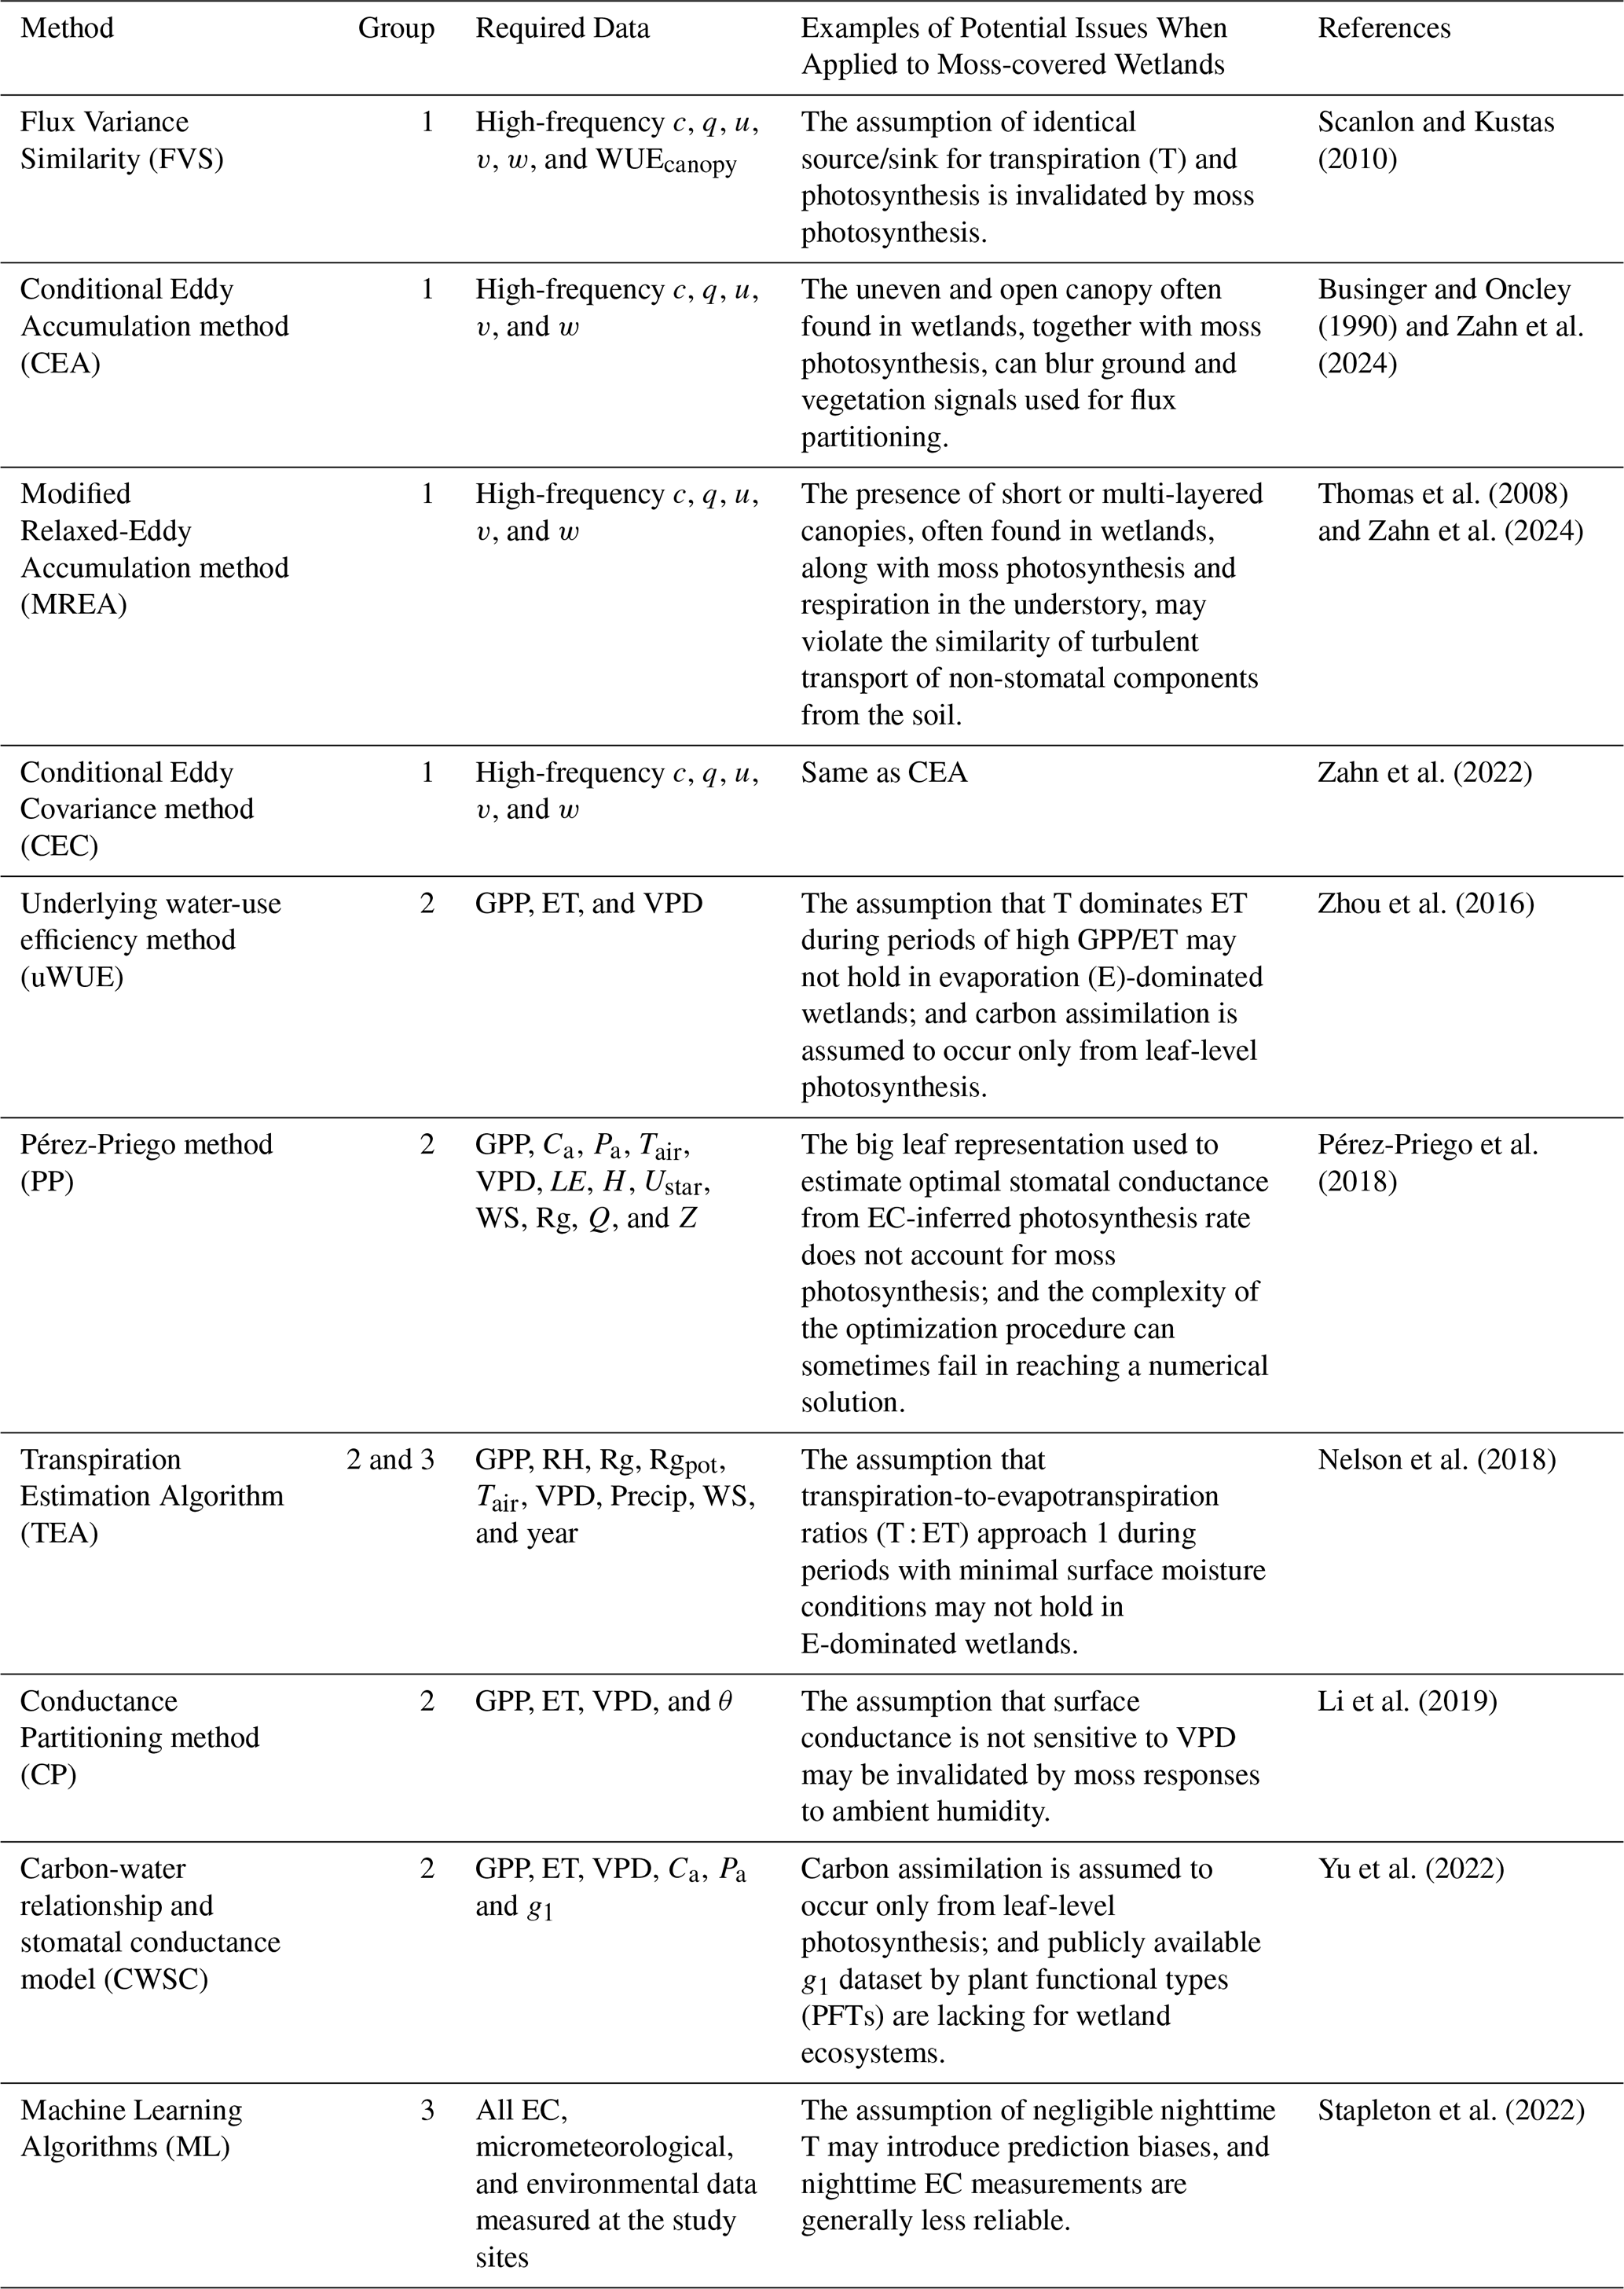
Note: c: high-frequency CO2 concentration; q: high-frequency H2O concentration; u: high-frequency streamwise wind speed, v: high frequency cross-stream wind speed; w: high frequency vertical wind speed; WUEcanopy: canopy-level water-use efficiency; GPP: ecosystem gross primary production; ET: ecosystem evapotranspiration; VPD: vapor pressure deficit; Ca: mean atmospheric CO2 concentration; Pa, atmospheric pressure; Tair, air temperature; LE: latent heat flux; H: sensible heat flux; Ustar: friction velocity; WS: mean wind speed; Rg: incoming shortwave radiation; Q: photosynthetic active radiation; Z: altitude; RH: relative humidity; Rgpot: daily potential radiation; Precip: precipitation; θ: soil moisture; g1: a parameter in the optimal stomatal conductance model. Some required variables differ from those listed in the original publications and instead reflect the data inputs used in the publicly available codes provided by the authors of each method. Specifically, the FVS, CEA, MREA and CEC methods were applied using the ET partitioning code developed by Zahn (2024); the PP method by Pérez-Priego and Wutzler (2018); the uWUE and TEA methods by Nelson (2020); the CWSC method by Jiang and Yu (2021); and the ML method by Stapleton (2022). Please refer to the corresponding references for further details.
2.2 Study sites
The best way to evaluate the ET partitioning approaches is by comparing their outputs to direct field measurements. However, to the best of the authors' knowledge, no publicly available datasets exist for wetland ET and its components. Therefore, we compiled data from four sites where field measurements of ET and its components had previously been conducted.
The first three sites, Sibbald, Burstall, and Bonsai, are located in the Canadian Rocky Mountains, where field measurements were conducted during the 2021 growing season. The fourth site, Poplar, is situated in the western boreal plain near Fort McMurray, Alberta, Canada, and its field measurements were conducted during the 2013 growing season. Among the four sites, only Sibbald and Poplar are peatlands. The study sites have been extensively described in detail in previous publications (Wang and Petrone, 2022; Wang et al., 2023; Wang, 2025; Gabrielli, 2016; Hathaway et al., 2022; Hrach et al., 2021; Streich and Westbrook, 2020; Morison et al., 2021); therefore, only the characteristics relevant to this study are briefly provided here. The geographic coordinates, wetland type, elevation, meteorological conditions during the study period, soil properties, water table depth, vegetation composition, and instrumentation used to measure evapotranspiration and its components are summarized in Table 2.
These sites are covered by mosses. At Sibbald, the moss layer is approximately 5 mm thick and includes species such as Aulacomnium palustre (Hedw.) Schwaegr., Bryum pseudotriquetrum (Hedw.) Gaertn. et. al., Calliergon giganteum (Schimp.) Kindb., Calliergon richardsonii (Mitt.) Kindb. in Warnst., Campylium stellatum (Hedw.) C. Jens., Hypnum lindbergii (Mitt.), Plagiomnium ellipticum (Brid.) T. Kop., Pohlia nutans (Hedw.) Lindb., and Warnstorfia fluitans (Hedw.) Loeske (Lei, 2021). At Burstall, the moss layer, about 1 cm thick, is dominated by peat moss (Sphagnum spp.) and feather moss (Eurhynchium spp.). At Bonsai, the moss cover consists primarily of brown moss (Tetrodontium spp.) with a thickness of up to 5 mm. At Poplar, the moss layer is around 2.5 cm thick (Goetz and Price, 2015), dominated by Tomenthypnum nitens (Hedw.) Loeske and Aulacomnium palustre (Hedw.). It is important to clarify that the moss layer in this study refers mainly to the photosynthetically active (green) components of the mosses, including their shoots and capitula.
Although all sites are moss-covered wetlands, they differ considerably in meteorological conditions, water table levels, vegetation composition, and canopy structure (Table 2 and Fig. S3). During the study period, the growing season LAI was 4.56, 1.64, 1.33 and 2.82 for Sibbald, Burstall, Bonsai and Poplar, respectively, with the value at Poplar representing the tree canopy only. The average canopy height was 1.6 m for Sibbald and Burstall, 0.8 m for Bonsai and 4.2 m for Poplar. Notably, Sibbald and Bonsai remained under non-flooded conditions throughout the study period, whereas Burstall transitioned to flooded conditions after August 17, 2021. In contrast, Poplar remained flooded for almost entire study period. The water table dynamics and meteorological conditions for each study site during the respective study period are shown in Fig. S4.
Table 2Summary of site characteristics, including geographic coordinates, wetland type, altitude, meteorological conditions during the study period, soil properties, water table depth, vegetation composition, instrumentation used for measuring evapotranspiration and its components, and the study period.
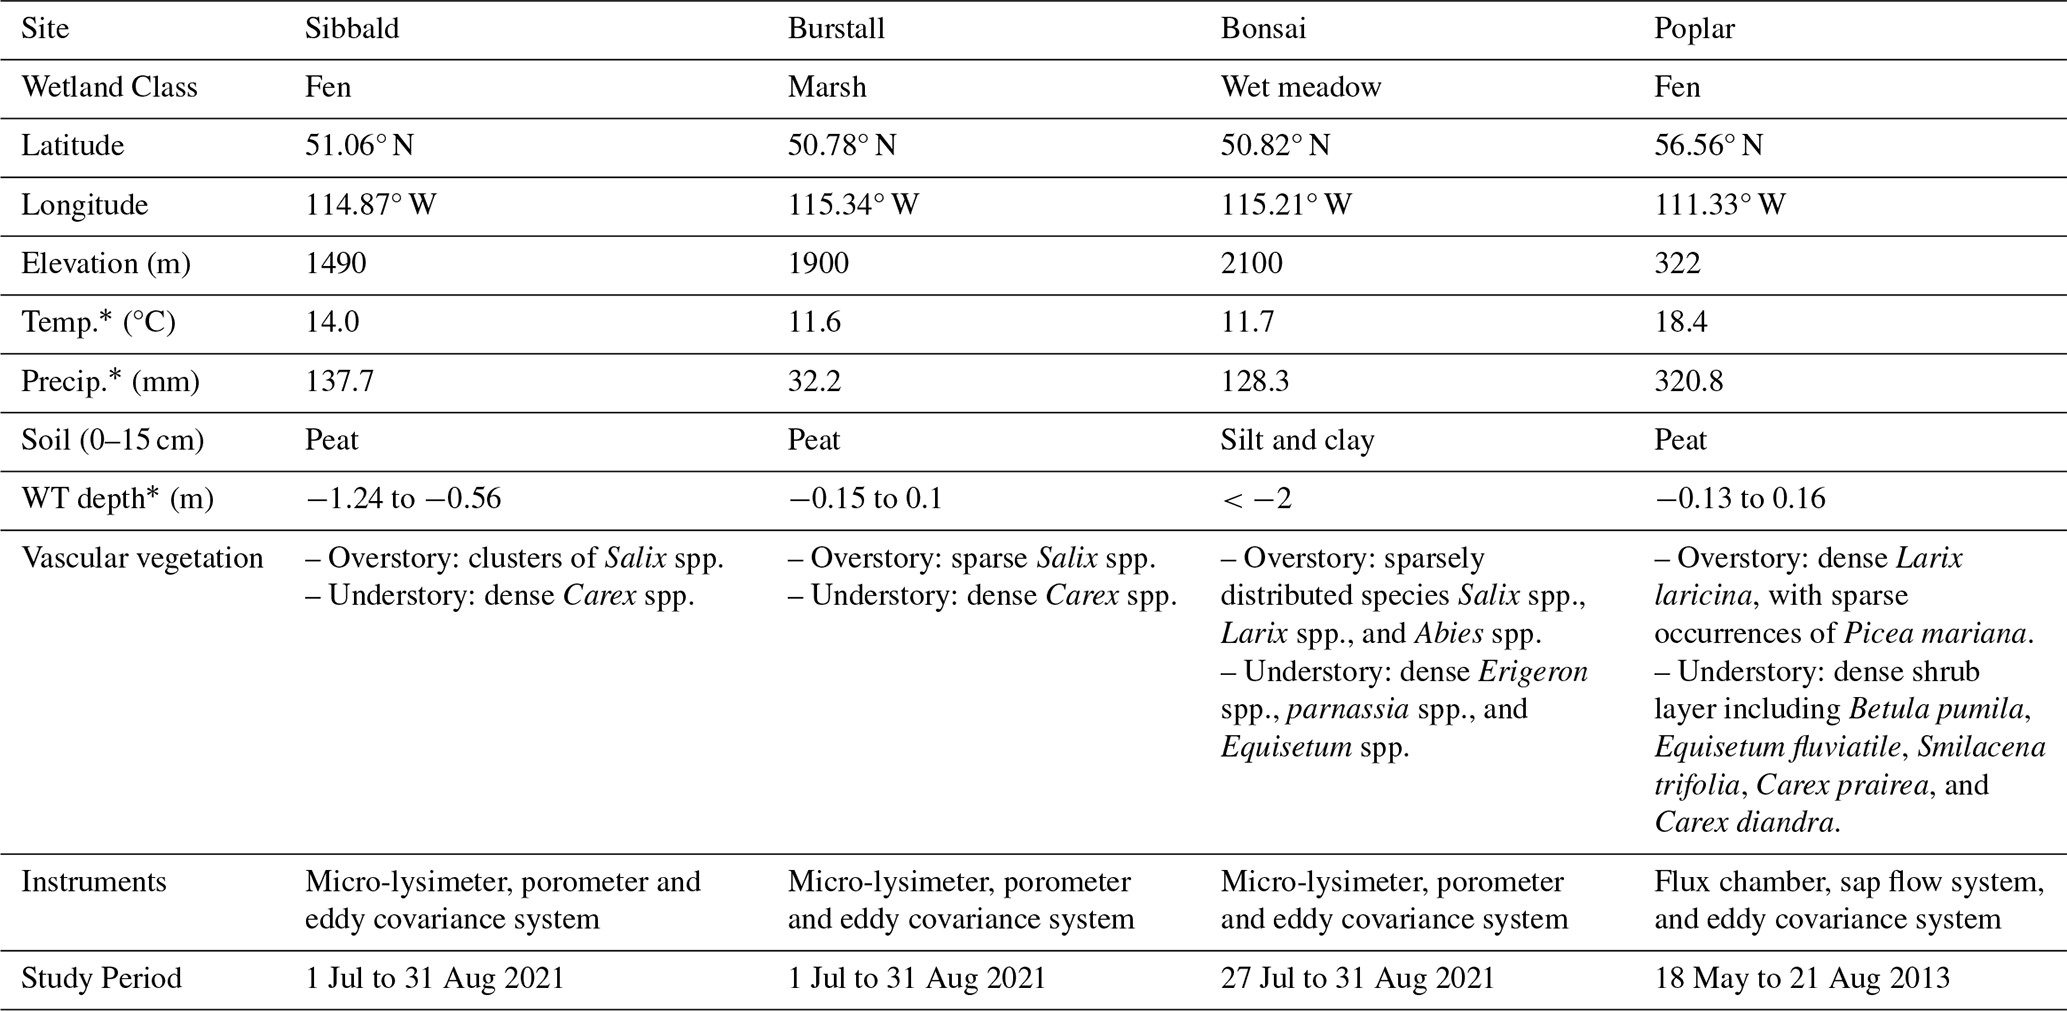
Note: Elevation is the elevation above sea level (in meters). Temp* represents the mean air temperature during the measurement period, and Precip.* is total precipitation during the same period. Soil describes the dominant soil type within the top 15 cm where micro-lysimeters were installed. WT depth* represents the mean water table position relative to the ground surface during the study period, calculated from all available monitoring wells. Negative values indicate that the water table was below the ground surface, whereas positive values indicate flooded conditions (i.e., the water table was above the ground surface). Instruments summarize the main equipment used to measure or estimate E, T and ET at each site. The study period for Bonsai begins on 27 July because the EC system malfunctioned before that date.
2.3 Field measurements of evaporation, transpiration and evapotranspiration
Ecosystem-scale water and carbon fluxes at all sites were measured by EC systems operating throughout the respective measurement periods. The ratio of EC measurement height to canopy height () is 1.88 at Sibbald, 1.25 at Burstall, 3.75 at Bonsai, and 1.55 at Poplar. EC data processing followed common FLUXNET protocols (Kaimal and Finnigan, 1994; Foken and Leclerc, 2004; Aubinet et al., 2012; Burba et al., 2012; Leuning and Judd, 1996; Webb et al., 1980; Pastorello et al., 2020). Latent heat flux (LE) was gap-filled using the MDS method (LE_F_MDS). Note that GPP is a required input for many ET partitioning approaches. In this study, it was estimated from EC-measured net ecosystem exchange (NEE_VUT_USTAR50) using the nighttime flux partitioning method described by Reichstein et al. (2005).
In addition to EC measurements, E at Sibbald, Burstall and Bonsai was measured using micro-lysimeters on six separate occasions during July and August in 2021, with each measurement period lasting mostly 2 to 4 d (Wang et al., 2023; Wang and Petrone, 2022). Stomatal conductance of the dominant vascular vegetation (Table 2) at these three sites were measured by leaf porometer (Wang, 2025). At the Poplar site, transparent flux chambers and sap flow systems were used to measure ground E and canopy T during the 2013 growing season (Gabrielli, 2016). These measurements were conducted within the EC footprint of each site. Detailed descriptions of site characteristics, field measurements, instrumentation, and the upscaling of plot-level data to estimate ecosystem-level daily transpiration-to-evapotranspiration ratios (T : ET) are provided in Wang (2025) and Gabrielli (2016). The errors and uncertainties of the measurements of E, T and ET are summarized in Table S4.
2.4 Reconstruction of daily ecosystem-scale measurement-based evapotranspiration partitioning time series
For the Sibbald, Burstall, and Bonsai sites, the measurement-based T : ET time series are derived from a site-calibrated and validated Shuttleworth–Wallace (S–W) model rather than direct averaging of ground E measurements. This approach was necessary because micro-lysimeters measure ground E over multi-day intervals, whereas EC measurements of ET at the study sites are subject to intermittent data gaps. Using calibrated S–W model enabled the reconstruction of a continuous daily T : ET time series and characterization of its temporal variation.
The detailed calibration of the S–W model for each study site, together with the development of a surface resistance formulation that explicitly accounts for the effects of moss and litter on ground E and its incorporation into the S–W model, are described in previous publications (Wang et al., 2023; Wang, 2025). The performance of the calibrated S–W model is further summarized in Sect. S3 of the Supplement. Overall, the model accurately reproduced both latent heat flux (LE) and ground E across the study sites. Because the S–W model is based on the surface energy balance, its predicted LE was evaluated against the energy balance-corrected EC measurements (LE_CORR). Across all sites, the relationship between modelled and measured LE was given by LE_modelled = 0.97 × LE_CORR + 2.23 W m−2 (R2=0.83). Agreement between modelled and measured ground E (W m−2, expressed as λE) was similarly strong, with λE_modelled = 0.91 × λE_measured − 4.46 W m−2 (R2=0.85). These results support the use of the S–W model-reconstructed T : ET time series as the measurement-based, ecosystem-scale daily T : ET for the three study sites.
At the Poplar site, the measurement-based T : ET time series was constructed differently from the other three sites, as this site includes direct EC-based ET measurements and upscaled sap flow measurements for dominant tree and understory species, informed by forest inventory data and LiDAR-based vegetation classification, as well as ground-based chamber flux measurements (Gabrielli, 2016). Ground E was calculated as the residual (ET minus upscaled site-level T) and evaluated against chamber measurements dominated by moss. This comparison yielded a regression slope of 0.96, an intercept of 0.08 mm h−1, and an R2 of 0.26 (Fig. S6). Because both T and ET were measured at the same timestep, whereas chamber measurements are instantaneous and inherently variable, we used the sap-flow-derived T together with EC-based ET to construct the Poplar T : ET time series. We acknowledge the relatively low R2, which reflects the high variability in the chamber measurements, but the near-unity slope and small intercept indicate good overall agreement. On this basis, we consider the reconstructed T : ET time series to be a reasonable representation for this study site.
2.5 Data quality control procedure
Given the measurement techniques described above, it is important to clarify that E in this study represent only ground evaporation. However, during rainy periods, E can occur from leaf surfaces. Excluding this canopy E may introduce bias in estimating ecosystem-scale ET partitioning into E and T. To minimize this potential bias, all methods except for the CP method exclude rainy days and 1 to 2 d afterward, following the precipitation and potential evapotranspiration (PET)-based criteria described in Zhou et al. (2015) and Yu et al. (2022). Specifically, if PET < Precip < 2PET, 1 d after a rainy day was excluded, if Precip > 2PET, 2 d were excluded. PET was estimated using the Priestley–Taylor equation (Priestley and Taylor, 1972). For the CP method, data screening follows its original protocol, which removes data during rainy hours and the 6 h following rainfall (Li et al., 2019).
In addition to excluding rainy periods, all methods were prescreened to include only data from the growing season, during daytime hours, and under conditions where net radiation, GPP, LE, H and VPD were greater than zero. Half-hourly EC fluxes data with poor quality (i.e., the quality flag (QC) > 1) were removed. For the CP method, additional filters were applied by excluding data with RH above 0.95, and by retaining only those periods where H exceeded 5 W m−2 and Rg exceeded 50 W m−2 (Li et al., 2019).
When aggregating half-hourly ET partitioning results to daily values, only days with more than 10 valid half-hourly values were included, following the procedure in Yu et al. (2022). Additionally, any half-hourly T : ET values that were negative or greater than 1 were excluded prior to daily aggregation.
2.6 Evaluation of evapotranspiration partitioning approaches
Direct measurements of ET components offer an independent means to evaluate the performance of ET partitioning approaches. However, this study does not focus on comparing exact magnitudes of T : ET between measurement-based estimates and those derived from ET partitioning approaches. This is because most field measurements were conducted at the plot level, and upscaling to the ecosystem level introduces uncertainties, as a wetland is a mosaic of diverse habitats with varying extents of vegetation cover, open water, and exposed bare soil (Drexler et al., 2004), which makes spatial upscaling very challenging. In peatlands, such complexity is further increased by micro-topographical features, such as hummocks (local high points) and hollows (local low points), which have been shown to influence ground E processes (Wang and Petrone, 2022).
In addition, the temporal resolution of measurements varies across methods. For example, flux chamber and porometer measurements provide instantaneous variables during daytime, whereas micro-lysimeters measurements in this study operated over multiple days, which yields averaged daily values. Reconstructing daily T : ET at the ecosystem level from these different measurements introduces additional biases. Moreover, all Group 2 ET partitioning approaches, strictly speaking, fundamentally rely on the coupling between carbon and water fluxes during the daytime period when photosynthesis takes place. Consequently, their ET partitioning results may not precisely align with measurements that include the nighttime period.
Furthermore, some required input variables were not directly measured and had to be approximated, which also introduces uncertainties. For example, the FVS method requires canopy-level water-use efficiency (WUEcanopy) as input, and its outputs are sensitive to the estimates of this parameter (Sulman et al., 2016). However, direct measurements of WUEcanopy and intercellular CO2 concentration to estimate WUEcanopy were unavailable, as a result, the optimization method proposed by Scanlon et al. (2019) was used to estimate WUEcanopy. But this method is more appropriate for light-saturating conditions (Scanlon et al., 2019), which may not always occur. The FVS method that uses estimated WUEcanopy from this optimized method is hereafter referred to as FVSopt. The CWSC method requires the parameter g1, which is not readily available for wetland ecosystems. Since most wetland plants are C3 species and mosses also follow a photosynthesis pathway similar to C3 plants (Aro and Gerbaud, 1984), g1 values for each site were derived from the reported values for C3 species based on a moisture index (MI) of each site, following Lin et al. (2015). Specifically, Sibbald and Burstall have MIs of 0.77 and 0.72, respectively, and were therefore both given a g1 value of 4.69 kPa0.5. Bonsai, with an MI of 5.38, was assigned a g1 value of 4.02 kPa0.5. Poplar, with an MI of 0.48, was given a g1 value of 3.77 kPa0.5. However, these estimates may not accurately represent the actual g1 at the site, which potentially affects model performance.
Given those limitations, this study emphasizes evaluating whether T : ET values derived from partitioning approaches are broadly consistent with measurement-based estimates and exhibit similar temporal dynamics. Therefore, the coefficient of determination (R2) was selected as the primary evaluation metric, following Eichelmann et al. (2022) and Stapleton et al. (2022), to quantify how well the predicted T : ET follows the overall pattern of the measurement-based estimates. Values of R2 closer to 1 indicate better agreement in their temporal dynamics of T : ET. In addition, the Nash–Sutcliffe model efficiency coefficient (NSE) was included to provide a complementary assessment of model performance. An NSE value of 1 indicates perfect agreement between predictions and measurements, a value of 0 suggests the model performs no better than the observed mean, and negative values imply the observed mean is a better predictor than the model.
Finally, because the measurement-based daily T : ET time series may be subject to measurement and upscaling uncertainties, model performance was also evaluated against the ensemble mean of all ET partitioning approaches, as ensemble averaging can reduce the influence of method-specific errors and thus provide a more stable and robust reference than any individual approach (Dietterich, 2000). For each day, the ensemble mean was calculated as the average of all available model predictions of T : ET and is hereafter referred to as the all-method ensemble. In addition, ensemble means were calculated separately for each method group, referred to as the HF ensemble (Group 1 ensemble), CW ensemble (Group 2 ensemble), and ML ensemble (Group 3 ensemble). These three group-specific ensembles were evaluated against both the measurement-based T : ET time series and the all-method ensemble to assess whether any group of ET partitioning approaches consistently outperformed the others.
It should be noted that E measured by the micro-lysimeters was not compared with E derived from the ensemble mean because the ensemble mean was derived from model predictions after applying the rainy-day exclusion procedure, whereas the micro-lysimeter measurements represented cumulative evaporation over multiple days, some of which included rainfall events (Table S3 and Fig. S4). Consequently, ensemble mean estimates were unavailable for portions of the micro-lysimeter observation periods. This mismatch in temporal coverage prevented a robust direct comparison. Since the measurement-based T : ET was independently validated against site measurements (Sects. S3 and S4 of the Supplement), comparing the ensemble mean with the measurement-based T : ET provides an indirect assessment of how well the ensemble mean agrees with the observations.
3.1 Evaluation of the high-frequency eddy covariance-based methods (Group 1)
The daily T : ET estimates derived from the Group 1 approaches, which are based on high-frequency EC measurements, are presented in Fig. 1. The measurement-based daily T : ET time series and the ensemble mean of all ET partitioning approaches are also shown for comparison. As shown in Fig. 1, the daily T : ET estimates produced by the Group 1 approaches do not always closely match either the measurement-based values or the overall ensemble mean. Likewise, the measurement-based values and the overall ensemble mean do not always agree, which reflects the uncertainty associated with both the reconstruction of the measurement-based T : ET time series and the ET partitioning approaches. Across four sites, the mean T : ET of the overall ensemble exceeds the mean of the measurement-based T : ET by 10.4 %. The mean T : ET of the Group 1 ensemble is even higher, exceeding the mean measurement-based daily T : ET by 18.4 %. Relative to the mean of all method ensemble, the mean of Group 1 ensemble is 5.3 % higher.
Among the Group 1 approaches, MREA and CEC generally produce the highest daily T : ET estimates, whereas CEA consistently produce the lowest. Across four sites, the mean T : ET estimated by MREA exceeds the mean measurement-based by 26.4 %, followed by CEC (18.3 %). In contrast, the mean T : ET estimated by CEA is only 0.17 % lower than the mean measurement-based values. FVSopt produces intermediate T : ET estimates among the four Group 1 approaches. The relatively lower T : ET estimates from FVSopt compared with MREA are consistent with the findings of Klosterhalfen et al. (2019b), who compared the FVS and MREA approaches across multiple ecosystems. They reported that FVS tends to overestimate the soil flux component (higher soil evaporation and thus lower T : ET), whereas MREA tends to underestimate the soil flux component.
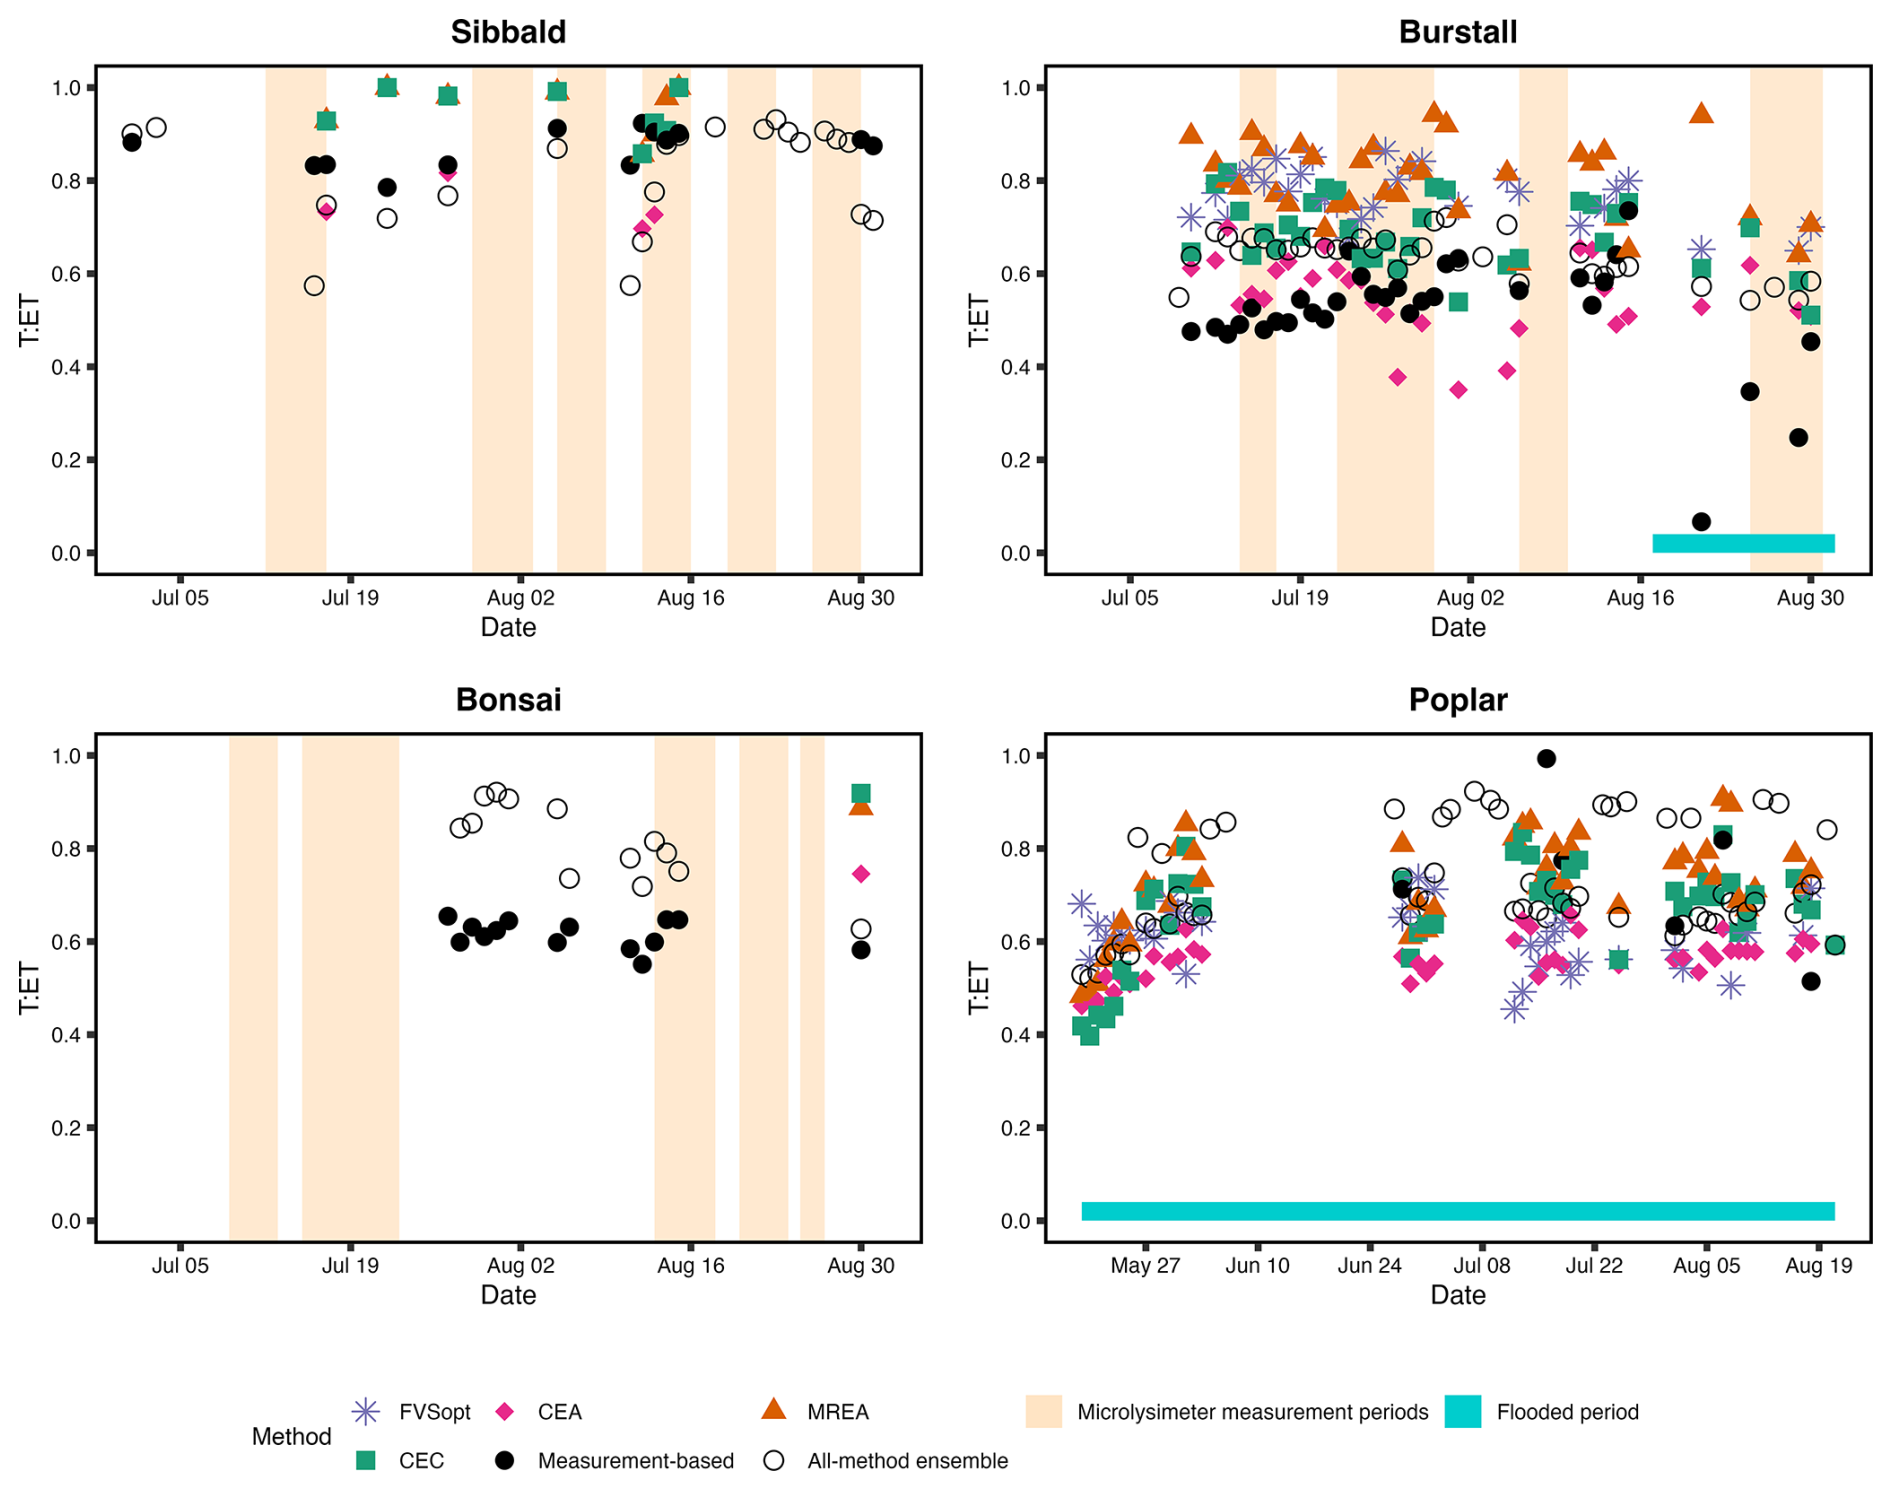
Figure 1Comparison of transpiration-to-evapotranspiration ratio (T : ET) from the high-frequency eddy covariance-based methods (Group 1) with the measurement-based values (black circles) and the ensemble mean of all evapotranspiration partitioning approaches (open circles) for the four study sites. The light beige shading indicates periods during which ground evaporation was measured using micro-lysimeters at Sibbald, Burstall and Bonsai. The cyan bars at the bottom of the Burstall and Poplar panels indicate flooded periods. The FVSopt method was excluded from the Sibbald analysis because it did not produce realistic T : ET values. Although FVSopt generated realistic T : ET estimates at Bonsai, no data remained after the exclusion of rainy periods.
The R2 and NSE values for the four Group 1 approaches are presented in Table 3. Regardless of whether the approaches are evaluated against the measurement-based T : ET or the ensemble mean of all ET partitioning approaches, no single Group 1 approach consistently outperforms the others across all four study sites. Furthermore, most approaches perform no better than using the observed mean as the predictor, as indicated by the predominantly negative or near zero NSE values (Table 3). In terms of capturing the temporal variability of T : ET, as indicated by R2, CEA performs best at Sibbald when evaluated against the measurement-based T : ET, whereas FVSopt performs best at both Burstall and Poplar, and MREA performs best at Bonsai. The Group 1 ensemble mean does not outperform the best individual approach at any of the study sites. When evaluated against the ensemble mean of all ET partitioning approaches, MREA remains the best-performing approach at Sibbald, FVSopt continues to perform best at Burstall, and CEC achieves the highest R2 at Poplar. The Group 1 ensemble mean outperforms the individual Group 1 approaches only at Poplar.
Table 3Comparison of coefficient of determination (R2) and Nash-Sutcliffe efficiency (NSE) values for each Group 1 approach and the Group 1 ensemble mean (HF ensemble) relative to the measurement-based transpiration-to-evapotranspiration ratio (T : ET) and the ensemble mean of T : ET from all ET partitioning approaches.
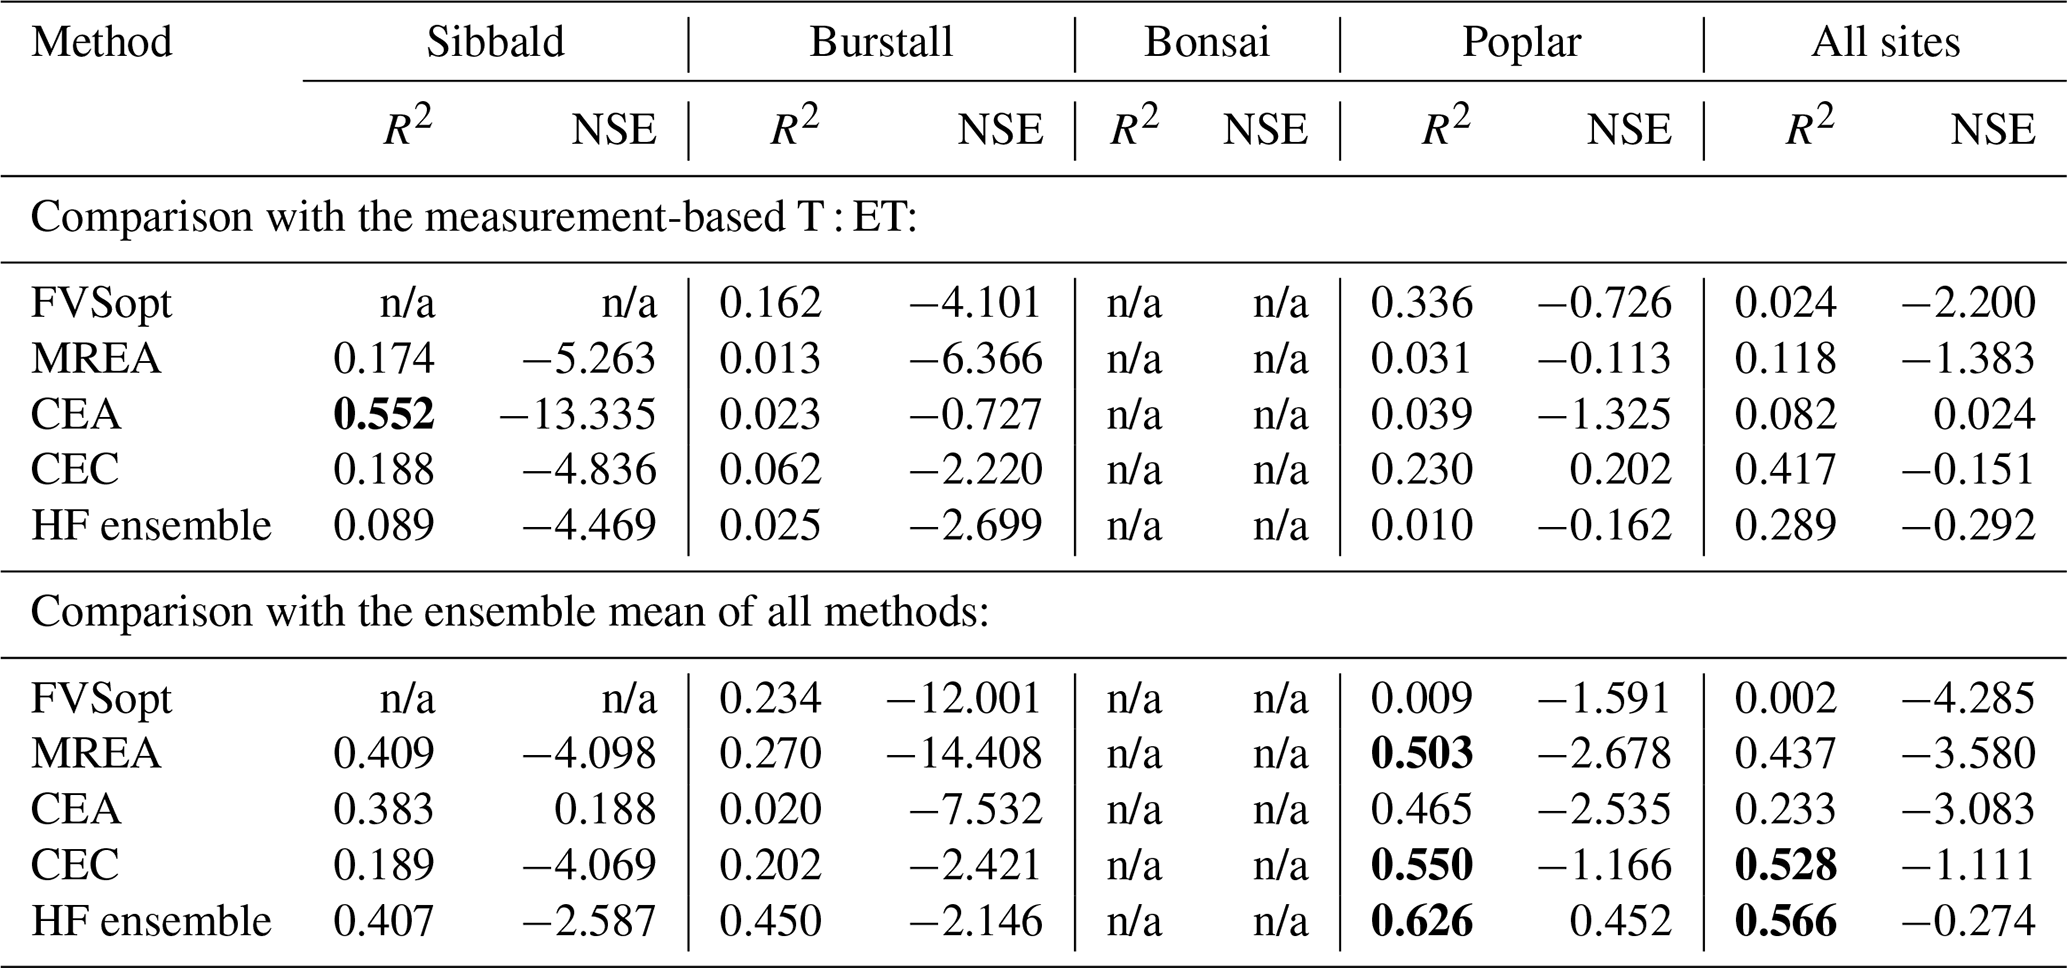
Note: Any R2 or NSE value greater than 0.5 is shown in bold. n/a: not applicable.
The performance of the Group 1 approaches has previously been shown to depend on site characteristics. For example, Klosterhalfen et al. (2019b) found that the performance of FVS decreases with increasing measurement height to canopy height ratio () and leaf area index to canopy height ratio (), but improves with increasing canopy height (h) and measurement height (z). This finding may partly explain the poor performance of FVSopt at Sibbald and Bonsai, where both and were substantially higher than at the other two sites and few physically realistic T : ET estimates were obtained. For MREA, Klosterhalfen et al. (2019b) reported that its performance is more strongly influenced by canopy structural characteristics, including h, LAI, and canopy gaps. More generally, they suggest that site characteristics increasing scalar dissimilarity, such as reduced turbulent mixing, greater source-sink separation, coherent turbulent structures, and ejection events, tend to improve the performance of both the FVS and MREA approaches (Klosterhalfen et al., 2019b).
To further examine how the performance of the Group 1 approaches is related to site characteristics, Spearman correlation analyses were conducted between site characteristics (canopy height, h; measurement height, z; LAI; ; ; moss thickness; and mean water table depth, WTD) and the R2 and NSE values of each Group 1 approach, as well as the Group 1 ensemble mean, relative to both the measurement-based T and the ensemble mean of all ET partitioning approaches. No significant correlations were identified between any site characteristic and the performance metrics. However, this result should be interpreted with caution because only three sites were available for the correlation analysis (Table 3), which results in very limited statistical power.
Although no clear relationships between site characteristics and model performance were identified in this study, Zahn et al. (2024) extended the work of Klosterhalfen et al. (2019b) by evaluating all the Group 1 methods and suggested that the Group 1 methods tend to be more reliable under specific conditions: no strong vertical stratification or convection, EC sampling height near the canopy top (i.e., ), moderate or low LAI, and the canopy does not have gaps that are too wide. Based on these criteria, the Group 1 methods would be expected to perform better at Burstall and Poplar than Sibbald and Bonsai. Nevertheless, considerable disagreement among the four approaches remains at both sites. At Burstall, the spread of daily T : ET estimates ranges from 0.10 to 0.42 across the study period, and at Poplar it ranges from 0.09 to 0.39, indicating substantial uncertainty in the Group 1 predictions even under conditions considered favorable for their application. Furthermore, Burstall transitions to flooded conditions after 17 August, during which the measurement-based T : ET exhibits a marked decline. In contrast, the T : ET estimates from the Group 1 approaches show only a slight decrease, suggesting that their predictive performance deteriorates under flooded conditions. However, a similar mismatch is not observed at Poplar, which remains flooded throughout the entire study period. At Poplar, the four Group 1 approaches produce relatively consistent T : ET estimates despite the persistent flooding. One possible explanation is the difference in vegetation structure between the two sites. Poplar is a densely forested wetland, whereas Burstall is dominated by shrubs with a lower and more open canopy. This observation suggests that the predictive performance of the Group 1 approaches may be more uncertain in waterlogged wetlands with sparse vegetation cover than in densely forested wetlands. Further evaluation across a broader range of wetland types is needed to confirm this hypothesis.
3.2 Evaluation of the ecosystem carbon-water coupling methods (Group 2)
The daily T : ET estimates derived from the Group 2 approaches (uWUE, PP, TEA, CP, and CWSC) are presented in Fig. 2. Compared with the measurement-based T : ET and the ensemble mean of all ET partitioning approaches, the Group 2 approaches exhibit a considerably wider spread of daily T : ET estimates and generally larger temporal fluctuations. Nevertheless, the Group 2 ensemble mean shows closer agreement with both reference datasets than the Group 1 ensemble mean. Across all four sites, the mean T : ET of the Group 2 ensemble exceeds the mean measurement-based T : ET by only 0.32 % and is 5.01 % lower than the overall ensemble mean.
Although no single Group 2 approach consistently produces the highest or lowest T : ET across all four study sites, several systematic patterns emerge. The Perez-Priego (PP) method consistently produces the lowest T : ET estimates, whereas CP generally produces T : ET values that are comparable to or higher than the measurement-based values. Among the five approaches, uWUE exhibits the largest temporal fluctuations, while TEA generally predicts higher T : ET than CWSC. Relative to the measurement-based T : ET, TEA overestimates T : ET by 17.44 % across four sites, followed by CWSC (13.07 %), CP (11.45 %), and uWUE (0.43 %), whereas PP underestimates T : ET by 167.84 %. Relative to the overall ensemble mean, CP overestimates T : ET by 10.39 %, followed by TEA (3.84 %), whereas uWUE, CWSC, and PP underestimate T : ET by 7.31 %, 7.65 %, and 67.71 %, respectively.
Notably, TEA is the only method that captures the sharp decline in T : ET observed at Burstall after August 17, when the site became flooded. In contrast, PP substantially underestimates T : ET and exhibits contrasting temporal trends relative to the measurement-based values at Sibbald and Burstall. This observation is different from the findings in Nelson et al. (2020) who reported similar results between the PP and uWUE methods. The exact cause of this bias remains unclear. However, since other methods align more closely and PP is the only method in this group that requires photosynthetically active radiation (Q) as an additional input, the discrepancy is likely related to this variable. It is possible that Q measured at a single location may not adequately represent canopy-level conditions, potentially due to the uneven and multi-layered canopy structures in these study sites (Fig. S3). Another potential explanation is that the PP method's E component may include not only ground E but also canopy E (e.g., dewfall), as suggested by Pérez-Priego et al. (2018). This inclusion of canopy E could result in lower T : ET. However, this hypothesis could not be tested in the present study and requires further investigation.
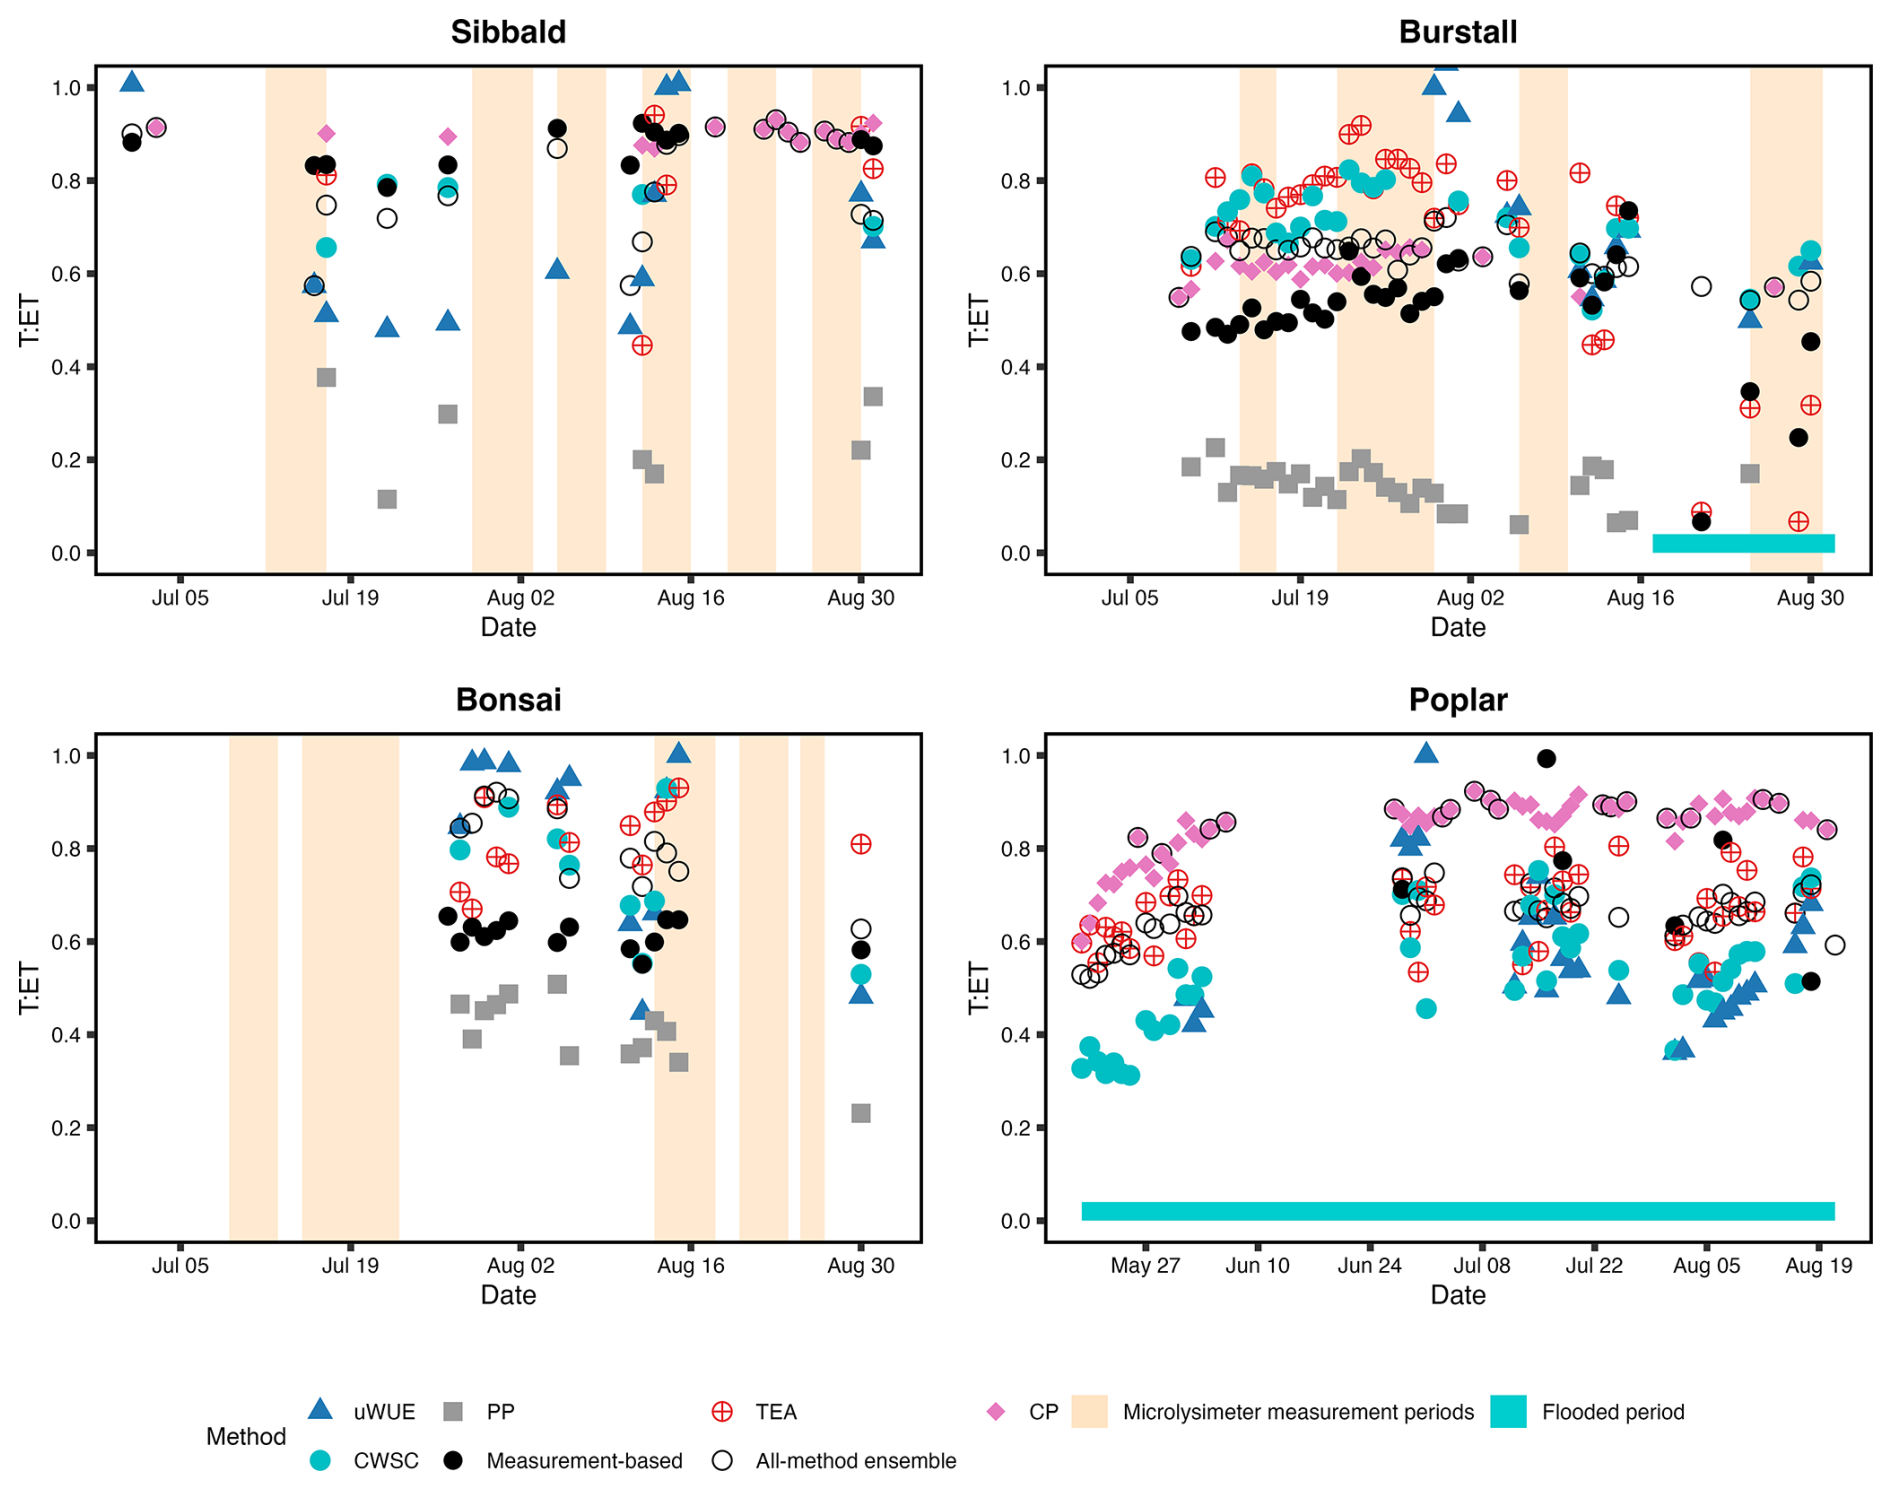
Figure 2Comparison of transpiration-to-evapotranspiration ratio (T : ET) from the ecosystem carbon-water coupling methods (Group 2) with the measurement-based values (black circles) and the ensemble mean of all ET partitioning approaches (open circles) for the four study sites. Note that the CP method did not produce any realistic T : ET values at Bonsai and thus was excluded. The PP method was not performed at Poplar due to missing photosynthetically active radiation data. The light beige shading indicates periods during which ground evaporation was measured using micro-lysimeters at Sibbald, Burstall and Bonsai. The cyan bars at the bottom of the Burstall and Poplar panels indicate flooded periods.
The performance statistics for the Group 2 approaches are summarized in Table 4. Similar to the Group 1 approaches, no single Group 2 approach consistently outperforms the others across all four study sites, and most approaches perform no better than using the observed mean as the predictor. However, in terms of capturing the temporal variability of T : ET, as measured by R2, the Group 2 approaches generally perform better than the Group 1 approaches. For example, when evaluated against the measurement-based T : ET, TEA achieves the highest R2 at Burstall, whereas uWUE and CWSC perform best at Bonsai. The Group 2 ensemble mean does not outperform the best individual approach at most sites, with the exception of Burstall. When evaluated against the overall ensemble mean, however, the Group 2 ensemble generally performs better than the individual Group 2 approaches at most sites. This result should be interpreted with caution because Group 2 contains more approaches than either Group 1 or Group 3 and therefore likely exerts a stronger influence on the overall ensemble mean.
Table 4Comparison of coefficient of determination (R2) and Nash-Sutcliffe efficiency (NSE) values for each Group 2 approach and the Group 2 ensemble mean (CW ensemble) relative to the measurement-based transpiration-to-evapotranspiration ratio (T : ET) and the ensemble mean of T : ET from all ET partitioning approaches.
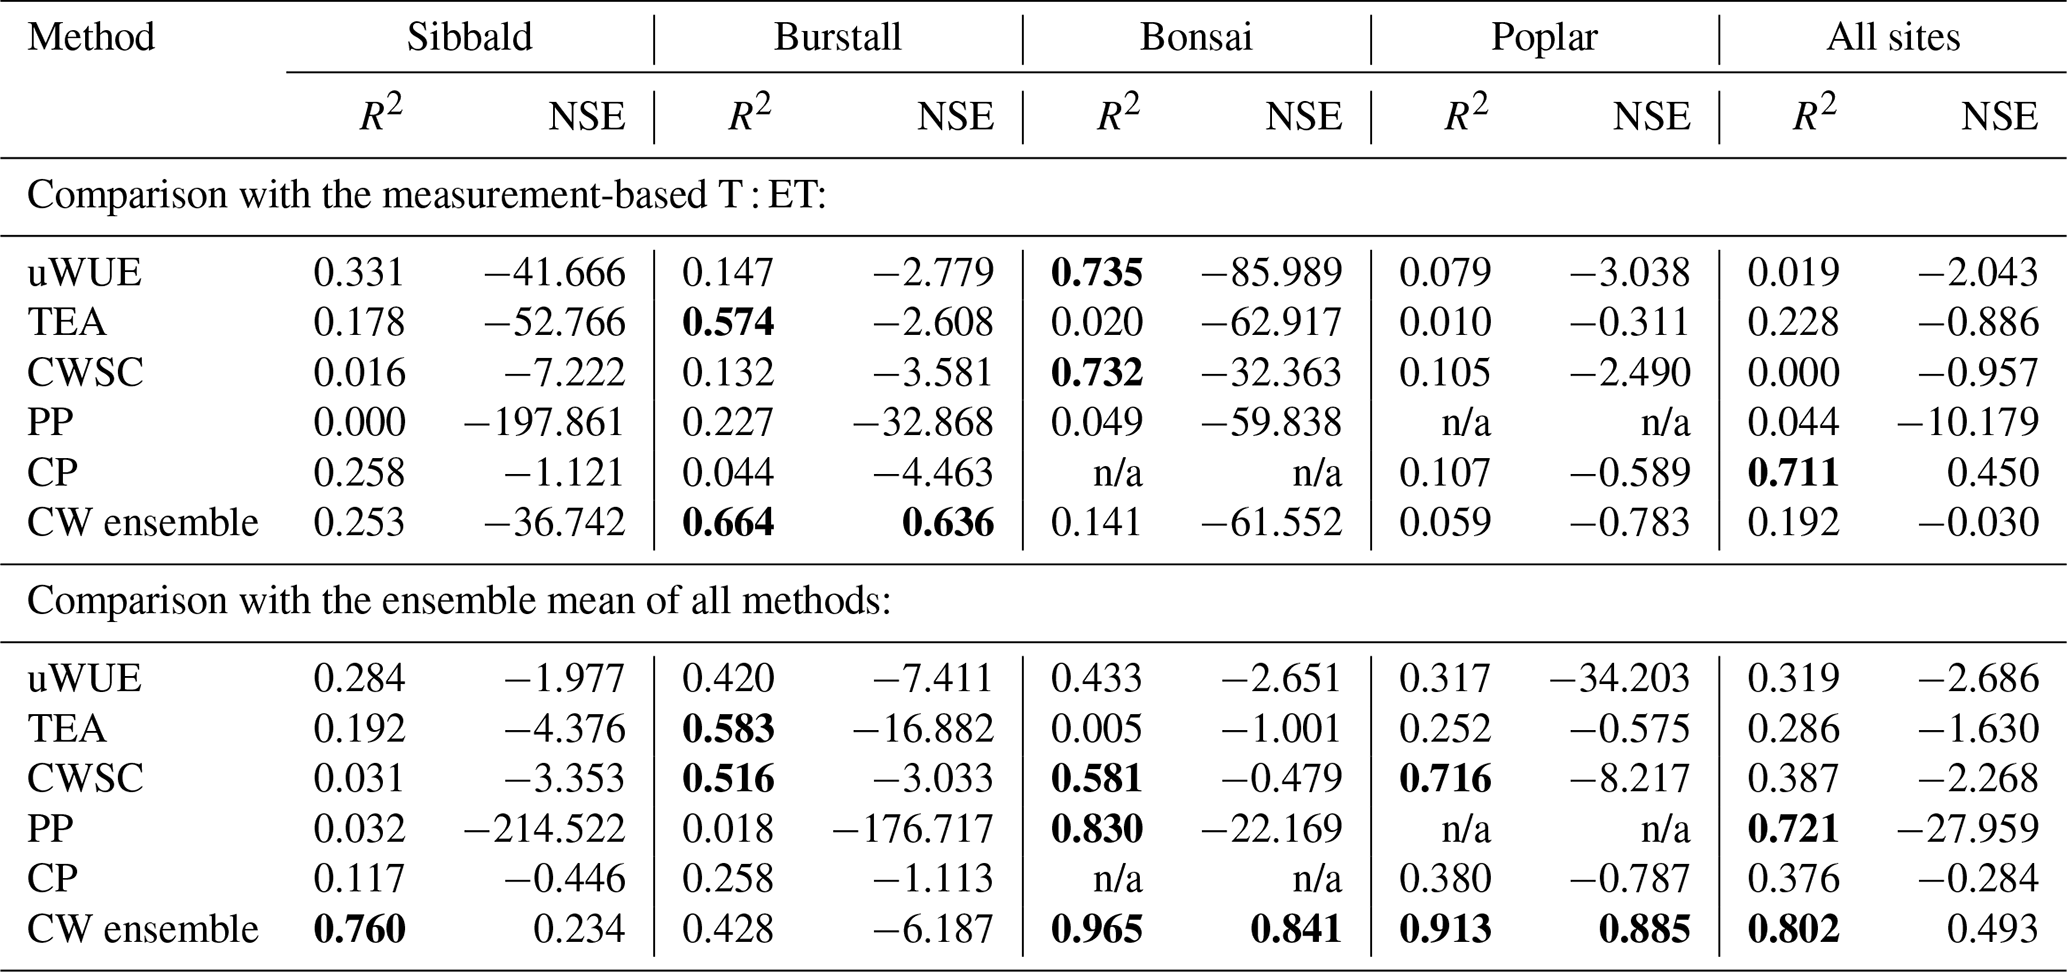
Note: Any R2 or NSE value greater than 0.5 is shown in bold. n/a: not applicable.
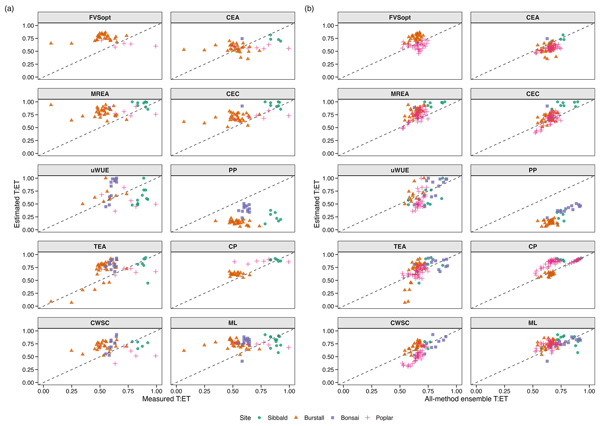
Previous studies have shown that the performance of Group 2 approaches depends on both the quality of the input data, including EC-derived GPP and ET and environmental variables such as radiation, temperature, humidity, wind and precipitation, and the representation of ecosystem carbon-water coupling within each approach (Nelson et al., 2020; Li et al., 2019; Yu et al., 2022). Besides differences in the quality of the input variables used by the Group 2 approaches, differences in the formulation of ecosystem carbon-water coupling are likely to be a major source of variation in the predicted T : ET among the approaches. All Group 2 methods are based, to varying extents, on the theory of optimal stomatal conductance. Among these, uWUE, CP, PP and CWSC are formulated using the unified stomatal conductance model proposed by Medlyn et al. (2011). The generally agreement between the measurement-based T : ET and the estimates from uWUE, CP, and CWSC (Fig. 3) supports previous conclusions that an optimal ecosystem response to VPD is a reasonable assumption (Stoy et al., 2019), even in some moss-covered wetlands such as those examined in this study.
However, as noted by Stoy et al. (2019) and Nelson et al. (2020), the way in which optimality is conceptualized and implemented in these models may need to be refined. Improvements could include incorporating effects of plant hydraulic architecture, soil moisture, temperature , atmospheric CO2 concentration (Bernacchi et al., 2004; Medlyn et al., 2011; Lin et al., 2015; Nardini and Salleo, 2000), as well as considering the timescales over which assumptions about constant parameters in the unified stomatal conductance model can hold (Mäkelä et al., 1996), could improve model performance. This is illustrated by the comparison of results from uWUE, CP and CWSC in Fig. 3. Both CP and CWSC, which account for soil moisture and atmospheric CO2 concentration effects respectively, produced a narrower spread of T : ET estimates than uWUE, which suggests that including these additional constraints improves model performance at sub-daily and daily scales.
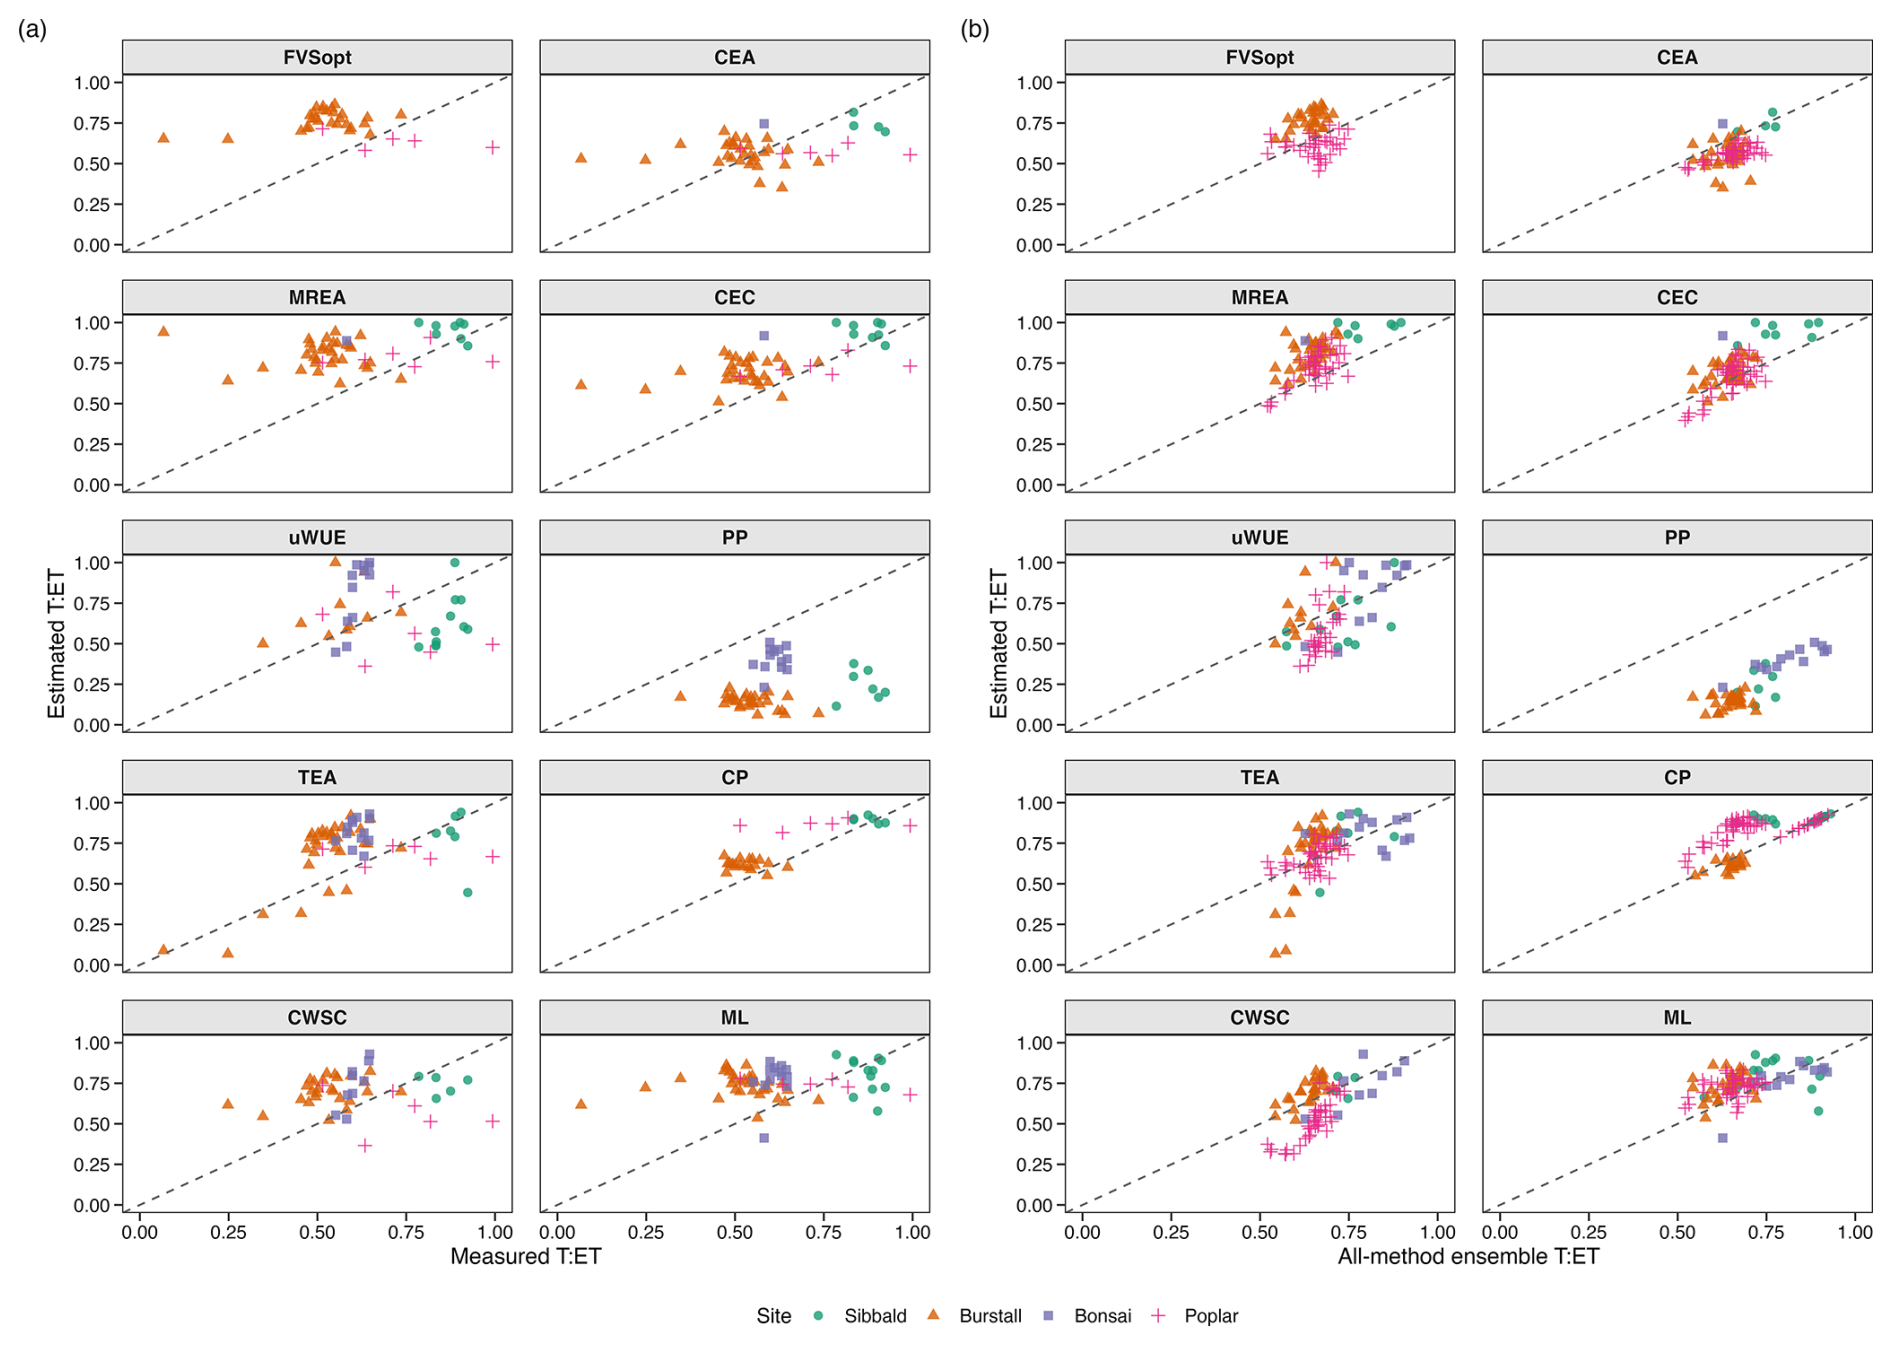
Figure 3Transpiration-to-evapotranspiration ratio (T : ET) estimates from each ET partitioning approach, pooled across the four study sites, with the measurement-based T : ET values (left two columns) and the ensemble mean of T : ET from all ET partitioning approaches (right two columns).
3.3 Evaluation of the machine learning-based methods (Group 3)
The best-performing ML models were identified using the adjusted R2 criterion defined by Stapleton et al. (2022), based on their performance on the night-time validation dataset. The flooding validation dataset was not used for model selection because all candidate models produced negative adjusted R2 values under flooded conditions (Fig. S1). The best-performing ML algorithms are the LightGBM for Sibbald and Poplar and the XGBoost for Burstall and Bonsai, each with different optimal predictor sets (Tables S1 and S2). This finding is consistent with Stapleton et al. (2022), who reported that no single ML algorithm or predictor set consistently performs best across all study sites. Instead, each site has its own best-performing algorithm, predictor combination, and variable importance ranking. Across the four study sites, sensible heat flux, air temperature, and net radiation consistently ranked among the five most important predictors of evaporation (Table S1).
The daily T : ET estimates produced by the best-performing ML model for each study site are presented in Fig. 4, and their performance statistics are summarized in Table 5. Similar to Groups 1 and 2 approaches, the ML models do not consistently outperform the other ET partitioning approaches across all four study sites and, in most cases, perform no better than using the observed mean as the predictor. In terms of reproducing the temporal variability of T : ET, as indicated by R2, the best-performing ML model achieves its highest agreement with the measurement-based T : ET at Poplar. When the overall ensemble mean is used as the reference, however, the highest R2 is obtained at Bonsai. Additionally, the Group 3 ensemble is defined as the average of the predictions from the best-performing ML model identified for each study site and the TEA approach, calculated from all available predictions on each day. Across four sites, the mean T : ET of the Group 3 ensemble exceeds the mean measurement-based T : ET by 16.09 % and is 6.14 % higher than the overall ensemble mean.
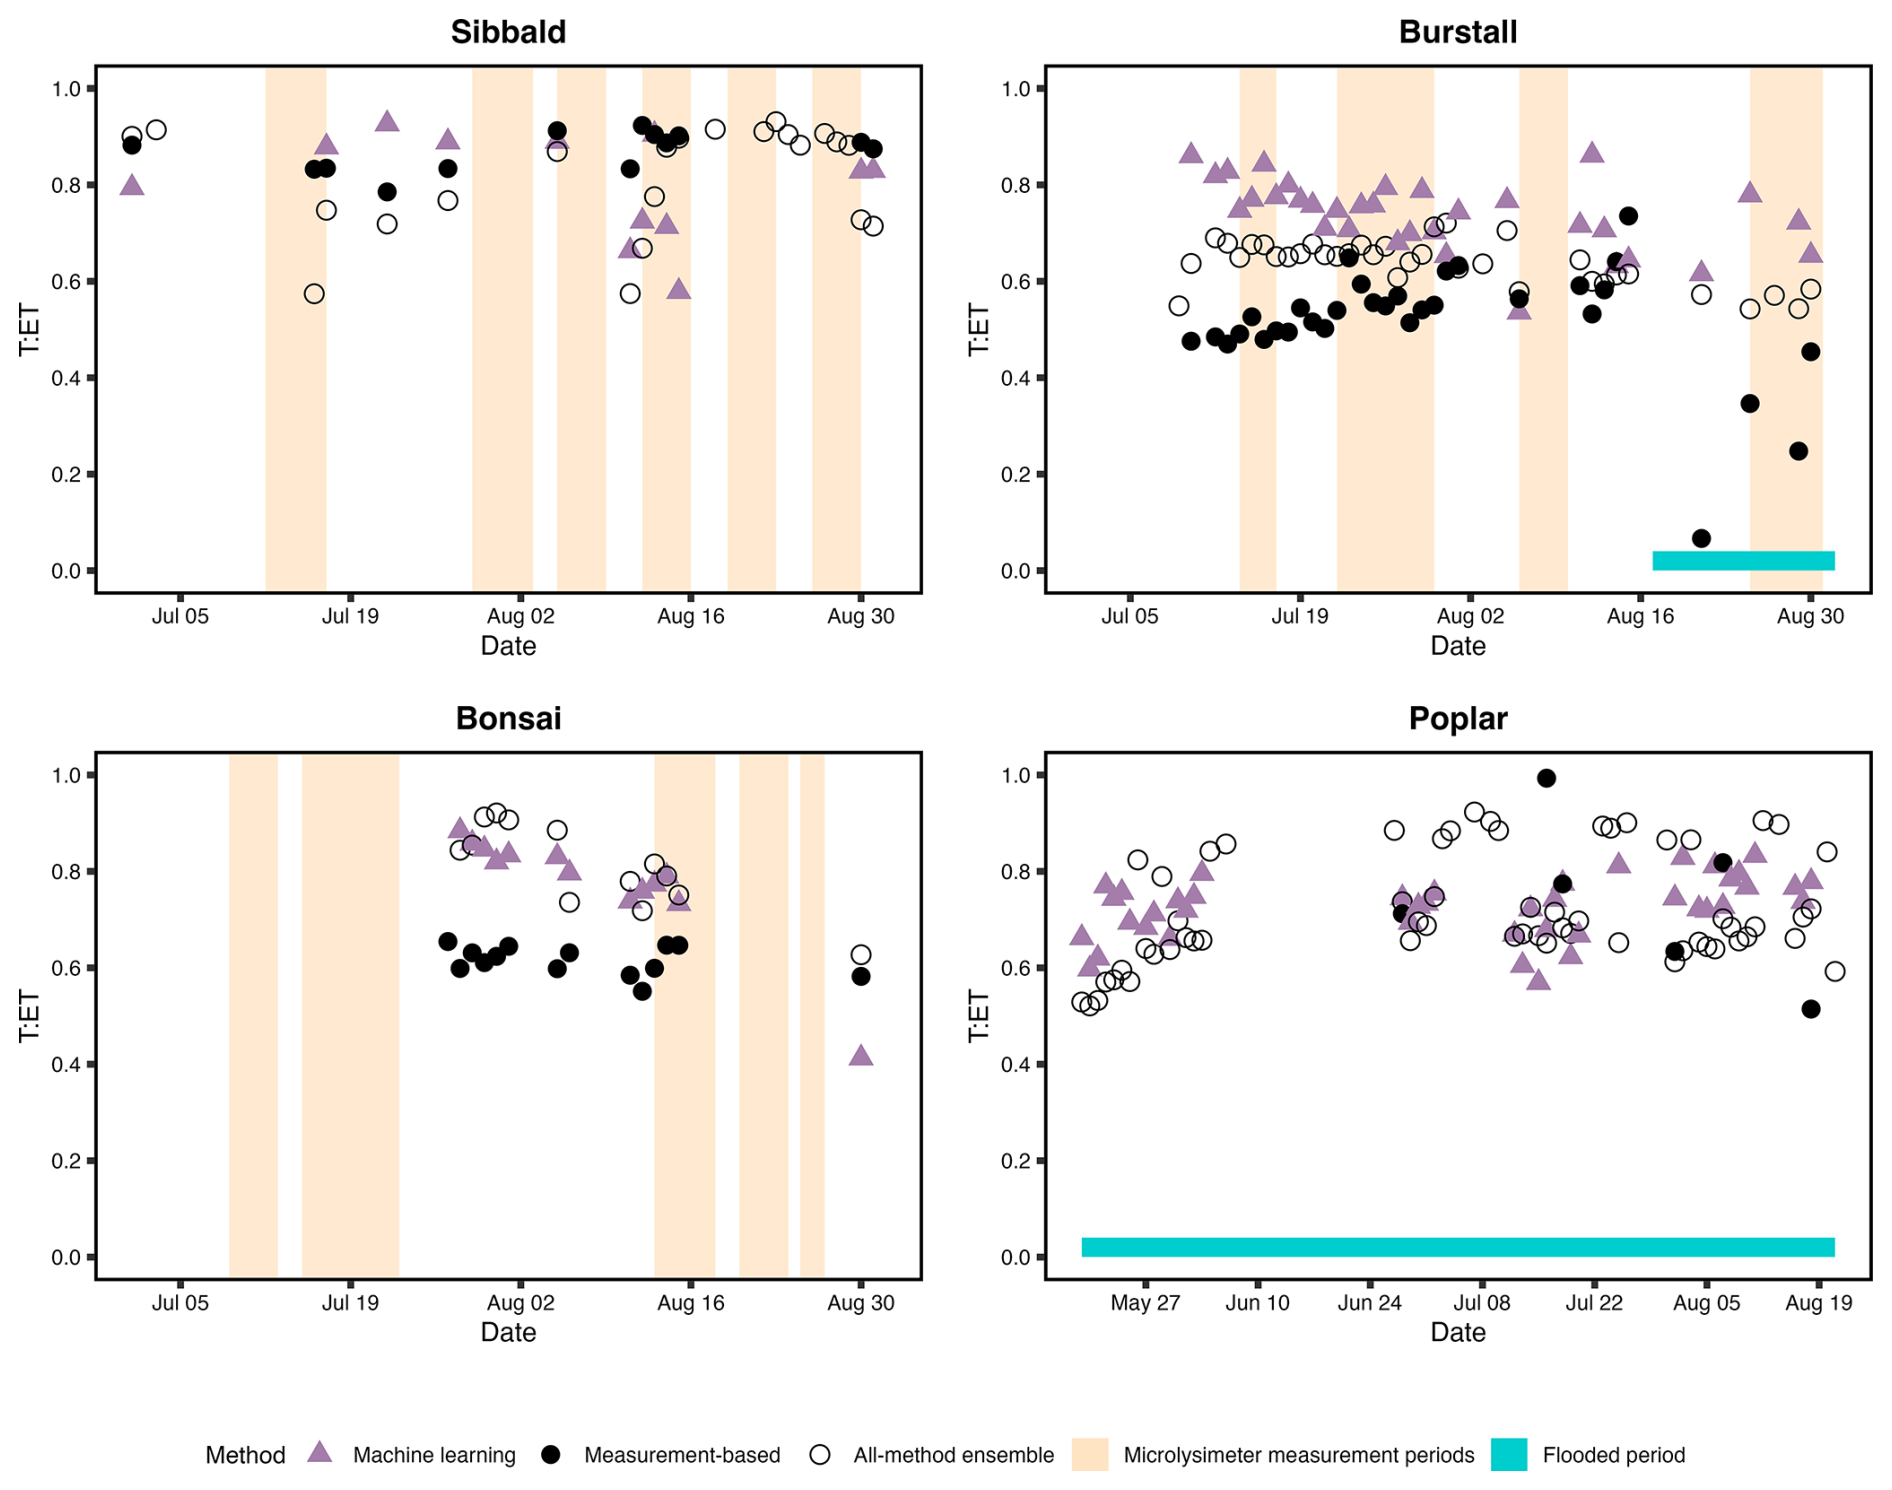
Figure 4Comparison of transpiration-to-evapotranspiration ratio (T : ET) estimates from the machine learning methods (Group 3) with the measurement-based values (black circles) and the ensemble mean of T : ET from all evapotranspiration partitioning approaches (open circles) for the four study sites. The light beige shading indicates periods during which ground evaporation was measured using micro-lysimeters at Sibbald, Burstall and Bonsai. The cyan bars at the bottom of the Burstall and Poplar panels indicate flooded periods.
Table 5Comparison of coefficient of determination (R2) and Nash-Sutcliffe efficiency (NSE) values for the Group 3 approach and the Group 3 ensemble mean (ML ensemble) relative to the measurement-based transpiration-to-evapotranspiration ratio (T : ET) and the ensemble mean of T : ET from all ET partitioning approaches.
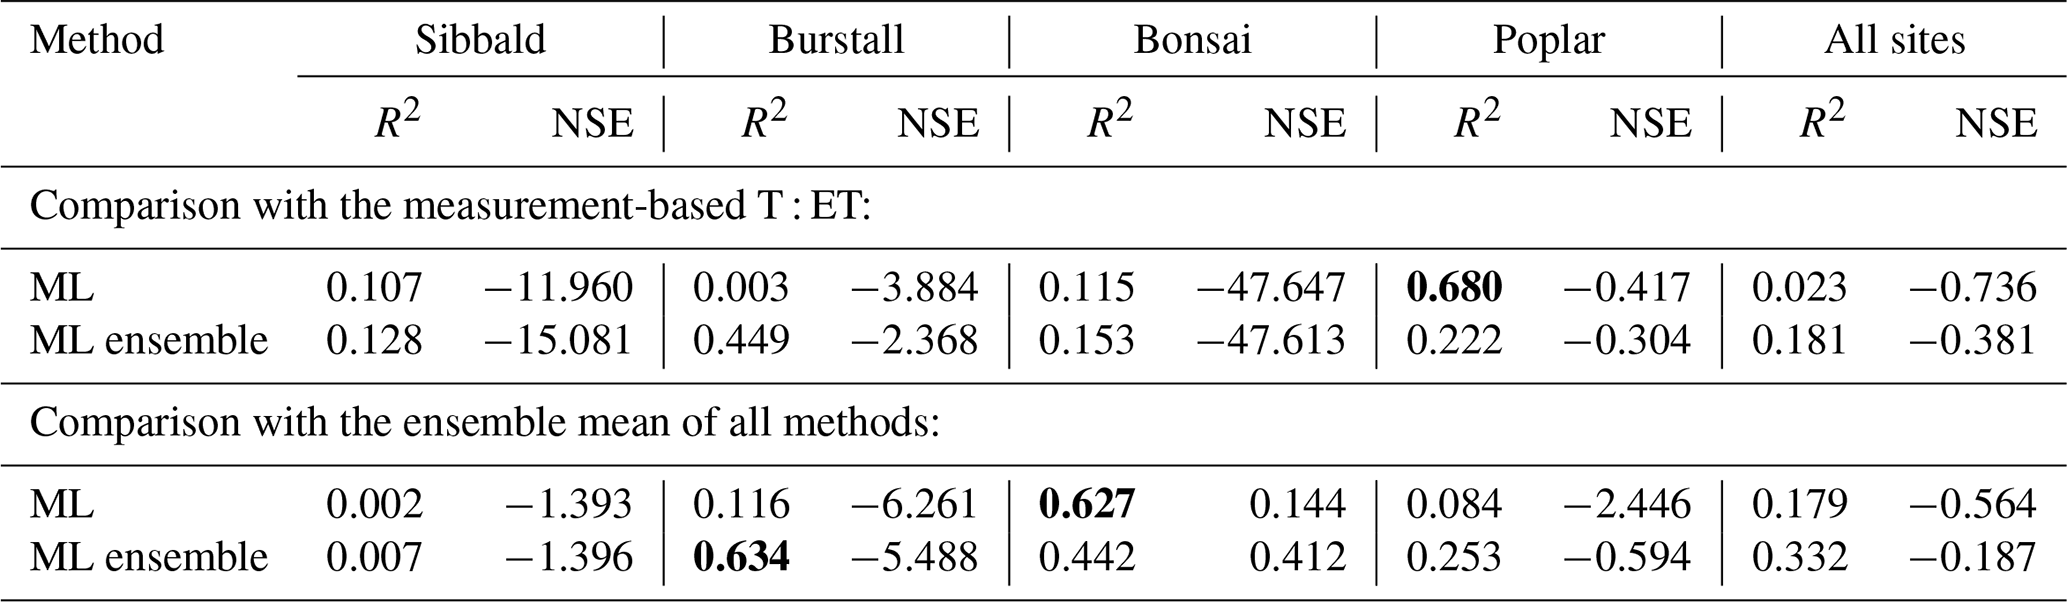
Note: Any R2 or NSE value greater than 0.5 is shown in bold. The ML ensemble includes the best-performing machine learning model identified using the framework of Stapleton et al. (2022) and the TEA approach, which is also classified as a machine learning-based ET partitioning approach.
Unlike the results reported by Eichelmann et al. (2022) and Stapleton et al. (2022), the ML models developed under their framework fail to reproduce the sharp decline in the measurement-based T : ET when Burstall transitions from unsaturated to flooded conditions. Assuming that the measurement-based T : ET reasonably represents the actual temporal dynamics of the site, one possible explanation is that the dominant environmental controls governing ground E and ET partitioning change substantially following flooding. Consequently, these ML models, which are trained under non-flooded conditions, rely on environmental relationships that are no longer representative once the site becomes inundated. In particular, the factors influencing WUE (i.e., the relationship between GPP and T) may change markedly following flooding. This interpretation is supported by the performance of the TEA approach, which is the only method that reproduces the observed decline in T : ET. Unlike the other carbon-water coupling approaches, TEA employs a random forest model to estimate a temporally varying WUE, which allows it to better adapt to changing environmental conditions. In contrast, the other carbon-water coupling approaches rely on presumed relationships between carbon and water fluxes and likewise fail to capture the transition in WUE following flooding. Although TEA demonstrates superior performance under these conditions, this does not necessarily imply that it is generally suitable for E-dominated ecosystems, as Nelson et al. (2018) reported that TEA tends to overestimate T at sites with a relatively constant E component. Therefore, the improved performance of TEA at Burstall is more likely attributable to its ability to accommodate temporal changes in WUE during the transition from unsaturated to flooded conditions than to a general advantage in E-dominated ecosystems. Together, these findings suggest that changes in WUE following inundation play an important role in determining ET partitioning.
Another important consideration is that, in both Eichelmann et al. (2022) and Stapleton et al. (2022), the ML models were validated by comparing predicted E with EC-measured ET during flooded periods when vegetation within the flux footprint had not yet become established. Under these conditions, T can reasonably be assumed to be negligible, such that nearly all measured ET originates from E. In contrast, this study evaluated the ML models under a different flooding scenario. At our sites, flooding occurred after vegetation was already well established and T remained an important component of ET. Consequently, these ML models may not perform equally well under all flooding scenarios, which may explain the negative adjusted R2 values obtained when they were evaluated using the flooding validation dataset (Fig. S1). However, unlike at Burstall, the best-performing ML model at Poplar does not deviate substantially from the reference estimates (Fig. 4), suggesting that the framework may remain applicable to wetlands that are continuously flooded throughout the study period. Together, these findings suggest that, although the framework may perform well under conditions of initial flooding or persistent flooding, further evaluation is needed to determine its applicability to wetlands that transition between unsaturated and flooded conditions.
The performance of these ML models depends on several factors, including the validity of the assumption that nighttime T is negligible, the quality of the nightime EC data and associated gap-filling procedures, as well as the choice of ML architecture and its hyperparameters (Stapleton et al., 2022). Among these factors, the influence of data gaps and gap-filling procedures appears to be limited in the present study. Poplar and Sibbald have substantially larger proportions of missing EC data (approximately 60 %) than Burstall and Bonsai (approximately 20 %). Nevertheless, the best-performing ML model achieves its highest agreement with the measurement-based T : ET at Poplar, which indicates that the extent of data gaps and the associated gap-filling procedures are unlikely to be the primary factors controlling model performance in this study. The magnitude of nighttime transpiration at each study site and the choice of machine learning architecture and hyperparameter settings may also contribute to differences in model performance. However, evaluating these factors is beyond the scope of the present study. Overall, the results suggest that the performance of the ML models is likely governed by the combined effects of data quality, machine learning architecture, site-specific environmental conditions, and the validity of the underlying ET partitioning assumptions.
3.4 Agreement among evapotranspiration partitioning approaches
The Spearman correlation analysis of the predicted T : ET among the ET partitioning methods evaluated in this study (Fig. 5) provides an additional perspective on the agreement among methods. Spearman correlation was preferred over Pearson correlation because it evaluates the monotonic relationship between methods without assuming a linear relationship or normally distributed data (Weaver et al., 2017). It is therefore more robust to outliers and better suited for comparing the temporal consistency of daily T : ET estimates produced by different ET partitioning approaches. Overall, the strength, direction, and statistical significance of the correlations vary considerably across the four study sites.
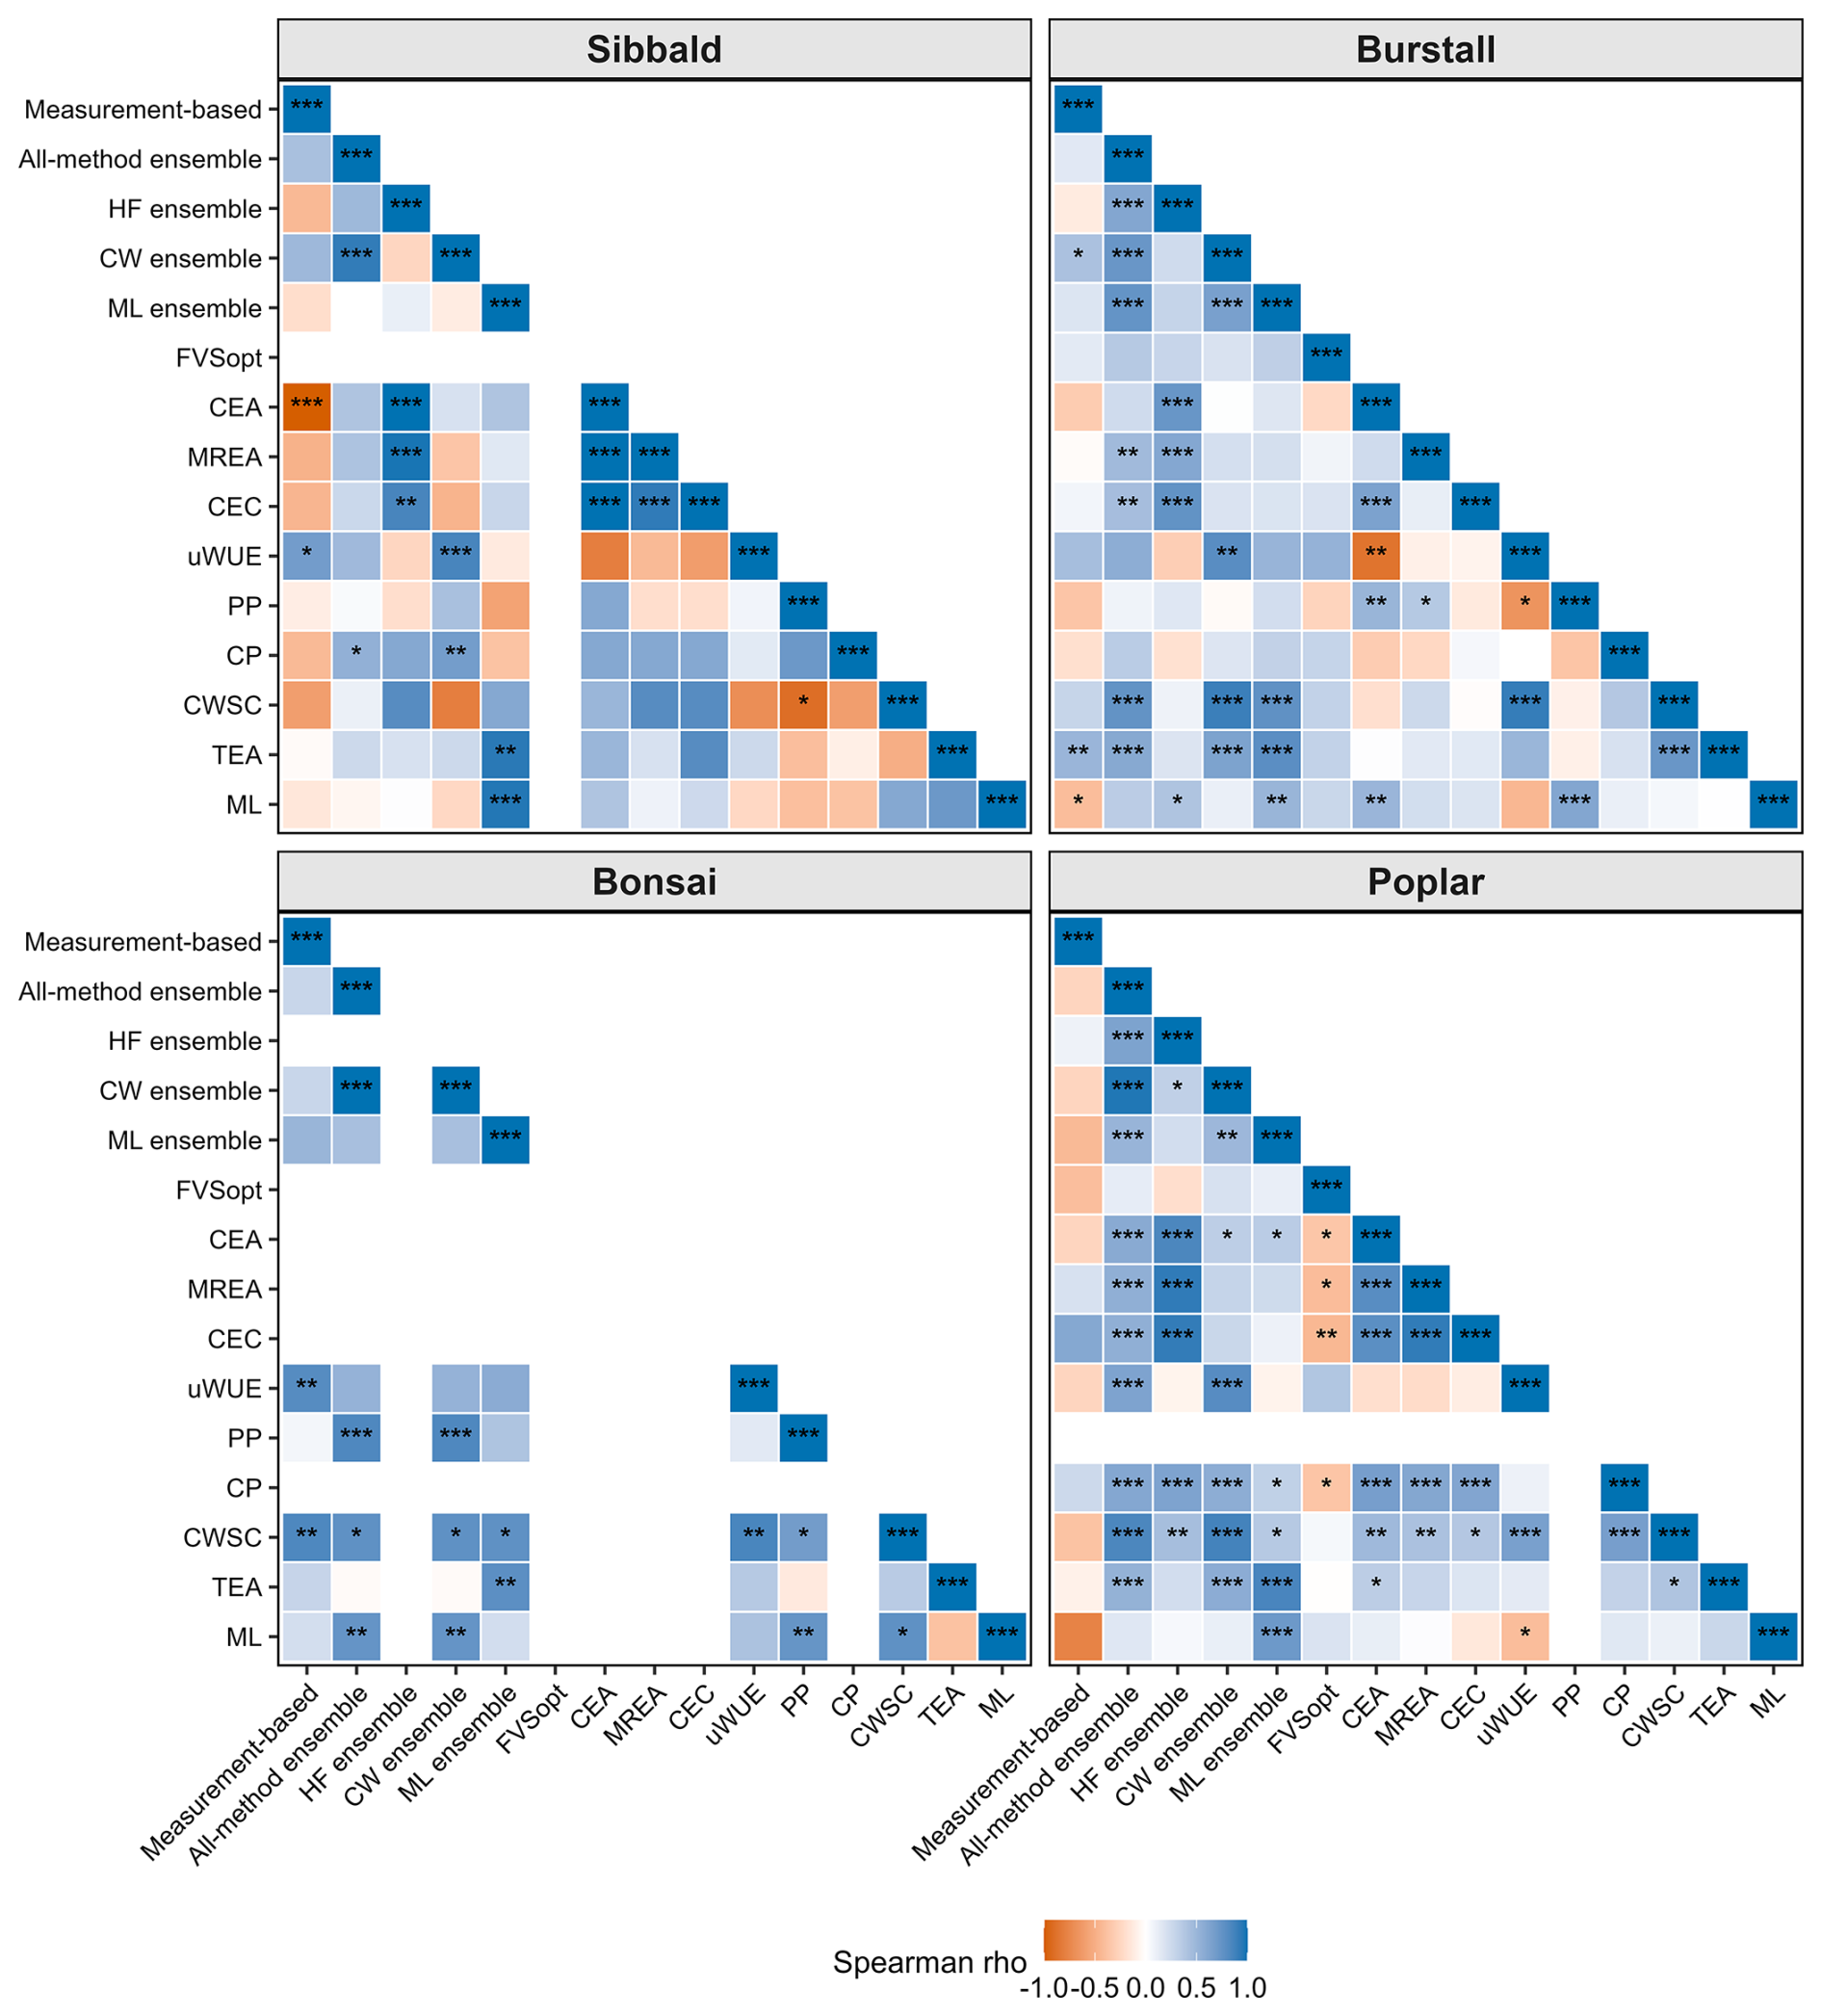
Figure 5Spearman correlation matrix of the predicted transpiration-to-evapotranspiration ratio (T : ET) among the evapotranspiration partitioning methods evaluated in this study. Blue indicates positive correlations, whereas orange indicates negative correlations. Statistical significance is denoted by * P<0.05, P<0.01, and P<0.001.
Notably, the measurement-based T : ET is not significantly correlated with the all-method ensemble at any of the study sites, and the correlation is negative at Poplar. Likewise, the measurement-based T : ET shows no significant correlation with any of the group ensemble means, except at Burstall, where it is positively correlated the Group 2 ensemble. In contrast, all-method ensemble exhibits positive and significant correlations with almost all three groups. These contrasting correlation patterns indicate that the assessment of ET partitioning performance depends strongly on the choice of reference dataset. Although the present study does not provide sufficient evidence to determine whether the measurement-based T : ET or the all-method ensemble better represents the true site-scale T : ET dynamics, the discrepancy between these two references highlights the uncertainty associated with defining a benchmark for ET partitioning evaluation. Consequently, the choice of reference dataset should be carefully considered when comparing and interpreting the performance of different ET partitioning approaches.
Among the three methodological groups, the Group 1 ensemble is positively correlated with the Group 3 ensemble at all four study sites, although none of these correlations is statistically significant. In contrast, the correlation between the Group 1 and Group 2 ensembles is site dependent, with a significant positive correlation observed only at Poplar. The Group 2 ensemble is positively correlated with the Group 3 ensemble at all sites except Sibbald, and these correlations are significant at Burstall and Poplar. Overall, the Group 3 ensemble exhibits stronger and more consistent agreement with both the Group 1 and Group 2 ensembles than the agreement observed between Groups 1 and 2. This pattern suggests that the ML models capture temporal variability that is shared by both the high-frequency EC-based and the carbon-water coupling approaches, likely because the predictor variables used in the machine learning framework capture information related to both turbulence transport and ecosystem carbon-water coupling.
Regarding the individual methods, approaches within the same methodological group generally exhibit stronger positive correlations than approaches from different groups. For example, MREA agrees more with CEA and CEC than with uWUE, which reflects their shared theoretical assumptions and common input variables. However, notable contrasts from the within-group correlation patterns are observed for FVSopt at Burstall and Poplar, and for CWSC and PP at Sibbald, where these methods exhibit substantially weaker agreement with the other approaches in their respective groups. This may reflect the uncertainty associated with estimating leaf-level WUE, as FVSopt, CWSC, and PP all rely on prescribed relationships to estimate leaf-level WUE, and these relationships may not adequately represent the responses of leaf-level WUE to the highly dynamic environmental conditions in wetlands. For example, Klosterhalfen et al. (2019a) demonstrated that the FVS is vulnerable to errors in water use efficiency estimates and atmospheric conditions that violate the variance similarity assumption, like under conditions of weak turbulence, canopy heterogeneity, and poorly separated soil and canopy source-sink distributions.
The degree of agreement among approaches also differs across the four study sites. Poplar exhibits the strongest agreement among methods, whereas Sibbald shows the weakest. This difference may be related to the greater ecosystem heterogeneity at Sibbald. Compared with the relatively homogeneous canopy of the dense forested Poplar peatland, Sibbald is characterized by a multi-layered shrub canopy, large canopy gaps, and pronounced hummock-hollow microtopography (Fig. S3). Such structural heterogeneity is likely to increase the spatial variability of carbon and water fluxes within the EC footprint, and thereby introduces greater uncertainty into EC measurements and reduces the applicability of both scalar transport assumptions and carbon-water relationships used by the EC-based ET partitioning approaches examined in this study.
Table 6Comparison of coefficient of determination (R2) and Nash-Sutcliffe efficiency (NSE) values relative to the measurement-based transpiration-to-evapotranspiration ratio (T : ET) and the ensemble mean of T : ET from all ET partitioning approaches for Burstall after excluding the flooding period.
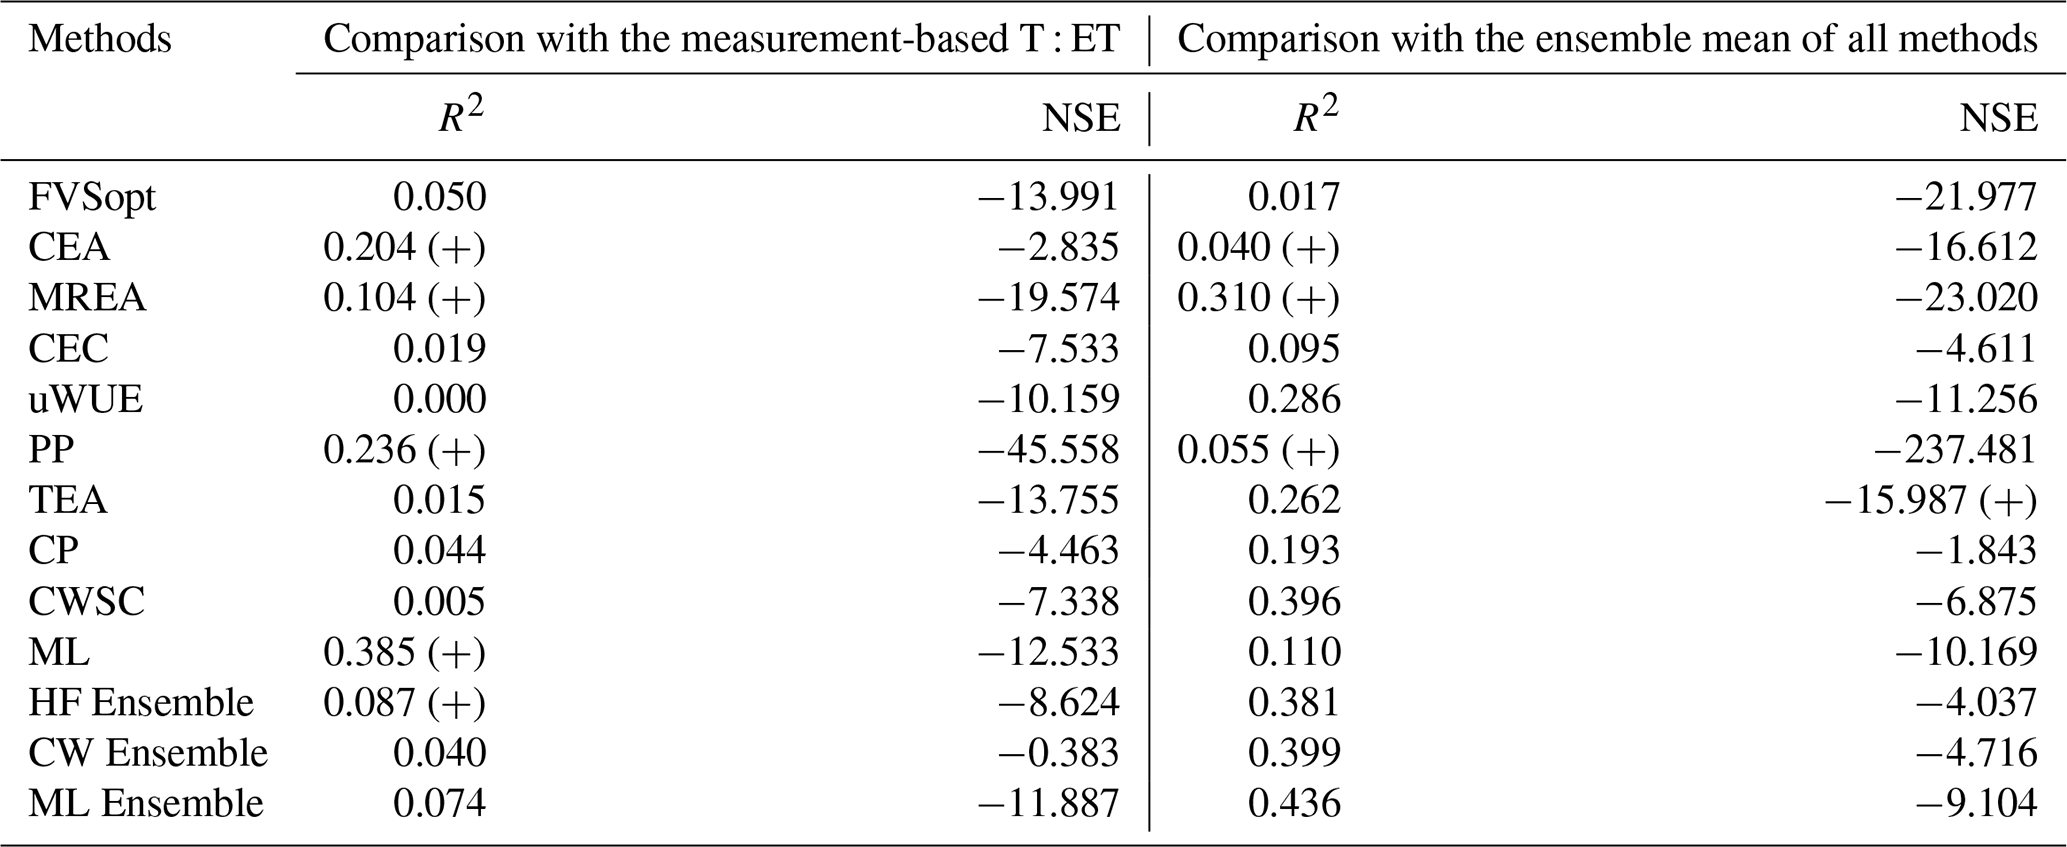
Note: (+) indicates that the corresponding performance metric improved after excluding the flooding period.
3.5 Effects of moss cover and flooding on the performance of evapotranspiration partitioning
The primary objective of this study is to evaluate the performance of existing ET partitioning approaches in moss-covered wetlands. As discussed in Sects. 1 and 2.1, moss cover has the potential to violate several of the fundamental assumptions underlying these approaches. For the Group 1 approaches, strong moss photosynthesis can produce a net negative surface CO2 signal, thereby violating the assumption that the surface acts as a net CO2 source. Evidence for this behavior was reported by Walker et al. (2017), whose chamber measurements on Sphagnum-peat columns showed frequent transitions between positive and negative hourly CO2 fluxes (their Fig. 4), together with sustained daily net CO2 uptake from mid-June to mid-July. These observations suggest that a moss layer has the potential to compromise the applicability of Group 1 approaches that rely on a persistent positive surface CO2 signal.
In terms of our study sites, direct measurements of surface CO2 exchange were unfortunately not available during the study period. Nevertheless, existing evidence indicates that negative surface CO2 fluxes are plausible, particularly at Poplar. Following the 2016 wildfire, chamber measurements conducted in 2017 over moss-dominated plots at Poplar showed that the unburned forest floor remained a net CO2 sink until early August (van Beest, 2019; Fig. 3-1). Although these measurements were not collected during the same study period, they provide independent evidence that strong moss photosynthesis can occur at this site and may influence the assumptions underlying Group 1 approaches.
As for the ecosystem carbon-water coupling approaches (Group 2), moss cover introduces a different source of uncertainty. These approaches estimate WUE under the assumption that GPP originates exclusively from vascular vegetation that also contributes to T. However, mosses contribute to ecosystem GPP while making no contribution to T. Consequently, moss photosynthesis may bias WUE estimates and propagate errors into ET partitioning. The methods that are more sensitive to GPP errors, such as PP and uWUE, as diagnosed in Nelson et al. (2020), are expected to exhibit greater uncertainty. The magnitude of this effect depends on the contribution of mosses to ecosystem GPP, which has been reported to account for approximately 20 % to 30 % of total forest CO2 uptake in a drained forested peatland (Badorek et al., 2011). Therefore, this source of uncertainty may not be trivial.
Another potential source of uncertainty affecting ET partitioning performance is flooding. Under flooded conditions, EC measurements may become less reliable because of weak turbulence and enhanced advection effects (Dai et al., 2026). For the Group 1 approaches, flooding may also weaken or obscure surface CO2 signals, further challenging the assumptions underlying these methods. To evaluate the influence of flooding, we recalculated the R2 and NSE values for Burstall after excluding the flooded period (Table 6) and compared the resulting performance statistics with those obtained using the complete dataset (Tables 3, 4 and 5). When evaluated against the measurement-based T : ET, the R2 values of CEA, MREA, PP, the best-performing ML model, and the Group 1 ensemble increased slightly after the flooded period was excluded. When the overall ensemble mean was used as the reference, only CEA, MREA and PP showed slight improvements in R2. However, despite these modest increases in R2, the NSE values decreased for all approaches except TEA, and all NSE values remained negative. These results suggest that the factors affecting ET partitioning performance are more complex and cannot be explained by flooding alone.
Overall, regardless of whether the measurement-based T : ET or the overall ensemble mean was used as the reference, none of the evaluated approaches consistently outperformed the observed mean as the predictor. This was true even for the ML approaches, whose underlying assumptions are not fundamentally violated by moss cover. Together, these findings suggest that the performance of ET partitioning approaches in wetlands is influenced by the combined effects of multiple factors, including moss cover, flooding conditions, canopy structure, canopy density, canopy openness, site heterogeneity, the measurement height relative to canopy height, the quality of EC and environmental measurements, and the validity of the assumptions underlying each ET partitioning approach.
This study provides first comprehensive evaluations of ET partitioning approaches in moss-covered wetlands across contrasting vegetation structures and hydrological conditions. Overall, no single ET partitioning approach consistently outperformed the others across the four study sites or under both flooded and non-flooded conditions. Likewise, no methodological group, including the high-frequency EC-based approaches, ecosystem carbon-water coupling approaches, or machine learning approaches, demonstrated a clear overall advantage. The performance of ET partitioning approaches in wetlands is likely governed by the combined effects of multiple environmental and methodological factors. In addition to the assumptions underlying each approach, performance is influenced by EC measurement configuration, site characteristics such as canopy height and leaf area index, ecosystem heterogeneity, moss cover, and flooding conditions. These factors interact to influence both the quality of EC and environmental observations and the validity of the assumptions on which current ET partitioning approaches are based.
An important finding of this study is that the evaluation results depend strongly on the choice of reference dataset. The measurement-based T : ET and the ensemble mean of all ET partitioning approaches exhibit markedly different correlation patterns with the evaluated methods, highlighting the uncertainty associated with defining a reference for ET partitioning evaluation. This finding suggests that greater attention should be given to reference dataset selection and uncertainty quantification in future benchmarking studies.
Although several approaches perform reasonably well under specific site conditions, none adequately captures the full range of environmental conditions encountered in wetlands, particularly transitions between unsaturated and flooded states. Future work should therefore focus on developing wetland-specific ET partitioning approaches that explicitly account for dynamic hydrological conditions, improve the representation of carbon-water coupling, and incorporate the influence of mosses on ecosystem carbon exchange. Such developments will improve the reliability of ET partitioning in wetlands and advance our understanding of water and carbon cycling in these globally important ecosystems.
Since the purpose of this study is to provide supporting evidence and recommendation for future research that plan to apply EC-based ET partitioning approaches in moss-covered wetlands, particularly in cases where direct validation through field measurements is not available. several practical recommendations can be made. Based on our study, the ensemble of the high-frequency EC-based approaches and the machine learning approaches produced T : ET estimates of similar magnitude, and both tended to overestimate T : ET relative to both the measurement-based estimates and the overall ensemble mean. In contrast, the ensemble of the ecosystem carbon-water coupling approaches produced lower mean T : ET values but generally exhibited larger temporal fluctuations. Rather than relying on a single ET partitioning group, we recommend applying multiple approaches from all three methodological groups whenever possible. Comparing predictions across different approaches provides a more comprehensive assessment of uncertainty and helps identify potential sources of disagreement among methods. For example, our analysis suggests that the parameterization of WUE is one of the major factors contributing to disagreement among methods. This finding implies that the response of WUE to changing environmental conditions in wetland ecosystems may not yet be fully represented in current formulations. However, it should be noted that this recommendation does not imply that the ensemble mean or any single approach is consistently better than the others. Our results showed that the relative performance of individual approaches, as well as the ensemble mean, depended on the reference dataset used for evaluation.
Finally, several caveats must be considered when interpreting the results of this study. First, the study did not examine the mechanisms by which mosses influence the results of ET partitioning approaches. This remains an important topic for future research. Secondly, the ET partitioning results presented here were filtered based on the data quality controls described in the Methods section. It is important to emphasize that rainy periods were excluded; if included, most Group 2 methods produced unrealistic T : ET values exceeding 1. Third, the evaporation component considered in this study refers exclusively to ground E. Whether the findings can be extended to include canopy E remains an open question. Lastly, the conclusions are most likely valid for sites with moss thickness similar to or less than that of those studied here. Uncertainty remains regarding their applicability to ecosystems with thicker moss layers and fewer vascular plants. Nonetheless, the study sites represent common wetlands and are expected to reflect a broad range of wetland ecosystems. Therefore, the conclusions are highly likely applicable to many wetland ecosystems.
The measurement-based T : ET estimates were previous published in Gabrielli (2016) and Wang (2025). The raw EC measurement data are currently involved in an ongoing research project and are therefore not yet publicly available. The raw EC data can be made available by the corresponding author upon reasonable request. The FVS, CEA, MREA and CEC methods were applied using the ET partitioning code developed by Zahn (2024); the PP method by Pérez-Priego and Wutzler (2018); the uWUE and TEA methods by Nelson (2020); the CWSC method by Jiang and Yu (2021) (https://doi.org/10.5281/zenodo.4816690); and the machine learning framework by Stapleton (2022). We sincerely thank these authors for generously sharing their codes.
The supplement related to this article is available online at https://doi.org/10.5194/bg-23-7067-2026-supplement.
YW and RP jointly developed the research concept. YW carried out data compilation, data analysis, and manuscript drafting. RP supervised the project, secured funding, and contributed to manuscript writing. LZ assisted with code adaptation, development, and manuscript editing. All authors approved the final manuscript.
The contact author has declared that none of the authors has any competing interests.
During the preparation of this work the first author used ChatGPT-4.0 only for grammar checking and language polishing. ChatGPT-4.0 was not used for content generation. After using this tool, the first author reviewed and edited the content as needed and takes full responsibility for the content of the publication.
Publisher's note: Copernicus Publications remains neutral with regard to jurisdictional claims made in the text, published maps, institutional affiliations, or any other geographical representation in this paper. The authors bear the ultimate responsibility for providing appropriate place names. Views expressed in the text are those of the authors and do not necessarily reflect the views of the publisher.
The authors would like to thank Lindsey Langs and Eric Murray for their assistance in data collection at Sibbald, Burstall and Bonsai, and Elise Gabrielli for data collection at Poplar. We thank Adam Green for eddy covariance data processing and Dr. Myroslava Khomik for her suggestions on data analysis. The University of Calgary must also be acknowledged for their hospitality and accommodations at the Biogeosciences Institute Barrier Lake Field Station during the field seasons. We also thank the Coldwater Laboratory in Canmore, Alberta, part of the University of Saskatchewan Global Water Future Project, for providing precipitation data for the Bonsai site. We are particularly grateful for to Dr. John Pomeroy, Dr. Cherie Westbrook, and Dr. Rebecca Rooney, Dr. Elke Eichelmann, and the reviewers and the editor for their constructive comments, which greatly improved this manuscript.
This research has been supported by the Global Water Futures (Mountain Water Futures project), the Alberta Innovates (Energy and Environment Solutions), and the Natural Sciences and Engineering Research Council of Canada, Networks of Centres of Excellence of Canada (grant nos. RGPN-04182-2017 and 463960-2015).
This paper was edited by Anne Klosterhalfen and reviewed by Elke Eichelmann and one anonymous referee.
Admiral, S. W. and Lafleur, P. M.: Partitioning of latent heat flux at a northern peatland, Aquat. Bot., 86, 107–116, https://doi.org/10.1016/j.aquabot.2006.09.006, 2007.
Albert-Saiz, M., Stróżecki, M., Rastogi, A., and Juszczak, R.: A Multi-Model Gap-Filling Strategy Increases the Accuracy of GPP Estimation from Periodic Chamber-Based Flux Measurements on Sphagnum-Dominated Peatland, Sustainability, 17, 393, https://doi.org/10.3390/su17020393, 2025.
Allen, S. T., Reba, M. L., Edwards, B. L., and Keim, R. F.: Evaporation and the subcanopy energy environment in a flooded forest, Hydrol. Process., 31, 2860–2871, https://doi.org/10.1002/hyp.11227, 2017.
Aro, E.-M. and Gerbaud, A.: Photosynthesis and Photorespiration in Mosses, in: Advances in Photosynthesis Research, edited by: Sybesma, C., Springer Netherlands, Dordrecht, 867–870, https://doi.org/10.1007/978-94-017-4973-2_198, 1984.
Aubinet, M., Vesala, T., and Papale, D.: Eddy covariance: a practical guide to measurement and data analysis, Springer Science & Business Media, https://doi.org/10.1007/978-94-007-2351-1, 2012.
Badorek, T., Tuittila, E.-S., Ojanen, P., and Minkkinen, K.: Forest floor photosynthesis and respiration in a drained peatland forest in southern Finland, Plant Ecol. Divers., 4, 227–241, https://doi.org/10.1080/17550874.2011.644344, 2011.
Baldocchi, D. D.: Assessing the eddy covariance technique for evaluating carbon dioxide exchange rates of ecosystems: past, present and future, Glob. Change Biol., 9, 479–492, https://doi-org.proxy.lib.uwaterloo.ca/10.1046/j.1365-2486.2003.00629.x (last access: 22 June 2026), 2003.
Bayfield, N. G.: Notes on water relations of Polytrichum commune Hedw, J. Bryol., 7, 607–617, https://doi.org/10.1179/jbr.1973.7.4.607, 1973.
Bernacchi, C. J., Singsaas, E. L., Pimentel, C., Portis Jr., A. R., and Long, S. P.: Improved temperature response functions for models of Rubisco-limited photosynthesis, Plant Cell Environ., 24, 253–259, https://doi.org/10.1111/j.1365-3040.2001.00668.x, 2004.
Bijoor, N. S., Pataki, D. E., Rocha, A. V., and Goulden, M. L.: The application of δ18O and δD for understanding water pools and fluxes in a Typha marsh, Plant Cell Environ., 34, 1761–1775, https://doi.org/10.1111/j.1365-3040.2011.02372.x, 2011.
Burba, G., Schmidt, A., Scott, R. L., Nakai, T., Kathilankal, J., Fratini, G., Hanson, C., Law, B., McDermitt, D. K., and Eckles, R.: Calculating CO2 and H2O eddy covariance fluxes from an enclosed gas analyzer using an instantaneous mixing ratio, Glob. Change Biol., 18, 385–399, https://doi.org/10.1111/j.1365-2486.2011.02536.x, 2012.
Burba, G. G., Verma, S. B., and Kim, J.: Surface energy fluxes of Phragmites australis in a prairie wetland, Agr. Forest Meteorol., 94, 31–51, https://doi.org/10.1016/S0168-1923(99)00007-6, 1999.
Businger, J. A. and Oncley, S. P.: Flux measurement with conditional sampling, J. Atmos. Ocean. Technol., 7, 349–352, https://doi.org/10.1175/1520-0426(1990)007<0349:FMWCS>2.0.CO;2, 1990.
Caird, M. A., Richards, J. H., and Donovan, L. A.: Nighttime Stomatal Conductance and Transpiration in C3 and C4 Plants, Plant Physiol., 143, 4–10, https://doi.org/10.1104/pp.106.092940, 2007.
Chen, S., Yang, Z., Liu, X., Sun, J., Xu, C., Xiong, D., Lin, W., Li, Y., Guo, J., and Yang, Y.: Moss regulates soil evaporation leading to decoupling of soil and near-surface air temperatures, J. Soil. Sediment., 19, 2903–2912, https://doi.org/10.1007/s11368-019-02297-4, 2019.
Dai, Y., Liu, B., Wei, J., Shi, Y., Li, Q., Liu, F., Luo, Y., and Cui, Y.: Impacts of surface heterogeneity on energy partitioning in paddy ecosystems: A dual eddy covariance study, Agr. Forest Meteorol., 384, 111165, https://doi.org/10.1016/j.agrformet.2026.111165, 2026.
Daley, M. J. and Phillips, N. G.: Interspecific variation in nighttime transpiration and stomatal conductance in a mixed New England deciduous forest, Tree Physiol., 26, 411–419, https://doi.org/10.1093/treephys/26.4.411, 2006.
Dietterich, T. G.: Ensemble Methods in Machine Learning, Berlin, Heidelberg, 1–15, https://doi.org/10.1007/3-540-45014-9_1, 2000.
Drexler, J. Z., Snyder, R. L., Spano, D., and Paw U, K. T.: A review of models and micrometeorological methods used to estimate wetland evapotranspiration, Hydrol. Process., 18, 2071–2101, https://doi.org/10.1002/hyp.1462, 2004.
Eichelmann, E., Mantoani, M. C., Chamberlain, S. D., Hemes, K. S., Oikawa, P. Y., Szutu, D., Valach, A., Verfaillie, J., and Baldocchi, D. D.: A novel approach to partitioning evapotranspiration into evaporation and transpiration in flooded ecosystems, Glob. Change Biol., 28, 990–1007, https://doi.org/10.1111/gcb.15974, 2022.
Farquhar, G. D. and Sharkey, T. D.: Stomatal conductance and photosynthesis, Ann. Rev. Plant Physiol., 33, 317–345, https://doi.org/10.1146/annurev.pp.33.060182.001533, 1982.
Farquhar, G. D., von Caemmerer, S. v., and Berry, J. A.: A biochemical model of photosynthetic CO2 assimilation in leaves of C3 species, Planta, 149, 78–90, https://doi.org/10.1007/BF00386231, 1980.
Fisher, J. B., Baldocchi, D. D., Misson, L., Dawson, T. E., and Goldstein, A. H.: What the towers don't see at night: nocturnal sap flow in trees and shrubs at two AmeriFlux sites in California, Tree Physiol., 27, 597–610, 10.1093/treephys/27.4.597, 2007.
Foken, T. and Leclerc, M. Y.: Methods and limitations in validation of footprint models, Agr. Forest Meteorol., 127, 223–234, https://doi.org/10.1016/j.agrformet.2004.07.015, 2004.
Frolking, S., Roulet, N., and Fuglestvedt, J.: How northern peatlands influence the Earth's radiative budget: Sustained methane emission versus sustained carbon sequestration, J. Geophys. Res.-Biogeo., 111, https://doi.org/10.1029/2005JG000091, 2006.
Gabrielli, E. C.: Partitioning Evapotranspiration in Forested Peatlands within the Western Boreal Plain, Fort McMurray, Alberta, Canada, Master's thesis, Wilfrid Laurier University, https://scholars.wlu.ca/etd/1820/ (last access: 22 June 2026), 2016.
Goetz, J. D. and Price, J. S.: Role of morphological structure and layering of Sphagnum and Tomenthypnum mosses on moss productivity and evaporation rates, Can. J. Soil Sci., 95, 109–124, https://doi.org/10.4141/cjss-2014-092, 2015.
Goulden, M. L., Litvak, M., and Miller, S. D.: Factors that control Typha marsh evapotranspiration, Aquat. Bot., 86, 97–106, https://doi.org/10.1016/j.aquabot.2006.09.005, 2007.
Hathaway, J. M., Westbrook, C. J., Rooney, R. C., Petrone, R. M., and Langs, L. E.: Quantifying relative contributions of source waters from a subalpine wetland to downstream water bodies, Hydrol. Process., 36, e14679, https://doi.org/10.1002/hyp.14679, 2022.
Hrach, D. M., Petrone, R. M., Van Huizen, B., Green, A., and Khomik, M.: The Impact of Variable Horizon Shade on the Growing Season Energy Budget of a Subalpine Headwater Wetland, Atmosphere, 12, 1473, https://doi.org/10.3390/atmos12111473, 2021.
Hussey, B. H. and Odum, W. E.: Evapotranspiration in tidal marshes, Estuaries, 15, 59–67, https://doi.org/10.2307/1352710, 1992.
Jacobs, J. M., Mergelsberg, S. L., Lopera, A. F., and Myers, D. A.: Evapotranspiration from a wet prairie wetland under drought conditions: Paynes Prairie Preserve, Florida, USA, Wetlands, 22, 374–385, https://doi.org/10.1672/0277-5212(2002)022[0374:EFAWPW]2.0.CO;2, 2002.
Jarvis, P. G. and McNaughton, K.: Stomatal control of transpiration: scaling up from leaf to region, in: Advances in ecological research, Elsevier, 1–49, https://doi.org/10.1016/S0065-2504(08)60119-1, 1986.
Jiang, K. and Yu, L.: A method for partitioning ecosystem evapotranspiration based on fluxnet data, Zenodo [code], https://doi.org/10.5281/zenodo.4816690, 2021.
Kaimal, J. C. and Finnigan, J. J.: Atmospheric boundary layer flows: their structure and measurement, Oxford University Press, https://doi.org/10.1093/oso/9780195062397.001.0001, 1994.
Ketcheson, S. J. and Price, J. S.: Characterization of the fluxes and stores of water within newly formed Sphagnum moss cushions and their environment, Ecohydrology, 7, 771–782, https://doi.org/10.1002/eco.1399, 2013.
Kettridge, N. and Waddington, J. M.: Towards quantifying the negative feedback regulation of peatland evaporation to drought, Hydrol. Process., 28, 3728–3740, https://doi.org/10.1002/hyp.9898, 2013.
Kettridge, N., Lukenbach, M. C., Hokanson, K. J., Hopkinson, C., Devito, K. J., Petrone, R. M., Mendoza, C. A., and Waddington, J. M.: Low Evapotranspiration Enhances the Resilience of Peatland Carbon Stocks to Fire, Geophys. Res. Lett., 44, 9341–9349, https://doi.org/10.1002/2017gl074186, 2017.
Kiniry, J. R., Williams, A. S., Reisner, L. M., Hatfield, J. L., and Kim, S.: Effects of two categorically differing emergent wetland plants on evapotranspiration, Agrosyst. Geosci. Environ., 6, e20331, https://doi.org/10.1002/agg2.20331, 2023.
Klosterhalfen, A., Moene, A. F., Schmidt, M., Scanlon, T. M., Vereecken, H., and Graf, A.: Sensitivity analysis of a source partitioning method for H2O and CO2 fluxes based on high frequency eddy covariance data: Findings from field data and large eddy simulations, Agr. Forest Meteorol., 265, 152–170, https://doi.org/10.1016/j.agrformet.2018.11.003, 2019a.
Klosterhalfen, A., Graf, A., Brüggemann, N., Drüe, C., Esser, O., González-Dugo, M. P., Heinemann, G., Jacobs, C. M. J., Mauder, M., Moene, A. F., Ney, P., Pütz, T., Rebmann, C., Ramos Rodríguez, M., Scanlon, T. M., Schmidt, M., Steinbrecher, R., Thomas, C. K., Valler, V., Zeeman, M. J., and Vereecken, H.: Source partitioning of H2O and CO2 fluxes based on high-frequency eddy covariance data: a comparison between study sites, Biogeosciences, 16, 1111–1132, https://doi.org/10.5194/bg-16-1111-2019, 2019b.
Kokkonen, N., Laine, A. M., Männistö, E., Mehtätalo, L., Korrensalo, A., and Tuittila, E.-S.: Two Mechanisms Drive Changes in Boreal Peatland Photosynthesis Following Long-Term Water Level Drawdown: Species Turnover and Altered Photosynthetic Capacity, Ecosystems, 25, 1601–1618, https://doi.org/10.1007/s10021-021-00736-3, 2022.
Kool, D., Agam, N., Lazarovitch, N., Heitman, J. L., Sauer, T. J., and Ben-Gal, A.: A review of approaches for evapotranspiration partitioning, Agr. Forest Meteorol., 184, 56–70, https://doi.org/10.1016/j.agrformet.2013.09.003, 2014.
Lei, C.: Vegetation diversity in mountain peatland systems, University of Waterloo, http://hdl.handle.net/10012/16665 (last access: 7 May 2025), 2021.
Leifeld, J. and Menichetti, L.: The underappreciated potential of peatlands in global climate change mitigation strategies, Nat. Commun., 9, 1071, https://doi.org/10.1038/s41467-018-03406-6, 2018.
Leuning, R. and Judd, M. J.: The relative merits of open- and closed-path analysers for measurement of eddy fluxes, Glob. Change Biol., 2, 241–253, https://doi.org/10.1111/j.1365-2486.1996.tb00076.x, 1996.
Li, X., Gentine, P., Lin, C., Zhou, S., Sun, Z., Zheng, Y., Liu, J., and Zheng, C.: A simple and objective method to partition evapotranspiration into transpiration and evaporation at eddy-covariance sites, Agr. Forest Meteorol., 265, 171–182, https://doi.org/10.1016/j.agrformet.2018.11.017, 2019.
Lin, Y.-S., Medlyn, B. E., Duursma, R. A., Prentice, I. C., Wang, H., Baig, S., Eamus, D., de Dios, Victor R., Mitchell, P., Ellsworth, D. S., de Beeck, M. O., Wallin, G., Uddling, J., Tarvainen, L., Linderson, M.-L., Cernusak, L. A., Nippert, J. B., Ocheltree, T. W., Tissue, D. T., Martin-StPaul, N. K., Rogers, A., Warren, J. M., De Angelis, P., Hikosaka, K., Han, Q., Onoda, Y., Gimeno, T. E., Barton, C. V. M., Bennie, J., Bonal, D., Bosc, A., Löw, M., Macinins-Ng, C., Rey, A., Rowland, L., Setterfield, S. A., Tausz-Posch, S., Zaragoza-Castells, J., Broadmeadow, M. S. J., Drake, J. E., Freeman, M., Ghannoum, O., Hutley, Lindsay B., Kelly, J. W., Kikuzawa, K., Kolari, P., Koyama, K., Limousin, J.-M., Meir, P., Lola da Costa, A. C., Mikkelsen, T. N., Salinas, N., Sun, W., and Wingate, L.: Optimal stomatal behaviour around the world, Nat. Clim. Change, 5, 459–464, https://doi.org/10.1038/nclimate2550, 2015.
Mäkelä, A., Berninger, F., and Hari, P.: Optimal control of gas exchange during drought: theoretical analysis, Ann. Bot., 77, 461–468, https://doi.org/10.1006/anbo.1996.0056, 1996.
McCarter, C. P. R. and Price, J. S.: Ecohydrology of Sphagnum moss hummocks: mechanisms of capitula water supply and simulated effects of evaporation, Ecohydrology, 7, 33–44, https://doi.org/10.1002/eco.1313, 2012.
Medlyn, B. E., Duursma, R. A., Eamus, D., Ellsworth, D. S., Prentice, I. C., Barton, C. V., Crous, K. Y., De Angelis, P., Freeman, M., and Wingate, L.: Reconciling the optimal and empirical approaches to modelling stomatal conductance, Glob. Change Biol., 17, 2134–2144, https://doi.org/10.1111/j.1365-2486.2010.02375.x, 2011.
Mitra, S., Wassmann, R., and Vlek, P. L. G.: An appraisal of global wetland area and its organic carbon stock, Curr. Sci., 88, 25–35, http://www.jstor.org/stable/24110090 (last access: 22 June 2025), 2005.
Morison, M., van Beest, C., Macrae, M., Nwaishi, F., and Petrone, R.: Deeper burning in a boreal fen peatland 1-year post-wildfire accelerates recovery trajectory of carbon dioxide uptake, Ecohydrology, 14, e2277, https://doi.org/10.1002/eco.2277, 2021.
Nardini, A. and Salleo, S.: Limitation of stomatal conductance by hydraulic traits: sensing or preventing xylem cavitation?, Trees, 15, 14–24, https://doi.org/10.1007/s004680000071, 2000.
Nelson, J. A.: Code and examples of how to estimate transpiration from eddy covariance data, GitHub [code], https://github.com/jnelson18/ecosystem-transpiration (last access: 14 July 2025), 2020.
Nelson, J. A., Carvalhais, N., Cuntz, M., Delpierre, N., Knauer, J., Ogée, J., Migliavacca, M., Reichstein, M., and Jung, M.: Coupling Water and Carbon Fluxes to Constrain Estimates of Transpiration: The TEA Algorithm, J. Geophys. Res.-Biogeo., 123, 3617–3632, https://doi.org/10.1029/2018jg004727, 2018.
Nelson, J. A., Perez-Priego, O., Zhou, S., Poyatos, R., Zhang, Y., Blanken, P. D., Gimeno, T. E., Wohlfahrt, G., Desai, A. R., Gioli, B., Limousin, J. M., Bonal, D., Paul-Limoges, E., Scott, R. L., Varlagin, A., Fuchs, K., Montagnani, L., Wolf, S., Delpierre, N., Berveiller, D., Gharun, M., Belelli Marchesini, L., Gianelle, D., Sigut, L., Mammarella, I., Siebicke, L., Andrew Black, T., Knohl, A., Hortnagl, L., Magliulo, V., Besnard, S., Weber, U., Carvalhais, N., Migliavacca, M., Reichstein, M., and Jung, M.: Ecosystem transpiration and evaporation: Insights from three water flux partitioning methods across FLUXNET sites, Glob. Chang Biol., 26, 6916–6930, https://doi.org/10.1111/gcb.15314, 2020.
Novick, K. A., Oren, R., Stoy, P. C., Siqueira, M. B. S., and Katul, G. G.: Nocturnal evapotranspiration in eddy-covariance records from three co-located ecosystems in the Southeastern U.S.: Implications for annual fluxes, Agr. Forest Meteorol., 149, 1491–1504, https://doi.org/10.1016/j.agrformet.2009.04.005, 2009.
Pacheco-Cancino, P. A., Carrillo-López, R. F., Sepulveda-Jauregui, A., and Somos-Valenzuela, M. A.: Sphagnum mosses, the impact of disturbances and anthropogenic management actions on their ecological role in CO2 fluxes generated in peatland ecosystems, Glob. Change Biol., 30, e16972, https://doi.org/10.1111/gcb.16972, 2024.
Pastorello, G., Trotta, C., Canfora, E., Chu, H., Christianson, D., Cheah, Y.-W., Poindexter, C., Chen, J., Elbashandy, A., Humphrey, M., Isaac, P., Polidori, D., Reichstein, M., Ribeca, A., van Ingen, C., Vuichard, N., Zhang, L., Amiro, B., Ammann, C., Arain, M. A., Ardö, J., Arkebauer, T., Arndt, S. K., Arriga, N., Aubinet, M., Aurela, M., Baldocchi, D., Barr, A., Beamesderfer, E., Marchesini, L. B., Bergeron, O., Beringer, J., Bernhofer, C., Berveiller, D., Billesbach, D., Black, T. A., Blanken, P. D., Bohrer, G., Boike, J., Bolstad, P. V., Bonal, D., Bonnefond, J.-M., Bowling, D. R., Bracho, R., Brodeur, J., Brümmer, C., Buchmann, N., Burban, B., Burns, S. P., Buysse, P., Cale, P., Cavagna, M., Cellier, P., Chen, S., Chini, I., Christensen, T. R., Cleverly, J., Collalti, A., Consalvo, C., Cook, B. D., Cook, D., Coursolle, C., Cremonese, E., Curtis, P. S., D'Andrea, E., da Rocha, H., Dai, X., Davis, K. J., Cinti, B. D., Grandcourt, A. d., Ligne, A. D., De Oliveira, R. C., Delpierre, N., Desai, A. R., Di Bella, C. M., Tommasi, P. d., Dolman, H., Domingo, F., Dong, G., Dore, S., Duce, P., Dufrêne, E., Dunn, A., Duek, J., Eamus, D., Eichelmann, U., ElKhidir, H. A. M., Eugster, W., Ewenz, C. M., Ewers, B., Famulari, D., Fares, S., Feigenwinter, I., Feitz, A., Fensholt, R., Filippa, G., Fischer, M., Frank, J., Galvagno, M., Gharun, M., Gianelle, D., Gielen, B., Gioli, B., Gitelson, A., Goded, I., Goeckede, M., Goldstein, A. H., Gough, C. M., Goulden, M. L., Graf, A., Griebel, A., Gruening, C., Grünwald, T., Hammerle, A., Han, S., Han, X., Hansen, B. U., Hanson, C., Hatakka, J., He, Y., Hehn, M., Heinesch, B., Hinko-Najera, N., Hörtnagl, L., Hutley, L., Ibrom, A., Ikawa, H., Jackowicz-Korczynski, M., Janou, D., Jans, W., Jassal, R., Jiang, S., Kato, T., Khomik, M., Klatt, J., Knohl, A., Knox, S., Kobayashi, H., Koerber, G., Kolle, O., Kosugi, Y., Kotani, A., Kowalski, A., Kruijt, B., Kurbatova, J., Kutsch, W. L., Kwon, H., Launiainen, S., Laurila, T., Law, B., Leuning, R., Li, Y., Liddell, M., Limousin, J.-M., Lion, M., Liska, A. J., Lohila, A., López-Ballesteros, A., López-Blanco, E., Loubet, B., Loustau, D., Lucas-Moffat, A., Lüers, J., Ma, S., Macfarlane, C., Magliulo, V., Maier, R., Mammarella, I., Manca, G., Marcolla, B., Margolis, H. A., Marras, S., Massman, W., Mastepanov, M., Matamala, R., Matthes, J. H., Mazzenga, F., McCaughey, H., McHugh, I., McMillan, A. M. S., Merbold, L., Meyer, W., Meyers, T., Miller, S. D., Minerbi, S., Moderow, U., Monson, R. K., Montagnani, L., Moore, C. E., Moors, E., Moreaux, V., Moureaux, C., Munger, J. W., Nakai, T., Neirynck, J., Nesic, Z., Nicolini, G., Noormets, A., Northwood, M., Nosetto, M., Nouvellon, Y., Novick, K., Oechel, W., Olesen, J. E., Ourcival, J.-M., Papuga, S. A., Parmentier, F.-J., Paul-Limoges, E., Pavelka, M., Peichl, M., Pendall, E., Phillips, R. P., Pilegaard, K., Pirk, N., Posse, G., Powell, T., Prasse, H., Prober, S. M., Rambal, S., Rannik, Ü., Raz-Yaseef, N., Rebmann, C., Reed, D., Dios, V. R. d., Restrepo-Coupe, N., Reverter, B. R., Roland, M., Sabbatini, S., Sachs, T., Saleska, S. R., Sánchez-Cañete, E. P., Sanchez-Mejia, Z. M., Schmid, H. P., Schmidt, M., Schneider, K., Schrader, F., Schroder, I., Scott, R. L., Sedlák, P., Serrano-Ortíz, P., Shao, C., Shi, P., Shironya, I., Siebicke, L., igut, L., Silberstein, R., Sirca, C., Spano, D., Steinbrecher, R., Stevens, R. M., Sturtevant, C., Suyker, A., Tagesson, T., Takanashi, S., Tang, Y., Tapper, N., Thom, J., Tomassucci, M., Tuovinen, J.-P., Urbanski, S., Valentini, R., van der Molen, M., van Gorsel, E., van Huissteden, K., Varlagin, A., Verfaillie, J., Vesala, T., Vincke, C., Vitale, D., Vygodskaya, N., Walker, J. P., Walter-Shea, E., Wang, H., Weber, R., Westermann, S., Wille, C., Wofsy, S., Wohlfahrt, G., Wolf, S., Woodgate, W., Li, Y., Zampedri, R., Zhang, J., Zhou, G., Zona, D., Agarwal, D., Biraud, S., Torn, M., and Papale, D.: The FLUXNET2015 dataset and the ONEFlux processing pipeline for eddy covariance data, Sci. Data, 7, 225, https://doi.org/10.1038/s41597-020-0534-3, 2020.
Pérez-Priego, O. and Wutzler, T.: Partitioning eddy covariance ET using optimal approaches, GitHub [code], https://github.com/oscarperezpriego/ETpartitioning (last access: 14 July 2025), 2018.
Pérez-Priego, O., Katul, G., Reichstein, M., El-Madany, T. S., Ahrens, B., Carrara, A., Scanlon, T. M., and Migliavacca, M.: Partitioning eddy covariance water flux components using physiological and micrometeorological approaches, J. Geophys. Res.-Biogeo., 123, 3353–3370, https://doi.org/10.1029/2018JG004637, 2018.
Priestley, C. H. B. and Taylor, R. J.: On the Assessment of Surface Heat Flux and Evaporation Using Large-Scale Parameters, Mon. Weather Rev., 100, 81–92, https://doi.org/10.1175/1520-0493(1972)100<0081:OTAOSH>2.3.CO;2, 1972.
Proctor, M.: Physiological ecology: water relations, light and temperature responses, carbon balance, in: Bryophyte ecology, Springer, 333–381, https://doi.org/10.1007/978-94-009-5891-3_10, 1982.
Reich, E. G., Samuels-Crow, K., Bradford, J. B., Litvak, M., Schlaepfer, D. R., and Ogle, K.: A Semi-Mechanistic Model for Partitioning Evapotranspiration Reveals Transpiration Dominates the Water Flux in Drylands, J. Geophys. Res.-Biogeo., 129, e2023JG007914, https://doi.org/10.1029/2023jg007914, 2024.
Reichstein, M., Camps-Valls, G., Stevens, B., Jung, M., Denzler, J., Carvalhais, N., and Prabhat: Deep learning and process understanding for data-driven Earth system science, Nature, 566, 195–204, https://doi.org/10.1038/s41586-019-0912-1, 2019.
Reichstein, M., Falge, E., Baldocchi, D., Papale, D., Aubinet, M., Berbigier, P., Bernhofer, C., Buchmann, N., Gilmanov, T., Granier, A., Grünwald, T., Havránková, K., Ilvesniemi, H., Janous, D., Knohl, A., Laurila, T., Lohila, A., Loustau, D., Matteucci, G., Meyers, T., Miglietta, F., Ourcival, J. M., Pumpanen, J., Rambal, S., Rotenberg, E., Sanz, M., Tenhunen, J., Seufert, G., Vaccari, F., Vesala, T., Yakir, D., and Valentini, R.: On the separation of net ecosystem exchange into assimilation and ecosystem respiration: review and improved algorithm, Glob. Change Biol., 11, 1424–1439, https://doi.org/10.1111/j.1365-2486.2005.001002.x, 2005.
Rigden, A. J., Salvucci, G. D., Entekhabi, D., and Short Gianotti, D. J.: Partitioning Evapotranspiration Over the Continental United States Using Weather Station Data, Geophys. Res. Lett., 45, 9605–9613, https://doi.org/10.1029/2018gl079121, 2018.
Rouse, W. R.: The energy and water balance of high-latitude wetlands: controls and extrapolation, Glob. Change Biol., 6, 59–68, https://doi.org/10.1046/j.1365-2486.2000.06013.x, 2000.
Scanlon, T. M. and Kustas, W. P.: Partitioning carbon dioxide and water vapor fluxes using correlation analysis, Agr. Forest Meteorol., 150, 89–99, https://doi.org/10.1016/j.agrformet.2009.09.005, 2010.
Scanlon, T. M., Schmidt, D. F., and Skaggs, T. H.: Correlation-based flux partitioning of water vapor and carbon dioxide fluxes: Method simplification and estimation of canopy water use efficiency, Agr. Forest Meteorol., 279, 107732, https://doi.org/10.1016/j.agrformet.2019.107732, 2019.
Scott, R. L. and Biederman, J. A.: Partitioning evapotranspiration using long-term carbon dioxide and water vapor fluxes, Geophys. Res. Lett., 44, 6833–6840, https://doi.org/10.1002/2017GL074324, 2017.
Speranskaya, L., Campbell, D. I., Lafleur, P. M., and Humphreys, E. R.: Peatland evaporation across hemispheres: contrasting controls and sensitivity to climate warming driven by plant functional types, Biogeosciences, 21, 1173–1190, https://doi.org/10.5194/bg-21-1173-2024, 2024.
Stapleton, A.: ETPartitioning, GitHub [code], https://github.com/AdamStapleton/ETPartitioning (last access: 22 June 2026), 2022.
Stapleton, A.: ETPartitioning, GitHub [code], https://github.com/AdamStapleton/ETPartitioning (last access: 22 June 2026), 2022.
Stapleton, A., Eichelmann, E., and Roantree, M.: A framework for constructing machine learning models with feature set optimisation for evapotranspiration partitioning, Appl. Comput. Geosci., 16, 100105, https://doi.org/10.1016/j.acags.2022.100105, 2022.
Stoy, P. C., El-Madany, T. S., Fisher, J. B., Gentine, P., Gerken, T., Good, S. P., Klosterhalfen, A., Liu, S., Miralles, D. G., Perez-Priego, O., Rigden, A. J., Skaggs, T. H., Wohlfahrt, G., Anderson, R. G., Coenders-Gerrits, A. M. J., Jung, M., Maes, W. H., Mammarella, I., Mauder, M., Migliavacca, M., Nelson, J. A., Poyatos, R., Reichstein, M., Scott, R. L., and Wolf, S.: Reviews and syntheses: Turning the challenges of partitioning ecosystem evaporation and transpiration into opportunities, Biogeosciences, 16, 3747–3775, https://doi.org/10.5194/bg-16-3747-2019, 2019.
Strack, M., Davidson, S. J., Hirano, T., and Dunn, C.: The potential of peatlands as nature-based climate solutions, Current Climate Change Reports, 8, 71–82, https://doi.org/10.1007/s40641-022-00183-9, 2022.
Strack, M., Cagampan, J., Fard, G. H., Keith, A., Nugent, K., Rankin, T., Robinson, C., Strachan, I., Waddington, J., and Xu, B.: Controls on plot-scale growing season CO2 and CH4 fluxes in restored peatlands: Do they differ from unrestored and natural sites?, Mires Peat, 16, https://doi.org/10.19189/MaP.2015.OMB.216, 2016.
Street, L. E., Subke, J. A., Sommerkorn, M., Sloan, V., Ducrotoy, H., Phoenix, G. K., and Williams, M.: The role of mosses in carbon uptake and partitioning in arctic vegetation, New Phytol., 199, 163–175, https://doi.org/10.1111/nph.12285, 2013.
Streich, S. C. and Westbrook, C. J.: Hydrological function of a mountain fen at low elevation under dry conditions, Hydrol. Process., 34, 244–257, https://doi.org/10.1002/hyp.13579, 2020.
Sulman, B. N., Roman, D. T., Scanlon, T. M., Wang, L., and Novick, K. A.: Comparing methods for partitioning a decade of carbon dioxide and water vapor fluxes in a temperate forest, Agr. Forest Meteorol., 226/227, 229–245, https://doi.org/10.1016/j.agrformet.2016.06.002, 2016.
Thomas, C., Martin, J. G., Göckede, M., Siqueira, M., Foken, T., Law, B. E., Loescher, H., and Katul, G.: Estimating daytime subcanopy respiration from conditional sampling methods applied to multi-scalar high frequency turbulence time series, Agr. Forest Meteorol., 148, 1210–1229, https://doi.org/10.1016/j.agrformet.2008.03.002, 2008.
van Beest, C.: Deeper Burning Increases Available Phosphorus, Promotes Moss Growth, and Carbon Dioxide Uptake in a Fen Peatland One-Year Post-Wildfire in Fort McMurray, AB, University of Waterloo, http://hdl.handle.net/10012/14429 (last access: 22 June 2026), 2019.
Walker, A. P., Carter, K. R., Gu, L., Hanson, P. J., Malhotra, A., Norby, R. J., Sebestyen, S. D., Wullschleger, S. D., and Weston, D. J.: Biophysical drivers of seasonal variability in Sphagnum gross primary production in a northern temperate bog, J. Geophys. Res.-Biogeo., 122, 1078–1097, https://doi.org/10.1002/2016JG003711, 2017.
Wang, Y.: Uncovering the understudied role of microtopography and ground cover on evapotranspiration partitioning in high-elevation wetlands in the Canadian Rocky Mountains, Doctoral dissertation, University of Waterloo, https://hdl.handle.net/10012/21395 (last access: 22 June 2026), 2025.
Wang, Y. and Petrone, R. M.: Effects of microforms on the evaporation of peat-bryophyte-litter column in a montane peatland in Canadian Rocky Mountain, Ecohydrology, 16, e2516, https://doi.org/10.1002/eco.2516, 2022.
Wang, Y., Petrone, R. M., and Van Huizen, B.: The dependence of evaporative efficiency of vegetated surfaces on ground cover mass fractions in vegetated soils in mesic ecosystems, Hydrol. Process., 37, e15036, https://doi.org/10.1002/hyp.15036, 2023.
Warren, R. K., Pappas, C., Helbig, M., Chasmer, L. E., Berg, A. A., Baltzer, J. L., Quinton, W. L., and Sonnentag, O.: Minor contribution of overstorey transpiration to landscape evapotranspiration in boreal permafrost peatlands, Ecohydrology, 11, e1975, https://doi.org/10.1002/eco.1975, 2018.
Weaver, K. F., Morales, V., Dunn, S. L., Godde, K., and Weaver, P. F.: Pearson's and Spearman's Correlation, in: An Introduction to Statistical Analysis in Research, John Wiley & Sons, Inc., 435–471, https://doi.org/10.1002/9781119454205.ch10, 2017.
Webb, E. K., Pearman, G. I., and Leuning, R.: Correction of flux measurements for density effects due to heat and water vapour transfer, Q. J. Roy. Meteorol. Soc., 106, 85–100, https://doi.org/10.1002/qj.49710644707, 1980.
Wei, Z., Yoshimura, K., Wang, L., Miralles, D. G., Jasechko, S., and Lee, X.: Revisiting the contribution of transpiration to global terrestrial evapotranspiration, Geophys. Res. Lett., 44, 2792–2801, https://doi.org/10.1002/2016GL072235, 2017.
Wu, J., Kutzbach, L., Jager, D., Wille, C., and Wilmking, M.: Evapotranspiration dynamics in a boreal peatland and its impact on the water and energy balance, J. Geophys. Res.-Biogeo., 115, https://doi.org/10.1029/2009JG001075, 2010.
Xu, S., Ma, T., and Liu, Y.: Application of a multi-cylinder evapotranspirometer method for evapotranspiration measurements in wetlands, Aquat. Bot., 95, 45–50, https://doi.org/10.1016/j.aquabot.2011.03.009, 2011.
Zahn, E.: Processing Eddy-Covariance Data: Five ET Flux Partitioning Methods (2.0.0), GitHub [code], https://github.com/einaraz/PartitioningMethods/releases/tag/v2.0.0 (last access: 7 May 2025), 2024.
Yu, L., Zhou, S., Zhao, X., Gao, X., Jiang, K., Zhang, B., Cheng, L., Song, X., and Siddique, K. H.: Evapotranspiration partitioning based on leaf and ecosystem water use efficiency, Water Resour. Res., 58, e2021WR030629, https://doi.org/10.1029/2021WR030629, 2022.
Zahn, E.: Processing Eddy-Covariance Data: Five ET Flux Partitioning Methods (2.0.0), GitHub [code], https://github.com/einaraz/PartitioningMethods/releases/tag/v2.0.0 (last access: 7 May 2025), 2024.
Zahn, E., Ghannam, K., Chamecki, M., Moene, A. F., Kustas, W. P., Good, S., and Bou-Zeid, E.: Numerical investigation of observational flux partitioning methods for water vapor and carbon dioxide, J. Geophys. Res.-Biogeo., 129, e2024JG008025, https://doi.org/10.1029/2024JG008025, 2024.
Zahn, E., Bou-Zeid, E., Good, S. P., Katul, G. G., Thomas, C. K., Ghannam, K., Smith, J. A., Chamecki, M., Dias, N. L., and Fuentes, J. D.: Direct partitioning of eddy-covariance water and carbon dioxide fluxes into ground and plant components, Agr. Forest Meteorol., 315, 108790, https://doi.org/10.1016/j.agrformet.2021.108790, 2022.
Zhang, S., Zhang, J., Liu, B., Zhang, W., Gong, C., Jiang, M., and Lv, X.: Evapotranspiration partitioning using a simple isotope-based model in a semiarid marsh wetland in northeastern China, Hydrol. Process., 32, 493–506, https://doi.org/10.1002/hyp.11430, 2018.
Zhou, S., Yu, B., Huang, Y., and Wang, G.: Daily underlying water use efficiency for AmeriFlux sites, J. Geophys. Res.-Biogeo., 120, 887–902, https://doi.org/10.1002/2015jg002947, 2015.
Zhou, S., Yu, B., Zhang, Y., Huang, Y., and Wang, G.: Partitioning evapotranspiration based on the concept of underlying water use efficiency, Water Resour. Res., 52, 1160–1175, https://doi.org/10.1002/2015wr017766, 2016.