
the Creative Commons Attribution 4.0 License.
the Creative Commons Attribution 4.0 License.
 | 13 Oct 2026
Temperate marine macrophytes are highly variable sources of Biogenic Volatile Organic Compounds – a comparative study from the Baltic Sea and NE Atlantic

Jian Zhao
Claudia L. Cara-Ortega
Kirsten N. Fossum
Frans Graeffe
Lu Lei
Dagmar B. Stengel
Roseline C. Thakur
Jurgita Ovadnevaite
Mikael Ehn
Camilla Gustafsson
Biogenic Volatile Organic Compounds (BVOC), emitted by Earth's ecosystems, affect several chemical processes in the atmosphere that have profound climate impacts. Despite their climate relevance, global BVOC budget estimations are still highly uncertain, with ocean-derived emissions being particularly poorly constrained. Marine macrophytes (i.e. macroalgae and seagrass) are a large and widespread organismal group whose BVOC emission rates are particularly poorly quantified. In this study, we set out to address this knowledge gap by quantifying ex situ the BVOC emission rates of three temperate macrophytes (Zostera marina, Fucus vesiculosus and Ulva intestinalis) with a Vocus proton-transfer-reaction time-of-flight mass spectrometer (Vocus PTR-TOF-MS). To capture and improve our understanding of the variability of macrophyte BVOC emissions, our quantifications were repeated across two contrasting coastal regions: the northeastern Atlantic (Ireland) and northern Baltic Sea (Finland). The three macrophytes emitted a wide range of BVOCs, with a total of 166 different compounds detected. Although many BVOCs were emitted by all macrophytes, significant differences were observed in the total emission profiles, both between and within species. Interestingly, the seagrass Zostera exhibited significantly higher overall BVOC emission rates per unit biomass than the two macroalgae and showed clearly differing intraspecific emission profiles across the two regions. Regarding individual compounds, dimethyl sulfide (DMS) was emitted at the highest rates, but many other compounds (e.g., sesquiterpenes and C10H21O+) also displayed notable emission rates. Although many of the observed BVOCs are commonly investigated compounds (e.g., DMS and terpenoids), our results show that macrophyte BVOC emissions comprise a large number of different compounds, suggesting that future studies would benefit from targeting a wider range of BVOCs than currently considered. Our results highlight macrophytes as highly variable sources of BVOCs, whose better inclusion into marine BVOC budgets should be strived for. However, more robust data are needed, and future research should also focus on investigating the dynamics driving macrophyte BVOC emissions, their variability, and their eventual fate in the environment.
- Article
(2283 KB) - Full-text XML
-
Supplement
(1048 KB) - BibTeX
- EndNote


Volatile Organic Compounds (VOCs) comprise thousands of molecules with low boiling points and high saturation vapor pressures. VOCs are emitted by many natural and anthropogenic sources into the atmosphere and drive the formation of ozone and secondary organic aerosol as well as prolong the lifetime of methane by reducing atmospheric oxidation capacity (Guenther et al., 2012; Boy et al., 2022). Aerosols provide a net cooling effect on the climate, as they increase solar scattering and can form cloud condensation nuclei (CCN) driving the formation of new clouds and altering cloud properties (e.g., reflectivity, lifetime, and extent; Gantt et al., 2012). Beyond their role in climate forcing, VOCs and aerosols also influence air quality and human health by contributing to the formation of secondary pollutants (Arfin et al., 2023). Through these chemical processes, VOCs have a substantial effect on atmospheric chemistry and the climate, which makes it important to understand the various sources contributing to the global atmospheric VOC-budget. Biogenic volatile organic compounds (BVOCs), originating from the natural world in contrast to anthropogenic sources, make up the majority (> 80 %) of the total global VOC budget (Guenther et al., 1995; Carpenter et al., 2012). It is well known that terrestrial ecosystems (forests at the forefront) emit BVOCs in massive quantities, but major knowledge gaps exist concerning BVOC emissions originating from the oceans and coasts (Pozzer et al., 2022; Exton et al., 2015; Zhao et al., 2023; Wang et al., 2025); as a result, the contributions of marine life to the global budget of VOCs are still poorly defined (Yu and Li, 2021) and require further attention.
In the marine realm, most research on BVOC emissions has focused on the open oceans, phytoplankton, and the most emitted marine BVOC, dimethyl sulfide (DMS) (e.g., Carpenter et al., 2012; Zhao et al., 2023; Yu and Li, 2021; Wang et al., 2025). Generally, high primary productivity drives higher marine BVOC emissions and nutrient-rich productive coastal areas exhibit higher BVOC concentrations and higher loadings of organics in the marine aerosols than open oceans (Wang et al., 2025; Fu et al., 2011; Kang et al., 2018). Phytoplankton, especially during and after blooms, emit large quantities of BVOCs into the water, that due to the close proximity to the sea-air interface can enter the atmosphere in large quantities. Through their BVOC emissions, phytoplankton directly affect climatic processes (e.g., marine secondary organic aerosol production). For instance, DMS emissions have a strong impact on the marine sulfur cycle and the global sulfur budget (Stefels et al., 2007; Asher et al., 2017). When DMS is released into the atmosphere, it can be oxidized to sulphuric acid, which in turn is an important driver of new atmospheric aerosol particles and subsequently CCN (Hoffmann et al., 2016). Although DMS has been the major focal point for marine BVOC research, emissions of many other BVOCs have been recorded, including other sulfur containing compounds, terpenoids, nitrogen-containing compounds, and volatile halocarbons (Zhao et al., 2023; Wang et al., 2025). However, oceans are vast and biologically diverse making measuring BVOCs emissions from marine areas both challenging and expensive, which has made synthesising marine BVOC emissions difficult. Therefore, current atmospheric models still underestimate marine BVOC emissions (Wang et al., 2025) and to fill these gaps, more data and a broader understanding of marine BVOC dynamics are needed. Overall, there is an increasing need to better understand the biology underlying marine BVOC emissions. Although phytoplankton are the largest biological sources of BVOCs in the oceans, the strong focus on this particular organismal group might have concealed the importance of other marine primary producers, especially in productive coastal areas.
Benthic macrophytes (seagrasses and macroalgae) are primary producers that grow on shallow bottoms along coastal seas and often form the foundation of marine ecosystems. The organisms and the ecosystems they create sustain many vital ecosystem services such as coastal protection, carbon sequestration and fisheries production (Nordlund et al., 2016; Eger et al., 2023). Although the organisms are known to produce a large variety of BVOCs, the rates at which macrophytes (and especially seagrasses) release BVOCs are poorly quantified (Saunier et al., 2025a) and therefore their contribution to the global atmospheric BVOC-budget remains largely undefined. The potential quantities of BVOC-emissions are substantial, as these organisms cover significant areas globally (macroalgae > 6 million km2 and seagrass meadows > 250 000 km2; Duarte et al., 2022; McKenzie et al., 2020), support high biomass year-round (unlike phytoplankton with a more ephemeral occurrence through blooms) and grow at shallow depths close to the sea-air interface. However, to elucidate this potential, more high-quality quantitative emission rate data are needed. Many previous macrophyte BVOC studies have been done destructively, e.g., by measuring BVOC contents of ground plant material (Rubino et al., 2022; Horinca et al., 2014; Jerković et al., 2018; Coquin et al., 2024). While such studies can provide valuable information about the BVOCs produced by macrophytes, they do not provide information about which BVOCs are emitted into the water nor at what rates. BVOC measurements have also often been done with methods that allow accurate qualitative identification of volatile compounds (e.g., gas chromatography–mass spectrometry, GC-MS) but lack the ability to quantify emission rates (Maruti et al., 2018; Wada and Hama, 2012). Several studies have also focused on measuring emission rates of only certain compound groups (e.g., halocarbons; Abrahamsson et al., 2003; Leedham Elvidge et al., 2013) or specific compounds (e.g., isoprene; Hrebien et al., 2021), which makes the data-incorporation to total BVOC-budgets challenging. Finally, many experiments that have quantified macrophyte emission rates, have been performed during low tide conditions (i.e. organisms exposed to the atmosphere, e.g., Sartin et al., 2001, 2002), and although valuable, these data do not necessarily correspond to emissions that occur while the organisms are submerged underwater. Hence, only a few studies have measured emission rates of submerged marine macrophytes (e.g., Saunier et al., 2025b; Bravo-Linares et al., 2010), and more data and insights are needed to establish impact and variability of macrophyte BVOC emissions.
In this study, we set out to quantify the underwater BVOC emission rates of three benthic macrophytes (the seagrass Zostera marina L., brown algae Fucus vesiculosus L. and green algae Ulva intestinalis L.) that are commonly found in temperate waters around the Northern Hemisphere. Common eelgrass (Z. marina) is the most widespread and well-studied seagrass species in the Northern Hemisphere, but only limited knowledge exists about the BVOCs these plants emit naturally (qualitative but destructive sampling presented in Coquin et al., 2024) and no BVOC emissions rates have previously been quantified. Gut weed (U. intestinalis) and bladderwrack (F. vesiculosus) are macroalgae, and while some information exists about their BVOC emissions into air (e.g., Bravo-Linares et al., 2010; Broadgate et al., 2004; Horincar et al., 2014), BVOC emissions during submersion are poorly understood and quantified. Here, we used a Vocus proton-transfer-reaction time-of-flight mass spectrometer (Vocus PTR-TOF-MS) to quantify BVOC emission rates in controlled incubation experiments. The selected macrophytes were collected from two marine regions that differ substantially from each other, the oceanic eastern Atlantic (Ireland) and brackish Baltic Sea (Finland). The markedly different environmental conditions (e.g., salinity, annual temperature range, submersion regimes) impact the physiology of the macrophytes (e.g. Bäck et al., 1992), but all three species still commonly occur in both marine regions. Using this comparative approach, our main aims were to establish (1) the type and rate of BVOCs emitted by these three common macrophytes, (2) how similar/dissimilar BVOC emissions are between the different macrophyte species and (3) how variable the emissions are within-species when comparing two marine regions with very differing environmental conditions. Hence, the overarching goal was to advance our understanding of BVOC emission rates originating from temperate marine macrophytes and provide an important step towards clarifying how these primary producers contribute to coastal and global BVOC budgets.
2.1 Study regions
The fieldwork and BVOC-measurements were performed in May and August 2025, in Ireland and Finland, respectively. In Ireland, BVOC measurements were performed at Mace Head Atmospheric Research Station (MHD), that is situated on the west coast of Ireland on the shore of the North Atlantic Ocean (Fig. 1a). In Finland, measurements were conducted at Tvärminne Zoological Station (TZS) that is located on the southern tip of Finland next to the Baltic Sea (Fig. 1a). Due to the stations' excellent placement, all macrophytes were collected from the near vicinity of the respective stations.

Figure 1(a) Locations of the two study sites in Europe. (b) Schematic of the incubation setup. (c) Example data of three compounds with differing responses (see Sect. 2.6 for details on interpretation) after macrophyte addition: green line = Emission that quickly stabilizes, blue line = Emission that keeps increasing, and grey line = Uptake. Macrophyte image from Integration and Application Network (IAN), University of Maryland Center for Environmental Science (https://ian.umces.edu/, last access: 28 September 2026).
The environment and local biology differ considerably between the studied marine regions. At Mace Head, salinity fluctuates around 30 psu, while in the brackish waters outside TZS salinity is quite stable around 5–6 psu. The Finnish coastal waters experience large annual temperature fluctuations, reaching > 20 °C in the summer and freezing conditions during the winter months, while on the Irish coast the seawater fluctuates less (6.5–18.5 °C at COMPASS Mace Head Buoy 2 km of the coast; data through https://erddap.marine.ie/, last access: 28 September 2026). Coincidentally, during both campaigns, the relevant sea areas were experiencing marine heatwaves, with seawater reaching over 20 °C in the shallows outside Mace Head in May (personal observation, 16 °C measured at Mace Head Buoy) and over 22 °C on the Finnish coast in August (Monitoring data from TZS, MONICOAST: http://www.helsinki.fi/monicoast, last access: 28 September 2026). The Baltic Sea is well known to be highly eutrophic, which has considerable effects on local biology e.g., high pelagic and filamentous algae production that affects benthic light availability. On the west coast of Ireland seawater is less nutrient-rich, translating to better visibility and lower biological activity in the water column. Tidal regime also differs significantly between regions. At Mace Head, low tide occurs twice a day (tidal difference during campaign ∼ 3 m), while the coastal areas of Finland are tideless, though some water-level fluctuations occur irregularly due to weather-related drivers (e.g. atmospheric pressure, wind).
2.2 Seawater collection and treatment
At both study sites, the seawater used in experiments was pumped from a depth of approximately 5 m from the nearby sea (Ireland: Carna Research Station which is about 5 km from MHD; Finland: TZS). Prior to the experiments in Ireland, we evaluated whether background signal quality could be improved by filtering the seawater (5 µm pore filter) and autoclaving (121 °C for 20 min) the filtered seawater. Filtering the water improved the background signal, while autoclaving worsened the measurement quality by increasing certain BVOC emissions. Although the exact source of these increased emissions could not be identified, we assume that they originated either from the plastic canister in which the water was autoclaved or from microorganisms that burst due to the sterilisation process. Based on these findings, filtered but not autoclaved seawater was used at both study sites (5 µm filter in Ireland and 0.2 µm filter in Finland). In Finland, the finer filter was necessary to reach satisfactory background measurements due to high amounts of organic particles/microorganisms being present in the water. Additionally, before measurements, the filtered seawater was bubbled in 20 L containers for at least 12 h to further reduce BVOC concentrations in background measurements. This practice was added to the measurement protocol after test incubations revealed high DMS concentrations in the background measurements that did not stabilize during the incubation, thereby negatively affecting the quality of the results.
2.3 Macrophyte collection
The three selected macrophyte species belong to distinct organismal groups. Bladderwrack (Fucus vesiculosus, hereafter Fucus) is a perennial brown macroalgae (Orchrophyta, Phaeophyceae) that usually grows attached to rocky substrates. Gut weed (Ulva intestinalis, hereafter Ulva) is a green macroalgae (Chlorophyta, Ulvophyceae), that unlike the two other species investigated has an annual lifecycle. Common eelgrass (Zostera marina, hereafter Zostera) is a perennial marine flowering plant (Zosteraceae, Angiospermae). It has roots that anchor it to soft-sedimentary seafloors where it can create dense underwater meadows.
Macrophytes were collected in the morning of emission measurements and kept in mesh bags submerged in the sea prior to incubations. During both campaigns, we collected and measured all replicates (n=5) per species during the same day and all three species during the same week. The different macrophyte species were measured on separate days, because it was not feasible to collect Zostera every day and we wanted to measure BVOC emissions from fresh specimens. Zostera was collected by snorkeling in Ireland (1 m depth during low tide) and by SCUBA in Finland (4 m depth). Instead of individual plants, Zostera replicates consisted of bundles of shoots (each shoot attached to an individual rhizome), averaging 22 shoots in Ireland and 15 in Finland. The shoot counts differed between countries, because plants were larger in Finland, and > 20 shoots would not have fit in the incubation flask. Each Ulva replicate consisted of algae thalli (fronds) collected from a specific rockpool. Hence, Ulva from 5 separate rockpools were measured at both study sites ensuring independent material. Replicates of Fucus consisted of individual intact thalli that were gently removed from the rocky substrate. The collection of Fucus replicates was semi-random, because the algae had to be small enough to fit the 5 L incubation-flask. At Mace Head, Fucus grows in the intertidal zone and falls dry twice a day, while Fucus in the northern Baltic Sea always remain submerged.
Before measuring their BVOC-emissions, the macrophytes were carefully cleaned and rinsed with filtered seawater to remove sediment and most visible epibiota. After cleaning, small amounts of filamentous algae remained attached to Zostera and Fucus replicates, but > 95 % of the biomass consisted of the target species. It was especially important to rinse Ulva-replicates, because during test incubations we noticed that unrinsed replicates released certain BVOCs at very high concentrations immediately when the algae were submerged in the flask, which was likely due to a priori accumulation of BVOCs on the surface of the algal matrix. This was unwanted as it obscured the measurement of real-time emission rates.
2.4 Vocus PTR-TOF-MS
BVOCs were measured using a Vocus proton-transfer-reaction time-of-flight mass spectrometer (Vocus PTR-TOF, Tofwerk AG/Aerodyne Research, Inc.), a high-sensitivity instrument described by Krechmer et al. (2018). The instrument is designed to continuously quantify BVOC concentrations in the air but has rarely been used to measure BVOC concentrations in water. The system employs a low-pressure discharge reagent ion source to generate H3O+ ions, which are then coupled to a Focusing Ion-Molecule Reactor (FIMR). The FIMR consists of a resistive glass tube with a radio frequency (RF) quadrupole field that collimates the ion beam, minimizing wall losses. For this study, the FIMR was operated at a reactor pressure of 2.5 mbar and an axial voltage gradient of 450 V, resulting in an E N ratio (electric field to gas number density) of approximately 120 Td. The reactor temperature was maintained at 100 °C. Ions were detected by a time-of-flight mass spectrometer operating with a mass resolving power of at 100 Th. Data were acquired at a time resolution of 6 s.
The ionization mechanism in the Vocus PTR-TOF-MS is proton transfer reaction, which is a relatively “soft” ionization technique that predominantly yields the protonated molecular ion (MH+) for most compounds of interest, though fragmentation becomes more common with larger and more functionalized molecules (Zhang et al., 2025; Li et al., 2022). The selectivity of the Vocus PTR-TOF-MS is primarily governed by the proton affinity (PA) of the target analytes relative to the reagent ions. Using H3O+ as the reagent ion, the instrument selectively ionizes VOCs with a PA greater than that of water (691 kJ mol−1), efficiently suppressing the detection of major atmospheric constituents such as N2, CO, and others. The sensitivity of the Vocus PTR-TOF-MS is influenced by the proton affinity, fragmentation patterns, and transmission efficiencies of the analytes. Fragmentation can occur depending on the functional groups present and the energetic conditions within the reactor. In the Vocus FIMR, the collision energy is modulated by the E N ratio. For this study, the reactor conditions were optimized to balance the suppression of water clusters and minimize collision-induced dissociation.
For any analyte molecule, knowledge of its proton transfer rate constant (kPTR) and the instrument's response to VOC standards under the applied operating conditions allows straightforward determination of the Vocus PTR-TOF-MS sensitivity for that molecule. During the campaign, the Vocus PTR-TOF-MS was calibrated weekly using a gas-phase standard (Apel-Riemer Environmental, Inc.), which contained 19 compounds. The sensitivity of these compounds can be found in Table S1 in the Supplement. Based on the calibration results of known compounds in the gas mixture, the transmission efficiency and the relationship between kPTR and sensitivity factors were determined, as shown in Figs. S1 and S2 in the Supplement. For detected species with known PA, the sensitivity factors can be calculated based on the established relationship between kPTR and sensitivity. For compounds with unknown PA, we used an averaged kPTR value of 2.5 × 10⁻⁹ cm3 molec.−1 s−1. The error introduced by this assumption is less than 50 %, assuming no significant fragmentation occurs during ionization.
2.5 Experimental and analytical setup
Incubations were performed in a 5 L borosilicate glass filtration flask (Schott Duran), made airtight during incubations with custom-made Teflon corks. Before the start of each incubation, the airtightness of the flask and incubation setup was checked with a flowmeter. During the whole measurement period (30 min), the seawater was purged with clean air (produced by Vocus ZeroAir-generator) through a Teflon tube with a flow rate of 0.2 L min−1 (Fig. 1b). The purging flow was pushed through a metallic bubbling stone that created small bubbles, increasing the area of the purged air and enhancing the effectiveness of capturing and transporting BVOCs into the headspace. From the headspace, the 0.2 L min−1 flow containing purged BVOCs continued out from the flask through another Teflon-tube. Before entering the Vocus PTR-TOF-MS, the flow was mixed with a clean air dilution flow (0.2 L min−1) to decrease the humidity and thereby risks for water condensation in the lines or in the filter (PTFE membrane filter, pore size 1.0 µm, Advantec MFS. Inc.) in front of the Vocus. Of the total 0.4 L min−1 flow, 0.1 L min−1 entered the PTR, while the rest was pumped out from the system or exhausted (Fig. 1b). The flows were controlled by mass flow controllers (Alicat Scientific, Inc. USA).
For the background measurements, the flask was filled with 4.5 L of pre-bubbled filtered seawater, leaving 1 L of headspace for BVOC measurements by PTR-TOF-MS (yielding a total of 5.5 L, as the neck volume is excluded from the nominal flask capacity). Immediately after finishing a background measurement, a macrophyte-replicate was added to the flask (without replacing the seawater) and its BVOC emissions were measured. The macrophytes were tied to Teflon sticks to keep them submerged. During all incubations, the flask was illuminated by two LED-lamps with light spectrums suitable for submerged plants (Fluval Plant LED). The light environment inside the flask corresponded to ∼ 200 PAR (Photosynthetically Active Radiation). The seawater temperature in all incubations was ∼ 20 °C, similar to ambient seawater temperatures during both campaigns (see Sect. 2.1). BVOC emissions from both background and macrophyte replicates were purged and measured continuously for 30 min. All replicates were measured in the same glass flask, which was rinsed twice with Milli-Q water between replicates and subsequently filled with fresh pre-bubbled filtered seawater. After measurements, the macrophyte-replicates were dried (60 °C, 48 h) to acquire their individual dry weight (hereafter DW).
2.6 Identification of BVOC emissions and data extraction
Post-processing of Vocus PTR-TOF-MS data was performed using the data analysis package “Tofware” (version 4.0.2, http://www.tofwerk.com/tofware, last access: 28 September 2026) running in the Igor Pro (Wavemetrics, v.9.0, OR, USA) environment. High-resolution peak fitting was conducted to deconvolve overlapping isobaric ions, sharing the same nominal mass. The peak shape was determined empirically from isolated high-intensity ions and applied to fit the entire mass spectrum. Molecular formulas were assigned to fit peaks based on mass defects and isotopic pattern matching. BVOC emissions were identified by evaluating time-series data for all identified peaks ( 19–400 Th). A peak was classified as a macrophyte-derived BVOC and included in subsequent analyses, if a distinct change relative to the seawater background was observed in at least three out of the five replicates within an experimental group.
Despite filtering and pre-bubbling of seawater background measurements did not always properly stabilize during the incubation period, which also affected the quality of the subsequent measurement of macrophyte BVOC emissions. For instance, if the seawater contained high concentrations of a BVOC that continued to decrease during the entire background measurement, it could mask emissions from the macrophytes (BG1 and Sample1 in Fig. S3). Due to failed background measurements, two replicates (a Finnish Zostera- and Ulva-replicate) were removed from further analysis. Problems with background measurements also occurred in other replicates (mainly in Finland) for individual data points (e.g., first data point in Fig. S3) and if the results were deemed unreliable in the data preprocessing stage, the data points were classified as NA in the final data set.
For emission rate calculations (see Sect. 2.7), we only used data collected during the last 15 min of both background and macrophyte incubations. The emissions of most compounds reached a stable plateau in the first 15 min of the measurements (Figs. 1c, S3), but the concentration of some compounds kept increasing during the whole measurement period. The compounds that stabilized are assumed to be limited by the emission rate of the macrophyte, and their transfer from the water into the sampled air is rapid. This is the case for poorly soluble compounds, such as hydrocarbons. The compounds that kept increasing throughout the measurement are most likely the more water-soluble compounds (e.g., Br2CH+ and DMS; Table S2) for which the concentrations in the sample air are more limited by water-to-air transfer. All data points (1 measurement/minute for each compound) from the last 15 min were averaged, after which the background averages were subtracted from the macrophyte averages to acquire cps-values (counts per second) for how much macrophytes were emitting each compound. The raw signal intensities (counts per second) were converted to mixing ratios (ppb) using reaction rate constants and the instrument-specific transmission curve as described in Sect. 2.4. Emission rates could then be accurately deduced for compounds whose concentrations stabilized during the incubations (see Sect. 2.7). For compounds that failed to reach a stable concentration, the emission rates could still be estimated, though these estimates are not considered accurate because they systematically underestimate the true emissions (all instances marked in Table S2). Despite underestimations, the comparisons between experimental groups for these compounds are valid due to the same sampling period across all replicates. Some BVOCs also clearly decreased following the addition of a macrophyte (Fig. 1c). We attribute this behaviour to uptake of BVOCs, but did not attempt to determine any uptake rates, as the observed decrease will depend on the initial concentrations available in the background water and possible balances between emission and uptake. All instances where BVOCs were taken up during macrophyte incubations are listed in the supplementary materials (Table S2).
The use of a Vocus PTR-TOF-MS allowed us to detect the emissions of a large range of compounds (C1–C15; Excel). However, when a Vocus PTR-TOF-MS is used as the sole analytical method the exact identity of the measured molecules cannot usually be identified, because the method is mass-selective, which means that isomers cannot be separately distinguished. Therefore, we used the GLOVOCS-database (Yáñez-Serrano et al., 2021) to assign potential identities to our measured compounds (Table S3). Most compounds have several potential identities and although the GLOVOCS database is extensive, many especially larger compounds were not found in the database. Certain well studied compounds could with good confidence be appointed their identity (e.g., C2H7S DMS).
2.7 Emission rate calculation
Emission rates standardized to macrophyte mass (ERmass; ng g−1 h−1) for the emission-data collected with the Vocus PTR-TOF-MS were calculated using the following equations:
where is the emission rate in moles min−1, Cppb is the measured ppb-concentration of each emitted compound, Nppb is the number of molecules corresponding to 1 ppb (2.5×10¹⁰ molec. cm−3), D stands for the dilution (=2 in this study), Fflow is the purging flow (0.2 L min cm3 min−1), NA is the Avogadro constant, Mm is the molar mass of emitted compounds, DW is the dry weight of incubated macrophyte, th is for 60 min h−1. To express emission rates in ng g−1 h−1, the calculated emission rates were multiplied by 109 to convert from grams to nanograms.
2.8 Data analysis
All statistical analyses were performed in RStudio (R version 4.3.0; R Core Team, 2023). AI models were used to assist with writing parts of the R code, but AI was never allowed to work directly with the data. We used non-metric multidimensional scaling (NMDS) to visualize patterns and variability in BVOC profiles across replicates. As NMDS requires complete data, we removed compounds that contained NA-values from the ordination analysis. This resulted in the NMDS being performed on 117 compounds of the total 170 detected compounds (166 compounds showing emissions and 4 compounds that were only taken up in the dataset). Prior to analysis, BVOC variables were standardized (z-score transformation) to account for differences in scale and variance among compounds. The NMDS with Euclidean distance, was performed using the metaMDS function (vegan-package; Oksanen et al., 2022). Euclidean distance was specifically selected because the dataset included both positive (emission) and negative (uptake) values. To assess the relationships between individual BVOC compounds and the ordination structure, environmental vector fitting was performed using the envfit function (999 permutations; vegan package). Only variables showing significant correlations with the ordination (p ≤ 0.05) were retained for visualization.
To explore if BVOC composition differed significantly between groups, a permutational multivariate ANOVA (PERMANOVA, adonis2 function in vegan package) was performed on the reduced dataset used for NMDS. The PERMANOVA model (Euclidean distance, 999 permutations) included Macrophyte species (Zostera, Fucus, Ulva) and Region (Finland and Ireland) as fixed factors, and their interaction (Macrophyte ⋅ Region). Sequential (type I) sums of squares were used to evaluate the contribution of both factors and their interaction. Beforehand, a permutation test for homogeneity of multivariate dispersions (betadisper, vegan package) was used to confirm that the group dispersions were similar between groups. Afterwards, pairwise comparisons were performed to investigate which groups (Macrophyte ⋅ Region) emitted significantly different BVOC compositions from each other. Resulting p-values were adjusted for multiple comparisons using the Benjamini–Hochberg procedure to control for false discovery rate.
To examine whether experimental groups differed in their total BVOC emission rates and the rates of the most highly emitted individual compounds, we used generalized linear models (GLMs) with a Gamma distribution and log link. This statistical approach was chosen to appropriately account for right-skewed data and heteroscedasticity. Macrophyte species, Region, and their interaction were included as fixed effects in the models. Model significance was assessed using analysis of deviance (χ2 tests), and afterwards, Tukey-adjusted pairwise comparisons were conducted using estimated marginal means to explore significant differences between experimental groups.
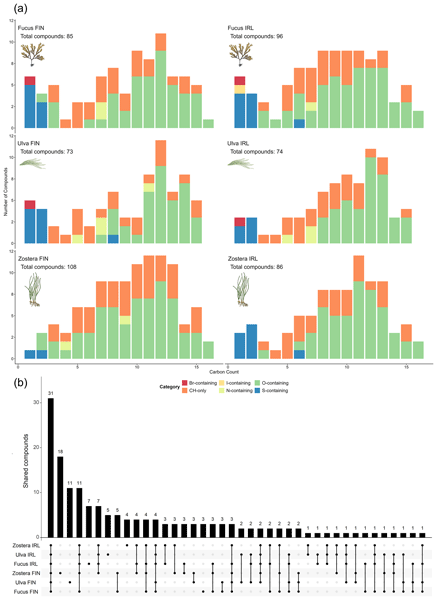
Across the two marine regions and three macrophyte species, we were able to detect emissions of 166 different compounds. Most unique compounds were identified from Finnish Zostera (108+1 unidentified, where “unidentified” means that we could not assign an elemental formula to the observed peak), while the lowest number of compounds was emitted by Finnish Ulva (73+1 unidentified, Fig. 2a). Only 31 compounds were consistently detected across all groups (Macrophyte ⋅ Region), but 70 of the total compounds were emitted by each macrophyte species in at least one region (Fig. 2b). Most identified compounds were hydrocarbons (CH) or oxygenated hydrocarbons (CHO), but each macrophyte species also emitted several S- and N-containing compounds (Fig. 2a). We were also able to quantify the emission rates of two halogenated compounds (Br2CH+ and CH3I+) from the two macroalgae. In addition to emissions, we identified the uptake of 11 compounds, of which 4 were only taken up and not emitted by any macrophyte (Table S2). All the compounds detected in this study and their average emission rates are listed in Table S2.
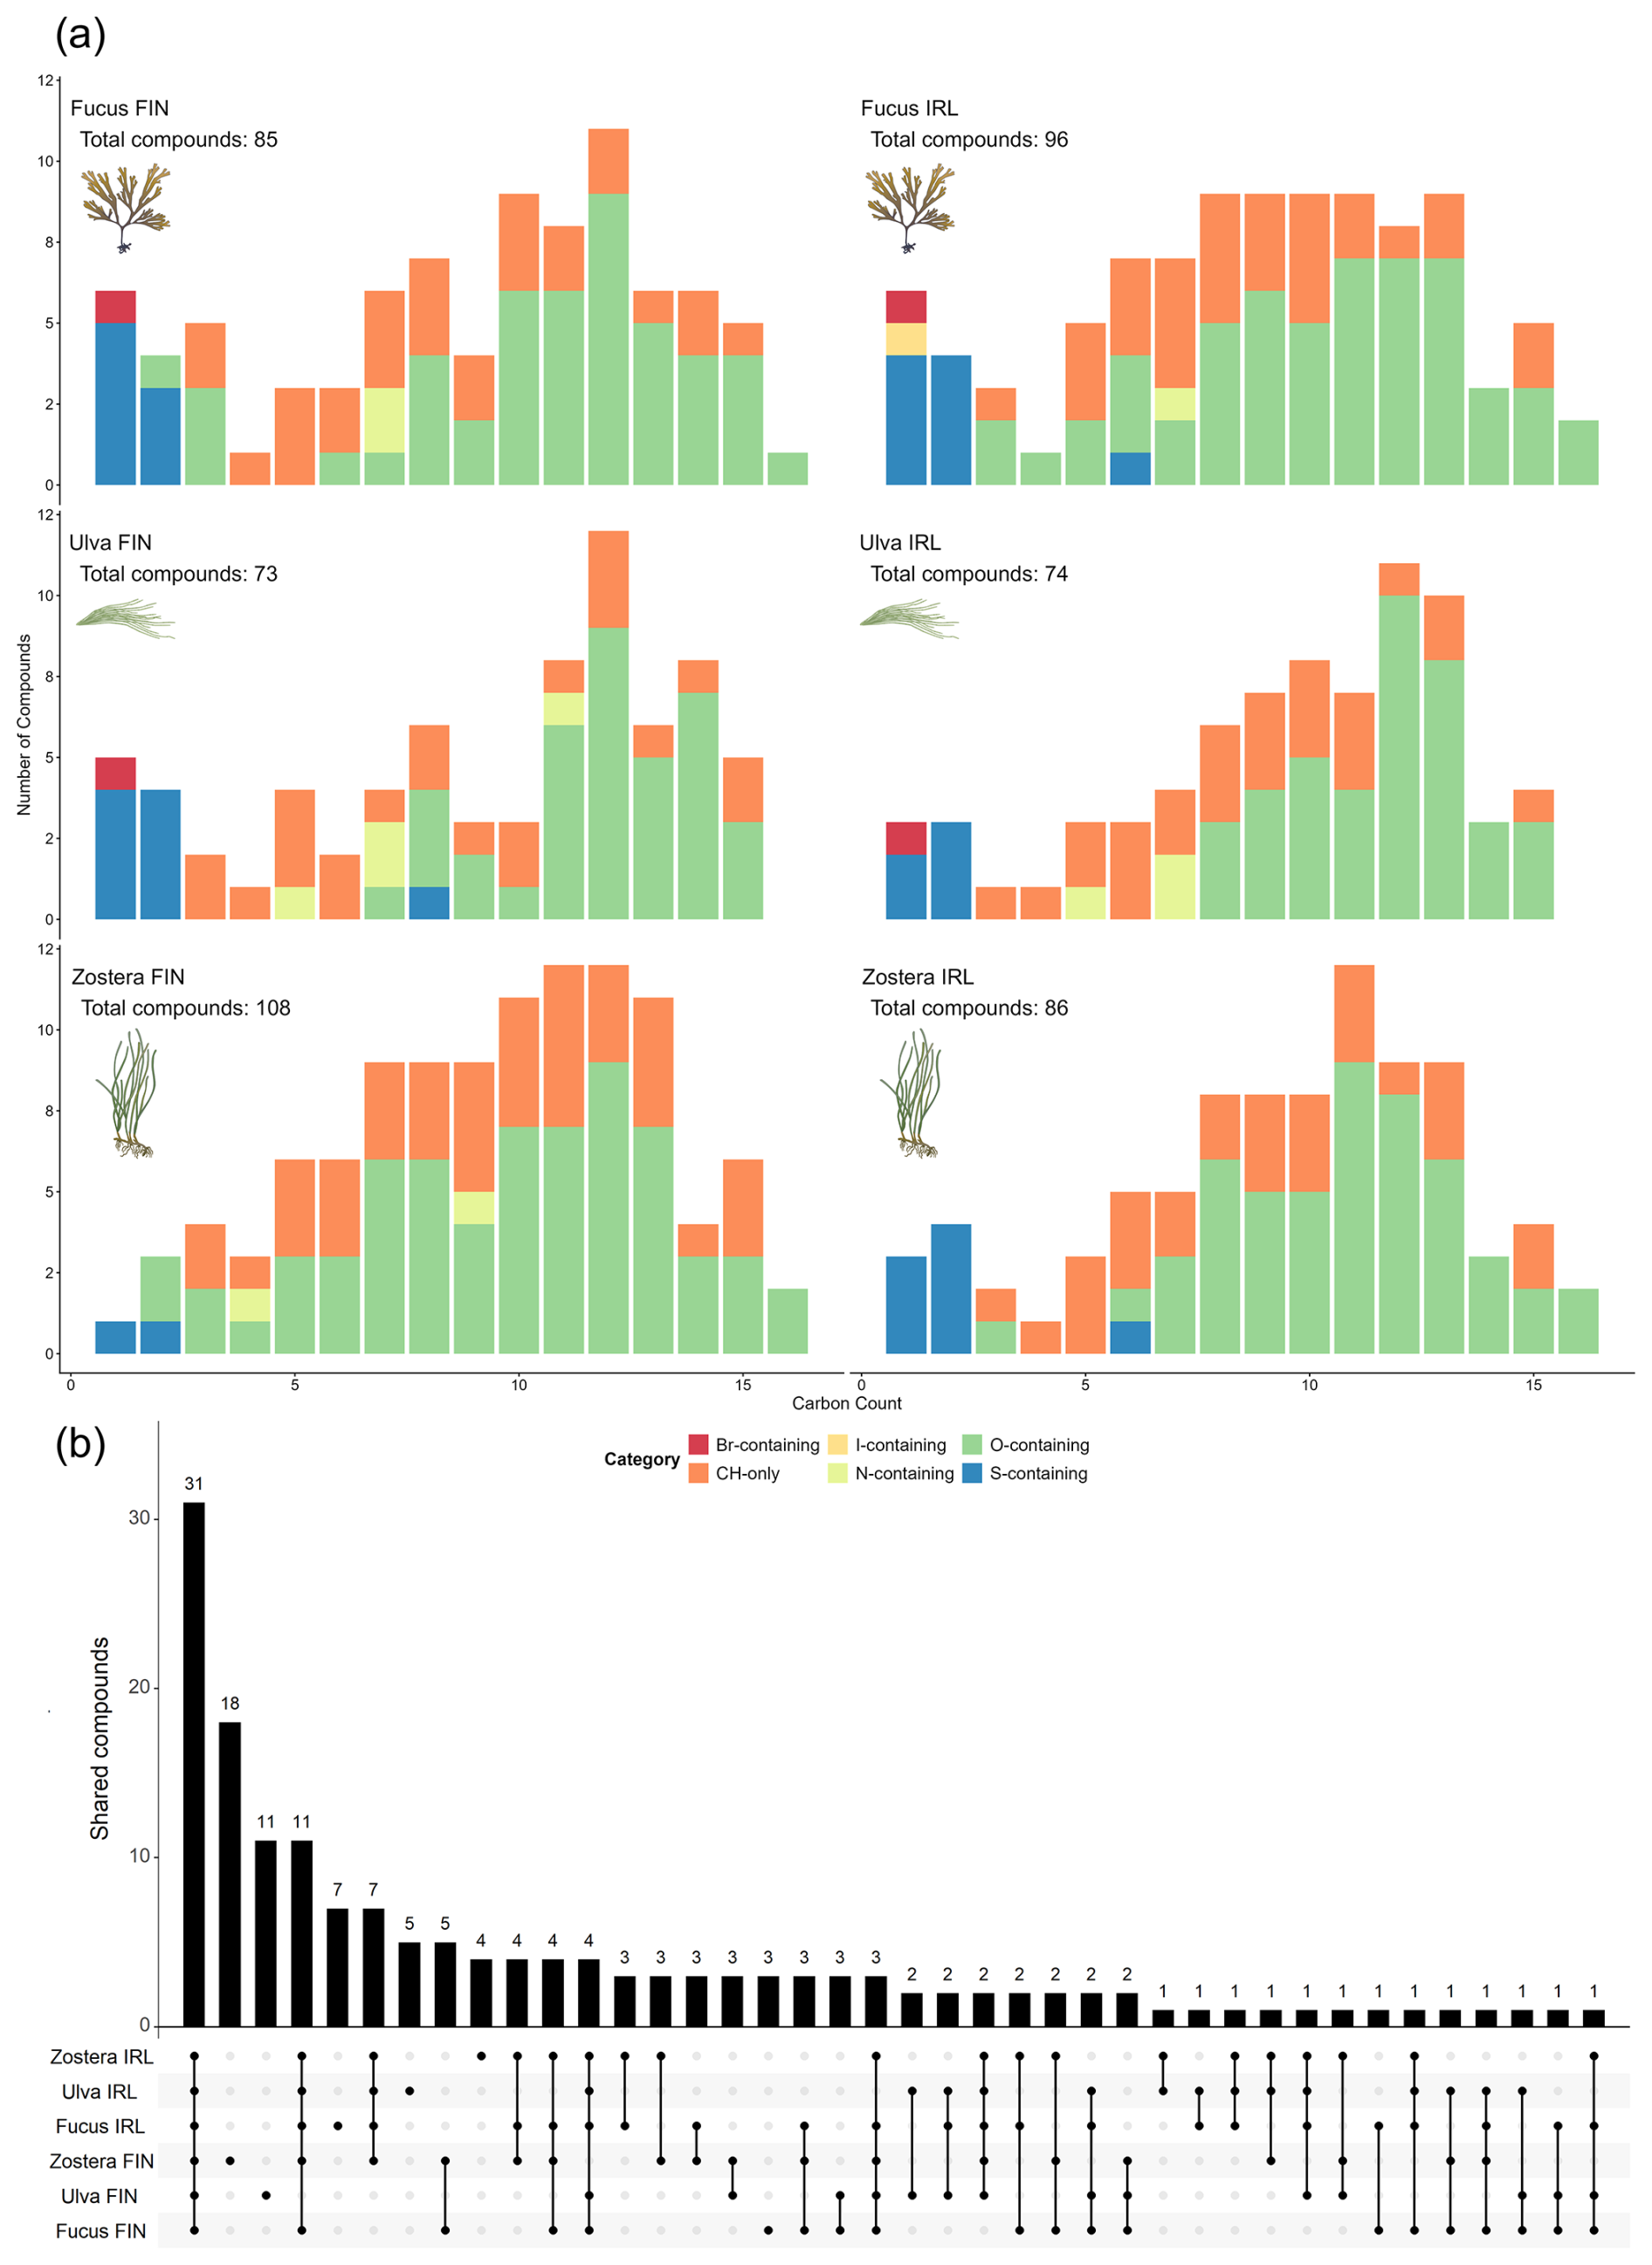
Figure 2(a) Overview of the identified compounds emitted by each group, organised by carbon count and characteristics of the compounds. The chemical formula and potential identity of all compounds can be found in Table S2. In addition to the depicted compounds, each treatment emitted at least 1 unknown compound (unknown carbon count and category); 1 unknown compound for all Finnish groups, 2 unknown compounds for Zostera and Fucus IRL, and 4 unknown compounds for Ulva IRL. (b) UpSet plot showing overlap of emitted compounds (both identified and unidentified) across experimental groups. The figure was produced with the UpSetR package in R (Conway et al., 2017). Both panels include only compounds that showed emissions, excluding those that exhibited only uptake. Macrophyte images from Integration and Application Network (IAN), University of Maryland Center for Environmental Science (https://ian.umces.edu/, last access: 28 September 2026).
The NMDS organized the different experimental groups as mostly separate clusters (Fig. 3). The low stress (0.071) of the NMDS indicates that the ordination provides a good representation of the dissimilarities among replicates. The PERMANOVA results support the NMDS-clustering, revealing that BVOC compositions were significantly affected by Macrophyte species (F2=14.081, R2=0.352, p=0.001), Region (F1=12.914, R2=0.161, p=0.001), and their interaction (F2=8.451, R2=0.211, p=0.001). Pairwise comparisons showed that BVOC composition differed significantly (p < 0.05) between all experimental groups. These results clearly indicate that the three macrophyte species produced significantly different BVOC compositions, but also, that the within-species emissions differed between regions. These differences were not only driven by differing emissions rates but also by differences in the identity of compounds emitted within-species between regions, with only 69, 65 and 45 compounds being shared within-species for Zostera, Fucus and Ulva, respectively (Fig. 2b, Table S2). This means that only 54 % (Zostera, total compounds 127), 55 % (Fucus, total 117), 43 % (Ulva, total 104) of the total compounds emitted by the species were found in both regions.
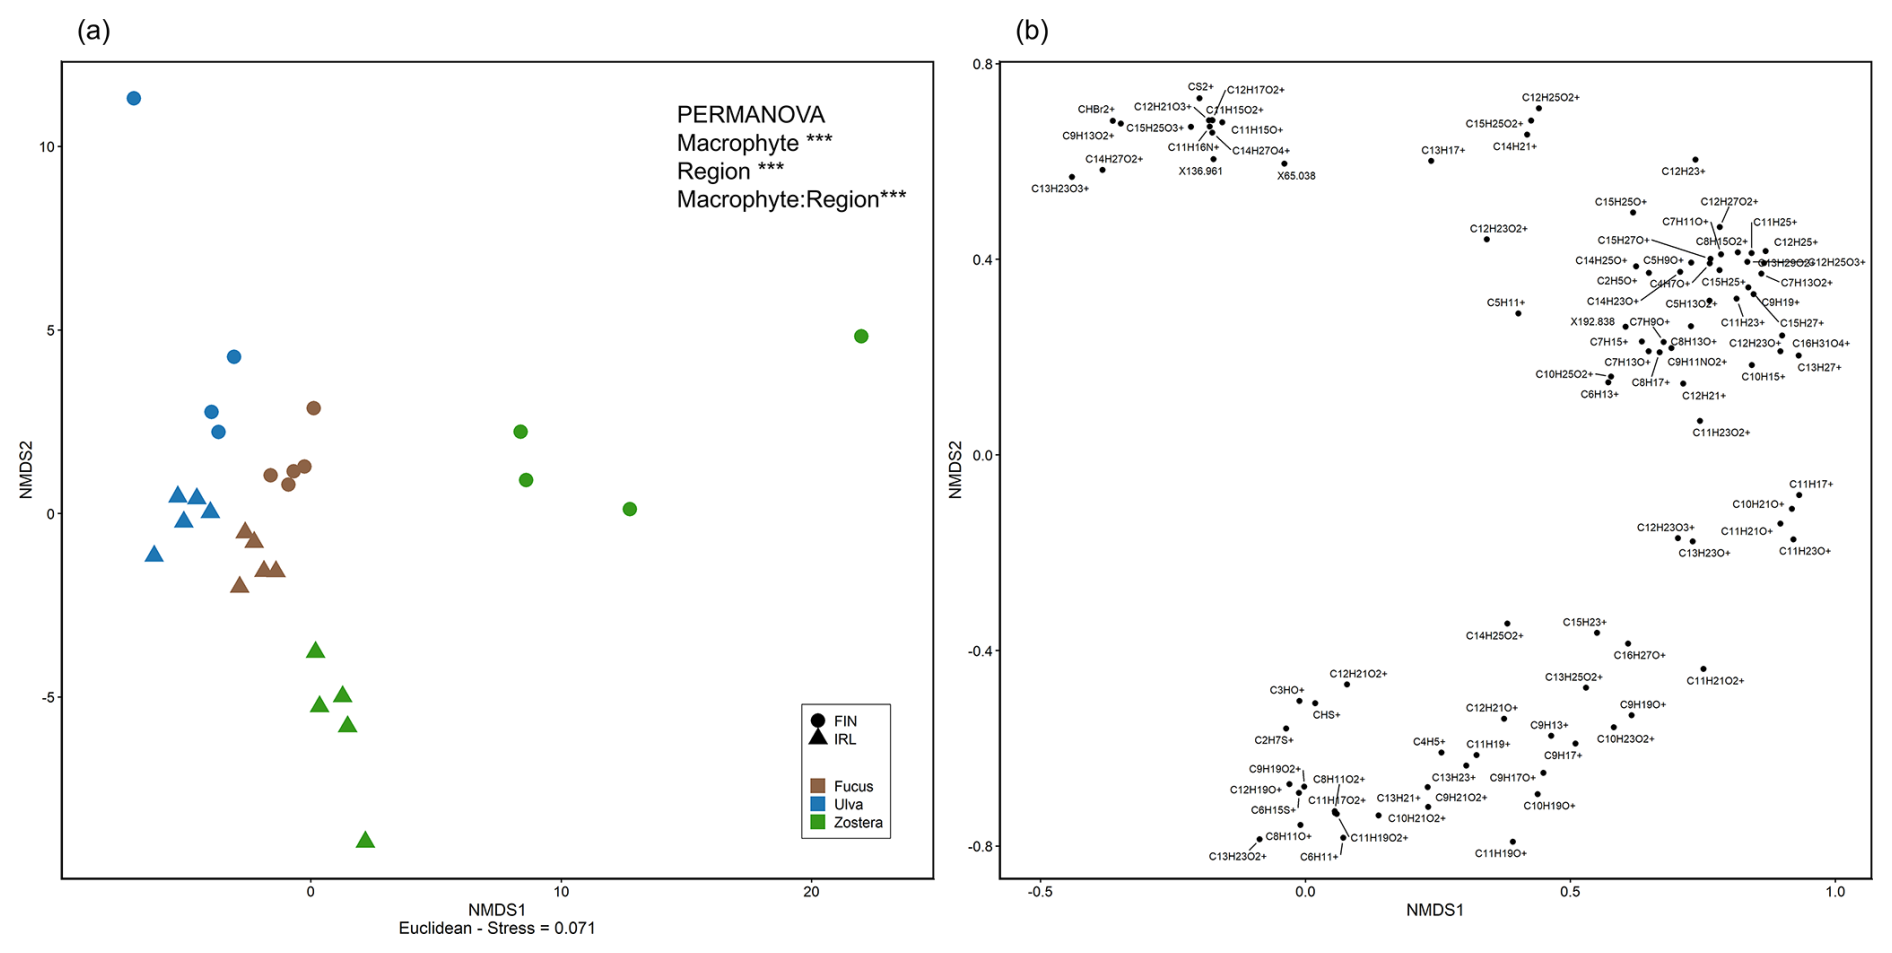
Figure 3(a) NMDS showing the distribution of replicates in ordination space. Results from the associated PERMANOVA examining drivers of BVOC composition are indicated, with asterisks denoting significance (, p=0.001). (b) The ions significantly correlated (envfit, p≤0.05) with the NMDS ordination in panel (a). The position of ions in NMDS space reflects the direction and strength of their correlation with replicate composition. Note the differing NMDS scales between panels, reflecting greater dispersion among replicates (a) compared to the more constrained distribution of compounds (b).
Total BVOC emission rates were significantly affected by macrophyte species (χ2=10.88, df =2, p < 0.001), with Zostera emitting BVOCs at significantly higher rates than the two macroalgae in both regions (Fig. 4a). Neither region nor the interaction between macrophyte species and region significantly affected total BVOC emission rates. The Zostera replicates emitted on average 52.9 and 54.4 ng g−1 h−1 in Finland and Ireland respectively, while total emission rates stayed below 20 ng g−1 h−1 for the macroalgae (Fig. 4a). The high total emission rates of Zostera (especially in Finland) were largely due to many compounds being emitted at medium rates (1–2 ng g−1 h−1) (Figs. 4d and 5). DMS (C2H7S+) was clearly the most emitted single compound, and its emissions contributed 30 % of the total emission rates (Fig. 4b). DMS emission rates were significantly affected by macrophyte species (χ2=10.57, df = 2, p < 0.01), region (χ2= 11.76, df = 1, p < 0.001), and the interaction between macrophyte and region (χ2= 10.36, df = 2, p < 0.01). Pairwise comparisons revealed that Finnish Zostera emitted significantly less DMS than all Irish macrophytes, and that Irish Zostera also emitted higher rates than Finnish Fucus (Fig. 4b). DMS was the most emitted BVOC by each group except for Finnish Zostera, which in turn, emitted sesquiterpenes (C15H) at highest rates (9.6 ng g−1 h−1; Fig. 4c). Sesquiterpene emission rates (Fig. 4c) were significantly affected by species (χ2= 64.52, df = 2, p < 0.001), region (χ2= 20.64, df = 1, p < 0.001), and their interaction (χ2= 3.22, df = 2, p < 0.01). Finnish Zostera emitted significantly more sesquiterpenes than all other groups, and some of the lower-emitting groups also showed significant pairwise differences (Fig. 4c).
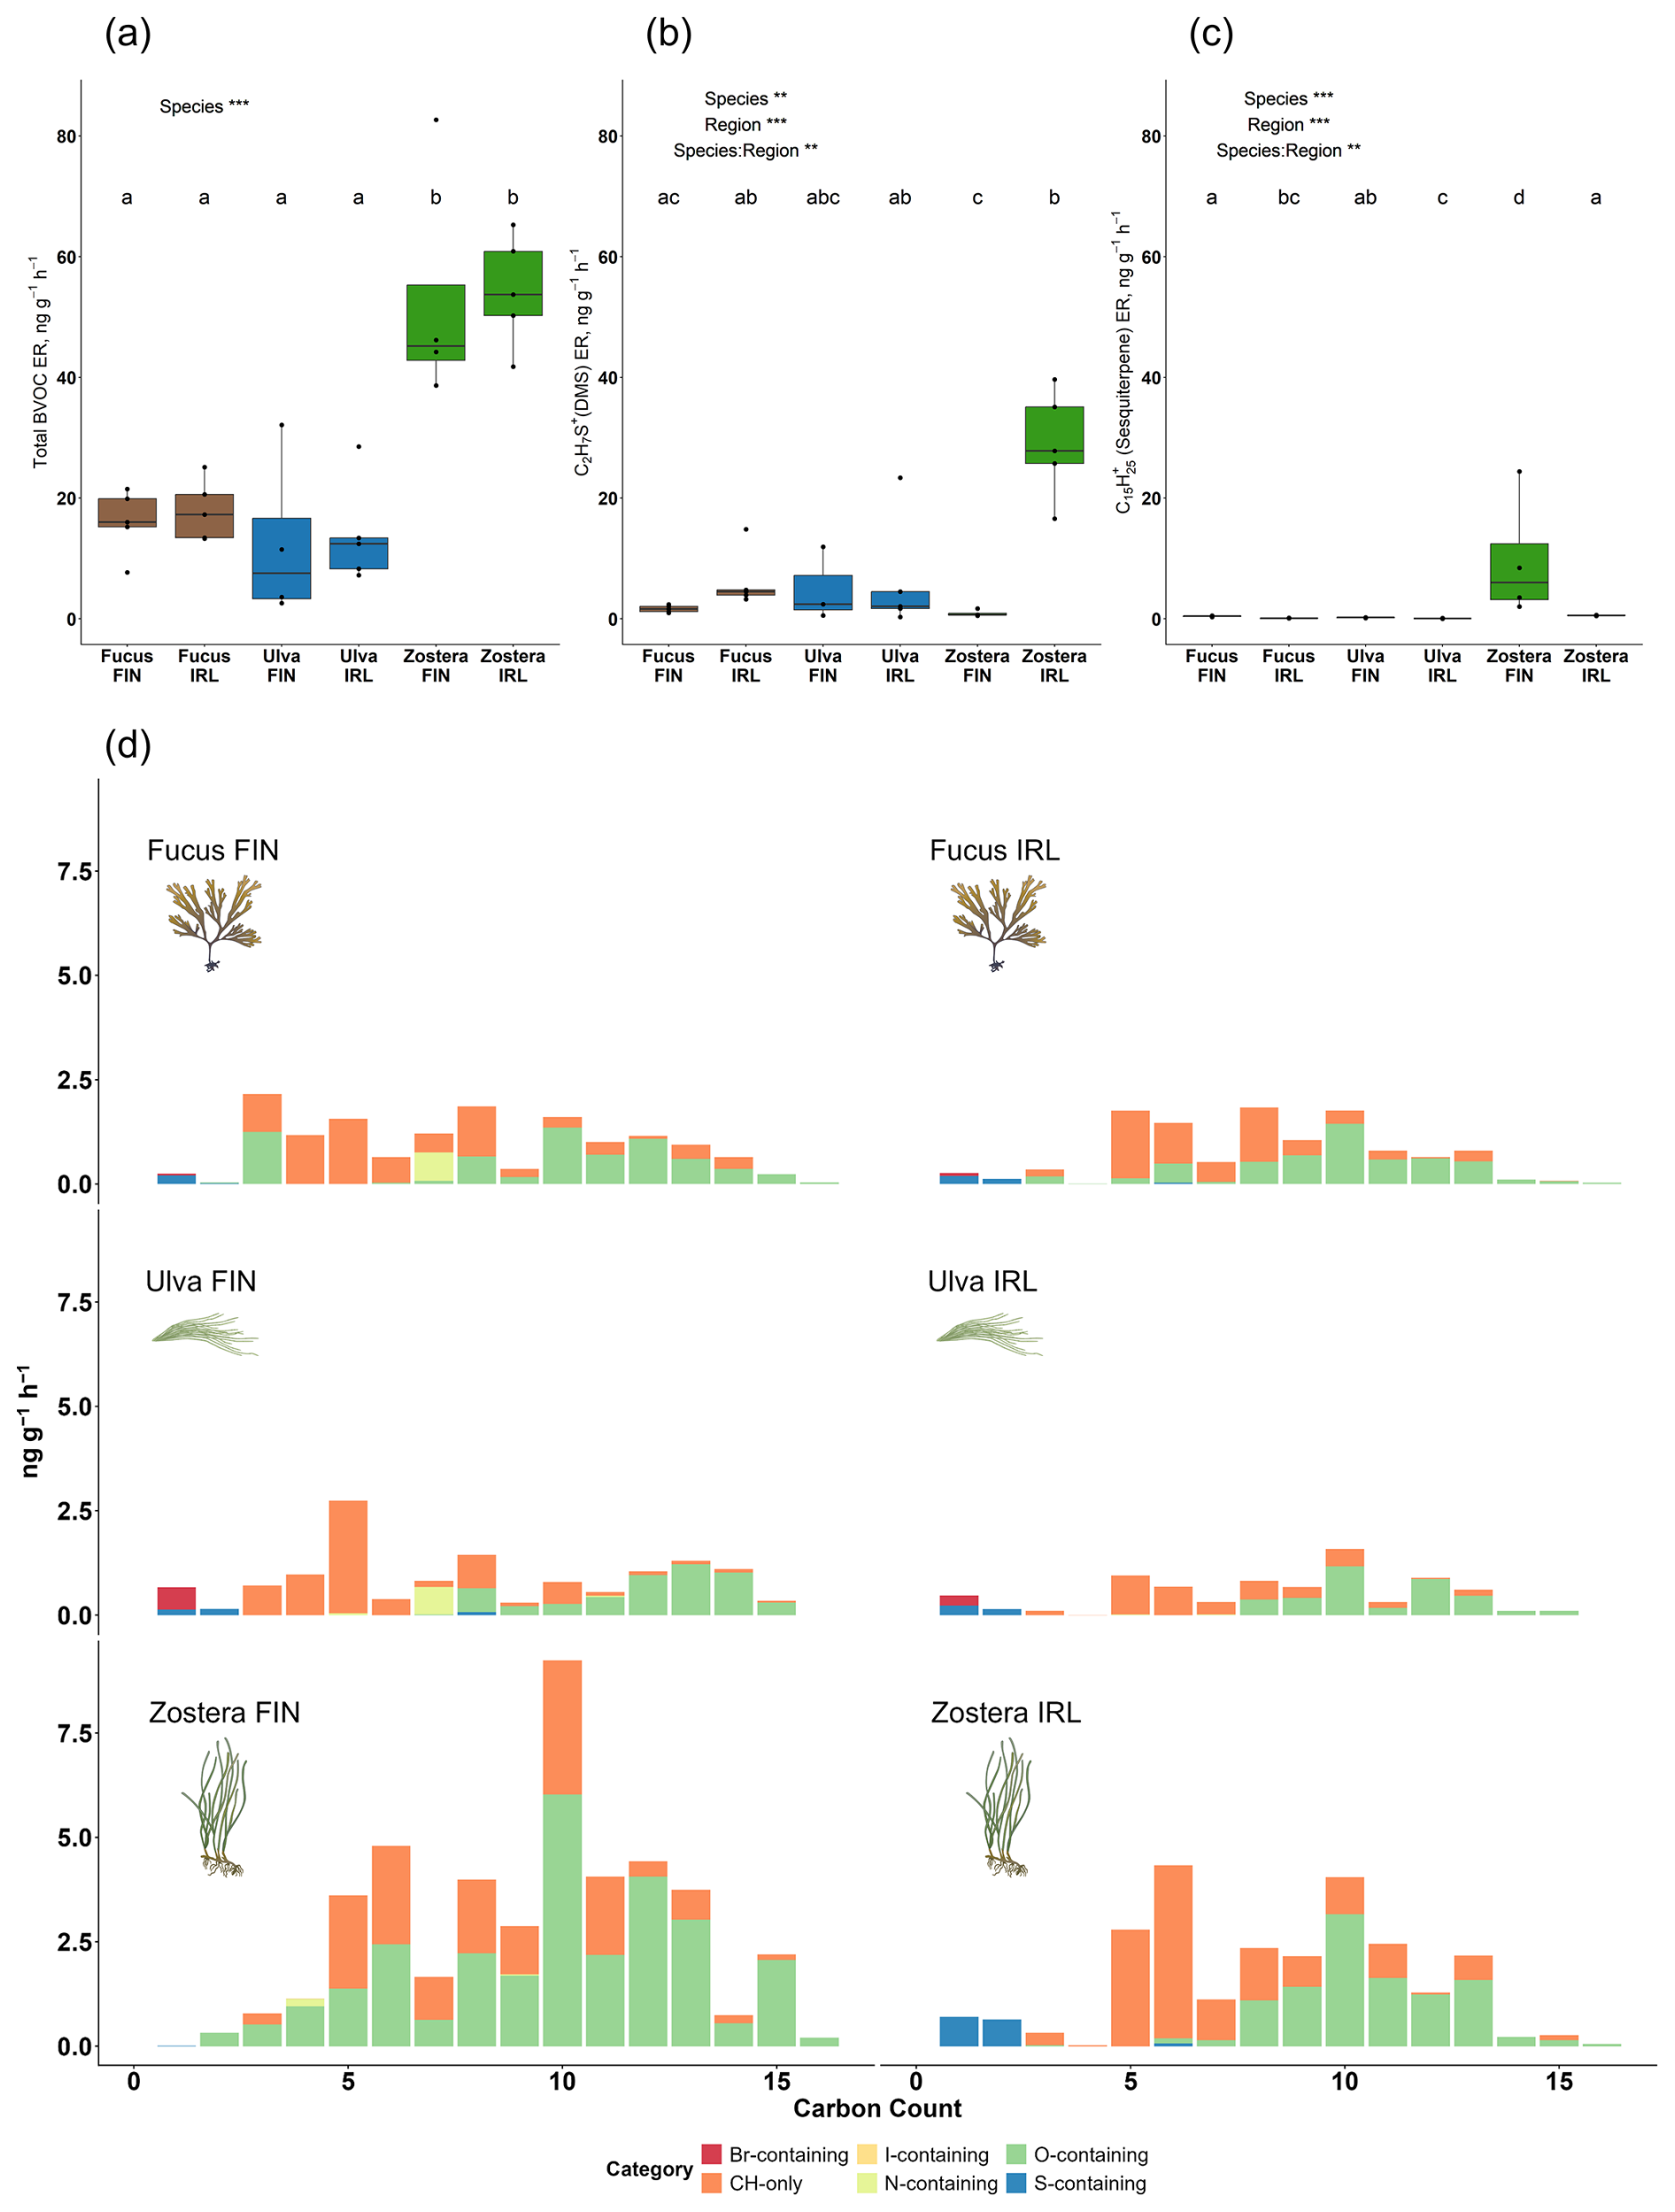
Figure 4(a) Total BVOC, (b) DMS (C2H7S+) and (c) sesquiterpene (C15H) emission rates (ng g−1 h−1) of all experimental groups. Boxplots show median (line in box), upper and lower quartiles (box), 1.5× interquartile range (vertical line) and outliers (dots). Different letters above boxplots denote significant differences (p < 0.05). (d) Overview of average BVOC emission rates for each group organised by the carbon count and chemical characteristics of the compounds. DMS (C2H7S+) and sesquiterpene (C15H) emission rates are not included in panel (d). The identity of all compounds and their average emission rates can be found in Table S2. Macrophyte images from Integration and Application Network (IAN), University of Maryland Center for Environmental Science (https://ian.umces.edu/, last access: 28 September 2026).
Besides DMS and sesquiterpenes, the BVOCs with highest emission rates were hydrocarbons and oxygenated hydrocarbons occupying a large size distribution (C5–C15, Fig. 5). The most emitted oxygenated hydrocarbons (Fig. 5) were C10H21O+ (potentially Decanal/Decanone/Menthol), C10H23O (potentially 1,2-Decanediol), C13H23O+, C12H25O and C12H23O. In addition to sesquiterpenes, hydrocarbon emissions were dominated by C5H (many possible identities but likely a mix of isoprene and fragments of larger terpenoids and aldehydes), C5H (several possible identities and fragments), C8H (potential terpene fragment), and C6H (several possible identities and fragments). A nitrogen-containing compound (C7H12NO+, potentially 1-Azabicyclo[2.2.2]octan-3-one) and a volatile halocarbon-fragment (CHBr) was also present in the highest quartile of emissions (Fig. 5). Many compounds with the highest emission rates were emitted by all groups (Fig. 5), but some of these compounds were also found to be species- (e.g., C3H7O+, Acetone), group- (e.g., C11H & C14H21O) or region-specific (e.g., C3H).
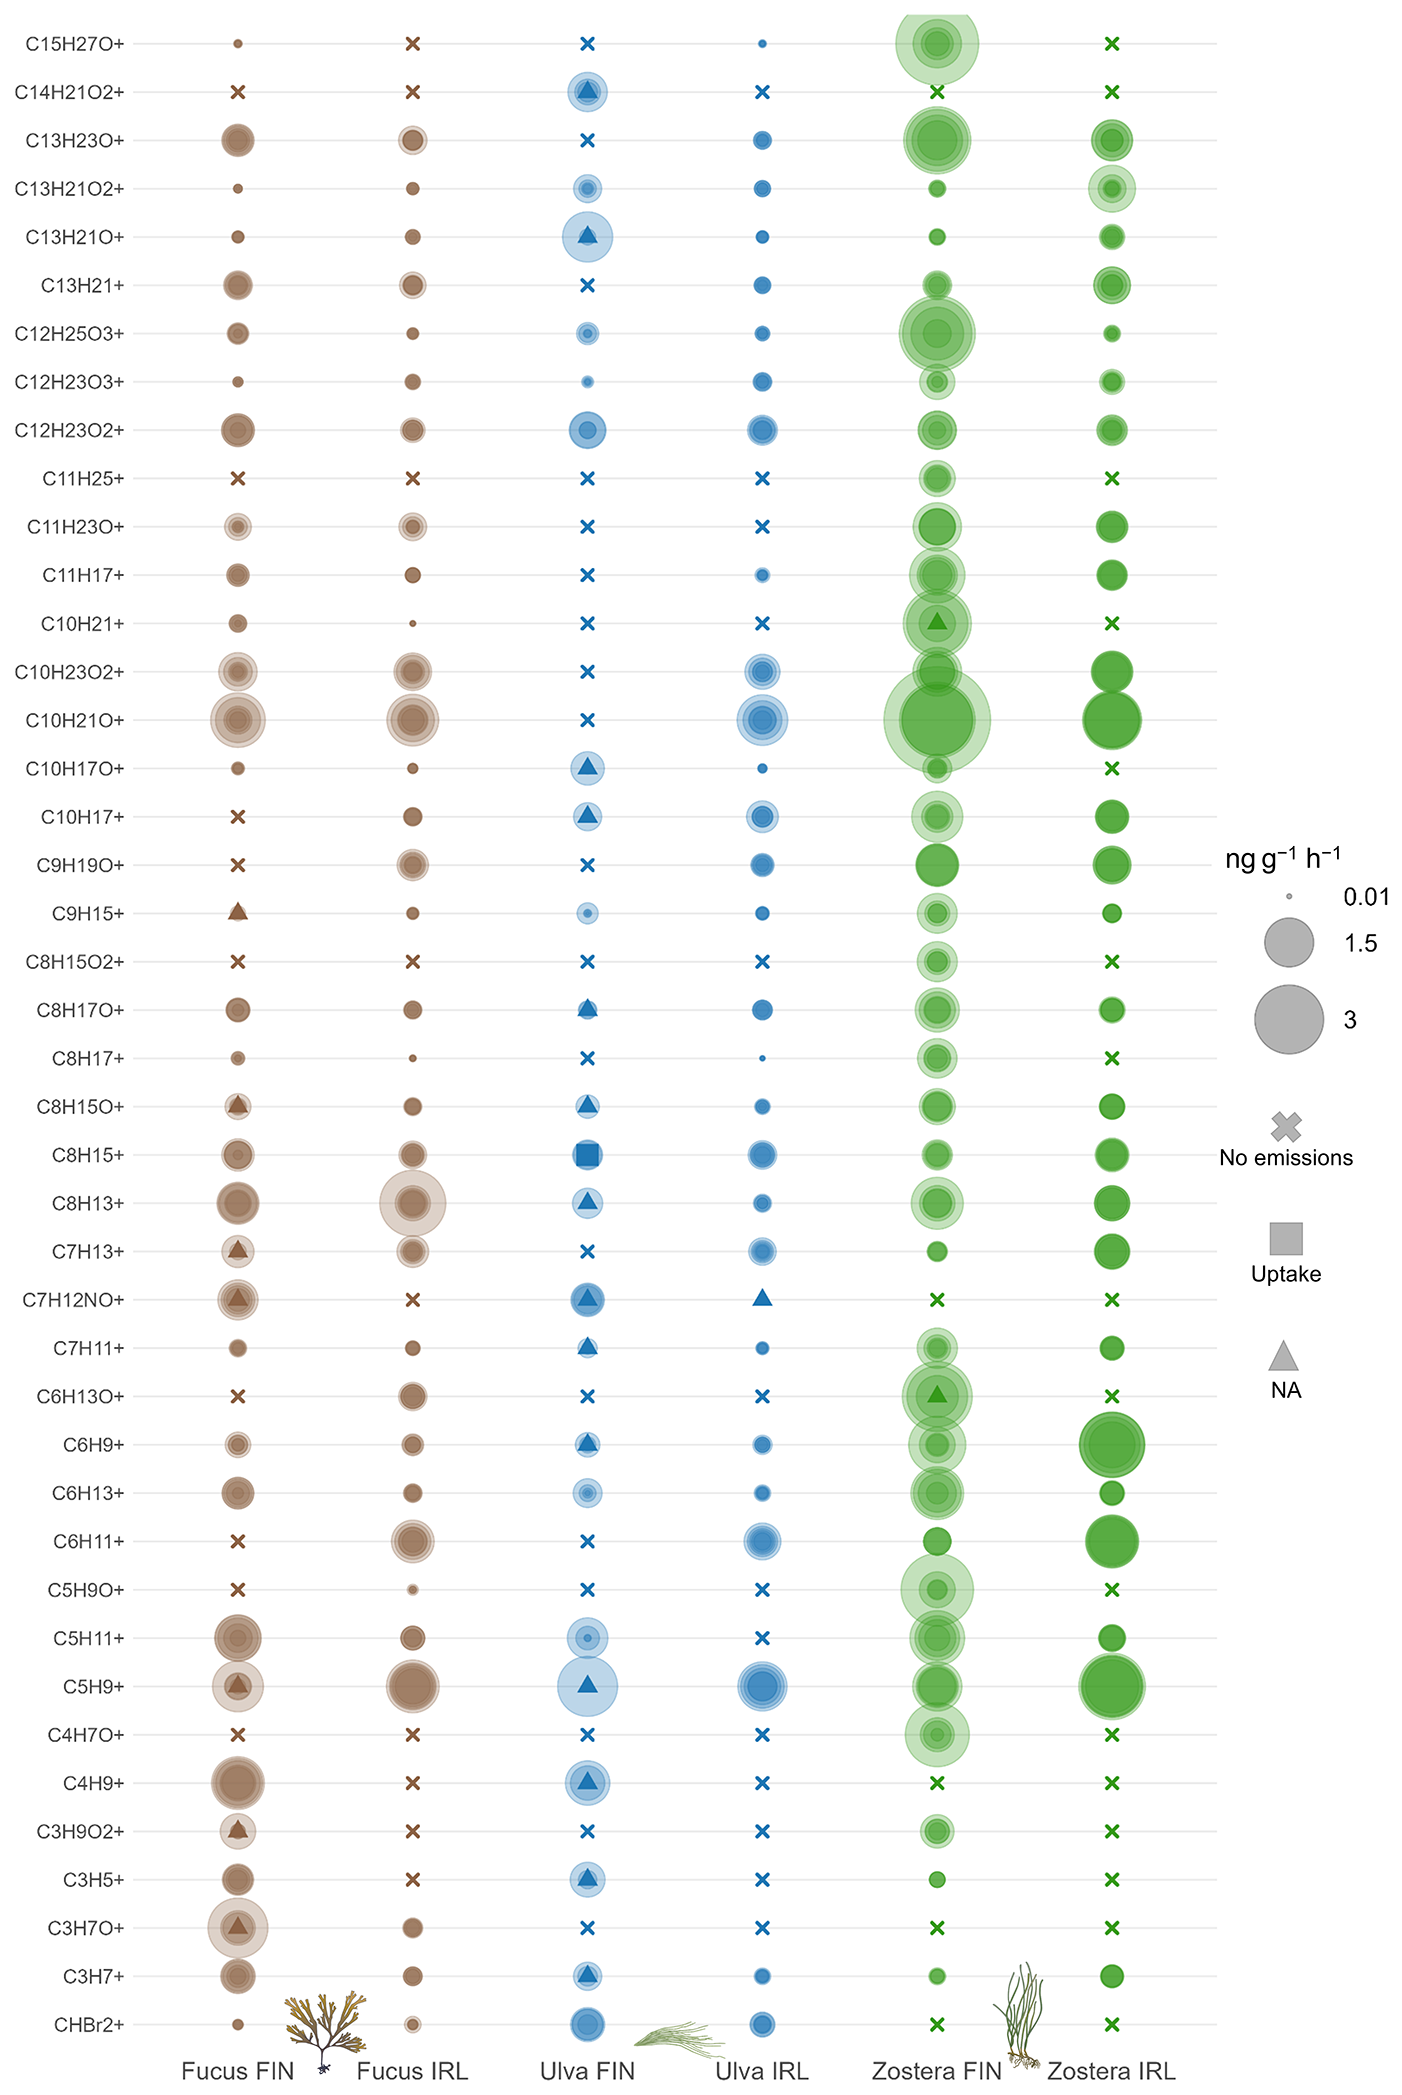
Figure 5The top quartile of emitted compounds (excluding DMS and sesquiterpenes) with the highest emission rates measured in this study. Each measured datapoint is included in the figure and shown as an individual circle (several replicates per group overlapping). Unavailable datapoints (NA), datapoints that showed uptake and measurements where no emissions were detected are marked in the figure with their corresponding symbols (see legend). The rest of the compounds observed in this study (not part of the highest quartile) are presented in the supplementary material (Figs. S4–S6). Macrophyte images from Integration and Application Network (IAN), University of Maryland Center for Environmental Science (https://ian.umces.edu/, access: 28 September 2026).
Our study demonstrates that temperate marine macrophytes emit highly diverse and variable BVOC profiles. The three studied macrophytes (Fucus vesiculosus, Ulva intestinalis and Zostera marina) emitted hundreds of compounds, with dozens of compounds contributing with rates over 1 ng g−1 h−1 to the total BVOC emissions. BVOC emissions differed significantly between the three species, but notably, also stark differences were found within-species between regions, both in the magnitude of emission rates and the identity of emitted compounds. This suggests that macrophyte BVOC emissions are strongly influenced by environmental or biogeographic factors. Our results provide novel insights to the chemical profiles of the studied macrophytes and highlight potential pathways these emissions can impact the environment both above and below the surface. Here, we discuss the key reasons that enabled high quality BVOC quantifications in seawater, possible factors explaining the high intra- and interspecific variability and critical questions that need to be answered so that the atmospheric impact of macrophytes can eventually be estimated.
4.1 Macrophyte BVOC emission rates and compound diversity
4.1.1 DMS and terpenoids, commonly investigated compounds emitted at highest rates
Dimethyl sulfide (DMS) was the highest emitted compound by all studied macrophytes except Finnish Zostera. DMS accounted for 30 % of total BVOC emissions in our study, which is consistent with the well-established role of DMS as the most abundant BVOC in the global ocean and highlights the potential contribution of macrophytes to coastal DMS budgets. In this study, Irish Zostera showed the highest DMS emission rates, which was surprising because Coquin et al. (2024) did not detect any DMS emissions from the species in the Mediterranean Sea. DMS is one of several products of dimethylsulfoniopropionate (DMSP) degradation. Specifically, DMS is formed through enzymatic cleavage of DMSP, whereas the demethylation pathway produces methanethiol (MeSH) (e.g., Curson et al., 2011). In our study, DMS emissions substantially exceeded MeSH emissions, with MeSH even exhibiting net uptake rather than emissions in three of the six experimental groups (Ulva FIN, Ulva IRL, and Zostera IRL; Table S2). DMSP and its degradation products play important roles in the physiology and stress responses of marine primary producers, including antioxidation and osmoregulation (Zhang et al., 2019 and references therein). Indeed, the role of DMSP as an osmolyte offers a potential explanation to why DMS emissions were lower in the brackish Baltic Sea compared to the fully saline Atlantic. Besides DMS, terpenoids represent some of the most important marine BVOCs and are frequently discussed in marine atmospheric chemistry (Yu and Li, 2021; Zhao et al., 2023) and several clear terpenoid signals also appear in our data. Notably, Finnish Zostera emitted sesquiterpenes at high rates, which is an interesting result given that sesquiterpenes are rarely measured in high quantities in marine systems. Seagrasses are more closely related to terrestrial plants than macroalgae, which may help explain the comparatively strong sesquiterpene emissions. It is also possible that the seagrasses were suffering from some unknown stressor (e.g., the prevailing marine heatwave), as sesquiterpene emissions are known to increase with stress levels in terrestrial plants (Bourtsoukidis et al., 2025). In contrast to the larger sesquiterpenes, isoprene was not released at particularly high concentrations by any experimental group, and this is especially evident when considering that the isoprene signal (C5H, Fig. 5) likely also contains signal from fragments of larger molecules (Coggon et al., 2024). Additionally, the last group of commonly investigated terpenoids, monoterpenes (C10H), were emitted by all groups except Finnish Fucus, but at even lower rates than isoprene (Fig. 5). In summary, neither DMS nor terpenoids, completely dominate the macrophyte emission profiles, and total emissions were instead composed of numerous smaller contributors (see Sect. 4.1.2 for more discussion). This suggests that coastal macrophytes may influence local, climate-relevant atmospheric chemistry through a more chemically diverse set of emissions compared to both pelagic phytoplankton and terrestrial plants. Still, the link between macrophyte emissions into the water and the air-sea exchange remains poorly resolved and needs to be assessed in more detail in future studies.
4.1.2 High diversity of macrophyte BVOC emissions
Beyond DMS and terpenoids, we detected a high diversity of BVOCs originating from the macrophytes (total detected compounds: 127 for Zostera, 117 for Fucus, 104 for Ulva), with the number of compounds clearly exceeding previous reports for these specific species (Coquin et al., 2024; Bravo-Linares et al., 2010; Horincar et al., 2014; Broadgate et al., 2004). For instance, we quantified the emissions of over a 100 BVOCs from Zostera that have not been reported previously, and similar numbers are true for the two macroalgae. We can attribute this increase in observed compounds to several factors: (1) Improvements in sensitivity of instruments have decreased VOC detection limits, (2) we performed a completely non-targeted analysis, analysing the entire mass spectrum to identify signals that systematically increased during incubations, (3) the use of a dynamic sampling approach with continuous airflow may have enabled detection of a wider range of emitted compounds, compared with static methods (e.g., headspace SPME; Coquin et al., 2024) and (4) we report elemental formulas which can only be tentatively linked to molecules, unlike e.g. GC-MS approaches that can provide unambiguous molecular assignments. The bulk of the emissions (both in terms of unique compounds and emission rates) were comprised by hydrocarbons and oxygenated hydrocarbons that exhibited great diversity, with emissions occupying a wide size range (majority spread evenly in C6–C13 range). The wide and quite even range of emissions is interesting, because it is in stark contrast to terrestrial emissions, often dominated by isoprene and monoterpenes (Guenther et al., 2012). The detected emission profiles highlight a diversity of BVOCs that has previously remained largely unexplored in macrophyte- and even marine context. Importantly, several of these unexplored compounds had high molecular weights, with 10 or more C-atoms, meaning that they have the potential to impact atmospheric aerosol formation if transported into the air, since aerosol yields typical scale with molecular size (Lim and Ziemann, 2009). Thus, especially the larger (oxygenated) hydrocarbons detected should be investigated further, in particular with reference to what fraction of them ultimately can enter the atmosphere. Ambient coastal BVOC observations, such as those from the continuous measurements at the newly established coastal SMEAR-station at Tvärminne Zoological Station (Thakur et al., 2025), can help shed insights into this question. Conversely, ambient datasets are complex and information about potential sources (as presented here) can greatly aid their exploration and analysis. The wide range of compounds detected in our work will hopefully also spur efforts to investigate these new compounds using targeted techniques that can identify their molecular structures.
Many of the BVOCs emitted at the highest rates were shared amongst all six groups (i.e. DMS, sesquiterpenes and 34 % of the top quartile presented in Fig. 5). The three studied species are taxonomically and physiologically very distinct from each other, which makes the shared compounds and their potential functions noteworthy. The results suggest that despite their evolutionary divergence, macrophytes may share a core BVOC profile linked to the organisms' core functions/processes. For instance, BVOCs emitted by phytoplankton function as intermediate and end products of crucial internal processes (e.g., photosynthetic metabolism, antioxidant activities, and carbon fixation; Halsey and Giovannoni (2023) and references within). However, compared to phytoplankton, little is known about the full spectrum of physiological and ecological roles that BVOCs serve in macrophytes, and the newly identified compounds can provide clues about the functioning and ecology of these common macrophytes. For instance, BVOCs are known to serve as important info-chemicals within and between species, having a profound effect on the ecology of marine ecosystems (Fink, 2007). However, detailed information about which individual compounds affect which processes is very poorly understood. The production and release of certain BVOCs can also aid the organism to deal with stressors (e.g., high temperature, salinity fluctuations). In relation to this, volatilomics has frequently been discussed in marine BVOC literature during the last decade (e.g., Steinke et al., 2018; Lawson et al., 2019), with the core idea that by monitoring stress related BVOCs the status/health of whole ecosystems can potentially be determined. Thus, better information on BVOCs emitted by macrophytes can potentially help explain ecological processes within and across trophic levels.
4.2 Intraspecific variation of macrophyte BVOC emissions
Although BVOC emissions of the three macrophytes were more similar within-species than between species, substantial intraspecific variation was also observed. Within the groups (Macrophyte ⋅ Region), emission profiles were consistent across replicates (Fig. 3a), but significant differences were evident among marine regions for all three species. Emission rates of specific compounds showed intraspecific differences (see e.g., Fig. 4b and c; DMS and sesquiterpenes for Zostera), but many compounds were also emitted in only one of the studied regions (see Figs. 2b, 5 and S4–S6). Some differences in emission rates were expected (e.g., driven by differing seasons and temperatures), but the large differences in the identities of emitted compounds were more surprising (only ∼ 50 % of compounds shared within species for all three species between regions). Here, we cannot pinpoint the exact factors driving these differences within-species, but below we discuss the most likely contributing factors.
Macrophyte BVOC emissions respond to several abiotic factors such as temperature, light, seasonality and organic pollution (Saunier et al., 2025a and references within). Light and temperature are important triggers of BVOC emissions, and changes in these drivers can rapidly affect emissions (Broadgate et al., 2004; Zhao et al., 2023; Wang et al., 2025). Although light and temperature were kept comparable throughout all incubations and in situ seawater temperatures were broadly similar during the campaigns, differing seasons and the markedly different annual temperature regimes in the two regions likely contributed to the observed differences in emissions. Additionally, season-specific developmental processes likely also affect macrophyte BVOC emissions. For instance, in terrestrial plants, factors like flowering, leaf senescence, and dormancy affect BVOC emissions (Kesselmeier and Staudt, 1999), but how these processes affect BVOC emissions from macrophytes remains unknown. In addition, the growth environment likely also drives BVOC emissions by affecting macrophyte metabolism, physiology or stress (Bäck et al., 1992). For instance, the stark differences in salinity and nutrient availability between regions likely affected the emissions (as has been observed with phytoplankton; Zhao et al., 2023 and references within).
The macrophyte populations of Finland and Ireland have been separated for millennia, leaving populations ample time to adapt to their local environmental conditions (e.g., salinity, temperatures, tides, etc.). Therefore, within-species genetic diversity will differ significantly between regions, which in turn could affect the organisms BVOC emissions, e.g., through metabolic responses to local conditions. For example, permanent exposure to low salinity/high nutrients in the Baltic Sea has likely modified biochemical profiles, with direct influence on both emission profiles and rates. However, the effect of genetic diversity on BVOC emissions is completely unexplored for macrophytes, leaving the influence of population-specific genetics an important question to answer. The quantified BVOC emissions were likely also affected or directly released by the microbial communities associated with the macrophytes, as microbes are known to produce and consume many BVOCs (Lemfack et al., 2018). For instance, seagrass meadows host diverse microbial communities active in the many phases of DMS production (e.g., DMSP-demethylation, DMSP-cleaving and DMS-oxidization; Jonkers et al., 2000), and regional differences in these communities could potentially explain why BVOC emissions differed so greatly within the studied species. Additionally, the fact that we found region-specific compounds emitted by all three macrophytes, suggests that these were formed by site-specific circumstance such as local microbial communities.
The Baltic Sea is an outlier when compared to most marine regions globally, that despite very low salinities and high nutrient loads, harbours marine macrophytes. It is possible that if this study was performed at different locations along the eastern Atlantic coast, macrophyte BVOC emissions (especially compound identities) would have been more similar between sites than shown here, due to more similar environmental conditions. Regardless, when comparing our results with Zostera marina BVOC-data collected from the Mediterranean Sea (Coquin et al., 2024), it becomes apparent that large differences even occur between fully saline regions. Of the 51 BVOCs detected by Coquin et al. (2024) only 12 fit compounds emitted by the seagrass in this study (out of 126 in total). Differing methodologies between studies (GC-MS and destructive sampling in Coquin et al., 2024) partly explain this large difference, but overall, these findings demonstrate that relying on data from a single site or population is insufficient to accurately estimate macrophyte BVOC emission rates or characterize their emission profiles. Hence, future emission estimates need to be compiled from several locations with differing environmental conditions. Our understanding of the dynamics governing macrophyte BVOC emissions lags knowledge of emissions from terrestrial plants by decades (e.g., Peñuelas and Llusià, 2001, Kesselmeier and Staudt, 1999) and investigating these dynamics will be crucial so that large scale emission estimations can eventually be established.
4.3 Methodological and experimental considerations
4.3.1 Methodological insights and issues
Detecting BVOC emissions accurately in seawater is challenging. Several methodological decisions contributed to the unusually high number of BVOCs detected in this study, but two factors were deemed especially crucial and are worth highlighting: 1. High quality background measurements & 2. real-time continuous measurements. Combined, these two allowed us to detect and quantify reliably even minuscule emission peaks (0.01 ng g−1 h−1), that might have remained classified as undefined noise with many other approaches. With high quality background measurements, we are referring to the (mostly) stable emissions from seawater that were achieved by filtration and pre-bubbling of the seawater, but also to the fact that every background measurement was highly comparable with its paired macrophyte measurement. Background measurements (seawater only) showed highly variable emissions between replicates (Fig. S3) and if all macrophyte emissions would have been compared to the same background measurement, data quality would have suffered. Therefore, the simple decision of adding a macrophyte into a previously quantified water-background, clearly improved the precision and sensitivity of our measurements, and we recommend that future studies adopt this practice when feasible. With real-time measurements, data is collected continuously over the whole measurement period in contrast to time-integrated measurements that would have resulted in one total emission datapoint for the whole incubation period. Continuous data allowed us to observe how emissions evolved over time and to pinpoint even small increases in emissions that might have fallen within the error margins of a time-integrated method. Additionally, only due to continuous measurements were we able to identify that certain background measurements failed and that some compounds kept increasing during the whole incubation period (Fig. 1c), which improved the correctness and quality of data. The PTR-TOF-MS also enables compound identification with high mass resolution, allowing it to clearly distinguish between closely spaced peaks that may overlap when using other analytical methods. However, despite its many advantages, the methodology used here also has some drawbacks. Especially the fact that the PTR-TOF-MS does not allow for the exact identification of compounds is a clear disadvantage. In future studies, we suggest combined methodological approaches (e.g., as nicely done by Saunier et al. (2025b)) that allow both accurate quantification and identification of emitted BVOCs.
It is important to note that the BVOC profiles measured for the different macrophytes are not complete. With any single analytical method, it is impossible to capture the complete range of BVOCs. For instance, with any PTR- MS, volatile halocarbons cannot be measured because their proton affinities are lower than that of water, which makes the ionization reaction thermodynamically unfavourable. Conversely, while GC-MS systems easily resolve these non-polar halocarbons, they often have trouble measuring highly polar or thermally labile oxygenated VOCs due to adsorption losses on the chromatographic column. Additionally, in our dataset some detected compounds are likely fragments of larger molecules, whereas others that we report as single compounds may in fact represent multiple distinct species (e.g., structural isomers). Moreover, it is important to note that macrophyte BVOC emissions exhibit pronounced diel- and seasonal variability (e.g., Saunier et al., 2025b; Broadgate et al., 2004, Coquin et al., 2026). Finally, although the replicates primarily consisted of the target species in terms of biomass, we cannot exclude the possibility that some of the detected compounds were emitted by epiphytes (filamentous algae) growing on the macrophytes. The above-mentioned factors are not captured in our dataset and should be kept in mind when comparing results across studies. Currently, publicly available macrophyte emission rate data is very scarce, and the scant data that is available is not easily comparable. Developing standardized approaches for reporting, harmonizing, and integrating data generated by different analytical methods should become a priority for marine/macrophyte BVOC emission rate datasets, so that once more data is collected, they can more easily be combined to scale up emission/budget estimations.
4.3.2 Ex situ vs. in situ
In this study, we removed the macrophytes from their natural habitat, which likely altered the BVOC-emissions of the organisms to some degree, e.g., due to increased stress, artificial light conditions or wounding. While not providing the absolute truth of emissions, controlled ex situ studies are still very useful for investigating species specific emissions in high detail and can aid in acquiring accurate in situ data in the future. High quality in situ measurements will be needed to accurately quantify BVOC emissions of undisturbed macrophyte ecosystems, including all relevant biotic interactions and components (e.g., macrophytes, fauna, sediment and microbes). However, in the Baltic Sea and other marine areas with inherently high BVOC concentrations in the water column, acquiring high quality background measurements for in situ experiments will be challenging, especially if time-integrated measurements are deployed. Based on our results, if background concentrations are very high, macrophyte emissions might not be high enough to allow detection from the water-background signal. If not accounted for, we predict that this can easily lead to incorrect emission rate calculations and lower the number of detected compounds. Thus, in situ data sets will likely not achieve the accuracy and clarity of our ex situ measurements, and therefore the datasets presented here can help predict and untangle more complex in situ data.
4.3.3 The unknown fate of macrophyte BVOCs
The majority of BVOCs emitted by macrophytes into seawater will likely not reach the surface or enter the atmosphere. In the open ocean only a small fraction of total concentrations in the water column enters the atmosphere e.g., ∼ 10 % of total DMS (Yang et al., 2013; Hopkins et al., 2023). Several processes in the water column (including microbial degradation, photooxidation, below surface chemical reactions) affect the fate and end-destination of BVOCs (Hopkins et al., 2023; Wang et al., 2025). These processes will also be important for determining the fate of BVOCs emitted by macrophytes, but when comparing macrophyte-dominated shallow areas to the open ocean, there are several differences that might affect the ratios reaching the surface. Firstly, macrophytes generally occupy shallow coastal environments and most often grow above 30 m depth, whereas pelagic phytoplankton can occur throughout the upper water column to much greater depths. This shorter distance to the surface might increase the odds of compounds reaching the atmosphere. In the intertidal zone, macrophytes are exposed daily to the atmosphere during low tide, and this likely further enhances atmospheric emissions. For instance, corals can emit very large quantities of DMS into the atmosphere when above the low tide level (Hopkins et al., 2016). Additionally, wave build up, crashing waves and overall increased coastal hydrodynamics can potentially also affect atmospheric emissions, due to increased water movement, sea spray and water surface breakage. However, how these processes affect atmospheric BVOC emissions at the coasts are poorly quantified, leaving scarce knowledge of where macrophyte BVOCs end up. Therefore, establishing the fractions of BVOC reaching the atmosphere and the overall fate of compounds are crucial objectives in the future, so that measurements like ours and eventual in situ measurements can more precisely be put into atmospheric context.
4.4 Outlook
Terrestrial deforestation has been shown to reduce BVOC emissions, with direct effects on atmospheric processes and local climate (Tripathi et al., 2025), and the large losses of forested areas during the last centuries have led to significant reductions in atmospheric BVOCs and SOAs (Vella et al., 2025). During the last century global macrophyte cover has also reduced greatly (e.g., 40 %–60 % decline of kelp forests and ∼ 19 % of seagrass; Wernberg et al., 2019; Dunic et al., 2021) and the negative trend is expected to continue (Manca et al., 2024). Such losses have already impacted rates of marine BVOC emissions to some degree and will continuously do so in the future, with unknown climate impacts as a result. However, this particular ecosystem service has largely remained unexplored for macrophytes. Similarly to the Blue Carbon boom of the last decade (Macreadie et al., 2021), if macrophyte BVOC emissions and their climate impact can be estimated, the information would bring much needed attention and value to these threatened ecosystems, which in turn could be used to aid their conservation.
In this study the seagrass Zostera showed the highest standardized total emission rates in both marine regions and very similar rates between regions. Globally, algae (both micro- and macro-) will still be larger BVOC-sources than seagrasses due to their substantially larger spatial coverage and biomass. Yet, our results (together with Saunier et al., 2025b) show that seagrasses emit many atmospherically relevant BVOCs at notable rates. For the seagrass genus Zostera, a global mean biomass dry weight per area has recently been estimated (226 g DW m−2; Foster et al., 2025), and by using this value, the total BVOC emission rates calculated in this study (Fig. 4a) translate to 12.0 and 12.3 µg BVOCs m−2 h−1 in Finland and Ireland, respectively. At present, the low amount of data and high unexplained variability in emissions make it unreliable to upscale these estimations even further (e.g., to global emissions with seagrass coverage data). Large-scale emission estimates are not only lacking for seagrasses, but all macrophytes and, in the future, more research efforts should be made to acquire quantitative and qualitative macrophyte emission data so that macrophytes emissions can eventually be added to marine BVOC budgets.
Our measurements reveal temperate marine macrophytes as highly diverse BVOC sources, exhibiting substantial variability of emissions across multiple biological levels. At the species-level, we found that the individual macrophytes emit hundreds of distinct compounds, revealing extensive chemical diversity of BVOC emissions. Between species, we found clear differences in the BVOC profiles (both in emitted compounds and emission rates) of the three macrophytes, but interestingly, all species still share a core suite of emitted compounds. Within species, across the two marine regions, the macrophytes emitted surprisingly different BVOC profiles and unravelling the drivers behind these pronounced differences represents an important task for the future. Overall, our results show that macrophytes emit many atmospherically relevant BVOCs, underscoring the need to better incorporate these emissions into global budgets. Linked to this, an important conclusion of this study is that acquiring reliable estimates of species-specific BVOC emission profiles and rates, requires observations from multiple populations growing in contrasting environmental conditions. Consequently, collection of more high quality data, alongside a better understanding of what drives the high measured variability, will be needed so that global macrophyte BVOC emissions can eventually be calculated. This study offers some of the most complete data on macrophyte BVOC emission rates to date, pinpoints crucial methodological advancements and open questions, and can serve as a foundational puzzle piece for advancing our understanding of global macrophyte BVOC emissions.
All BVOC emission rates measured during the study are available at: https://doi.org/10.17043/coastclim-grafnings-2026-coastvoc-1 (Gräfnings et al., 2026).
The supplement related to this article is available online at https://doi.org/10.5194/bg-23-7183-2026-supplement.
Max Gräfnings: Conceptualization, Formal analysis, Investigation, Methodology, Visualization, Writing (original draft preparation), Writing (review and editing); Yuanyuan Luo: Investigation, Methodology, Writing (review and editing); Jian Zhao: Investigation, Methodology, Writing (review and editing); Claudia L. Cara-Ortega: Resources, Writing (review and editing); Kirsten N. Fossum: Resources, Writing (review and editing); Frans Graeffe: Methodology, Writing (review and editing); Lu Lei: Resources, Writing (review and editing); Dagmar B. Stengel: Resources, Writing (review and editing); Roseline C. Thakur: Methodology, Writing (review and editing); Jurgita Ovadnevaite: Funding acquisition, Writing (review and editing); Mikael Ehn: Conceptualization, Funding acquisition, Methodology, Supervision, Writing (review and editing); Camilla Gustafsson: Conceptualization, Funding acquisition, Supervision, Writing (review and editing).
The contact author has declared that none of the authors has any competing interests.
Publisher's note: Copernicus Publications remains neutral with regard to jurisdictional claims made in the text, published maps, institutional affiliations, or any other geographical representation in this paper. The authors bear the ultimate responsibility for providing appropriate place names. Views expressed in the text are those of the authors and do not necessarily reflect the views of the publisher.
The authors acknowledge Laura Koivuniemi, Eveliina Rantanen, and the staff of the research stations (TZS, MHD and CRS in Carna) for their help. We would like to thank the Ryan Institute's CRS (University of Galway) and Dr. Alex Wan, Oilibhéar Ó Niaidh, Sean Casey, and Kieran O'Halloran with help in seawater collection and treatment. This study used research infrastructure facilities at Tvärminne Zoological Station, University of Helsinki, as part of FINMARI (Finnish Marine Research Infrastructure consortium). We are grateful to Dr. Amélie Saunier and an anonymous reviewer whose feedback helped us improve the article substantially. This is a publication from the Centre for Coastal Ecosystem and Climate Change Research (http://www.coastclim.org, last access: 8 October 2026).
This research was funded by the BNP Paribas Foundation (Biodiversity & Climate Initiative, 2023-2025: Coast-VOC). This research was also supported by Taighde Éireann – Research Ireland under Grant number (22/FFP-A/10611), Jane and Aatos Erkko Foundation and the Research Council of Finland (grant no. 354454 to CG).
Open-access funding was provided by the Helsinki University Library.
This paper was edited by Tina Treude and reviewed by three anonymous referees.
Abrahamsson, K., Choo, K.-S., Pedersén, M., Johansson, G., and Snoeijs, P.: Effects of temperature on the production of hydrogen peroxide and volatile halocarbons by brackish-water algae, Phytochemistry, 64, 725–734, https://doi.org/10.1016/S0031-9422(03)00419-9, 2003.
Arfin, T., Pillai, A. M., Mathew, N., Tirpude, A., Bang, R., and Mondal, P.: An overview of atmospheric aerosol and their effects on human health, Environ. Sci. Pollut. R., 30, 125347–125369, https://doi.org/10.1007/s11356-023-29652-w, 2023.
Asher, E. C., Dacey, J. W. H., Stukel, M., Long, M. C., and Tortell, P. D.: Processes driving seasonal variability in DMS, DMSP, and DMSO concentrations and turnover in coastal Antarctic waters, Limnol. Oceanogr., 62, 104–124, https://doi.org/10.1002/lno.10379, 2017.
Bäck, S., Collins, J. C., and Russell, G.: Comparative ecophysiology of Baltic and Atlantic Fucus vesiculosus, Mar. Ecol.-Prog. Ser., 84, 71–82, https://doi.org/10.3354/meps084071, 1992.
Bourtsoukidis, E., Guenther, A., Wang, H., Economou, T., Lazoglou, G., Christodoulou, A., Christoudias, T., Nölscher, A., Yañez-Serrano, A. M., and Peñuelas, J.: Environmental Change Is Reshaping the Temperature Sensitivity of Sesquiterpene Emissions and Their Atmospheric Impacts, Glob. Change Biol., 31, e70258, https://doi.org/10.1111/gcb.70258, 2025.
Boy, M., Zhou, P., Kurtén, T., Chen, D., Xavier, C., Clusius, P., Roldin, P., Baykara, M., Pichelstorfer, L., Foreback, B., Bäck, J., Petäjä, T., Makkonen, R., Kerminen, V.-M., Pihlatie, M., Aalto, J., and Kulmala, M.: Positive feedback mechanism between biogenic volatile organic compounds and the methane lifetime in future climates, npj Clim. Atmos. Sci., 5, 72, https://doi.org/10.1038/s41612-022-00292-0, 2022.
Bravo-Linares, C. M., Mudge, S. M., and Loyola-Sepulveda, R. H.: Production of volatile organic compounds (VOCs) by temperate macroalgae: The use of solid phase microextraction (SPME) coupled to GC-MS as method of analysis, J. Chil. Chem. Soc., 55, 227–232, https://doi.org/10.4067/S0717-97072010000200018, 2010.
Broadgate, W. J., Malin, G., Küpper, F. C., Thompson, A., and Liss, P. S.: Isoprene and other non-methane hydrocarbons from seaweeds: a source of reactive hydrocarbons to the atmosphere, Mar. Chem., 88, 61–73, https://doi.org/10.1016/j.marchem.2004.03.002, 2004.
Carpenter, L. J., Archer, S. D., and Beale, R.: Ocean-atmosphere trace gas exchange, Chem. Soc. Rev, 41, 6473–6506, https://doi.org/10.1039/C2CS35121H, 2012.
Coggon, M. M., Stockwell, C. E., Claflin, M. S., Pfannerstill, E. Y., Xu, L., Gilman, J. B., Marcantonio, J., Cao, C., Bates, K., Gkatzelis, G. I., Lamplugh, A., Katz, E. F., Arata, C., Apel, E. C., Hornbrook, R. S., Piel, F., Majluf, F., Blake, D. R., Wisthaler, A., Canagaratna, M., Lerner, B. M., Goldstein, A. H., Mak, J E., and Warneke, C.: Identifying and correcting interferences to PTR-ToF-MS measurements of isoprene and other urban volatile organic compounds, Atmos. Meas. Tech., 17, 801–825, https://doi.org/10.5194/amt-17-801-2024, 2024.
Conway, J. R., Lex, A., and Gehlenborg, N.: UpSetR: An R package for the visualization of intersecting sets and their properties, Bioinformatics, 33, 2938–2940, https://doi.org/10.1093/bioinformatics/btx364, 2017.
Coquin, S., Ormeno, E., Pasqualini, V., Monnier, B., Culioli, G., Lecareux, C., Fernandez, C., and Saunier, A.: Chemical diversity of Mediterranean seagrasses volatilome, Metabolites, 14, 705, https://doi.org/10.3390/metabo14120705, 2024.
Coquin, S., Ormeno, E., Ouisse, V., Pasqualini, V., Monnier, B., Lecareux, C., Fernandez, C., and Saunier, A.: Seasonal and spatial shifts in the volatile chemical profile of Cymodocea nodosa across marine and lagoon ecosystems, Sci. Rep., 2026, https://doi.org/10.1038/s41598-026-40760-8, 2026.
Curson, A. R., Todd, J. D., Sullivan, M. J., and Johnston, A. W.: Catabolism of dimethylsulphoniopropionate: microorganisms, enzymes and genes, Nat. Rev. Microbiol., 9, 849–859, https://doi.org/10.1038/nrmicro2653. PMID: 21986900, 2011.
Duarte, C. M., Gattuso J.-P., Hancke K., Gundersen H., Filbee-Dexter K., Pedersen M. F., Middelburg J. J., Burrows M. T., Krumhansl K. A., Wernberg, T., Moor, P., Pessarrodona, A., Orberg, S. B., Pinto, I. S., Assis, J., Queiros, A. M., Smale, D. A., Bekkby, T., Serrao, E. A., and Krause-Jensen, D.: Global estimates of the extent and production of macroalgal forests, Global Ecol. Biogeogr., 31, 1422–1439, https://doi.org/10.1111/geb.13515, 2022.
Dunic, J. C., Brown, C. J., Turschwell, M. P., and Côté, I. M.: Long-term declines and recovery of meadow area across the world's seagrass bioregions, Glob. Change Biol., 1–14, https://doi.org/10.1111/gcb.15684, 2021.
Eger, A. M., Marzinelli, E. M., Beas-Luna, R., Blain, C. O., Blamey, L. K., Byrnes, J. E. K., Carnell, P. E., Choi, C. G., Hessing-Lewis, M., Kim, K. Y., Kumagai, N. H., Lorda, J., Moore, P., Nakamura, Y., Pérez-Matus, A., Pontier, O., Smale, D., Steinberg, P. D., and Vergés, A.: The value of ecosystem services in global marine kelp forests, Nat. Commun., 14, 1894, https://doi.org/10.1038/s41467-023-37385-0, 2023.
Exton, D. A., McGenity, T. J., Steinke, M., Smith, D. J., and Suggett, D. J.: Uncovering the volatile nature of tropical coastal marine ecosystems in a changing world, Glob. Change Biol., 21, 1383–1394, https://doi.org/10.1111/gcb.12764, 2015.
Fink, P.: Ecological functions of volatile organic compounds in aquatic systems, Mar. Freshw. Behav. Phy., 40, 155–168, https://doi.org/10.1080/10236240701602218, 2007.
Foster, N. R., Gomis, E., Montemayor, D. I., Strydom, S., Mateo, M. A., Serrano, E., Ricart, A. M., Dahl, M., Mazarrasa, I., Cisternas, P., Whiteley, H., Bates, E. J., Puigcorbé, V., Moreda, U., Truc, M., Inostroza, K., Huertas, R., McCallum, R., Lafratta, A., Webster, C. L., O'Dea, C. M., Said, N. E., Duarte, C. M., Lavery, P. S., and Serrano, O.: Global Patterns and Drivers of Seagrass Biomass, Net Primary Production and Meadow Structure, J. Biogeogr., 52, e70041, https://doi.org/10.1111/jbi.70041, 2025.
Fu, P., Kawamura, K., and Miura, K.: Molecular characterization of marine organic aerosols collected during a round-the-world cruise, J. Geophys. Res.-Atmos., 116, D13302, https://doi.org/10.1029/2011JD015604, 2011.
Gantt, B., Xu, J., Meskhidze, N., Zhang, Y., Nenes, A., Ghan, S. J., Liu, X., Easter, R., and Zaveri, R.: Global distribution and climate forcing of marine organic aerosol – Part 2: Effects on cloud properties and radiative forcing, Atmos. Chem. Phys., 12, 6555–6563, https://doi.org/10.5194/acp-12-6555-2012, 2012.
Gräfnings, M., Luo, Y., Zhao, J., Cara-Ortega, C. L., Fossum, K. N., Graeffe, F., Lei, L., Stengel, D. B., Thakur, R. C., Ovadnevaite, J., Ehn, M., and Gustafsson, C.: Macrophyte Biogenic Volatile Organic compound emission rates from the Baltic Sea and NE Atlantic, 2025, Dataset version 1, Bolin Centre Database [data set], https://doi.org/10.17043/coastclim-grafnings-2026-coastvoc-1, 2026.
Guenther, A., Hewitt, C. N., Erickson, D., Fall, R., Geron, C., Graedel, T., Harley, P., Klinger, L., Lerdau, M., McKay, W. A., Pierce, T., Scholes, B., Steinbrecher, R., Tallamraju, R., Taylor, J., and Zimmerman, P.: A global model of natural volatile organic compound emissions, J. Geophys. Res.-Atmos., 100, 8873–8892, https://doi.org/10.1029/94JD02950, 1995.
Guenther, A. B., Jiang, X., Heald, C. L., Sakulyanontvittaya, T., Duhl, T., Emmons, L. K., and Wang, X.: The Model of Emissions of Gases and Aerosols from Nature version 2.1 (MEGAN2.1): an extended and updated framework for modeling biogenic emissions, Geosci. Model Dev., 5, 1471–1492, https://doi.org/10.5194/gmd-5-1471-2012, 2012.
Halsey, K. H. and Giovannoni, S. J.: Biological controls on marine volatile organic compound emissions: A balancing act at the sea–air interface, Earth-Sci. Rev., 240, 104360, https://doi.org/10.1016/j.earscirev.2023.104360, 2023.
Hoffmann, E. H., Tilgner, A., Schrödner, R., Bräuer, P., Wolke, R., and Herrmann, H.: An advanced modeling study on the impacts and atmospheric implications of multiphase dimethyl sulfide chemistry, P. Natl. Acad. Sci. USA, 113, 11776–11781, https://doi.org/10.1073/pnas.1606320113, 2016.
Hopkins, F. E., Bell, T. G., Yang, M., Suggett, D. J., and Steinke, M.: Air exposure of coral is a significant source of dimethylsulfide (DMS) to the atmosphere, Sci. Rep., 6, 36031, https://doi.org/10.1038/srep36031, 2016.
Hopkins, F. E., Archer, S. D., Bell, T. G., Suntharalingam, P., and Todd, J. D.: The biogeochemistry of marine dimethylsulfide, Nat. Rev. Earth Environ., 4, 361–376, https://doi.org/10.1038/s43017-023-00428-7, 2023.
Horincar, V. B., Parfene, G., Tyagi, A. K., Gottardi, D., Dinică, R., Guerzoni, M. E., and Bahrim, G.: Extraction and characterization of volatile compounds and fatty acids from red and green macroalgae from the Romanian Black Sea in order to obtain valuable bioadditives and biopreservatives, J. Appl. Phycol., 26, 551–559, https://doi.org/10.1007/s10811-013-0053-0, 2014.
Hrebien, V., Deschaseaux, E., and Eyre, B. D.: Isoprene fluxes from warm temperate and tropical seagrass communities, Mar. Ecol.-Prog. Ser., 676, 1–17, https://doi.org/10.3354/meps13830, 2021.
Jerković, I., Marijanović, Z., Roje, M., Kuś, P. M., Jokić, S., and Čož-Rakovac, R.: Phytochemical study of the headspace volatile organic compounds of fresh algae and seagrass from the Adriatic Sea (single point collection), PLOS ONE, 13, e0196462, https://doi.org/10.1371/journal.pone.0196462, 2018.
Jonkers, H. M., van Bergeijk, S. A., and van Gemerden, H.: Microbial production and consumption of dimethyl sulfide (DMS) in a sea grass (Zostera noltii)-dominated marine intertidal sediment ecosystem (Bassin d'Arcachon, France), FEMS Microbiol. Ecol., 31, 163–172, https://doi.org/10.1016/S0168-6496(99)00097-5, 2000.
Kang, M., Fu, P., Kawamura, K., Yang, F., Zhang, H., Zang, Z., Ren, H., Ren, L., Zhao, Y., Sun, Y., and Wang, Z.: Characterization of biogenic primary and secondary organic aerosols in the marine atmosphere over the East China Sea, Atmos. Chem. Phys., 18, 13947–13967, https://doi.org/10.5194/acp-18-13947-2018, 2018.
Kesselmeier, J. and Staudt, M.: Biogenic volatile organic compounds (VOC): An overview on emission, physiology and ecology, J. Atmos. Chem., 33, 23–88, https://doi.org/10.1023/A:1006127516791, 1999.
Krechmer, J., Lopez-Hilfiker, F., Koss, A., Hutterli, M., Stoermer, C., Deming, B., Kimmel, J., Warneke, C., Holzinger, R., Jayne, J., Worsnop, D., Fuhrer, K., Gonin, M., and de Gouw, J.: Evaluation of a New Reagent-Ion Source and Focusing Ion-Molecule Reactor for Proton-Transfer-Reaction Mass Spectrometry, Anal. Chem., 90, 12011–12018, https://doi.org/10.1021/acs.analchem.8b02641, 2018.
Lawson, C. A., Possell, M., Seymour, J. R., Raina, J.-B., and Suggett, D. J.: Coral endosymbionts (Symbiodiniaceae) emit species-specific volatilomes that shift when exposed to thermal stress, Sci. Rep., 9, 17395, https://doi.org/10.1038/s41598-019-53552-0, 2019.
Leedham Elvidge, E. C., Hughes, C., Keng, F. S. L., Phang, S.-M., Malin, G., and Sturges, W. T.: Emission of atmospherically significant halocarbons by naturally occurring and farmed tropical macroalgae, Biogeosciences, 10, 3615–3633, https://doi.org/10.5194/bg-10-3615-2013, 2013.
Lemfack, M. C., Gohlke, B.-O., Toguem, S. M. T., Preissner, S., Piechulla, B., and Preissner, R.: mVOC 2.0: a database of microbial volatiles, Nucleic Acids Res., 46, D1261–D1265, https://doi.org/10.1093/nar/gkx1016, 2018.
Li, H., Almeida, T. G., Luo, Y., Zhao, J., Palm, B. B., Daub, C. D., Huang, W., Mohr, C., Krechmer, J. E., Kurtén, T., and Ehn, M.: Fragmentation inside proton-transfer-reaction-based mass spectrometers limits the detection of ROOR and ROOH peroxides, Atmos. Meas. Tech., 15, 1811–1827, https://doi.org/10.5194/amt-15-1811-2022, 2022.
Lim, Y. B. and Ziemann, P. J.: Effects of molecular structure on aerosol yields from OH radical-initiated reactions of linear, branched, and cyclic alkanes in the presence of NOx, Environ. Sci. Technol., 43, 2328–2334, https://doi.org/10.1021/es803389s, 2009.
Macreadie, P. I., Costa, M. D. P., Atwood, T. B., Friess, D. A., Kelleway, J. J., Kennedy, H., Lovelock, C. E., Serrano, O., and Duarte, C. M.: Blue carbon as a natural climate solution, Nat. Rev. Earth Environ, 2, 826–839, https://doi.org/10.1038/s43017-021-00224-1, 2021.
Manca, F., Benedetti-Cecchi, L., Bradshaw, C. J. A., Cabeza, M., Gustafsson, C., Norkko, A. M., Roslin, T. V., Thomas, D. N., White, L., and Strona, G.: Projected loss of brown macroalgae and seagrasses with global environmental change, Nat. Commun., 15, 5344, https://doi.org/10.1038/s41467-024-48273-6, 2024.
Maruti, A., Durán-Guerrero, E., Barroso, C. G., and Castro, R.: Optimization of a multiple headspace sorptive extraction method coupled to gas chromatography-mass spectrometry for the determination of volatile compounds in macroalgae, J. Chromatogr. A, 1551, 41–51, https://doi.org/10.1016/j.chroma.2018.04.011, 2018.
McKenzie, L. J., Nordlund, L. M., Jones, B. L., Cullen-Unsworth, L. C., Roelfsema, C., and Unsworth, R. K. F.: The global distribution of seagrass meadows, Environ. Res. Lett., 15, 074041, https://doi.org/10.1088/1748-9326/ab7d06, 2020.
Nordlund, L. M., Koch, E. W., Barbier, E. B., and Creed, J. C.: Seagrass Ecosystem Services and Their Variability across Genera and Geographical Regions, PLOS ONE, 11, e0163091, https://doi.org/10.1371/journal.pone.0163091, 2016.
Oksanen, J., Simpson, G., Blanchet, F., Kindt, R., Legendre, P., Minchin, P., O'Hara, R., Solymos, P., Stevens, M., Szoecs, E., Wagner, H., Barbour, M., Bedward, M., Bolker, B., Borcard, D., Carvalho, G., Chirico, M., De Caceres, M., Durand, S., Evangelista, H., FitzJohn, R., Friendly, M., Furneaux, B., Hannigan, G., Hill, M., Lahti, L., McGlinn, D., Ouellette, M., Ribeiro Cunha, E., Smith, T., Stier, A., Ter Braak, C., and Weedon, J.: vegan: Community Ecology Package, R package version 2.6-4, CRAN [code], https://doi.org/10.32614/CRAN.package.vegan, 2022.
Peñuelas, J. and Llusià, J.: The complexity of factors driving volatile organic compound emissions by plants, Biol. Plantarum, 44, 481–487, https://doi.org/10.1023/A:1013797129428, 2001.
Pozzer, A. C., Gómez, P. A., and Weiss, J.: Volatile organic compounds in aquatic ecosystems – Detection, origin, significance and application, Sci. Total Environ., 838, 156155, https://doi.org/10.1016/j.scitotenv.2022.156155, 2022.
R Core Team: R: A Language and Environment for Statistical Computing, Version 4.3.0, R Foundation for Statistical Computing, https://www.R-project.org/ (last access: 8 October 2026), 2023.
Rubino, S., Peteiro, C., Aymerich, T., and Hortós, M.: Brown Macroalgae (Phaeophyceae): A Valuable Reservoir of Antimicrobial Compounds on Northern Coast of Spain, Mar. Drugs, 20, 775, https://doi.org/10.3390/md20120775, 2022.
Sartin, J. H., Halsall, C. J., Davison, B., Owen, S., and Hewitt, C. N.: Determination of biogenic volatile organic compounds (C8–C16) in the coastal atmosphere at Mace Head, Ireland, Anal. Chim. Ac., 428, 61–72, https://doi.org/10.1016/S0003-2670(00)01214-9, 2001.
Sartin, J. H., Halsall, C. J., Hayward, S., and Hewitt, C. N.: Emission rates of C8–C15 VOCs from seaweed and sand in the inter-tidal zone at Mace Head, Ireland, Atmos. Environ., 36, 5311–5321, https://doi.org/10.1016/S1352-2310(02)00639-8, 2002.
Saunier, A., Coquin, S., Nguyen, X.-M.-A., Shili, A., Ormeno, E., and Fernandez, C.: Biogenic volatile organic compounds from marine benthic organisms: a review, Mar. Environ. Res., 209, 107162, https://doi.org/10.1016/j.marenvres.2025.107162, 2025a.
Saunier, A., Kammer, J., Rocco, M., Wortham, H., Coquin, S., Raina, J.-B., Lecareux, C., Ormeno, E., and Fernandez, C.: BVOC emissions from Posidonia oceanica, the most abundant Mediterranean seagrass species, Chemosphere, 378, 144392, https://doi.org/10.1016/j.chemosphere.2025.144392, 2025b.
Stefels, J., Steinke, M., Turner, S. M., Malin, G., and Belviso, S.: Environmental constraints on the production and removal of dimethylsulphide (DMS) and implications for ecosystem modelling, Biogeochemistry, 83, 245–275, https://doi.org/10.1007/s10533-007-9091-5, 2007.
Steinke, M., Randell, L., Dumbrell, A. J., and Saha, M.: Chapter three – volatile biomarkers for aquatic ecological research, in Advances in Ecological Research, Academic Press, New York, 75–92, https://doi.org/10.1016/bs.aecr.2018.09.002, 2018.
Thakur, R. C., Peltola, M., Spence, K., Vähä, A., Haapanala, S., Ke, P., Ezhova, E., Hellén, H., Geilfus, N.-X., Chan, T., Norkko, J., Mammarella, I., Ehn, M., Norkko, A., and Kulmala, M.: Coastal-SMEAR – introduction to infrastructure and capacity of the atmospheric observatory in Tvärminne, Finland, Boreal Environ. Res., 30, 195–219, https://doi.org/10.60910/ber2025.7rkh-0d75, 2025.
Tripathi, N., Krumm, B. E., Edtbauer, A., Ringsdorf, A., Wang, N., Kohl, M., Vella, R., Machado, L. A. T., Pozzer, A., Lelieveld, J., and Williams, J.: Impacts of convection, chemistry, and forest clearing on biogenic volatile organic compounds over the Amazon, Nat. Commun., 16, 4692, https://doi.org/10.1038/s41467-025-59953-2, 2025.
Vella, R., Forrest, M., Pozzer, A., Tsimpidi, A. P., Hickler, T., Lelieveld, J., and Tost, H.: Influence of land cover change on atmospheric organic gases, aerosols, and radiative effects, Atmos. Chem. Phys., 25, 243–262, https://doi.org/10.5194/acp-25-243-2025, 2025.
Wada, S. and Hama, T.: Application of Gas Chromatography to Exuded Organic Matter Derived from Macroalgae, in Advanced Gas Chromatography – Progress in Agricultural, Biomedical and Industrial Applications, InTech, https://doi.org/10.5772/33684, 2012.
Wang, J., Li, J., Tchinda, N. T., and Du, L.: Marine biogenic volatile organic compounds: production, emission, atmospheric transformation, and climate effects, Curr. Pollut. Rep., 11, 37, https://doi.org/10.1007/s40726-025-00365-7, 2025.
Wernberg, T., Krumhansl, K., Filbee-Dexter, K., and Pedersen, M. F.: Chapter 3: Status and Trends for the World's Kelp Forests, in World Seas: An Environmental Evaluation, Elsevier, 22, https://doi.org/10.1016/B978-0-12-805052-1.00003-6, 2019.
Yáñez-Serrano, A. M., Filella, I., Llusià, J., Gargallo-Garriga, A., Granda, V., Bourtsoukidis, E., Williams, J., Seco, R., Cappellin, L., Werner, C., de Gouw, J., and Peñuelas, J.: GLOVOCS – Master compound assignment guide for PTR-MS users, Atmos. Environ., 244, 117929, https://doi.org/10.1016/j.atmosenv.2020.117929, 2021.
Yang, M., Archer, S. D., Blomquist, B. W., Ho, D. T., Lance, V. P., and Torres, R. J.: Lagrangian evolution of DMS during the Southern Ocean gas exchange experiment: The effects of vertical mixing and biological community shift, J. Geophys. Res.-Oceans, 118, 6774–6790, https://doi.org/10.1002/2013JC009329, 2013.
Yu, Z. and Li, Y.: Marine volatile organic compounds and their impacts on marine aerosol – A review, Sci. Total Environ., https://doi.org/10.1016/j.scitotenv.2021.145054, 2021.
Zhang, X.-H., Liu, J., Liu, J., Yang, G., Xue, C.-X., Curson, A. R. J., and Todd, J. D.: Biogenic production of DMSP and its degradation to DMS – their roles in the global sulfur cycle, Sci. China Life Sci., 62, 1296–1319, https://doi.org/10.1007/s11427-018-9524-y, 2019.
Zhang, Y., Wang, Y., Li, C., Li, Y., Yin, S., Claflin, M. S., Lerner, B. M., Worsnop, D., and Wang, L.: Interpretation of mass spectra by a Vocus proton-transfer-reaction mass spectrometer (PTR-MS) at an urban site: insights from gas chromatographic pre-separation, Atmos. Meas. Tech., 18, 3547–3568, https://doi.org/10.5194/amt-18-3547-2025, 2025.
Zhao, D., Yang, Y., Tham, Y. J., and Zou, S.: Emission of marine volatile organic compounds (VOCs) by phytoplankton – a review, Mar. Environ. Res., 191, 106177, https://doi.org/10.1016/j.marenvres.2023.106177, 2023.