
the Creative Commons Attribution 4.0 License.
the Creative Commons Attribution 4.0 License.
 | 21 Oct 2026
Eddy covariance diverges from inventory and model-based estimates of soil organic carbon stock change across five crop rotations in Belgian cropland
Quentin Beauclaire

Bernard Longdoz
Laura Delhez
Bruna Winck
Benjamin Loubet
Marmar Sabetizade
Neo Arquin
Nicolas Saby
Bernard Heinesch
Quantifying long-term soil organic carbon (SOC) dynamics in croplands is critical to evaluate their climate mitigation potential. We assessed SOC stock changes over 21 years at the BE-Lon ICOS cropland (Belgium) by comparing decadal soil inventories, RothC model simulations, and eddy covariance (EC) flux measurements, supported by comprehensive uncertainty propagation. Soil inventories indicated no significant change in SOC stocks, while RothC simulations indicated a gain of 20.4 ± 34.7 g C m−2 yr−1. In contrast, EC-derived carbon budgets suggested mean annual SOC losses of 69.8 ± 19.2 g C m−2 yr−1. Uncertainty in the flux-based approach was distributed evenly among spectral corrections, friction velocity thresholds, and lateral carbon flux estimates; yet it remained substantially smaller than the cumulative flux signal. A systematic positive discrepancy between EC-derived budget and RothC simulations suggests an underestimation of net carbon sequestration by the EC technique, which is consistent with the well-documented energy balance non-closure at cropland sites. Despite these methodological discrepancies, both EC and RothC consistently highlighted the critical role of management practices. Notably, both approaches identified the winter wheat–cover crop sequence as a moderate net carbon source in the absence of organic amendments. Conversely, manure application emerged as the primary driver of SOC stock accumulation. More broadly, this study highlights the necessity of combining process-based models, multi-decadal inventories, and EC flux measurements to reliably constrain SOC budgets and identify robust management drivers in cropland ecosystems.
- Article
(3369 KB) - Full-text XML
-
Supplement
(475 KB) - BibTeX
- EndNote


The management of soil organic carbon (SOC) plays a dual role in sustaining agricultural productivity and regulating the global carbon cycle. While soil represents the largest carbon pool within the terrestrial biosphere, storing two to four times more carbon (C) than the combined total of vegetation and the atmosphere (Lehmann and Kleber, 2015; Terrer et al., 2021), even minor changes in SOC content can either exacerbate or mitigate climate change through their effects on atmospheric CO2 concentrations (Köchy et al., 2015). As a vital component of agricultural productivity, high SOC stocks improve soil structure, supply nutrients, enhance water retention, and support crop performance (Lal, 2020; Pan et al., 2009). Furthermore, SOC sequestration is increasingly recognized as a viable negative emission method, capable of offsetting one-sixth to one-third of annual net anthropogenic CO2 emissions (Friedlingstein et al., 2022; Fuss et al., 2018).
Agricultural soils cover an area of more than 1.2 M ha worldwide, spanning across a wide range of climate zone and edaphic conditions (Potapov et al., 2021). The heterogeneity of agricultural landscapes complicates the assessment of SOC changes over space and time (Penko Seidl and Golobič, 2020; Sulman et al., 2020). In particular, SOC dynamics in croplands are influenced by agricultural practices, including tillage, crop rotation, residue management, and fertilization, which collectively influence nutrient cycling, soil fertility, and greenhouse gas emissions (Ren et al., 2020). Comprehensive and robust methods for SOC assessment are essential to support sustainable agricultural management and to mitigate climate change through the implementation of monitoring, reporting, and verification (MRV) tools (Smith et al., 2020).
Traditional SOC assessment methods rely on direct soil sampling and laboratory analyses, providing detailed but spatially and temporally limited estimates of carbon stocks, lacking the temporal resolution required to capture SOC dynamics (Raffeld et al., 2024; Smith et al., 2020). Additionally, the variability of bulk density and SOC concentration on croplands may also complicate the assessment of SOC stock changes from soil inventories (Goidts et al., 2009). Flux tower measurements offer an alternative method for assessing CO2 exchange at the ecosystem–atmosphere interface through the eddy covariance (EC) technique, which delivers high-frequency observations of net CO2 fluxes across multiple interacting pools, referred to as net ecosystem exchange (NEE) (Baldocchi, 2014). To date, over 800 site-years of data from more than 130 cropland sites have been collected by the FLUXNET network (Pastorello et al., 2020), thereby offering powerful datasets for studying carbon dynamics in croplands. Notably, net biome productivity (NBP) can be estimated from NEE and net lateral CO2 fluxes from agricultural activities (e.g., manure application and harvesting) and reflects changes in SOC stocks when dissolved organic and inorganic carbon fluxes, and changes in vegetation C stocks are negligible (Aubinet et al., 2009). However, the extensive post-processing of EC data can introduce additional uncertainties (Aubinet et al., 2012; Hemes et al., 2021). Although substantial progress has been achieved through the development of standardized quality-control procedures in centralized data-processing pipelines (Pastorello et al., 2020), comprehensive uncertainty analysis across all steps of the EC data processing chain remains essential to ensure robust estimates of carbon fluxes and derived budgets. Process-based SOC models simulate soil carbon cycling processes and their interactions with climate, soil properties and management practices to predict SOC dynamics over time under changing environmental and land-use conditions (Smith et al., 2020). The Rothamsted Carbon Model (RothC – Coleman and Jenkinson, 1996) has been widely used under varying land-use, management scenarios, and climate conditions to predict SOC stocks at local (Dechow et al., 2019; Geremew et al., 2024; Ingwersen et al., 2024; Zimmermann et al., 2007) and large scales (Gutierrez et al., 2023; Jordon and Smith, 2022; Morais et al., 2019; Muhammed et al., 2018). RothC is currently used for estimating national-scale CO2 emissions and removals as a Tier 3 approach in Japan, Switzerland and Australia (Forrester et al., 2024, 2024; Wüst-Galley et al., 2020; Yokozawa et al., 2010), is recommended by the Food and Agriculture Organization of the United Nations (FAO) as a baseline model for mapping SOC sequestration potential (Peralta et al., 2022), and has been integrated into Earth system models (Clark et al., 2011). Yet, predictions of SOC remains strongly sensitive to model structure (Wieder et al., 2014), initial conditions (Todd-Brown et al., 2013) and classical parameterization (Bruni et al., 2022; Hararuk et al., 2014), potentially biasing simulated soil C responses to climate change (Shi et al., 2018). Therefore, uncertainty quantification in soil C models remains critical for assessing the reliability of SOC predictions.
This study assesses changes in SOC stocks over 21 years in a typical 4-year crop rotation at the Lonzée EC station in Wallonia, Belgium. The joint comparison of soil inventories, EC-derived carbon budgets, and RothC simulations provides a unique opportunity to evaluate the consistency of independent approaches, identify potential biases, and improve confidence in SOC stock change estimates. The objectives were to (1) quantify long-term SOC stock changes across methods, (2) assess associated uncertainties, and (3) examine the influence of agricultural management practices on SOC stock dynamics.
2.1 Study site
The study site is located in Lonzée, Belgium (50°33′05.8′′ N 4°44′46.4′′ E, 167 m a.s.l.). The cropland has been cultivated for more than 80 years. Since 2004, sugar beet (SB – Beta vulgaris L.), winter wheat (WW – Triticum aestivum L.) and seed potato (SP – Solanum tuberosum L.) have been grown in a four-year rotation system typical of central Belgium under conventional tillage. Fertilization varied with crop and year but was dominated by repeated nitrogen (N) applications, mainly as liquid N, nitrate, ammonitrate or urea-based fertilizers. The average mineral and organic nitrogen fertilization were respectively 161 kg Nmin ha−1 yr−1 and 23.2 kg Norg ha−1 yr−1. In addition, potassium, calcium, sulfur, boron, and magnesium were applied intermittently and some rotations also received organic amendments such as cow manure and lime-based products. Farming activities associated with these rotations are given in Table S1.
The Lonzée site has been part of the FLUXNET network since 2004 and was labelled “class 2” station in the Integrated Carbon Observation System (ICOS) network in 2017 (site code BE-Lon). The climate is temperate oceanic (Köppen classification Cfb) with annual mean precipitation and temperature of 742 mm and 10.2 °C respectively. The soil is classified as a Stagnic Luvisol (WRB classification, Mantel et al., 2023). Texture shows a clear vertical gradient: silt dominates the topsoil (>80 % in 0–30 cm), sand content decreases with depth, and clay content increases correspondingly. SOC content follows the typical exponential decline with depth observed in ploughed agricultural soils, from 10.9 g C kg−1 in 0–30 cm to 3.96 and 1.80 g C kg−1 in the 30–60 and 60–100 cm layers, respectively (measured in 2017; Table A1).
This paper focuses on the 2004–2024 period, thereby including five rotations starting in April 2004. The first (2004–2008), second (2008–2012) and fourth (2016–2020) rotations followed the typical scheme: SB-WW-SP-WW. Cover crops (mustard MU – Sinapis alba L.; oat OAT – Avena sativa L.; faba bean FAB – Vicia faba L., phacelia PHA – Phacelia tanacetifolia Benth., clover CLO – Trifolium repens L.) were sown after harvesting WW except in 2005, 2007 and 2011. The third (2012–2016) and fifth (2020–2024) rotations diverged from this cropping sequence: in 2012 silage maize (MA – Zea mays L.) replaced SB, and spinach (SPI – Spinacia oleracea L.) and green dwarf beans (GWB – Phaseolus vulgaris L. var. nanus) were sown in 2021 to achieve higher economic returns. Due to technical constraints, the spinach crop was not harvested and was instead crushed and incorporated into the soil in May 2021. Consequently, we classified it as a cover crop in our analysis, as all aboveground biomass were returned to the soil. Green dwarf beans were subsequently sown in August 2021 and harvested in October 2021. Consequently, rotation 5 was extended beyond the typical cycle, ending with the crushing of a mix of phacelia and clover as cover crops after winter wheat harvest until the end of 2024. Due to lack of data availability, the three months of bare soil preceding the end of rotation 5 from January 2025 to March 2025 were not included in the analysis. The study period therefore ended with phacelia-clover crushing in December 2024. The crop calendar is given in Fig. 1.
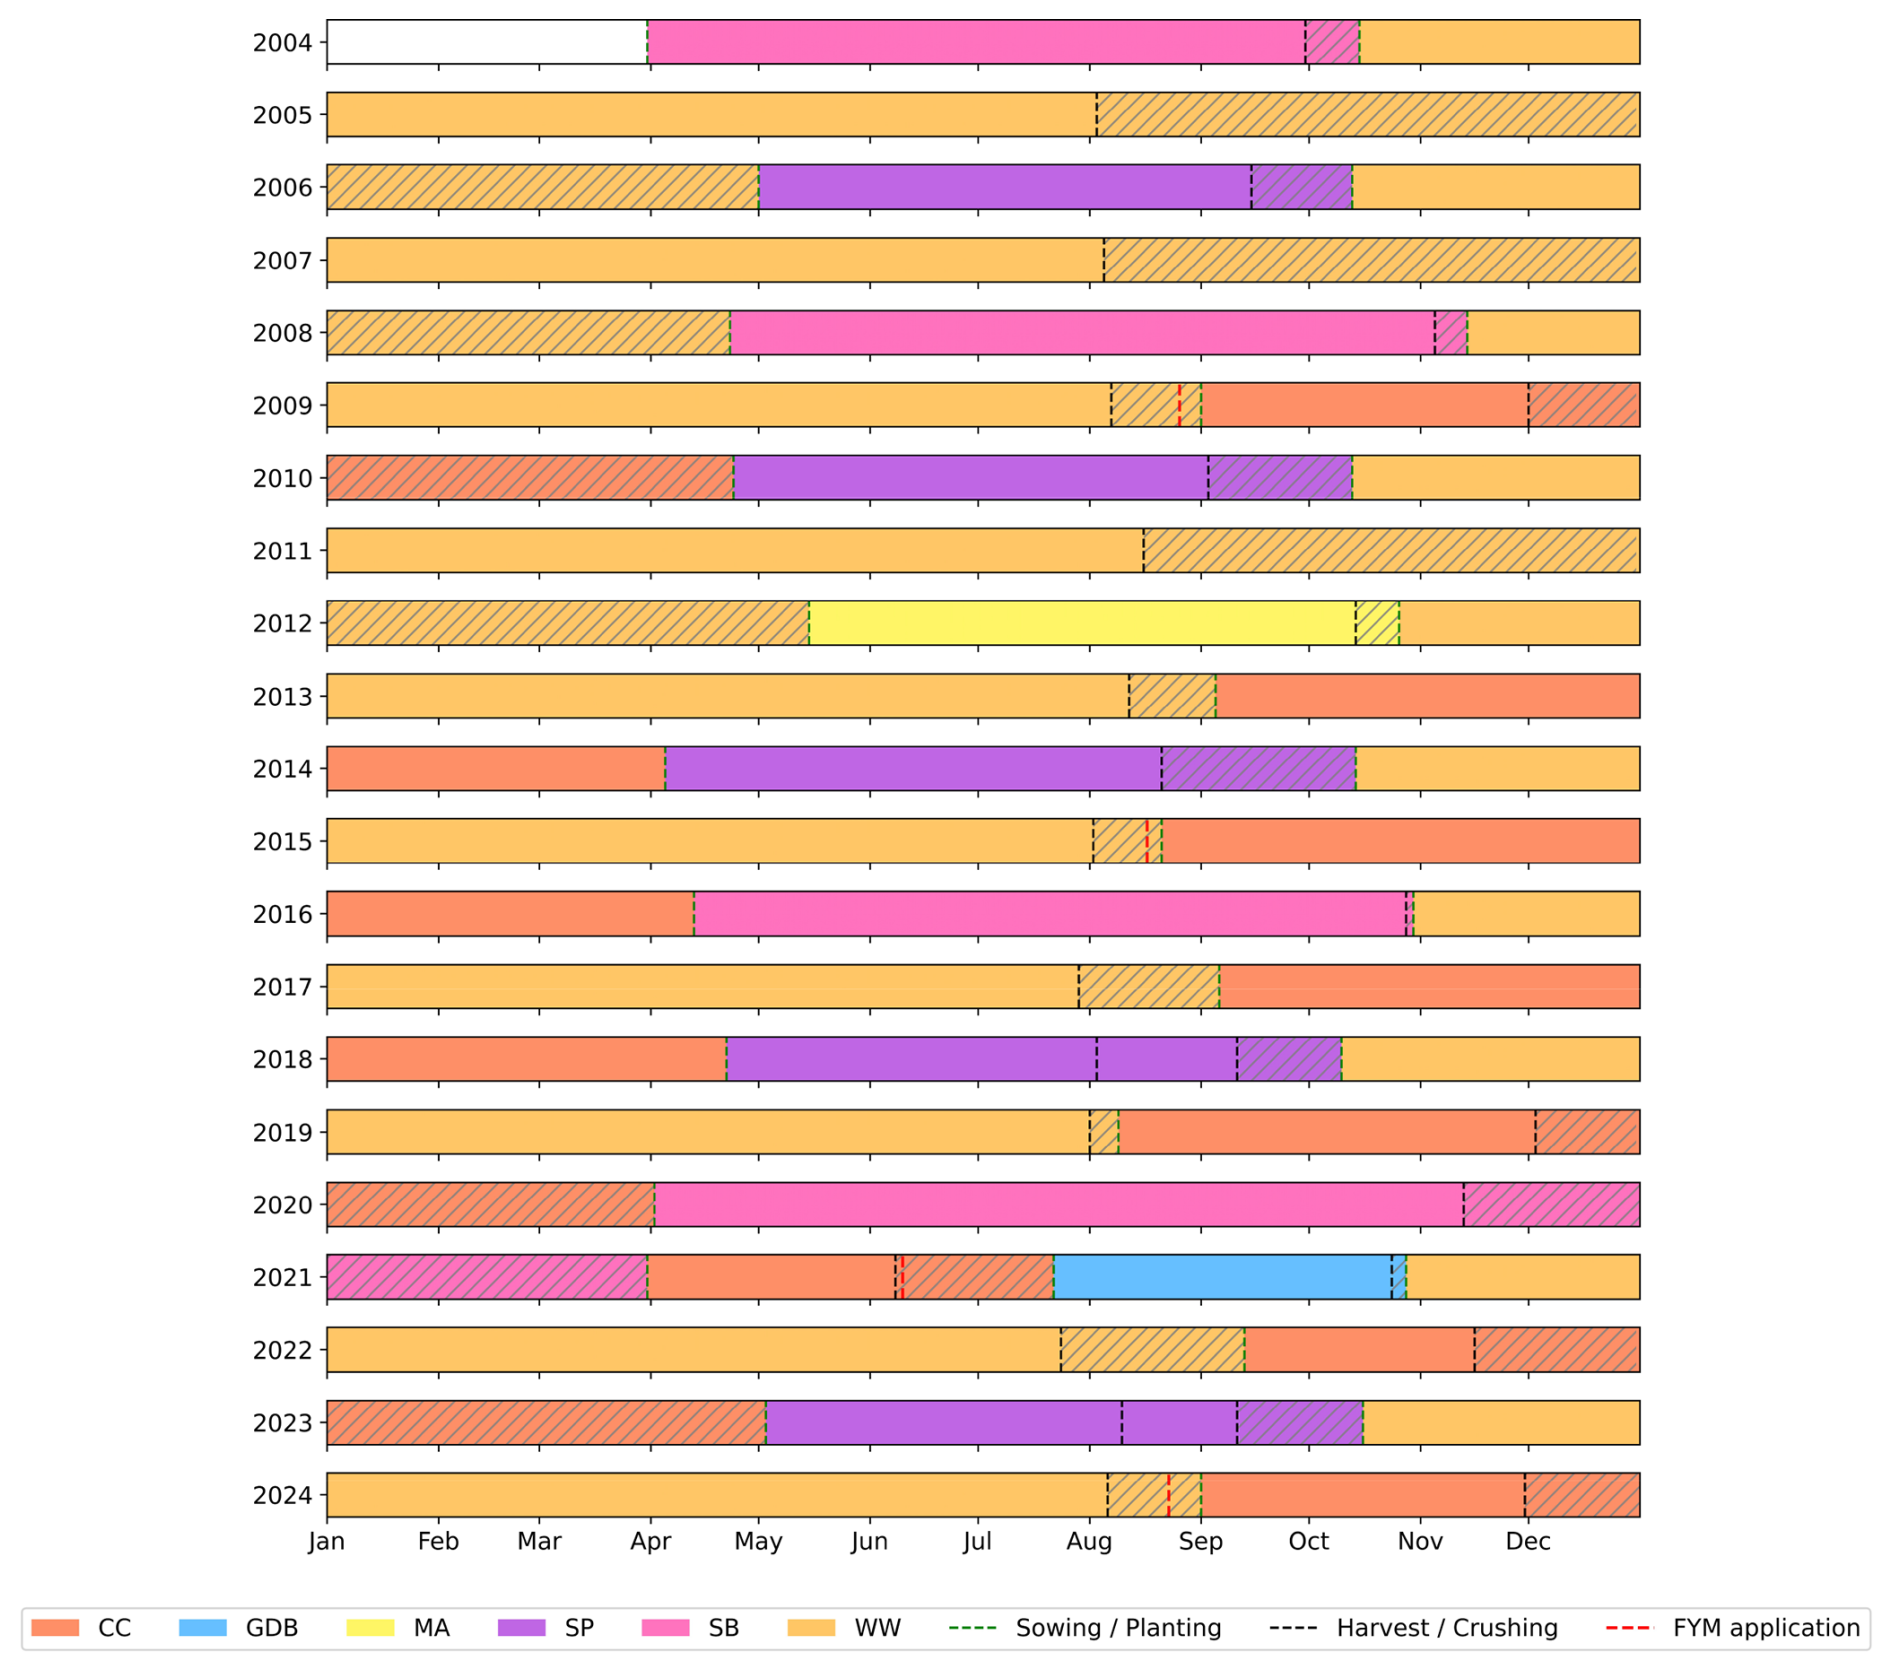
Figure 1Summary of five crop rotations (2004–2024) at BE-Lon. Each crop period spans from the sowing of one crop to the sowing of the subsequent crop. Abbreviations: WW, winter wheat; SP, seed potato; SB, sugar beet; CC, cover crop; MA, silage maize; GDB, green dwarf bean. Rotations ran from 31 March to 31 March four years later, except Rotation 5, which ended on 31 December 2024. Cover crops included: oat–faba bean (2019–2020), spinach (2021), and phacelia–clover (2024); mustard was used in all other years. FYM is farmyard manure. Hatches show bare soil periods between harvest/crushing and sowing/planting events.
2.2 Data processing
The Lonzée station is equipped with a sonic anemometer (Solent Research R3 before 2014 and Solent Research HS-50 after 2014, Gill Instruments, Lymington, UK) and an infrared gas analyzer (LI-7000 before 2014 and LI-7200 after 2014, LI-COR Inc., Lincoln, NE, US) allowing to quantify the turbulent exchange of CO2 (NEE), latent heat (LE) and sensible heat (H) from high-frequency (10–20 Hz) measurements of vertical wind speed and gas concentrations. The complete list of sensors is given in Table S2. All variables used in this study, except CO2 fluxes, can be found in Dumont et al. (2026a). The processing of CO2 flux data, which is different than the standard FLUXNET pipeline, is described below.
Half-hourly fluxes were calculated from raw data following the methodology described in Aubinet et al. (2012). Block averaging was used for the estimation of fluctuations, double rotation was applied to align the wind vector to the streamlines, and time lag was estimated by covariance maximization. One important step in flux computation consists of applying a spectral correction on CO2 flux observations. In particular, the EC system acts as a low pass filter due to its limited ability to resolve small-scale variations in vertical wind speed and CO2 concentration, resulting in attenuation of the measured co-spectra at high frequencies (Aubinet et al., 2012). This signal loss is compensated during post-processing by means of a correction factor (CF), which is used to estimate the true, unattenuated covariance from the measured covariance. Assuming co-spectral similarity among scalar fluxes, CF can be estimated empirically as the ratio of the integrated unbiased wind speed (ws) – sonic temperature (Ts) co-spectrum to the integrated biased ws – CO2 concentration co-spectrum. The latter is modeled as the product of a transfer function and the unbiased ws–Ts co-spectrum. The transfer function was obtained by fitting a Lorentzian function, characterized by a single fitting parameter corresponding to the cut-off frequency (fc), to the ratio between high-quality biased and unbiased co-spectra (Ibrom et al., 2007). Beyond this general framework, several implementation choices are possible. In this study, we followed the co-spectral approach described in Faurès et al. (2026). Co-spectra were preferred over spectra for the estimation of fc. Recent developments by Peltola et al. (2021), highlighting the need to account for an additional filtering linked to the lag search by covariance maximization, were also included. The estimation of fc and CF was based on binned, class-averaged co-spectra, with atmospheric stability and wind speed used as sorting variables. CF were then used to correct half-hourly CO2 for compensating high-frequency losses. Co-spectra were computed using the EddyPro software (LI-COR Biosciences, Lincoln, NE, USA, v7.0.9), and subsequent analysis was performed with the Python tool FreqCor v1.3 (see section “Code and data availability”).
Because fc and CF also depend on the effective measurement height and on instrumental setup characteristics – such as the distance between the sonic anemometer sensing volume and the gas inlet, flow rate, tube length, and filter and rain cap configurations – the analysis was conducted separately for periods during which these characteristics remained constant. The effective measurement height was discretized into three classes split around 1.5 and 2.3 m, resulting in 34 sub-periods over the 21-year study period. Additional information on uncertainty calculations can be found in Sect. 2.4.
After spectral corrections, post-processing of NEE data included (i) determination of friction velocity (u*) thresholds, and (ii) gap-filling of missing or discarded data under low turbulence, following the REddyProc routine (version 1.3.3; Wutzler et al., 2018). Compared to the typical REddyProc workflow, we implemented several adaptations to account for the crop rotation structure of the Lonzée site. Instead of relying on fixed three-months yearly seasons, we defined a seasonal stratification based on harvest and sowing dates of each crop, reflecting the aerodynamic characteristics of each cropping period. Within each sowing-to-harvest sequence, the following typical data treatment was applied. First, u* thresholds were determined using the moving point detection method (Papale et al., 2006). Second, to propagate the uncertainty associated with the u* threshold estimation, five equiprobable u* scenarios corresponding to the 5th, 16th, 50th, 84th and 95th percentiles of the bootstrapped u* threshold distribution (n=200 bootstrap samples) were generated. Third, after discarding data under low turbulence (i.e., thresholds), gap-filling was performed by applying the standard MDS (Marginal Distribution Sampling) algorithm (Reichstein et al., 2005), using shortwave incoming radiation, air temperature, and vapor pressure deficit as auxiliary meteorological variables. The MDS method consists in replacing missing data with the average of half-hourly CO2 flux measurements under similar meteorological variables within sliding time-windows. The MDS method was applied for each u* threshold scenario, yielding an ensemble of five gap-filled NEE time series from which half-hourly uncertainty envelopes (5th–95th percentile range) were derived.
Unlike standard implementations of REddyProc, which treat the full time series as a homogeneous pool for MDS gap-filling, this pipeline segmented the data by crop group prior to gap-filling. This segmentation reduced pool sizes at crop transitions or at the edges of the dataset, necessitating an alternative approach where standard MDS would have failed for gap-filling discarded or missing data. For instance, at the onset of a winter wheat period, only a few days of observations are available within that crop group, making it impossible for MDS to identify a sufficient number of meteorologically similar half-hours within the required window. For these cases, we implemented a fallback that extended the search of similar conditions periods to all years of the dataset while preserving the crop-group consistency. Candidate observations were drawn from the same crop group across the full record and matched using the standard MDS meteorological similarity criteria. The gap-filled value was the arithmetic mean of all retained observations, and a quality flag (fqc = 4–6) was assigned to reflect the level of constraint relaxation, extending the REddyProc flag convention (fqc 0: measured data, fqc 1–3, gap-filled depending on the availability of meteorological drivers). Of the 363 841 half-hourly timesteps retained in the analysis, 67.0 % corresponded to fqc = 0, 29.4 % to fqc = 1–3, and 3.52 % to fqc = 4–6.
2.3 EC-based C budget
Assuming that all dissolved organic and inorganic carbon in precipitation, runoff, percolation and drainage are negligible, the SOC stock budget of an agricultural field over a specific time interval (t to t′) can be written as (Baker and Griffis, 2005; Zhou et al., 2025):
with NBP the net biome productivity, Cimp the carbon imported (e.g., farmyard manure), Cexp the carbon exported (e.g., harvest), all expressed in mass density (kg C m−2). Carbon gain was counted negative and carbon loss positive, following the EC flux sign convention. Since the study period encompasses five full crop rotations, we assumed that residue-derived carbon inputs were effectively balanced across the study period and unlikely to introduce systematic bias in the long-term carbon budget estimates.
The time interval from t to t′ in Eq. (1) extends from the sowing of one crop to the sowing of the subsequent crop. This sowing-to-sowing definition ensured that most of CO2 emissions arising from post-harvest crop residue decomposition were attributed to the crop of origin rather than to the following crop, thereby enabling a more robust estimation of the influence of crop species on SOC stock variations. The calculation of the fraction of crop residues that have been decomposed between harvest of the crop and sowing of the next crop will be described in Sect. 2.6.2. Sowing-to-sowing periods also enable a direct comparison between EC- and RothC-based SOC stocks. More information is available in Sect. 2.8.
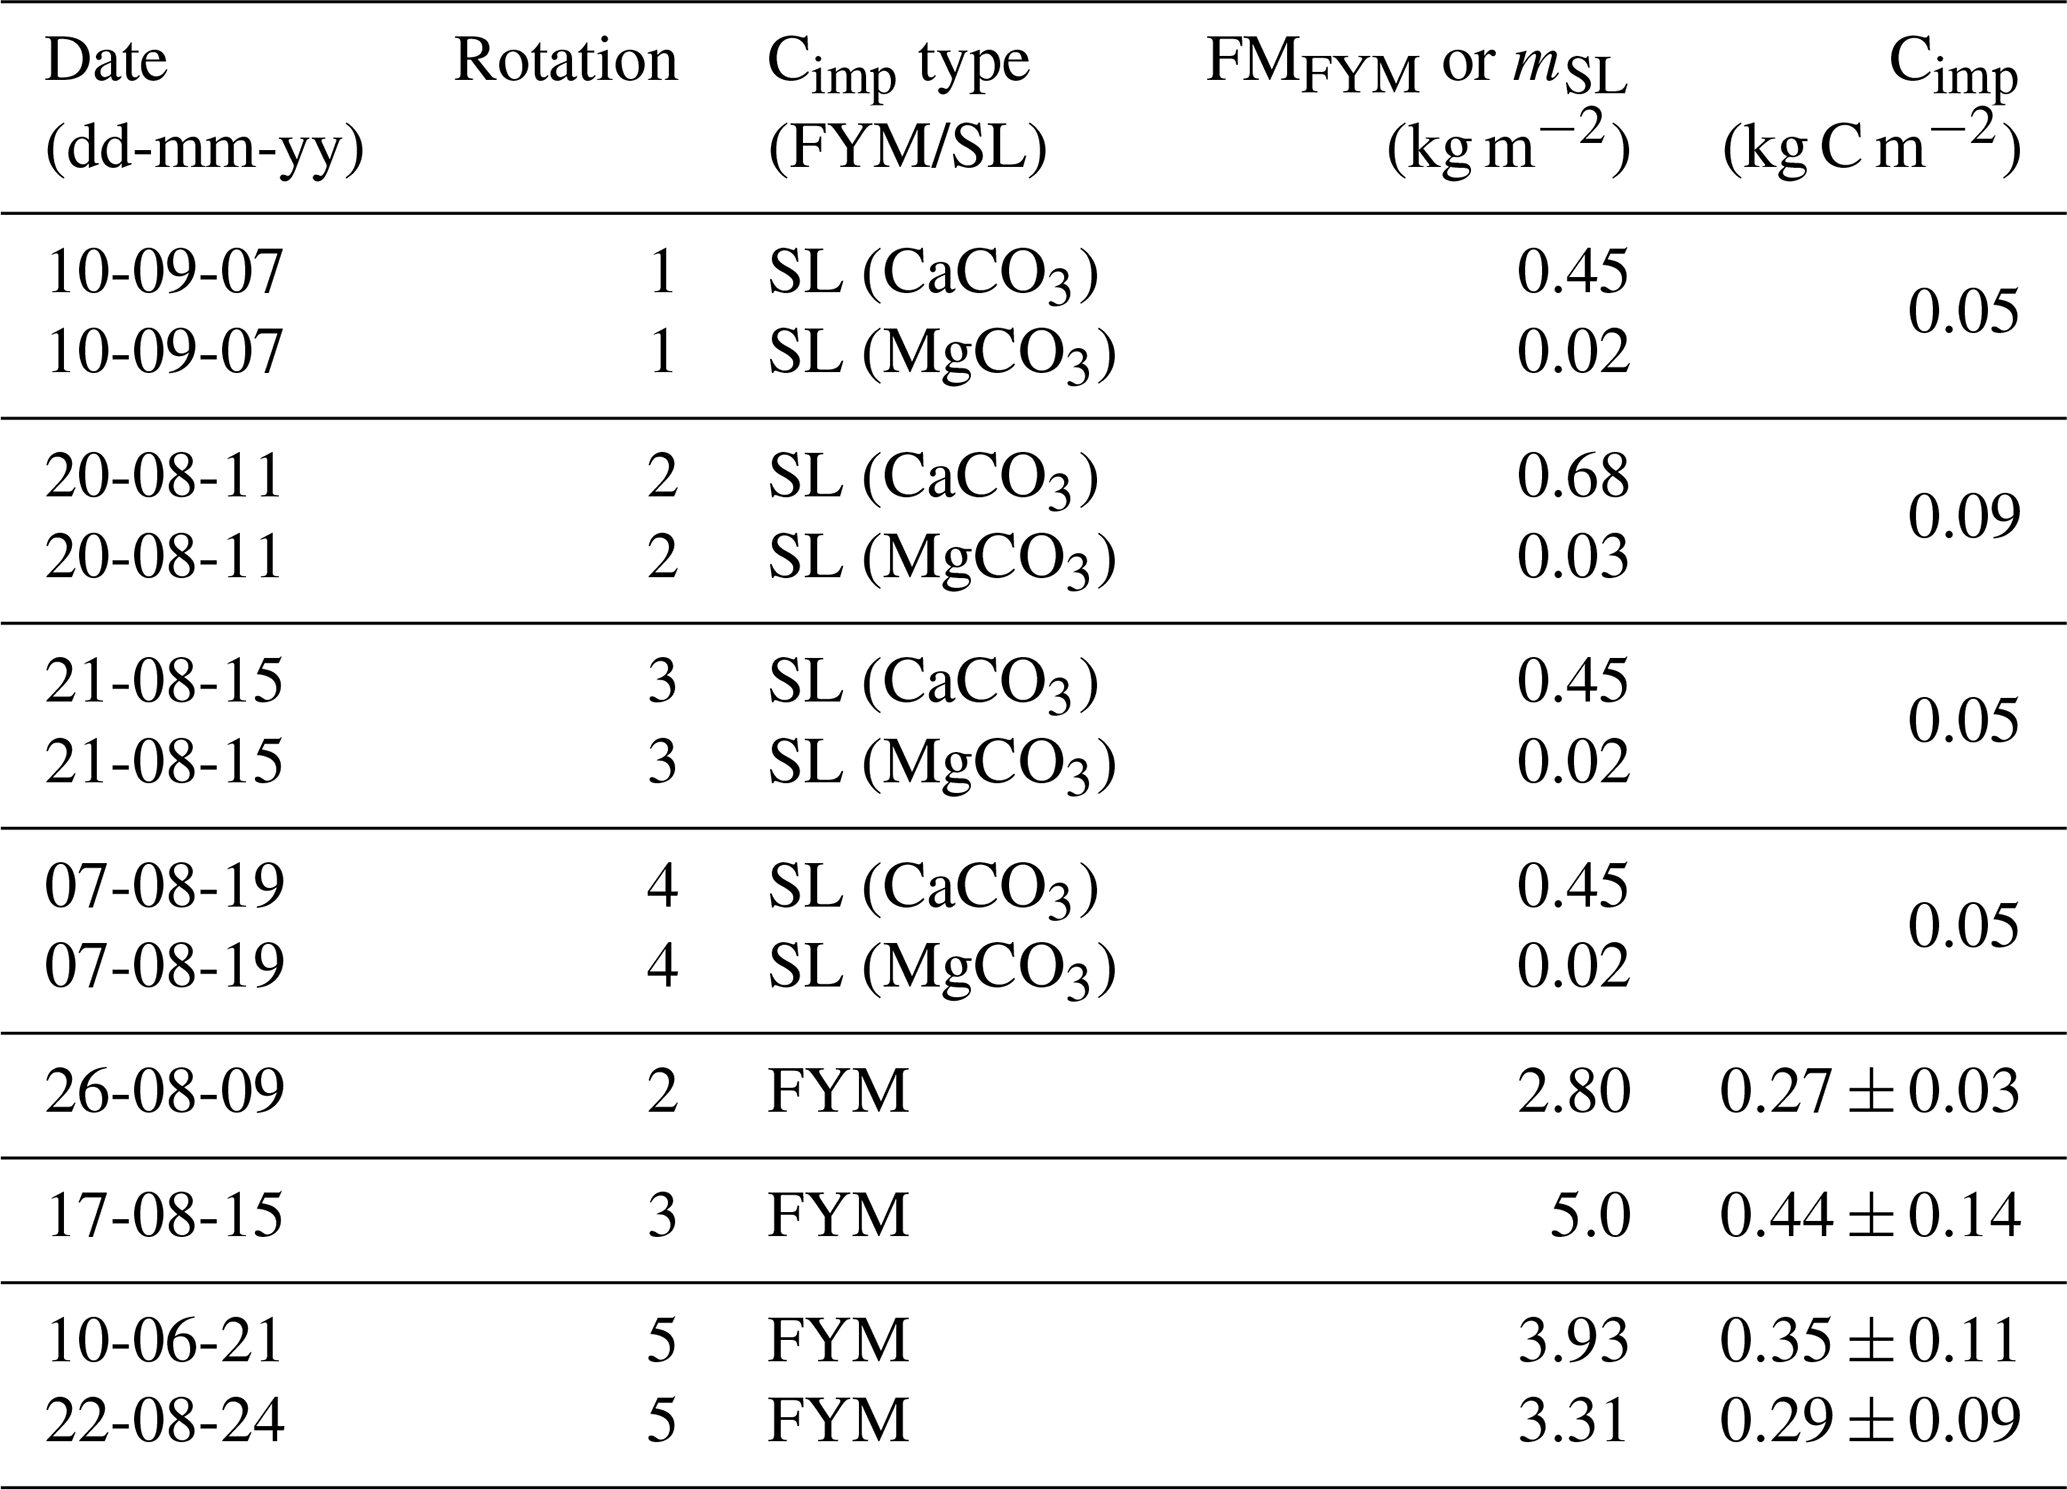
Cimp from farming practices consisted in the addition of farmyard manure (FYM), limes (SL) and seeds or mother tubers. FYM was added in 2009 (Rotation 2), 2015 (Rotation 3), 2021 and 2024 (Rotation 5, Table 1). C added from FYM (Cimp,FYM) was calculated as follows:
where FMFYM is fresh matter FM of FYM (kg m−2), [C]FYM is C content (kg C kg−1 of dry matter DM) and fFM2DM is the conversion factor from FM to DM, which is the inverse of the dry matter content (kg DM kg−1). [C]FYMand fFM2DM were measured in 2009 and 2021. In practice, samples of FYM were collected at three different depths within the heap of manure (3 repetitions) and dried at 65 °C to determine fFM2DM. [C]FYM was measured by dry combustion (ISO 10694:1995). fFM2DM was 0.29 in 2009 and 0.24 ± 0.07 in 2021 (no standard deviation on fFM2DM available in 2009). [C]FYM was 0.33 ± 0.02 and 0.37 ± 0.02 in 2009 and 2021 respectively [C]FYM and fFM2DM were therefore set to 0.35 ± 0.01 and to 0.27 ± 0.07 (average of the two campaigns assuming independent measurements). C added from slimes (Cimp,SL) was calculated as follows:
where mSL is the mass density of slimes added to the cropland (kg m−2), MC is the molar mass of C, and MSL is the molar mass of lime (either CaCO3 or MgCO3 – kg mol−1). C imported from sowing (Cimp,SE) was calculated as follows:
with SD the density of seeds (m−2), mSE the mass of seeds (kg) and [C]SE the carbon content of seeds (kg C kg−1 DM). mSE was set to 20 mg (Heimbach, 2018) and [C]SE was set to 45 % (Ma et al., 2018). Exports of C (Cexp) were calculated as follows:
with DMH the dry matter of harvested material (kg m−2) and [C]H the C content (kg C kg−1 DM) of harvested material (being tubers for SP and SB, grains and a variable fraction of straws for WW, grains and straws for MA, grain legumes for GDB). DMH was obtained after drying fresh matter harvested in an oven at 65 °C until constant weight. [C]H was measured by dry combustion (ISO 10694:1995). In 2007, 2013 and 2017, missing harvested straw used to calculate DMH of winter wheat was estimated from a linear regression based on total dry biomass, fitted across all available observations for winter wheat (R2 = 0.91, data not shown). DMH was then calculated as the sum of predicted harvested straw and measured harvested grain dry matter. Cimp,SEof potato was calculated from dry matter of mother tubers and C content similarly to Eq. (5). Missing measurements of [C]H were replaced by the average of measurements for similar crops. Cimp associated to FYM and SL are shown in Table 1. DMH, [C]H and SD used to calculate Cimp and Cexp are provided in Table A2. FMFYM, mSL and SD were communicated by the farmer. All other ancillary data collected at BE-Lon follows ICOS standard protocols (Gielen et al., 2018) and can be found in Dumont et al. (2026b) for the period 2017–2024. For the period 2004–2017, the protocol for ancillary data collection is described in Buysse et al. (2017).
Table 1Carbon inputs added over the five-rotation period at BE-Lon. FMFYM is fresh matter of farmyard manure (FYM), mSL is the density of slimes (SL) and Cimp is the corresponding input of carbon (Eqs. 2–4). All uncertainties are cumulative standard deviation.
2.4 Uncertainty on EC-based C budget
The half-hourly uncertainty on NBP (σNBP,30) was calculated as the square root of the sum of squares of all individual half-hourly uncertainties on NEE (σNEE,30), Cimp () and Cexp () as:
Equation (6) explicitly considers that the covariance between all uncertainties is negligible, that is, errors are assumed independent. σNEE,30 was calculated as the combination of uncertainties related to the low turbulence filtering procedure (), to the spectral correction procedure () and to the random error in NEE measurement () (Aubinet et al., 2012). As the MDS approach generally yields results comparable to alternative methods (Teng et al., 2020; Zhao and Huang, 2015), particularly at sites below 60° N and in the absence of prolonged data gaps (Vekuri et al., 2023, 2025), the uncertainty in gap-filling was neglected in the analysis. Equation (6) then becomes:
The calculation of each term of Eq. (7) and the propagation of uncertainty over long-term budgets is described below.
2.4.1 Uncertainty on lateral C fluxes
and were calculated using Eqs. (2)–(5) and the Gaussian error propagation (Ku, 1965), giving for Cexp as an example:
For no standard deviations on FMFYM (Eq. 2) and mSL (Eq. 3) were available. The uncertainty on FMFYM was set to ±10 % to account for optimistic typical field-scale deviations caused by variations in manure density, volume estimation, and spreader calibration (Thirion and Chabot, 2003). These uncertainties were attributed to the median half-hour of the day (i.e., 12 h GMT+1) when measurements were performed.
2.4.2 Uncertainty on NEE
was calculated as follows (Pastorello et al., 2020):
where NEE_U84_f and NEE_U16_f are respectively the half-hourly gap-filled NEE after applying a u* threshold corresponding to the 84th and 16th percentile of the threshold distribution within a sowing-to-harvest period (see Sect. 2.2). was calculated as the standard deviation of the measured NEE fluxes following the method described in Hollinger and Richardson (2005).
corresponds to the total uncertainty related to the spectral correction applied on CO2 flux measurements, which consists of two components: (i) one related to the cut-off frequency resulting from the fitting of the Lorentzian function, referred to as the transfer function uncertainty σtf, and (ii) one related to the aggregation of correction factors within wind speed and stability classes, referred to as the spectral class uncertainty σcl. σtf corresponds to the square root of the diagonal of the covariance matrix associated with the fitted Lorentzian parameters, while σcl was calculated as the standard deviation of the population of correction factors CF for a given wind speed and stability class within a spectral correction period. These two uncertainty sources are physically independent: σtf depends solely on the uncertainty in the cut-off frequency fc derived from the Lorentzian fitting procedure, while σcl reflects the residual variability of individual correction factors within each class, which can be attributed to other factors such as like crop height or wind direction.
2.4.3 Propagation of uncertainties
The general framework of uncertainty propagation posits that systematic errors accumulate linearly and random errors accumulate in quadrature (Richardson et al., 2012). Therefore, the cumulative uncertainty on NEE and ultimately on NBP strongly depends on the categorization of each uncertainty term as systematic or random.
For , we considered each spectral correction period as an independent correction unit, within which we applied a nested error structure reflecting the nature of the spectral correction procedure. Within each wind speed – stability class combination (k) for a given spectral correction period (p), since σtf,k originates from a single cut-off frequency estimate derived from the Lorentzian fitting procedure and applied identically to all half-hours of class k, it was treated as systematic and propagated linearly over the cumulated NEE of the class (Richardson et al., 2012). The uncertainty on NEE related to the cut-off frequency for each class () was therefore calculated as:
In contrast, was treated as random, assuming that variability of co-spectra within a wind speed – stability class is uncorrelated between half-hours, and was therefore propagated quadratically:
The composite uncertainty for each class k was then obtained by combining these two independent contributions quadratically:
Since wind speed – stability classes capture distinct turbulent regimes, their associated errors can be considered independent across classes. The total standard deviation on cumulated NEE within a spectral correction period p containing nk wind speed classes was therefore obtained as the square root of the sum of squares of class-level contributions:
For simplicity, the class-level uncertainty σNEE,k was redistributed to each half-hour in proportion to its absolute NEE value, normalized by the root-sum-of-squares of NEE within the class. This provides an estimate of the half-hourly uncertainty in NEE due to the spectral correction procedure (). This redistribution enables that the quadratic sum of half-hourly uncertainties exactly recovers , and by extension at every aggregation level.
A very similar approach was applied to the uncertainty on u* threshold determination. Since a single u* threshold is applied uniformly to all half-hours within a given crop season, this uncertainty is systematic in nature within each season. Accordingly, errors were accumulated linearly within each season to yield a seasonal u* uncertainty. Since crop seasons are determined independently and their respective thresholds are estimated from non-overlapping datasets, seasonal uncertainties are treated as independent and combined in quadrature across seasons. Half-hourly values were then redistributed from the seasonal budget in proportion to their individual contribution, preserving quadratic consistency with the total uncertainty related to u* threshold procedure, and giving . σNBP,30 calculated using Eq. (7) was then propagated in quadrature over a specified period (d) following:
where t is the number of half-hourly data within the corresponding time window d. As the covariance was neglected, the reported NBP uncertainty should therefore be considered as a higher bound on the true uncertainty.
2.5 Soil inventories
Soil samples were collected in 2007 and 2017. In 2007, the sampling scheme corresponding to a systematic grid covered a rectangular area of 0.6 ha around the EC flux tower (Rodeghiero et al., 2010; Schrumpf et al., 2011). The 61 cores extracted at the node of the sampling grid were each divided into 2–3 pedogenetic horizons, reaching a mean maximum depth of 60 cm. In 2017, the sampling scheme covered the entire cropland area (14 ha), which corresponded to a stratified random sampling where the sampling domain was divided into six strata of equal area. 20 sample locations were selected from the sampling domain from which 100 samples were extracted over 5 depths (0–5, 5–15, 15–30, 30–60, 60–100 cm) following ICOS protocols (Arrouays et al., 2018). As the carbonate content was below 0.70 g C inorganic kg−1 (0.34, 0.36, 0.47 g C inorganic kg−1 over 0–5, 5–15 and 15–30 cm, Table A1), SOC concentration was calculated as the difference between total and carbonate concentration (Arrouays et al., 2018). In 2007, no information on carbonate concentration was available. Since the soil is classified as Stagnic Luvisoil (Mantel et al., 2023) developed under leaching conditions and inherently non-calcareous; carbonate contents are therefore negligible, and total carbon is taken as equivalent to SOC for the 2007 campaign.
SOC stocks were computed on an equivalent soil mass basis (ESM; Lee et al., 2009) using the simpleESM R script (Ferchaud et al., 2023) with reference soil masses of 384 and 436 Mg ha−1 in ∼ 0–30 and ∼ 30–60 cm layers. The mean and standard deviation of SOC stocks over these layers were then computed using a design-based approach (Loustau et al., 2017). Because the soil was relatively homogeneous, a reduced dataset was reconstructed by selecting spatially co-located sampling points from 2007 and 2017 to ensure a reliable comparison between the two datasets (Fig. A1) (Loubet et al., 2026). Differences in SOC stocks over the ∼ 0–30 and ∼ 30–60 cm layers between 2007 and 2017 within the reduced area were quantified using Hedges' g effect size estimates, allowing to correct standardized mean difference for small-sample bias (Hedges, 1981). Confidence intervals (CI) on Hedges' g were obtained using 10 000 nonparametric bootstrap resamples and estimated with the bias-corrected and accelerated method (Kirby and Gerlanc, 2013). More information on the statistical analysis on SOC stock comparison can be found in Loubet et al. (2026).
2.6 Process-based modelling of SOC
2.6.1 The RothC model
The RothC model (Coleman and Jenkinson, 1996) was used to simulate SOC stock changes in the topsoil (i.e., over 0–23 cm, as the model was calibrated and validated in this soil layer) between 2004 and 2024. RothC divides SOC into five conceptual pools: decomposable plant material (DPM), resistant plant material (RPM), microbial biomass (BIO), humified organic matter (HUM) and inert organic matter (IOM) pools. SOC stock depletion within each pool are influenced by rate modifying factors which depend on climate conditions, land use and pool characteristics (Coleman and Jenkinson, 1996). RothC requires the following inputs: initial SOC stock, precipitation, open-pan evaporation, air temperature, clay content, decomposability of incoming plant material (expressed as the ratio and set to 1.44 for croplands), soil cover (either 0.6 for vegetated soil or 1.0 for bare soil) and C inputs from farmyard manure and plant biomass (in kg C m−2). The latter includes all plant material returned during the cultivation period, including both above ground biomass as crop residues and belowground biomass as C exudates or unharvested root biomass. In practice, fractions of carbon returned to the soil as belowground biomass (CBGB) were estimated from the sum of plant carbon in root tissues (CR) and root exudates (CE) (Bolinder et al., 2007):
where CE represents 65 % of CR (Bolinder et al., 2007). For silage maize and winter wheat, CR was estimated from carbon exported from the main agricultural product (CP), shoot-to-root ratio (S:R) and harvest index (HI) (Bolinder et al., 2007; Keel et al., 2017):
HI was calculated from the ratio of harvested grain to total biomass harvested and S:R was quantified during a 2022 pre-harvest field campaign on winter wheat. Measurements were conducted at four randomly selected locations across the cropland, following established protocols for both shoot biomass (Gielen et al., 2018) and root biomass (Frasier et al., 2016; Noordwijk et al., 1985). Root biomass was measured by collecting soil samples at six depth intervals within the 0–100 cm layer using hand augers. Roots were separated from soil using a saline solution (NaCl), followed by sieving (2, 1 and 0.5 mm). The samples were then dried at 65 °C until constant weight was achieved. Total root biomass was calculated by normalizing root weight by the soil sampling area across the entire soil profile. Shoot biomass was determined by harvesting 5 randomly selected plants at each sampling location. All aboveground organs were dried at 65 °C until reaching constant weight. Final shoot biomass was calculated as the ratio of dry organ weight to the sampled soil surface area. S:R was 12.3 which in the upper end of the values reported by Bolinder et al. (2007). S:R for silage maize was assumed to be equivalent to that of winter wheat (Bolinder et al., 2007). For the other crops, Bolinder coefficients were used to determine CR and CE from yield or from crushed aboveground biomass for cover crops (Bolinder et al., 2007). CBGB was rescaled to 23 cm to match RothC layers definition (Dechow et al., 2019; Keel et al., 2017).
2.6.2 Initialization and simulation phases
Reactive carbon pools in RothC were initialized as a function of clay content and initial SOC stock (Falloon et al., 1998; Morais et al., 2019; Weihermüller et al., 2013). The initial SOC stock in 2004 was set to the 2007 inventory measurement, since significant changes in SOC stocks are generally detectable only after at least 10 years (Schrumpf et al., 2011; Smith, 2004). All model parameters were chosen accordingly to the original version of RothC (Coleman and Jenkinson, 1996). The decomposition rate constants related to pool characteristics were not modified (10 yr−1 for DPM, 0.3 yr−1 for RPM, 0.66 yr−1 for BIO and 0.02 yr−1 for HUM). The model was then run between 2004 and 2024 using observed meteorological data, C inputs from plant biomass and from FYM. Potential evapotranspiration was calculated using the FAO Penman-Monteith equation (Pereira et al., 2025; Cai et al., 2007) based on wind speed, vapor pressure deficit, and net radiation. Open-pan evapotranspiration was calculated by dividing potential evapotranspiration by 0.75 (Coleman and Jenkinson, 1996). For winter wheat, maize and cover crops, carbon inputs were calculated as the sum of measured aboveground crop residues after harvest (Table A3) and estimated belowground biomass (CBGB – Eq. 15). For tuber crops, measured harvest residues were selected as carbon inputs. For each simulated month, the difference between the initial SOC stock was calculated (ΔSOCRothC).
To draw meaningful conclusions regarding the influence of crop species on SOC stock variations, we quantified the potential carry-over C residues over the sowing-to-sowing crop period by calculating the fraction of the C input allocated to the DPM and RPM pools in RothC (fres) as follows:
where CDPM and CRPM are the C in the DPM and RPM pools respectively, ξi is the product of RothC rate modifiers for temperature, soil moisture and soil cover over a month of index i between t and t′, kDPM and kRPMare the monthly DPM and RPM decomposition rate constants (0.83 and 0.025 per month respectively), and and are the fraction of C residue attributed to the DPM and RPM pool respectively with DR the DPM:RPM ratio of 1.44. The summation is taken over the months included in the sowing-to-sowing period from t to t′. We focused on DPM and RPM as it corresponds to the pools most likely to generate a short-term carry-over of newly added residue C across successive sowing-to-sowing periods. Since BIO and HUM have substantially lower decomposition rate constants and represent slower C dynamics, they were not used in the calculation of fres. Periods with low fres were interpreted as periods with substantial carry-over of DPM and RPM C beyond the end of the crop period. In these cases, the attribution of residue-related C turnover and associated C losses to an individual crop period may be biased, and the resulting sink or source classification should be interpreted with caution.
2.7 Uncertainty on RothC simulations
Monte Carlo (MC) simulations represents a powerful probabilistic framework for quantifying the uncertainties related to inputs, parameters, model structure, and initial conditions (Pierson et al., 2022). MC methodology was applied to RothC by propagating uncertainties through the model via repeated random sampling in probability distribution over 10 000 simulations (Morais et al., 2019; Stamati et al., 2013). The process notably involves selecting the range and probability distributions of selected factors, generating random samples, running the model for each sample, and then conducting uncertainty analysis (Saltelli et al., 2000). Model-input uncertainties were propagated by independently sampling monthly values from Gaussian distributions centred on their measured values. For air temperature and precipitation, standard deviations were derived from sensor accuracy (Vaisala, 2025; MicroStep-MIS, 2026). Monthly plant-derived C inputs, FYM C inputs, and initial SOC stock were sampled using their measurement-based standard deviations. Uncertainty in open-pan evapotranspiration and clay content was neglected. Finally, statistical distributions of RothC parameters (decomposition rates, temperature and bare soil moisture deficit rate modifiers) were also defined based on a Gaussian distribution but within a 20 % margin, which is a typical approach when uncertainty around parameters is not known (Delhez et al., 2025). For each MC simulation, the monthly total SOC and the corresponding difference with initial SOC were calculated. For each month, mean, median, and standard deviation, were calculated across the ensemble of Monte Carlo simulations, yielding a distinct uncertainty estimate for every monthly time step. RothC was run in R (R Core Team, 2023) using the SoilR package (version 1.2; Sierra et al., 2012).
2.8 Comparison between cumulative NBP and SOC stocks simulated by RothC
Unlike inventories, which measure changes in SOC stock between two discrete sampling campaigns, cumulative NBP and ΔSOCRothC provide continuous estimates of SOC stock variations. However, the two methods rely on fundamentally different principles: NBP integrates NEE, capturing the net CO2 exchange between vegetation and the atmosphere, and thus directly reflecting the net ecosystem carbon balance after accounting for autotrophic and heterotrophic respiration, as well as net lateral C fluxes. In contrast, RothC does not simulate plant uptake explicitly and contains no living-biomass compartment, no plant growth sub-model, and resolves only the decomposition and turnover of organic matter within the soil from prescribed carbon inputs.
This structural difference defines the conditions under which the two quantities can be compared. Over any given interval, the ecosystem carbon balance can be decomposed as the sum of the net changes in soil C stocks and in living biomass C stocks. Since RothC predicts changes in SOC stocks only, EC-based C budgets and RothC simulations can only be compared when changes in living biomass C stocks are negligible over the selected period. We therefore restricted the comparison to sowing-to-sowing periods. At the beginning of the period, no vegetation is present on the field and living biomass C stocks are zero. At the end of the period (sowing of the subsequent crop, which can occur a few months after harvest), living biomass C stocks have also returned to near zero, since crop residues left in the field after harvest enter the soil through ploughing. This step is explicitly considered in RothC, where aboveground residues left on the field are prescribed to the DPM and RPM pools at the month of harvest. Belowground crop residues, consisting of root material built up during the cultivation period, are captured by NBP through NEE and are likewise prescribed to RothC through allometric equations based on yield. Any respiratory flux resulting from harvest residue mineralization is accounted for by both approaches. Carbon losses through DOC and DIC leaching or erosion were assumed negligible at this site and are not accounted for in either method. Overall, the comparison between cumulative NBP and ΔSOCRothC consisted in two parts: first comparing their dynamics to identify systematic trends or biases over the five-rotation period, and second, the calculation of cumulative NBP and ΔSOCRothC over individual sowing-to-sowing periods. In particular, the net change in each variable was computed as the difference between cumulative values at the end and beginning of each sowing-to-sowing period.
As RothC operates at a monthly time step while EC measurements are provided at half-hourly resolution, NBP and its associated uncertainty were aggregated to a monthly basis prior to comparison. For each sowing-to-sowing period, cumulative NBP was extracted at the exact day of transition between consecutive periods within the month, thereby capturing the net carbon exchange integrated over the sowing-to-sowing periods, including post-harvest residue mineralization. Because both cumulative NBP and ΔSOCRothC time series carry correlated uncertainties (each monthly value inheriting the accumulated error of all preceding timesteps) the variance of the difference between the two stocks reduces to . The resulting standard deviation σ(ΔS) was used as the uncertainty estimate for each period. The sum of the difference between cumulative NBP and ΔSOCRothC variations was calculated within each period to quantify agreement between the two estimates. This comparison helps determine whether both methods converge on the same source–sink pattern for a given crop period. RothC simulations and soil inventories followed the same sign convention as NBP, in which carbon gains were considered negative and carbon losses positive.
3.1 Eddy covariance-based carbon budget
Winter wheat was the crop with the longest cumulative cultivation period over the five-rotation period for a total of 129.1 months, followed by cover crop (53.8 months), sugar beet (32.2 months), potato (28.8 months), maize (5.46 months) and green dwarf bean (3.13 months). Carbon exports were highest for winter wheat (5.49 ± 0.13 kg C m−2), followed by sugar beet (3.64 ± 0.22 kg C m−2), seed potato (1.55 ± 0.01 kg C m−2), maize (0.78 ± 0.01 kg C m−2), and green dwarf bean (0.04 ± 0.00 kg C m−2) (Table 2, Fig. 2).
Table 2Cumulative values of net ecosystem exchange (NEE), imports of carbon (Cimp), exports of carbon at harvest (Cexp), net biome productivity (NBP) for each rotation and each crop over the five-rotation period. Abbreviations: WW, winter wheat; SP, seed potato; SB, sugar beet; CC, cover crop; MA, silage maize; GDB, green dwarf bean. Crops are mentioned with the corresponding year. All uncertainties are cumulative standard deviation.
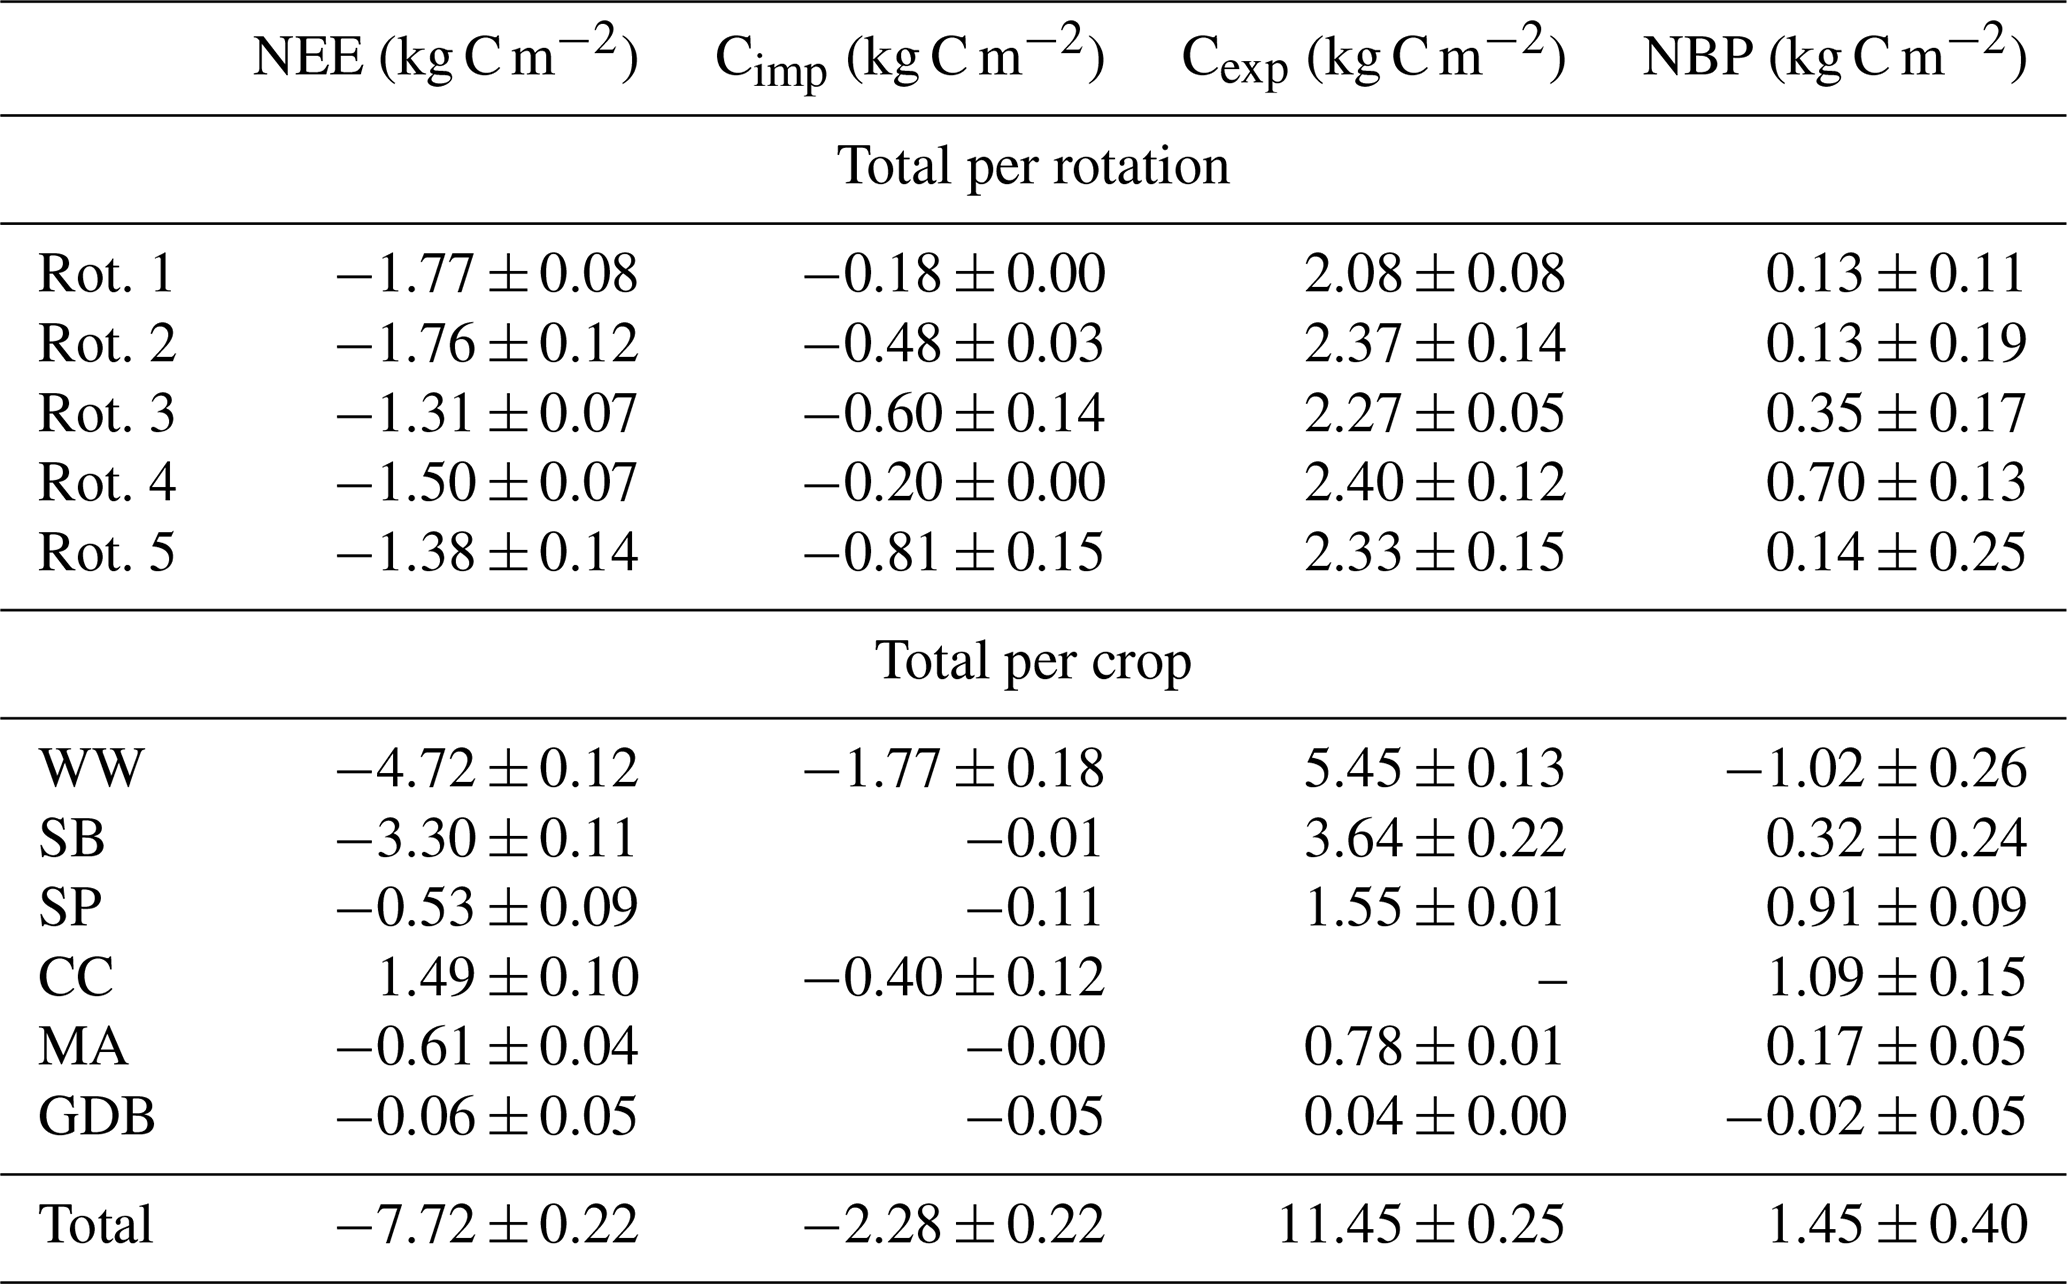
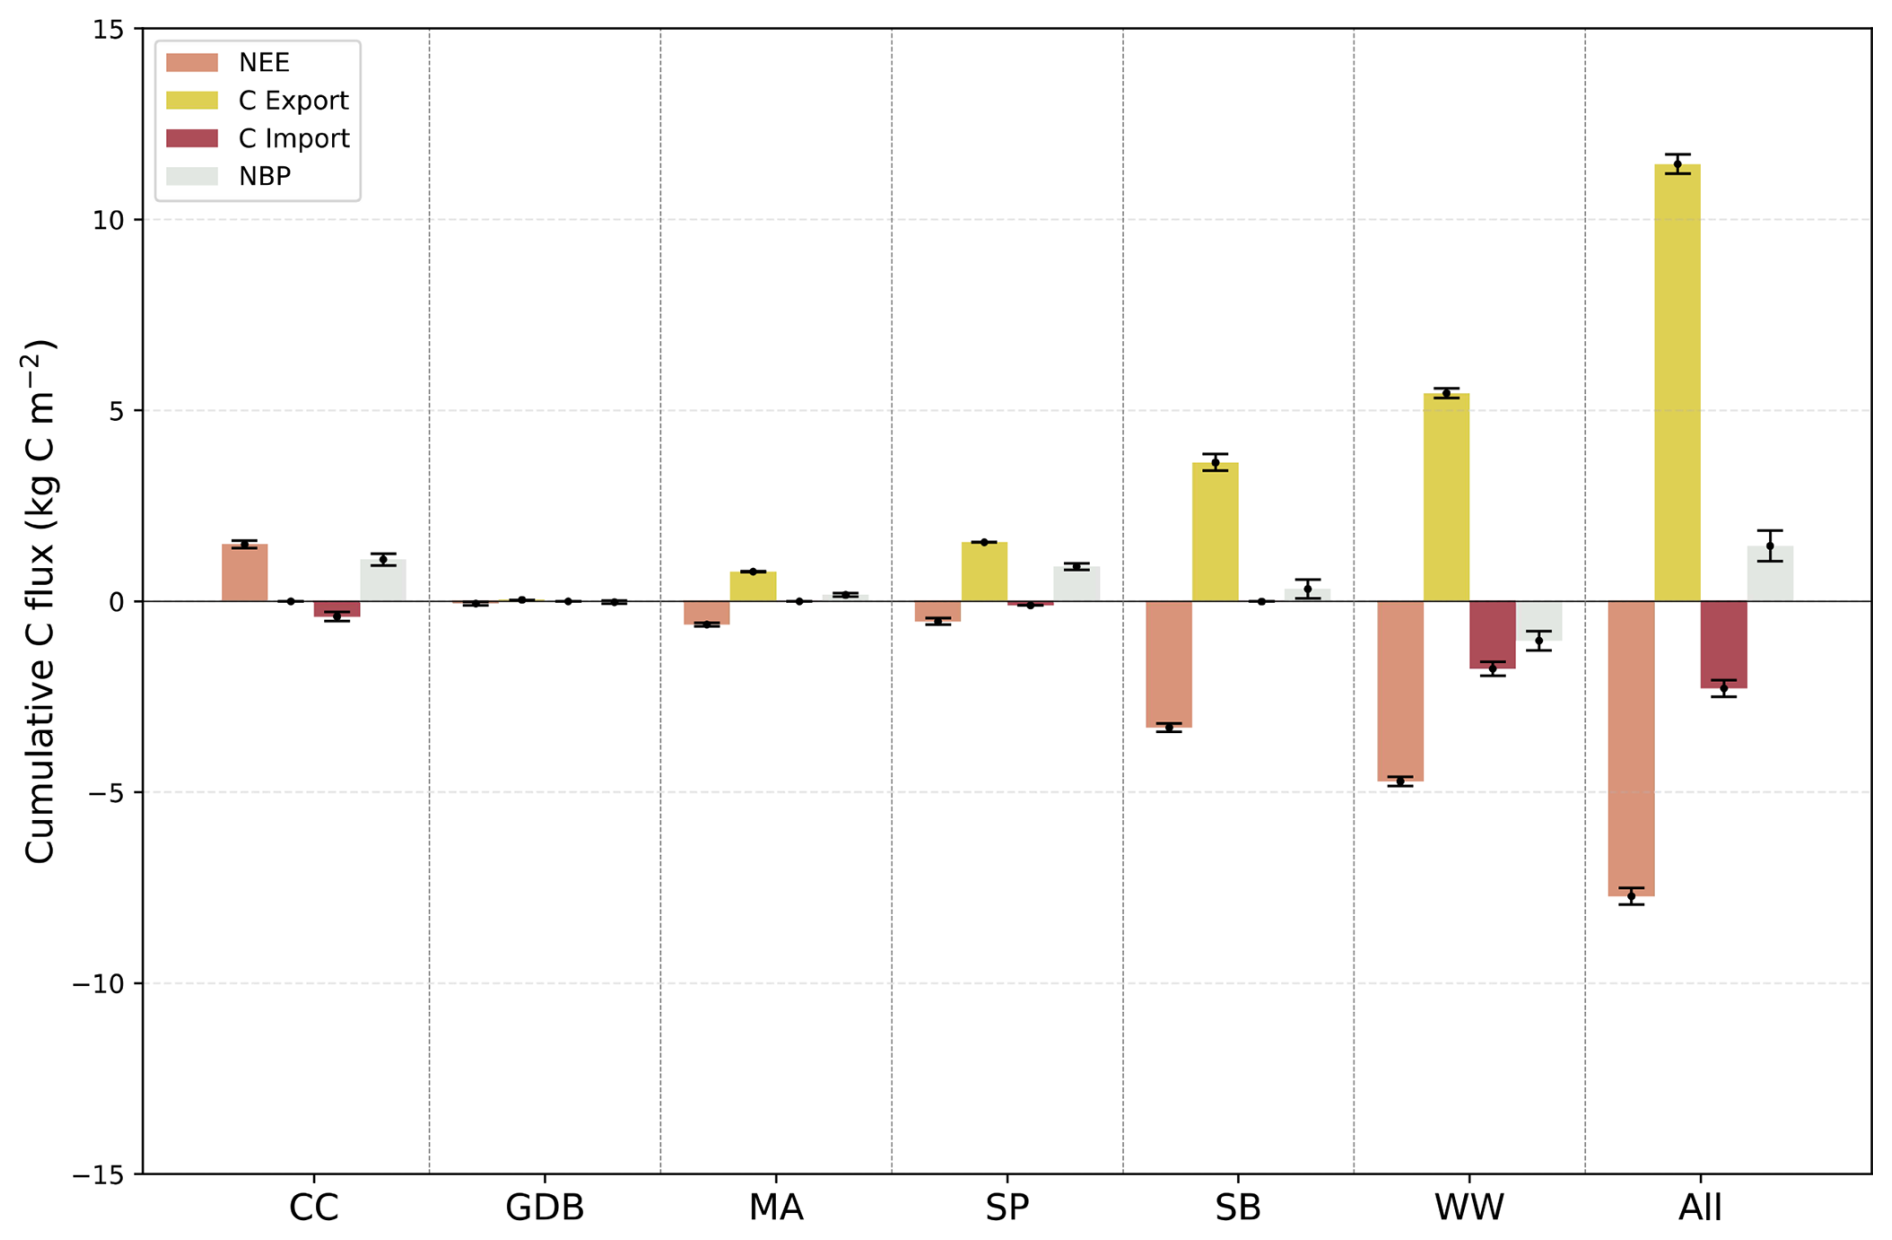
Figure 2Cumulative net ecosystem exchange (NEE), exports of carbon (Cexp), imports of carbon (Cimp) and net biome productivity (NBP) for each crop over the five-rotation period. The error bars on the bar plots show cumulative standard deviations on each budget term. Abbreviations: WW, winter wheat; SP, seed potato; SB, sugar beet; CC, cover crop; MA, silage maize; GDB, green dwarf bean.
Farmyard manure was the main external carbon input across the study period, with applications restricted to Rotations 2, 3 and 5 (Table 2). Cumulative NEE differed markedly among crops: it was strongly negative (i.e. net C uptake) under winter wheat and sugar beet, near zero under potato, silage maize and green dwarf bean, and positive (i.e. net C release) under the cover crop (Table 2). As manure application occurred after winter wheat harvest in 2009, 2015 and 2024 and after cover crop crushing in 2021 (Fig. 1, Table 1), the cumulative NBP of these crops was therefore reduced (Table A3). In particular, the cumulative NBP of winter wheat was negative (−1.02 ± 0.25 kg C m−2) while other crops exhibited cumulative NBP values ranging from near equilibrium to a moderate carbon source (Fig. 2, Table 2). Positive cumulative NBP values were observed for maize (0.16 ± 0.05 kg C m−2), potato (0.91 ± 0.09 kg C m−2), sugar beet (0.32 ± 0.24 kg C m−2) and cover crops (1.10 ± 0.16 kg C m−2) whereas cumulative NBP of green dwarf bean (−0.02 ± 0.04 kg C m−2) did not differ significantly from zero (Table 2).
Over the five rotations (252 months), 11.5 ± 0.25 kg C m−2 were exported at harvest while −7.72 ± 0.22 kg C m−2 was sequestrated by vegetation and −2.28 ± 0.21 kg C m−2 was added as FYM, slimes, seeds and mother tubers, giving a total cumulative NBP of 1.45 ± 0.40 kg C m−2 (Tables 1, 2). It corresponds to a yearly loss of 69.8 ± 19.2 g C m−2 on average. The uncertainty in cumulative NBP was distributed relatively evenly across all components of the carbon budget. The cumulative and were 0.25 and 0.21 kg C m−2, respectively. reached 0.17 kg C m−2 while σNEE,spcorr amounted to 0.13 kg C m−2, leading to σNEE of 0.22 kg C m−2 (Table 2). NBP was the highest for Rotation 4, which is explained by the highest exports of C in the five-rotation period (Fig. 3, Table 2). Despite no cover crops being grown and no manure being applied, Rotation 1 had a cumulative NBP which remained close to equilibrium (Fig. 3, Table 2). Compared to Rotation 1, Rotation 2 received an additional 0.30 kg C m−2 of C inputs via manure (Fig. 3, Table 2). As explained in Sect. 2.1, three months of bare soil following cover crop crushing were not included in Rotation 5 between January and April 2025, which would have slightly increased the cumulative NBP due to heterotrophic soil respiration. Other rotations showed higher positive cumulative NBP trends despite manure applications in 2009 and 2015 (Fig. 3). Overall, the persistent positive trend across the observation period indicates a long-term carbon source pattern. Cumulative carbon fluxes for each crop-period are given in Table A3.
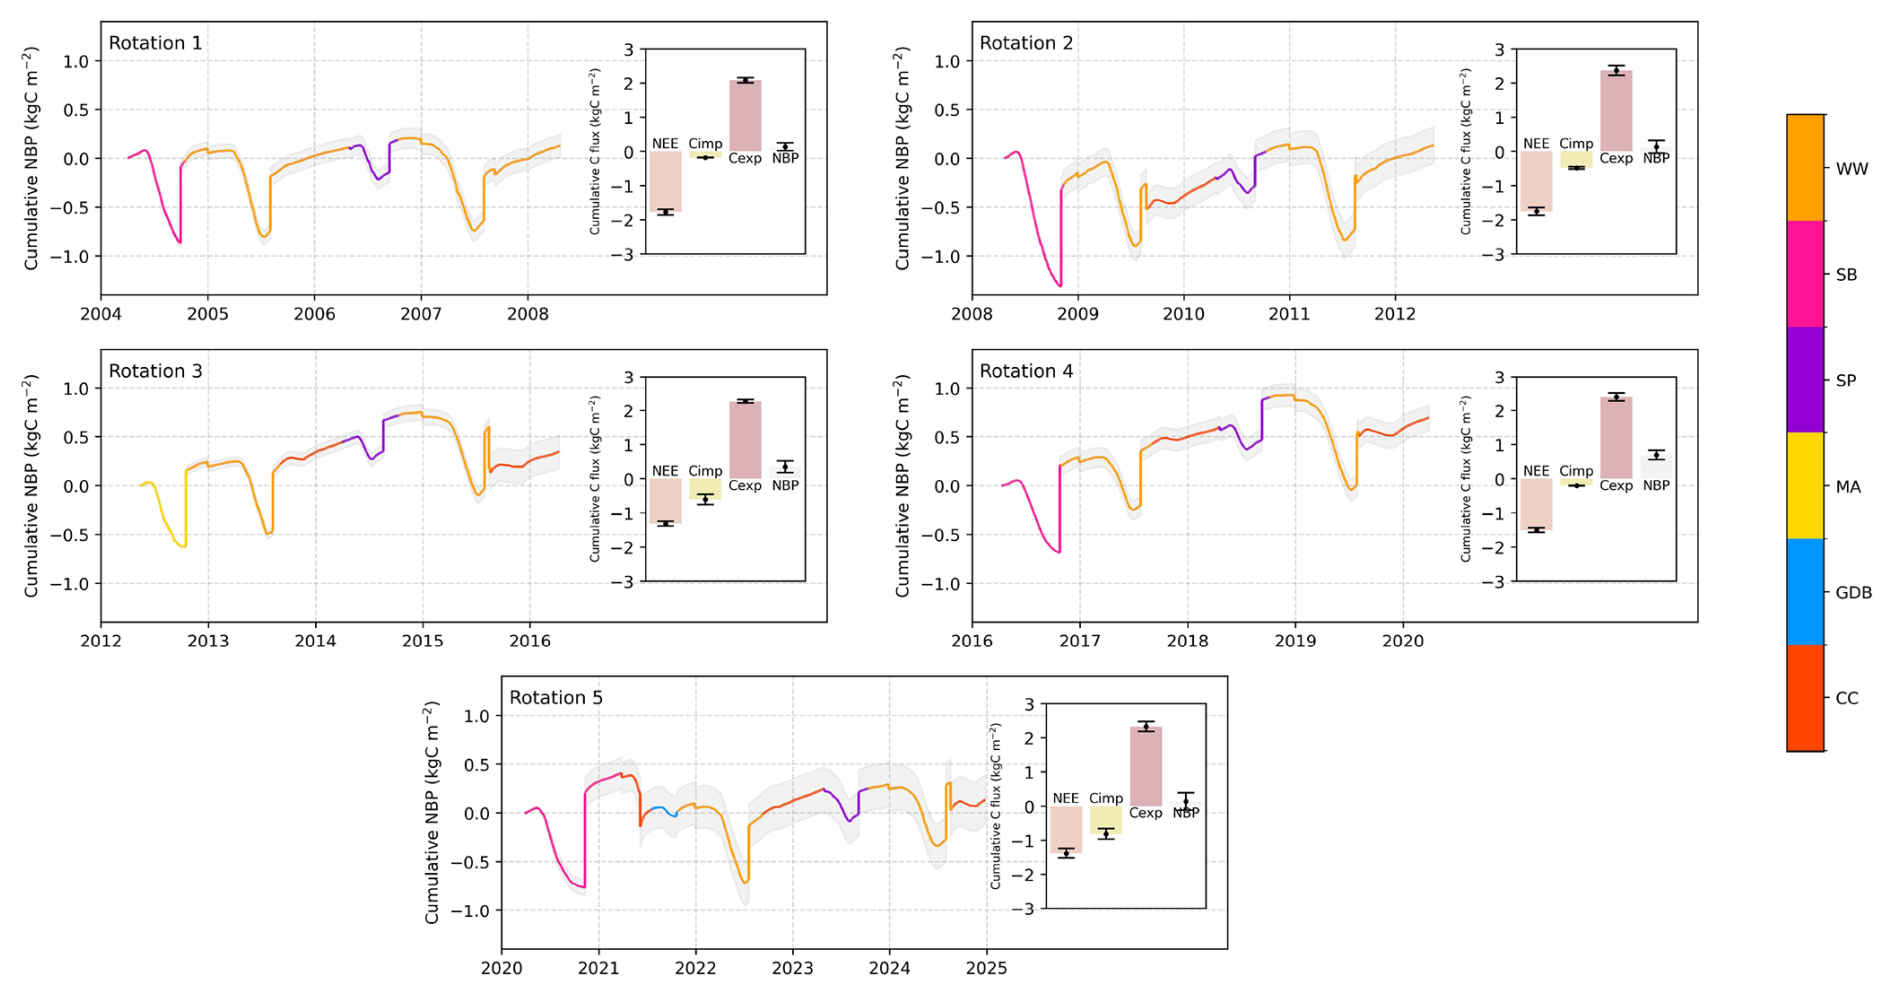
Figure 3Cumulative net ecosystem exchange (NEE), exports of carbon (Cexp), imports of carbon (Cimp) and net biome productivity (NBP) for each rotation over the five-rotation period. The shaded curve represents the cumulative standard deviation on NBP (σNBP) over each rotation. The error bars on the bar plots show cumulative standard deviations on NEE, Cimp and Cexp. Abbreviations: WW, winter wheat; SP, seed potato; SB, sugar beet; CC, cover crop; MA, silage maize; GDB, green dwarf bean.
3.2 Comparison between RothC simulations, cumulative NBP and inventories
The fraction of mineralized DPM and RPM pools (fres) calculated from RothC SOC stock simulations, varied widely across crop-periods (Table 3). As C inputs in RothC are attributed to the harvest month and the three preceding months, fres was driven primarily by the length of the harvest-to-sowing period and the corresponding meteorological conditions (Table 3).
Table 3Harvest-to-sowing intervals and fraction of mineralization of the DPM and RPM pools (fres). Abbreviations: WW, winter wheat; SP, seed potato; SB, sugar beet; CC, cover crop; MA, silage maize; GDB, green dwarf bean.
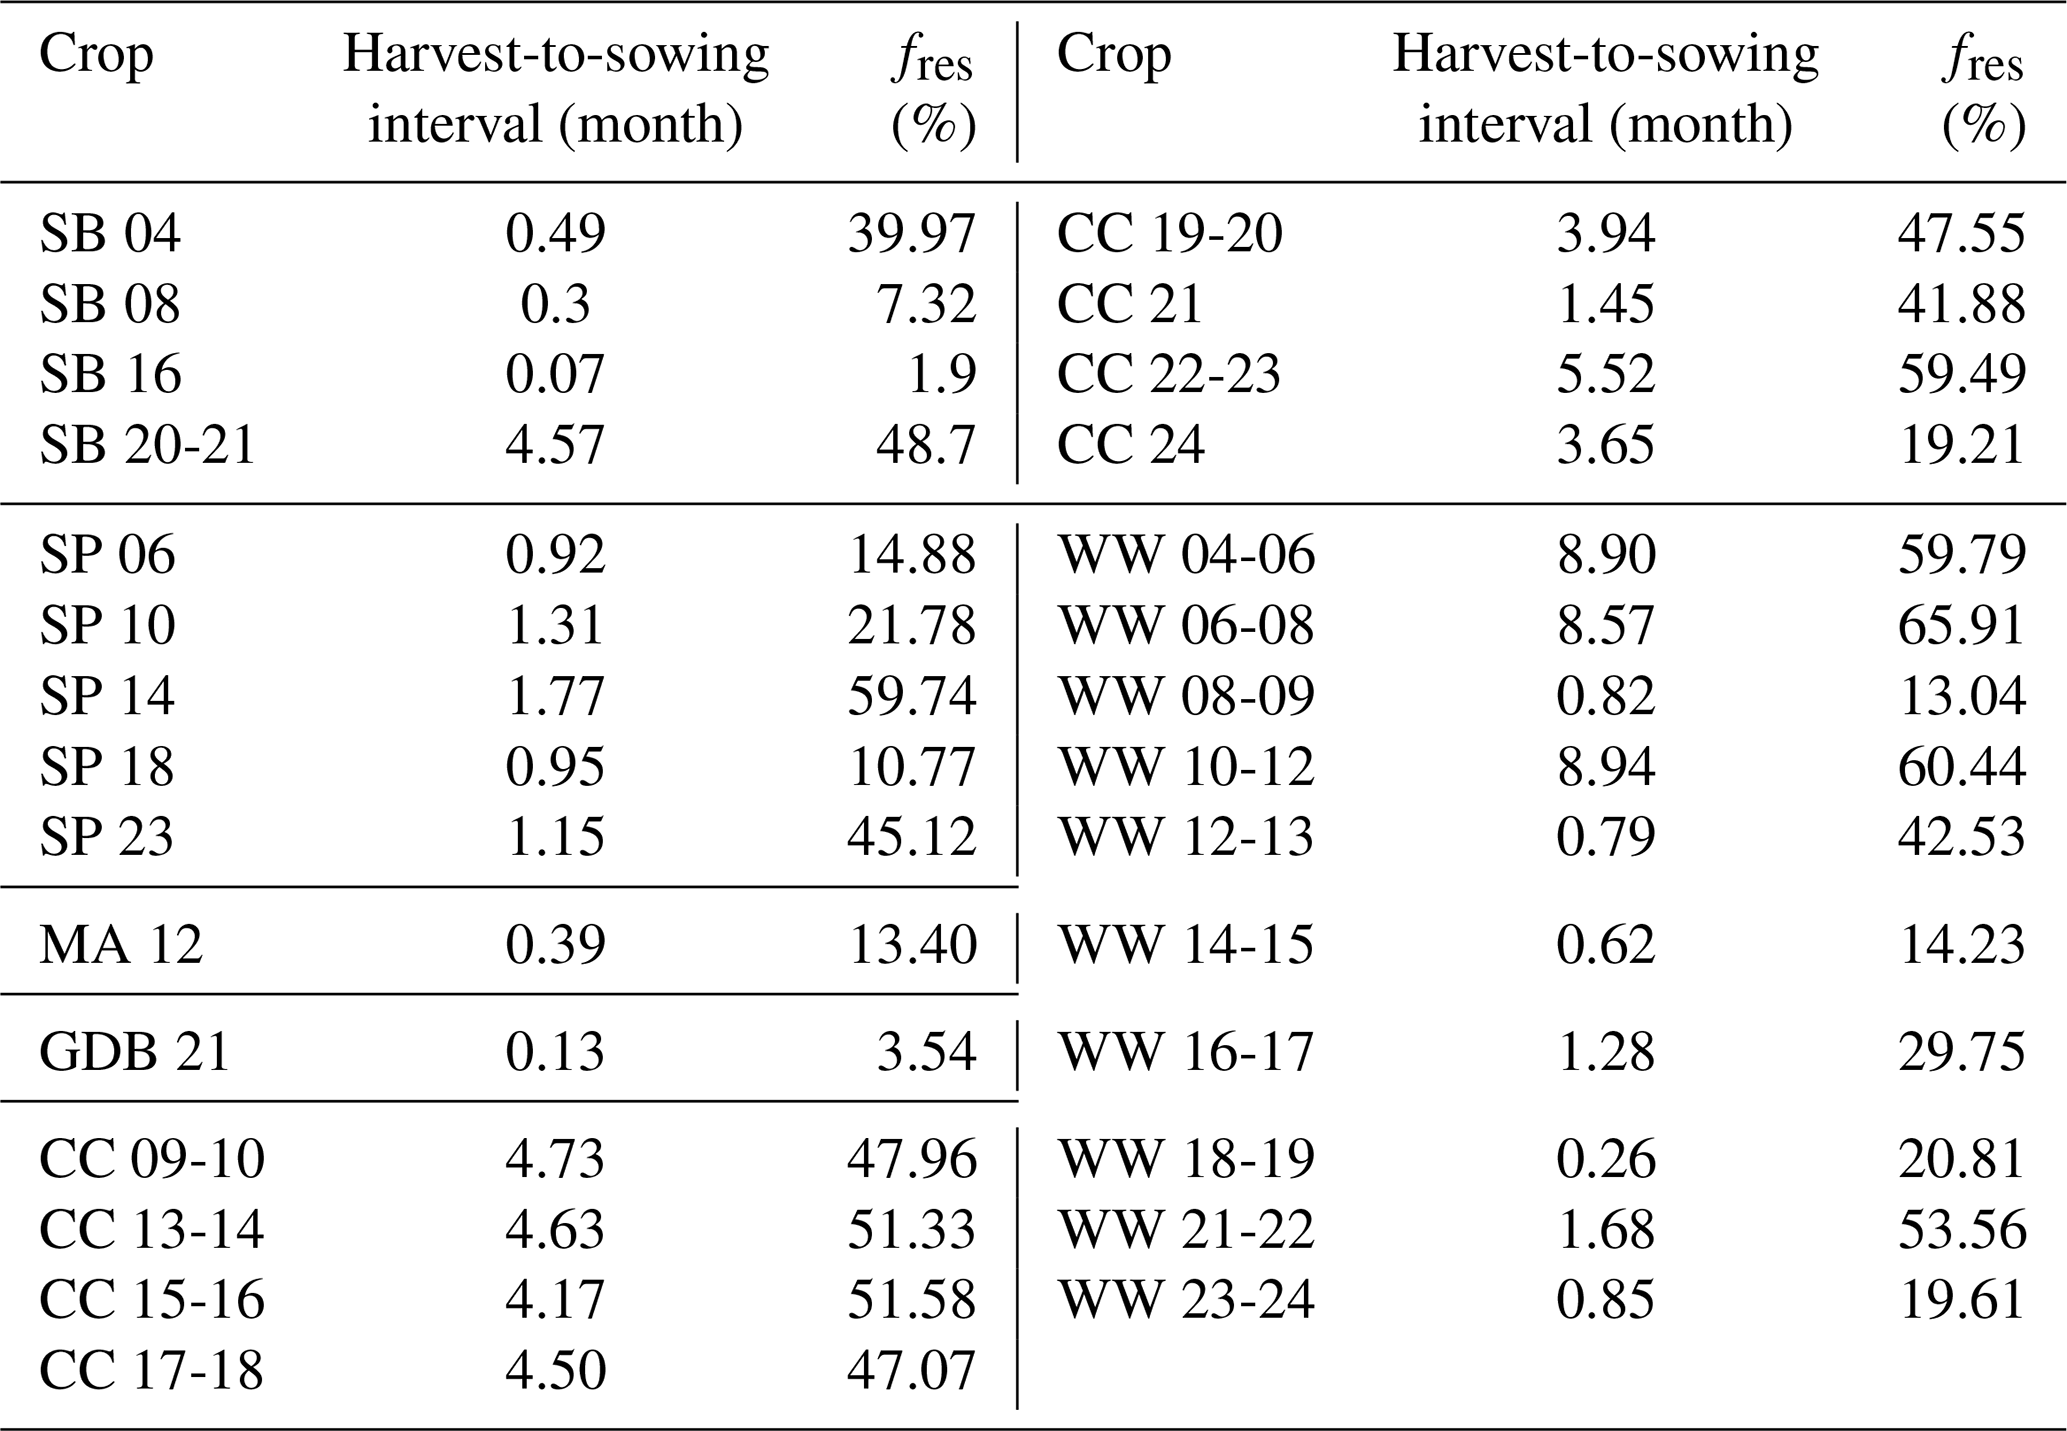
Cover crop periods consistently showed fres of ∼ 40 %–50 %, as residues were crushed in winter under conditions favourable to early-spring mineralization, except for 2024 due to the truncation of the study period on 31 December. Similarly, winter wheat periods without cover crops (2004–2006, 2006–2008, 2010–2012) yielded harvest-to-sowing interval exceeding 8 months and fres∼60 %. Conversely, short harvest-to-sowing interval associated with winter wheat (2008–2009, 2014–2015, 2018–2019, 2023–2024), maize (2012), sugar beet (2016), seed potato (2018) and green dwarf bean (2021) resulted in markedly lower mineralized fractions (Table 3). Interestingly, when the short winter wheat harvest-to-sowing intervals of 2008–2009, 2014–2015, 2018–2019 and 2023–2024 were combined with their immediately following cover crop periods to form full rotation sequences, the fres increased substantially, reaching 62.9 %, 64.6 %, 62.6 %, and 66.6 %, respectively. Taken together, these results demonstrate that the WW–CC sequence consistently achieves a high fres, strengthening the reliability of the NBP and RothC simulated carbon balance, as the sink or source status of the crop-period is not heavily confounded by undecomposed DPM and RPM pools across interval boundaries. Overall, fres was strongly and positively correlated with harvest-to-sowing interval length across all crop-periods (Pearson r=0.74, p<0.001), confirming that interval duration is the primary control on DPM mineralization at BE-Lon. No significant additional effect of harvest timing was detected after controlling for interval length (partial , p=0.42).
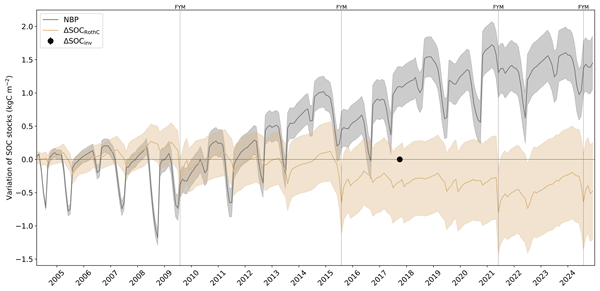
RothC simulations yielded a final ΔSOC of −0.43 ± 0.73 kg C m−2 over the five-rotation period (Fig. 4). The large standard deviation reflects an uncertain carbon balance, ranging from moderate sink to source. Increase in ΔSOCRothC stocks occurred either due to manure application or during the three months preceding and including the harvest month due to crop residues and root exudates (Fig. 4). On the other hand, positive ΔSOCRothC (i.e., decrease in SOC stocks) notably occurred after harvest, where CO2 emissions were solely driven by heterotrophic respiration resulting from crop residues (Fig. 4).
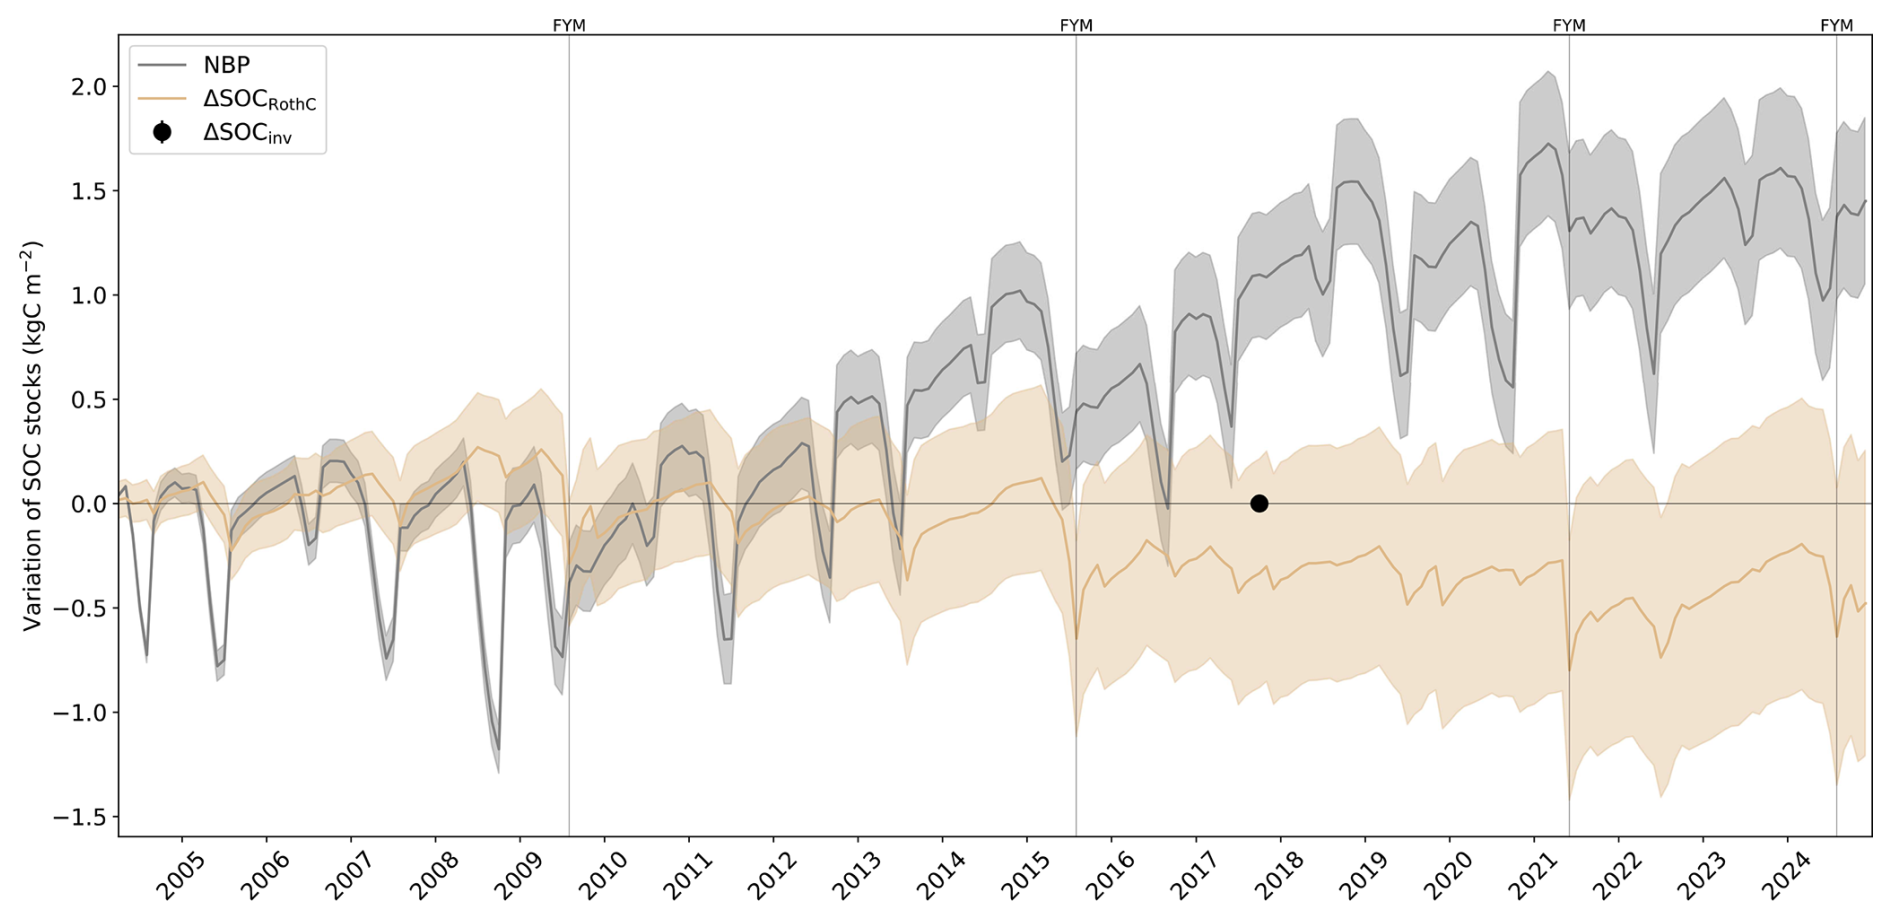
Figure 4Cumulative net biome productivity (NBP) and SOC stock variation simulated by RothC (ΔSOCRothC). Vertical lines indicate farmyard manure (FYM) application. The shaded curves represent the cumulative standard deviation over the study period. The black circle indicates the difference between the SOC stocks measured in 2007 and 2017 (ΔSOCinv). Note that the grey curve corresponds to the cumulated NBP per month, which leads to a monthly aggregation of events (e.g., FYM and harvest if occurring the same month).
Cumulative SOC stocks over the ∼ 0–60 cm profile (820 kg m−2 of fine earth), derived from inventories on an equivalent soil mass basis, were 5.99 ± 0.14 kg C m−2 in 2007 and 5.93 ± 0.22 kg C m−2 in 2017. Corresponding stocks in the topsoil (∼ 0–30 cm) were 3.81 ± 0.38 and 3.79 ± 0.21 kg C m−2, respectively, while subsoil (∼ 30–60 cm) stocks were 2.18 ± 0.48 and 2.17 ± 0.28 kg C m−2, respectively. The magnitude of change between the two inventories (ΔSOCinv) was negligible, as indicated by Hedges' g values overlapping zero for both layers (topsoil: −0.05, with a 95 % CI from −0.45 to 0.40; subsoil: −0.02, with a 95 % CI from −0.38 to 0.43). Therefore, ΔSOCinv was not significantly different from 0 over the period 2007–2017. ΔSOCRothC in 2017 (−0.28 ± 0.48 kg C m−2) was of similar magnitude to the inventory change, whereas cumulative NBP over the same period was higher than 1.0 kg C m−2 (Fig. 4).
By the end of the five-rotation period, the discrepancy between ΔSOCRothC and cumulative NBP reached 1.88 ± 0.83 kg C m−2. The comparison between variations of cumulative NBP and ΔSOCRothC for each crop periods showed a systematic positive discrepancy between the two variables as highlighted by the cumulative difference for maize, seed potato and winter wheat with respectively 0.25 ± 0.08, 0.63 ± 0.08, and 1.55 ± 0.54 kg C m−2 (Fig. 5). For sugar beet, the cumulative difference was 0.28 ± 0.35 kg C m−2, which was strongly influenced by the year 2008 with a negative cumulative NBP of −0.28 ± 0.35 kg C m−2 while ΔSOCRothC was close to zero (Fig. 5, Table A3). In particular, the cumulative NEE for this crop over the active vegetation period in 2008 (from sowing to harvest) was −1.26 ± 0.03 kg C m−2, which was 36 %, 85 %, and 129 % higher in absolute value than in 2004 (−0.81 ± 0.05 kg C m−2), 2016 (−0.68 ± 0.02 kg C m−2), and 2021 (−0.55 ± 0.08 kg C m−2), respectively (data not shown). In the meantime, the yield and crop residues did not follow the same magnitude (Table A3), which might indicate an underestimation of biomass measured at harvest in 2008.
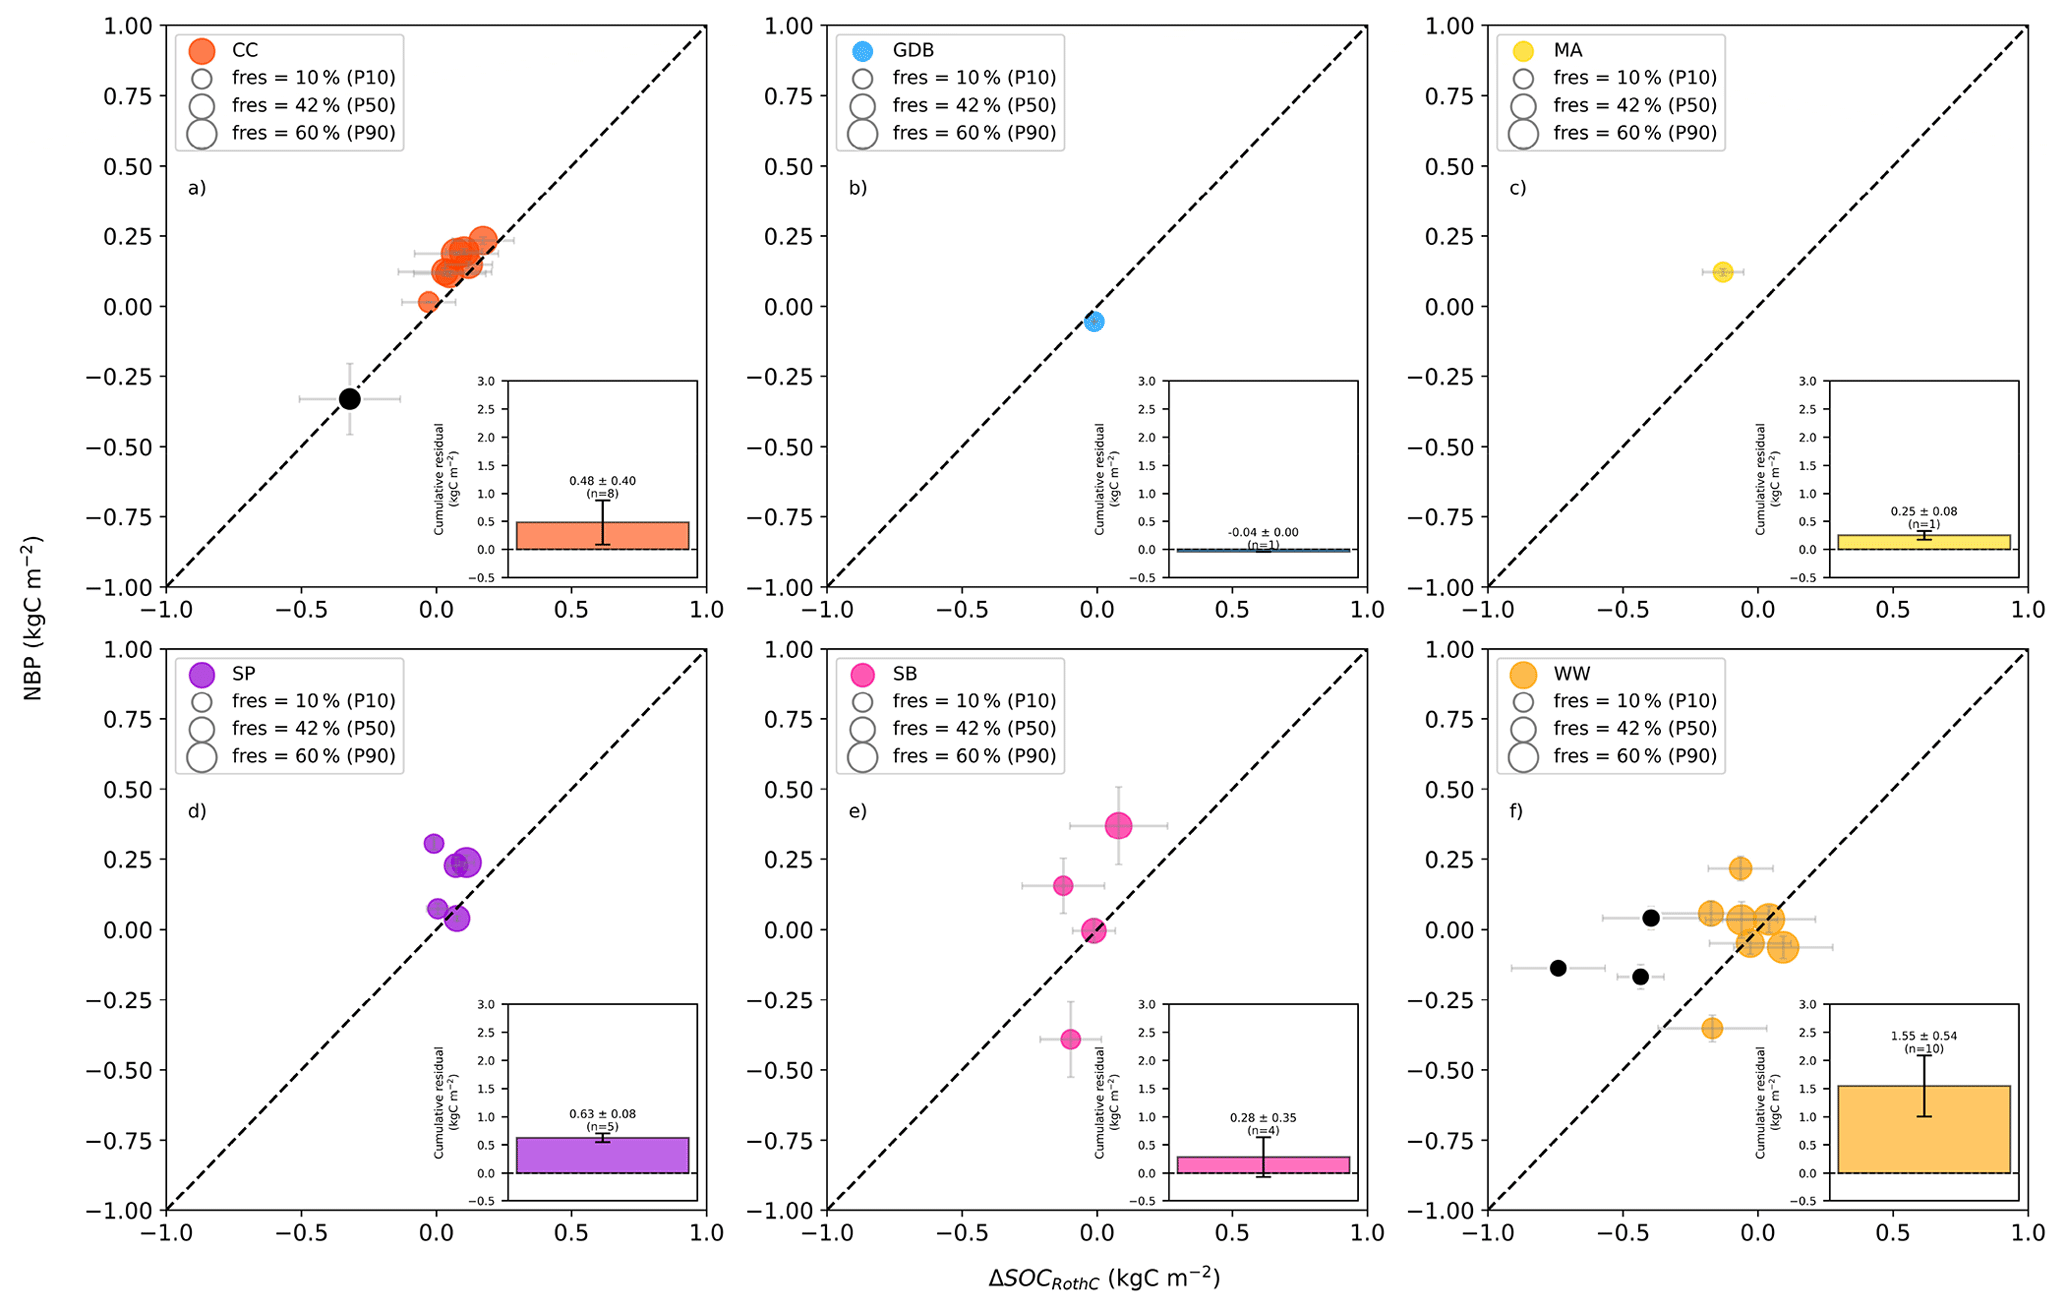
Figure 5Cumulative net biome productivity (NBP) and SOC stock variation modelled by RothC (ΔSOCRothC) for cover crop (panel a), green dwarf bean (panel b), silage maize (panel c), seed potato (panel d), sugar beet (panel e) and winter wheat (panel f). The cumulative bias between the two variables is shown in the inset. Black circles indicate farmyard manure application. The size of the circles corresponds to the 10th, 50th and 90th percentiles of the fraction of mineralization of the DPM and RPM pools (fres). n is the number of sowing-to-sowing periods per crop. Abbreviations: WW, winter wheat; SP, seed potato; SB, sugar beet; CC, cover crop; MA, silage maize; GDB, green dwarf bean.
A strong agreement between variations of cumulative NBP and ΔSOCRothC was found for cover crop, with a cumulative difference of 0.48 ± 0.40 kg C m−2, which persisted whether farmyard manure was added or not (Fig. 5a). The point at negative cumulative NBP and ΔSOCRothC variations corresponds to the phacelia – clover crop in 2024, which was truncated in December 2024, resulting in a partial mineralization of C residues after crushing (Fig. 5a). All other cover crop periods had a positive variation of cumulative NBP and ΔSOCRothC, highlighting SOC stock decrease. Only green dwarf bean showed a cumulative difference of −0.04 ± 0.00 kg C m−2, but the interpretation is limited with only one crop period in 2021 (Fig. 5b), similarly to maize with a single crop period in 2012 (Fig. 5c).
Winter wheat was an important driver of the discrepancy between cumulative NBP and ΔSOCRothC over the five-rotation period, with a marked underestimation of C sequestration via NBP compared to RothC over 10 crop periods and a cumulative difference of 1.55 ± 0.54 kg C m−2 (Fig. 5f). However, low fres indicated that a significant fraction of the imports of C to the model was not mineralized to conclude that winter wheat significantly sequesters C in the soil. The same observation regarding fresidue applies to all crops except cover crops (Fig. 5b, c, d, e). Since cover crop and winter wheat are part of the same agronomic sequence which aims to cover the soil before the next spring crop (sugar beet or potato), one could group these two crops together to form a unique winter wheat – cover crop sequence spanning from sowing of winter wheat to sowing of the next main crop after cover crop crushing. The sum of the difference between cumulative NBP and ΔSOCRothC of these new sequences was still driving the positive discrepancy between cumulative NBP and ΔSOCRothC (0.70 ± 0.63 kg C m−2, Fig. 6a, b). Importantly, the extension of the sowing-to-sowing period for WW-CC sequences resulted in a higher degree of mineralization (Fig. 6b). Although addition of farmyard manure achieved negative variations of cumulative NBP and ΔSOCRothC associated with high mineralization rate for two periods in 2009–2010 and 2015–2016, high uncertainties prevent conclusive sink identification for these specific sequences (Fig. 6b). Only one winter wheat – cover crop sequence, corresponding to the phacelia – clover crop in 2024, was a net C sink due to farmyard manure application but still achieved an incomplete mineralization (Fig. 6b). The three remaining winter wheat crop periods alone were the ones in Rotation 1 (2004–2006, 2006–2008 and 2010–2012) when no cover crops were sown after harvest and bare soil was there until sowing of the seed potato, sugar beet and maize respectively (Fig. 6a). For these three winter wheat crops, no significant sink or source pattern, nor bias between cumulative NBP and ΔSOCRothC could be observed (Fig. 6a).
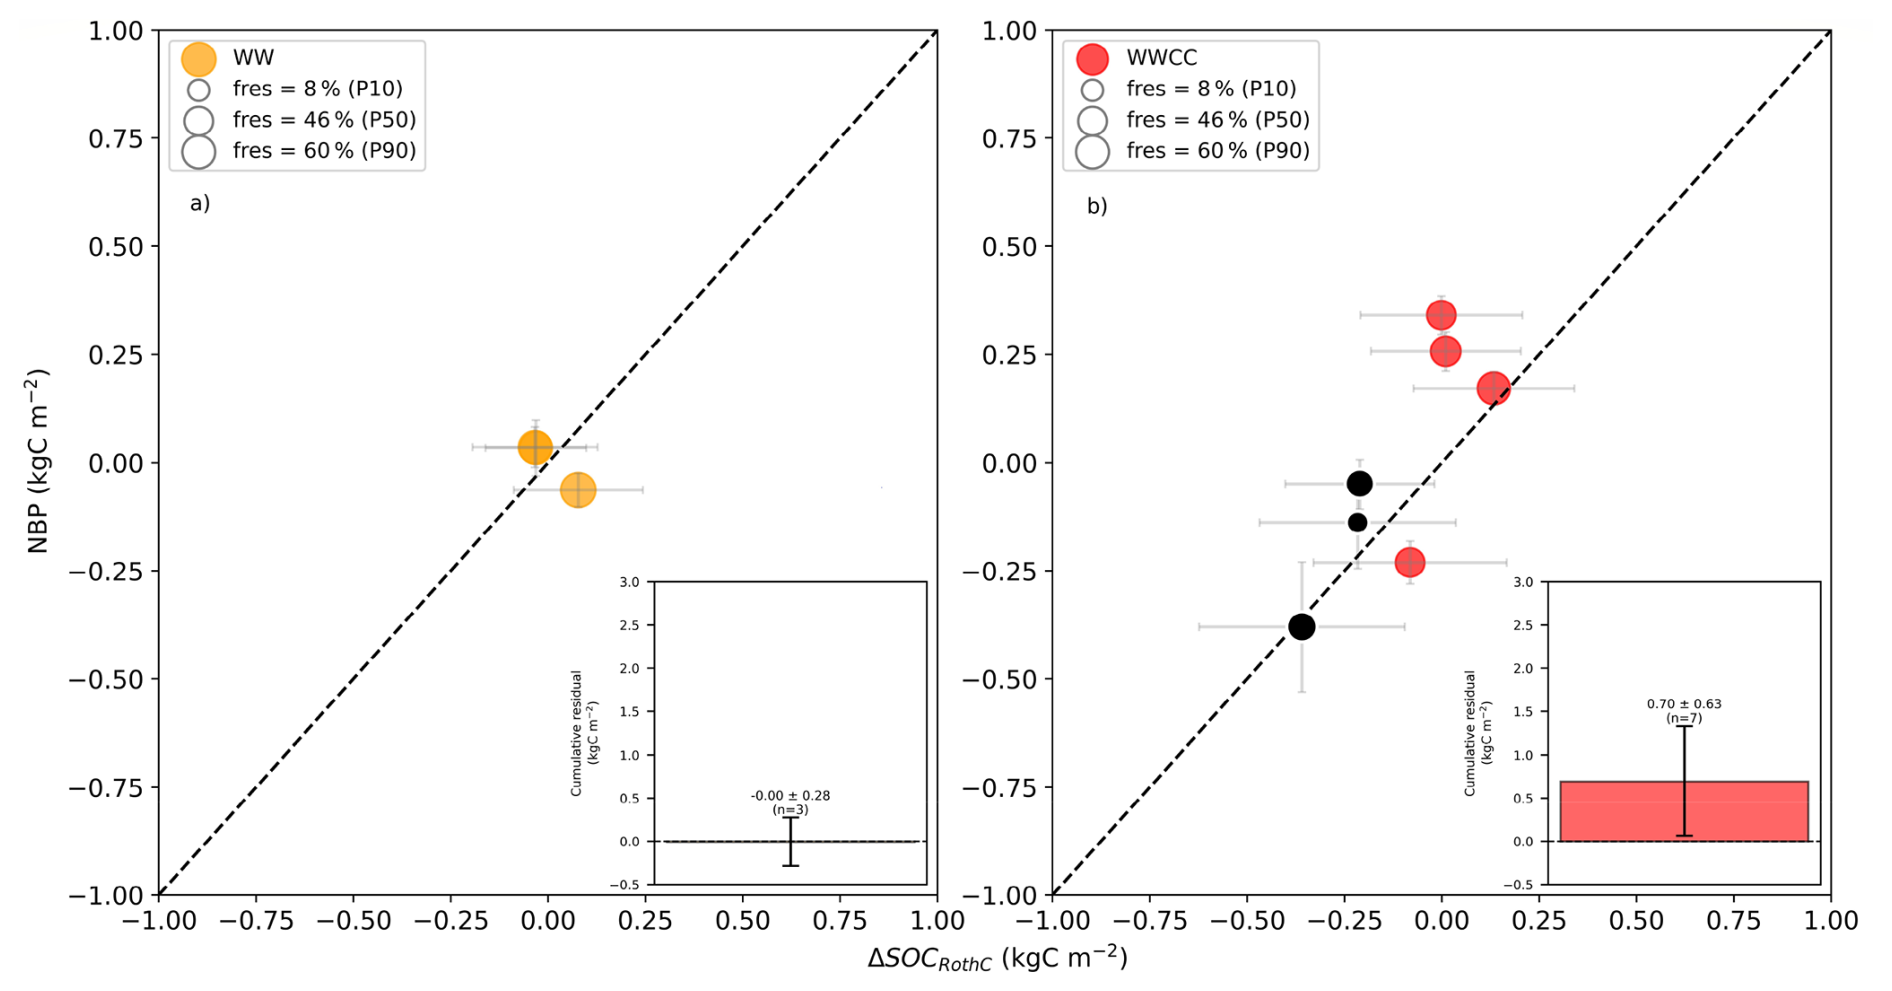
Figure 6Cumulative net biome productivity (NBP) and SOC stock variation modelled by RothC (ΔSOCRothC) for winter wheat without subsequent cover crops (panel a) and for the winter wheat – cover crop sequence (panel b). The cumulative bias between the two variables is shown in the inset. The size of the circles corresponds to the 10th, 50th and 90th percentiles of the fraction of mineralization of the DPM and RPM pools (fres). Black circles indicate farmyard manure application. n is the number of sowing-to-sowing periods per crop. Abbreviations: WW, winter wheat; CC, cover crop.
4.1 Discrepancies between RothC simulations and EC
The annual SOC stock loss rate derived from NBP was estimated at approximately 0.07 kg C m−2 yr−1 on average. At this rate, the initial SOC stock in the 0–60 cm soil profile (5.99 kg C m−2) would theoretically be depleted within about 85.6 years, assuming a linear and uninterrupted loss. However, this simple projection should be interpreted with caution, as it does not fully reflect long-term soil carbon dynamics. In particular, the site has been under continuous cultivation for nearly a century, with the current crop rotation maintained for at least 40 years. Under such stable management conditions, SOC dynamics are more likely to approach a quasi-equilibrium state rather than follow a sustained linear decline over time. For instance, Buysse et al. (2013) demonstrated at a long-term experimental site near Lonzée that SOC stock equilibrium is typically achieved after 20 years of constant farmyard manure and crop residue treatments, resulting in minimal subsequent effects on SOC concentration. While these observations suggest that the EC-derived SOC stock loss rate may be overestimated, these results on cumulative NBP lie within the range of previous studies conducted on similar crop rotations using EC data. For instance, Poyda et al. (2019) found an annual loss of 0.12 kg C m−2 for six intensive crop rotations over a period of eight years in Germany. Emmel et al. (2018) showed that the Oensingen site in Switzerland (site code CH-Oe2) was a net carbon source with a loss of 0.12 kg C m−2 yr−1 over 13 years for a crop rotation including winter barley, winter wheat, winter rapeseed, peas and potato. Similar results were found across Europe for similar rotations under similar climate (Kutsch et al. (2010): 0.10 kg C m−2 yr−1, Ceschia et al. (2010): 0.14 kg C m−2 yr−1, Buysse et al. (2017): 0.09 kg C m−2 yr−1, Loubet et al. (2011): 0.13 kg C m−2 yr−1). However, these findings strongly contrast with SOC stock variations derived from regional inventories. For instance, historical soil databases (Goidts and Van Wesemael, 2007) and modelling (Meersmans et al., 2011) have shown that croplands have lost on average 0 to 0.02 kg C m2 yr−1 in the plough layer over 50 years in Wallonia, reflecting a limited to negligible decline. Although this trend was supported by RothC simulations and soil inventories at the Lonzée cropland (Fig. 4), our results show large uncertainty bounds in ΔSOCRothC over the five-rotation period, underscoring the need for cautious interpretation.
Furthermore, the comparison between ΔSOCRothC and cumulative NBP may be biased by the omission of subsoil carbon dynamics in RothC. While EC fluxes integrate CO2 exchange across the entire soil profile, RothC simulations only accounted for the top 23 cm of soil (Coleman and Jenkinson, 1996). C inputs from belowground biomass for winter wheat and silage maize were estimated using measured shoot-to-root ratios and harvest index values. These estimates were aligned with the RothC vertical discretization by assigning root-derived inputs to the topsoil layer, under the assumption that most root biomass is concentrated within this horizon (Bolinder et al., 2007). As a result, all carbon inputs were conceptually added into the topsoil and no inputs to the subsoil were considered. Although evidence suggests that most CO2 efflux in croplands originates from the topsoil (Khan et al., 2023; Wang et al., 2018; Wiaux et al., 2015) and that subsoil SOC stocks are relatively stable due to slow turnover rates (Alcántara et al., 2017) or textural protection (Sierra et al., 2024), recent studies indicate that root–subsoil interactions, particularly in cereals, can substantially contribute to changes in subsoil carbon stocks (Jones et al., 2026; Kätterer et al., 2014; Patra et al., 2022, 2024). In the present study, measurements conducted during pre-harvest field campaign in 2022 showed that winter wheat root biomass in the subsoil (30–100 cm) accounted for 16.5 ± 4.2 % of the total root biomass over the whole soil profile. Therefore, a significant part of C inputs for winter wheat and maize could have been attributed to a subsoil layer, which could have exacerbated the difference between RothC simulations and cumulative NBP by enhancing SOC sequestration due to greater stabilization with depth, thus widening the gap with cumulative NBP. On the other hand, this could also decrease ΔSOCRothC if priming of older carbon, enhanced mineralization, or lateral exports dominated. To resolve this uncertainty, future work should assess the sensitivity of overall ΔSOC to belowground carbon allocation, depth-dependent turnover rates, and priming effects. Recent modelling frameworks have started to address these processes explicitly – including the implementation of RothC within JULES across a 3 m soil profile (Nakhavali et al., 2018), rCTOOL (Giannini-Kurina et al., 2025), and ORCHIDEE-SOM (Camino-Serrano et al., 2018). While SOC stock measurements for topsoil and subsoil are available at our site and could support such an extension, implementing and validating a multi-layer model was beyond the scope of the present study, which focused on the topsoil carbon budget over observed rotation sequences. Coupling these multi-layer approaches with the long-term eddy covariance and soil inventory dataset presented here therefore constitutes a particularly well-constrained opportunity for future work.
A complementary perspective to further constrain SOC stock dynamics at BE-Lon would be the measurement of functional soil organic matter fractions, such as particulate organic matter (POM) and mineral-associated organic matter (MAOM). Bulk SOC stock measurements integrate pools with contrasting turnover times and stabilization mechanisms, and may therefore mask compensating changes between a labile, plant-derived POM pool and a more persistent, mineral-stabilized MAOM pool (Cotrufo et al., 2019; Lavallee et al., 2020). Partitioning SOC into these measurable fractions would provide a more mechanistic basis for interpreting the near-equilibrium trend observed here and would offer observational constraints that map more directly onto recent process-based models structured around measurable pools (e.g. MEMS, Millennial; Abramoff et al., 2022) than the kinetically defined pools of RothC. Additionally, constraining model uncertainty using supplementary observational data, such as mineralization curves to improve process representation in RothC (Mondini et al., 2017) would support more robust conclusions.
Finally, an important step in the calculation of NBP from NEE and lateral C fluxes was the omission of total dissolved organic and inorganic carbon (DIC-DOC) in Eq. (1), due to a lack of available measurements and limited representation in the model framework. Notably, DOC and DIC fluxes have been shown to be non-negligible in croplands and can represent a significant component of the carbon budget (Nakhavali et al., 2021, 2024). Yearly losses yielded 12.5, 16.0 and 11.2 g C m−2 yr−1 at the cropland ICOS sites of Grignon, Klingenberg and Carlow, respectively (Kindler et al., 2011). Comparable flux magnitudes have been reported in other croplands (Manninen et al., 2018; Walmsley et al., 2011) as well as in large-scale modelling studies across Europe (Gommet et al., 2022; Janssens et al., 2003). Including DIC and DOC fluxes in the EC-derived C budget would therefore increase the discrepancy between cumulative NBP and ΔSOCRothC, while leaving unchanged the conclusions of the present study regarding the differences observed among the SOC stock–based methods.
4.2 Uncertainty propagation and its impact on trend significance
The large uncertainty bounds on ΔSOCRothC indicates that RothC simulations must be interpreted with caution. By the end of the simulation period, the standard deviation of simulated SOC stock variation (0.73 kg C m−2) was larger than the corresponding increase in SOC stock (−0.43 kg C m−2), underscoring considerable predictive uncertainty on SOC stock predictions. The variability observed here exceeded that reported in previous studies (Filip et al., 2025; Morais et al., 2019; Pesce et al., 2024), likely because, in addition to C inputs and meteorological drivers, we also accounted for a moderate hypothesized uncertainty in the model's functional relationships (20 % on model parameters, Sect. 2.6). However, this study did not consider potential correlations among the perturbed parameters and drivers. All Monte Carlo simulations were based on independent sampling. Several of these variables are however likely correlated: temperature and evapotranspiration typically co-vary within the same climatic events, decomposition rate constants are usually derived from a joint calibration, and biomass inputs may respond to the same climatic drivers used to modify decomposition. Ignoring these dependencies can bias the estimated uncertainty in either direction: positive, reinforcing correlations would lead independent sampling to underestimate true variability, whereas opposing correlations could cause overestimation. As the correlation structure among RothC parameters and drivers was not quantified at our site, we cannot determine a priori whether the reported uncertainty bounds over- or underestimated the true predictive uncertainty. Future applications should consider a joint sampling scheme informed by the empirical covariance among climatic drivers and model parameters. Additionally, using multiple soil C models within an ensemble framework could provide a more robust assessment of uncertainties arising from model structural differences (Bruni et al., 2022; Farina et al., 2021). Recent efforts to develop a single interface for generating projections from multiple SOC models in forest soils pave the way towards more accessible and robust predictions of SOC stocks over croplands (Bruni et al., 2026). Nonetheless, our results suggest that the 2017 SOC stock measured by physical sampling fell within the simulated range, thereby supporting the overall trend of equilibrium of SOC stocks at BE-Lon over the 21-year period. Confirmation of the apparent long-term stability requires additional SOC measurements, ideally at least ten years after the 2017 sampling (Schrumpf et al., 2011), which is required in the ICOS protocols.
Error propagation in EC measurements is critical for reliable carbon budgets, as uncertainties arise from instrumental limitations, missing data and gap-filling. In this study, we quantified uncertainty contributions from key processing steps over the five-rotation period. Random measurement errors contributed minimally to the total error on NEE (0.98 g C m−2 yr−1), consistent with literature values (0–5 g C m−2 yr−1) (Du et al., 2014; Vekuri et al., 2023). The u* threshold uncertainty reached 8.09 g C m−2 yr−1, which is slightly lower than the range of reported values (10–100 g C m−2 yr−1) (Papale et al., 2006) likely thanks to sowing-to-harvest seasons in REddyProc that constrained surface roughness variability. Spectral correction uncertainty was comparable at 6.29 g C m−2 yr−1, reflecting methodological robustness of the spectral correction workflow. These two dominant sources on NEE uncertainty (u* filtering and spectral correction) together accounted for ∼ 30 % of the total annual uncertainty on cumulative NBP, the other 70 % being shared by the uncertainty on Cimp and Cexp. The total cumulative standard deviation on NEE represented a very small fraction of the cumulative flux (∼ 3 % on the −7.72 kg C m−2), thereby indicating that the post-processing workflow of EC data minimized the uncertainty associated with flux estimation and ensured a high level of confidence in the derived cumulative carbon balance.
4.3 Potential underestimation of C sequestration
This study showed a systematic overestimation of cumulative NBP when compared to ΔSOCRothC, which was observed for winter wheat, maize, seed potato and sugar beet (Fig. 5), and suggested a potential underestimation of C sequestration by the EC technique. To further investigate the mismatch between the flux-based approach and the SOC modelling approach, we calculated the carbon balance ratio (CBR), which is defined as the ratio of the integrated NEE to the difference between the carbon exported and imported plus the difference between final and initial SOC (Baker and Griffis, 2005). In the absence of SOC stock changes, the vertical CO2 flux balance should match the net lateral carbon balance, leading to a CBR of ∼ 1. At the Lonzée site, the CBR over five full rotations was ∼ 82.5 %, suggesting that EC measurements likely captured only a part of the true CO2 exchange over the cropland, assuming no systematic biases affected lateral carbon fluxes or inventory estimates. This finding for CO2 fluxes is consistent with the well-documented non-closure of the surface energy balance, where the sum of turbulent sensible and latent heat fluxes is likely smaller than the available energy (Aubinet et al., 2012; Foken, 2008; Oncley et al., 2007; Twine et al., 2000). The energy balance ratio (EBR) at BE-Lon was 60.8 % over the five-rotation period (Arquin, pers. comm.), which falls within the lower range of values typically reported for croplands (Nicolini et al., 2026; Stoy et al., 2013). One commonly proposed explanation is the contribution of large-scale turbulent structures with timescales exceeding the EC averaging period, which generate dispersive fluxes that are not captured by single-tower measurements (Foken et al., 2011; Gao et al., 2019; Mauder et al., 2020; Wohlfahrt and Widmoser, 2013). It has also been suggested that missing terms in the classical energy balance equation may contribute to the observed imbalance (Durand, 2022; Sun et al., 2021; Sun and Tribbia, 2025). To test whether the discrepancy between the EC-based C budget, the model estimates and the soil C inventories could arise from a fraction of the turbulent CO2 exchange being missed by EC at the ecosystem surface, we computed the EBR following Volk et al. (2021) and attributed a fraction (α) of the energy balance non-closure to NEE, varying α between 0 % and 100 %. The optimal α was identified by comparing the resulting gain in NEE after correction (ΔNEE) with cumulative NBP. α=52 % yielded a cumulative ΔNEE of the same magnitude as cumulative NBP (1.45 kg C m−2), indicating that correcting NEE for only part of the energy balance non-closure may help reconcile EC, RothC and soil C inventories. This supports the hypothesis that eddy covariance turbulent fluxes are underestimated in absolute value at BE-Lon, while also implying that the degree of underestimation differs between turbulent energy fluxes and CO2 fluxes. Whether energy balance non-closure can be systematically translated into NEE corrections nevertheless remains uncertain (Mauder et al., 2024; Zhou et al., 2024). These findings therefore call for caution when interpreting absolute NEE-derived carbon budgets, while highlighting the value of independent model-based approaches, such as RothC, to benchmark and contextualize EC measurements.
4.4 The role of amendments and cover crops on SOC sequestration
This study demonstrates that farmyard manure application during a winter wheat – cover crop sequence led to a significant increase in SOC stocks, as consistently indicated by both cumulative NBP and ΔSOCRothC variations under high residue mineralization conditions (Fig. 6b). In contrast, without manure amendment, the additional carbon inputs from cover crop incorporation and winter wheat harvest residues appeared insufficient to offset heterotrophic respiration losses, resulting in a moderate net carbon loss (Fig. 6b). Manure applications can enhance SOC stocks through two non-exclusive pathways: (i) by boosting crop productivity and cover crop growth, thereby increasing the amount of plant residues and rhizodeposition returned to the soil (Stewart et al., 2007); and (ii) by directly supplying organic matter with a composition and nutrient content that promote the stabilization of a larger fraction of input C in soil organic matter compared to crop residues alone, as suggested by global syntheses of manure effects on SOC (Maillard and Angers, 2014). These findings highlight the critical role of organic amendments in enhancing the carbon sequestration potential of the BE-Lon cropland and raise important questions regarding the capacity of cover crops alone – in the absence of external organic inputs – to drive net SOC accumulation under the prevailing climatic and management conditions.
The potential to further enhance carbon sequestration through increased manure application depends on factors such as soil and climate adaptability, economic feasibility for farmers, impacts on food production, and the extent to which these practices are already implemented. It is well known that manure applications have been shown to increase SOC stocks (Bolinder et al., 2020; Poulton et al., 2018; Sail et al., 2025), making organic amendments a promising strategy to increase SOC stocks in agricultural systems (Bai et al., 2023; Chenu et al., 2019). However, the potential for further SOC gains from increasing manure application depends on the soil's capacity to stabilize added carbon. This capacity is determined by the number of mineral binding sites, which is closely related to the proportion of fine silt and clay particles (Carter et al., 2003). Soils are therefore expected to have a finite carbon storage capacity in aggregate fractions, with an estimated upper limit of approximately 50 g C kg−1 for European soils (Cotrufo et al., 2019). Consequently, soils with low initial SOC content in the fine fraction typically have high carbon sequestration potential due to a greater capacity for long-term stabilization in association with the mineral phase (Georgiou et al., 2022; Gross and Glaser, 2021). However, recent studies indicate that soils with high initial SOC can continue to sequester carbon when carbon inputs increase (Orgill et al., 2017). It could be expected that increasing manure applications leads to measurable gains in SOC stocks (Joona et al., 2024; Koga, 2017; Liang et al., 2023; Shakoor et al., 2021).
The role of cover crops in enhancing the carbon sink capacity of croplands remains debated in the literature, with studies reporting a wide range of outcomes from net carbon gains to neutral or slightly negative balances. For instance, a long-term experiment in France demonstrated that residue incorporation from cover crops was largely compensated by the associated CO2 respiration flux following crushing, in a cropland with a SOC content comparable to BE-Lon (Breil et al., 2023). Meta-analyses notably consistently report SOC stock gains under cover crops relative to bare soils (McClelland et al., 2021; Poeplau and Don, 2015; Scavo et al., 2022). Process-based model simulations in Flanders (Spotorno et al., 2024) or Germany (Seitz et al., 2023) similarly suggest beneficial effects on SOC stocks. However, other studies point to more limited or inconsistent outcomes. Blanco-Canqui (2022) reported only minor effects of cover crops on SOC sequestration, a 65-year long-term experiment in Belgium found marginal SOC increases attributable to cover crops (Sail et al., 2025), and Schepens et al. (2025) concluded that winter cover crops do not systematically increase SOC stocks across Northwestern Europe. The extent to which cover crops enhance the carbon sink capacity of croplands is therefore site-specific, and depends on factors including the duration of cover crop integration, initial SOC content, soil texture, climate and, critically, plant species (Blanco-Canqui, 2022; Breil et al., 2023; Zhang et al., 2022). At BE-Lon, mustard accounted for more than 80 % of cover crop periods, with oat and faba bean mixtures comprising the remainder. Mustard appears to have limited SOC sequestration potential (Antosh et al., 2020), in contrast to ryegrass – also used in Western Europe (Smit et al., 2019) – which can substantially enhance SOC stocks (Jensen et al., 2022; Poeplau et al., 2015). The dominance of a low-sequestration cover crop species at the BE-Lon site may therefore partly explain the absence of a net carbon sink effect from cover cropping. Furthermore, incorporating N-rich cover crops like faba beans may lead to increased N2O emissions offsetting the carbon storage benefits (Li et al., 2024).
This study could not confirm whether winter wheat or maize as contributors to SOC sequestration, owing to the incomplete mineralization of the DPM and RPM pools following harvest (Fig. 5). When winter wheat data were pooled with the subsequent cover crop periods to achieve higher DPM mineralization rates over a unique agronomic sequence, both cumulative NBP and ΔSOCRothC consistently indicated a moderate net carbon source trend – except when farmyard manure was applied (Fig. 6). This pattern is consistent with the broader finding that organic amendments, rather than crop rotation design alone, appear to be the primary lever for SOC accumulation at BE-Lon. While the inclusion of cereal crops with deep root systems has been proposed as a strategy to increase belowground C inputs and promote SOC gains in many studies (Patra et al., 2022, 2024; Poeplau et al., 2021; Sun et al., 2018), this effect may be insufficient to counteract heterotrophic respiration losses under the management and climatic conditions prevailing at this site. Under the conditions of this study, modifying the rotation to increase the proportion of cereal crops does not appear to be a sufficient strategy for improving net SOC sequestration.
Although this study showed that manure application was a key driver of SOC accumulation, the associated increase in greenhouse gas emissions, particularly nitrous oxide (N2O), may partially or even fully offset the climate benefits of enhanced carbon sequestration (Guenet et al., 2021). In general, manure amendments lead to significantly higher N2O emissions than mineral nitrogen fertilization alone, with the magnitude of this effect strongly influenced by the ratio of the applied material (Zhou et al., 2017). While the present study did not quantify N2O emissions following manure application, additional inputs, even within the limits set by the European Union Nitrates Directive (91/676/EEC; European Commission, Directorate-General for Environment, 2000) and farm-level agronomic constraints, could exacerbate ammonia volatilization, nitrate leaching, and N2O emissions, thereby reducing or negating the net greenhouse gas mitigation potential at the cropland scale (Maenhout et al., 2024). Moreover, manure use is constrained by broader environmental concerns, including water contamination, nitrate leaching, the spread of antibiotic resistance, and risks to ecosystems functioning (Zhen et al., 2020, Wang et al., 2019). Overall, the net climate mitigation potential of manure application is likely limited, as many of its benefits reflect redistribution of existing carbon stocks rather than direct sequestration of atmospheric carbon into the soil (Powlson et al., 2011, 2012).
This study compared decadal soil inventories, RothC simulations, and EC measurements with lateral C flux inventories to assess SOC stock changes at BE-Lon across five crop rotations. EC-derived carbon budgets indicated high SOC losses inconsistent with the long-term agricultural and management history of the site, while RothC simulations and soil inventories supported near-equilibrium dynamics. Uncertainties associated with spectral correction and friction velocity threshold determination were comparable in magnitude to the uncertainty in lateral C flux estimates within the EC-based budget. However, all uncertainties remained smaller than the cumulative NBP signal, enabling the identification of a strong source trend. Comparison between cumulative NBP and RothC simulations of SOC stock variation revealed a systematic positive bias for most crops, likely reflecting an underestimation of C sequestration by the EC technique, which is consistent with the well-documented energy balance non-closure at cropland sites. Both approaches identified the winter wheat – cover crop sequence as a moderate net C source in the absence of organic amendments. Farmyard manure application emerged as the primary driver of SOC accumulation at the site, as shown by the convergence between the two approaches under high DPM mineralization. However, evaluating the true mitigation potential of this practice requires accounting for potential trade-offs with N2O emissions in the full greenhouse gas balance. More broadly, this study highlights the value of combining process-based models, multi-decadal soil inventories, and eddy covariance flux tower to constrain SOC budgets, and improve understanding of SOC stock drivers on croplands.
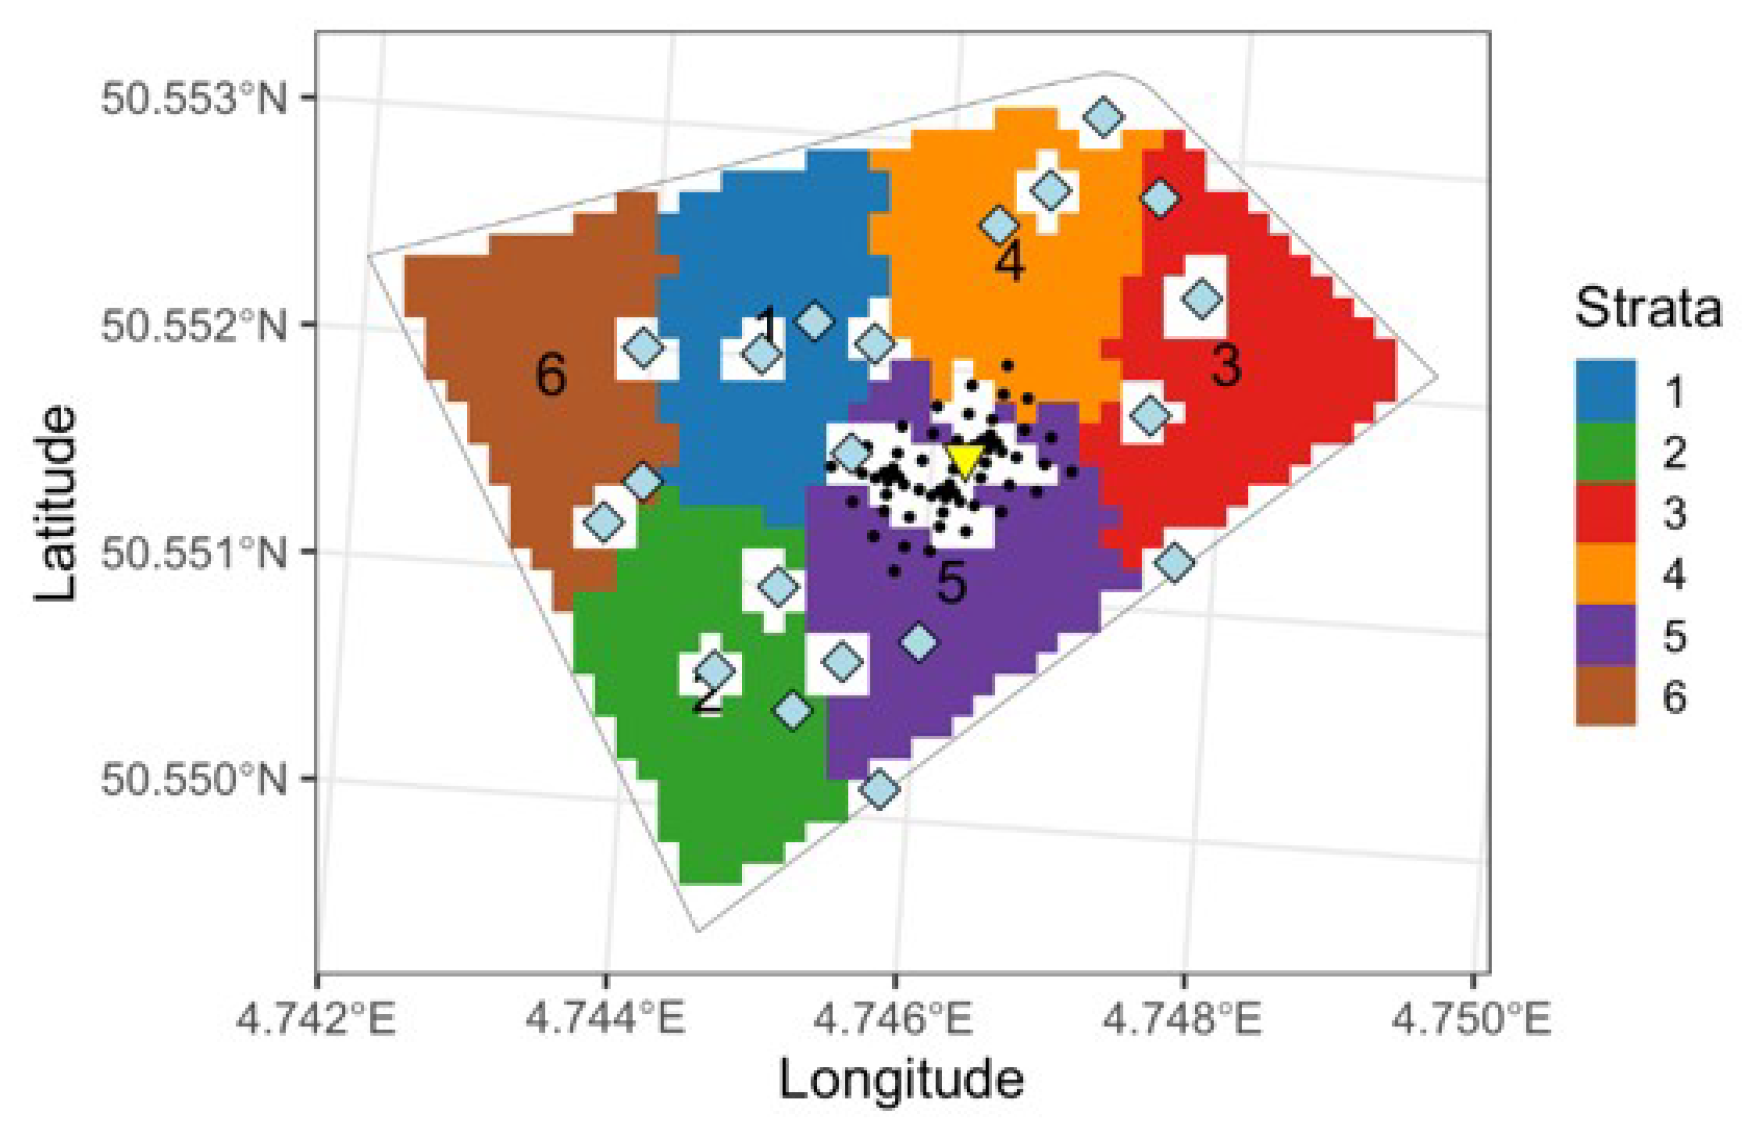
Figure A1Spatial design of soil sampling in 2007 and 2017. The black points indicate 2007 samples location. The blue diamonds indicate 2017 samples locations labelled as “SP-I”. Strata were determined based on Loubet et al. (2026).
Table A1Soil characteristics at BE-Lon across the vertical profile: carbonates (CaCO3), soil organic carbon content (SOC), organic matter (OM), nitrogen content (N), bulk density (BD), pH and granulometry. Samples were collected during the field campaign in 2017 following ICOS protocols.
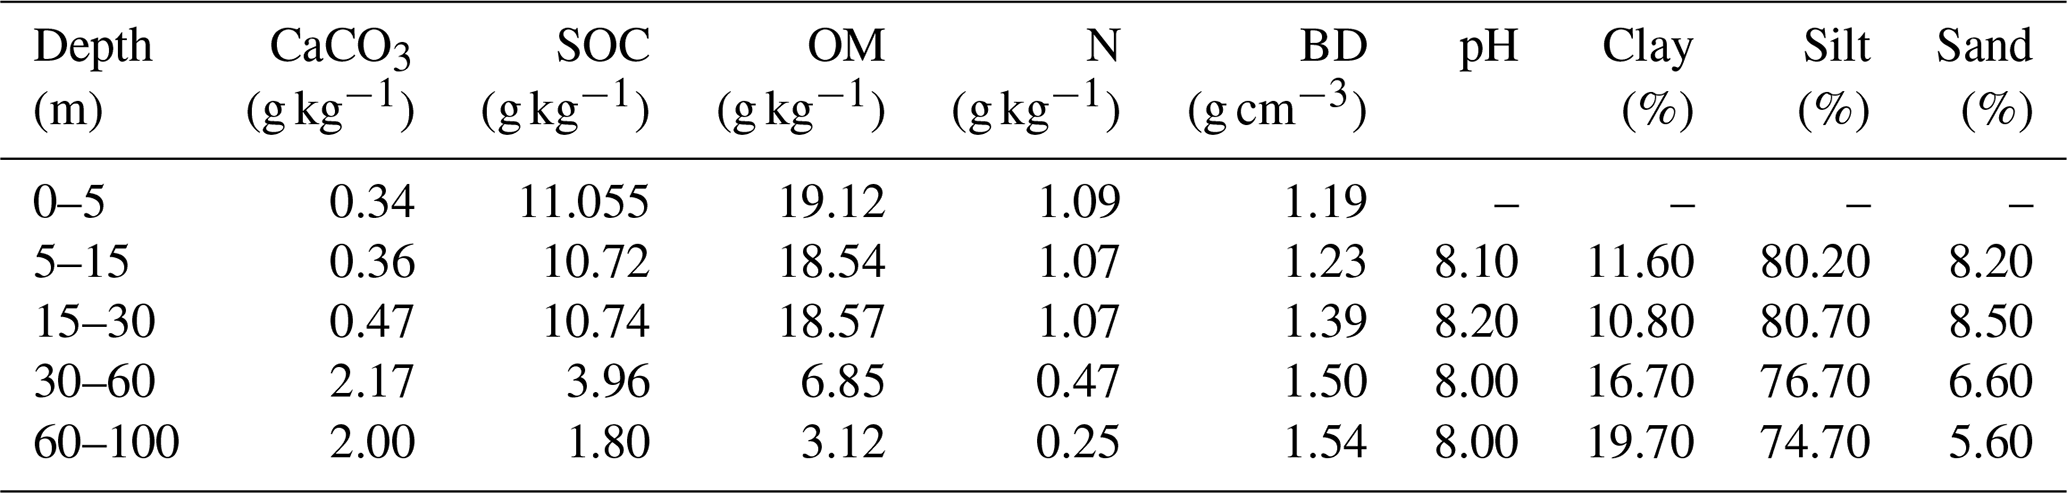
Table A2Seed density (SD), dry matter (DMH), carbon content ([C]H) of the harvested product and the corresponding export of carbon at harvest (Cexp) for the main crop periods. For abbreviations, WW: winter wheat, SP: seed potato, SB: sugar beet, MA: silage maize, GDB: green dwarf bean. All uncertainties are standard deviation.
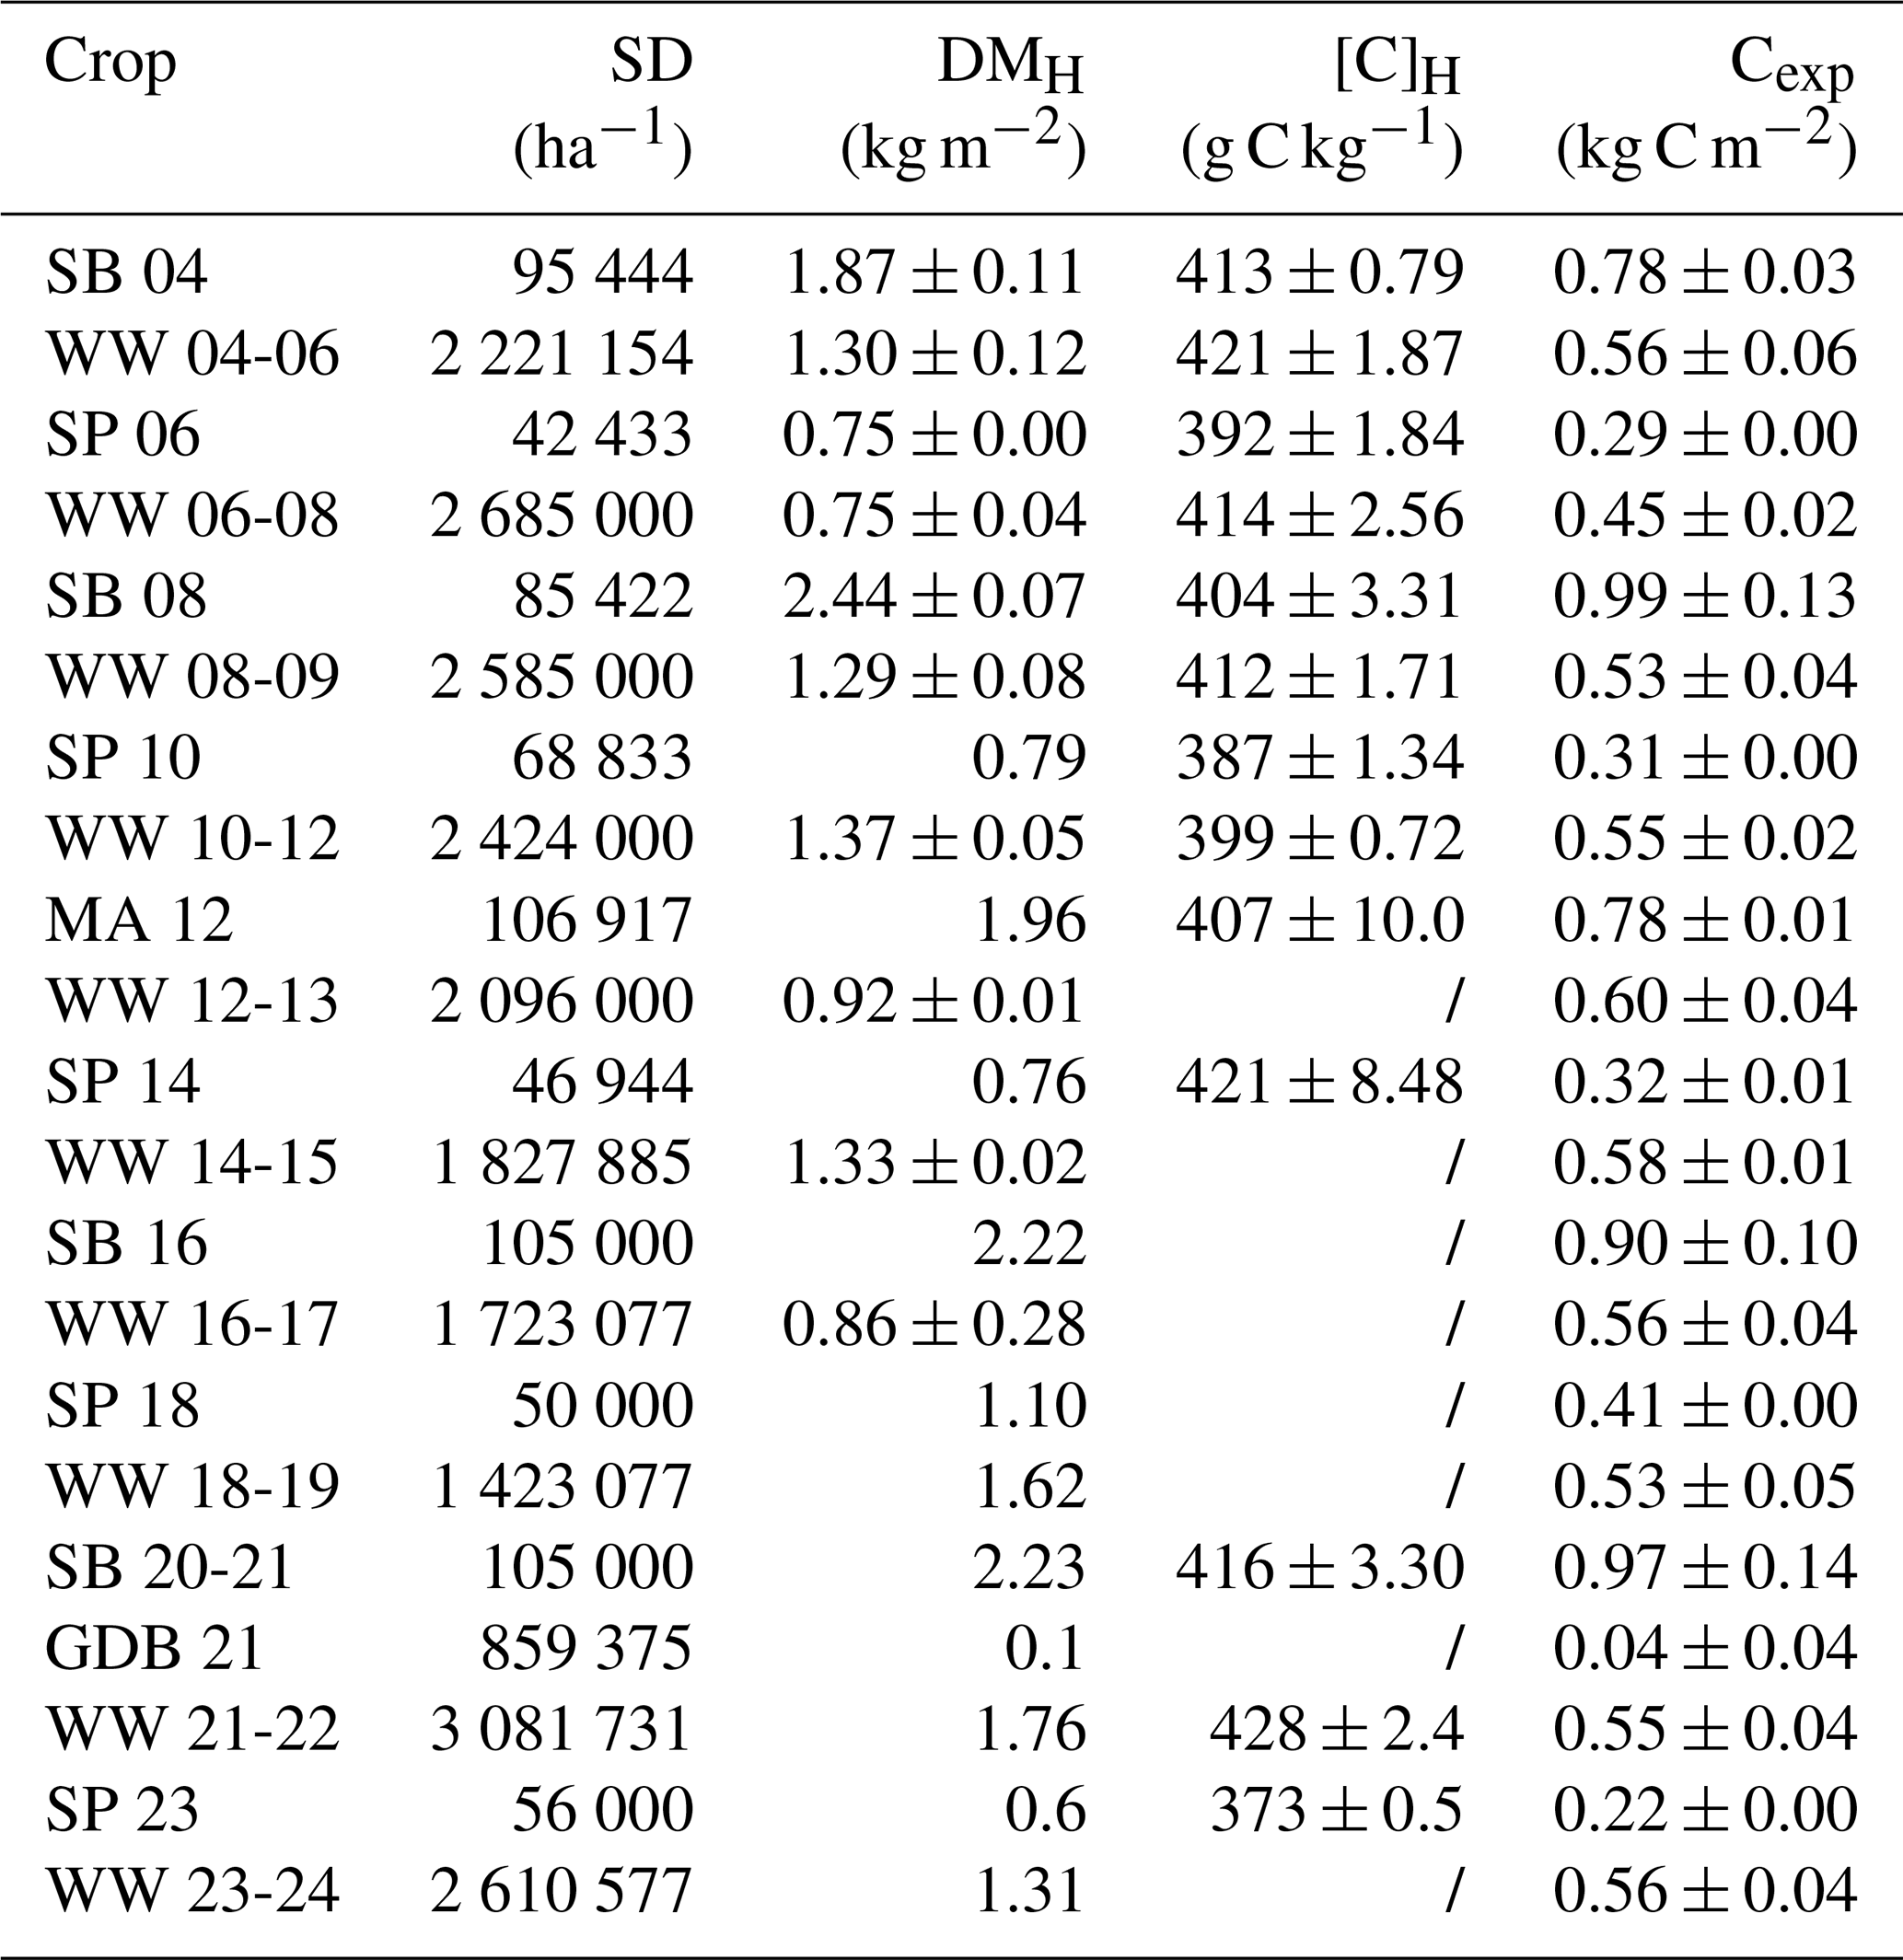
Table A3Cumulative values of net ecosystem exchange (NEE), imports of carbon (Cimp), exports of carbon at harvest (Cexp), net biome productivity (NBP) and aboveground crop residues at harvest (CR). Crops are mentioned with the corresponding year. All uncertainties are cumulative standard deviation. Bold text for Cimp highlights the application of farmyard manure. Crop-periods are defined as from sowing to sowing of the next crop. Abbreviations: WW, winter wheat; SP, seed potato; SB, sugar beet; CC, cover crop; MA, silage maize; GDB, green dwarf bean.
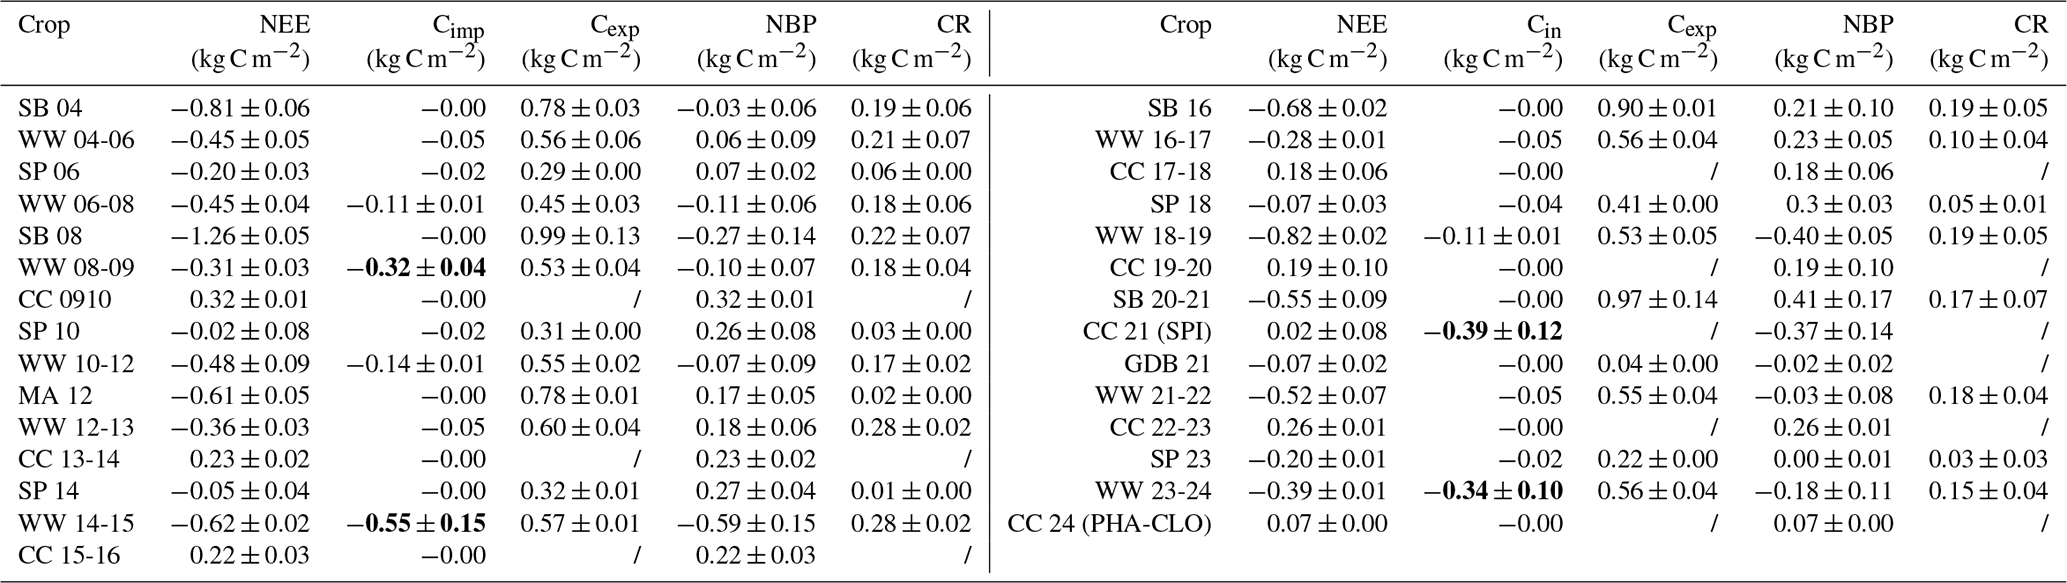
In this study, all eddy covariance-related and meteorological variables except CO2 fluxes are accessible on the ICOS Carbon Portal at https://hdl.handle.net/11676/1u2xQ5XcQoX0j2wJiZcyDP3M (Dumont et al., 2026a). Biomass data after 2017 are accessible on the ICOS Carbon Portal at https://hdl.handle.net/11676/99gAK7xqcSkk7SRKDwZz1KJT (Dumont et al., 2026b). Biomass data before 2017 and raw CO2 flux measurements over the 2004–2024 period were provided by the ICOS team of the Lonzée site and are accessible upon request. RothC is available in the SoilR package (v1.2; Sierra et al., 2012). FreqCor is a python tool to compare cospectral and spectral corrections and is available on Zenodo (v1.3; https://doi.org/10.5281/zenodo.22877082, Faurès and Heinesch, 2026). ReddyProc is available on Zenodo (v1.3.3; https://doi.org/10.5281/zenodo.10572005, Wutzler et al., 2024).
The supplement related to this article is available online at https://doi.org/10.5194/bg-23-7345-2026-supplement.
QB, BH, and BL (Bernard Longdoz) designed the study. BH developed the spectral correction procedure. QB processed the eddy covariance data and conducted the EC-based budget calculations, RothC simulations, and all corresponding uncertainty analyses. BW performed the comparison between soil inventories and the associated uncertainty analyses. YZ provided guidance for running RothC. QB wrote the manuscript. All co-authors contributed to the revision process and to improving the manuscript, with BH and BL (Bernard Longdoz) playing an active role in revising the early versions.
The contact author has declared that none of the authors has any competing interests.
Views and opinions expressed are however those of the author(s) only and do not necessarily reflect those of the European Union or European Research Executive Agency (REA). Neither the European Union nor the granting authority can be held responsible for them.
Publisher's note: Copernicus Publications remains neutral with regard to jurisdictional claims made in the text, published maps, institutional affiliations, or any other geographical representation in this paper. The authors bear the ultimate responsibility for providing appropriate place names. Views expressed in the text are those of the authors and do not necessarily reflect the views of the publisher.
The author(s) would like to thank the PI of the Lonzée site (Benjamin Dumont) for providing the data, and the ICOS team for their assistance on post-processing the data.
This paper is part of the MRV4SOC project funded by the European Union's Horizon Europe Research and Innovation Action program under Grant Agreement No. 101112754. Funded by the European Union. The Lonzée station research infrastructure is funded by the Service Public de Wallonie (Project ICOS – Wallonia, grant no. 1217769).
This paper was edited by Julia Drewer and reviewed by two anonymous referees.
Abramoff, R. Z., Guenet, B., Zhang, H., Georgiou, K., Xu, X., Viscarra Rossel, R. A., Yuan, W., and Ciais, P.: Improved global-scale predictions of soil carbon stocks with Millennial Version 2, Soil Biol. Biochem., 164, 108466, https://doi.org/10.1016/j.soilbio.2021.108466, 2022.
Alcántara, V., Don, A., Vesterdal, L., Well, R., and Nieder, R.: Stability of buried carbon in deep-ploughed forest and cropland soils – implications for carbon stocks, Sci. Rep., 7, 5511, https://doi.org/10.1038/s41598-017-05501-y, 2017.
Antosh, E., Idowu, J., Schutte, B., and Lehnhoff, E.: Winter cover crops effects on soil properties and sweet corn yield in semi-arid irrigated systems, Agron. J., 112, 92–106, https://doi.org/10.1002/agj2.20055, 2020.
Arrouays, D., Saby, N. P. A., Boukir, H., Jolivet, C., Ratié, C., Schrumpf, M., Merbold, L., Gielen, B., Gogo, S., Delpierre, N., Vincent, G., Klumpp, K., and Loustau, D.: Soil sampling and preparation for monitoring soil carbon, Int. Agrophys., 32, 633–643, https://doi.org/10.1515/intag-2017-0047, 2018.
Aubinet, M., Moureaux, C., Bodson, B., Dufranne, D., Heinesch, B., Suleau, M., Vancutsem, F., and Vilret, A.: Carbon sequestration by a crop over a 4-year sugar beet/winter wheat/seed potato/winter wheat rotation cycle, Agr. Forest Meteorol., 149, 407–418, https://doi.org/10.1016/j.agrformet.2008.09.003, 2009.
Aubinet, M., Vesala, T., and Papale, D. (Eds.): Eddy Covariance: A Practical Guide to Measurement and Data Analysis, Springer Netherlands, Dordrecht, https://doi.org/10.1007/978-94-007-2351-1, 2012.
Bai, X., Tang, J., Wang, W., Ma, J., Shi, J., and Ren, W.: Organic amendment effects on cropland soil organic carbon and its implications: A global synthesis, CATENA, 231, 107343, https://doi.org/10.1016/j.catena.2023.107343, 2023.
Baker, J. M. and Griffis, T. J.: Examining strategies to improve the carbon balance of corn/soybean agriculture using eddy covariance and mass balance techniques, Agr. Forest Meteorol., 128, 163–177, https://doi.org/10.1016/j.agrformet.2004.11.005, 2005.
Baldocchi, D.: Measuring fluxes of trace gases and energy between ecosystems and the atmosphere – the state and future of the eddy covariance method, Glob. Change Biol., 20, 3600–3609, https://doi.org/10.1111/gcb.12649, 2014.
Blanco-Canqui, H.: Cover crops and carbon sequestration: Lessons from U.S. studies, Soil Sci. Soc. Am. J., 86, 501–519, https://doi.org/10.1002/saj2.20378, 2022.
Bolinder, M. A., Janzen, H. H., Gregorich, E. G., Angers, D. A., and VandenBygaart, A. J.: An approach for estimating net primary productivity and annual carbon inputs to soil for common agricultural crops in Canada, Agr. Ecosyst. Environ., 118, 29–42, https://doi.org/10.1016/j.agee.2006.05.013, 2007.
Bolinder, M. A., Crotty, F., Elsen, A., Frac, M., Kismányoky, T., Lipiec, J., Tits, M., Tóth, Z., and Kätterer, T.: The effect of crop residues, cover crops, manures and nitrogen fertilization on soil organic carbon changes in agroecosystems: a synthesis of reviews, Mitig. Adapt. Strat. Gl., 25, 929–952, https://doi.org/10.1007/s11027-020-09916-3, 2020.
Breil, N. L., Lamaze, T., Bustillo, V., Marcato-Romain, C.-E., Coudert, B., Queguiner, S., and Jarosz-Pellé, N.: Combined impact of no-tillage and cover crops on soil carbon stocks and fluxes in maize crops, Soil Till. Res., 233, 105782, https://doi.org/10.1016/j.still.2023.105782, 2023.
Bruni, E., Chenu, C., Abramoff, R. Z., Baldoni, G., Barkusky, D., Clivot, H., Huang, Y., Kätterer, T., Pikuła, D., Spiegel, H., Virto, I., and Guenet, B.: Multi-modelling predictions show high uncertainty of required carbon input changes to reach a 4 ‰ target, Eur. J. Soil Sci., 73, e13330, https://doi.org/10.1111/ejss.13330, 2022.
Bruni, E., Lehtonen, A., Hashimoto, S., Ťupek, B., Bacha, N., Bunker, D., Brasselet-Darracq, I., Fages-Gouyou, D., Hemeray, Y., Reyer, C. P. O., Sierra, C. A., and Guenet, B.: me4soc: a multi-model ensemble interface for soil organic carbon predictions, Ecol. Model., 521, 111716, https://doi.org/10.1016/j.ecolmodel.2026.111716, 2026.
Buysse, P., Goffin, S., Carnol, M., Malchair, S., Debacq, A., Longdoz, B., and Aubinet, M.: Short-term temperature impact on soil heterotrophic respiration in limed agricultural soil samples, Biogeochemistry, 112, 441–455, https://doi.org/10.1007/s10533-012-9739-7, 2013.
Buysse, P., Bodson, B., Debacq, A., De Ligne, A., Heinesch, B., Manise, T., Moureaux, C., and Aubinet, M.: Carbon budget measurement over 12 years at a crop production site in the silty-loam region in Belgium, Agr. Forest Meteorol., 246, 241–255, https://doi.org/10.1016/j.agrformet.2017.07.004, 2017.
Cai, J., Liu, Y., Lei, T., and Pereira, L. S.: Estimating reference evapotranspiration with the FAO Penman–Monteith equation using daily weather forecast messages, Agr. Forest Meteorol., 145, 22–35, https://doi.org/10.1016/j.agrformet.2007.04.012, 2007.
Camino-Serrano, M., Guenet, B., Luyssaert, S., Ciais, P., Bastrikov, V., De Vos, B., Gielen, B., Gleixner, G., Jornet-Puig, A., Kaiser, K., Kothawala, D., Lauerwald, R., Peñuelas, J., Schrumpf, M., Vicca, S., Vuichard, N., Walmsley, D., and Janssens, I. A.: ORCHIDEE-SOM: modeling soil organic carbon (SOC) and dissolved organic carbon (DOC) dynamics along vertical soil profiles in Europe, Geosci. Model Dev., 11, 937–957, https://doi.org/10.5194/gmd-11-937-2018, 2018.
Carter, M. R., Angers, D. A., Gregorich, E. G., and Bolinder, M. A.: Characterizing organic matter retention for surface soils in eastern Canada using density and particle size fractions, Can. J. Soil. Sci., 83, 11–23, https://doi.org/10.4141/S01-087, 2003.
Ceschia, E., Béziat, P., Dejoux, J. F., Aubinet, M., Bernhofer, Ch., Bodson, B., Buchmann, N., Carrara, A., Cellier, P., Di Tommasi, P., Elbers, J. A., Eugster, W., Grünwald, T., Jacobs, C. M. J., Jans, W. W. P., Jones, M., Kutsch, W., Lanigan, G., Magliulo, E., Marloie, O., Moors, E. J., Moureaux, C., Olioso, A., Osborne, B., Sanz, M. J., Saunders, M., Smith, P., Soegaard, H., and Wattenbach, M.: Management effects on net ecosystem carbon and GHG budgets at European crop sites, Agr. Ecosyst. Environ., 139, 363–383, https://doi.org/10.1016/j.agee.2010.09.020, 2010.
Chenu, C., Angers, D. A., Barré, P., Derrien, D., Arrouays, D., and Balesdent, J.: Increasing organic stocks in agricultural soils: Knowledge gaps and potential innovations, Soil Till. Res., 188, 41–52, https://doi.org/10.1016/j.still.2018.04.011, 2019.
Clark, D. B., Mercado, L. M., Sitch, S., Jones, C. D., Gedney, N., Best, M. J., Pryor, M., Rooney, G. G., Essery, R. L. H., Blyth, E., Boucher, O., Harding, R. J., Huntingford, C., and Cox, P. M.: The Joint UK Land Environment Simulator (JULES), model description – Part 2: Carbon fluxes and vegetation dynamics, Geosci. Model Dev., 4, 701–722, https://doi.org/10.5194/gmd-4-701-2011, 2011.
Coleman, K. and Jenkinson, D. S.: RothC-26.3 - A Model for the turnover of carbon in soil, in: Evaluation of Soil Organic Matter Models, edited by: Powlson, D. S., Smith, P., and Smith, J. U., Springer Berlin Heidelberg, Berlin, Heidelberg, 237–246, https://doi.org/10.1007/978-3-642-61094-3_17, 1996.
Cotrufo, M. F., Ranalli, M. G., Haddix, M. L., Six, J., and Lugato, E.: Soil carbon storage informed by particulate and mineral-associated organic matter, Nat. Geosci., 12, 989–994, https://doi.org/10.1038/s41561-019-0484-6, 2019.
Dechow, R., Franko, U., Kätterer, T., and Kolbe, H.: Evaluation of the RothC model as a prognostic tool for the prediction of SOC trends in response to management practices on arable land, Geoderma, 337, 463–478, https://doi.org/10.1016/j.geoderma.2018.10.001, 2019.
Delhez, L., Dumont, B., and Longdoz, B.: Leveraging temporal variability in global sensitivity analysis of the Daisy soil-plant-atmosphere model, Eur. J. Agron., 165, 127533, https://doi.org/10.1016/j.eja.2025.127533, 2025.
Du, Q., Liu, H., Feng, J., and Wang, L.: Effects of different gap filling methods and land surface energy balance closure on annual net ecosystem exchange in a semiarid area of China, Sci. China Earth Sci., 57, 1340–1351, https://doi.org/10.1007/s11430-013-4756-5, 2014.
Dumont, B., Heinesch, B., Bodson, B., Bogaerts, G., Chopin, H., De Ligne, A., Demoulin, L., Douxfils, B., Engelmann, T., Faurès, A., Longdoz, B., Manise, T., Orgun, A., Piret, A., and Thyrion, T.: Fluxnet Archive Product from Lonzee, 2004–2024, FLUXNET [data set], https://hdl.handle.net/11676/1u2xQ5XcQoX0j2wJiZcyDP3M (last access: 1 May 2026), 2026a.
Dumont, B., Heinesch, B., Bodson, B., Bogaerts, G., Chopin, H., Clément, T., De Ligne, A., Demoulin, L., Douxfils, B., Engelmann, T., Faurès, A., Longdoz, B., Manise, T., Orgun, A., Piret, A., and Thyrion, T.: ETC L2 ARCHIVE from Lonzee, 2017–2025, ICOS RI [data set], https://hdl.handle.net/11676/99gAK7xqcSkk7SRKDwZz1KJT (last access: 1 May 2026), 2026b.
Durand, P.: A Possible Reconciliation between Eddy Covariance Fluxes and Surface Energy Balance Closure, Atmosphere, 13, 1965, https://doi.org/10.3390/atmos13121965, 2022.
Emmel, C., Winkler, A., Hörtnagl, L., Revill, A., Ammann, C., D'Odorico, P., Buchmann, N., and Eugster, W.: Integrated management of a Swiss cropland is not sufficient to preserve its soil carbon pool in the long term, Biogeosciences, 15, 5377–5393, https://doi.org/10.5194/bg-15-5377-2018, 2018.
European Commission, Directorate-General for Environment: Nitrates Directive 91/676/EEC – Status and trends of aquatic environment and agricultural practice: development guide for Member States' reports, https://op.europa.eu/s/Aldi (last access: 12 February 2025), 2000.
Falloon, P., Smith, P., Coleman, K., and Marshall, S.: Estimating the size of the inert organic matter pool from total soil organic carbon content for use in the Rothamsted carbon model, Soil Biol. Biochem., 30, 1207–1211, https://doi.org/10.1016/S0038-0717(97)00256-3, 1998.
Farina, R., Sándor, R., Abdalla, M., Álvaro-Fuentes, J., Bechini, L., Bolinder, M. A., Brilli, L., Chenu, C., Clivot, H., De Antoni Migliorati, M., Di Bene, C., Dorich, C. D., Ehrhardt, F., Ferchaud, F., Fitton, N., Francaviglia, R., Franko, U., Giltrap, D. L., Grant, B. B., Guenet, B., Harrison, M. T., Kirschbaum, M. U. F., Kuka, K., Kulmala, L., Liski, J., McGrath, M. J., Meier, E., Menichetti, L., Moyano, F., Nendel, C., Recous, S., Reibold, N., Shepherd, A., Smith, W. N., Smith, P., Soussana, J., Stella, T., Taghizadeh-Toosi, A., Tsutskikh, E., and Bellocchi, G.: Ensemble modelling, uncertainty and robust predictions of organic carbon in long-term bare-fallow soils, Glob. Change Biol., 27, 904–928, https://doi.org/10.1111/gcb.15441, 2021.
Faurès, A. and Heinesch, B.: FreqCor, Version v1.3, Zenodo [code], https://doi.org/10.5281/zenodo.22877082, 2026.
Faurès, A., Fratini, G., Nicolini, G., Papale, D., Sabbatini, S., and Heinesch, B.: Spectral versus co-spectral correction of eddy-covariance fluxes: a multi-site assessment across the ICOS network, Atmos. Meas. Tech., 19, 6037–6074, https://doi.org/10.5194/amt-19-6037-2026, 2026.
Ferchaud, F., Chlebowski, F., and Mary, B.: SimpleESM: R script to calculate soil organic carbon and nitrogen stocks at equivalent soil mass, Institut National de Recherche pour l'Agriculture, l'Alimentation et l'Environnement (INRAE), https://hal.science/hal-04013158 (last access: 4 April 2026), 2023.
Filip, I. D., Peri, P. L., Banegas, N., Nasca, J., Sacido, M., Faverin, C., and Vibart, R.: Predicting Soil Organic Carbon Stocks Under Native Forests and Grasslands in the Dry Chaco Region of Argentina, Sustainability, 17, 5012, https://doi.org/10.3390/su17115012, 2025.
Foken, T.: The Energy Balance Closure Problem: An Overview, Ecol. Appl., 18, 1351–1367, https://doi.org/10.1890/06-0922.1, 2008.
Foken, T., Aubinet, M., Finnigan, J. J., Leclerc, M. Y., Mauder, M., and Paw U, K. T.: Results Of A Panel Discussion About The Energy Balance Closure Correction For Trace Gases, B. Am. Meteorol. Soc., 92, ES13–ES18, https://doi.org/10.1175/2011BAMS3130.1, 2011.
Forrester, D. I., England, J. R., Paul, K. I., Rosauer, D. F., and Roxburgh, S. H.: Modelling carbon flows from live biomass to soils using the full Carbon Accounting Model (FullCAM), Environ. Modell. Softw., 177, 106064, https://doi.org/10.1016/j.envsoft.2024.106064, 2024.
Frasier, I., Noellemeyer, E., Fernández, R., and Quiroga, A.: Direct field method for root biomass quantification in agroecosystems, MethodsX, 3, 513–519, https://doi.org/10.1016/j.mex.2016.08.002, 2016.
Friedlingstein, P., O'Sullivan, M., Jones, M. W., Andrew, R. M., Gregor, L., Hauck, J., Le Quéré, C., Luijkx, I. T., Olsen, A., Peters, G. P., Peters, W., Pongratz, J., Schwingshackl, C., Sitch, S., Canadell, J. G., Ciais, P., Jackson, R. B., Alin, S. R., Alkama, R., Arneth, A., Arora, V. K., Bates, N. R., Becker, M., Bellouin, N., Bittig, H. C., Bopp, L., Chevallier, F., Chini, L. P., Cronin, M., Evans, W., Falk, S., Feely, R. A., Gasser, T., Gehlen, M., Gkritzalis, T., Gloege, L., Grassi, G., Gruber, N., Gürses, Ö., Harris, I., Hefner, M., Houghton, R. A., Hurtt, G. C., Iida, Y., Ilyina, T., Jain, A. K., Jersild, A., Kadono, K., Kato, E., Kennedy, D., Klein Goldewijk, K., Knauer, J., Korsbakken, J. I., Landschützer, P., Lefèvre, N., Lindsay, K., Liu, J., Liu, Z., Marland, G., Mayot, N., McGrath, M. J., Metzl, N., Monacci, N. M., Munro, D. R., Nakaoka, S.-I., Niwa, Y., O'Brien, K., Ono, T., Palmer, P. I., Pan, N., Pierrot, D., Pocock, K., Poulter, B., Resplandy, L., Robertson, E., Rödenbeck, C., Rodriguez, C., Rosan, T. M., Schwinger, J., Séférian, R., Shutler, J. D., Skjelvan, I., Steinhoff, T., Sun, Q., Sutton, A. J., Sweeney, C., Takao, S., Tanhua, T., Tans, P. P., Tian, X., Tian, H., Tilbrook, B., Tsujino, H., Tubiello, F., van der Werf, G. R., Walker, A. P., Wanninkhof, R., Whitehead, C., Willstrand Wranne, A., Wright, R., Yuan, W., Yue, C., Yue, X., Zaehle, S., Zeng, J., and Zheng, B.: Global Carbon Budget 2022, Earth Syst. Sci. Data, 14, 4811–4900, https://doi.org/10.5194/essd-14-4811-2022, 2022.
Fuss, S., Lamb, W. F., Callaghan, M. W., Hilaire, J., Creutzig, F., Amann, T., Beringer, T., De Oliveira Garcia, W., Hartmann, J., Khanna, T., Luderer, G., Nemet, G. F., Rogelj, J., Smith, P., Vicente, J. L. V., Wilcox, J., Del Mar Zamora Dominguez, M., and Minx, J. C.: Negative emissions–Part 2: Costs, potentials and side effects, Environ. Res. Lett., 13, 063002, https://doi.org/10.1088/1748-9326/aabf9f, 2018.
Gao, Z., Liu, H., Missik, J. E. C., Yao, J., Huang, M., Chen, X., Arntzen, E., and Mcfarland, D. P.: Mechanistic links between underestimated CO2 fluxes and non-closure of the surface energy balance in a semi-arid sagebrush ecosystem, Environ. Res. Lett., 14, 044016, https://doi.org/10.1088/1748-9326/ab082d, 2019.
Georgiou, K., Jackson, R. B., Vindušková, O., Abramoff, R. Z., Ahlström, A., Feng, W., Harden, J. W., Pellegrini, A. F. A., Polley, H. W., Soong, J. L., Riley, W. J., and Torn, M. S.: Global stocks and capacity of mineral-associated soil organic carbon, Nat. Commun., 13, 3797, https://doi.org/10.1038/s41467-022-31540-9, 2022.
Geremew, B., Tadesse, T., Bedadi, B., Gollany, H. T., Tesfaye, K., Aschalew, A., Tilaye, A., and Abera, W.: Evaluation of RothC model for predicting soil organic carbon stock in north-west Ethiopia, Environmental Challenges, 15, 100909, https://doi.org/10.1016/j.envc.2024.100909, 2024.
Giannini-Kurina, F., Serra, J., Christensen, B. T., Eriksen, J., Hutchings, N. J., Olesen, J. E., and Jensen, J. L.: Modelling and validating soil carbon dynamics at the long-term plot scale using the rCTOOL R package, Environ. Modell. Softw., 183, 106229, https://doi.org/10.1016/j.envsoft.2024.106229, 2025.
Gielen, B., Acosta, M., Altimir, N., Buchmann, N., Cescatti, A., Ceschia, E., Fleck, S., Hörtnagl, L., Klumpp, K., Kolari, P., Lohila, A., Loustau, D., Marańon-Jimenez, S., Manise, T., Matteucci, G., Merbold, L., Metzger, C., Moureaux, C., Montagnani, L., Nilsson, M. B., Osborne, B., Papale, D., Pavelka, M., Saunders, M., Simioni, G., Soudani, K., Sonnentag, O., Tallec, T., Tuittila, E.-S., Peichl, M., Pokorny, R., Vincke, C., and Wohlfahrt, G.: Ancillary vegetation measurements at ICOS ecosystem stations, Int. Agrophys., 32, 645–664, https://doi.org/10.1515/intag-2017-0048, 2018.
Goidts, E. and Van Wesemael, B.: Regional assessment of soil organic carbon changes under agriculture in Southern Belgium (1955–2005), Geoderma, 141, 341–354, https://doi.org/10.1016/j.geoderma.2007.06.013, 2007.
Goidts, E., Van Wesemael, B., and Crucifix, M.: Magnitude and sources of uncertainties in soil organic carbon (SOC) stock assessments at various scales, Eur. J. Soil Sci., 60, 723–739, https://doi.org/10.1111/j.1365-2389.2009.01157.x, 2009.
Gommet, C., Lauerwald, R., Ciais, P., Guenet, B., Zhang, H., and Regnier, P.: Spatiotemporal patterns and drivers of terrestrial dissolved organic carbon (DOC) leaching into the European river network, Earth Syst. Dynam., 13, 393–418, https://doi.org/10.5194/esd-13-393-2022, 2022.
Gross, A. and Glaser, B.: Meta-analysis on how manure application changes soil organic carbon storage, Sci. Rep., 11, 5516, https://doi.org/10.1038/s41598-021-82739-7, 2021.
Guenet, B., Gabrielle, B., Chenu, C., Arrouays, D., Balesdent, J., Bernoux, M., Bruni, E., Caliman, J., Cardinael, R., Chen, S., Ciais, P., Desbois, D., Fouche, J., Frank, S., Henault, C., Lugato, E., Naipal, V., Nesme, T., Obersteiner, M., Pellerin, S., Powlson, D. S., Rasse, D. P., Rees, F., Soussana, J., Su, Y., Tian, H., Valin, H., and Zhou, F.: Can N2O emissions offset the benefits from soil organic carbon storage?, Glob. Change Biol., 27, 237–256, https://doi.org/10.1111/gcb.15342, 2021.
Gutierrez, S., Grados, D., Møller, A. B., De Carvalho Gomes, L., Beucher, A. M., Giannini-Kurina, F., De Jonge, L. W., and Greve, M. H.: Unleashing the sequestration potential of soil organic carbon under climate and land use change scenarios in Danish agroecosystems, Sci. Total Environ., 905, 166921, https://doi.org/10.1016/j.scitotenv.2023.166921, 2023.
Hararuk, O., Xia, J., and Luo, Y.: Evaluation and improvement of a global land model against soil carbon data using a Bayesian Markov chain Monte Carlo method, J. Geophys. Res.-Biogeo., 119, 403–417, https://doi.org/10.1002/2013JG002535, 2014.
Hedges, L. V.: Distribution Theory for Glass's Estimator of Effect Size and Related Estimators, J. Educ. Stat., 6, 107, https://doi.org/10.2307/1164588, 1981.
Heimbach, U.: Variability of thousand grain weights of seed batches of important arable and some horticultural crops, Journal of Cultivated Plants, 70, 250–254, https://doi.org/10.5073/JFK.2018.08.03, 2018.
Hemes, K. S., Runkle, B. R. K., Novick, K. A., Baldocchi, D. D., and Field, C. B.: An Ecosystem-Scale Flux Measurement Strategy to Assess Natural Climate Solutions, Environ. Sci. Technol., 55, 3494–3504, https://doi.org/10.1021/acs.est.0c06421, 2021.
Hollinger, D. Y. and Richardson, A. D.: Uncertainty in eddy covariance measurements and its application to physiological models, Tree Physiol., 25, 873–885, https://doi.org/10.1093/treephys/25.7.873, 2005.
Ibrom, A., Dellwik, E., Larsen, S. E., and Pilegaard, K.: On the use of the Webb–Pearman–Leuning theory for closed-path eddy correlation measurements, Tellus B, 59, 937, https://doi.org/10.1111/j.1600-0889.2007.00311.x, 2007.
Ingwersen, J., Poyda, A., Kremer, P., and Streck, T.: Harvest residues: A relevant term in the carbon balance of croplands?, Agr. Forest Meteorol., 349, 109935, https://doi.org/10.1016/j.agrformet.2024.109935, 2024.
Janssens, I. A., Freibauer, A., Ciais, P., Smith, P., Nabuurs, G.-J., Folberth, G., Schlamadinger, B., Hutjes, R. W. A., Ceulemans, R., Schulze, E.-D., Valentini, R., and Dolman, A. J.: Europe's Terrestrial Biosphere Absorbs 7 % to 12 % of European Anthropogenic CO2 Emissions, Science, 300, 1538–1542, https://doi.org/10.1126/science.1083592, 2003.
Jensen, J. L., Eriksen, J., Thomsen, I. K., Munkholm, L. J., and Christensen, B. T.: Cereal straw incorporation and ryegrass cover crops: The path to equilibrium in soil carbon storage is short, Eur. J. Soil Sci., 73, e13173, https://doi.org/10.1111/ejss.13173, 2022.
Jones, D. L., Cooledge, E. C., Alston, D., and Chadwick, D. R.: Agricultural management strategies to actively promote subsoil carbon storage, Soil Till. Res., 256, 106846, https://doi.org/10.1016/j.still.2025.106846, 2026.
Joona, J., Liski, E., and Kahiluoto, H.: Manure increases soil organic carbon most when allocated to annual cropping, CATENA, 238, 107844, https://doi.org/10.1016/j.catena.2024.107844, 2024.
Jordon, M. W. and Smith, P.: Modelling soil carbon stocks following reduced tillage intensity: A framework to estimate decomposition rate constant modifiers for RothC-26.3, demonstrated in north-west Europe, Soil Till. Res., 222, 105428, https://doi.org/10.1016/j.still.2022.105428, 2022.
Kätterer, T., Börjesson, G., and Kirchmann, H.: Changes in organic carbon in topsoil and subsoil and microbial community composition caused by repeated additions of organic amendments and N fertilisation in a long-term field experiment in Sweden, Agr. Ecosyst. Environ., 189, 110–118, https://doi.org/10.1016/j.agee.2014.03.025, 2014.
Keel, S. G., Leifeld, J., Mayer, J., Taghizadeh-Toosi, A., and Olesen, J. E.: Large uncertainty in soil carbon modelling related to method of calculation of plant carbon input in agricultural systems, Eur. J. Soil Sci., 68, 953–963, https://doi.org/10.1111/ejss.12454, 2017.
Khan, Md. Z., Chabbi, A., Hicks Pries, C. E., Torn, M. S., and Rumpel, C.: Management impacts on whole soil warming responses of CO2 production and efflux in temperate climate, Geoderma, 440, 116725, https://doi.org/10.1016/j.geoderma.2023.116725, 2023.
Kindler, R., Siemens, J., Kaiser, K., Walmsley, D. C., Bernhofer, C., Buchmann, N., Cellier, P., Eugster, W., Gleixner, G., Grũnwald, T., Heim, A., Ibrom, A., Jones, S. K., Jones, M., Klumpp, K., Kutsch, W., Larsen, K. S., Lehuger, S., Loubet, B., Mckenzie, R., Moors, E., Osborne, B., Pilegaard, K., Rebmann, C., Saunders, M., Schmidt, M. W. I., Schrumpf, M., Seyfferth, J., Skiba, U., Soussana, J., Sutton, M. A., Tefs, C., Vowinckel, B., Zeeman, M. J., and Kaupenjohann, M.: Dissolved carbon leaching from soil is a crucial component of the net ecosystem carbon balance, Glob. Change Biol., 17, 1167–1185, https://doi.org/10.1111/j.1365-2486.2010.02282.x, 2011.
Kirby, K. N. and Gerlanc, D.: BootES: An R package for bootstrap confidence intervals on effect sizes, Behav. Res., 45, 905–927, https://doi.org/10.3758/s13428-013-0330-5, 2013.
Köchy, M., Hiederer, R., and Freibauer, A.: Global distribution of soil organic carbon – Part 1: Masses and frequency distributions of SOC stocks for the tropics, permafrost regions, wetlands, and the world, SOIL, 1, 351–365, https://doi.org/10.5194/soil-1-351-2015, 2015.
Koga, N.: Tillage, fertilizer type, and plant residue input impacts on soil carbon sequestration rates on a Japanese Andosol, Soil Sci. Plant Nutr., 63, 396–404, https://doi.org/10.1080/00380768.2017.1355725, 2017.
Ku, H. H.: Notes on the use of propagation of error formulas, National Bureau of Standards, Gaithersburg, MD, USA, https://doi.org/10.6028/NBS.RPT.9011, 1965.
Kutsch, W. L., Aubinet, M., Buchmann, N., Smith, P., Osborne, B., Eugster, W., Wattenbach, M., Schrumpf, M., Schulze, E. D., Tomelleri, E., Ceschia, E., Bernhofer, C., Béziat, P., Carrara, A., Di Tommasi, P., Grünwald, T., Jones, M., Magliulo, V., Marloie, O., Moureaux, C., Olioso, A., Sanz, M. J., Saunders, M., Søgaard, H., and Ziegler, W.: The net biome production of full crop rotations in Europe, Agr. Ecosyst. Environ., 139, 336–345, https://doi.org/10.1016/j.agee.2010.07.016, 2010.
Lal, R.: Soil organic matter and water retention, Agron. J., 112, 3265–3277, https://doi.org/10.1002/agj2.20282, 2020.
Lavallee, J. M., Soong, J. L., and Cotrufo, M. F.: Conceptualizing soil organic matter into particulate and mineral-associated forms to address global change in the 21st century, Glob. Change Biol., 26, 261–273, https://doi.org/10.1111/gcb.14859, 2020.
Lee, J., Hopmans, J. W., Rolston, D. E., Baer, S. G., and Six, J.: Determining soil carbon stock changes: Simple bulk density corrections fail, Agr. Ecosyst. Environ., 134, 251–256, https://doi.org/10.1016/j.agee.2009.07.006, 2009.
Lehmann, J. and Kleber, M.: The contentious nature of soil organic matter, Nature, 528, 60–68, https://doi.org/10.1038/nature16069, 2015.
Li, L., Hong, M., Zhang, Y., and Paustian, K.: Soil N2 O emissions from specialty crop systems: A global estimation and meta-analysis, Glob. Change Biol., 30, e17233, https://doi.org/10.1111/gcb.17233, 2024.
Liang, S., Sun, N., Wang, S., Colinet, G., Longdoz, B., Meersmans, J., Wu, L., and Xu, M.: Manure amendment acts as a recommended fertilization for improving carbon sequestration efficiency in soils of typical drylands of China, Frontiers in Environmental Science, 11, https://doi.org/10.3389/fenvs.2023.1173509, 2023.
Loubet, B., Laville, P., Lehuger, S., Larmanou, E., Fléchard, C., Mascher, N., Genermont, S., Roche, R., Ferrara, R. M., Stella, P., Personne, E., Durand, B., Decuq, C., Flura, D., Masson, S., Fanucci, O., Rampon, J.-N., Siemens, J., Kindler, R., Gabrielle, B., Schrumpf, M., and Cellier, P.: Carbon, nitrogen and Greenhouse gases budgets over a four years crop rotation in northern France, Plant Soil, 343, 109–137, https://doi.org/10.1007/s11104-011-0751-9, 2011.
Loubet, B., Saby, N. P. A., Winck, B., Gebleh, M., Buysse, P., Chenu, J.-P., Ratié, C., Jolivet, C., Kalalian, C., Levavasseur, F., Munera-Echeverri, J.-L., Lafont, S., Loustau, D., Papale, D., Nicolini, G., and Arrouays, D.: Carbon soil stock change in an intensive crop field near Paris reveals significant carbon losses over a decade, Biogeosciences, 23, 2059–2077, https://doi.org/10.5194/bg-23-2059-2026, 2026.
Loustau, D., Jolivet, C., Lafont, S., Loubet, B., Klumpp, K., Papale, D., and Arrouays, D.: ICOS Ecosystem Instructions for Soil Samples Collection and Preparation, Version 20230727, ICOS Ecosystem Thematic Centre, https://doi.org/10.18160/k3yc-td6h, 2017.
Ma, S., He, F., Tian, D., Zou, D., Yan, Z., Yang, Y., Zhou, T., Huang, K., Shen, H., and Fang, J.: Variations and determinants of carbon content in plants: a global synthesis, Biogeosciences, 15, 693–702, https://doi.org/10.5194/bg-15-693-2018, 2018.
Maenhout, P., Di Bene, C., Cayuela, M. L., Diaz-Pines, E., Govednik, A., Keuper, F., Mavsar, S., Mihelic, R., O'Toole, A., Schwarzmann, A., Suhadolc, M., Syp, A., and Valkama, E.: Trade-offs and synergies of soil carbon sequestration: Addressing knowledge gaps related to soil management strategies, Eur. J. Soil Sci., 75, e13515, https://doi.org/10.1111/ejss.13515, 2024.
Maillard, É. and Angers, D. A.: Animal manure application and soil organic carbon stocks: a meta-analysis, Glob. Change Biol., 20, 666–679, https://doi.org/10.1111/gcb.12438, 2014.
Manninen, N., Soinne, H., Lemola, R., Hoikkala, L., and Turtola, E.: Effects of agricultural land use on dissolved organic carbon and nitrogen in surface runoff and subsurface drainage, Sci. Total Environ., 618, 1519–1528, https://doi.org/10.1016/j.scitotenv.2017.09.319, 2018.
Mantel, S., Dondeyne, S., and Deckers, S.: World reference base for soil resources (WRB), in: Encyclopedia of Soils in the Environment, Elsevier, 206–217, https://doi.org/10.1016/B978-0-12-822974-3.00161-0, 2023.
Mauder, M., Foken, T., and Cuxart, J.: Surface-Energy-Balance Closure over Land: A Review, Bound.-Lay. Meteorol., 177, 395–426, https://doi.org/10.1007/s10546-020-00529-6, 2020.
Mauder, M., Jung, M., Stoy, P., Nelson, J., and Wanner, L.: Energy balance closure at FLUXNET sites revisited, Agr. Forest Meteorol., 358, 110235, https://doi.org/10.1016/j.agrformet.2024.110235, 2024.
McClelland, S. C., Paustian, K., and Schipanski, M. E.: Management of cover crops in temperate climates influences soil organic carbon stocks: a meta-analysis, Ecol. Appl., 31, e02278, https://doi.org/10.1002/eap.2278, 2021.
Meersmans, J., Van Wesemael, B., Goidts, E., Van Molle, M., De Baets, S., and De Ridder, F.: Spatial analysis of soil organic carbon evolution in Belgian croplands and grasslands, 1960–2006, Glob. Change Biol., 17, 466–479, https://doi.org/10.1111/j.1365-2486.2010.02183.x, 2011.
MicroStep-MIS: TRwS214/514/215/415 Total Rain Weighing Sensor, product data sheet, MicroStep-MIS, Bratislava, Slovakia, https://www.microstep-mis.com/drupal/web/sites/default/files/datasheets/Total%20Rain%20weighing%20Sensor_product%20sheet.pdf (last access: 8 October 2026), 2026.
Mondini, C., Cayuela, M. L., Sinicco, T., Fornasier, F., Galvez, A., and Sánchez-Monedero, M. A.: Modification of the RothC model to simulate soil C mineralization of exogenous organic matter, Biogeosciences, 14, 3253–3274, https://doi.org/10.5194/bg-14-3253-2017, 2017.
Morais, T. G., Teixeira, R. F. M., and Domingos, T.: Detailed global modelling of soil organic carbon in cropland, grassland and forest soils, PLoS ONE, 14, e0222604, https://doi.org/10.1371/journal.pone.0222604, 2019.
Muhammed, S. E., Coleman, K., Wu, L., Bell, V. A., Davies, J. A. C., Quinton, J. N., Carnell, E. J., Tomlinson, S. J., Dore, A. J., Dragosits, U., Naden, P. S., Glendining, M. J., Tipping, E., and Whitmore, A. P.: Impact of two centuries of intensive agriculture on soil carbon, nitrogen and phosphorus cycling in the UK, Sci. Total Environ., 634, 1486–1504, https://doi.org/10.1016/j.scitotenv.2018.03.378, 2018.
Nakhavali, M., Friedlingstein, P., Lauerwald, R., Tang, J., Chadburn, S., Camino-Serrano, M., Guenet, B., Harper, A., Walmsley, D., Peichl, M., and Gielen, B.: Representation of dissolved organic carbon in the JULES land surface model (vn4.4_JULES-DOCM), Geosci. Model Dev., 11, 593–609, https://doi.org/10.5194/gmd-11-593-2018, 2018.
Nakhavali, M., Lauerwald, R., Regnier, P., Guenet, B., Chadburn, S., and Friedlingstein, P.: Leaching of dissolved organic carbon from mineral soils plays a significant role in the terrestrial carbon balance, Glob. Change Biol., 27, 1083–1096, https://doi.org/10.1111/gcb.15460, 2021.
Nakhavali, M., Lauerwald, R., Regnier, P., and Friedlingstein, P.: Historical trends and drivers of the laterally transported terrestrial dissolved organic carbon to river systems, Sci. Total Environ., 917, 170560, https://doi.org/10.1016/j.scitotenv.2024.170560, 2024.
Nicolini, G., Durden, D., Di Fiore, L., Florian, C., Sabbatini, S., Gielen, B., Iserbyt, A., Loubet, B., Mammarella, I., Mariotti, A., Op De Beeck, M., Slemmons, C., Trotta, C., Young, A., Chabbi, A., Feigenwinter, I., Heinesch, B., Kowalska, N., Mauder, M., Šigut, L., Van Der Molen, M., Bastos Campos, F., Berveiller, D., Brümmer, C., Cuntz, M., Domec, J., Dumont, B., Fares, S., Gianelle, D., Jensen, R., Kalalian, C., Kljun, N., Lange, H., Limousin, J., Lundin, E., Manco, A., Montagnani, L., Nemitz, E., Peichl, M., Rinne, E., Roland, M., Schmidt, M., Simioni, G., Thomas, A., Vincke, C., and Papale, D.: Bridging the Energy Balance Gap in Eddy-Covariance Measurements: Insights From Standardized Network Data, Glob. Change Biol., 32, e70892, https://doi.org/10.1111/gcb.70892, 2026.
Noordwijk, M. V., Floris, J., and Jager, A. D.: Sampling schemes for estimating root density distribution in cropped fields, NJAS, 33, 241–261, https://doi.org/10.18174/njas.v33i3.16839, 1985.
Oncley, S. P., Foken, T., Vogt, R., Kohsiek, W., DeBruin, H. A. R., Bernhofer, C., Christen, A., Gorsel, E. V., Grantz, D., Feigenwinter, C., Lehner, I., Liebethal, C., Liu, H., Mauder, M., Pitacco, A., Ribeiro, L., and Weidinger, T.: The Energy Balance Experiment EBEX-2000. Part I: overview and energy balance, Bound.-Lay. Meteorol., 123, 1–28, https://doi.org/10.1007/s10546-007-9161-1, 2007.
Orgill, S. E., Condon, J. R., Kirkby, C. A., Orchard, B. A., Conyers, M. K., Greene, R. S. B., and Murphy, B. W.: Soil with high organic carbon concentration continues to sequester carbon with increasing carbon inputs, Geoderma, 285, 151–163, https://doi.org/10.1016/j.geoderma.2016.09.033, 2017.
Pan, G., Smith, P., and Pan, W.: The role of soil organic matter in maintaining the productivity and yield stability of cereals in China, Agr. Ecosyst. Environ., 129, 344–348, https://doi.org/10.1016/j.agee.2008.10.008, 2009.
Papale, D., Reichstein, M., Aubinet, M., Canfora, E., Bernhofer, C., Kutsch, W., Longdoz, B., Rambal, S., Valentini, R., Vesala, T., and Yakir, D.: Towards a standardized processing of Net Ecosystem Exchange measured with eddy covariance technique: algorithms and uncertainty estimation, Biogeosciences, 3, 571–583, https://doi.org/10.5194/bg-3-571-2006, 2006.
Pastorello, G., Trotta, C., Canfora, E., Chu, H., Christianson, D., Cheah, Y.-W., Poindexter, C., Chen, J., Elbashandy, A., Humphrey, M., Isaac, P., Polidori, D., Ribeca, A., Ingen, C., Zhang, L., Amiro, B., Ammann, C., Arain, M., Ardö, J., and Papale, D.: The FLUXNET2015 dataset and the ONEFlux processing pipeline for eddy covariance data, Scientific Data, 7, https://doi.org/10.1038/s41597-020-0534-3, 2020.
Patra, R., Saha, D., and Jagadamma, S.: Winter wheat cover crop increased subsoil organic carbon in a long-term cotton cropping system in Tennessee, Soil Till. Res., 224, 105521, https://doi.org/10.1016/j.still.2022.105521, 2022.
Patra, R., Saha, D., Neupane, A., and Jagadamma, S.: Deep-rooted winter wheat cover crop promotes subsoil organic carbon storage through improved microbial functional traits, Appl. Soil Ecol., 199, 105413, https://doi.org/10.1016/j.apsoil.2024.105413, 2024.
Peltola, O., Aslan, T., Ibrom, A., Nemitz, E., Rannik, Ü., and Mammarella, I.: The high-frequency response correction of eddy covariance fluxes – Part 1: An experimental approach and its interdependence with the time-lag estimation, Atmos. Meas. Tech., 14, 5071–5088, https://doi.org/10.5194/amt-14-5071-2021, 2021.
Penko Seidl, N. and Golobič, M.: Quantitative assessment of agricultural landscape heterogeneity, Ecol. Indic., 112, 106115, https://doi.org/10.1016/j.ecolind.2020.106115, 2020.
Peralta, G., Di Paolo, L., Luotto, I., Omuto, C., Mainka, M., Viatkin, K., and Yigini, Y.: Global soil organic carbon sequestration potential map (GSOCseq v1.1) – Technical manual, FAO, Rome, Italy, 255 pp., https://doi.org/10.4060/cb2642en, 2022.
Pereira, L. S., Allen, R. G., Paredes, P., López-Urrea, R., Raes, D., Smith, M., Kilic, A., and Salman, M.: Crop evapotranspiration – Guidelines for computing crop water requirements, 2nd edn., rev. 2025, FAO Irrigation and Drainage Paper 56, Rev. 1, FAO, Rome, Italy, https://doi.org/10.4060/cd6621en, 2025.
Pesce, S., Balugani, E., De Paz, J. M., Marazza, D., and Visconti, F.: A Modified Version of RothC to Model the Direct and Indirect Effects of Rice Straw Mulching on Soil Carbon Dynamics, Calibrated in Two Valencian Citrus Orchards, Soil Systems, 8, 12, https://doi.org/10.3390/soilsystems8010012, 2024.
Pierson, D., Lohse, K. A., Wieder, W. R., Patton, N. R., Facer, J., De Graaff, M.-A., Georgiou, K., Seyfried, M. S., Flerchinger, G., and Will, R.: Optimizing process-based models to predict current and future soil organic carbon stocks at high-resolution, Sci. Rep., 12, 10824, https://doi.org/10.1038/s41598-022-14224-8, 2022.
Poeplau, C. and Don, A.: Carbon sequestration in agricultural soils via cultivation of cover crops – A meta-analysis, Agr. Ecosyst. Environ., 200, 33–41, https://doi.org/10.1016/j.agee.2014.10.024, 2015.
Poeplau, C., Aronsson, H., Myrbeck, Å., and Kätterer, T.: Effect of perennial ryegrass cover crop on soil organic carbon stocks in southern Sweden, Geoderma Regional, 4, 126–133, https://doi.org/10.1016/j.geodrs.2015.01.004, 2015.
Poeplau, C., Don, A., and Schneider, F.: Roots are key to increasing the mean residence time of organic carbon entering temperate agricultural soils, Glob. Change Biol., 27, 4921–4934, https://doi.org/10.1111/gcb.15787, 2021.
Potapov, P., Turubanova, S., Hansen, M. C., Tyukavina, A., Zalles, V., Khan, A., Song, X.-P., Pickens, A., Shen, Q., and Cortez, J.: Global maps of cropland extent and change show accelerated cropland expansion in the twenty-first century, Nat. Food, 3, 19–28, https://doi.org/10.1038/s43016-021-00429-z, 2021.
Poulton, P., Johnston, J., Macdonald, A., White, R., and Powlson, D.: Major limitations to achieving “4 per 1000” increases in soil organic carbon stock in temperate regions: Evidence from long-term experiments at Rothamsted Research, United Kingdom, Glob. Change Biol., 24, 2563–2584, https://doi.org/10.1111/gcb.14066, 2018.
Powlson, D. S., Whitmore, A. P., and Goulding, K. W. T.: Soil carbon sequestration to mitigate climate change: a critical re-examination to identify the true and the false, Eur. J. Soil Sci., 62, 42–55, https://doi.org/10.1111/j.1365-2389.2010.01342.x, 2011.
Powlson, D. S., Bhogal, A., Chambers, B. J., Coleman, K., Macdonald, A. J., Goulding, K. W. T., and Whitmore, A. P.: The potential to increase soil carbon stocks through reduced tillage or organic material additions in England and Wales: A case study, Agr. Ecosyst. Environ., 146, 23–33, https://doi.org/10.1016/j.agee.2011.10.004, 2012.
Poyda, A., Wizemann, H.-D., Ingwersen, J., Eshonkulov, R., Högy, P., Demyan, M. S., Kremer, P., Wulfmeyer, V., and Streck, T.: Carbon fluxes and budgets of intensive crop rotations in two regional climates of southwest Germany, Agr. Ecosyst. Environ., 276, 31–46, https://doi.org/10.1016/j.agee.2019.02.011, 2019.
Raffeld, A. M., Bradford, M. A., Jackson, R. D., Rath, D., Sanford, G. R., Tautges, N., and Oldfield, E. E.: The importance of accounting method and sampling depth to estimate changes in soil carbon stocks, Carbon Balance Manage., 19, 2, https://doi.org/10.1186/s13021-024-00249-1, 2024.
R Core Team: R: A Language and Environment for Statistical Computing, R Foundation for Statistical Computing, Vienna, Austria, available at: https://www.R-project.org/ (last access: 12 September 2023), 2023.
Reichstein, M., Falge, E., Baldocchi, D., Papale, D., Aubinet, M., Berbigier, P., Bernhofer, C., Buchmann, N., Gilmanov, T., Granier, A., Grunwald, T., Havrankova, K., Ilvesniemi, H., Janous, D., Knohl, A., Laurila, T., Lohila, A., Loustau, D., Matteucci, G., Meyers, T., Miglietta, F., Ourcival, J.-M., Pumpanen, J., Rambal, S., Rotenberg, E., Sanz, M., Tenhunen, J., Seufert, G., Vaccari, F., Vesala, T., Yakir, D., and Valentini, R.: On the separation of net ecosystem exchange into assimilation and ecosystem respiration: review and improved algorithm, Glob. Change Biol., 11, 1424–1439, https://doi.org/10.1111/j.1365-2486.2005.001002.x, 2005.
Ren, W., Banger, K., Tao, B., Yang, J., Huang, Y., and Tian, H.: Global pattern and change of cropland soil organic carbon during 1901–2010: Roles of climate, atmospheric chemistry, land use and management, Geography and Sustainability, 1, 59–69, https://doi.org/10.1016/j.geosus.2020.03.001, 2020.
Richardson, A. D., Aubinet, M., Barr, A. G., Hollinger, D. Y., Ibrom, A., Lasslop, G., and Reichstein, M.: Uncertainty Quantification, in: Eddy Covariance, edited by: Aubinet, M., Vesala, T., and Papale, D., Springer Netherlands, Dordrecht, 173–209, https://doi.org/10.1007/978-94-007-2351-1_7, 2012.
Rodeghiero, M., Heinemeyer, A., Schrumpf, M., and Bellamy, P.: Determination of soil carbon stocks and changes, in: Soil Carbon Dynamics, edited by: Kutsch, W. L., Bahn, M., and Heinemeyer, A., Cambridge University Press, 49–75, https://doi.org/10.1017/CBO9780511711794.005, 2010.
Sail, S., Huyghebaert, B., Vanwindekens, F., Abras, M., and Hardy, B.: Soil organic carbon stocks and dynamics under contrasting organic matter management practices – Results from a 65-year-old experiment in Belgium, Eur. J. Agron., 170, 127709, https://doi.org/10.1016/j.eja.2025.127709, 2025.
Saltelli, A., Tarantola, S., and Campolongo, F.: Sensitivity Analysis as an Ingredient of Modeling, Stat. Sci., 15, 377–395, 2000.
Scavo, A., Fontanazza, S., Restuccia, A., Pesce, G. R., Abbate, C., and Mauromicale, G.: The role of cover crops in improving soil fertility and plant nutritional status in temperate climates. A review, Agron. Sustain. Dev., 42, 93, https://doi.org/10.1007/s13593-022-00825-0, 2022.
Schepens, J. A. B., Koopmans, C. J., Heupink, D. T., Timmermans, B. G. H., Gentsch, N., Martens, S., De Haan, J., Creamer, R. E., and Moinet, G. Y. K.: From global trends to local realities: SOC accrual of improved management practices in northwestern Europe, Geoderma Regional, 42, e00983, https://doi.org/10.1016/j.geodrs.2025.e00983, 2025.
Schrumpf, M., Schulze, E. D., Kaiser, K., and Schumacher, J.: How accurately can soil organic carbon stocks and stock changes be quantified by soil inventories?, Biogeosciences, 8, 1193–1212, https://doi.org/10.5194/bg-8-1193-2011, 2011.
Seitz, D., Fischer, L. M., Dechow, R., Wiesmeier, M., and Don, A.: The potential of cover crops to increase soil organic carbon storage in German croplands, Plant Soil, 488, 157–173, https://doi.org/10.1007/s11104-022-05438-w, 2023.
Shakoor, A., Shakoor, S., Rehman, A., Ashraf, F., Abdullah, M., Shahzad, S. M., Farooq, T. H., Ashraf, M., Manzoor, M. A., Altaf, M. M., and Altaf, M. A.: Effect of animal manure, crop type, climate zone, and soil attributes on greenhouse gas emissions from agricultural soils–A global meta-analysis, J. Clean. Prod., 278, 124019, https://doi.org/10.1016/j.jclepro.2020.124019, 2021.
Shi, Z., Crowell, S., Luo, Y., and Moore, B.: Model structures amplify uncertainty in predicted soil carbon responses to climate change, Nat. Commun., 9, 2171, https://doi.org/10.1038/s41467-018-04526-9, 2018.
Sierra, C. A., Müller, M., and Trumbore, S. E.: Models of soil organic matter decomposition: the SoilR package, version 1.0, Geosci. Model Dev., 5, 1045–1060, https://doi.org/10.5194/gmd-5-1045-2012, 2012.
Sierra, C. A., Ahrens, B., Bolinder, M. A., Braakhekke, M. C., Von Fromm, S., Kätterer, T., Luo, Z., Parvin, N., and Wang, G.: Carbon sequestration in the subsoil and the time required to stabilize carbon for climate change mitigation, Glob. Change Biol., 30, e17153, https://doi.org/10.1111/gcb.17153, 2024.
Smit, B., Janssens, B., Haagsma, W., Hennen, W., Adrados, J. and Kathage, J.: Adoption of cover crops for climate change mitigation in the EU, edited by: Kathage, J. and Perez Dominguez, I., EUR 29863 EN, Publications Office of the European Union, Luxembourg, ISBN 978-92-76-11312-6, https://doi.org/10.2760/638382, 2019.
Smith, P.: How long before a change in soil organic carbon can be detected?, Glob. Change Biol., 10, 1878–1883, https://doi.org/10.1111/j.1365-2486.2004.00854.x, 2004.
Smith, P., Soussana, J., Angers, D., Schipper, L., Chenu, C., Rasse, D. P., Batjes, N. H., Van Egmond, F., McNeill, S., Kuhnert, M., Arias-Navarro, C., Olesen, J. E., Chirinda, N., Fornara, D., Wollenberg, E., Álvaro-Fuentes, J., Sanz-Cobena, A., and Klumpp, K.: How to measure, report and verify soil carbon change to realize the potential of soil carbon sequestration for atmospheric greenhouse gas removal, Glob. Change Biol., 26, 219–241, https://doi.org/10.1111/gcb.14815, 2020.
Spotorno, S., Gobin, A., Vanongeval, F., Del Borghi, A., and Gallo, M.: Carbon Farming practices assessment: Modelling spatial changes of Soil Organic Carbon in Flanders, Belgium, Sci. Total Environ., 922, 171267, https://doi.org/10.1016/j.scitotenv.2024.171267, 2024.
Stamati, F. E., Nikolaidis, N. P., and Schnoor, J. L.: Modeling topsoil carbon sequestration in two contrasting crop production to set-aside conversions with RothC – Calibration issues and uncertainty analysis, Agr. Ecosyst. Environ., 165, 190–200, https://doi.org/10.1016/j.agee.2012.11.010, 2013.
Stewart, C. E., Paustian, K., Conant, R. T., Plante, A. F., and Six, J.: Soil carbon saturation: concept, evidence and evaluation, Biogeochemistry, 86, 19–31, https://doi.org/10.1007/s10533-007-9140-0, 2007.
Stoy, P. C., Mauder, M., Foken, T., Marcolla, B., Boegh, E., Ibrom, A., Arain, M. A., Arneth, A., Aurela, M., Bernhofer, C., Cescatti, A., Dellwik, E., Duce, P., Gianelle, D., van Gorsel, E., Kiely, G., Knohl, A., Margolis, H., McCaughey, H., Merbold, L., Montagnani, L., Papale, D., Reichstein, M., Saunders, M., Serrano-Ortiz, P., Sottocornola, M., Spano, D., Vaccari, F., and Varlagin, A.: A data-driven analysis of energy balance closure across FLUXNET research sites: The role of landscape scale heterogeneity, Agr. Forest Meteorol., 171–172, 137–152, https://doi.org/10.1016/j.agrformet.2012.11.004, 2013.
Sulman, B. N., Harden, J., He, Y., Treat, C., Koven, C., Mishra, U., O'Donnell, J. A., and Nave, L. E.: Land Use and Land Cover Affect the Depth Distribution of Soil Carbon: Insights From a Large Database of Soil Profiles, Front. Environ. Sci., 8, 146, https://doi.org/10.3389/fenvs.2020.00146, 2020.
Sun, J. and Tribbia, J.: Total energy conservation for explaining discrepancies between field observations and the traditional thermal energy balance, Q. J. Roy. Meteor. Soc., 151, e5005, https://doi.org/10.1002/qj.5005, 2025.
Sun, J., Massman, W. J., Banta, R. M., and Burns, S. P.: Revisiting the Surface Energy Imbalance, J. Geophys. Res.-Atmos., 126, e2020JD034219, https://doi.org/10.1029/2020JD034219, 2021.
Sun, Z., Chen, Q., Han, X., Bol, R., Qu, B., and Meng, F.: Allocation of photosynthesized carbon in an intensively farmed winter wheat–soil system as revealed by 14CO2 pulse labelling, Sci. Rep., 8, 3160, https://doi.org/10.1038/s41598-018-21547-y, 2018.
Teng, D., He, X., Wang, J., Wang, J., and Lv, G.: Uncertainty in gap filling and estimating the annual sum of carbon dioxide exchange for the desert Tugai forest, Ebinur Lake Basin, Northwest China, PeerJ, 8, e8530, https://doi.org/10.7717/peerj.8530, 2020.
Terrer, C., Phillips, R. P., Hungate, B. A., Rosende, J., Pett-Ridge, J., Craig, M. E., Van Groenigen, K. J., Keenan, T. F., Sulman, B. N., Stocker, B. D., Reich, P. B., Pellegrini, A. F. A., Pendall, E., Zhang, H., Evans, R. D., Carrillo, Y., Fisher, J. B., Van Sundert, K., Vicca, S., and Jackson, R. B.: A trade-off between plant and soil carbon storage under elevated CO2, Nature, 591, 599–603, https://doi.org/10.1038/s41586-021-03306-8, 2021.
Thirion, F. and Chabot, F.: Recommandations pour assurer la qualité d'épandage des produits organiques, Ingénieries Eau Agriculture-Territoires, 35, 29–41, https://hal.science/hal-00467509 (last access: 4 April 2026), 2003.
Todd-Brown, K. E. O., Randerson, J. T., Post, W. M., Hoffman, F. M., Tarnocai, C., Schuur, E. A. G., and Allison, S. D.: Causes of variation in soil carbon simulations from CMIP5 Earth system models and comparison with observations, Biogeosciences, 10, 1717–1736, https://doi.org/10.5194/bg-10-1717-2013, 2013.
Twine, T. E., Kustas, W. P., Norman, J. M., Cook, D. R., Houser, P. R., Meyers, T. P., Prueger, J. H., Starks, P. J., and Wesely, M. L.: Correcting eddy-covariance flux underestimates over a grassland, Agr. Forest Meteorol., 103, 279–300, https://doi.org/10.1016/S0168-1923(00)00123-4, 2000.
Vaisala: Vaisala HUMICAP Humidity and Temperature Probe HMP155, Technical data sheet B210752EN-K, Vaisala Oyj, Vantaa, Finland, https://docs.vaisala.com/v/u/B210752EN-K/en-US (last access: 8 October 2026), 2025.
Vekuri, H., Tuovinen, J.-P., Kulmala, L., Papale, D., Kolari, P., Aurela, M., Laurila, T., Liski, J., and Lohila, A.: A widely-used eddy covariance gap-filling method creates systematic bias in carbon balance estimates, Sci. Rep., 13, 1720, https://doi.org/10.1038/s41598-023-28827-2, 2023.
Vekuri, H., Tuovinen, J.-P., Kulmala, L., Aurela, M., Thum, T., Liski, J., and Lohila, A.: Improved uncertainty estimates for eddy covariance-based carbon dioxide balances using deep ensembles for gap-filling, Agr. Forest Meteorol., 371, 110558, https://doi.org/10.1016/j.agrformet.2025.110558, 2025.
Volk, J., Huntington, J., Allen, R., Melton, F., Anderson, M., and Kilic, A.: flux-data-qaqc: A Python Package for Energy Balance Closure and Post-Processing of Eddy Flux Data, JOSS, 6, 3418, https://doi.org/10.21105/joss.03418, 2021.
Walmsley, D. C., Siemens, J., Kindler, R., Kirwan, L., Kaiser, K., Saunders, M., Kaupenjohann, M., and Osborne, B. A.: Dissolved carbon leaching from an Irish cropland soil is increased by reduced tillage and cover cropping, Agr. Ecosyst. Environ., 142, 393–402, https://doi.org/10.1016/j.agee.2011.06.011, 2011.
Wang, Y., Li, X., Dong, W., Wu, D., Hu, C., Zhang, Y., and Luo, Y.: Depth-dependent greenhouse gas production and consumption in an upland cropping system in northern China, Geoderma, 319, 100–112, https://doi.org/10.1016/j.geoderma.2018.01.001, 2018.
Wang, Y., Ying, H., Yin, Y., Zheng, H., and Cui, Z.: Estimating soil nitrate leaching of nitrogen fertilizer from global meta-analysis, Sci. Total Environ., 657, 96–102, https://doi.org/10.1016/j.scitotenv.2018.12.029, 2019.
Weihermüller, L., Graf, A., Herbst, M., and Vereecken, H.: Simple pedotransfer functions to initialize reactive carbon pools of the RothC model, Eur. J. Soil Sci., 64, 567–575, https://doi.org/10.1111/ejss.12036, 2013.
Wiaux, F., Vanclooster, M., and Van Oost, K.: Vertical partitioning and controlling factors of gradient-based soil carbon dioxide fluxes in two contrasted soil profiles along a loamy hillslope, Biogeosciences, 12, 4637–4649, https://doi.org/10.5194/bg-12-4637-2015, 2015.
Wieder, W. R., Boehnert, J., and Bonan, G. B.: Evaluating soil biogeochemistry parameterizations in Earth system models with observations, Global Biogeochem. Cy., 28, 211–222, https://doi.org/10.1002/2013GB004665, 2014.
Wohlfahrt, G. and Widmoser, P.: Can an energy balance model provide additional constraints on how to close the energy imbalance?, Agr. Forest Meteorol., 169, 85–91, https://doi.org/10.1016/j.agrformet.2012.10.006, 2013.
Wüst-Galley, C., Keel, S. G., and Leifeld, J.: A model-based carbon inventory for Switzerland's mineral agricultural soils using RothC, Agroscope, https://doi.org/10.34776/AS105E, 2020.
Wutzler, T., Lucas-Moffat, A., Migliavacca, M., Knauer, J., Sickel, K., Šigut, L., Menzer, O., and Reichstein, M.: Basic and extensible post-processing of eddy covariance flux data with REddyProc, Biogeosciences, 15, 5015–5030, https://doi.org/10.5194/bg-15-5015-2018, 2018.
Wutzler, T., Wutzler, T., and mircomigliavacca, bgctw/REddyProc: REddyProc 1.3.3, Version v1.3.3, Zenodo [software], https://doi.org/10.5281/zenodo.10572005, 2024.
Yokozawa, M., Shirato, Y., Sakamoto, T., Yonemura, S., Nakai, M., and Ohkura, T.: Use of the RothC model to estimate the carbon sequestration potential of organic matter application in Japanese arable soils, Soil Sci. Plant Nutr., 56, 168–176, https://doi.org/10.1111/j.1747-0765.2009.00422.x, 2010.
Zhang, Z., Kaye, J. P., Bradley, B. A., Amsili, J. P., and Suseela, V.: Cover crop functional types differentially alter the content and composition of soil organic carbon in particulate and mineral-associated fractions, Glob. Change Biol., 28, 5831–5848, https://doi.org/10.1111/gcb.16296, 2022.
Zhao, X. and Huang, Y.: A Comparison of Three Gap Filling Techniques for Eddy Covariance Net Carbon Fluxes in Short Vegetation Ecosystems, Adv. Meteorol., 2015, 12 pp., https://doi.org/10.1155/2015/260580, 2015.
Zhen, H., Jia, L., Huang, C., Qiao, Y., Li, J., Li, H., Chen, Q., and Wan, Y.: Long-term effects of intensive application of manure on heavy metal pollution risk in protected-field vegetable production, Environ. Pollut., 263, 114552, https://doi.org/10.1016/j.envpol.2020.114552, 2020.
Zhou, J., Shao, G., Li, L., Yang, X., Zamanian, K., Alharbi, S. A., Filimonenko, E., Liu, E., Mei, X., and Kuzyakov, Y.: The over-estimation of long-term mineral fertilizer on CO2 release from soil carbonates, Agr. Ecosyst. Environ., 392, 109737, https://doi.org/10.1016/j.agee.2025.109737, 2025.
Zhou, M., Zhu, B., Wang, S., Zhu, X., Vereecken, H., and Brüggemann, N.: Stimulation of N2 O emission by manure application to agricultural soils may largely offset carbon benefits: a global meta-analysis, Glob. Change Biol., 23, 4068–4083, https://doi.org/10.1111/gcb.13648, 2017.
Zhou, Y., Liu, H., Sühring, M., and Li, X.: Implications of energy balance non-closure on carbon dioxide flux uncertainties: Insights from large eddy simulations in convective boundary layers, Agr. Forest Meteorol., 358, 110211, https://doi.org/10.1016/j.agrformet.2024.110211, 2024.
Zimmermann, M., Leifeld, J., Schmidt, M. W. I., Smith, P., and Fuhrer, J.: Measured soil organic matter fractions can be related to pools in the RothC model, Eur. J. Soil Sci., 58, 658–667, https://doi.org/10.1111/j.1365-2389.2006.00855.x, 2007.