
the Creative Commons Attribution 4.0 License.
the Creative Commons Attribution 4.0 License.
 | 23 Oct 2026
Fine-scale spatial variability of winter CO2 and CH4 fluxes in Arctic tundra derived from snowpack gradient measurements
Gabriel Hould Gosselin

Nick Rutter
Paul J. Mann
Philip Marsh
Oliver Sonnentag
Winter carbon dioxide (CO2) and methane (CH4) fluxes from soils under seasonal snowpacks make non-negligible, yet poorly constrained contributions to annual carbon budgets across Arctic regions. Quantifying these fluxes and their spatial variance will better constrain uncertainties in simulations of winter carbon fluxes from terrestrial biosphere models. We address this gap by measuring and identifying patterns and spatial variability in CO2 and CH4 soil-atmosphere fluxes through late winter snowpacks at an upland tundra site in the western Canadian Arctic. Instantaneous fluxes were calculated from CO2 and CH4 microsite concentration gradients at 10 to 20 cm vertical resolution (n=119) through the snowpack across five homogeneous surface covers, representing dominant vegetation types. We measured consistent soil-to-atmosphere CO2 fluxes but with significantly different rates across surface covers (0.8 to 100 mgC m−2 d−1), which were strongly influenced by snow depth and soil surface temperature, exhibiting higher emissions under deeper snowpacks and warmer soil surfaces. CH4 fluxes were also coupled to soil surface temperature and varied between −0.04 and 0.08 mgC m−2 d−1. Persistent CH4 uptake was observed in warmer soils (−6.0 to −0.5 °C) in a sparsely populated black spruce and shrub dominated area with deep snow, indicating active methane oxidation during winter. Microsite scale CO2 and CH4 fluxes were statistically independent of vertical snow microstructure, indicating that winter fluxes could be reliably calculated from single gas concentration at the soil-snow interface, negating the need for additional snowpack gas measurements. These results open new avenues for quantifying fine-scale spatial variability of wintertime CO2 and CH4 fluxes in Arctic tundra, which can constrain biogeochemical process representations in terrestrial biosphere models and inform spatial upscaling methodologies.
- Article
(5900 KB) - Full-text XML
- BibTeX
- EndNote


Arctic environments are experiencing up to four times the rate of climate warming than the global average (Rantanen et al., 2022), with greater rates of warming during the cold season months of September to May (Bekryaev et al., 2010; Smith et al., 2019). Longer growing seasons and earlier springtime snowmelt drive changes in vegetation composition and structure (Piao et al., 2019; Shi et al., 2015), such as deciduous shrubs expanding northwards and increasing in size and density (i.e., Arctic greening), especially in the forest-tundra ecotone (Ju and Masek, 2016; Myers-Smith et al., 2011, 2020). Altered Arctic precipitation patterns (Ernakovich et al., 2014) and taller, more plentiful shrubs offer more resistance to wind, favouring the trapping of blowing snow and impacting processes that control the seasonal evolution of snowpack thickness and microstructure (Shirley et al., 2025). This influences the insulating properties of snow on soils throughout winter, here defined as the snow covered period of the cold season (Busseau et al., 2017). Warmer winter soils promote increased microbial activity and more rapid degradation of soil organic matter through heterotrophic respiration. As soil microbes are especially sensitive to temperature and to the availability of liquid soil moisture near and below freezing, warmer wintertime soils could alter emissions of potent greenhouse gases (GHGs) such as carbon dioxide (CO2) and methane (CH4) (Natali et al., 2019), with the direction of the net CH4 response set by the balance between methanogenesis and methanotrophic oxidation under prevailing soil moisture and oxygen availability. Understanding how surface-atmosphere carbon exchanges in different Arctic ecosystems impact net GHG budgets is key to assessing warming potential at a global scale (Ludwig et al., 2024).
Terrestrial Biosphere Models (TBMs) simulate exchanges of energy, water, and carbon at the Earth's surface, and allow us to simulate the effects of warmer air temperatures and land cover change on regional and global climate. TBMs as used in Earth System Models, such as the Community Land Model (CLM5.0) (Lawrence et al., 2019) are used to integrate the effects of dynamically evolving snowpacks on soil thermal and moisture regimes, coupled with biogeochemical processes. Large uncertainties in simulations of cold season carbon fluxes remain, largely because of the poor representation of the effective conductivity of snow and inadequate parametrisation of soil heterotrophic respiration and limited northern latitude GHG flux measurements for model evaluation (Fisher et al., 2014; Natali et al., 2019; Tao et al., 2021).
Simulations urgently require improvement as measurements of cold season GHG fluxes in Arctic ecosystems have been shown to contribute substantially to annual carbon budgets. Field measurements from northern Alaska demonstrated that CO2 emissions during the snow-covered season can be large enough to offset or exceed growing-season uptake (Fahnestock et al., 1998, 1999; Jones et al., 1999b; Welker et al., 2000), and recent syntheses reinforce these findings at pan-Arctic scales (Natali et al., 2019; Rafat et al., 2021). Relatively small CH4 emissions during the lengthy cold season have also been shown to contribute > 50 % of annual total sources in Alaskan tundra (Zona et al., 2016). Collectively, such studies established winter as a critical period for Arctic carbon cycling and motivated subsequent efforts to quantify cold-season fluxes across a wider range of Arctic and sub-Arctic ecosystems.
Snow covered landscape wintertime GHG exchanges between soil and atmosphere have been measured using several techniques, yet published methods sacrificed spatial coverage (single sampling sites), spatial resolution by aggregating fluxes over length scales larger than those over which processes vary, or temporal coverage by aggregating flux measurements over several measurement campaigns. Eddy covariance measurements (Baldocchi, 2003) have increasingly been used to measure surface-atmosphere fluxes in the Arctic over footprints of 100 s to 1000 s m2 (Virkkala et al., 2022). However, eddy covariance flux systems aggregate fluxes at scales orders of magnitude larger than localised (< 1 m2) soil microbial processes, masking surface cover scale variability driven by localised conditions (i.e., soil temperature, available liquid soil moisture, labile nutrient availability, root zones, and discrete organic inputs such as faecal deposits) (Soegaard et al., 2000; Sullivan et al., 2020; Vourlitis et al., 2000). Conversely, soil chambers provide process scale microsite vertical fluxes by measuring changes in gas concentration within an enclosed volume at the ground-atmosphere interface (Subke et al., 2021). Where wintertime chamber-based CO2 snowpack flux measurements have been made, they generally underestimate fluxes as the chamber-method excludes lateral diffusive flux driven by wind within the snow porous structure, or require chambers to be installed before snowfall, inevitably changing soil thermal and moisture regimes during the winter (McDowell et al., 2000; Webb et al., 2016). Soil-atmosphere fluxes derived from direct measurements of snowpack CO2 and CH4 concentrations and steady-state diffusion models have been used for several decades to estimate winter greenhouse gas fluxes in Arctic ecosystems. Manually extracting air from snowpacks with syringes allows for cost effective and spatially distributed flux measurements. However, large sample sizes (n>10) are difficult to collect within time scales where meteorological conditions are stationary and wind speeds are low, and require several samples to be extracted and analysed per microsite for flux calculations (Jones et al., 1999a; Mavrovic et al., 2023; Seok et al., 2009; Zhu et al., 2014). Faster, high accuracy in situ snowpack gradient measurements of CO2 flux (and later CH4) were more recently made possible using portable Infrared Gas Analysers (IRGA), quantifying winter soil-atmosphere fluxes across a variety of Arctic land surface covers (Fahnestock et al., 1998; Jones et al., 1999b; Pirk et al., 2016).
High spatial variability in winter carbon fluxes is due to complex interactions between microtopography, snow structure, and soil moisture. Microtopographic features, such as hummocks and hollows, influence the distribution of snow depth and insulative properties, decoupling soil thermal regimes from cold winter air (Burn and Kokelj, 2009; Quinton and Marsh, 1998; Schädel et al., 2024; Wilcox et al., 2019). Strong soil-air thermal gradients and wind driven snow redistribution in drifts and vegetation result in locally distinct vertical snowpack layering. Dominant snow layers such as wind crusts and depth hoar further affect the insulative capacity and diffusivity of gasses within a snowpack (Domine et al., 2016; Proksch et al., 2015). Additionally, shrubs protruding through snowpacks act as thermal conduits passively cooling soils at their roots, locally diminishing the insulative capacity of snow (Domine et al., 2022). As winter soil thermal regimes vary spatially with snow structure and distribution, winter soil microbial respiration and nutrient mineralization likewise vary (Aanderud et al., 2013; Schimel et al., 2004; Sullivan et al., 2020; Wilkman et al., 2018), because snowpack characteristics control soil temperature and moisture microclimates that regulate microbial activity (Mikan et al., 2002). Wet, low-lying areas with persistent soil saturation are more likely to be hotspots for methanogenesis, whereas drier upland areas promote aerobic methane oxidation (Virkkala et al., 2024; Voigt et al., 2023). However, the spatial distribution of these processes in TBMs remains poorly constrained due to limited high-resolution measurements across tundra ecosystems, especially within frozen soils during winter (Fisher et al., 2014; Levy et al., 2022). Temporally continuous and spatially distributed measurements of winter carbon fluxes remain a necessity to evaluate wintertime soil microbial heterotrophic respiration simulations as a function of ground thermal and moisture regimes (Dutch et al., 2022, 2024; Schädel et al., 2024).
Here we examine the spatial variability of CO2 and CH4 wintertime fluxes across local scales (100 m transects) in an Arctic tundra site and develop methodologies for capturing representative mean emission estimates for wider upscaling. Three objectives are to (1) quantify CO2 and CH4 flux variability within homogenous surface covers from a broad range of microtopographic and vegetation microsites, (2) quantify and compare errors on measured fluxes using a new snowpack gas concentration gradient measurement approach to current values found in the literature, and (3) identify the required number of samples needed to adequately capture variability within homogenous surface covers for surface cover based spatial scaling. Meeting these objectives, we provide a dataset for constraining uncertainties in biogeochemical processes simulated in TBMs, and statistical insight informing future sampling protocols aimed at improving spatial upscaling from in situ flux measurements and for TBM validation datasets.
2.1 Theoretical framework for gas flux calculation through the snowpack
Winter microbial respiration in soils drive vertical fluxes in GHGs across the soil-atmosphere interface by the production or consumption of CO2 and CH4 within the soil column. Snow acts as a porous intermediary medium between soil and atmosphere for gases to traverse, creating a vertical concentration gradient driven by molecular diffusion. Assuming steady state and concentration gradients across the snowpack are linear, then the rate of diffusion of gas (Fgas, mol m−2 s−1) can be calculated using Fick's 1st law of diffusion as:
where D (m−2 s−1) is the standard air diffusion coefficient of each gas species (here, and for CO2 and CH4, respectively) through the snowpack, dC dz (mol m−1) is the vertical gas concentration gradient across the snowpack of height z, φ (m3 m−3) is snowpack porosity across dz, τ (m m−1) is snowpack tortuosity across dz, and Na (mol m−3) is the molar volume used to convert units of concentration (from ppm to mol m−3). According to the ideal gas law (PV = nRT, where R=8.314 J K−1 mol−1), Na () is calculated as:
where P (Pa) is ambient air pressure and T (K) is the average temperature of the snowpack. Snow porosity is derived from measured snow density along its vertical profile following Kinar and Pomeroy (2015):
where no liquid content is assumed to be present in the snowpack, ρsnow is measured snow density and ρice is pure ice density as a function of measured temperature at standard pressure ( × T+0.9168 g cm−3; Haynes, 2016), where T is temperature in °C. Tortuosity through a porous medium is derived from Du Plessis and Masliyah (1991):
Standard CO2 and CH4 diffusion coefficients must be corrected for air temperature and pressure (Massman, 1998):
where P0 and T0 are standard atmosphere pressure and temperature respectively (P0=101.325 kPa and T0=273.15 K), and D0 is gas diffusion in air at those standards where: 0.1381 cm2 s−1 (1.381 × 10⁻⁵ m2 s−1); 0.1952 cm2 s−1 (1.952 × 10⁻⁵ m2 s−1).
Non-diffusive transport driven by wind pumping is represented through an effective diffusion coefficient altering Eq. (1) to:
where ϵ is a dimensionless enhancement factor that is zero for pure molecular diffusion and increases with snow-surface wind speed, snowpack air permeability, and barometric variance (Massman et al., 1997; Bowling and Massman, 2011).
Turbulent and barometric pressure pumping is oscillatory with near-zero mean flow, so the net effect is a dispersive enhancement of diffusion rather than a mean advective flux (Massman et al., 1997; Bowling and Massman, 2011), whereas quasi-static (Venturi) advection depends on the wavelength and height of surface relief, such as sastrugi or drifts, and on the resulting surface pressure perturbation (Colbeck, 1997; Massman et al., 1997). Bowling and Massman (2011) directly measured ϵ with values reaching zero in calm air and up to 0.33 at a wind speed of 10 m s−1. Modelling of a layered snowpack driven by such fluctuations at mean wind speeds of 1 to 4 m s−1 shows that pressure pumping does not appreciably enhance through-snowpack diffusion unless it alters the boundary concentrations (Massman et al., 1997). Furthermore, a lower-permeability surface layer such as a wind crust further attenuates the penetration of pressure-driven airflow into the snowpack (Colbeck, 1997). Advective enhancement is therefore bounded near zero (ϵ≈ 0) under which conditions the flux reduces to its diffusive form as Eq. (1) when wind speed is low, the snow surface lacks pronounced relief, and a wind crust is present. As antecedent wind-generated pressure gradients were not directly measured within snowpacks over periods of hours to days before measurement of concentration gradients, their impact on basal snowpack CO2 concentrations (e.g. Massman and Frank, 2006) cannot be excluded completely. Nevertheless, the contribution to barometric pressure pumping from small atmospheric pressure changes during the measurement period are expected to be negligible.
2.2 Study site
Measurements were undertaken in a 3 km2 area surrounding the Wilfrid Laurier University Trail Valley Creek Research Station, (TVC; 68°74′ N, 133°50′ W), approximately 45 km north of Inuvik, in the Inuvialuit Settlement Region of western Inuit Nunangat, Northwest Territories, Canada (Fig. 1). TVC has a mean annual precipitation of 210 ± 9 mm for the 1991–2020 period, with approximately two thirds of annual precipitation falling as snow. Mean annual air temperature for that same period is −8.1 ± 0.7 °C (Environment and Climate Change Canada, 2024). Dominant westerly wintertime winds produce stable snow redistribution patterns across years trapping snow in areas with taller shrubs, and into drifts on eastward facing slopes where large eddies form forcing snow deposition (Wilcox et al., 2019). Typically, snow covers persist from mid-October to mid-May depending on accumulation patterns (Wilcox et al., 2019; Pomeroy et al., 1993), with seasonal maximum snow depths ranging from 45 ± 10 cm in riparian shrub and sparsely wooded areas to 71 ± 15 cm in upland tundra and tussock sites (Tutton et al., 2025).
Topography is characterised by gently rolling hills of glacial till, overlain by silty clay and a thin organic top layer. The area is underlain by 350 to 500 m thick ice rich continuous permafrost (i.e., > 90 % in areal extent; Gruber, 2012), generally with active layer thickness varying between 0.5 and 0.8 m (Burn and Kokelj, 2009) and up to 1.5 m on some southward facing white and black spruce (Picea glauca, Picea mariana) populated slopes and below stream channels. Landscape microtopography is dominated by mineral soil hummocks of up to a metre in diameter and peaty inter-hummock hollows with some periglacial tundra landforms and associated cover types including ice-wedge polygons and barren ground (Quinton and Marsh, 1998).
Vegetation is composed of low stature shrub tundra composed of dwarf birch and willow (Betula nana, Betula glandulosa; S. arctica), taller alders surrounding drainage channels (Alnus sp.), graminoids and cotton grass tussocks (Eriophorum spp.), patches of lichen and mosses, with some areas of sparsely populated black spruce (Graveline et al., 2024). Shrub-dominated areas are seen as greener areas, and low-lying lichen and graminoid-dominated vegetation in lighter tones (Fig. 1).

Figure 1Overview of sample locations in Trail Valley Creek (study site), NWT Canada. Icon colours indicate snow depth at each sampling microsite across sampling transects (Table 1). Land surface imagery from © Google, © 2025 Airbus Maxar Technologies, elevation above sea level contour lines derived from a LIDAR-based digital elevation model produced for Wilfrid Laurier University (KBM Resources Group, 2024).
2.3 Data Collection and Sampling design
All data were collected late winter between 20–26 March 2024 near maximum annual snow water equivalent, but before any snow surface melt had taken place and air temperatures remained below −10 °C. We identified five sampling transects, at length scales of approximately 100 m (T1 to T5; Fig. 1), within different vegetation types representative of the Trail Valley Creek site (Grünberg and Boike, 2019), and snow depth distribution patterns reported in Walker et al. (2021). Topography and vegetation types were used as a visual proxy for spatial delineation of the combined influence of snow depth and soil properties (temperature, moisture and organic content) on potential for carbon fluxes. To account for any preferential orientation of snow resulting from wind redistribution, sampling transects were split into two sections of 100 m, orthogonal to each other. Snow free images of transect vegetative cover are shown in Fig. A1.
Vertical snowpack structure profiles and CO2 and CH4 concentration profiles were sampled along five 200 m transects with 10 m spacing between each microsite along each transects (Fig. 1, described in Table 1). Three 1 m spaced samples also taken at the 50 and 150 m mark of each transect (at the midpoint of each section) to further identify highly localised variance at metre-scales. In total, 119 (Ntot) co-located snowpack structure profiles and CO2 and CH4concentration profiles were collected across the study site.

Vertical profiles of snow density, depth, and specific surface area were measured at sub-millimetre resolution using a Snow Micropenetrometer (SMP; Proksch, Löwe, and Schneebeli 2015). Raw SMP measurements were processed using the snowmicropyn (v. 1.2.1) python package with penetration force to snow density relationship coefficients adapted by Dutch et al. (2022) to the arctic snowpacks found in TVC.
Snowpack CO2 concentration profiles were measured using a temperature controlled portable IRGA (LGR U-GGA-915 Ultraportable, Los Gatos Inc, Los Gatos, CA) deployed in a toboggan. Snow depths at each profile were calculated as the average of three measurements taken within 100 mm of each microsite profile (coloured icons, Fig. 1). Gases within the snowpack were sampled at increments of 100 or 200 mm depending on total thickness of the snowpack, with a minimum of 6 measurement depths per profile. Snowpack air was drawn to the analyser through a metal tube on a graduated avalanche probe by the instrument's fixed internal pump at approximately 0.8 standard L min−1, and each depth was measured for approximately 60 s until CO2 and CH4 concentrations reached a stable plateau. The analyser is a flow-through instrument; sampled air was vented to ambient air rather than returned to the snowpack. The volume drawn per depth (∼ 0.8 L over 60 s) is a few percent of the pore-air volume of the surrounding snow, of the order of tens of litres within a radius of at most 0.3 m from the intake at the measured porosities (φ≈ 0.65 to 0.78). Cumulative depletion was therefore limited to the volume within each vertical layer measured. Ambient air concentrations were also recorded at the start of each profile within the transect drawn from approximately 1.5 m height to avoid contamination.
Gas concentration profiles were recorded as one continuous IRGA time series per transect accompanied by manually recorded total profile depths, creating a timeseries of step changes in concentration for each depth where air was sampled in the snowpack. IRGA time series were then partitioned into individual profiles with defined concentrations per depth in a MATLAB environment, using the Signal Processing Toolbox findchangepts.m function (The MathWorks, 2024), forcing known number of step changes in mean gas concentration between the start and end times of each profile. Step changes were first identified on the CO2 concentration time series as signal noise to change in concentration per step change was lower and then used to partition the CH4 time series. Concentrations at each step were then associated to independently recorded depths for each profile. Snowpack CO2 and CH4 concentration gradients used to calculate soil-atmosphere CO2 and CH4 fluxes through the snowpack ( and , g C m−2 d−1, respectively were then calculated by fitting linear models at each profile and testing for significance of gradient (T-test) and model coefficient of determination (R2).
Flux estimates assume quasi-steady-state diffusive transport and linear concentration gradients through the snowpack, computed from the diffusive form of Eq. (1) only. To ensure the validity of this assumption and satisfy the conditions under which the wind-pumping enhancement is negligible (Sect. 2.1), all measurements were conducted during stable meteorological conditions, characterized by wind speeds below 3.5 m s−1, and were restricted to microsites free of pronounced sastrugi or drift relief and capped wind crust free of ice lenses. Barometric pressure was measured at the Environment and Climate Change Canada weather station (Trail Valley Creek) located near transect T2-Mixed, and varied by at most 10 hPa (1.0 %) within each sampling day and by 37 hPa (3.7 %) across the campaign. Pressure changes exchanged no more than the upper 1 % of snowpack pore air with the atmosphere per day (≤ 13 mm for the deepest snowpack), constituting a negligible advective contribution under low-frequency barometric forcing.
Soil-snow interface temperatures (basal temperatures) and snowpack temperatures sampled at 10 cm vertical intervals were measured using a handheld type K thermocouple probe. Missing basal temperature observations due instrument malfunction were inferred using a linear relationship between snow depth and soil temperature (missing = 53, R2=0.76, RMSE = 1.47 °C).
2.4 Snowpack diffusion flux uncertainty quantification
Measurement uncertainties were propagated to and according to the generalised error propagation method for nonlinear systems (Taylor, 2022). Gas concentration profile gradient uncertainty is defined as the linear fit 95 % confidence interval using the Wald method for binomial series, assuming that measurements used to calculate gradients are exact as the IRGA concentration measurement error was negligible compared to the error on profile gradients. Error on average profile snow density was defined as the standard deviation of binned densities in 50 mm vertical increments, where error-per-binned densities were propagated to the total average. Soil temperature, snow temperature, and air pressure measurements errors were also fully propagated to and using the generalised error propagation method.
2.5 Sub-sampling gas concentration micro-site profiles and transect-level median estimates
Snowpack concentration gradients derived from all vertically spaced measurements in each microsite profile were compared to sub-sampled vertical gradients calculated from; (a) two concentration measurements: one within the air-snow interface layer of snow and one at the bottom of the snowpack (two measurements per microsite), and (b) one measurement from the bottom of the snowpack and the average concentration from ambient air above snow surface for the whole transect (one measurement per microsite and an average of ambient near-surface air).
To assess gas flux spatial variability across transects (homogenous surface covers), robust median estimates with acceptable variances are required to calibrate and test TBMs. However, the ideal number of samples per surface cover cannot be know in advance. Here, we used a bootstrap method where median flux values (Mdfull) of the total number of flux measurements (N) from each surface cover transect were compared to median flux values from incrementally smaller subsamples per transect. Subsample size decreased from a total number of flux measurements from each transect to n=2 (T1 N=19; T2 to T5 N=25). Subsamples with n-values less than the maximum in each transect were randomly selected from the total possible. Random selection was repeated 10 000 times, the median calculated for each selection, and then the median of all 10 000 selections was calculated (Mdn). Differences between the medians of subsamples and all measurements in a transect are expressed as a ratio (Mdn Mdfull). Subsampled Mdn were considered different to the median of total number of flux measurements from each transect (Mdfull) when the ratio Mdn Mdfull fell within the 19.4 % relative uncertainty reported for the CO2 concentration-gradient (d[CO2]/dz) regression of manually sampled snowpack fluxes at Trail Valley Creek by Mavrovic et al. (2023). This tolerance is a method-based precision band rather than a statistical significance level, adopted so that the subsampling result is directly comparable with the accuracy achievable by the gradient method. Profiles exhibiting non-significant concentration gradients (p>0.05) were excluded from subsampling and scaling analyses to avoid introducing noise from profiles indicating negligible net exchange. Profiles exhibiting non-significant concentration gradients were interpreted as representing near-zero flux conditions for the corresponding sampling period.
3.1 Snow physical characteristics
Snow density profiles exhibited typical Arctic tundra characteristics of high-density near-surface wind crust and lower density basal depth hoar layers (Fig. 2, a to f). Depth hoar layers were most pronounced in T1-Shrub and T2-Mixed, and T5-Inlet, with median wind crust densities of 297 ±70 kg m−3 and depth hoar densities of 223 ± 46 kg m−3. Greater spread in T3-Tussock mid-snowpack densities may indicate several harder snow layers forming during consecutive high wind events as the snowpack built over winter. Snowpacks were dry and free of discrete ice lenses or basal ice layers at all microsites throughout transects.
Pronounced microtopography and shallow snow in T3-Tussock created more variable density profiles, corroborating with observed variable wind crust presence and profile depth. T4 forest snowpack were deeper than for other transects but had similar profiles of high-density surface layers overlying lower density depth hoar (wind crust Md: 314 ± 84 kg m−3, depth hoar Md: 219 ± 40 kg m−3).

Figure 2Normalised medians snow density profile with 25th/75th percentiles (dark) and 5th/95th percentile (light), for sampling transects T1 to T5 (a to e). (f) shows snow basal temperature and snow depth distribution per transect.
Snow depths and basal (soil-snow interface) temperatures (Fig. 2f) were strongly correlated (Pearson's Linear Correlation Coefficient, r=0.90, α< 0.01). Transect scale basal temperature and snow depth medians were significantly different (alpha < 1 %) to each other, except for T1-Shrub and T5-Inlet that had similar distributions. T3-Tussock basal temperatures were lowest with lowest snow depths (Md: −9.5 ± 0.8 °C, 440 ± 118 mm), contrasting with T4-Forest with highest basal temperatures and snow depths (Md: −2.7 ± 2.6 °C, 1280 ± 343 mm). Basal temperature and snow depth distributions in other transects are all found between T3-Tussock and T4-Forest ranges, with the T2-Mixed significantly colder (α< 0.05) than T1 and T5. Transect density, basal temperature, and snow depths are summarised in Table 2.
Table 2Transect scale summary of sampled microsites taken at the TVC site in late March 2024.

Notes: * Numbers within [square brackets] show interquartile range. CO2 median fluxes are shown in mgC instead of gC for table readability. Highest flux magnitudes are in bold, with CH4 uptake in italic.
3.2 Carbon dioxide and methane concentration profiles
Individual snowpack CO2 and CH4 concentration profile analysis revealed that most profiles across transects T1-Shrub, T2-Mixed, T4-Forest, and T5-Inlet were explained with high certainty by simple linear models. Transect T3-Tussock microsites contained weak GHG gradients, where the majority of snowpack CO2 and CH4 concentrations were not significantly different to atmospheric concentrations with 80 % (CO2) and 56 % (CH4) of gradient p-values > 0.05. Although well explained by linear models (gradient p-value < 0.05), some profiles display nonlinearity, suggesting the influence of snowpack vertical structure for some locations.
Transect scale concentration profile linearity were also examined by aggregating normalised CO2 and CH4 concentrations as a function of depth (Fig. 3). Linear models were fitted to each normalised gas species (CO2 and CH4) with model 95 % confidence intervals illustrating the level of certainty about the model. Normalised T1-Shrub concentration gradients show positive linear trends for both CO2 and CH4, with variance well explained by the model (R2 > 0.75), indicating a strongly linear trend across all profiles. T2-Mixed has similar relationship to T1-Shrub but shows more spread (R2> 0.55), suggesting either more variance in flux magnitudes or less linearity in concentration profiles. T3-Tussock shows positive gradients for both gas species, with CO2 variance being poorly explained (R2 < 0.1) while CH4 shows a tighter albeit poor fit (R2=0.37). T4-Forest concentration profiles are the most linear for both CO2 and CH4 with very little spread around the linear model (R2> 0.85), indicating the least dependence to vertical snow structure. Contrarily to all other transects, All T4-Forest CH4 vs. depth gradients are negative, indicating a net CH4 uptake in the forested area. T5-Inlet CO2 profiles are also strongly linear (R2=0.75), while CH4 show more spread (R2=0.35), with 76 % of profile gradients significant (p-value < 0.05). Similarly to T3-Tussock, several profiles across T5 had CH4 concentrations near atmospheric levels, with a few profiles with high basal concentrations. T5-Inlet was the most varied in terms of land cover type, i.e., dry shallow snowpack slope, and wet high snowpack drainage channel.
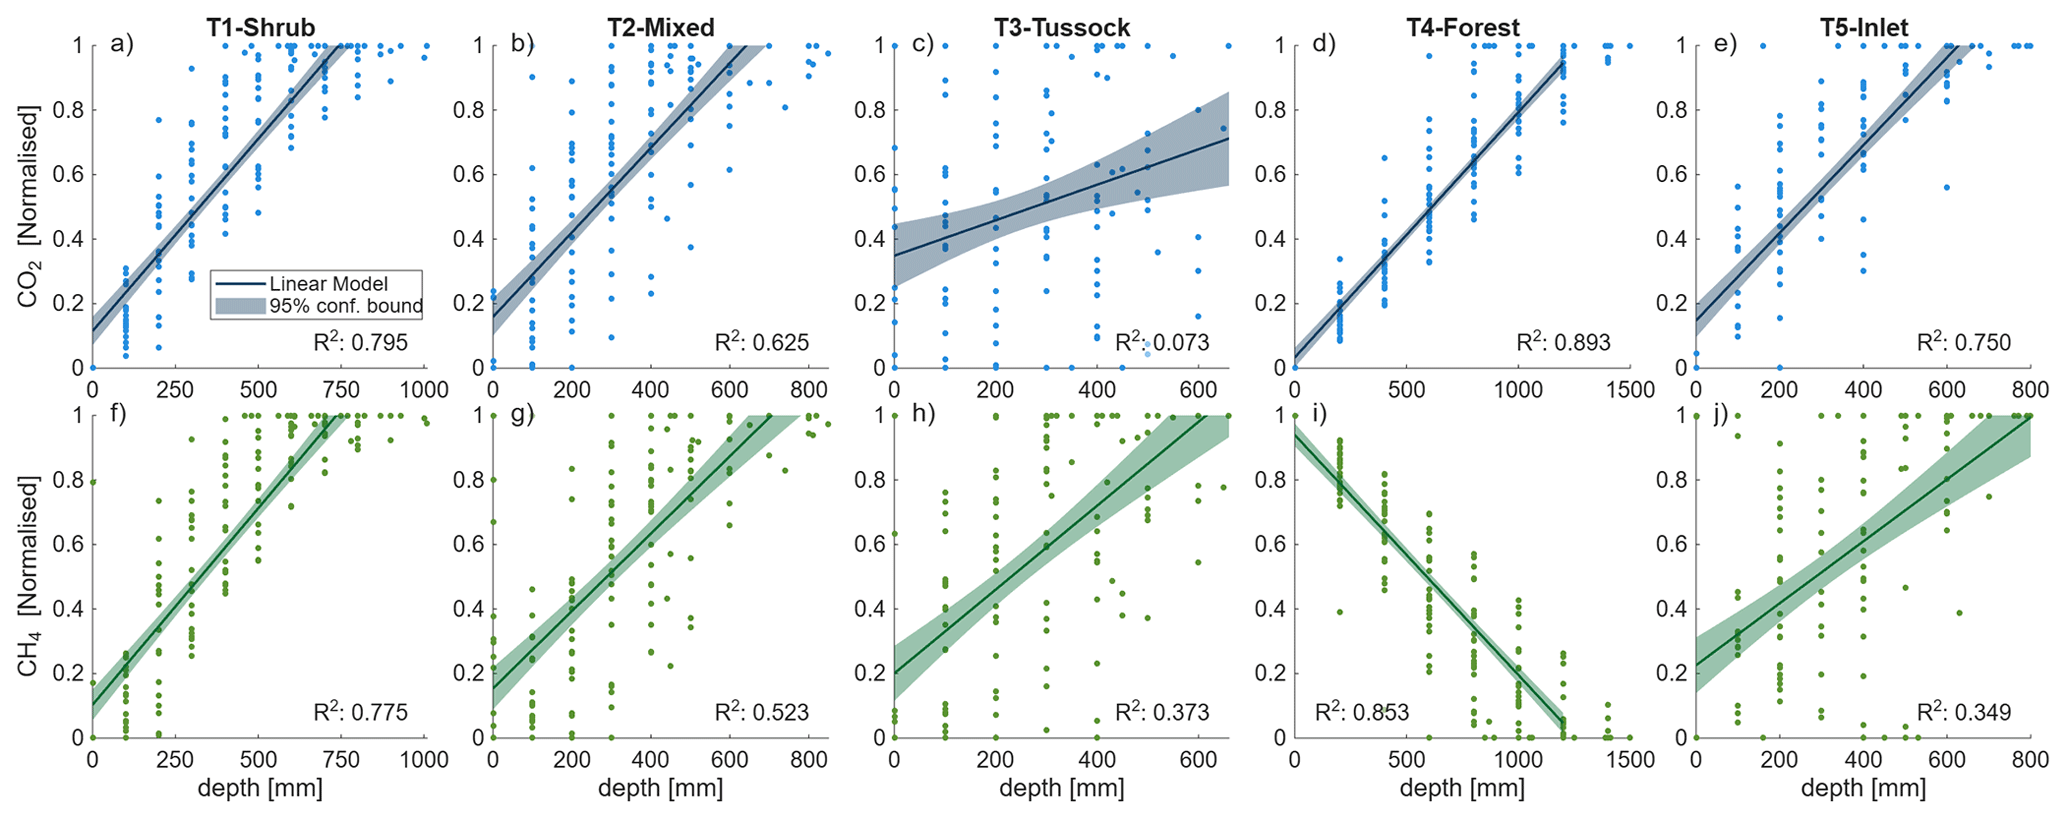
Figure 3Linear model fit through depth normalised CO2 (a–e) and CH4 (f–j) concentration profiles across TVC transects. Profiles are aggregated per transect to illustrate consistency of profile shape; individual microsite gradients were fitted separately and used for all flux calculations. All gradients are significant with p-values < 0.01 (T test).
3.3 Carbon dioxide and methane fluxes
Instantaneous CO2 and CH4 fluxes ( and , respectively) through the snowpack for each vertical profile were calculated using paired snow gas concentrations and snow density profiles, aggregated by transect (Fig. 4). Distributions of CO2 fluxes closely correspond with snow depth distributions, which strongly control soil surface temperatures. Distributions of fluxes between transects were all significantly different to one another except for T1-Shrub and T5-Inlet. Very low fluxes at T3 coincide with the shallowest snowpacks and coldest basal temperatures. Median CO2 and CH4 fluxes at T4-Forest were an order of magnitude higher than other transects, coinciding with the deepest snowpacks and warmest basal temperatures. Five high CO2 emitting outliers were found in T2-Mixed, and T3-Tussock, T4-Forest.

Figure 4Transect scale instantaneous CO2 (a) and CH4 (b) fluxes ( and , respectively) Median snow depths per transect are shown above the CO2 box and whisker plots in italic. Note the change of unit scale between left and right panels.
Methane fluxes through the snowpack did not follow the same pattern as CO2 fluxes Instead, significant net CH4 uptake () was found throughout T4-Forest where snowpacks are thickest and basal temperatures in frozen soils are warmer than −3 °C. Low positive CH4 fluxes were found across T2-Mixed with T1-Shrub and T3-Tussock, including some high emitting profiles where net fluxes were one order of magnitude higher than profile medians. T5-Inlet CH4 fluxes had most variability with weak net uptakes and strongly emitting profiles which show little correlation to snowpack depth and basal temperatures (R2=0.06 and −0.02, respectively), contrary to patterns in CO2 fluxes (Table 2).
We found a significant relationship between T4-Forest microsite rates of net CH4 uptake (negative ) and (Fig. 5). Although significantly related (p-value < 0.01), T4-Forest to ratios are still poorly explained by magnitudes alone with an R2=0.14. Spread around the linear model is partially explained by basal temperatures, increasing proportionally more with warmer soil surfaces than CH4 uptake rates.

Figure 5CH4 uptake rates (negative ) as a function of respiratory along T4-Forest. Flux uncertainties are shown by the grey error bars.
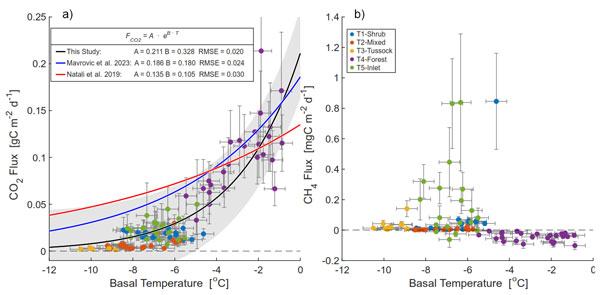
Measured CO2 fluxes followed an exponential relationship to basal temperatures, with R2 of 0.79 and RMSE of 0.020, most situated within the model's 95 % regression parameter confidence interval (Fig. 6). A two-parameter exponential regression curve was fitted on and basal temperature, and compared to relationships found elsewhere (Natali et al., 2019; Mavrovic et al., 2023). While within this study's 95 % regression parameter confidence interval, Mavrovic et al. (2023) overestimated fluxes with basal temperatures below −4 °C relative to our study, whereas Natali et al. (2019) overestimated low temperature CO2 fluxes (as noted in Mavrovic et al., 2023). This may be due to our study including a substantial number of fluxes measured at temperatures of −6 to −0.5 °C, which were insufficiently represented in previous datasets.

Figure 6(a) CO2 flux as a function of snowpack basal temperature, with exponential model fit for this study and similar studies in winter Arctic environments. Shaded area represents the 95 % regression parameter confidence interval around this study's exponential model (black line). (b) CH4 flux as a function of soil-snow interface temperature. Soil temperature and flux uncertainty propagated from measurements and flux calculations are shown by the grey error bars.
Methane fluxes have less distinct relationship with soil surface temperature than CO2 fluxes. T1-Shrub, T2-Mixed and T3-Tussock microsites were all below −6 °C and showed very little CH4 emissions, with two high emitting microsites (up to 0.58 mgC m−2 d−1 or 0.56 nmol m−2 s−1) in the coldest transect T3. All fluxes measured in T4-Forest and had basal temperatures were above −5 °C and showed weak net CH4 sinks between 0 and −0.1 mgC m−2 d−1 (−0.10 nmol m−2 s−1). Although within the same temperature range as T1-Shrub and T2-Mixed (−8 °C < T < −4.5 °C), T5-Inlet had the highest CH4 emissions with three profiles displaying uptake of the same magnitude as T4-Tussock. T5-Inlet had the most diverse surface vegetation and snow depths across its sampling transect, with the first 100 m of the transect situated on a well-drained and wind scoured eastward facing slope covered with dwarf birch, and the second 100 m along the lake inlet with taller alder shrubs, tussocks and several micro drainage channels which are generally saturated with water across the shoulder and growing seasons.
3.4 Sampling method analysis
We separately calculated and from only basal and near surface, and from snow basal and average ambient air samples to assess advantages and need for snow gas profiles. Both subsampling strategies tightly predicted fluxes similar to those fluxes calculated using multiple evenly spaced snowpack samples (Fig. 7). Both subsampling methods showed near 1:1 ratio for and with R2> 0.99 and RMSE two orders of magnitude smaller than and one order of magnitude smaller than . As two-sample and one-sample methods show similar linear relationships, concentration gradient and consequently vertical fluxes have been shown to be almost entirely driven by the snowpack basal concentration.

Figure 7Linear model fitted to (a, c) and (b, d) calculated from snowpack basal and near surface profile (top) samples, and from basal profile samples and average ambient air (bottom). Dotted lines show the 1:1 ratio line and shaded areas show the linear model 95 % confidence intervals.
Transect subsampling comparisons show that Mdn variability remains within 90 % of the fully sampled dataset Mdfull with n>9 in transects T1-Shrub, T4-Forest, and T5-Inlet, and n > 16 for T3-Tussock (Fig. 8). T3-Tussock subsampled Mdn did not stabilise within subsamples suggesting surface cover variability within T3 may require a larger sampling size than we conducted (n > 25). transect Mdn required more subsamples to capture surface cover scale variability in Mdfull, with n> 12 for T2-Mixed and T4-Forest, while other transects required n > 20 when comparing means but did not reach a stable plateau within N samples when comparing medians. TVC site scale analysis (black lines Fig. 8a and b) shows that were within 90 % of Mdfull with transect n> 12 for medians and n> 13 for means, while CH4 failed to be adequately reproduced with subsamples below N.

Figure 8Surface cover subsampling analysis. Horizontal axes show the number of subsamples (Mdn) randomly selected from total number of measurements from each surface cover transect picked out of the total number of samples. Vertical axes show the proportion of times the ratio of medians of subsamples and all measurements in a transect (Mdn Mdfull) were within 19.4 % Mdfull. The thicker black line shows the same exercise combining all transects.
4.1 Transect scale CO2 and CH4 fluxes
We consistently observed positive (soil-to-atmosphere) CO2 emissions () at all microsites with significantly different rates between surface cover transects. Instantaneous were similar to those derived using syringe extraction methods by Mavrovic et al. (2023) at TVC during the late 2022 and 2023 winters, and comparable to pan-Arctic measurements using comparable in-situ concentration measurements or a wide range of other techniques including eddy covariance and flux chambers (Natali et al., 2019; Pirk et al., 2016; Webb et al., 2016). However, our study resolved a paucity of Arctic at soil temperatures between −6 and 0 °C. Filling this measurement gap reduced error in exponential model fits by 0.01 and 0.004 gC m−2 d−1 for Natali et al. (2019) and Mavrovic et al. (2023), respectively (Fig. 6a). A wide basal temperature range and lower uncertainty at temperatures below −6 °C, constrains exponential response to soil temperature, indicating tends to zero at lower temperatures observed at TVC ( °C).
Measured winter CO2 flux magnitudes at TVC are consistent with early observations from Arctic Alaska showing sustained cold-season emissions under snow cover (Fahnestock et al., 1998, 1999; Jones et al., 1999b; Welker et al., 2000). Subsequent work has demonstrated that snow depth, thermal insulation, and active-layer dynamics exert strong controls on winter respiration and the age of respired carbon (Lupascu et al., 2018; Pedron et al., 2023; Schimel et al., 2006; Sullivan et al., 2008). Measurements at TVC extend these findings by resolving fine-scale spatial variability in winter fluxes and by evaluating how simplified sampling strategies capture this variability under dry snowpack conditions.
Significant differences in the magnitudes of between transects coincide with spatial patterns of basal temperatures, indicating CO2 emissions from each surface cover are dominated by microbial respiration in frozen soils (Pedron et al., 2022). Consistently high emitting microsites in T4-Forest are typical of fluxes observed in permafrost free northern boreal forests with similar snow depths (Mavrovic et al., 2023). Near zero basal temperatures at T4-Forest suggest a portion of the vertical soil column might remain at or near zero-curtain conditions, a narrow temperature range (0.05 °C) in which changes in heat energy alters the phase of water without changing soil temperature (Zona et al., 2016; Lupascu et al., 2018; Devoie et al., 2022). outliers (Fig. 4) at low surface temperatures (basal temperature °C), may have resulted from wintertime microbial activity in localised warmer soil pockets, or slow release of trapped CO2 produced during autumn freeze-up similarly to those found in other tundra sites at similar latitudes (Pedron et al., 2022). Talik formations have been reported in dry tundra environments by Kim et al. (2021) at similar latitudes (Cambridge Bay, NU Canada), but have yet to be verified in TVC.
Consistent net uptake measured in the T4-Forest transect between −6 and 0 °C reveals that high-latitude forested soils can function as significant net sinks even under frozen conditions, representing an integrated balance of diffusive transport and microbial methanogenic and methanotrophic turnover within soils (Mast et al., 1998). Few measurements of wintertime CH4 uptake specific to land surface types have been reported in high-latitude tundra environments, mainly due to the historical difficulty of resolving low-magnitude fluxes through Arctic snowpacks. Recent studies have begun to address this gap, with winter CH4 uptake rates in northern closed-crown boreal forest uplands recently reported at −0.43 ± 0.34 to −0.47 ± 0.26 mg C m−2 d−1 (Mavrovic et al., 2025). For comparison, our observed winter forest uptake (−0.04 to 0.08 mg C m−2 d−1) represents a persistent, albeit diminished sink relative to peak growing season consumption. At TVC, automated chambers have recorded summer CH4 uptake rates for lichen and shrub communities between −0.37 and −0.44 mg C m−2 d−1 (converted from −0.49 to −0.59 mg CH4 m−2 d−1), suggesting winter forest uptake magnitudes are roughly one order of magnitude lower than peak summer rates in the same region (Voigt et al., 2023).
Landscape-scale tundra winter CH4 sinks have also been observed in Svalbard, Greenland, and Norway, where soil organic layers are less spatially pervasive than in TVC (D'Imperio et al., 2023; Donateo et al., 2025; Treat et al., 2018). In Svalbard's dry upland tundra, median CH4 fluxes remain negative throughout the winter, ranging from −0.18 to −0.37 mg C m−2 d−1 (reported as −0.17 to −0.36 nmol m−2 s−1), while notable net uptake events during the freezing shoulder season can reach −0.72 mg C m−2 d−1 (reported as −0.69 nmol m−2 s−1) (Donateo et al., 2025). Growing season and start-of-cold-season CH4 uptake measured at TVC across drier landforms, including upland tundra and polygonal rims, further suggest that methanotrophic activity persists long after plant senescence (Ivanova et al., 2025; Voigt et al., 2023).The magnitude of this winter sink is particularly important when contrasted with comparatively wetter tundra sites in Northern Alaska, where summer emissions from even relatively dry polygon rims can range from 4.5 to 9.6 mg C m−2 d−1 (McEwing et al., 2015). Comparisons between different pan-Arctic land covers highlight that while mid-winter CH4 uptake may be a small component of the annual budget, persistence of aerobic oxidation in well-drained forested and upland soils provides a non-negligible offset to winter CH4 emissions from saturated hotspots.
Near-zero basal temperatures at T4-Forest suggest that much of the near-surface soil profile likely remained at zero-curtain temperature conditions, When soil temperatures are poised near 0 °C due to release of latent heat during the phase transition of water to ice, allowing liquid water content and ice to coexist in soil pore space (Devoie et al., 2022; Tucker, 2014; Outcalt et al., 1990). Remaining liquid soil water over winter sustains microbial metabolic activity in thin films surrounding soil particles even at temperatures as low as −18 °C (Dutch et al., 2024; Elberling and Brandt, 2003; Sullivan et al., 2008).
Northern boreal forest CH4 uptake rates have been reported to be within the same order of magnitude as those found in T4-Forest, where soils also remained in zero-curtain conditions throughout winter (Lee et al., 2023; Mavrovic et al., 2025). Evidence for microbial CH4 consumption within the T4-Forest is provided by the significant inverse relationship between and (Fig. 5). This inverse relationship aligns with global patterns where winter CO2 emissions explain nearly 96 % of the variability in CH4 oxidation, effectively serving as a proxy for the biological activation and oxygen diffusion required for substrate consumption (Voigt et al., 2023; Kim et al., 2024). High-affinity methanotrophs likely maintain this activity in the aerobic upper soil layers during mid-winter; however, the preferential coupling of basal temperatures with CO2 rather than CH4 flux magnitudes suggests that CH4 consumption may also take place in deeper, relatively warmer soil layers (Donateo et al., 2025; Mikan et al., 2002). Further variability in CH4 uptake magnitudes could also be explained by oxygen, and the liquid portion of soil moisture available in upper soil horizons have been identified as important regulators of uptake (D'Imperio et al., 2023; Lee et al., 2023; Rößger et al., 2022).
However, soil temperature measurements taken at the soil-snow interface may be insufficient to infer liquid water availability across the upper soil layers. As the active layer typically freezes faster from the surface downward due to large soil-atmosphere thermal gradients, interface temperatures may drop below ideal temperatures for microbial activity, while deeper carbon-rich layers remain in a zero-curtain state for weeks or months longer (Pedron et al., 2022; Yi et al., 2020). Relying solely on surface temperatures contributes to the cold-soil temperature biases in carbon fluxes observed in terrestrial biosphere models such as CLM5.0, which often fail to resolve the extended duration of these subsurface thermal refugia and resulting non-growing season carbon losses (Damseaux et al., 2025; Dutch et al., 2024; Tao et al., 2021).
We also measured CH4 uptake in locations with notably cooler soils in T5-Inlet (temperature °C), which also contained the highest sitewide CH4 emitting microsites. The T5-Inlet transect crosses a lake inlet area that is typically saturated or submerged during the autumn shoulder season, forming a patchwork of dry grassy hummocks, tall alder shrubs, and 10–40 cm deep drainage channels often permeating the active layer. While soil surface temperatures in T5-Inlet did not differ significantly from those in T1-Shrub, greater heterogeneity in snow depths and elevated spatial variability in soil water saturation in T5-Inlet may account for enhanced positive and suppressed typical of anoxic environments. Conditions for preferentially anoxic microbial activity are likely driven by prolonged thermal retention in saturated microsites during winter due to increased latent heat release during freeze-up, similarly documented in hydrologically comparable “wet” tundra systems in northern Alaska (Blanc-Betes et al., 2025).
Alternatively observed net CH4 uptake in saturated landcovers may be limited by physical encapsulation of soil layers by ice, where basal ice or thick frozen soil layers creates an impermeable barrier occluding efflux of CH4 produced in deeper, unfrozen soil horizons (Elberling and Brandt, 2003; van Bochove et al., 2001). Such diffusion-limited transport, exacerbated by the occlusion of soil pores by ice, can decouple subsurface CH4 production from soil-atmosphere exchange, potentially resulting in apparent uptake signals if atmospheric CH4 is consumed in the uppermost aerated soil or if production is physically trapped at depth (Mavrovic et al., 2025; Treat et al., 2018; Schimel et al., 2006). Slower CH4 diffusion through ice-filled pores in frozen soils can further mask the temperature dependence of winter CH4 fluxes, suggesting that surface net uptake may reflect a lack of transport from deeper source layers rather than high methanotrophic potential (Mavrovic et al., 2025). Consequently, the fine-scale variability at T5-Inlet likely reflects a gradient where some microsites maintain active methanogenesis while others are governed by the passive trapping of greenhouse gases within the soil profile.
Further efforts to partition into its autotrophic and heterotrophic respiration components through isotopic analysis (e.g., Pirk et al., 2016) or via metagenomic sequencing may help identify the relative importance of soil surface temperature, liquid moisture availability and nutrient availability on CH4 flux, and allow estimation of CH4 specific temperature response curves under methanogenic or methanotrophic prevailing conditions. Identifying sampling locations prior to snowfall and optimizing repeated flux measurements to capture more variability in vegetation, soils, and hydrology, throughout the growing and autumn shoulder seasons would also allow process level understanding of abiotic and biotic drivers of flux variability, providing a more comprehensive dataset to upscale fluxes to landscape and regional spatial extents.
4.2 Profile linearity and flux uncertainty
Overall GHG concentrations throughout snowpacks were linear in nature (Fig. 3). Surprisingly, denser upper snowpack wind crust layers did not appear to limit CO2 and CH4 diffusion rates. Consistently significant linear fits across transects independent of snow depth (except T3-Tussock, where fluxes were too small) demonstrate that the snowpack acted as a uniform porous material (i.e., independent of snow structure). Concentrations at distinct vertical sampling points concentration profiles were reproducible across replicate profiles and consistent between full-profile and two-point flux estimates (Fig. 7), indicating that extraction did not draw down or homogenise air from different layers or ambient air. As GHG concentrations follow a linear trend from basal to air above snowpacks, microsite level concentration gradients are controlled by their respective basal concentrations. Future GHG emissions could therefore be estimated using basal concentration variability within landscapes.
Robust agreement between full-profile fluxes and estimates derived from basal and near-surface concentrations was evident under the predominantly dry, cold snowpack conditions encountered at TVC. Where snowpacks lack extensive ice layers and experience limited mid-winter melt-freeze cycles, molecular diffusion will remain the dominant transport mechanism. Melt-refreeze events promoting the formation of spatially coherent ice lenses within snowpacks may cause diffusive transport to deviate from linear assumptions and decouple subsurface microbial production from surface exchange (Elberling and Brandt, 2003; Mavrovic et al., 2023). Soil stratigraphic barriers or basal snowpack ice lenses can trap gases produced in deep soil layers, potentially leading to zero-gradient fluxes within the overlying snow despite ongoing soil metabolic activity
Non-linear departures in snowpack gas concentration profiles, particularly homogenization of gas concentrations observed in basal depth hoar layers, introduce a known potential for gradient underestimation (Dutch et al., 2022). Such concentration gradient (dC dz) underestimations, particularly in low carbon flux environments such as the T3-Tussock transect, may reflect a reduced concentration change over the sampled depth, resulting in and magnitudes that are lower than the actual soil metabolic flux rates or mechanical release. Wind-induced advection (wind pumping) can further perturb gradients in upper snow layers, although these effects are often transient and confined to periods of high wind speeds (Jones et al., 1999a; Mavrovic et al., 2025), although those effects were negated in this study by sampling while wind speeds remained below 3.5 m s−1.
Previous studies have also identified non-linear profiles in snowpack GHG distributions when impermeable soil layers were present (van Bochove et al., 2001). In such cases, using snowpack basal concentrations would likely overestimate instantaneous flux magnitudes, and would affect estimates in the timing of emissions rather than seasonal budget estimates. While profiles at TVC were predominantly linear, significant gas trapping below frozen soil barriers can artificially increase concentration gradients once released through thermal or mechanical cracking, or conversely, mask subsurface production entirely (Jones et al., 1999a). Such diffusion-limited transport decoupling suggests that measurements taken strictly within the snowpack may periodically reflect physical encapsulation rather than active biological oxidation (Elberling and Brandt, 2003; van Bochove et al., 2001).
The application of Fickian diffusion models to wintertime greenhouse gas exchange assumes linear concentration gradients through the snowpack. Uncertainty bounds (Figs. 5 and 6) incorporate the standard error associated with linear regression of concentration versus depth, accounting for variance introduced by non-linear yet significant vertical profile concentration gradients. Robustly quantification of uncertainty for and from both instrument measurement error and linear model uncertainty was then made possible. High resolution snow density profile measurements (SMP) and high precision in situ gas measurements using a portable IRGA allowed a tighter relationship between magnitudes and basal temperatures than comparable studies and gave statistical confidence on reported magnitudes in a low flux environment. Some profiles only became linear at 100 to 300 mm above the ground surface with concentrations homogenised below these depths. Profiles where CO2 and CH4 concentrations were more homogenous in the depth hoar layer likely caused gradient underestimation thus leading to lower and magnitudes. Conversely, bulk snowpack density and temperature values derived from the entire snow column could lead to and overestimation due to an underestimation of effective snow porosity and tortuosity, making the snowpack less resistant to vertical molecular diffusion. In either case, we recalculated and using per-microsite range of densities and air temperatures and found resulting instantaneous flux variability to be within reported propagated flux uncertainty.
We found CO2 and CH4 concentration measurement error from the portable IRGA to have negligible effect on and uncertainties, which were mostly controlled by snowpack gas concentration gradient confidence intervals. Flux uncertainties are often reported but rarely well constrained, whether from microsite scale measurements due to low sample size, or from integrated landscape scale flux measurements such as eddy covariance, where systematic errors are difficult to separate from random measurement uncertainty (Levy et al., 2022). The importance of accurate uncertainty quantification in greenhouse gas flux measurements is underscored by (Fisher et al., 2014), who highlighted the significant uncertainties in carbon cycle models for the Alaskan Arctic. Similarly, (Björkman et al., 2010) demonstrated that different methods for estimating winter CO2 effluxes can yield results that vary by up to two orders of magnitude, emphasizing the need for robust error analysis and uncertainty calculation. Measurement error propagation to and uncertainties presented here are nevertheless within similar magnitudes as snowpack gradient method derived fluxes reported by (Mavrovic et al., 2023, 2024).
4.3 Spatial variability and scalability
Understanding the distribution of spatial variance in CO2 and CH4 soil-atmosphere fluxes across different land surface types is vital to enable up-scaling to the landscape scale, where flux uncertainties must account for surface cover aggregation error. Past studies reporting winter fluxes have either compromised spatial coverage for temporally continuous data (Zhu et al., 2014; Seok et al., 2009), or report spatially aggregated landscape scale fluxes that pose challenges to partitioning into their component surface covers (Levy et al., 2022; Pirk et al., 2017). Fast, instantaneous CO2 and CH4 concentration measurements using a roving, high-precision portable IRGA and SMP allowed robust quantification of spatial variability within surface cover types. This is particularly relevant to upscaling small-scale fluxes from tens of metres to scales typically used in Terrestrial Biosphere Models (TBMs), where finer-scaled data is aggregated by averaging discrete data points to much larger grid cells (Levy et al., 2022).
Measurements from TVC can directly inform TBMs by providing high-resolution empirical bounds for temperature sensitivity (Q10) of cold-season biogeochemical processes as a primary source of uncertainty in Arctic carbon simulations (Dutch et al., 2024). The relationship between late-winter soil temperature, snow depth, and suggests that deterministic models using grid-cell mean snow depths likely underestimate winter activity by failing to capture the disproportionate contribution of from warmer frozen soils under deeper snow. Our findings suggest that bulk snowpack diffusivity remains a robust approximation for models, provided that refined snow thermal conductivity parameterizations are implemented to correct the cold soil temperature biases that currently inhibit accurate flux simulations. A need for revised temperature-response curves in Arctic tundra extends to CH4 dynamics; where persistent uptake observed in the forested transects indicates that current TBM methane production and oxidation schemes require better low temperature calibration to account for microbial oxidation occurring at soil temperatures below 0 °C. Following the process-based evaluation by Dutch et al. (2024), which highlighted how default model configurations often simulate near-zero winter fluxes at TVC due to overly restrictive soil moisture thresholds (Ψmin) and respiration temperature responses, a transition is recommended toward sub-pixel distribution-based parameterizations (e.g., probability density functions) that can represent sub-grid heterogeneity in snow insulation and soil thermal regimes.
Errors in the estimation of spatial variability using methods such as Bayesian Kriging can be constrained by informing the number of measurements needed to quantify spatial variability within homogenous surface covers (Levy et al., 2022). A subsampling experiment (Figure 8), demonstrated that at TVC the homogenous surface cover scale variance can generally be captured with n >=12 sampling sites, while larger sample sizes were needed for (n > 25). Both median and average and at T3-Tussock failed to be reproduced with fewer subsamples because fluxes were either one order of magnitude smaller than those found in other transects or were not significantly different to zero. T5-Inlet covered both a well-drained low snow slope and a flat high snow and historically wet drainage area, exhibiting both high CH4 emitting and low uptake microsites. Although closely grouped spatially (within 150 m), T5-Inlet's more heterogeneous snow depths and soil moisture (as well as associated nutrient availability), in contrast to other transects most likely explained why average and median were not well reproduced with subsamples. This suggests future scaling attempts should consider a data informed method, such as multivariate spatial interpolation (and prior information) to divide up land surface for spatial flux upscaling.
Vertical snow structure had little effect on concentration profile linearity (and thus and ), and surface cover scale flux could confidently be derived from concentrations near the soil-snow and air-snow interfaces (Fig. 7). We show no significant difference between calculating soil-atmosphere fluxes from basal snowpack CO2 and CH4 concentrations and ambient air above the snowpack, compared to calculations from a larger number of equally spaced samples throughout the snowpack. Together these findings reduce the measurement burden needed for rapid in situ instantaneous flux measurement, opening up potential for landscape-scale and winter budgets at larger spatial scales using remotely sensed snow properties while expanding measurement spatial coverage improving quantification of variability over a wider set of surface covers (Dutch et al., 2024; Ivanova et al., 2026; Virkkala et al., 2022).
This study quantified wintertime CO2 and CH4 fluxes across contrasting tundra surface covers in the western Canadian Arctic, linking snowpack structure and soil surface temperatures to 10 m spatial variability in winter carbon fluxes. Our results provide valuable guidance for refining sampling protocols and provide key observational constraints for improving terrestrial biosphere model representations of Arctic winter carbon dynamics under ongoing climatic warming. Key findings presented in this work are:
-
Carbon dioxide emissions were evident throughout TVC, but at significantly different rates within and between surface cover transects, primarily driven by basal soil temperature and local snow depth.
-
Methane uptake was consistent throughout the forested transect (T4-Forest), bacterial methanotrophic activity in upper soil layers.
-
Vertical snow structure has little effect on concentration profile linearity (and thus and ). Reliable flux estimates using the snow gradient diffusion method were obtained using only near-surface and basal gas concentration measurements, reducing the need for full-depth gas profiles in future studies.
-
Small-scale heterogeneity (10 m spacing) in snow depth, soil thermal regime, and vegetation exerts strong controls on wintertime CO2 and CH4 flux dynamics.
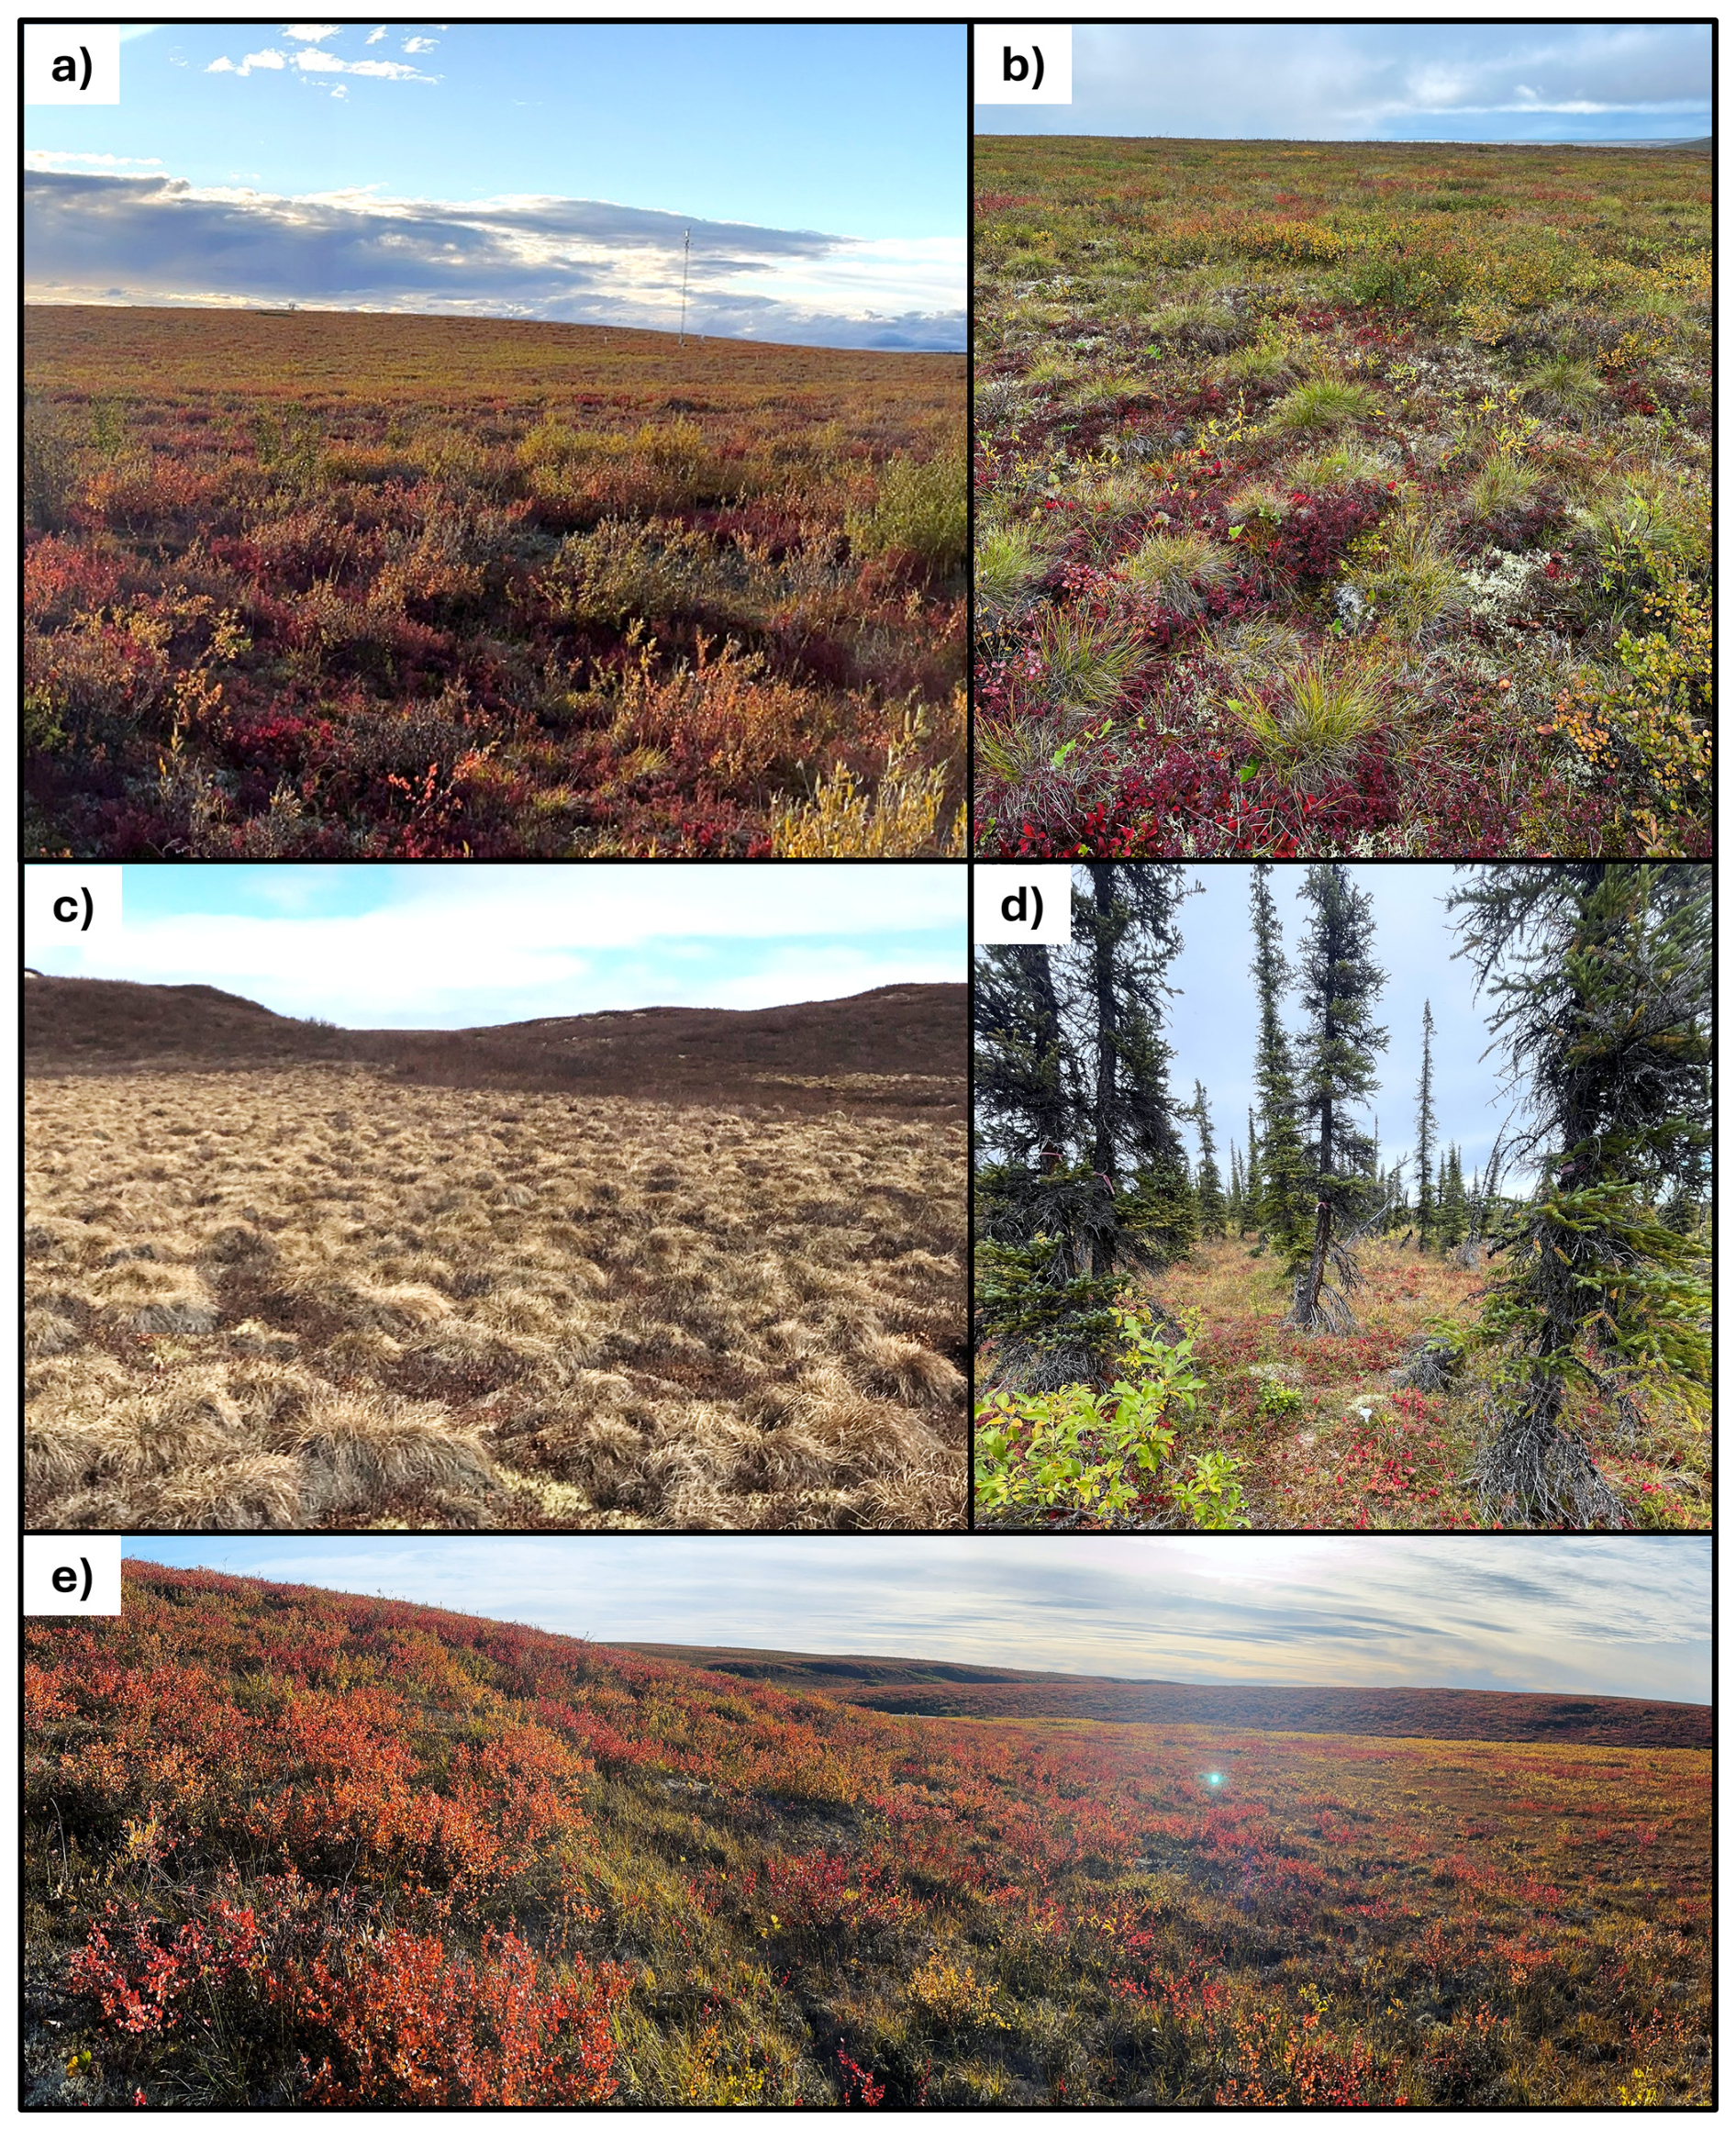
Figure A1Snow free photos of vegetative cover at measurement transects. (a) T1-Shrub: dwarf birch shrub dominated with mosses and lichen; (b) T2-Mixed: mix of dwarf shrubs; lichens, and tussocks, (c) T3-Tussock: tussock field; (d) T4-Forest: black and white spruce sparsely forested area; (e) T5-Inlet: tussocks, alder shrubs in a lake inlet area, dwarf birch on neighbouring slope. Photo credits: Gabriel Hould Gosselin (a, d, e) and Kathryn Bennett (b, c).
Data needed to create plots and corresponding MATLAB scripts are available at: https://doi.org/10.5281/zenodo.23223688 (Hould Gosselin, 2026).
GHG: Data collection, data curation formal analysis, writing – original draft, review, and editing. NR: Supervision, data collection, writing – review and editing. PJM: Supervision, data collection, writing – review and editing. PM: Writing – review and editing, funding and logistical support. OS: Writing – review and editing, funding and logistical support.
The contact author has declared that none of the authors has any competing interests.
Publisher's note: Copernicus Publications remains neutral with regard to jurisdictional claims made in the text, published maps, institutional affiliations, or any other geographical representation in this paper. The authors bear the ultimate responsibility for providing appropriate place names. Views expressed in the text are those of the authors and do not necessarily reflect the views of the publisher.
This article is part of the special issue “Cryospheric ecosystems: climate feedback loops, threatened ecosystems, and consequences of climate change”. It is not associated with a conference.
The authors would like to thank the Inuvialuit community of Inuvik and the Aurora Research Institute granting permission to conduct our research in their homeland; to Bruno Lecavalier and Joseph Durat for help in field data collection, Joëlle Voglimacci-Stephanopoli and Neil Ross for constructive inputs while writing the manuscript, to Branden Walker which helped facilitate fieldwork operations while in TVC, and to Kathryn Bennett for sharing TVC photos. We acknowledge the Wilfrid Laurier University Trail Valley Creek research station for site access, logistical support, and long-term environmental data. The authors note that generative AI (Chat GPT 2025) was used for text editing and language polishing.
Gabriel Hould Gosselin greatly acknowledges the financial support of the UK Natural Research Council (NERC One Planet Doctoral Training Partnership) and Natural Sciences and Engineering Research Council of Canada NSERC (PGS-D funding reference no. 598832). The work was supported by a UK National Environmental Research Council (NERC) Seedcorn grant awarded to Nick Rutter and Paul J. Mann; Carbon Emissions Under Arctic Snow (CEAS) (project reference NE/W003686/1). Oliver Sonnentag acknowledges financial support through the Canada Research Chair Tier 1 (grant no. CRC-2018-00259) and NSERC Discovery Grants programs (grant no. DGPIN-2018-05743) and ArcticNet, a Network of Centres of Excellence Canada (grant no. P216).
This paper was edited by Roberto Ambrosini and reviewed by two anonymous referees.
Aanderud, Z. T., Jones, S. E., Schoolmaster, D. R., Fierer, N., and Lennon, J. T.: Sensitivity of soil respiration and microbial communities to altered snowfall, Soil Biol. Biochem., 57, 217–227, https://doi.org/10.1016/j.soilbio.2012.07.022, 2013.
Baldocchi, D. D. D.: Assessing the eddy covariance technique for evaluating carbon dioxide exchange rates of ecosystems: Past, present and future, Glob. Change Biol., 9, 479–492, https://doi.org/10.1046/j.1365-2486.2003.00629.x, 2003.
Bekryaev, R. V., Polyakov, I. V., and Alexeev, V. A.: Role of polar amplification in long-term surface air temperature variations and modern arctic warming, J. Climate, 23, 3888–3906, https://doi.org/10.1175/2010JCLI3297.1, 2010.
Björkman, M. P., Morgner, E., Cooper, E. J., Elberling, B., Klemedtsson, L., and Björk, R. G.: Winter carbon dioxide effluxes from Arctic ecosystems: An overview and comparison of methodologies, Global Biogeochem. Cy., 24, 2009GB003667, https://doi.org/10.1029/2009GB003667, 2010.
Blanc-Betes, E., Welker, J. M., Gomez-Casanovas, N., DeLucia, E. H., Peñuelas, J., De Oliveira, E. D., and Gonzalez-Meler, M. A.: Strong legacies of emerging trends in winter precipitation on the carbon-climate feedback from Arctic tundra, Sci. Total Environ., 962, 178246, https://doi.org/10.1016/j.scitotenv.2024.178246, 2025.
van Bochove, E., Thériault, G., Rochette, P., Jones, H. G., and Pomeroy, J. W.: Thick ice layers in snow and frozen soil affecting gas emissions from agricultural soils during winter, J. Geophys. Res.-Atmos., 106, 23061–23071, https://doi.org/10.1029/2000JD000044, 2001.
Bowling, D. R. and Massman, W. J.: Persistent wind-induced enhancement of diffusive CO2 transport in a mountain forest snowpack, J. Geophys. Res.-Biogeo., 116, https://doi.org/10.1029/2011JG001722, 2011.
Burn, C. R. and Kokelj, S. V.: The environment and permafrost of the Mackenzie Delta area, Permafrost Periglac., 20, 83–105, https://doi.org/10.1002/ppp.655, 2009.
Busseau, B.-C., Royer, A., Roy, A., Langlois, A., and Domine, F.: Analysis of snow-vegetation interactions in the low Arctic-Subarctic transition zone (northeastern Canada), Phys. Geogr., 38, 159–175, https://doi.org/10.1080/02723646.2017.1283477, 2017.
Colbeck, S. C.: Model of wind pumping for layered snow, J. Glaciol., 43, 60–65, https://doi.org/10.3189/S002214300000280X, 1997.
Damseaux, A., Matthes, H., Dutch, V. R., Wake, L., and Rutter, N.: Impact of snow thermal conductivity schemes on pan-Arctic permafrost dynamics in the Community Land Model version 5.0, The Cryosphere, 19, 1539–1558, https://doi.org/10.5194/tc-19-1539-2025, 2025.
Devoie, É. G., Gruber, S., and McKenzie, J. M.: A repository of measured soil freezing characteristic curves: 1921 to 2021, Earth Syst. Sci. Data, 14, 3365–3377, https://doi.org/10.5194/essd-14-3365-2022, 2022.
D'Imperio, L., Li, B.-B., Tiedje, J. M., Oh, Y., Christiansen, J. R., Kepfer-Rojas, S., Westergaard-Nielsen, A., Brandt, K. K., Holm, P. E., Wang, P., Ambus, P., and Elberling, B.: Spatial controls of methane uptake in upland soils across climatic and geological regions in Greenland, Commun. Earth Environ., 4, 461, https://doi.org/10.1038/s43247-023-01143-3, 2023.
Domine, F., Barrere, M., and Sarrazin, D.: Seasonal evolution of the effective thermal conductivity of the snow and the soil in high Arctic herb tundra at Bylot Island, Canada, The Cryosphere, 10, 2573–2588, https://doi.org/10.5194/tc-10-2573-2016, 2016.
Domine, F., Fourteau, K., Picard, G., Lackner, G., Sarrazin, D., and Poirier, M.: Permafrost cooled in winter by thermal bridging through snow-covered shrub branches, Nat. Geosci., 15, 554–560, https://doi.org/10.1038/s41561-022-00979-2, 2022.
Donateo, A., Famulari, D., Giovannelli, D., Mariani, A., Mazzola, M., Decesari, S., and Pappaccogli, G.: Observations of methane net sinks in the upland Arctic tundra, Biogeosciences, 22, 2889–2908, https://doi.org/10.5194/bg-22-2889-2025, 2025.
Du Plessis, J. P. and Masliyah, J. H.: Flow through isotropic granular porous media, Transport Porous Med., 6, 207–221, https://doi.org/10.1007/BF00208950, 1991.
Dutch, V. R., Rutter, N., Wake, L., Sandells, M., Derksen, C., Walker, B., Hould Gosselin, G., Sonnentag, O., Essery, R., Kelly, R., Marsh, P., King, J., and Boike, J.: Impact of measured and simulated tundra snowpack properties on heat transfer, The Cryosphere, 16, 4201–4222, https://doi.org/10.5194/tc-16-4201-2022, 2022.
Dutch, V. R., Rutter, N., Wake, L., Sonnentag, O., Hould Gosselin, G., Sandells, M., Derksen, C., Walker, B., Meyer, G., Essery, R., Kelly, R., Marsh, P., Boike, J., and Detto, M.: Simulating net ecosystem exchange under seasonal snow cover at an Arctic tundra site, Biogeosciences, 21, 825–841, https://doi.org/10.5194/bg-21-825-2024, 2024.
Elberling, B. and Brandt, K. K.: Uncoupling of microbial CO2 production and release in frozen soil and its implications for field studies of arctic C cycling, Soil Biol. Biochem., 35, 263–272, https://doi.org/10.1016/S0038-0717(02)00258-4, 2003.
Environment and Climate Change Canada: Climate Data, Environment and Climate Change Canada, http://climate.weather.gc.ca/climate_normals/ (last access: 1 September 2024), 2024.
Ernakovich, J. G., Hopping, K. A., Berdanier, A. B., Simpson, R. T., Kachergis, E. J., Steltzer, H., and Wallenstein, M. D.: Predicted responses of arctic and alpine ecosystems to altered seasonality under climate change, Glob. Change Biol., 20, 3256–3269, https://doi.org/10.1111/gcb.12568, 2014.
Fahnestock, J. T., Jones, M. H., Brooks, P. D., Walker, D. A., and Welker, J. M.: Winter and early spring CO2 efflux from tundra communities of northern Alaska, J. Geophys. Res.-Atmos., 103, 29023–29027, https://doi.org/10.1029/98JD00805, 1998.
Fahnestock, J. T., Jones, M. H., and Welker, J. M.: Wintertime CO2 efflux from Arctic soils: Implications for annual carbon budgets, Global Biogeochem. Cy., 13, 775–779, https://doi.org/10.1029/1999GB900006, 1999.
Fisher, J. B., Sikka, M., Oechel, W. C., Huntzinger, D. N., Melton, J. R., Koven, C. D., Ahlström, A., Arain, M. A., Baker, I., Chen, J. M., Ciais, P., Davidson, C., Dietze, M., El-Masri, B., Hayes, D., Huntingford, C., Jain, A. K., Levy, P. E., Lomas, M. R., Poulter, B., Price, D., Sahoo, A. K., Schaefer, K., Tian, H., Tomelleri, E., Verbeeck, H., Viovy, N., Wania, R., Zeng, N., and Miller, C. E.: Carbon cycle uncertainty in the Alaskan Arctic, Biogeosciences, 11, 4271–4288, https://doi.org/10.5194/bg-11-4271-2014, 2014.
Graveline, V., Helbig, M., Gosselin, G. H., Alcock, H., Detto, M., Walker, B., Marsh, P., and Sonnentag, O.: Surface-atmosphere energy exchanges and their effects on surface climate and atmospheric boundary layer characteristics in the forest-tundra ecotone in northwestern Canada, Agr. Forest Meteorol., 350, 109996, https://doi.org/10.1016/j.agrformet.2024.109996, 2024.
Gruber, S.: Derivation and analysis of a high-resolution estimate of global permafrost zonation, The Cryosphere, 6, 221–233, https://doi.org/10.5194/tc-6-221-2012, 2012.
Grünberg, I. and Boike, J.: Vegetation map of Trail Valley Creek, Northwest Territories, Canada, PANGAEA [data set], https://doi.org/10.1594/PANGAEA.904270, 2019.
Haynes, W. M. (Ed.): CRC Handbook of Chemistry and Physics, 97th edn., CRC Press, Boca Raton, 2670 pp., ISBN 978-1-4987-5429-3, 2016.
Hould Gosselin, G.: ghgosselin/Biogeosciences1_Gabriel_Hould_Gosselin: v1.0.0: Code and data for Hould Gosselin et al., Fine-scale spatial variability of winter CO2 and CH4 fluxes in Arctic tundra (Biogeosciences) (Version v1.0.0), Zenodo [data set] and [code], https://doi.org/10.5281/zenodo.23223688, 2026.
Ivanova, K., Virkkala, A.-M., Vogt, J., Bieniada, A., Küchenmeister, A., Kolle, O. E. E., Sonnentag, O., Lecavalier, B., and Göckede, M.: Small-Scale Spatial Variability in Carbon Fluxes Driven by Soil and Vegetation Characteristics in Wetlands of Trail Valley Creek, Canada, https://doi.org/10.22541/essoar.175855718.85179582/v1, 2025.
Ivanova, K., Virkkala, A.-M., Brovkin, V., Stacke, T., Widhalm, B., Bartsch, A., Voigt, C., Sonnentag, O., and Göckede, M.: High-resolution remote sensing and machine-learning-based upscaling of methane fluxes: a case study in the Western Canadian tundra, Biogeosciences, 23, 233–262, https://doi.org/10.5194/bg-23-233-2026, 2026.
Jones, H. G., Pomeroy, J. W., Davies, T. D., Tranter, M., and Marsh, P.: CO in Arctic snow cover: landscape form, in-pack gas concentration gradients, and the implications for the estimation of gaseous fluxes, Hydrol. Process., 13, 2977–2989, 1999a.
Jones, M. H., Fahnestock, J. T., and Welker, J. M.: Early and Late Winter CO2 Efflux from Arctic Tundra in the Kuparuk River Watershed, Alaska, U.S.A., Arct. Antarct. Alp. Res., 31, 187–190, https://doi.org/10.1080/15230430.1999.12003296, 1999b.
Ju, J. and Masek, J. G.: The vegetation greenness trend in Canada and US Alaska from 1984–2012 Landsat data, Remote Sens. Environ., 176, 1–16, https://doi.org/10.1016/j.rse.2016.01.001, 2016.
KBM Resources Group: Aerial Survey & Geomatics: Aerial Survey Report – SYS9 – VQ-780II-S/Ultracam, 24_NWT_TVC, KBM Resources Group, 5103 48th St. 2nd Floor Waldron Building Yellowknife, NT X1A 1N5, https://kbm.ca/geomatics/lidar/ (last access: 13 August 2024), 2024.
Kim, K., Lee, J., Ju, H., Jung, J. Y., Chae, N., Chi, J., Kwon, M. J., Lee, B. Y., Wagner, J., and Kim, J.-S.: Time-lapse electrical resistivity tomography and ground penetrating radar mapping of the active layer of permafrost across a snow fence in Cambridge Bay, Nunavut Territory, Canada: correlation interpretation using vegetation and meteorological data, Geosci. J., 25, 877–890, https://doi.org/10.1007/s12303-021-0021-7, 2021.
Kim, Y., Tsunogai, S., and Tanaka, N.: Interrelationships of CO2, CH4, and N2O fluxes in snow-covered temperate soils, Northern Japan, Polar Sci., 41, 101073, https://doi.org/10.1016/j.polar.2024.101073, 2024.
Kinar, N. J. and Pomeroy, J. W.: Measurement of the physical properties of the snowpack, Rev. Geophys., 53, 481–544, https://doi.org/10.1002/2015RG000481, 2015.
Lawrence, D. M., Fisher, R. A., Koven, C. D., Oleson, K. W., Swenson, S. C., Bonan, G., Collier, N., Ghimire, B., Van Kampenhout, L., Kennedy, D., Kluzek, E., Lawrence, P. J., Li, F., Li, H., Lombardozzi, D., Riley, W. J., Sacks, W. J., Shi, M., Vertenstein, M., Wieder, W. R., Xu, C., Ali, A. A., Badger, A. M., Bisht, G., Van Den Broeke, M., Brunke, M. A., Burns, S. P., Buzan, J., Clark, M., Craig, A., Dahlin, K., Drewniak, B., Fisher, J. B., Flanner, M., Fox, A. M., Gentine, P., Hoffman, F., Keppel-Aleks, G., Knox, R., Kumar, S., Lenaerts, J., Leung, L. R., Lipscomb, W. H., Lu, Y., Pandey, A., Pelletier, J. D., Perket, J., Randerson, J. T., Ricciuto, D. M., Sanderson, B. M., Slater, A., Subin, Z. M., Tang, J., Thomas, R. Q., Val Martin, M., and Zeng, X.: The Community Land Model Version 5: Description of New Features, Benchmarking, and Impact of Forcing Uncertainty, J. Adv. Model. Earth Sy., 11, 4245–4287, https://doi.org/10.1029/2018MS001583, 2019.
Lee, J., Oh, Y., Lee, S. T., Seo, Y. O., Yun, J., Yang, Y., Kim, J., Zhuang, Q., and Kang, H.: Soil organic carbon is a key determinant of CH4 sink in global forest soils, Nat. Commun., 14, 3110, https://doi.org/10.1038/s41467-023-38905-8, 2023.
Levy, P., Clement, R., Cowan, N., Keane, B., Myrgiotis, V., van Oijen, M., Smallman, T. L., Toet, S., and Williams, M.: Challenges in Scaling Up Greenhouse Gas Fluxes: Experience From the UK Greenhouse Gas Emissions and Feedbacks Program, J. Geophys. Res.-Biogeo., 127, e2021JG006743, https://doi.org/10.1029/2021JG006743, 2022.
Ludwig, S. M., Schiferl, L., Hung, J., Natali, S. M., and Commane, R.: Resolving heterogeneous fluxes from tundra halves the growing season carbon budget, Biogeosciences, 21, 1301–1321, https://doi.org/10.5194/bg-21-1301-2024, 2024.
Lupascu, M., Czimczik, C. I., Welker, M. C., Ziolkowski, L. A., Cooper, E. J., and Welker, J. M.: Winter Ecosystem Respiration and Sources of CO2 From the High Arctic Tundra of Svalbard: Response to a Deeper Snow Experiment, J. Geophys. Res.-Biogeo., 123, 2627–2642, https://doi.org/10.1029/2018JG004396, 2018.
Massman, W. J.: A review of the molecular diffusivities of H2O, CO2, CH4, CO, O3, SO2, NH3, N2O, NO, and NO2 in air, O2 and N2 near STP, Atmos. Environ., 32, 1111–1127, https://doi.org/10.1016/S1352-2310(97)00391-9, 1998.
Massman, W. J. and Frank, J. M.: Advective transport of CO2 in permeable media induced by atmospheric pressure fluctuations: 2. Observational evidence under snowpacks, J. Geophys. Res.-Biogeo., 111, https://doi.org/10.1029/2006JG000164, 2006.
Massman, W. J., Sommerfeld, R. A., Mosier, A. R., Zeller, K. F., Hehn, T. J., and Rochelle, S. G.: A model investigation of turbulence-driven pressure-pumping effects on the rate of diffusion of CO2, N2O, and CH4 through layered snowpacks, J. Geophys. Res.-Atmos., 102, 18851–18863, https://doi.org/10.1029/97JD00844, 1997.
Mast, M. A., Wickland, K. P., Striegl, R. T., and Clow, D. W.: Winter fluxes of CO2 and CH4 from subalpine soils in Rocky Mountain National Park, Colorado, Global Biogeochem. Cy., 12, 607–620, https://doi.org/10.1029/98GB02313, 1998.
Mavrovic, A., Sonnentag, O., Lemmetyinen, J., Voigt, C., Rutter, N., Mann, P., Sylvain, J.-D., and Roy, A.: Environmental controls of winter soil carbon dioxide fluxes in boreal and tundra environments, Biogeosciences, 20, 5087–5108, https://doi.org/10.5194/bg-20-5087-2023, 2023.
Mavrovic, A., Sonnentag, O., Lemmetyinen, J., Voigt, C., Aurela, M., and Roy, A.: Winter methane fluxes over boreal and Arctic environments, ESS Open Archive, https://doi.org/10.22541/essoar.170542245.58670859/v1, 2024.
Mavrovic, A., Sonnentag, O., Voigt, C., Lemmetyinen, J., Aurela, M., and Roy, A.: Winter Methane Fluxes Over Boreal and Arctic Environments, Geophys. Res. Lett., 52, e2025GL118367, https://doi.org/10.1029/2025GL118367, 2025.
McDowell, N. G., Marshall, J. D., Hooker, T. D., and Musselman, R.: Estimating CO2 flux from snowpacks at three sites in the Rocky Mountains, Tree Physiol., 20, 745–753, https://doi.org/10.1093/treephys/20.11.745, 2000.
McEwing, K. R., Fisher, J. P., and Zona, D.: Environmental and vegetation controls on the spatial variability of CH4 emission from wet-sedge and tussock tundra ecosystems in the Arctic, Plant Soil, 388, 37–52, https://doi.org/10.1007/s11104-014-2377-1, 2015.
Mikan, C. J., Schimel, J. P., and Doyle, A. P.: Temperature controls of microbial respiration in arctic tundra soils above and below freezing, Soil Biol. Biochem., 34, 1785–1795, https://doi.org/10.1016/S0038-0717(02)00168-2, 2002.
Myers-Smith, I. H., Forbes, B. C., Wilmking, M., Hallinger, M., Lantz, T., Blok, D., Tape, K. D., Macias-Fauria, M., Sass-Klaassen, U., Lévesque, E., Boudreau, S., Ropars, P., Hermanutz, L., Trant, A., Collier, L. S., Weijers, S., Rozema, J., Rayback, S. A., Schmidt, N. M., Schaepman-Strub, G., Wipf, S., Rixen, C., Ménard, C. B., Venn, S., Goetz, S., Andreu-Hayles, L., Elmendorf, S., Ravolainen, V., Welker, J., Grogan, P., Epstein, H. E., and Hik, D. S.: Shrub expansion in tundra ecosystems: dynamics, impacts and research priorities, Environ. Res. Lett., 6, 045509, https://doi.org/10.1088/1748-9326/6/4/045509, 2011.
Myers-Smith, I. H., Kerby, J. T., Phoenix, G. K., Bjerke, J. W., Epstein, H. E., Assmann, J. J., John, C., Andreu-Hayles, L., Angers-Blondin, S., Beck, P. S. A., Berner, L. T., Bhatt, U. S., Bjorkman, A. D., Blok, D., Bryn, A., Christiansen, C. T., Cornelissen, J. H. C., Cunliffe, A. M., Elmendorf, S. C., Forbes, B. C., Goetz, S. J., Hollister, R. D., De Jong, R., Loranty, M. M., Macias-Fauria, M., Maseyk, K., Normand, S., Olofsson, J., Parker, T. C., Parmentier, F.-J. W., Post, E., Schaepman-Strub, G., Stordal, F., Sullivan, P. F., Thomas, H. J. D., Tømmervik, H., Treharne, R., Tweedie, C. E., Walker, D. A., Wilmking, M., and Wipf, S.: Complexity revealed in the greening of the Arctic, Nat. Clim. Change, 10, 106–117, https://doi.org/10.1038/s41558-019-0688-1, 2020.
Natali, S. M., Watts, J. D., Rogers, B. M., Potter, S., Ludwig, S. M., Selbmann, A. K., Sullivan, P. F., Abbott, B. W., Arndt, K. A., Birch, L., Björkman, M. P., Bloom, A. A., Celis, G., Christensen, T. R., Christiansen, C. T., Commane, R., Cooper, E. J., Crill, P., Czimczik, C., Davydov, S., Du, J., Egan, J. E., Elberling, B., Euskirchen, E. S., Friborg, T., Genet, H., Göckede, M., Goodrich, J. P., Grogan, P., Helbig, M., Jafarov, E. E., Jastrow, J. D., Kalhori, A. A. M., Kim, Y., Kimball, J. S., Kutzbach, L., Lara, M. J., Larsen, K. S., Lee, B. Y., Liu, Z., Loranty, M. M., Lund, M., Lupascu, M., Madani, N., Malhotra, A., Matamala, R., McFarland, J., McGuire, A. D., Michelsen, A., Minions, C., Oechel, W. C., Olefeldt, D., Parmentier, F. J. W., Pirk, N., Poulter, B., Quinton, W., Rezanezhad, F., Risk, D., Sachs, T., Schaefer, K., Schmidt, N. M., Schuur, E. A. G., Semenchuk, P. R., Shaver, G., Sonnentag, O., Starr, G., Treat, C. C., Waldrop, M. P., Wang, Y., Welker, J., Wille, C., Xu, X., Zhang, Z., Zhuang, Q., and Zona, D.: Large loss of CO2 in winter observed across the northern permafrost region, Nat. Clim. Change, 9, 852–857, https://doi.org/10.1038/s41558-019-0592-8, 2019.
Outcalt, S. I., Nelson, F. E., and Hinkel, K. M.: The zero-curtain effect: Heat and mass transfer across an isothermal region in freezing soil, Water Resour. Res., 26, 1509–1516, https://doi.org/10.1029/WR026i007p01509, 1990.
Pedron, S. A., Welker, J. M., Euskirchen, E. S., Klein, E. S., Walker, J. C., Xu, X., and Czimczik, C. I.: Closing the Winter Gap–Year-Round Measurements of Soil CO2 Emission Sources in Arctic Tundra, Geophys. Res. Lett., 49, e2021GL097347, https://doi.org/10.1029/2021GL097347, 2022.
Pedron, S. A., Jespersen, R. G., Xu, X., Khazindar, Y., Welker, J. M., and Czimczik, C. I.: More Snow Accelerates Legacy Carbon Emissions From Arctic Permafrost, AGU Adv., 4, e2023AV000942, https://doi.org/10.1029/2023AV000942, 2023.
Piao, S., Wang, X., Park, T., Chen, C., Lian, X., He, Y., Bjerke, J. W., Chen, A., Ciais, P., Tømmervik, H., Nemani, R. R., and Myneni, R. B.: Characteristics, drivers and feedbacks of global greening, Nat. Rev. Earth Environ., 1, 14–27, https://doi.org/10.1038/s43017-019-0001-x, 2019.
Pirk, N., Tamstorf, M. P., Lund, M., Mastepanov, M., Pedersen, S. H., Mylius, M. R., Parmentier, F.-J. W., Christiansen, H. H., and Christensen, T. R.: Snowpack fluxes of methane and carbon dioxide from high Arctic tundra, J. Geophys. Res.-Biogeo., 121, 2886–2900, https://doi.org/10.1002/2016JG003486, 2016.
Pirk, N., Sievers, J., Mertes, J., Parmentier, F.-J. W., Mastepanov, M., and Christensen, T. R.: Spatial variability of CO2 uptake in polygonal tundra: assessing low-frequency disturbances in eddy covariance flux estimates, Biogeosciences, 14, 3157–3169, https://doi.org/10.5194/bg-14-3157-2017, 2017.
Pomeroy, J. W., Marsh, P., and Lesack, L.: Relocation of Major Ions in Snow along the Tundra-Taiga Ecotone, Hydrol. Res., 24, 151–168, https://doi.org/10.2166/nh.1993.0019, 1993.
Proksch, M., Löwe, H., and Schneebeli, M.: Density, specific surface area, and correlation length of snow measured by high-resolution penetrometry, J. Geophys. Res.-Earth, 120, 346–362, https://doi.org/10.1002/2014JF003266, 2015.
Quinton, W. L. and Marsh, P.: The influence of mineral earth hummocks on subsurface drainage in the continuous permafrost zone, Permafrost Periglac., 9, 213–228, 1998.
Rafat, A., Rezanezhad, F., Quinton, W. L., Humphreys, E. R., Webster, K., and Van Cappellen, P.: Non-growing season carbon emissions in a northern peatland are projected to increase under global warming, Commun. Earth Environ., 2, https://doi.org/10.1038/s43247-021-00184-w, 2021.
Rantanen, M., Karpechko, A. Y., Lipponen, A., Nordling, K., Hyvärinen, O., Ruosteenoja, K., Vihma, T., and Laaksonen, A.: The Arctic has warmed nearly four times faster than the globe since 1979, Commun. Earth Environ., 3, https://doi.org/10.1038/s43247-022-00498-3, 2022.
Rößger, N., Sachs, T., Wille, C., Boike, J., and Kutzbach, L.: Seasonal increase of methane emissions linked to warming in Siberian tundra, Nat. Clim. Change, 12, 1031–1036, https://doi.org/10.1038/s41558-022-01512-4, 2022.
Schädel, C., Rogers, B. M., Lawrence, D. M., Koven, C. D., Brovkin, V., Burke, E. J., Genet, H., Huntzinger, D. N., Jafarov, E., McGuire, A. D., Riley, W. J., and Natali, S. M.: Earth system models must include permafrost carbon processes, Nat. Clim. Change, 14, 114–116, https://doi.org/10.1038/s41558-023-01909-9, 2024.
Schimel, J. P., Bilbrough, C., and Welker, J. M.: Increased snow depth affects microbial activity and nitrogen mineralization in two Arctic tundra communities, Soil Biol. Biochem., 36, 217–227, https://doi.org/10.1016/j.soilbio.2003.09.008, 2004.
Schimel, J. P., Fahnestock, J., Michaelson, G., Mikan, C., Ping, C.-L., Romanovsky, V. E., and Welker, J.: Cold-season Production of CO2 in Arctic Soils: Can Laboratory and Field Estimates Be Reconciled through a Simple Modeling Approach?, Arct. Antarct. Alp. Res., 38, 249–256, 2006.
Seok, B., Helmig, D., Williams, M. W., Liptzin, D., Chowanski, K., and Hueber, J.: An automated system for continuous measurements of trace gas fluxes through snow: an evaluation of the gas diffusion method at a subalpine forest site, Niwot Ridge, Colorado, Biogeochemistry, 95, 95–113, https://doi.org/10.1007/s10533-009-9302-3, 2009.
Shi, X., Marsh, P., and Yang, D.: Warming spring air temperatures, but delayed spring streamflow in an Arctic headwater basin, Environ. Res. Lett., 10, 064003, https://doi.org/10.1088/1748-9326/10/6/064003, 2015.
Shirley, I., Uhlemann, S., Peterson, J., Bennett, K., Hubbard, S. S., and Dafflon, B.: Disentangling the Impacts of Microtopography and Shrub Distribution on Snow Depth in a Subarctic Watershed: Toward a Predictive Understanding of Snow Spatial Variability, J. Geophys. Res.-Biogeo., 130, e2024JG008604, https://doi.org/10.1029/2024JG008604, 2025.
Smith, D. M., Screen, J. A., Deser, C., Cohen, J., Fyfe, J. C., García-Serrano, J., Jung, T., Kattsov, V., Matei, D., Msadek, R., Peings, Y., Sigmond, M., Ukita, J., Yoon, J.-H., and Zhang, X.: The Polar Amplification Model Intercomparison Project (PAMIP) contribution to CMIP6: investigating the causes and consequences of polar amplification, Geosci. Model Dev., 12, 1139–1164, https://doi.org/10.5194/gmd-12-1139-2019, 2019.
Soegaard, H., Nordstroem, C., Friborg, T., Hansen, B. U., Christensen, T. R., and Bay, C.: Trace gas exchange in a high-Arctic valley: 3. Integrating and scaling CO2 fluxes from canopy to landscape using flux data, footprint modeling, and remote sensing, Global Biogeochem. Cy., 14, 725–744, https://doi.org/10.1029/1999GB001137, 2000.
Subke, J.-A., Kutzbach, L., and Risk, D.: Soil Chamber Measurements, in: Springer Handbook of Atmospheric Measurements, edited by: Foken, T., Springer International Publishing, Cham, 1603–1624, https://doi.org/10.1007/978-3-030-52171-4_60, 2021.
Sullivan, P. F., Welker, J. M., Arens, S. J. T., and Sveinbjörnsson, B.: Continuous estimates of CO2 efflux from arctic and boreal soils during the snow-covered season in Alaska, J. Geophys. Res.-Biogeo., 113, https://doi.org/10.1029/2008JG000715, 2008.
Sullivan, P. F., Stokes, M. C., McMillan, C. K., and Weintraub, M. N.: Labile carbon limits late winter microbial activity near Arctic treeline, Nat. Commun., 11, 4024, https://doi.org/10.1038/s41467-020-17790-5, 2020.
Tao, J., Zhu, Q., Riley, W. J., and Neumann, R. B.: Improved ELMv1-ECA simulations of zero-curtain periods and cold-season CH4 and CO2 emissions at Alaskan Arctic tundra sites, The Cryosphere, 15, 5281–5307, https://doi.org/10.5194/tc-15-5281-2021, 2021.
Taylor, J. R.: An introduction to error analysis: the study of uncertainties in physical measurements, 3rd edn., University Science Books, MIT Press, ISBN 1940380081, 978-1940380087, 2022.
The MathWorks: MATLAB version: 24.1.0 (R2024a), https://www.mathworks.com (last access: 1 November 2025), 2024.
Treat, C. C., Bloom, A. A., and Marushchak, M. E.: Nongrowing season methane emissions – a significant component of annual emissions across northern ecosystems, Glob. Change Biol., 24, 3331–3343, https://doi.org/10.1111/gcb.14137, 2018.
Tucker, C.: Reduction of air- and liquid water-filled soil pore space with freezing explains high temperature sensitivity of soil respiration below 0 °C, Soil Biol. Biochem., 78, 90–96, https://doi.org/10.1016/j.soilbio.2014.06.018, 2014.
Tutton, R., Dakin, B., Essery, R., Griffith, J., Hould-Gosselin, G., Marsh, P., Sonnentag, O., Thorne, R., and Walker, B.: A hydrometeorological dataset from the taiga-tundra ecotone in the western Canadian Arctic: Trail Valley Creek, Northwest Territories (3.0), https://doi.org/10.5683/SP3/BXV4DE, 2025.
Virkkala, A.-M., Natali, S. M., Rogers, B. M., Watts, J. D., Savage, K., Connon, S. J., Mauritz, M., Schuur, E. A. G., Peter, D., Minions, C., Nojeim, J., Commane, R., Emmerton, C. A., Goeckede, M., Helbig, M., Holl, D., Iwata, H., Kobayashi, H., Kolari, P., López-Blanco, E., Marushchak, M. E., Mastepanov, M., Merbold, L., Parmentier, F.-J. W., Peichl, M., Sachs, T., Sonnentag, O., Ueyama, M., Voigt, C., Aurela, M., Boike, J., Celis, G., Chae, N., Christensen, T. R., Bret-Harte, M. S., Dengel, S., Dolman, H., Edgar, C. W., Elberling, B., Euskirchen, E., Grelle, A., Hatakka, J., Humphreys, E., Järveoja, J., Kotani, A., Kutzbach, L., Laurila, T., Lohila, A., Mammarella, I., Matsuura, Y., Meyer, G., Nilsson, M. B., Oberbauer, S. F., Park, S.-J., Petrov, R., Prokushkin, A. S., Schulze, C., St. Louis, V. L., Tuittila, E.-S., Tuovinen, J.-P., Quinton, W., Varlagin, A., Zona, D., and Zyryanov, V. I.: The ABCflux database: Arctic–boreal CO2 flux observations and ancillary information aggregated to monthly time steps across terrestrial ecosystems, Earth Syst. Sci. Data, 14, 179–208, https://doi.org/10.5194/essd-14-179-2022, 2022.
Virkkala, A.-M., Niittynen, P., Kemppinen, J., Marushchak, M. E., Voigt, C., Hensgens, G., Kerttula, J., Happonen, K., Tyystjärvi, V., Biasi, C., Hultman, J., Rinne, J., and Luoto, M.: High-resolution spatial patterns and drivers of terrestrial ecosystem carbon dioxide, methane, and nitrous oxide fluxes in the tundra, Biogeosciences, 21, 335–355, https://doi.org/10.5194/bg-21-335-2024, 2024.
Voigt, C., Virkkala, A.-M., Hould Gosselin, G., Bennett, K. A., Black, T. A., Detto, M., Chevrier-Dion, C., Guggenberger, G., Hashmi, W., Kohl, L., Kou, D., Marquis, C., Marsh, P., Marushchak, M. E., Nesic, Z., Nykänen, H., Saarela, T., Sauheitl, L., Walker, B., Weiss, N., Wilcox, E. J., and Sonnentag, O.: Arctic soil methane sink increases with drier conditions and higher ecosystem respiration, Nat. Clim. Change, 13, 1095–1104, https://doi.org/10.1038/s41558-023-01785-3, 2023.
Vourlitis, G. L., Oechel, W. C., Hope, A., Stow, D., Boynton, B., Verfaillie, J., Zulueta, R., and Hastings, S. J.: PHYSIOLOGICAL MODELS FOR SCALING PLOT MEASUREMENTS OF CO2 FLUX ACROSS AN ARCTIC TUNDRA LANDSCAPE, Ecol. Appl., 10, 60–72, https://doi.org/10.1890/1051-0761(2000)010[0060:PMFSPM]2.0.CO;2, 2000.
Walker, B., Wilcox, E. J., and Marsh, P.: Accuracy assessment of late winter snow depth mapping for tundra environments using Structure-from-Motion photogrammetry, Arct. Sci., 7, 588–604, https://doi.org/10.1139/as-2020-0006, 2021.
Webb, E. E., Schuur, E. A. G., Natali, S. M., Oken, K. L., Bracho, R., Krapek, J. P., Risk, D., and Nickerson, N. R.: Increased wintertime CO2 loss as a result of sustained tundra warming, J. Geophys. Res.-Biogeo., 121, 249–265, https://doi.org/10.1002/2014JG002795, 2016.
Welker, J. M., Fahnestock, J. T., and Jones, M. H.: Annual CO2 Flux in Dry and Moist Arctic Tundra: Field Responses to Increases in Summer Temperatures and Winter Snow Depth, Clim. Change, 44, 139–150, https://doi.org/10.1023/A:1005555012742, 2000.
Wilcox, E. J., Keim, D., de Jong, T., Walker, B., Sonnentag, O., Sniderhan, A. E., Mann, P., and Marsh, P.: Tundra shrub expansion may amplify permafrost thaw by advancing snowmelt timing, Arct. Sci., 5, 202–217, https://doi.org/10.1139/as-2018-0028, 2019.
Wilkman, E., Zona, D., Tang, Y., Gioli, B., Lipson, D. A., and Oechel, W.: Temperature Response of Respiration Across the Heterogeneous Landscape of the Alaskan Arctic Tundra, J. Geophys. Res.-Biogeo., 123, 2287–2302, https://doi.org/10.1029/2017JG004227, 2018.
Yi, Y., Kimball, J. S., Watts, J. D., Natali, S. M., Zona, D., Liu, J., Ueyama, M., Kobayashi, H., Oechel, W., and Miller, C. E.: Investigating the sensitivity of soil heterotrophic respiration to recent snow cover changes in Alaska using a satellite-based permafrost carbon model, Biogeosciences, 17, 5861–5882, https://doi.org/10.5194/bg-17-5861-2020, 2020.
Zhu, C., Nakayama, M., and Yoshikawa Inoue, H.: Continuous measurement of CO2 flux through the snowpack in a dwarf bamboo ecosystem on Rishiri Island, Hokkaido, Japan, Polar Sci., 8, 218–231, https://doi.org/10.1016/j.polar.2014.04.003, 2014.
Zona, D., Gioli, B., Commane, R., Lindaas, J., Wofsy, S. C., Miller, C. E., Dinardo, S. J., Dengel, S., Sweeney, C., Karion, A., Chang, R. Y.-W., Henderson, J. M., Murphy, P. C., Goodrich, J. P., Moreaux, V., Liljedahl, A., Watts, J. D., Kimball, J. S., Lipson, D. A., and Oechel, W. C.: Cold season emissions dominate the Arctic tundra methane budget, P. Natl. Acad. Sci. USA, 113, 40–5, https://doi.org/10.1073/pnas.1516017113, 2016.