
the Creative Commons Attribution 4.0 License.
the Creative Commons Attribution 4.0 License.
 | 28 Oct 2026
Synthesis of greenhouse gas emission factors for forest organic soils in the Köppen–Geiger Dfb climate zone

Arta Bārdule
Ieva Līcīte
Muhammad Kamil-Sardar
Andis Lazdiņš
Greenhouse gas (GHG) emissions from organic soils are a key component of land-use-related emissions, particularly in countries with large areas of organic soils. Temperate-zone forest soils remain less studied in GHG research than boreal soils. However, recent work has expanded coverage in the northeastern temperate region, which, under the Köppen–Geiger climate classification, shares key climatic characteristics with the southern boreal region (Dfb). This study synthesised updated GHG flux data to evaluate carbon balance and emissions from forest organic soils in the Dfb zone, stratified by drainage status, nutrient availability, and dominant tree species. Such stratification revealed CO2 source-sink patterns, which encourage the ecological relevance of using these categories for data aggregation. The dominant tree species reflected nutrient status: drained coniferous and deciduous stands have been reported as CO2 sources, emitting 0.03 ± 0.55 and 0.47 ± 0.29 t CO2-C ha−1 yr−1, respectively, though soils tended to shift toward CO2 sinks in stands older than 25 years. In contrast, undrained soils have generally been observed to function as CO2 sinks, although not necessarily in all sites. However, this stratification was less informative for CH4 and N2O. CH4 fluxes were primarily determined by water table level rather than by other site variables, whereas N2O showed a tendency toward elevated emissions in deciduous stands, irrespective of drainage status.
- Article
(2514 KB) - Full-text XML
- BibTeX
- EndNote


Organic soils, when predominantly peat-based, contain large stocks of organic carbon (C) and nitrogen (N), where widespread, are considered to be disproportionately large sources of land-use greenhouse gas (GHG) emissions (Lake et al., 2025). As a result, they have attracted growing attention from stakeholders in sustainable soil C management and GHG emission mitigation, thereby stimulating efforts to improve the accuracy of GHG emission estimates (e.g., Alm et al., 2023; Tiemeyer et al., 2020; Jauhiainen et al., 2023). The Intergovernmental Panel on Climate Change (IPCC) guidelines characterise emissions from organic soils based on stratification by boreal, temperate, and tropical climate zones (Eggleston et al., 2006). These zones are geographically broad, thus encompassing substantial variability in climate, vegetation, hydrology, nutrient availability, and geomorphology conditions, all of which can influence the magnitude of GHG emissions (He and Roulet, 2023). Compared with the extensive data available for the boreal zone, studies on GHG fluxes from organic soils in the temperate climate zone have been relatively scarce. For example, the most recent yet now outdated default IPCC emission factor (EF) for carbon dioxide (CO2) from drained organic soils in temperate forest land was synthesised from only eight study sites, whereas the boreal EFs were based on data from 184 sites (Hiraishi et al., 2014). A more recent EF synthesis incorporated data published during the following decade, increasing the number of temperate sites to 35 and boreal sites to 218 (Jauhiainen et al., 2023). However, most temperate and boreal sites remained concentrated in Sweden and Finland, respectively. In the years following this synthesis, the number of study sites in the Baltic States, classified as part of the temperate zone according to the IPCC, has increased substantially, with directly measured organic-soil GHG emissions now reported from 56 forest sites (Butlers et al., 2025, 2022). This recent expansion has considerably improved data availability and geographical coverage for the northeastern part of the temperate zone.
The Baltic States, together with the southern parts of Finland and Sweden, fall within the Dfb climate zone (cold winters, no dry season, warm summers) according to the Köppen–Geiger climate classification (Beck et al., 2023). Given that the Dfb zone partially overlaps with the temperate zone and that most temperate-zone data fall within this overlap, using Dfb-specific data to elaborate EFs for the respective region is more appropriate than aggregating data of a much broader temperate zone. Combining data within narrower climatic ranges increases the spatial density of aggregated data, thereby supporting the development of EFs specific to additional geographical strata, such as forest types, drainage conditions, or nutrient status, thus enhancing the accuracy of soil emission upscaling.
In this study, we compiled existing annualised net CO2, CH4, and N2O flux data from drained and undrained (naturally wet) forest land sites with organic soils across the Baltic States reported by Butlers et al. (2022, 2025) and Kamil-Sardar et al. (2026), supplemented with forest site data from the Köppen–Geiger Dfb climate zone aggregated by Jauhiainen et al. (2023). Our objective was to synthesise GHG EFs stratified by drainage status (drained, undrained), dominant tree species, and nutrient status, for the Dfb climate zone, to identify the most suitable grouping options for upscaling using Latvia as a case study.
2.1 Data compilation
Peer-reviewed annualised site-specific net GHG flux values, estimated using the chamber method, were compiled for the synthesis of organic soil CO2, CH4 and N2O EFs (Hiraishi et al., 2014) for forest land. The addressed net CO2 fluxes represent soil CO2 balance: sum of soil CO2-C loss by heterotrophic respiration and C input to soil by litter. The compiled dataset comprised study results from drained and undrained forest sites in the Baltic states (Butlers et al., 2022, 2023, 2025; Kamil-Sardar et al., 2026) supplemented by a subset of aggregated drained site values from Jauhiainen et al. (2023) overlapping with the Köppen–Geiger Dfb climate zone (cold winter, no dry season, warm summer, Beck et al., 2023), for which nutrient status was explicitly reported (Fig. 1). Dominant tree species in sites were coniferous, such as Norway spruce (Picea abies (L.) H.Karst., n=32) and Scots pine (Pinus sylvestris L., n=36), and deciduous species such as birch (Betula pendula Roth and Betula pubescens Ehrh., n=22) and alder (Alnus glutinosa (L.) Gaertn., n=18). We also included values assigned to other species, mixed stands, clearcuts, or cases where the tree species were not specified (n=25). Where tree species were not reported, the data were used only to derive tree species–independent EFs and were excluded from species-specific EF derivation. As a result, 297 annualised GHG flux values from 131 sites were compiled (Butlers, 2026). Fluxes can be traced to published peer-reviewed articles, 93 site-specific CO2, CH4 and N2O fluxes were acquired by contacting article authors, which were validated against originally published summary results (Butlers et al., 2022, 2023). In addition to flux values, we compiled available site-specific data on quantitative soil properties, forest stand characteristics, and annual C inputs to soil by litter. Availability of these supplementary data was not an inclusion criterion. Study inclusion was based solely on the flux and site-characterisation criteria described above, including identification of drainage and soil nutrient status.
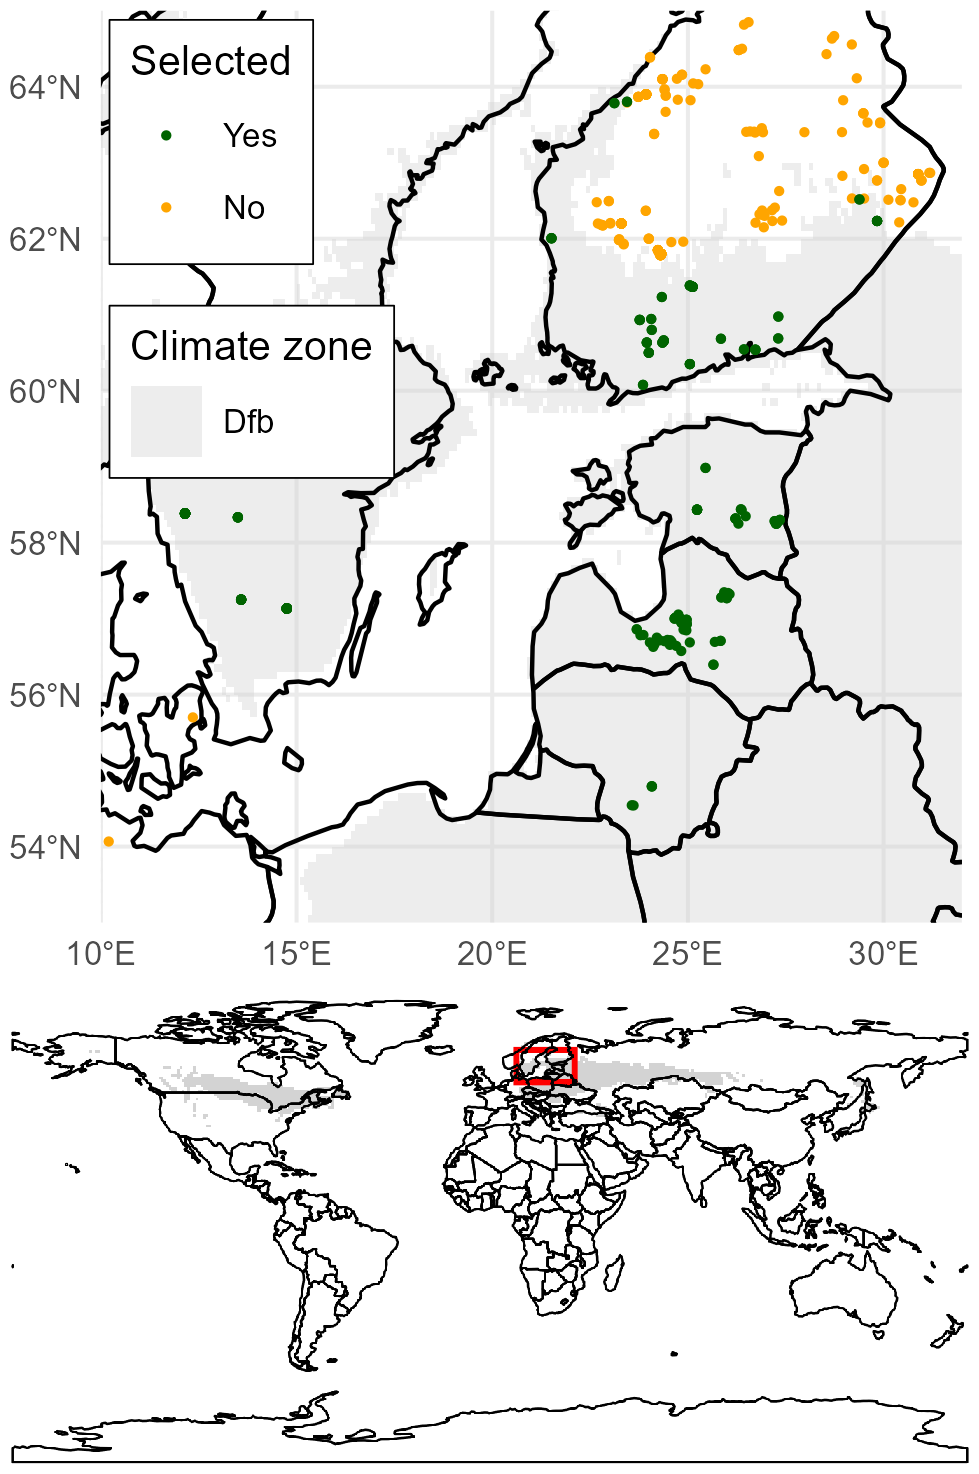
Figure 1Locations of the sites in the Köppen–Geiger Dfb climate zone from which GHG flux data were collected and included in the study. The figure excludes three sites located in Canada.
Soil properties such as C, calcium (Ca), magnesium (Mg), phosphorus (P), and organic matter (OM) content were available for 34 % of sites, whereas N, pH, C:N ratio, and soil bulk density were available for 59 % of sites. Overall, at least some soil property data were available for 93 % of sites. Stand age was the most frequently reported stand parameter, available for 43 % of sites. Only 19 % of sites provided a complete set of stand variables (age, growing, stock, mean tree height, diameter at breast height, and basal area); these were also the sites for which annual C input to soil via litter (from above- and belowground ground vegetation, tree fine roots, and foliar litter) was available.
2.2 Data quality control and harmonisation
Quality control of the aggregated fluxes followed the approach described by Jauhiainen et al. (2023). This procedure assessed whether the originally reported peer-reviewed fluxes represented annual net soil GHG fluxes or those could be derived by applying supplementary procedures, including annualising warm-season measurements, separating heterotrophic from total soil respiration, or accounting for litter inputs. Where required, Jauhiainen et al. (2023) had already performed the necessary annualisation and harmonisation procedures and assigned weights to individual estimates according to their relative reliability. A weight of 1.0 was assigned to estimates without major identified limitations. In contrast, a weight of 0.5 was assigned where uncertainty was higher, for example because of limited spatial replication or greater reliance on supplementary data when deriving the annual flux estimate. Jauhiainen et al. (2023) provide detailed descriptions of adjustments applied to individual flux estimates.
In this synthesis, we used the estimates compiled by Jauhiainen et al. (2023) directly and retained their original weights. For additional fluxes compiled in this study, we applied the same quality-assessment criteria. We verified that the originally reported values represented annualised net soil GHG fluxes suitable for direct comparison with the Jauhiainen et al. (2023) dataset. Because no additional data manipulation was required, we assigned a weight of 1.0 in all cases.
Before further processing of the compiled dataset, we ensured that the units were harmonised. Additional harmonisation was needed for classifying soil nutrient status. The assigned soil nutrient status (rich, moderate) was harmonised by aligning the classification schemes used across the datasets. In the dataset of Jauhiainen et al. (2023), sites labelled as nutrient-poor were combined with the Baltic data classified as Myrtillosa turf. mel. forest site types and grouped under the “moderate” nutrient class. Similarly, sites labelled as nutrient-rich in Jauhiainen et al. (2023) and those classified as Oxalidosa turf. mel. and Dryopterioso–caricosa forest types in the Baltic data were grouped under the “rich” class.
2.3 Emission factor synthesis and statistical analysis
Using the assigned weights, for each EF aggregation level, we calculated the weighted mean with the associated standard error (SE) and 95 % confidence interval (CI). In addition, weighted medians with weighted 25th and 75th percentiles (IQR) are presented. In the text, uncertainty is expressed as the SE.
Differences in fluxes, grouped by drainage status, dominant tree species or type (coniferous, deciduous), and nutrient status, were assessed using Kruskal–Wallis tests. Mixed-effects models were used to evaluate the influence of species and nutrient status on GHG emissions while accounting for site-level random effects (R Core Team, 2023). These statistical methods were also applied to flux metadata, such as soil physico-chemical properties, to further strengthen the ecological rationale for data grouping aimed at elaborating EFs suitable for upscaling.
3.1 Soil CO2 fluxes
No significant differences in soil annual net CO2 fluxes were detected among dominant tree species or between coniferous and deciduous species type groups when stratified by drainage and nutrient status (p=0.32–0.84). Nutrient status had somewhat greater predictive power than species type: in mixed-effects models, nutrient status explained ∼ 13 % of the variance in net CO2 fluxes (marginal R2=0.13, χ2=11.6, p<0.001), while species type accounted for only ∼ 3 % within nutrient-rich sites (marginal R2=0.03, χ2=1.9, p=0.17). However, robust comparison was constrained by the data structure, as deciduous stands occurred exclusively on nutrient-rich sites. Nevertheless, the data demonstrated the dominant tree species type reflecting nutrient availability, as notable differences between coniferous and deciduous stands were observed for Ca, ratio, K, Mg, N, P, and pH (Fig. A1). These observations indicated that both soil nutrient status and dominant tree species can be used to stratify data for EF calculation, depending on patterns observed in flux data.
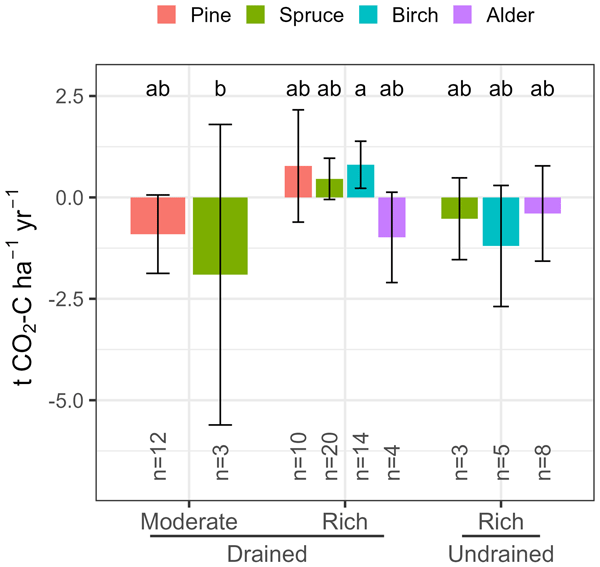
Overall, mean net CO2 emissions were 0.22 ± 0.18 t CO2-C ha−1 yr−1 in drained sites and −0.60 ± 0.37 t CO2-C ha−1 yr−1 in undrained sites. The undrained sites were represented by nutrient-rich stands of Norway spruce, birch, and alder, with the highest mean removals observed in birch stands (−1.20 ± 0.76 t CO2-C ha−1 yr−1). However, undrained soils at some sites across all dominant species categories have also acted as CO2 sources (Fig. A2). The mean net CO2 flux of drained soils in coniferous and deciduous stands was 0.03 ± 0.55 and 0.47±29 t CO2-C ha−1 yr−1, respectively. Scots pine and Norway spruce were equally represented within the drained coniferous category (Fig. 2), and statistical analysis indicated that differences between fluxes of these categories are not significant. However, a tendency toward lower fluxes, with a mean of −1.13 ± 0.52 t CO2-C ha−1 yr−1, was observed in nutrient-moderate sites (Fig. 2), which were dominated by Scots pine (80 % of observations). In contrast, drained nutrient-rich coniferous sites dominated by Norway spruce (67 % of observations) were a source of 0.55 ± 0.26 t CO2-C ha−1 yr−1, similar to what was observed in drained deciduous stands, which were present in nutrient-rich sites only. Consequently, drained nutrient-rich soils were, on average, a CO2 source of 0.51 ± 0.17 t CO2-C ha−1 yr−1. Drained alder stands appeared as CO2 sinks; however, their fluxes did not differ statistically from other nutrient-rich sites.
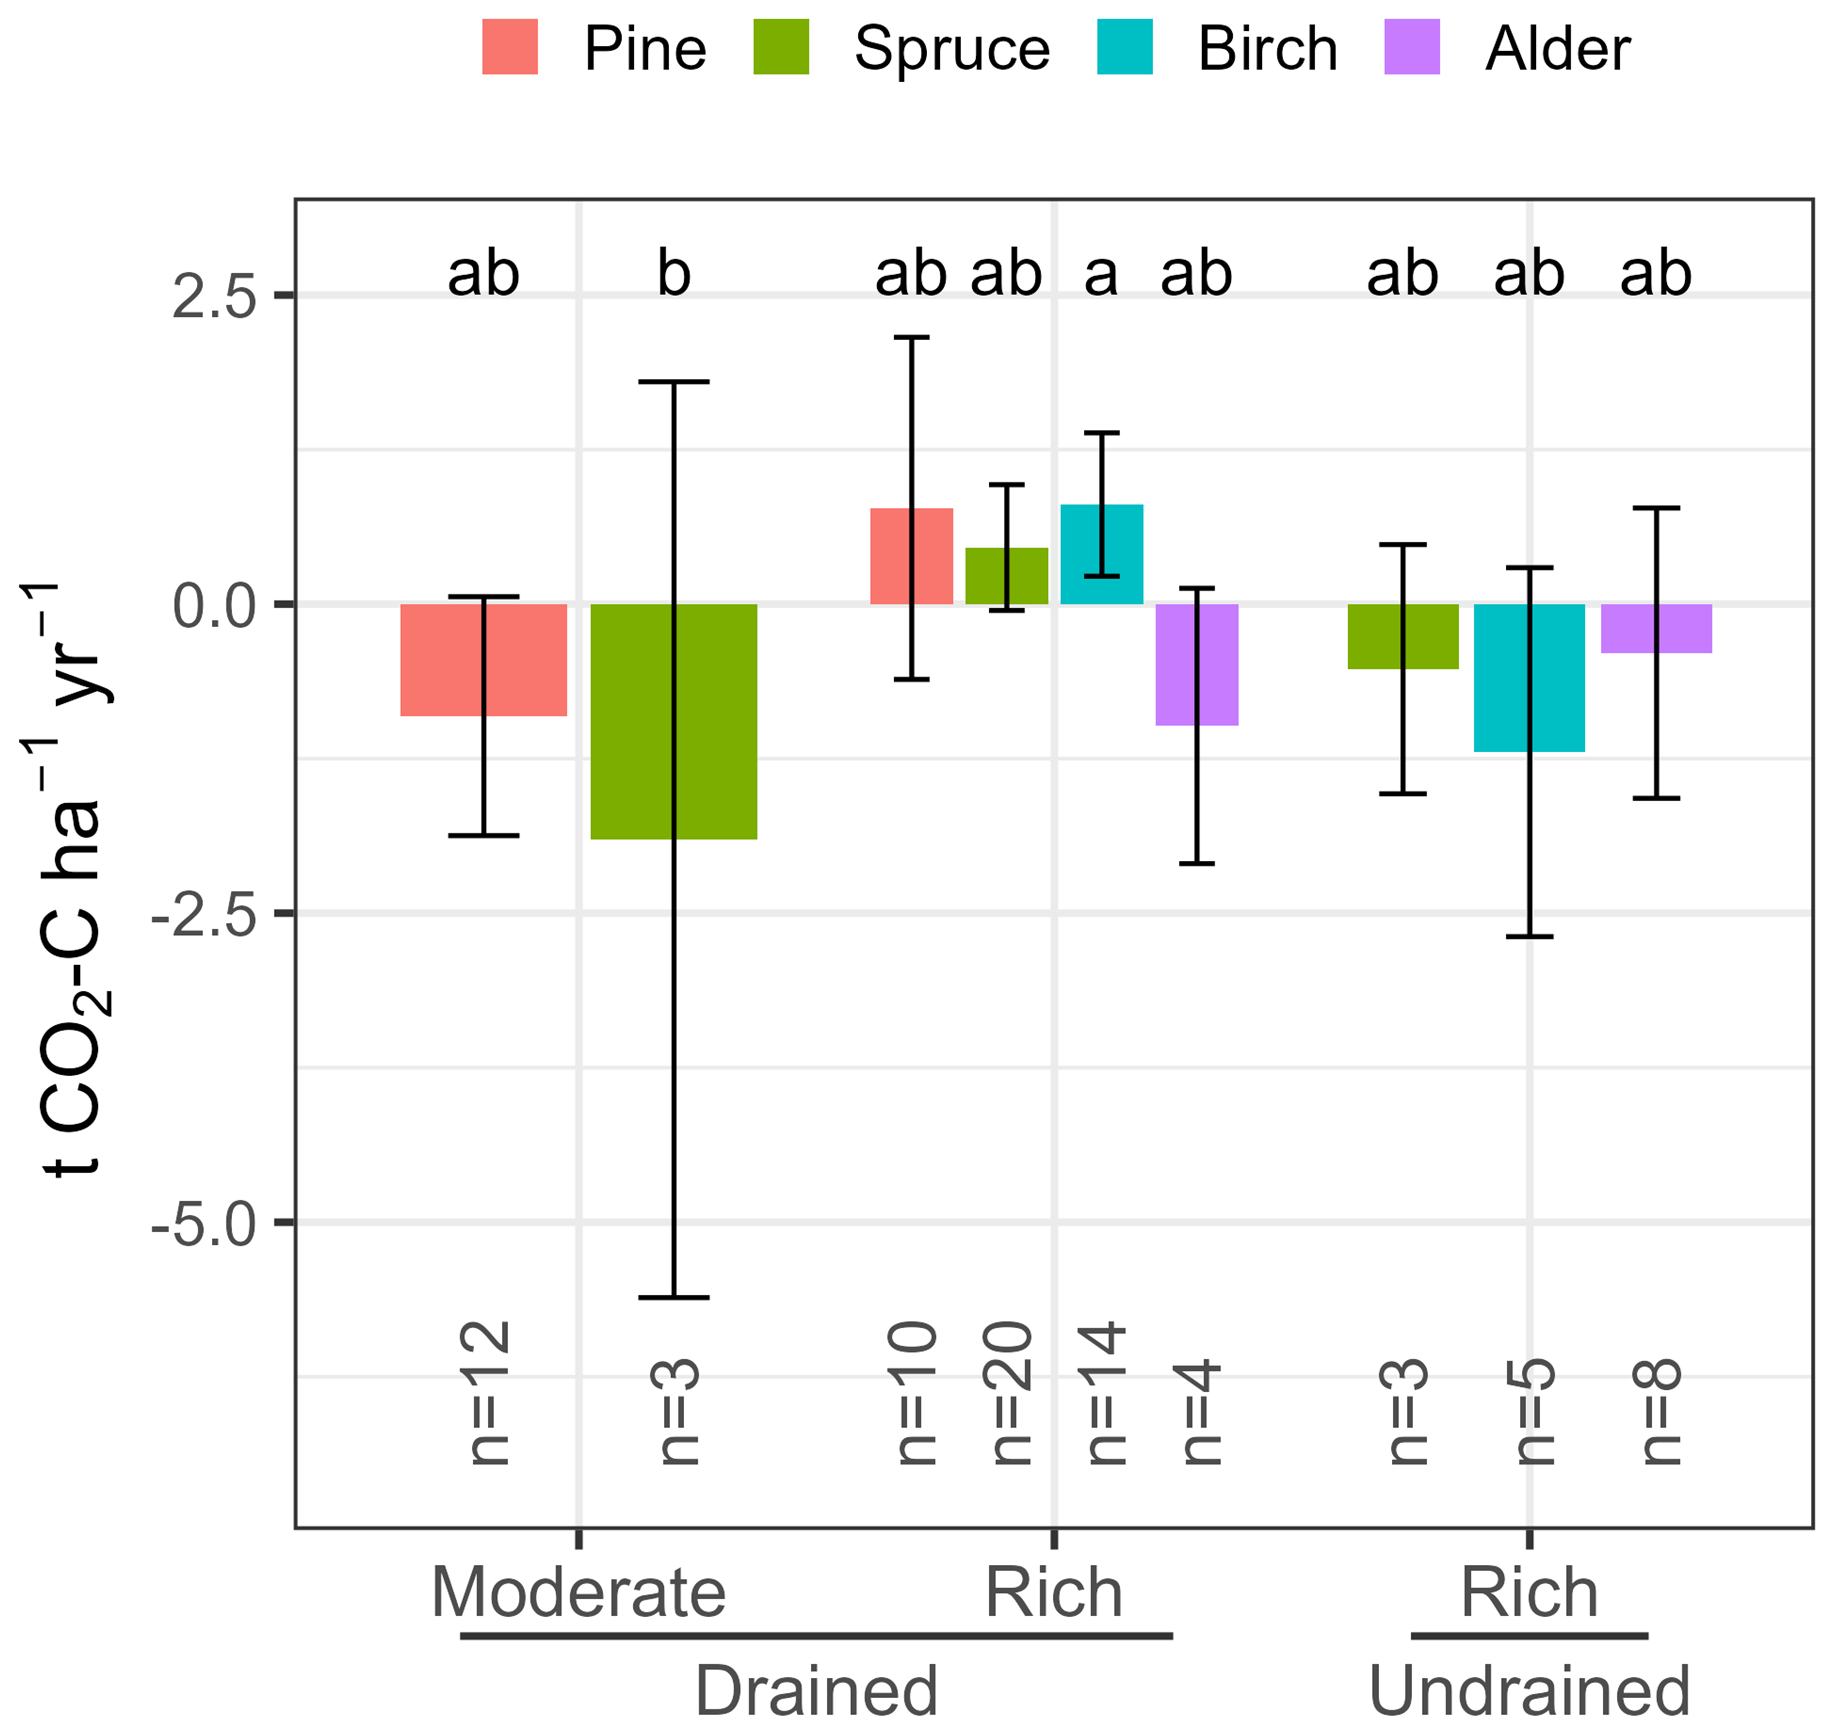
Figure 2Mean soil annual net CO2 fluxes by soil drainage and nutrient status, and dominant tree species. Error bars indicate a 95 % confidence interval; n indicates the number of sites represented. A common lowercase letter indicates statistically insignificant differences in average annual net CO2 fluxes. For numerical values, see Table B1.
Among stand variables, age showed the strongest relationship with net CO2 flux in drained soils, indicating a tendency for soils to shift from a CO2 source to a sink beyond approximately 25 years of stand age (Fig. 3). No relationship was observed between gross CO2 emissions and stand variables or annual litter. Gross CO2 flux, however, showed a weak decreasing trend with decreasing soil pH and N concentration, although the correlations were too weak to quantify. Net CO2 fluxes showed no consistent relationship with water table level, as both sinks and sources occurred across the range of water table conditions. Annual cumulative C input to soil from tree fine roots and foliar litterfall increased linearly with stand age (slope = 0.046, intercept = 0, R2=0.9). No relationship with fluxes was found for above- or belowground vegetation, likely due to limited data availability.
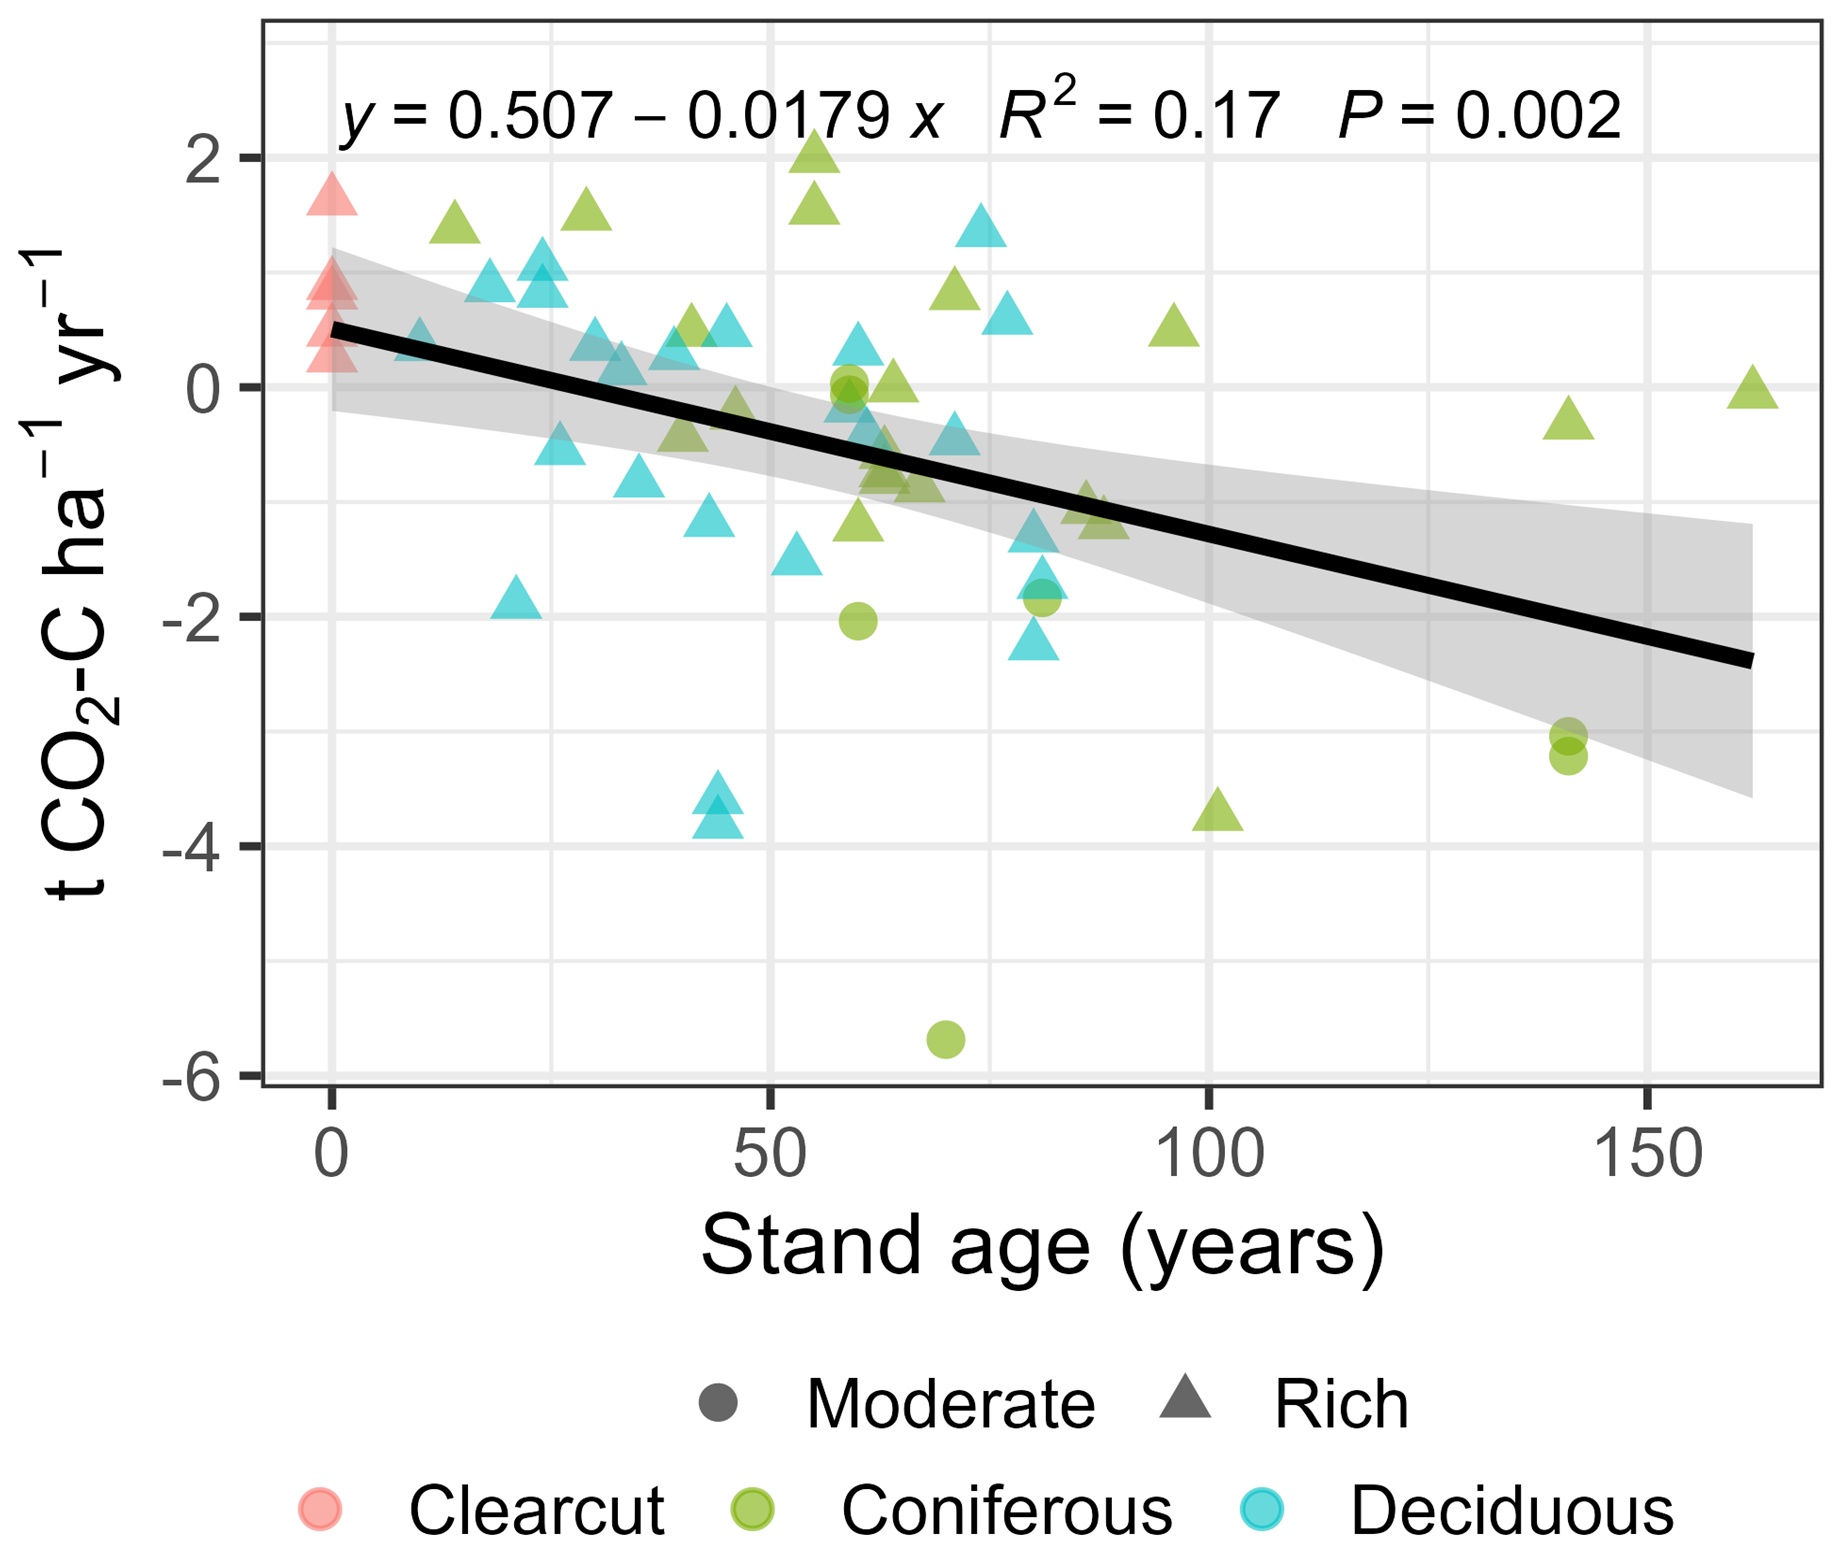
Figure 3Variation in soil annual net CO2 fluxes depending on stand age (all sites with known stand age combined).
3.2 Soil CH4 fluxes
CH4 fluxes showed less pronounced effects of nutrient richness and an apparent influence of species (Fig. A3). In drained sites, soils acted as CH4 sources in Scots pine stands (6.3 ± 2.6 kg CH4 ha−1 yr−1) and as CH4 sinks in Norway spruce stands (−4.5 ± 0.8 kg CH4 ha−1 yr−1), irrespective of nutrient status. Soils in drained, nutrient-rich birch stands were approximately CH4-neutral, while alder stands showed on average higher and more variable CH4 emissions under both drained and undrained conditions (Fig. 4). In undrained Norway spruce and birch sites, mean CH4 emissions were 9.3 ± 8.0 and 23.3 ± 18.0 kg CH4 ha−1 yr−1, respectively. However, due to the CH4 emission hotspot in alder stands, mean undrained-soil CH4 emissions reached 92.88 ± 78.05 kg CH4 ha−1 yr−1.
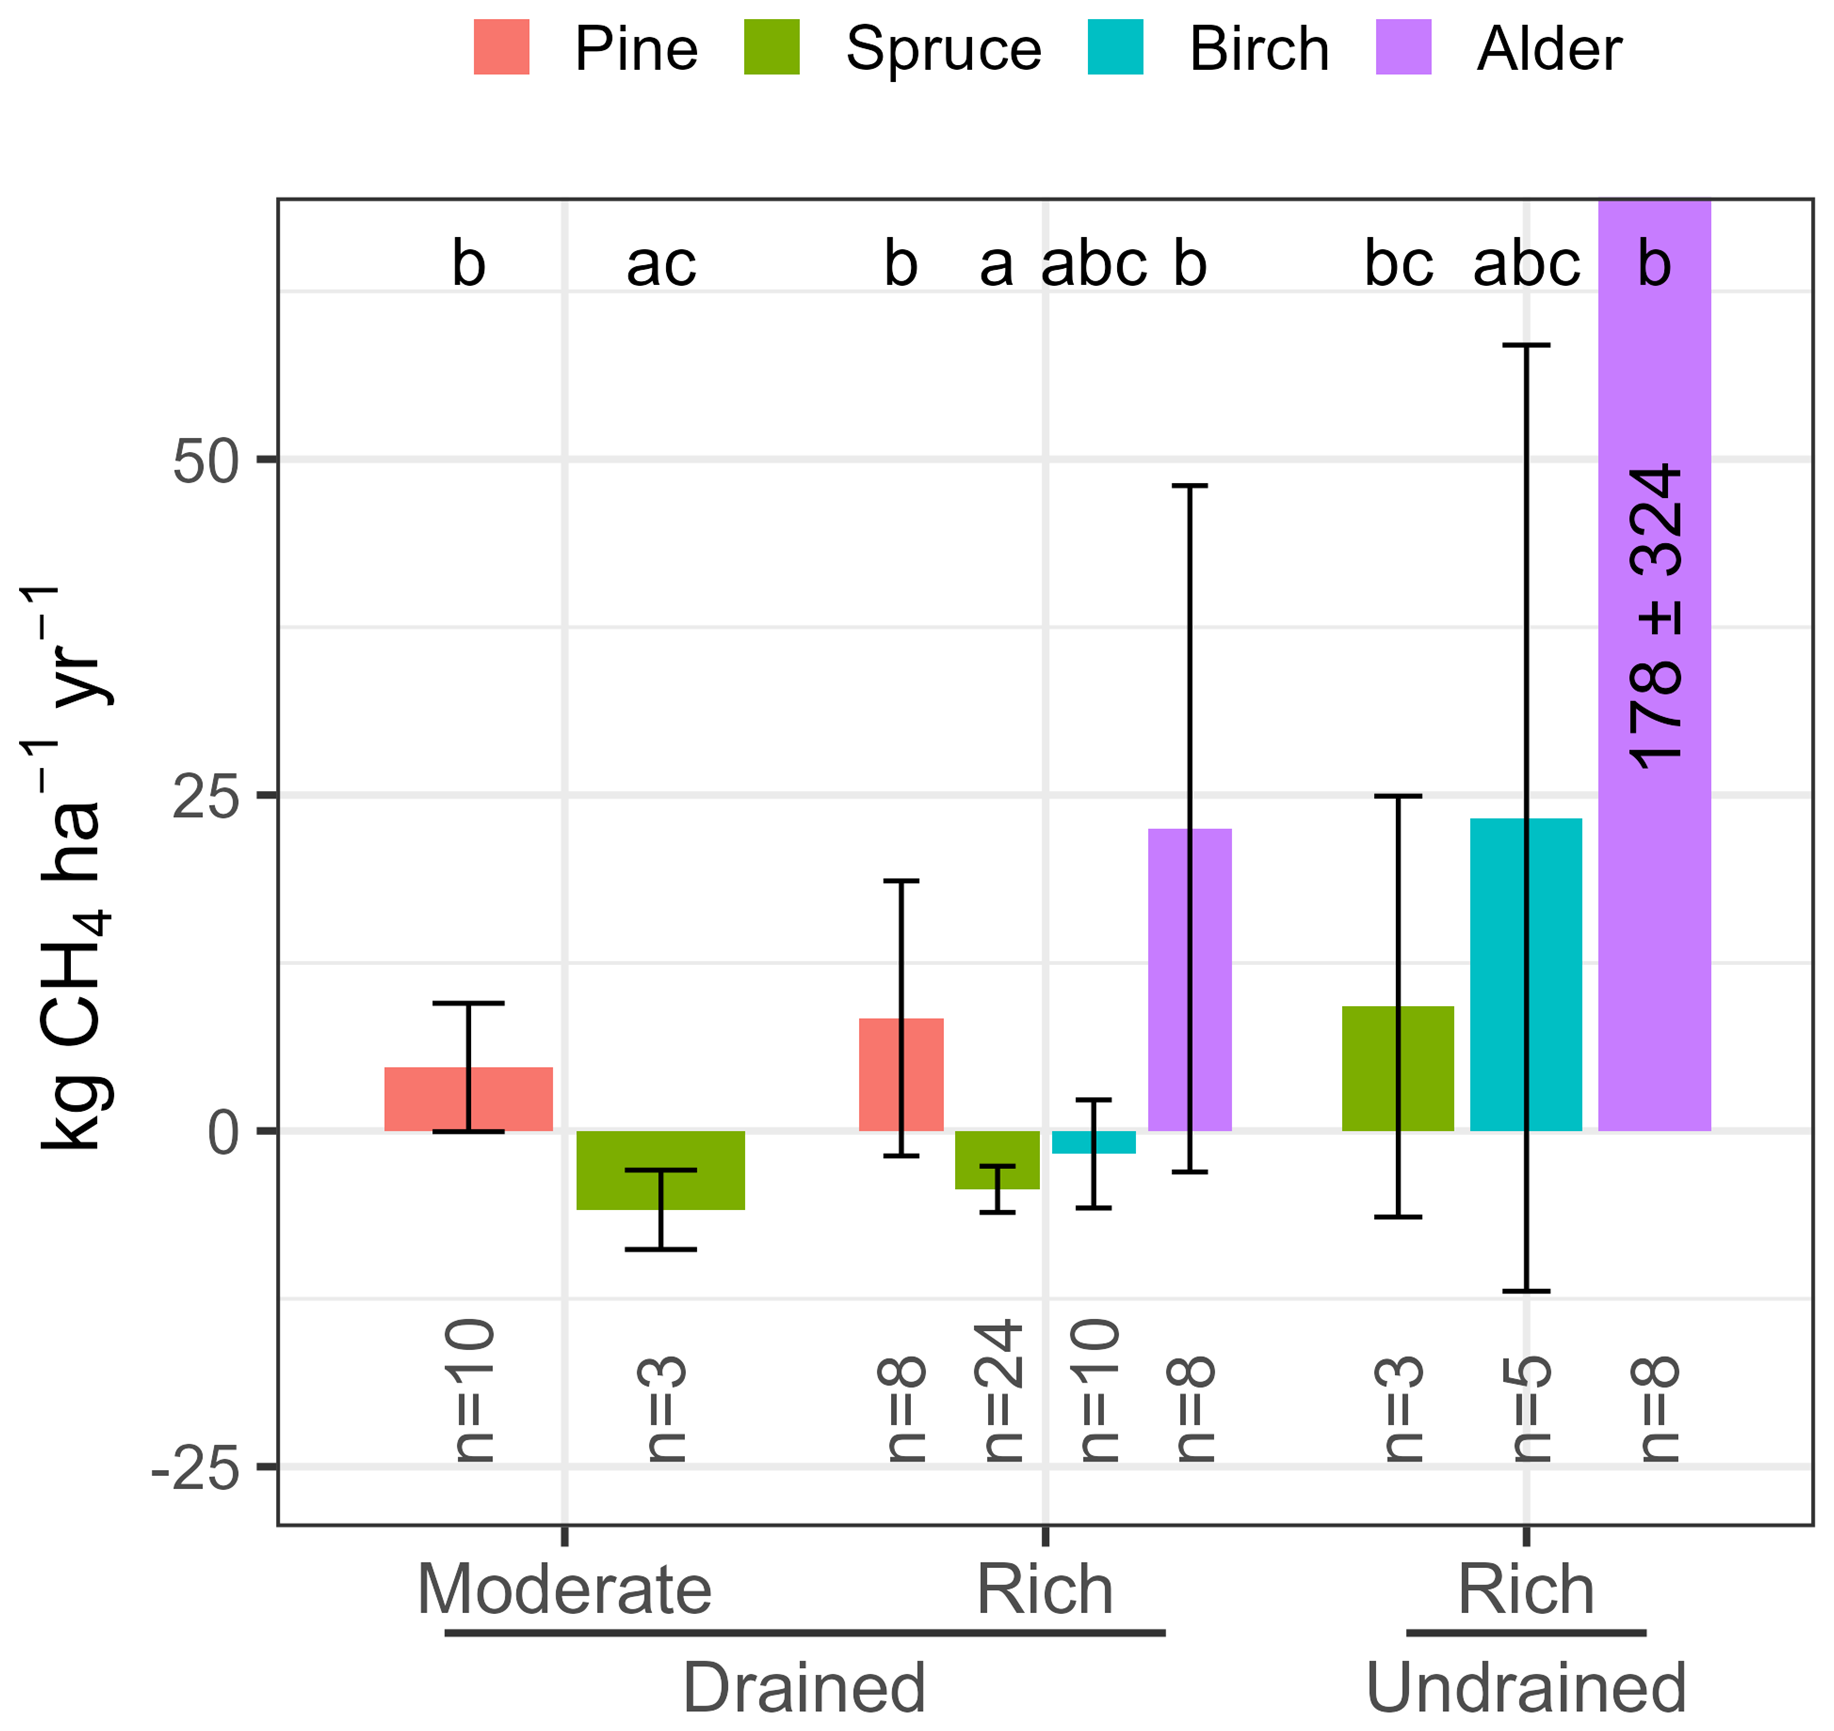
Figure 4Mean soil annual CH4 fluxes by soil drainage and nutrient status, and dominant tree species. Error bars indicate a 95 % confidence interval; n indicates the number of sites represented. A common lowercase letter indicates statistically insignificant differences in average annual CH4 fluxes. For numerical values, see Table B2.
However, these patterns reflect variation in water table levels among the respective study sites rather than species effects. For instance, alder stands in drained sites appear as comparatively larger CH4 sources because their mean water table level was 16 cm below the surface. Moreover, when the alder emission hotspot in undrained sites is excluded, mean CH4 emissions decrease from 178.2 to 12.8 kg CH4 ha−1 yr−1. Similarly, Scots pine stands appear biased toward CH4 sources, as half of the sites have mean water table levels above ∼ 20 cm. In the compiled dataset, a linear regression between mean water table level and annualised CH4 fluxes identified −20 cm as a threshold separating source and sink conditions, with CH4 uptake increasing by 0.102 kg CH4 ha−1 yr−1 for each 1 cm decrease in water table level. The mean CH4 fluxes for sites with mean water table level below and above 20 cm were −3.91 ± 0.41 and 70.88 ± 44.30 kg CH4 ha−1 yr−1, respectively. For comparison, drained and undrained sites were on average sources of 1.17 ± 1.58 and 92.88 ± 78.05 kg CH4 ha−1 yr−1.
3.3 Soil N2O fluxes
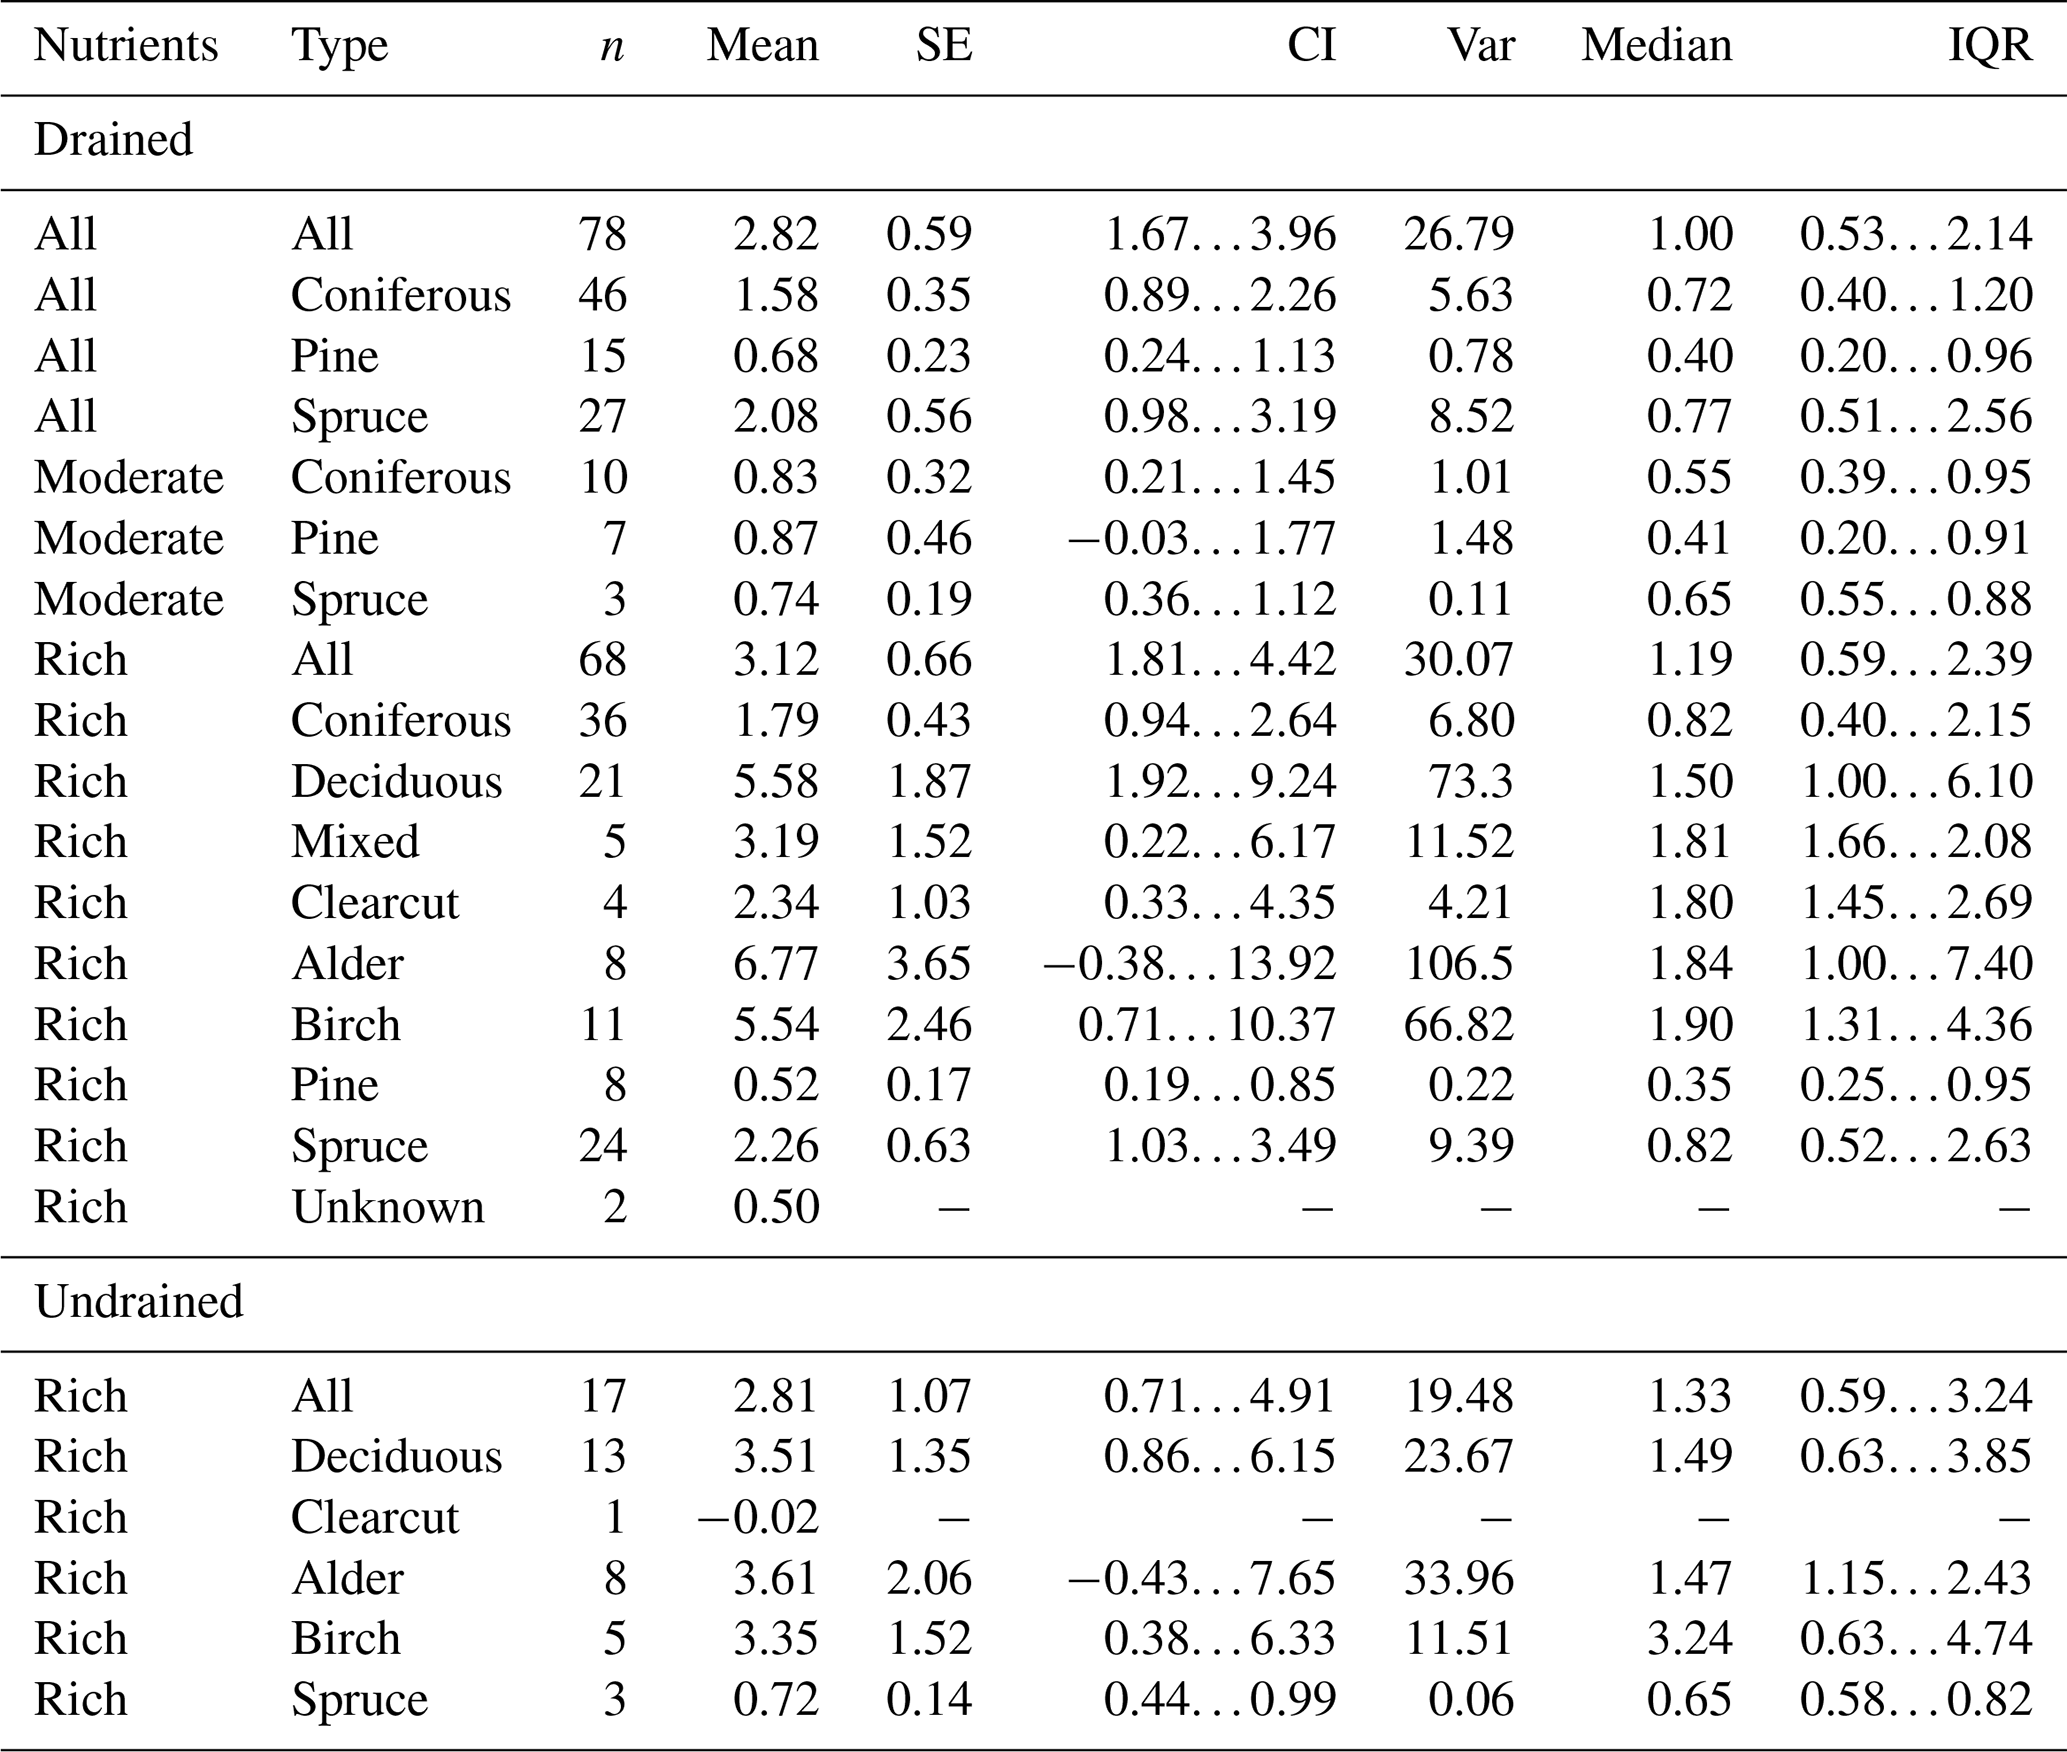
Soil N2O flux patterns suggested that species type may influence flux behaviour, as excess emissions were observed in deciduous stands regardless of drainage conditions, though these excesses were more pronounced under drained conditions (Figs. A4, 5). On average, N2O fluxes in deciduous stands were 2.82 ± 0.68 kg N2O ha−1 yr−1, irrespective of nutrient or drainage status. Due to the presence of outlier (excess) fluxes, statistical differences among deciduous stands could not be identified. Mean fluxes in drained deciduous sites were 5.58 ± 1.87 kg N2O ha−1 yr−1, whereas in undrained sites they were 3.51 ± 1.35 kg N2O ha−1 yr−1 or on average 37 % lower. In all conifer stands, emissions were on average 1.58 ± 0.35 kg N2O ha−1 yr−1.
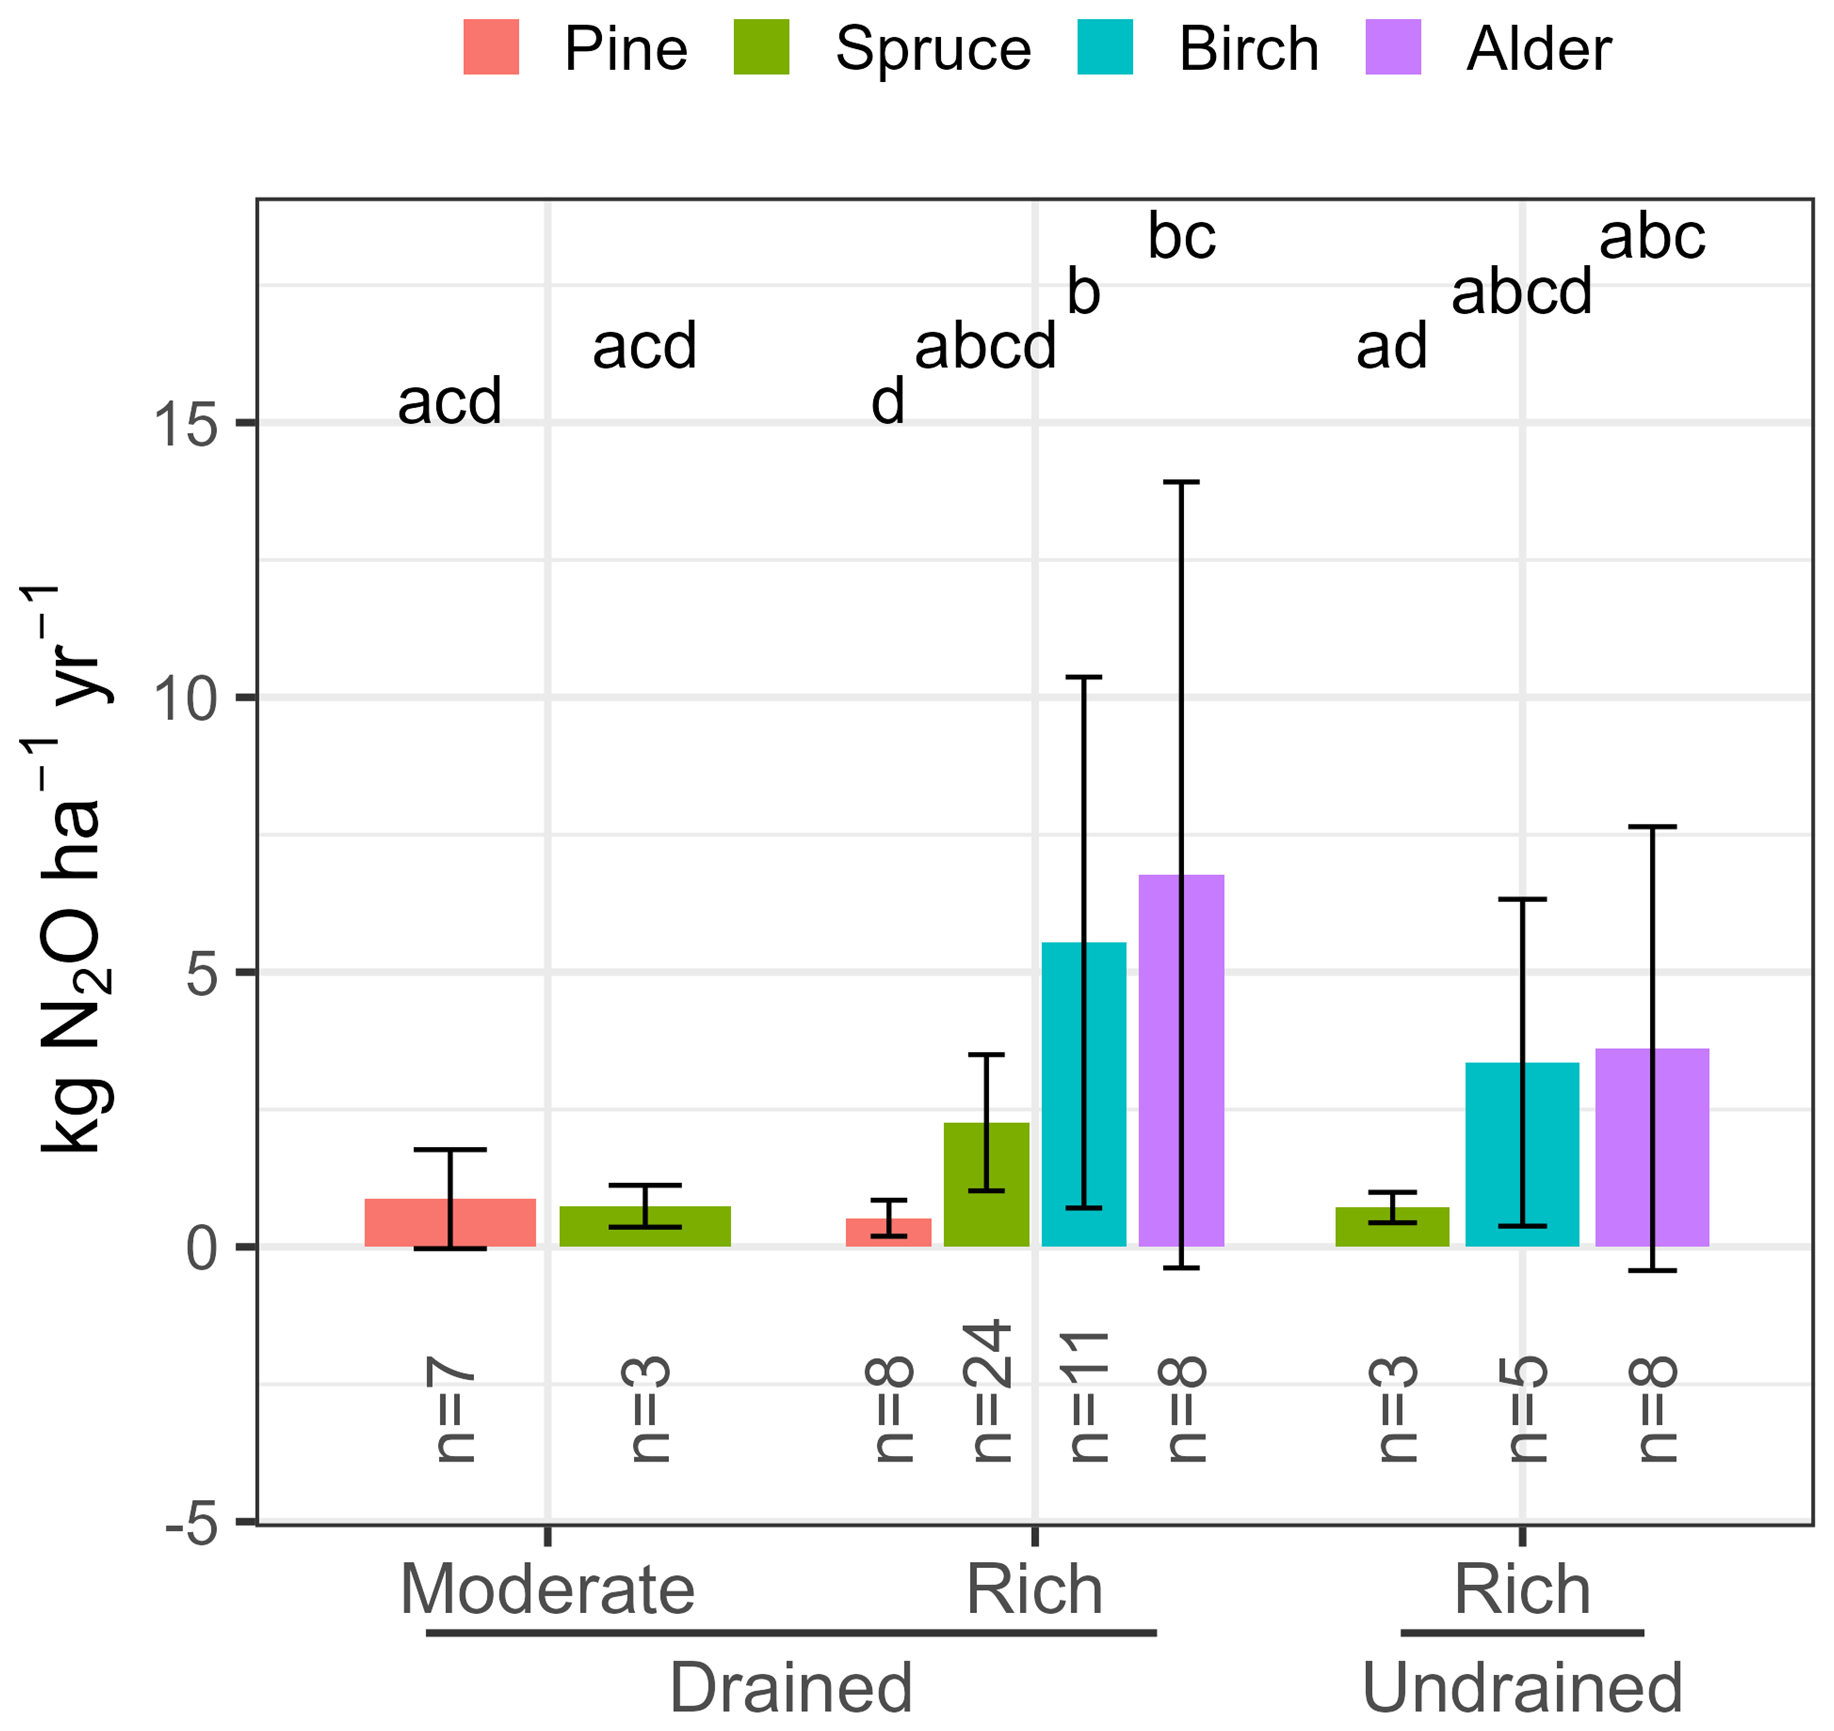
Figure 5Mean soil annual N2O fluxes by soil drainage and nutrient status, and dominant tree species. Error bars indicate a 95 % confidence interval; n indicates the number of sites represented. A common lowercase letter indicates statistically insignificant differences in average annual N2O fluxes. For numerical values, see Table B3.
3.4 Upscaling: Latvian Case
The synthesised EFs are intended for application within the Dfb climate zone; however, the level of EF aggregation can be adjusted for specific regions to reflect local conditions, such as nutrient status and the presence of dominant tree species. Here, we demonstrate the application of the synthesised EFs for upscaling tailored to Latvia's specific conditions. Latvia is situated in the hemiboreal region according to the vegetation zone classification (temperate–boreal transition; Ahti et al., 1968) and in the IPCC-defined cold temperate, moist climate region (Eggleston et al., 2006), which overlaps with the Köppen–Geiger Dfb classification (Beck et al., 2023). Therefore, the synthesised EFs are applicable, although specific Latvian conditions must be taken into account.
In Latvia, the area of drained organic soils is estimated at 529 kha, representing 8 % of the state area. Around 314 kha or 59 % of drained organic soils are in forest land (Fig. A5). At the Latvia scale, the coarsest level of granularity that can be reasonably applied for emission upscaling corresponds to the heterogeneity and spatial distribution of forest site types and dominant tree species as provided by the National Forest Inventory (NFI) data (Fig. 6). NFI distinguishes eight forest site types with organic soils based on drainage status and nutrient availability, the latter classified by ground-vegetation composition (Bušs, 1981). Nutrient availability for forest site types is further grouped into three categories: nutrient-poor, nutrient-moderate, and nutrient-rich soils (Bušs, 1981). For emission upscaling, we combined nutrient-poor and nutrient-moderate areas and applied the synthesised EFs for the “moderate” category.
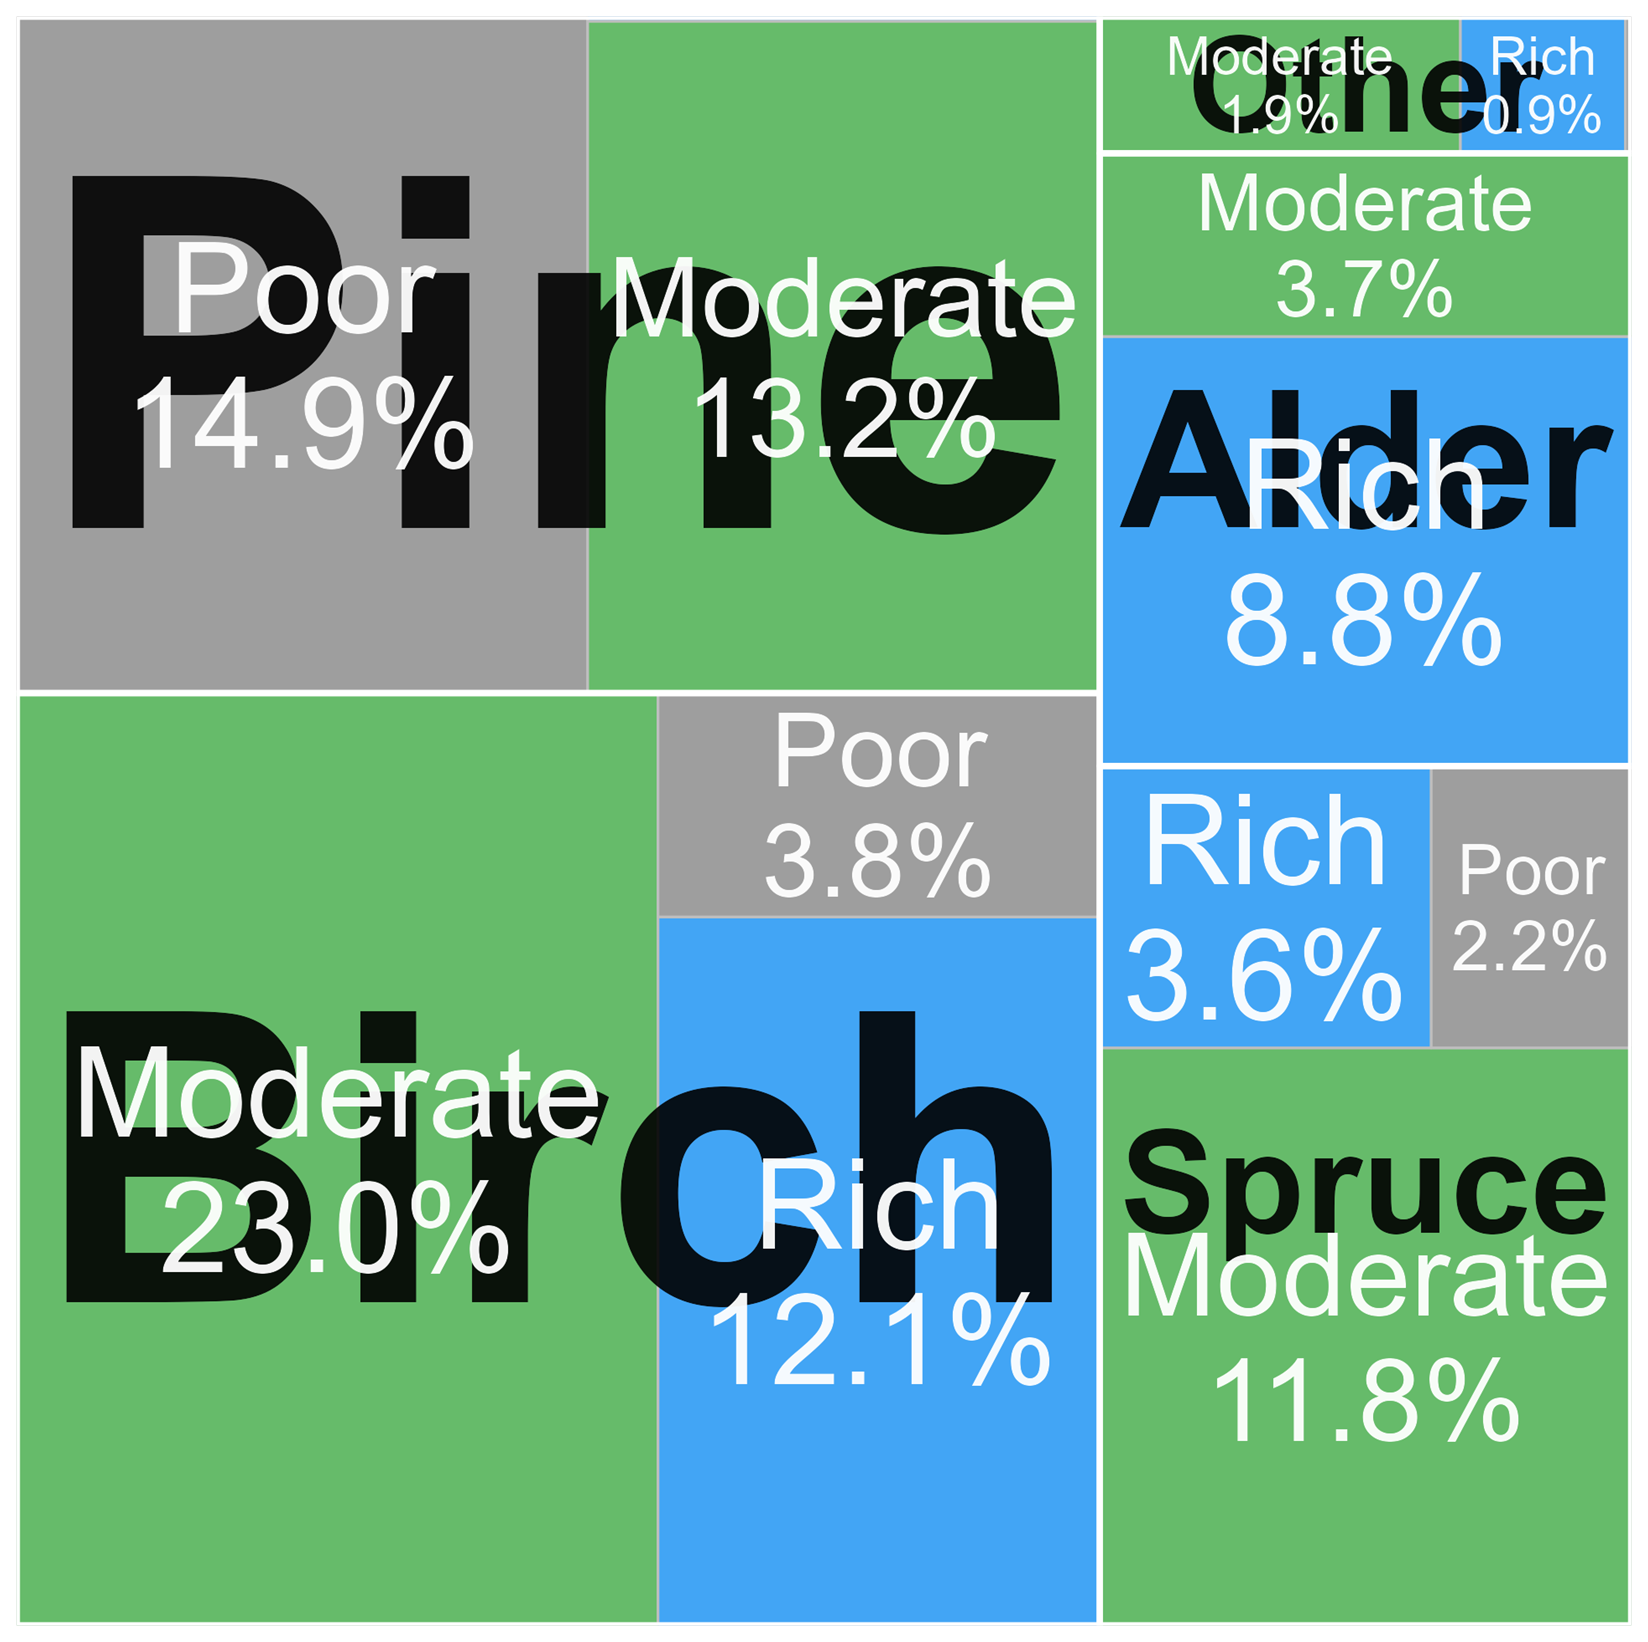
Figure 6Distribution of soil nutrient status and dominant tree species across drained forest lands in Latvia (Latvian National Forest Inventory, https://www.silava.lv/images/Petijumi/Nacionalais-meza-monitorings/MRM-rezultati/Kopsavilkumi-2023-IV-cikls.xlsx, last access: 12 January 2026).
Although differences in drained soil CO2 EFs, stratified by nutrient status and tree species, were generally not statistically significant, we applied EFs based on distinct source-sink patterns. To characterise emissions in all drained Scots pine stands, we used EFs aggregated for Scots pine under moderate and rich nutrient status. The choice was based on ecological reasoning that Scots pine does not tend to dominate on nutrient-rich soils, which was supported by NFI data showing that Scots pine accounts for less than 0.1 % of nutrient-rich forest types. This showed that it's appropriate to apply Scots pine EF, which aggregates any assigned nutrient status. A similar issue was encountered for Norway spruce, which typically occurs on nutrient-moderate soils (Latvian National Forest Inventory). However, the aggregated EF for such sites was underrepresented (3 sites, 20 %) and exhibited high flux variability (−1.91 ± 1.89 t CO2-C ha−1 yr−1). Therefore, we considered it appropriate to combine all available data points and derive a single EF for all drained Norway spruce stands, irrespective of nutrient status. For deciduous stands, only nutrient-rich EFs were available. Therefore, the choice was between applying a single EF to all deciduous stands or using birch- and alder-specific EFs for their respective areas. In addition to birch and alder (grey alder, black alder), approximately 6 % of organic soils are overgrown with other deciduous species, generally aspen, oak, or ash. For less common species for which national allometric equations are unavailable, the NFI classifies these stands as birch; we followed the same approach in this study. For alder species, we applied an alder-specific EF, as it exhibited a distinct source–sink pattern compared with birch.
For undrained soils, as well as for CH4 and N2O when grouped by drainage status, the use of a single EF was considered most appropriate. An exception was made for drained soil N2O, for which species–type–specific EFs were deemed more appropriate. These decisions were based on the absence of statistically significant differences in EFs or in source–sink dynamics, or on the observation that differences were driven by factors other than species or nutrient status, as demonstrated in the section on CH4 emissions.
Using this approach, the weighted CO2 EF for drained organic soils in Latvia is 0.14 t CO2-C ha−1 yr−1 (Table 1). Applying a single EF to all deciduous stands increases the weighted value to 0.23 t CO2-C ha−1 yr−1. Conversely, if a single nutrient-based EF were applied for CO2, the area-weighted mean would be −0.71 t CO2-C ha−1 yr−1, due to nutrient-rich organic soils being underweighted in Latvia's area distribution. Similarly, if, for N2O rather than species-type-specific EFs, a single value was used, the weighted 3.80 kg N2O ha−1 yr−1 would be reduced to 2.82 kg N2O ha−1 yr−1. Consequently, the choice of stratification can lead to differences in country-specific EFs.
Table 1Emission factors were identified as appropriate for upscaling GHG emissions from drained forest organic soil in Latvia.
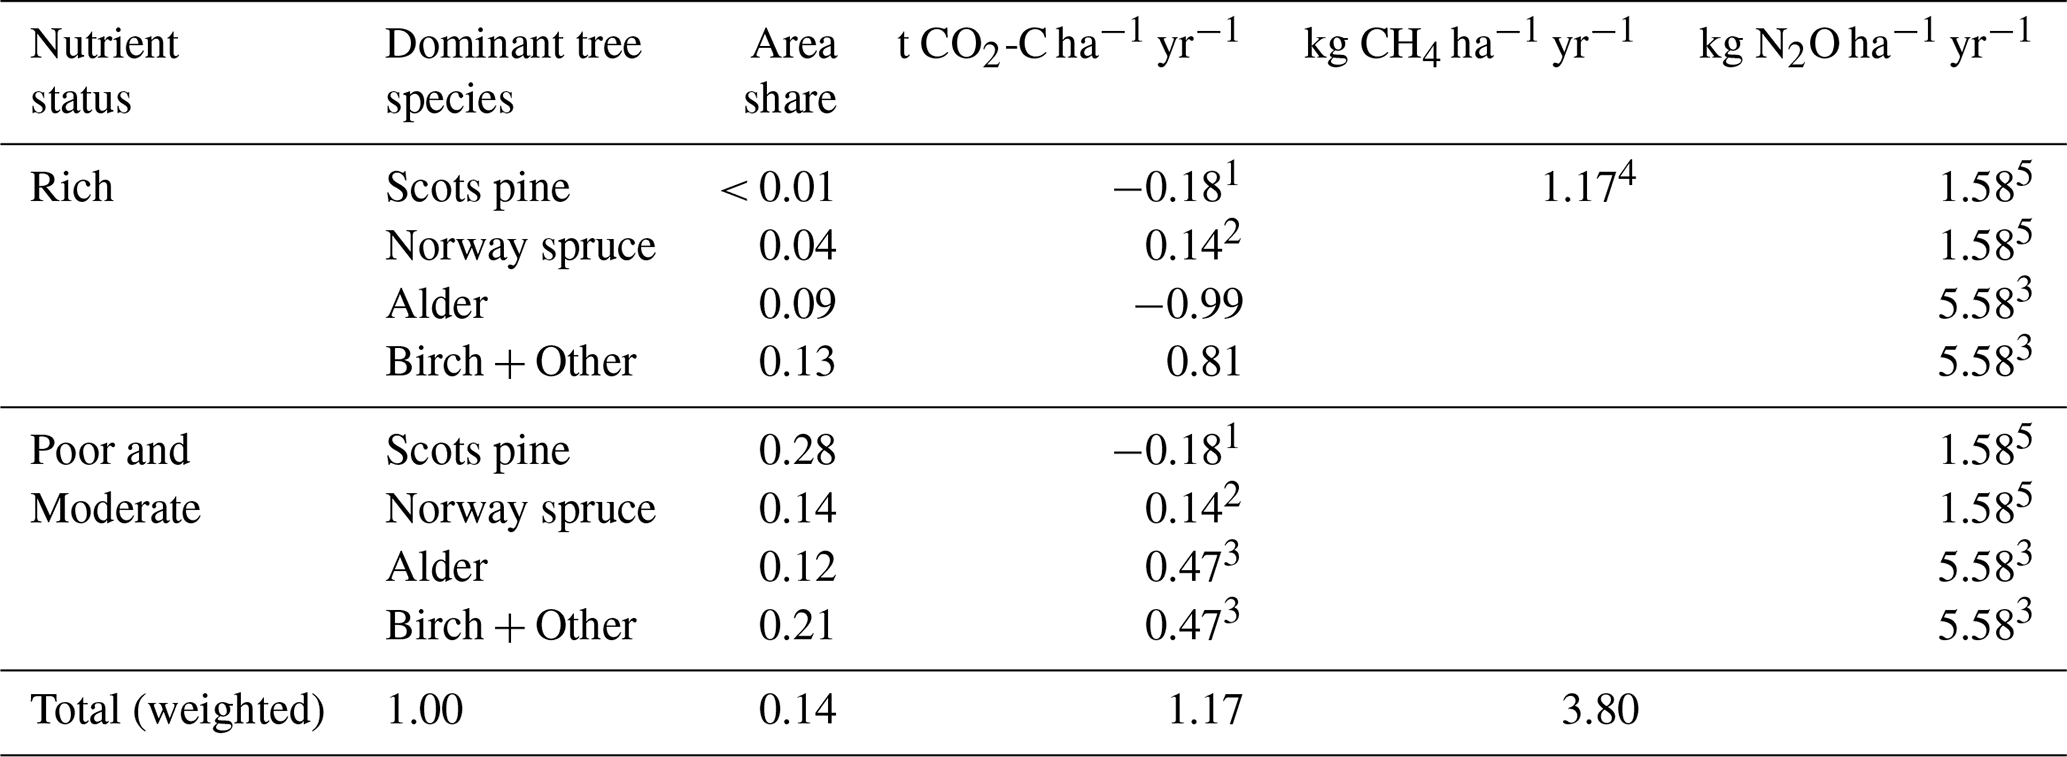
1 All Scots pine sites. 2 All Norway spruce sites. 3 All nutrient-rich deciduous sites. 4 All sites. 5 All conifer sites.
4.1 Emission factor stratification improves quality of the estimates
The main reason for developing EFs that reflect different local conditions, such as soil nutrient status, dominant tree species, or other factors, is their use in emission upscaling with improved accuracy. Applying a single EF across a wide geographic scale inevitably introduces bias if the EF does not capture the heterogeneity of conditions in the area. However, this is common practice in national GHG inventories (Lake et al., 2025), where EFs applied often represent averages derived from datasets covering broad geographic areas, without accounting for the representativeness or composition of the underlying data. These averaged EFs are subsequently applied to areas that may differ substantially in their actual composition in terms of dominant tree species and site nutrient status. Increasing the granularity of EFs represents an effective way to enhance the precision of upscaling. However, this also means that segregated EFs must be sufficiently representative of the corresponding area strata, necessitating more observations. Our study demonstrates an approach to mitigate the restraints caused by a limited number of observations. We constructed EFs for the northeastern part of the temperate zone by including a proportion of observations from the boreal zone, thereby ensuring partial overlap of data sources across regional boundaries. This overlap was justified by the demonstrated comparability of the regions, specifically by the Dfb climate zone, and enabled the acquisition of more observations without compromising representativeness. Furthermore, regional datasets are often produced by different research teams using varying study designs and equipment, which may introduce systematic biases into the results. Incorporating a portion of data from neighbouring areas into local datasets likely reduced potential biases arising from such methodological differences in EF estimation. This, in turn, technically improves the comparability of the elaborated EFs with those from the boreal zone, an essential requirement for large-scale GHG inventories that support coordinated policy decisions, such as those at the EU level. Notably, Jauhiainen et al. (2023) demonstrated that expanding and stratifying the dataset into more specific site categories improves EF precision, even if the updated mean emission values remain similar to previous estimates. Despite the uncertainties, the magnitude and direction of fluxes estimated in our study are broadly consistent with published measurements from boreal and hemiboreal forest organic soils (Jauhiainen et al., 2023), and the synthesised EFs reflect the best available knowledge for the region. In the absence of country-specific EFs, Latvia would have to rely on the IPCC default EF of 2.60 t CO2-C ha−1 yr−1, based on observations from eight sites (Hiraishi et al., 2014). Alternatively, regionally refined EFs could be adopted, such as the values of 1.61 and 1.46 t CO2-C ha−1 yr−1 reported by Jauhiainen et al. (2023) for nutrient-rich and nutrient-poor temperate forest organic soils, respectively, based on observations from 19 sites. However, the temperate climate region covers a broad geographical and climatic range extending to considerably warmer and drier parts of Europe, making these aggregated EFs poorly representative of Latvian conditions. The EF synthesised in the present study, 0.14 t CO2-C ha−1 yr−1, is substantially lower and is more consistent with the EFs derived by Jauhiainen et al. (2023) for drained boreal forest organic soils, which range from −0.23 to 0.73 t CO2-C ha−1 yr−1 depending on site nutrient status and stand productivity. The refined EF developed in this study, based on data from 81 study sites, also represents an improvement over the EF of 0.52 t CO2-C ha−1 yr−1 currently applied in Latvia's national GHG inventory (Latvia's National Inventory Document, 2025).
4.2 Representativeness and selection of emission factor strata
We observed that EF aggregation and the level of upscaling granularity can lead to diverging area-weighted EF outcomes, and identifying the most optimal approach for a given region may not be straightforward. Combining datasets from multiple sources introduces challenges related to data interpretation and harmonisation. In our case, an issue arose regarding potential differences in how soil nutrient-richness categories were assigned across the source datasets, likely reflecting variations in national forest site-type classification systems. This issue became evident in our upscaling case study, as the compiled dataset contained a substantial number of coniferous stands classified as growing on nutrient-rich soils, whereas such stands account for only about 4 % of drained forest organic soils in Latvia (Latvian National Forest Inventory). Nine of ten data points for nutrient-rich Scots pine sites were obtained from the Jauhiainen et al. (2023) synthesis, suggesting that different forest site-type classification systems may not yield directly comparable indicators of nutrient status. Accordingly, nutrient-status classes should be interpreted as operational groupings rather than strictly equivalent indicators across datasets.
Despite this issue, the results suggested that nutrient availability has a stronger predictive capacity for fluxes than tree species. This finding supports previous results indicating that nutrient status plays a key role in determining GHG emissions across different ecosystems (e.g., Säurich et al., 2019). However, in our case, aggregated EFs derived specifically for conifers on nutrient-rich soils had limited practical relevance for national upscaling. Therefore, we considered flux aggregation by species to be the most appropriate approach, as nutrient status classifications in the compiled data may vary, but stand types themselves are ecologically meaningful for data stratification. This is because dominant tree species not only reflect soil properties but also shape them (Hagen-Thorn et al., 2004; Lorenz and Thiele-Bruhn, 2019; Vesterdal et al., 2013). Fast-growing, nutrient-demanding species likely represent nutrient-rich soils because in such areas they tend to outcompete other species, whereas nutrient-tolerant species prevail in nutrient-poor sites, as they prevail in conditions of low nutrient availability that limits the growth of other species. In turn, the species established further reinforces the soil conditions, including decomposition of litter and the associated microbial community composition they inhabit (Wang et al., 2016; Bai et al., 2023): nutrient-demanding broadleaves enrich soils with labile organic matter (Vancampenhout et al., 2012), while nutrient-tolerant species maintain more acidic conditions that limit nutrient availability for other species (Šantrůčková et al., 2019). This reasoning was supported by the observation that nutrient availability differs statistically among sites dominated by different species types (Fig. A1).
The decision to stratify nutrient-rich alder and birch stands, which showed an apparently distinct sink–source pattern though not statistically significant, was more challenging. Whether upscaling should rely on such stratification or on a total mean EF remains debatable, as current knowledge lacks ecological evidence to explain these sink–source dynamics. Nutrient-rich undrained stands dominated by black alder in our dataset showed increased spatial variability in CH4 and N2O fluxes, complicating generalisations. High inputs of labile litter and nitrogen in deciduous stands could stimulate microbial processes that produce N2O (Zhou et al., 2022) even under wet conditions (Elberling et al., 2023; Rautakoski et al., 2024), but more data are needed to confirm this mechanism. Such difficulties will likely persist until a sufficient number of observations is available to provide a statistically robust justification for data-use decisions, or may persist even as long as EFs are used for emission upscaling. Studies have begun linking organic soil GHG fluxes to measurable site properties. For instance, under both drained and wet conditions, the magnitudes of peat CO2 and CH4 emissions are linked to geochemical variables such as pH, P content, and water-holding capacity (Nielsen et al., 2023). Since soil emissions are dependent on the chemical and physical properties of the soil (Rubaiyat et al., 2023), improvements can be achieved not only by expanding the emission sample set accompanied by observations of potential influencing factors, including quantitative assessments of soil properties, but also by conducting in-depth evaluations of the relationships between soil properties and forest types. Quantifying soil–forest type–species relationships would allow us to determine which level of data stratification or aggregation is ecologically rational.
Irrespective of the chosen flux stratification, application of acquired average values for upscaling to national emissions is likely to introduce biases, if the weighted impact of site characteristics, including stand variables, water table level and management practices are not accounted for. Water table levels represented at the study sites clearly demonstrated how bias can be introduced into the synthesised CH4 EFs, creating a false impression of species impact. A water table level threshold of approximately 20 cm is well known to be a deterministic indicator of whether a site is a CH4 source or sink (Jovani et al., 2023; Hatano, 2019). We observed that the significant differences in fluxes among drained sites with different dominant tree species were driven by the inclusion of sites with mean water tables above −20 cm. This highlights a common issue: the classification of drainage status (i.e. the presence of drainage ditches) does not necessarily imply that the ditches are functional or that the water table is actually lowered (Butlers et al., 2025). For this reason, we do not consider dominant tree species a suitable single proxy for CH4 flux upscaling; instead, it should rely on water table data. However, because spatial water-table data, even when derived from remote sensing, have not yet been validated against ground-truth measurements (Ibrahim et al., 2024), it is more practical to use mean fluxes by drainage status for upscaling. This approach would assume that the probability of non-functional drainage ditches within the studied sites reflects the situation across the upscaled region.
4.3 Effects of stand development on emission factors
Stand development stages included in the dataset demonstrated an impact on synthesised CO2 EFs. The issue is well illustrated by clearcuts, where the risk of soil C loss is increased, with mean fluxes of 0.90 ± 0.28 t CO2-C ha−1 yr−1, compared with the overall mean for drained soils of 0.22 ± 0.18 t CO2-C ha−1 yr−1. Increased GHG emissions in a drained peatland forest after clear-cutting, at least in the short term, compared with mature forests, are consistent with earlier findings (e.g., Tikkasalo et al., 2025; Korkiakoski et al., 2023). However, such assessments are challenged by the difficulty of partitioning CO2 emissions originating from the decomposition of historical soil organic matter and deadwood, which increase substantially after harvesting due to above- and belowground residues (Menichetti et al., 2025). The compiled dataset also showed a moderate correlation (r=0.41) between stand age and soil C balance, indicating a higher likelihood of soils acting as a C source in stands younger than ∼ 25 years and suggesting an increasing sink potential of about 0.02 t C ha−1 yr−1 with subsequent aging. The flux data supplemented by stand age information showed a mean age of 56 years and an interquartile range of 31–73 years. This indicates a risk of underestimating emissions if the elevated fluxes from clearcuts and young stands are not properly accounted for. Using a 25-year threshold derived from regression analysis, we found that younger stands, on average, were a source of 0.61 ± 0.44 t CO2-C ha−1 yr−1.
However, the soil carbon balance relationship identified with stand age only illustrates part of the issue. The true impact of stand development should be derived from relationships between soil conditions and stand variables, such as soil gross emissions, carbon inputs from litter, and their interaction. We observed that the ground vegetation component contributes approximately 30 % of the total reported carbon input to soil. However, no quantitative relationships with site variables could be identified. This component is likely highly influenced by soil nutrient status, suggesting that potential relationships are obscured by noise arising from insufficient measurement replication and unaccounted site heterogeneity. It is crucial that future research focuses on increasing the amount of data characterising soil C input dynamics during stand development to enable dynamic soil C balance modelling. At present, however, such analyses are highly constrained by the critically limited number of available observations. Similar to GHG efflux data, regional C influx measurements are largely concentrated in Finland, where biomass–litter equations dependent on stand variables have been developed (e.g., Starr et al., 2005; Muukkonen and Mäkipää, 2006). These equations, however, are unlikely to be directly applicable at a broader regional scale, making this data gap a key limitation for advancing spatially explicit soil C balance modelling. Furthermore, C fluxes, both efflux and influx, can respond to typical management activities such as tending (e.g., Yang et al., 2022; Doukalianou et al., 2022) as well as natural disturbances (e.g., Ribeiro-Kumara et al., 2020) and therefore vary over the course of a forest rotation cycle. However, data remain insufficient to accurately incorporate these impacts. Nevertheless, the compiled dataset indicates that stratification by drainage status and dominant tree species provides a practical first-order improvement for upscaling.
4.4 Drainage impact on emission factors
EFs derived from combined drained and undrained site observations show that, on average, drained organic soils are either GHG-neutral or net sources, while undrained soils can function as both sources and sinks, with uncertainties several times higher due to variable CH4 and N2O fluxes. Consequently, net drainage impact on GHG emissions remains unknown (Fig. 7). Uncertainty in undrained soil GHG emissions remains largely driven by a single CH4-emission hotspot site. It is unknown whether the alder CH4 emission hotspot is exceptional, and increasing the amount of data will continue to reduce the mean estimate and uncertainty, or another hotspot will eventually be captured.
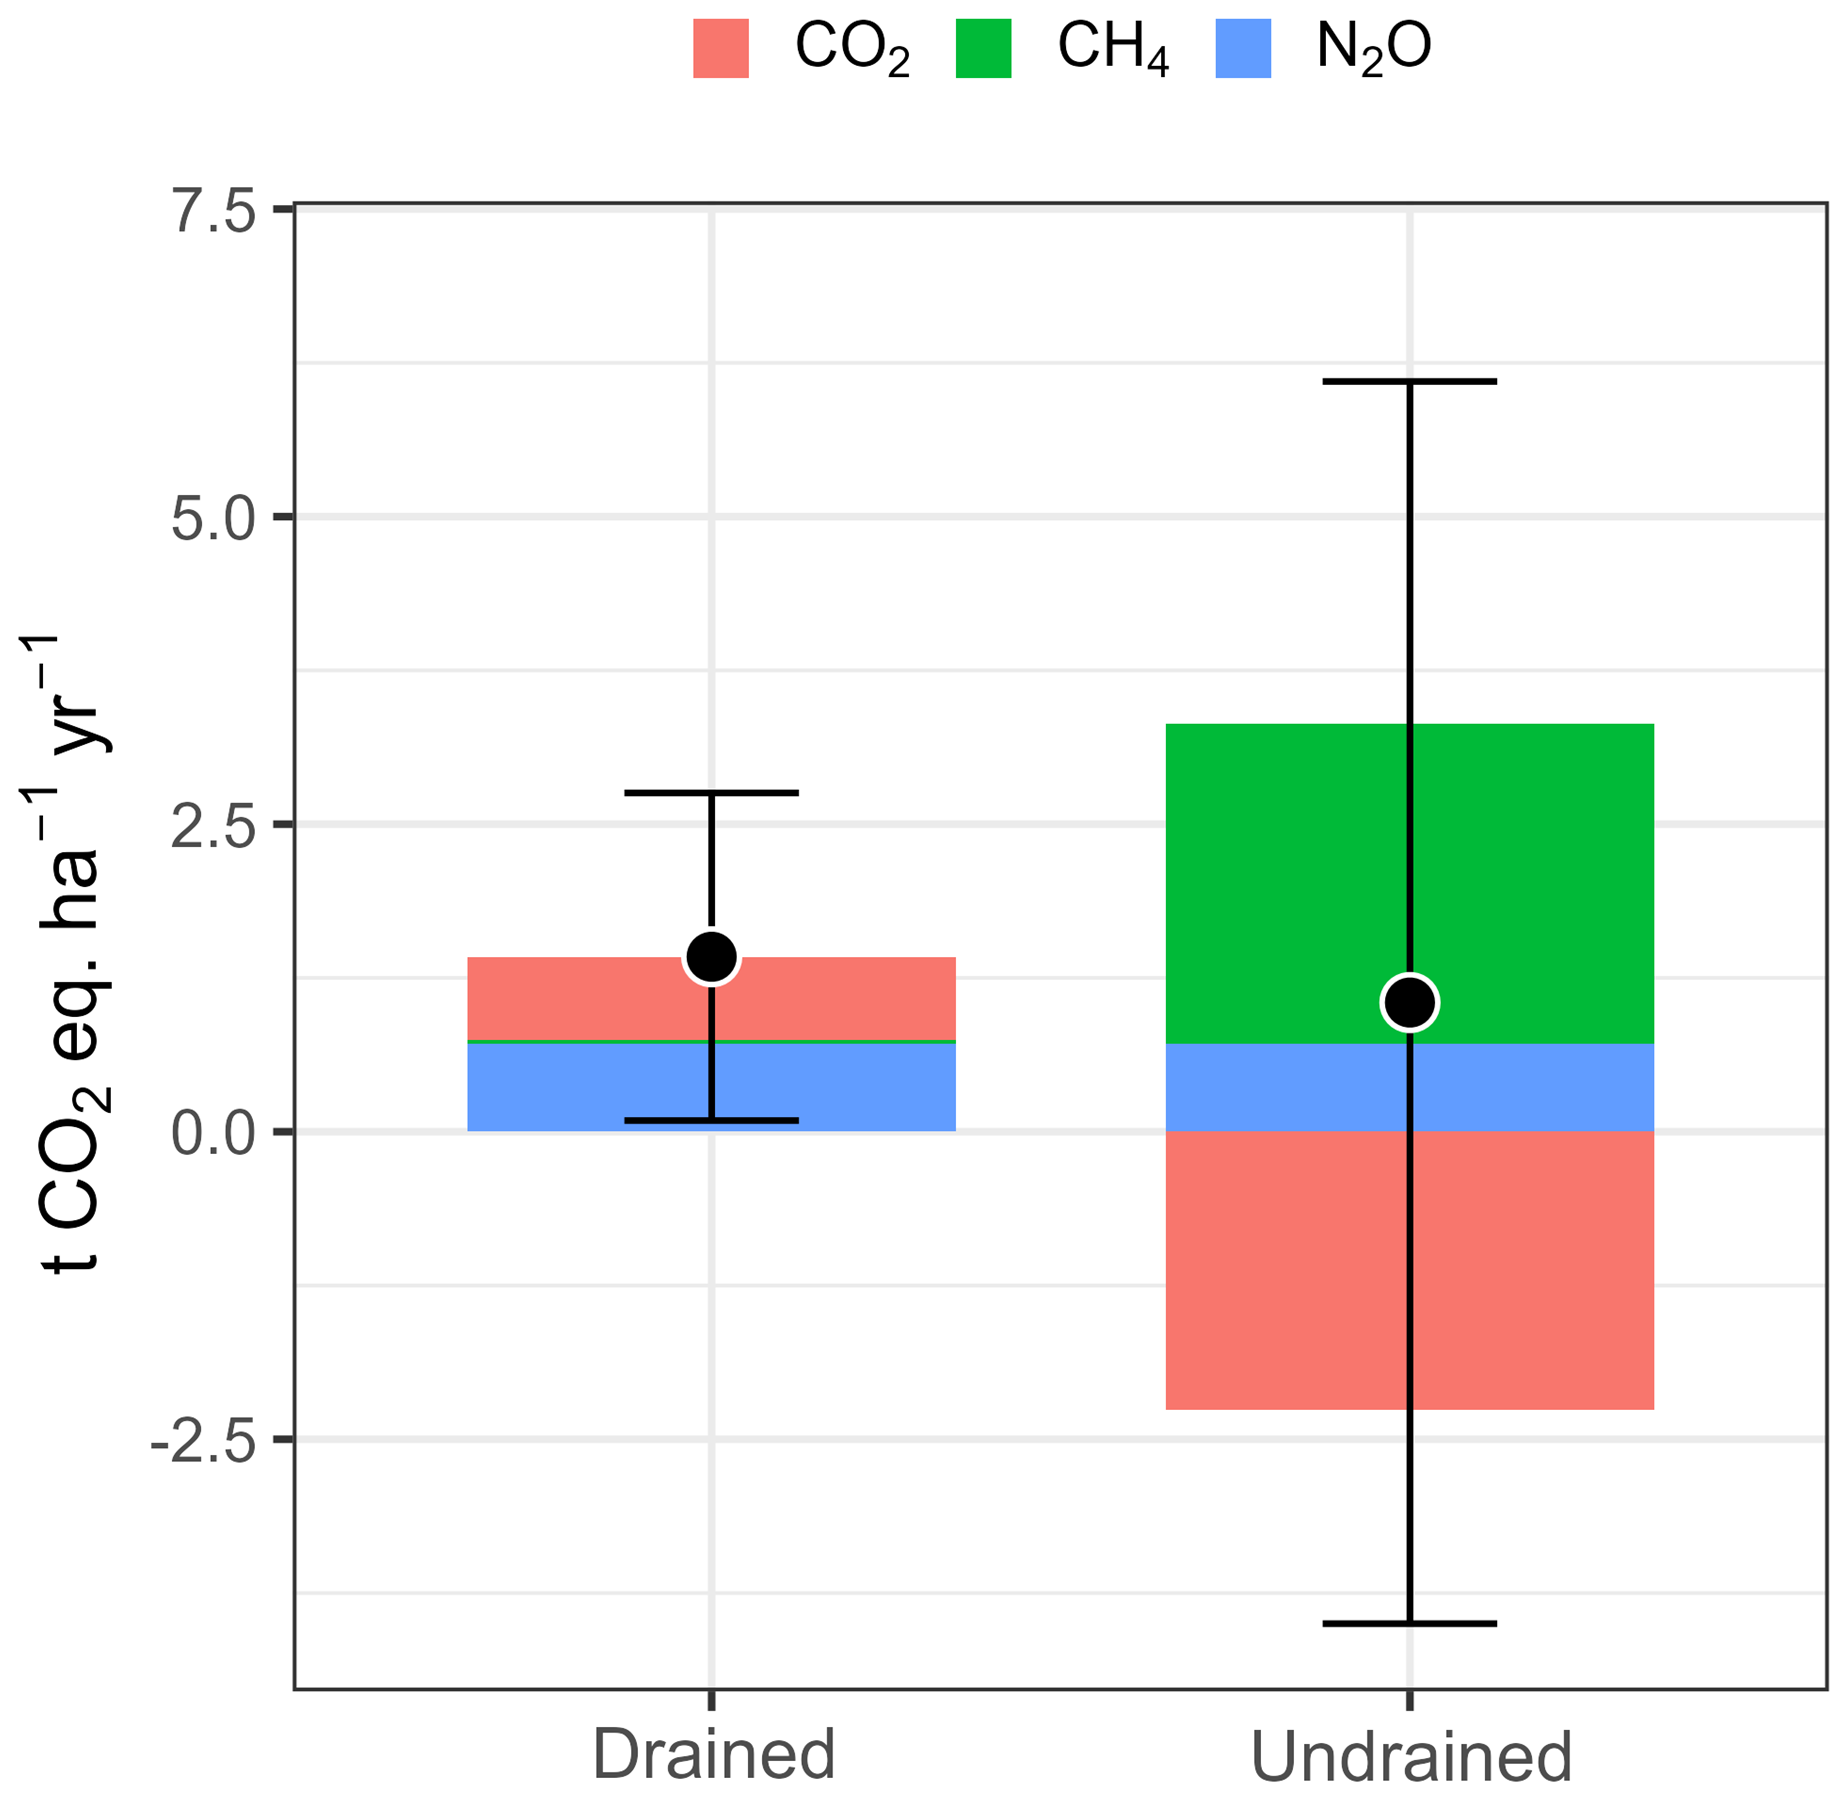
Figure 7Mean GHG emissions from drained and undrained organic soils expressed in CO2 equivalents according to AR5 100-year global warming potentials (Huang et al., 2013). Error bars indicate the combined uncertainty (root mean square sum) expressed as a 95 % confidence interval.
Undrained forest organic soils generally skew toward acting as CO2 sinks; however, irrespective of drainage status, soils have been found to be CO2 sources, likely depending on local conditions such as soil nutritional conditions, dominant tree species, and stand development stage. Soil nutrient status, to a large extent, was reflected by the dominant tree species, indicating that both can serve as useful categories for classifying soil GHG fluxes. Drained deciduous stands are reported to be on average CO2 sources, while drained coniferous stands are roughly CO2 neutral. Soils in drained stands older than 25 years are more likely to act as CO2 sinks, highlighting the importance of the forest development stage in carbon balance assessment. CH4 emissions from undrained soils exhibited the greatest uncertainty, largely driven by variability in groundwater levels rather than forest type or nutritional conditions. This makes the development and upscaling of CH4 emission factors especially challenging. Similarly, N2O emissions showed high site-level variability, with elevated fluxes driven by statistical outliers in both drained and undrained deciduous stands, resulting in comparably increased fluxes. Currently available data do not allow robust quantification of drainage impacts on the total GHG balance, owing to residual flux variability that cannot yet be statistically explained. However, expanding CO2 datasets linked to stand variables and quantitative soil physicochemical properties offers strong potential for future site-specific assessments of soil carbon balance across stand development stages. The study's findings provide empirical support for refining greenhouse gas accounting approaches for forest organic soils.
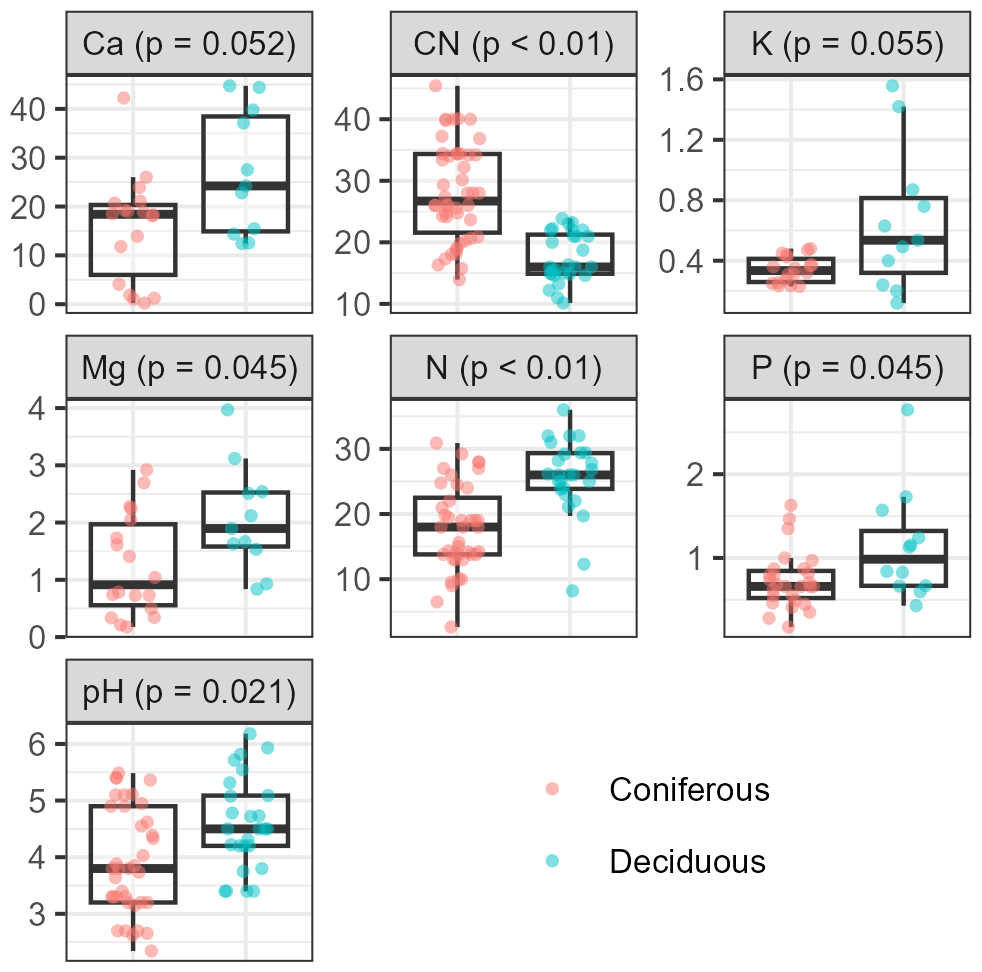
Figure A1Variation in soil parameters. (Ca – calcium, Mg – magnesium, K – potassium, N – total nitrogen, P – total phosphorus, CN – ratio, pH – soil pH) in drained coniferous (red) and deciduous (green) stands. Ca, K, Mg, N and P are expressed in g kg−1. The bottom and top edges of the box represent the 25th and 75th percentiles, summarising the interquartile range (IQR). The whiskers extend to the smallest and largest values within 1.5 × IQR from the 25th and 75th percentiles, respectively. A solid horizontal line in the box indicates the mean and median values.
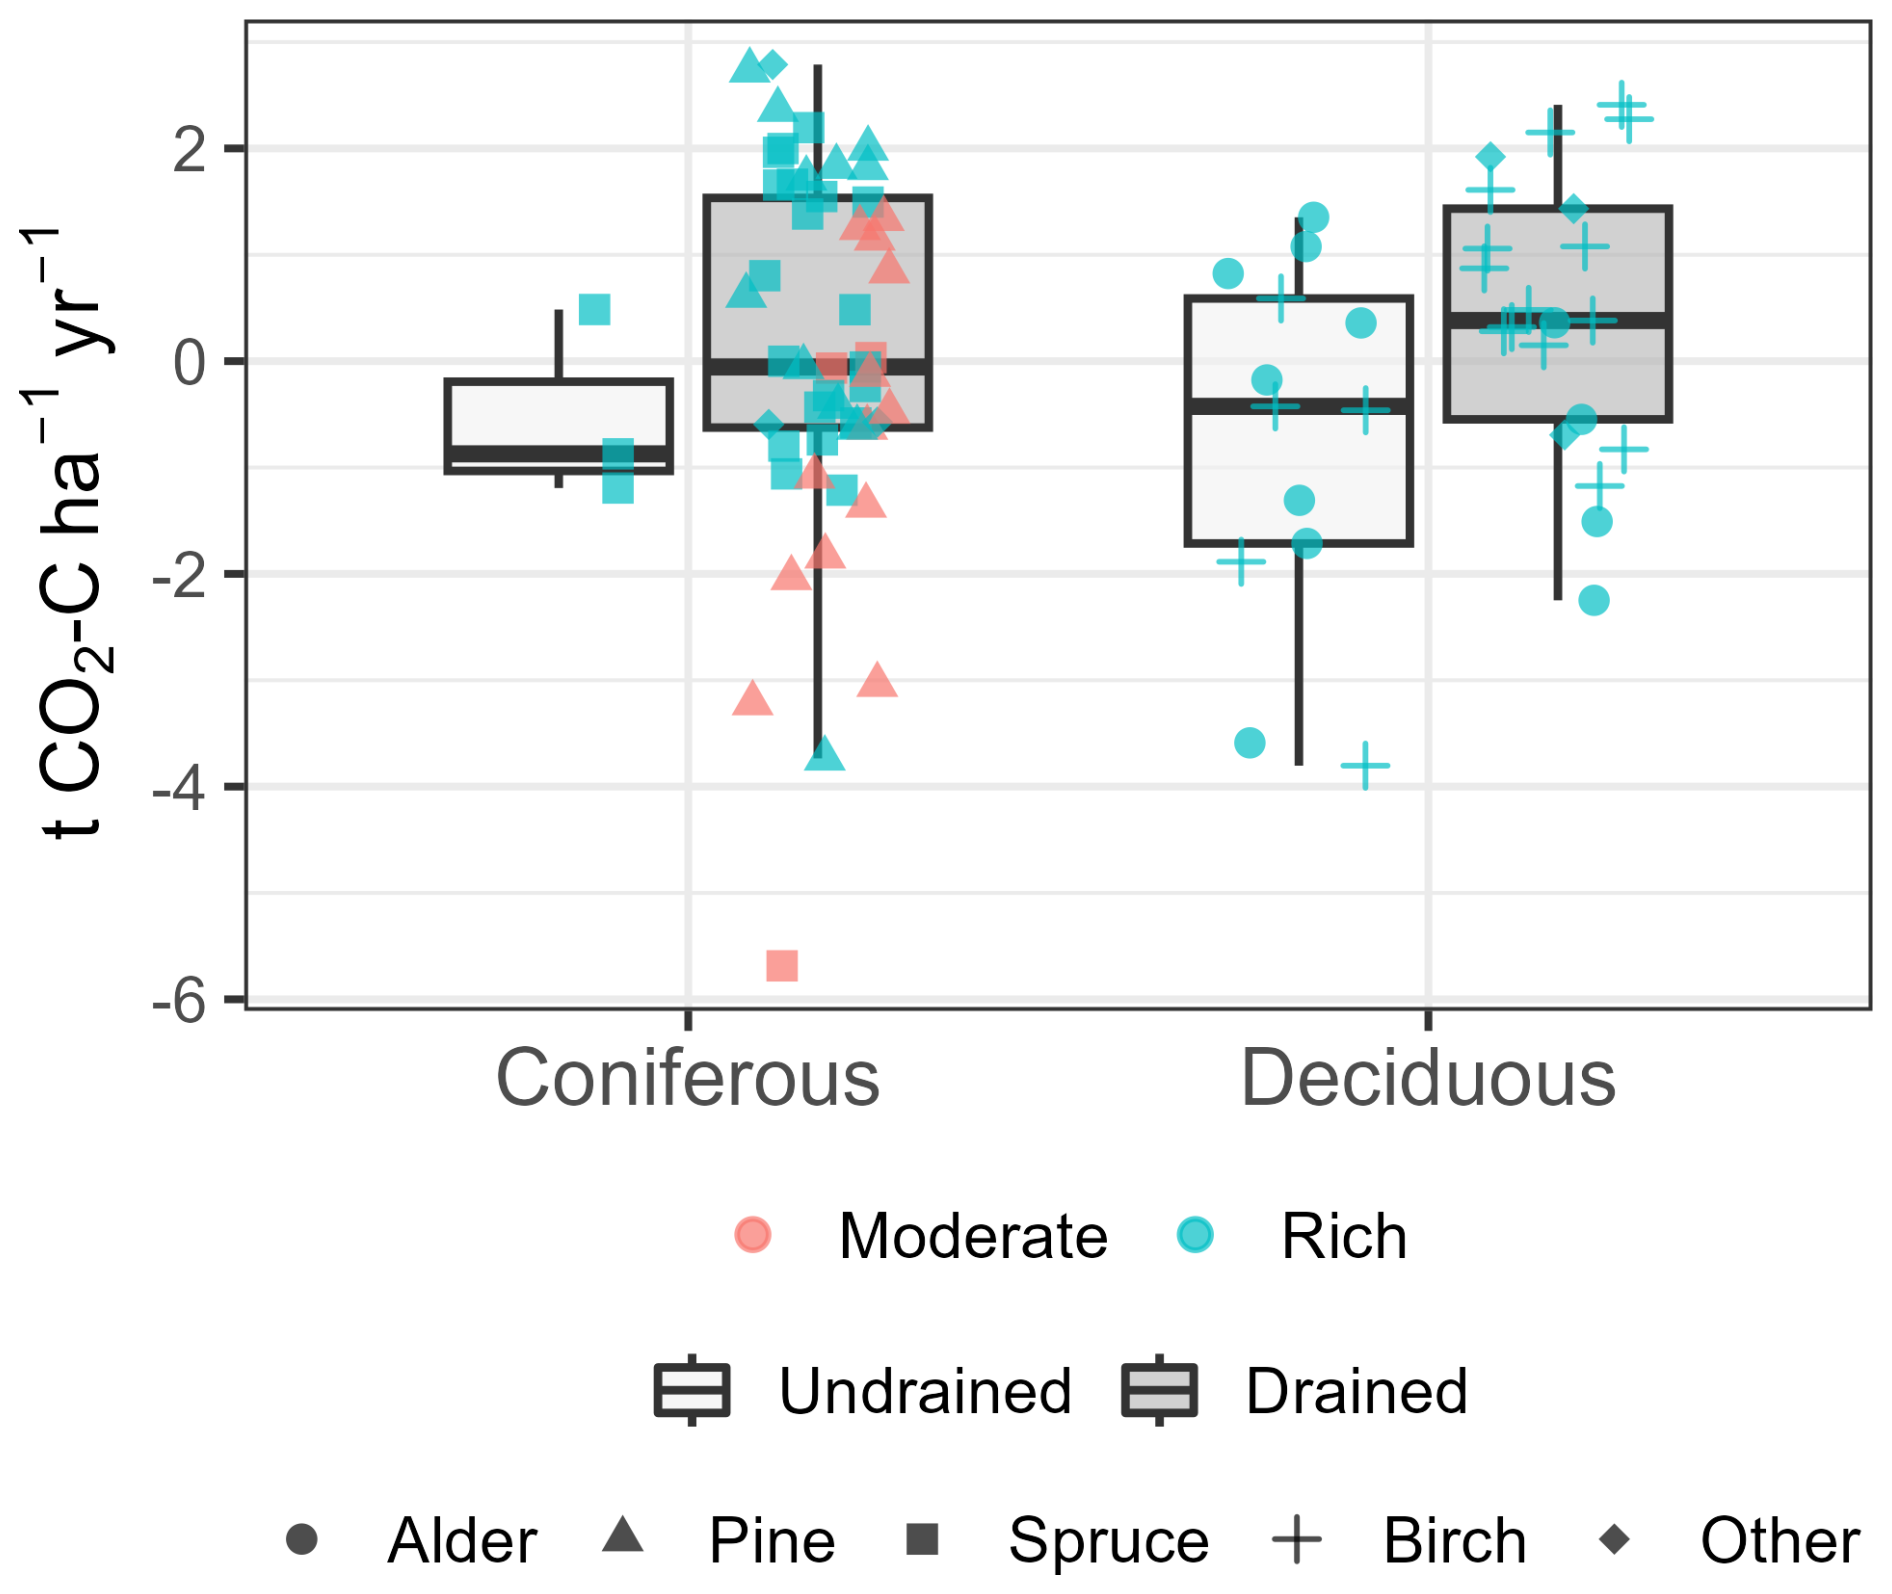
Figure A2Variation of soil net CO2 fluxes by drainage status, tree species type and nutrient status. The bottom and top edges of the box represent the 25th and 75th percentiles, summarising the interquartile range (IQR). The whiskers extend to the smallest and largest values within 1.5 × IQR from the 25th and 75th percentiles, respectively. A solid horizontal line in the box indicates the mean and median values.
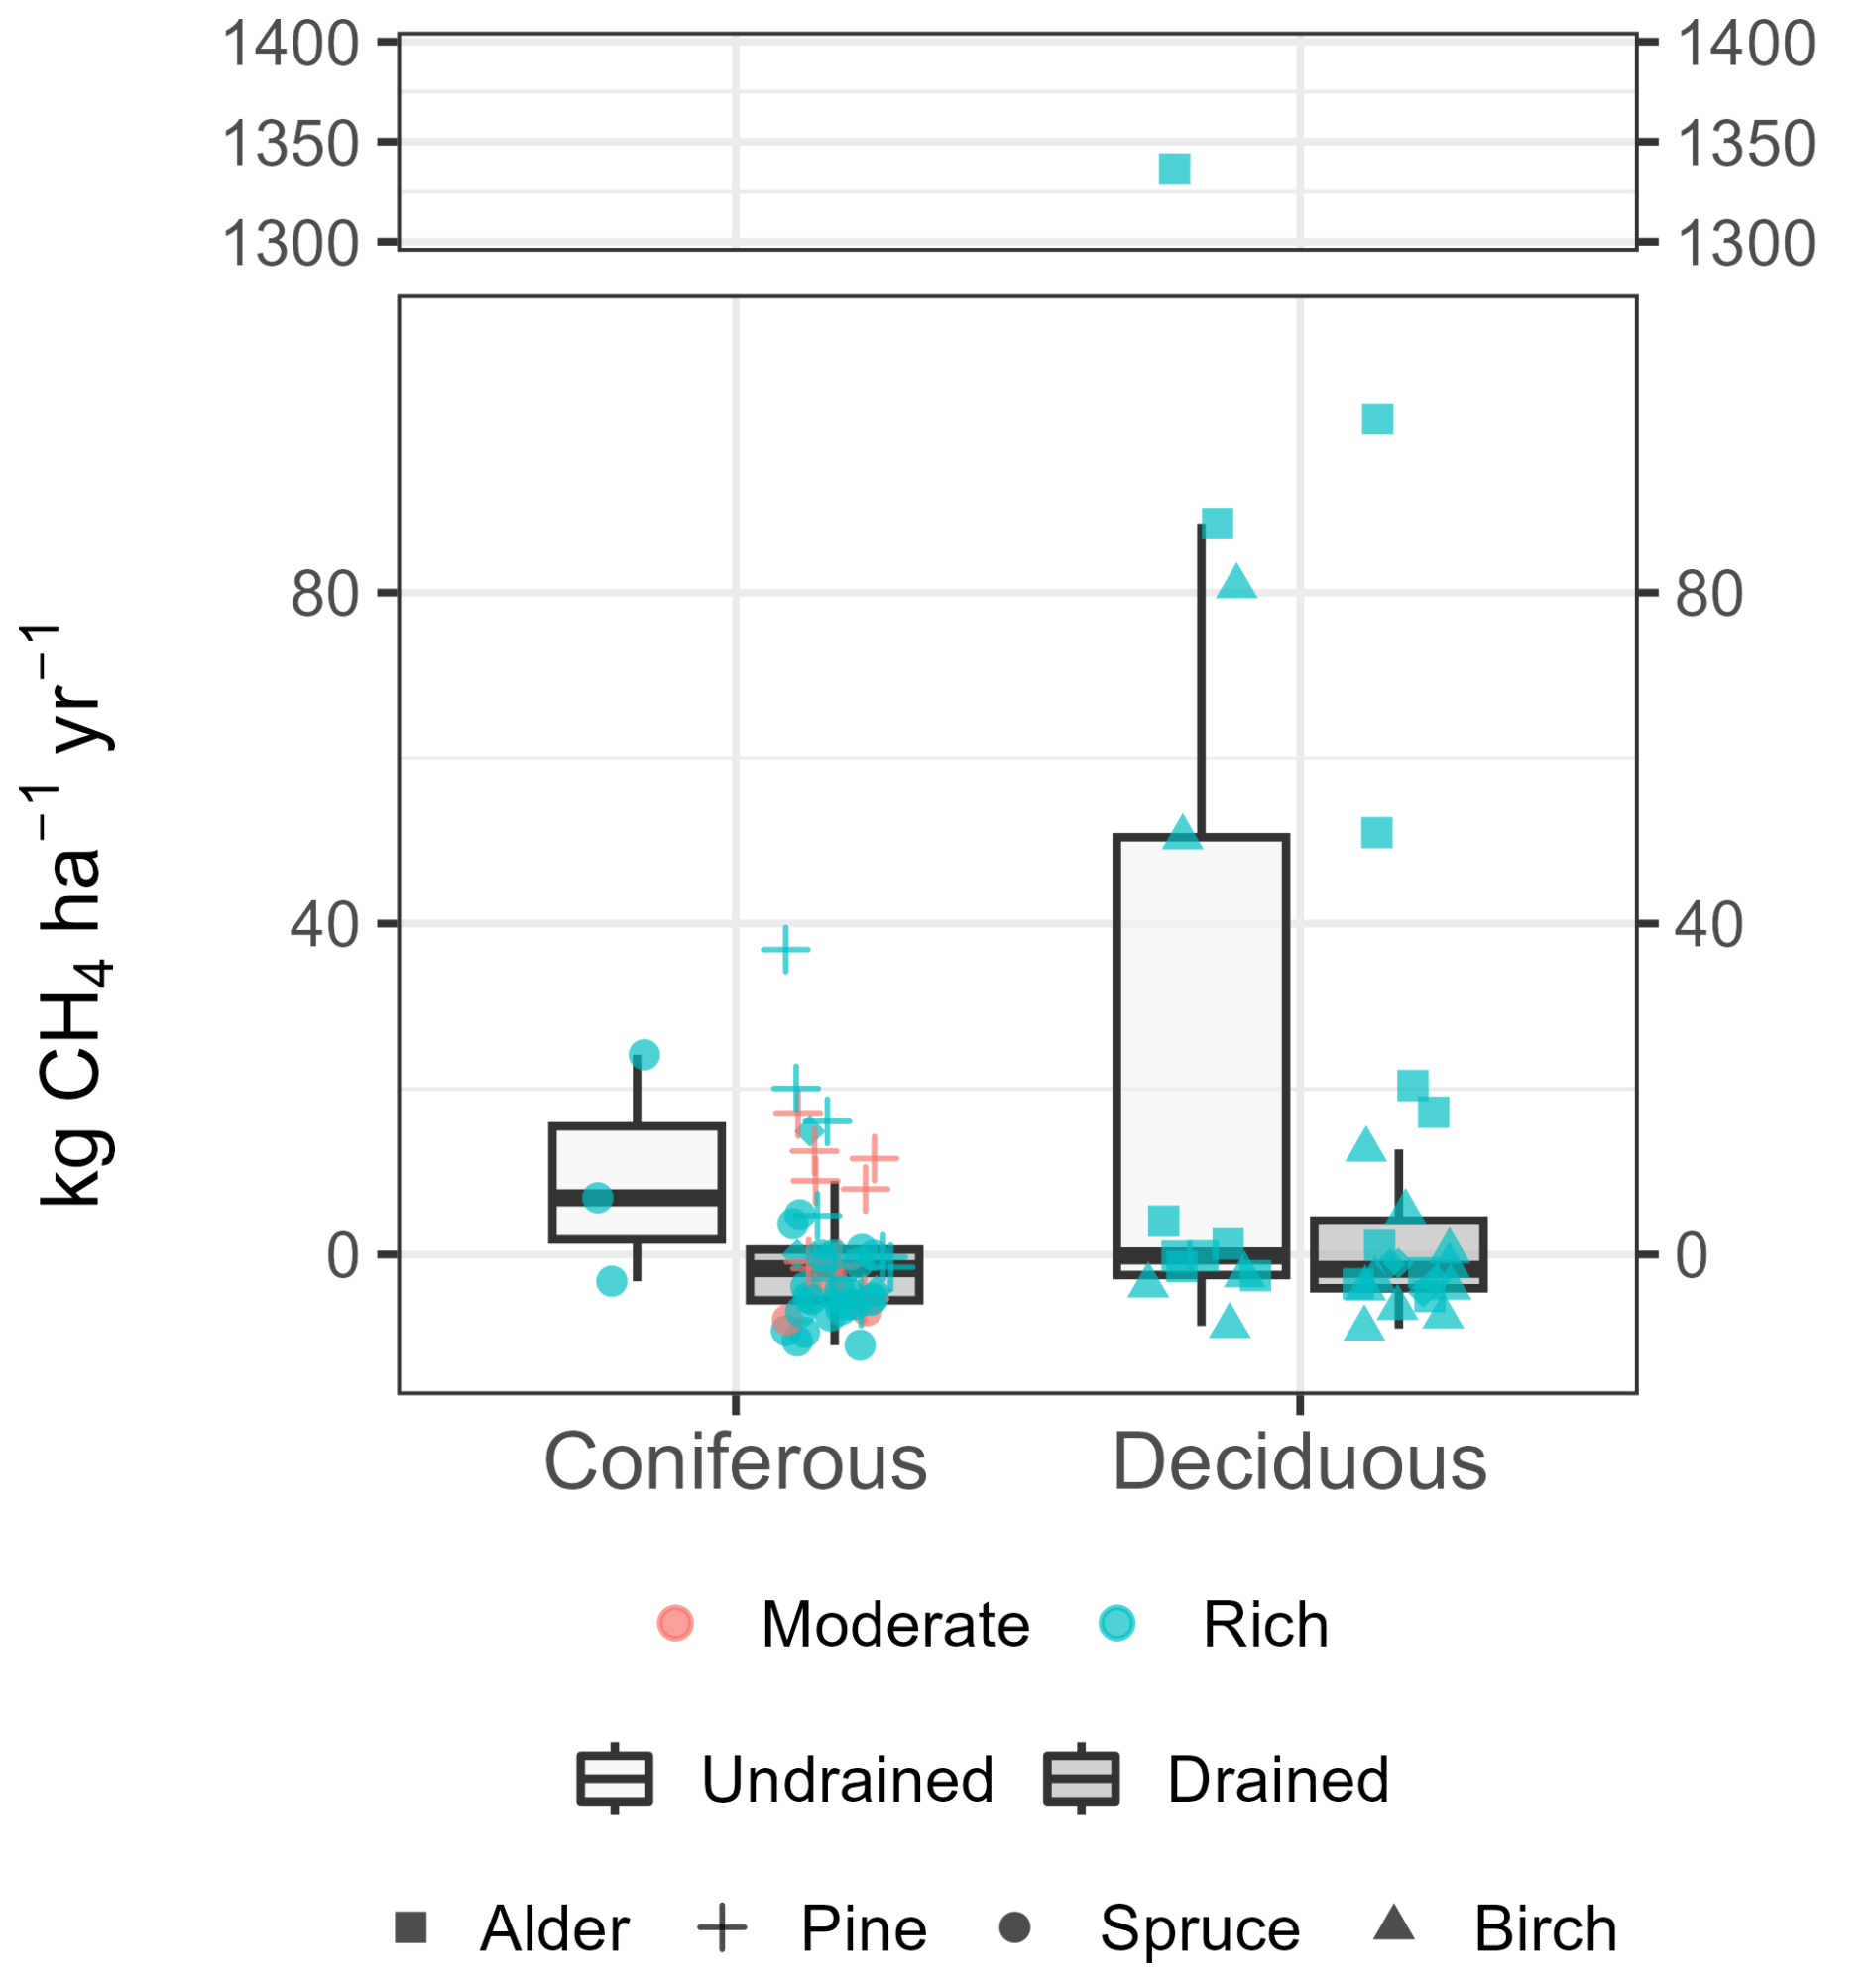
Figure A3Variation in soil CH4 fluxes by drainage status, tree species type and nutrient status. The bottom and top edges of the box represent the 25th and 75th percentiles, summarising the interquartile range (IQR). The whiskers extend to the smallest and largest values within 1.5 × IQR from the 25th and 75th percentiles, respectively. A solid horizontal line in the box indicates the mean and median values.
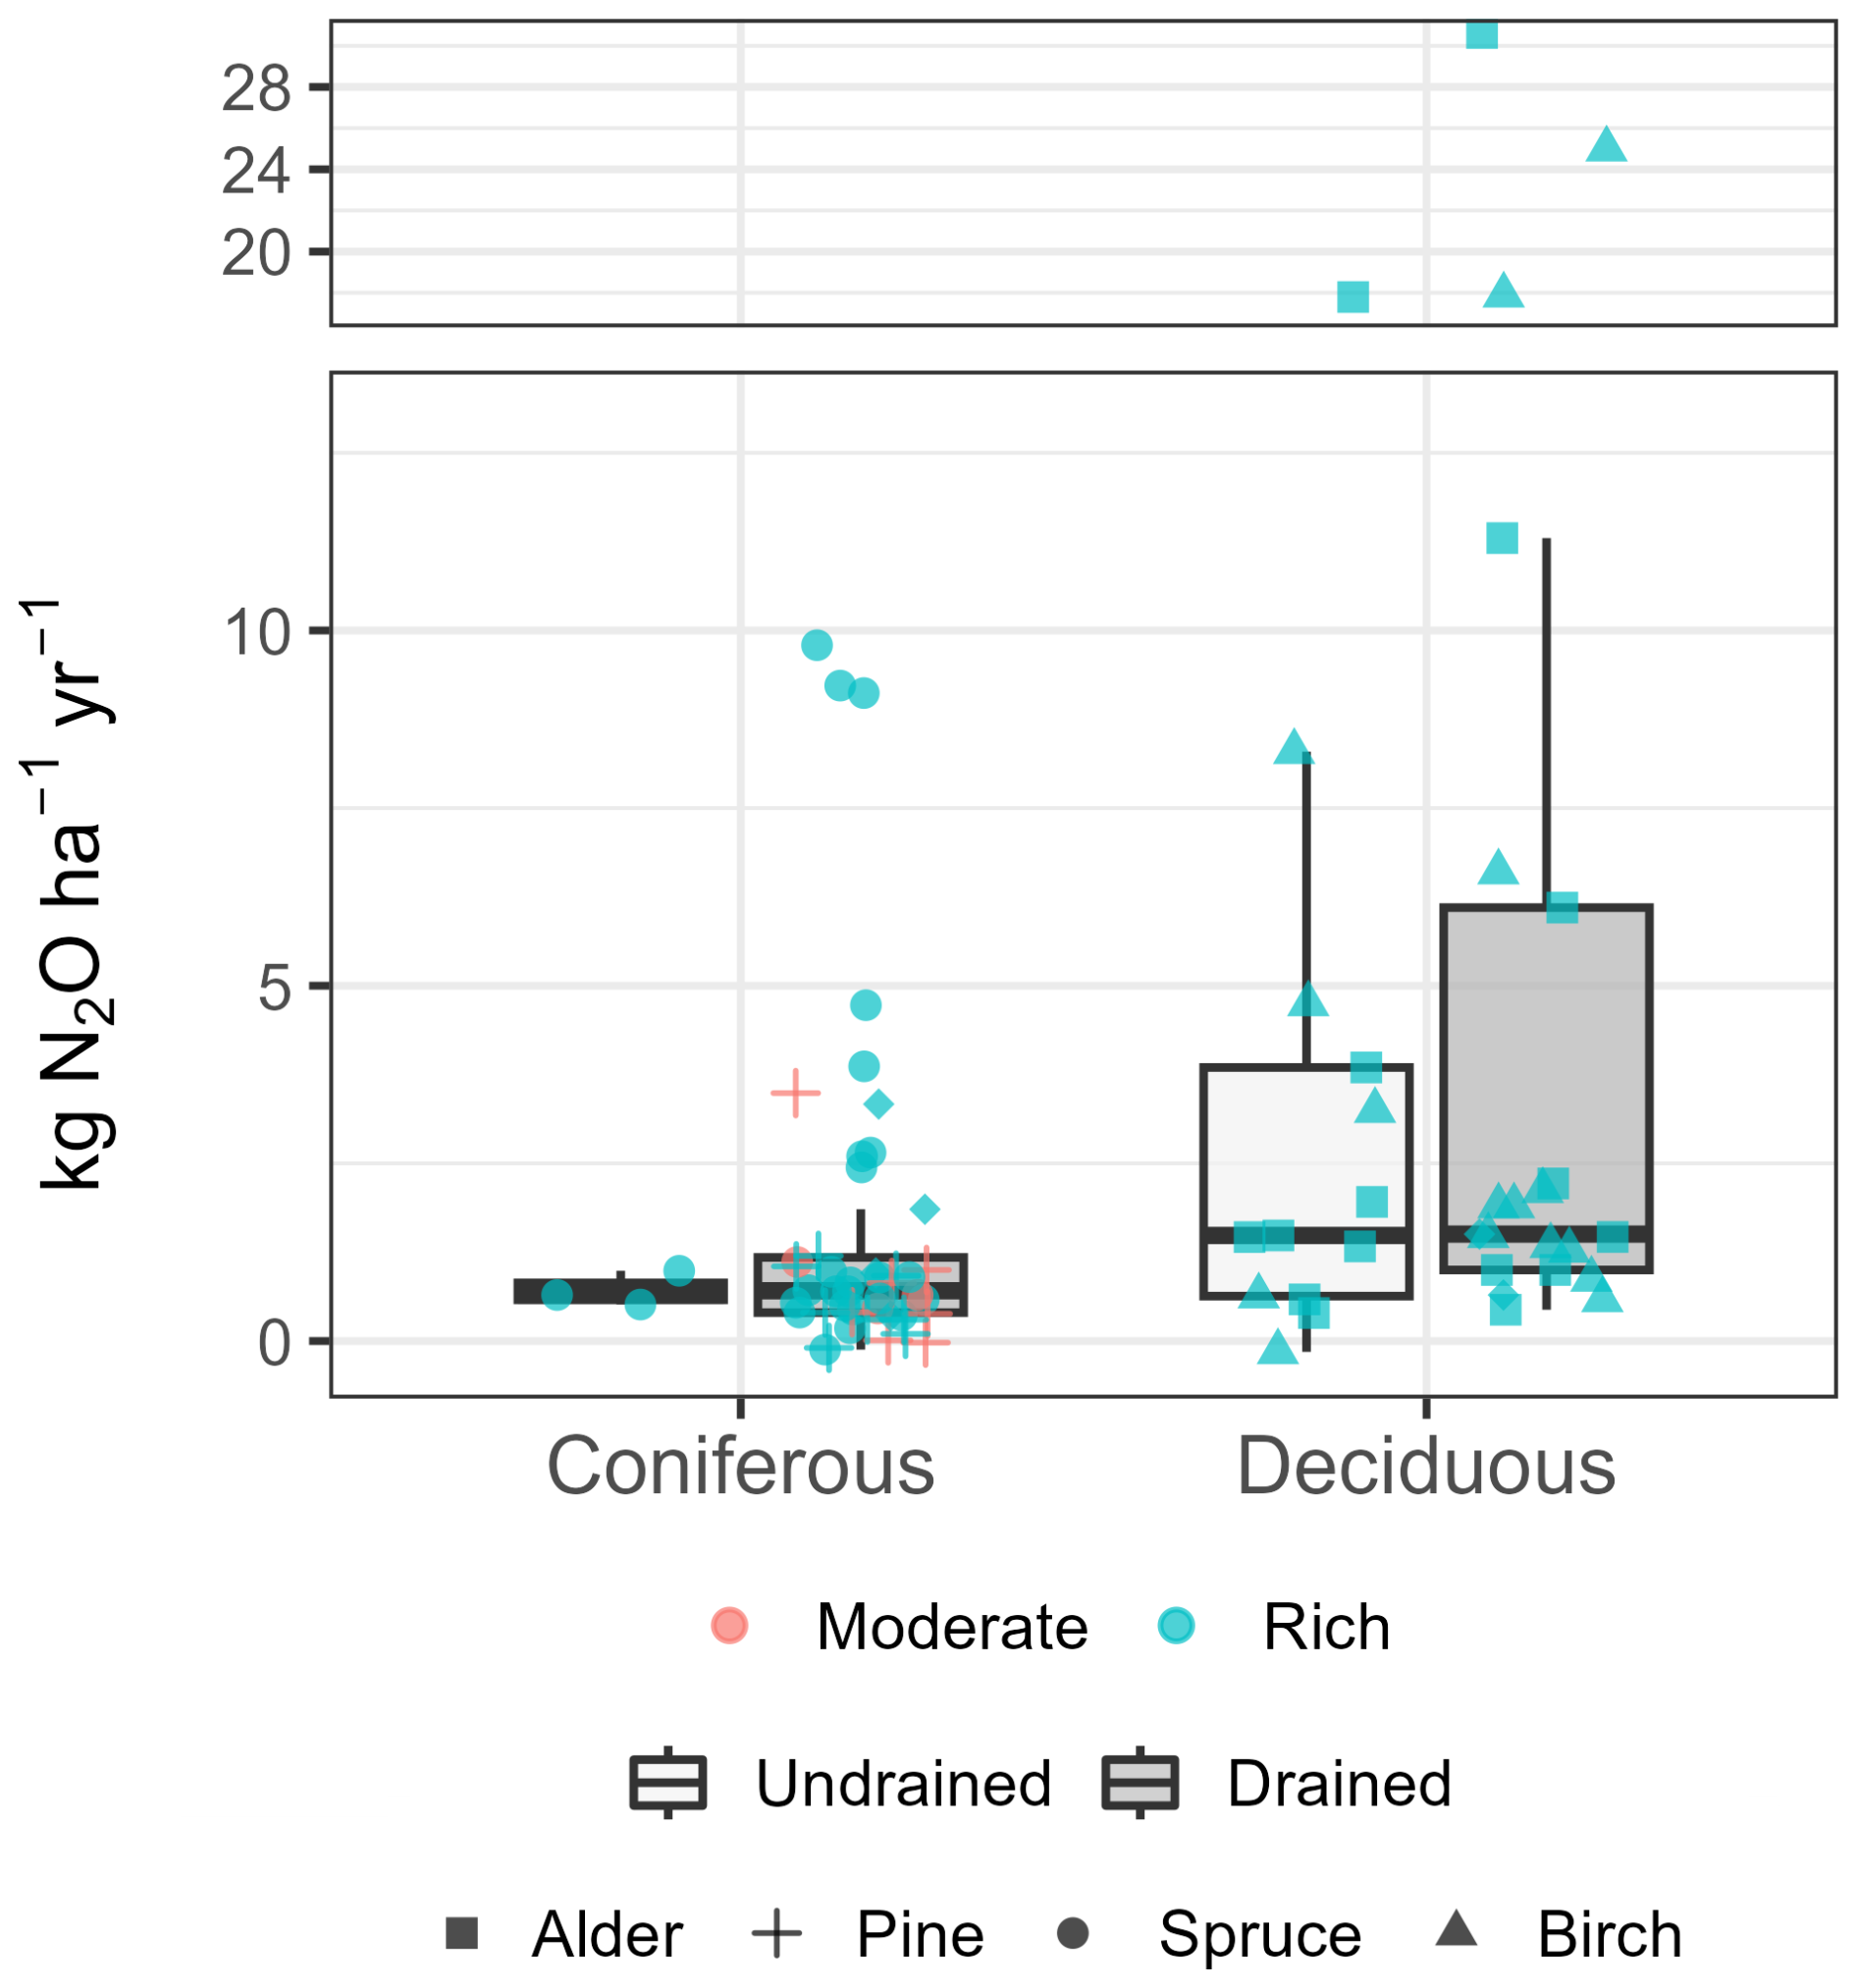
Figure A4Variation in soil N2O fluxes by drainage status, tree species type, and nutrient status. The bottom and top edges of the box represent the 25th and 75th percentiles, summarising the interquartile range (IQR). The whiskers extend to the smallest and largest values within 1.5 × IQR from the 25th and 75th percentiles, respectively. A solid horizontal line in the box indicates the mean and median values.
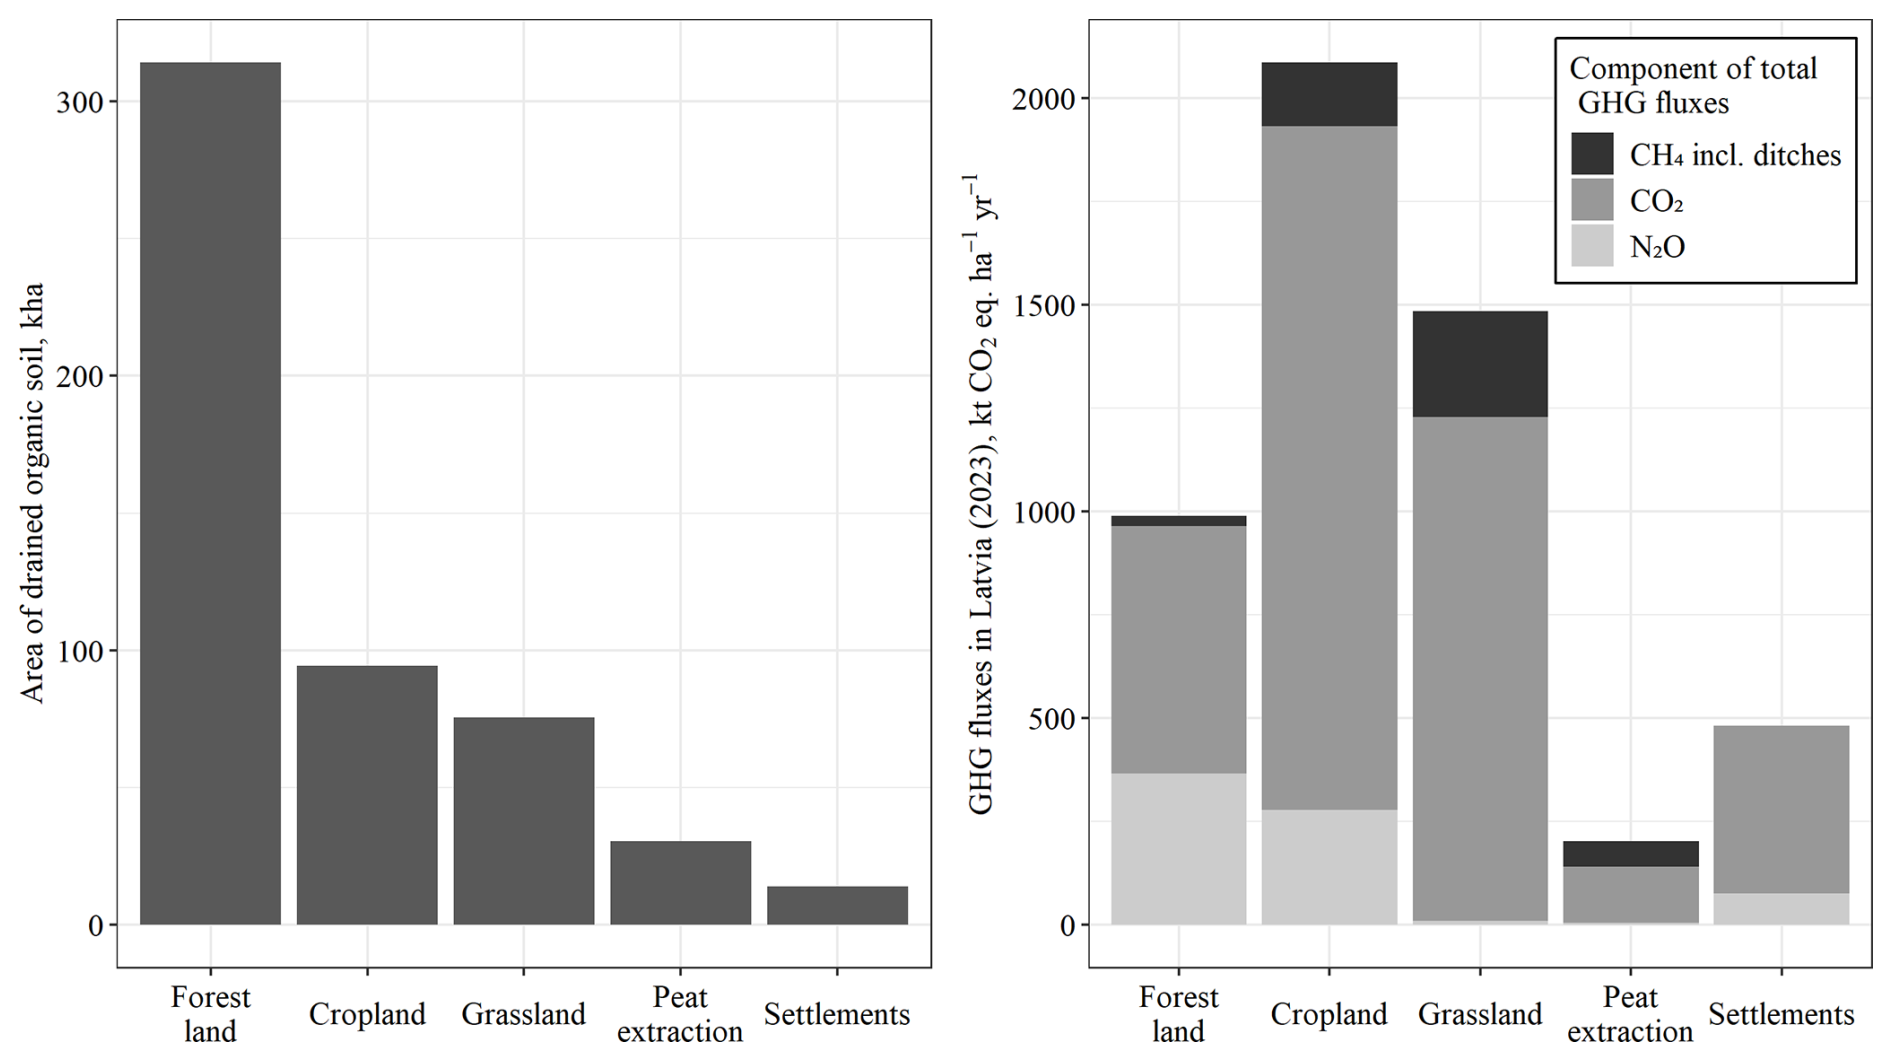
Figure A5Area of drained organic soils (left panel) and reported on-site GHG emissions (right panel) from drained organic soils across different land use categories (Latvia's National Inventory Document, 2025).
Table B1Summary statistics of CO2 emissions(t CO2-C ha−1 yr−1) stratified by soil nutrient status and dominant tree species. SE – standard error, CI – 95 % confidence interval, Var – variance, IQR – interquartile range.
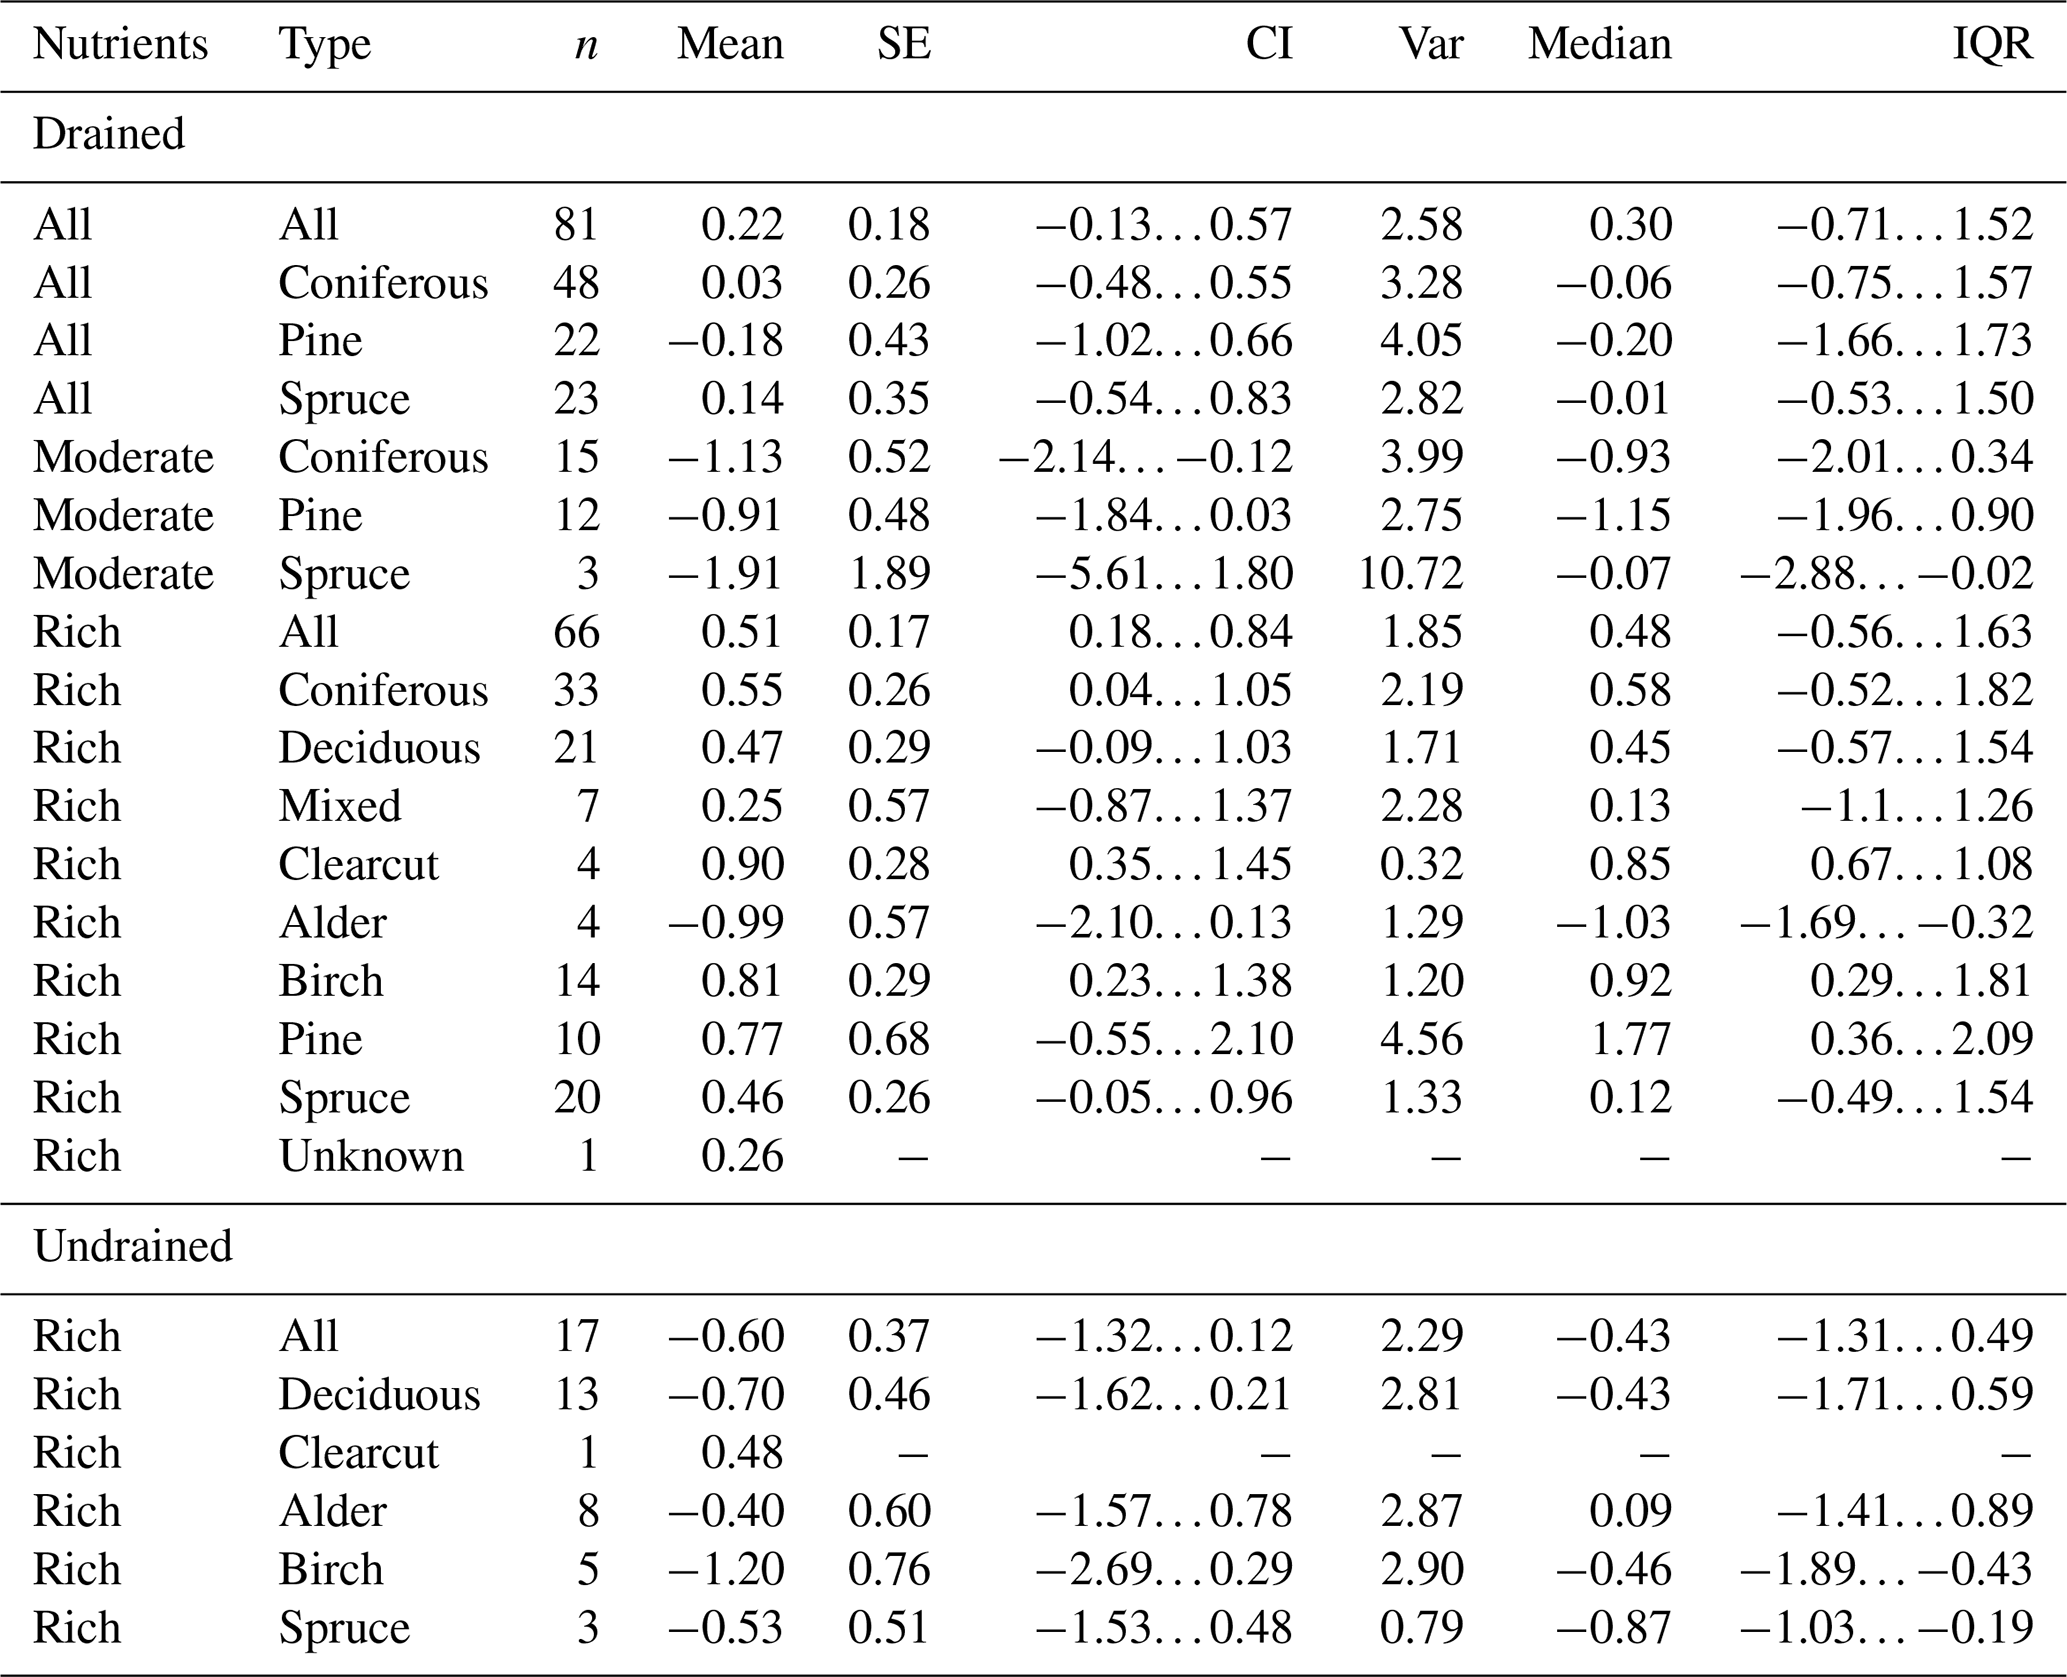
Table B2Summary statistics of CH4 emissions (kg CH4 ha−1 yr−1) stratified by soil nutrient status and dominant tree species. SE – standard error, CI – 95 % confidence interval, Var – variance, IQR – interquartile range.
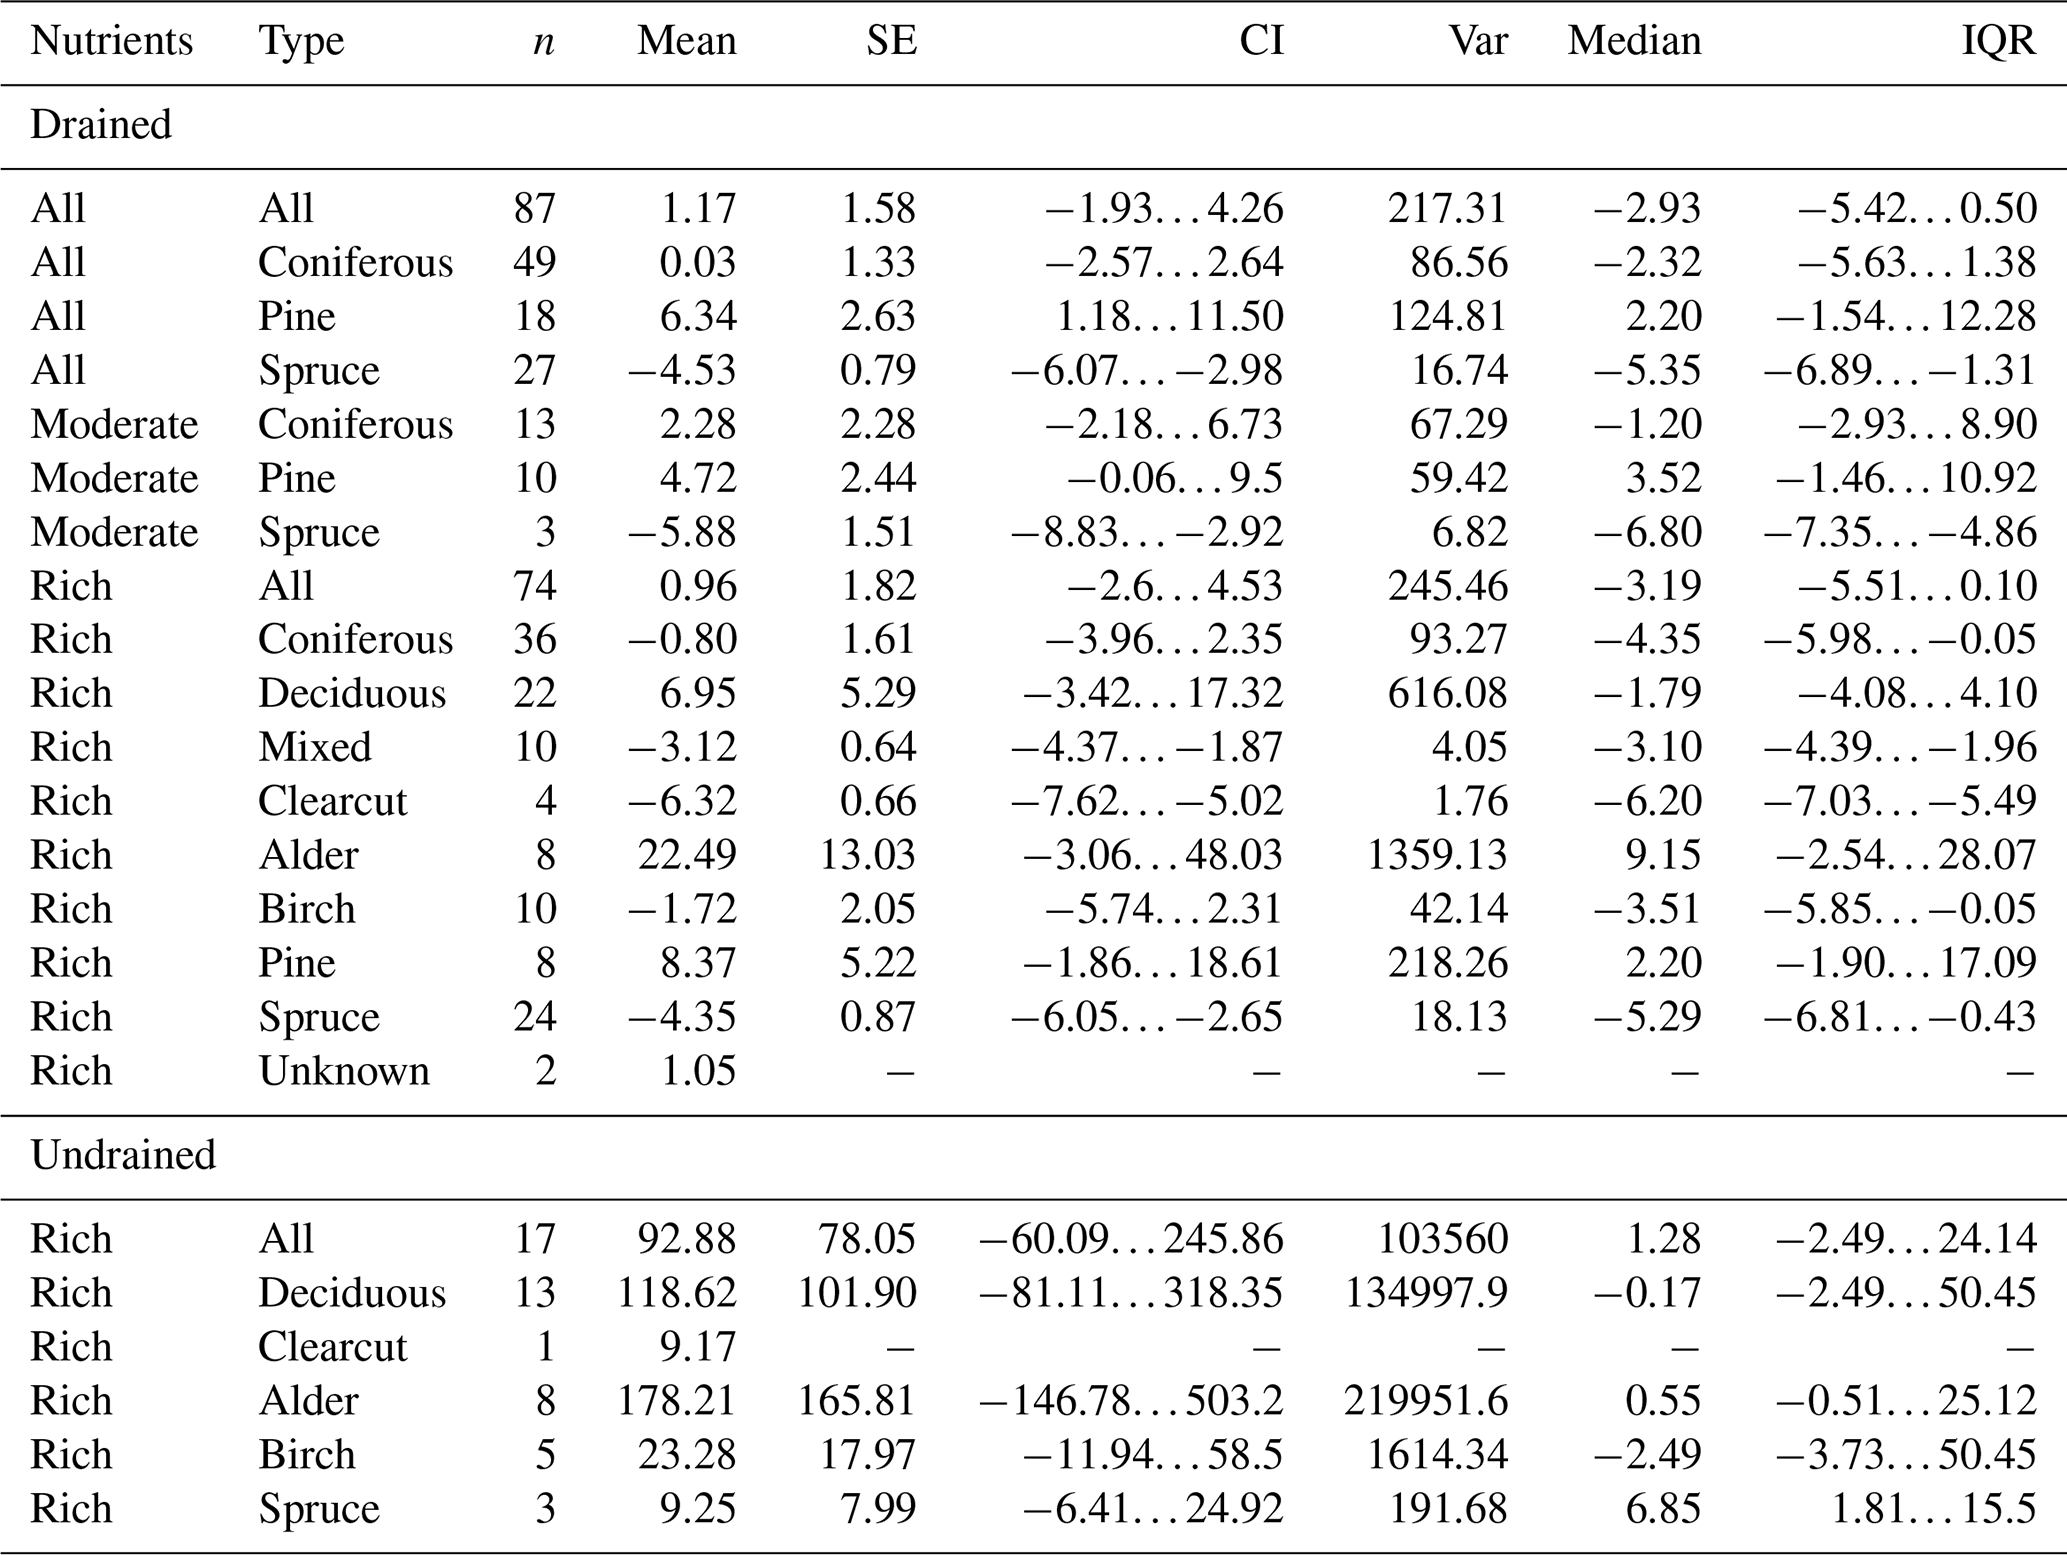
Table B3Summary statistics of N2O emissions (kg N2O ha−1 yr−1) stratified by soil nutrient status and dominant tree species. SE – standard error, CI – 95 % confidence interval, Var – variance, IQR – interquartile range.
The dataset compiled and analysed in the study is available at https://doi.org/10.5281/zenodo.18223234 (Butlers, 2026).
Conceptualisation, funding acquisition, and project administration were performed by AL and IL. MKS provided unpublished data. Data curation, formal analysis, and preparation of the original draft were carried out by AB. All co-authors reviewed and edited the manuscript.
The contact author has declared that none of the authors has any competing interests.
Publisher's note: Copernicus Publications remains neutral with regard to jurisdictional claims made in the text, published maps, institutional affiliations, or any other geographical representation in this paper. The authors bear the ultimate responsibility for providing appropriate place names. Views expressed in the text are those of the authors and do not necessarily reflect the views of the publisher.
The article was prepared within the scope of the project (26-00-S0INZ03-000021) Socio-economic assessment of activities implemented to achieve climate change mitigation targets in Latvia's land use, land-use change, and forestry (LULUCF) sector for reducing greenhouse gas (GHG) emissions and promoting carbon dioxide (CO2) sequestration in forest management.
The study was supported by the project PeatTransform “Research and Innovation Based Solutions to Support the Peat Sector's Transition to a Climate Neutral Economy, Promoting the Sustainable Use of Latvia's Natural Resources” implemented under the European Union Cohesion Policy Programme for 2021–2027, Specific Objective 6.1.1 “Mitigation of the economic, social and environmental impacts of the transition to climate neutrality in the most affected regions”, Measure 6.1.1.2 “Research development for the sustainable use of natural resources related to environmental and climate goals” with co-funding from the European Union and the State Budget of Latvia (6.1.1.2/1/25/A/001).
This paper was edited by Frank Hagedorn and reviewed by two anonymous referees.
Ahti, T., Hämet-Ahti, L., and Jalas, J.: Vegetation zones and their sections in northwestern Europe, Ann. Bot. Fenn., 5, 169–211, 1968.
Alm, J., Wall, A., Myllykangas, J. P., Ojanen, P., Heikkinen, J., Henttonen, H. M., Laiho, R., Minkkinen, K., Tuomainen, T., and Mikola, J.: A new method for estimating carbon dioxide emissions from drained peatland forest soils for the greenhouse gas inventory of Finland, Biogeosciences, 20, 3827–3855, https://doi.org/10.5194/bg-20-3827-2023, 2023.
Bai, Y., Zhou, Y., Chen, X., An, Z., Zhang, X., Du, J., and Chang, S. X.: Tree species composition alters the decomposition of mixed litter and the associated microbial community composition and function in subtropical plantations in China, For. Ecol. Manage., 529, 120743, https://doi.org/10.1016/j.foreco.2022.120743, 2023.
Beck, H. E., McVicar, T. R., Vergopolan, N., Berg, A., Lutsko, N. J., Dufour, A., Zeng, Z., Jiang, X., van Dijk, A. I. J. M., and Miralles, D. G.: High-resolution (1 km) Köppen-Geiger maps for 1901–2099 based on constrained CMIP6 projections, Sci. Data, 10, 1–16, https://doi.org/10.1038/s41597-023-02549-6, 2023.
Bušs, K.: Forest Ecology and Typology, Zinātne, Rīga, Latvija, 64 pp., https://dom.lndb.lv/data/obj/419599.html (last access: 12 January 2026), 1981.
Butlers, A.: Appendix: Forest organic soil carbon balance and GHG emissions in Köppen–Geiger Dfb climate zone, Zenodo [data set], https://doi.org/10.5281/zenodo.18223234, 2026.
Butlers, A., Lazdiņš, A., Kalēja, S., and Bārdule, A.: Carbon Budget of Undrained and Drained Nutrient-Rich Organic Forest Soil, Forests, 13, https://doi.org/10.3390/f13111790, 2022.
Butlers, A., Lazdiņš, A., Kalēja, S., Purviņa, D., Spalva, G., Saule, G., and Bārdule, A.: CH4 and N2O Emissions of Undrained and Drained Nutrient-Rich Organic Forest Soil, Forests, 14, https://doi.org/10.3390/f14071390, 2023.
Butlers, A., Laiho, R., Lazdiņš, A., Schindler, T., Soosaar, K., Jauhiainen, J., Bārdule, A., Kamil-Sardar, M., Līcīte, I., Samariks, V., Haberl, A., Vahter, H., Čiuldienė, D., Anttila, J., and Armolaitis, K.: Organic soils can be CO2 sinks in both drained and undrained hemiboreal peatland forests, Biogeosciences, 22, 4627–4647, https://doi.org/10.5194/bg-22-4627-2025, 2025.
Doukalianou, F., Spyroglou, G., Orfanoudakis, M., Radoglou, K., Stefanou, S., Kitikidou, K., Milios, E., and Lagomarsino, A.: Effects of Forest Thinning on Soil Litter Input Nutrients in Relation to Soil CO2, CH4, and N2O Fluxes in Greece, Atmosphere (Basel), 13, https://doi.org/10.3390/atmos13030376, 2022.
Eggleston, H. S., Buendia, L., Miwa, K., Ngara, T., and Tanabe, K.: 2006 IPCC Guidelines for National Greenhouse Gas Inventories, Prepared by the National Greenhouse Gas Inventories Programme, Japan, 1–59 pp., ISBN 4-88788-032-4, 2006.
Elberling, B. B., Kovács, G. M., Hansen, H. F. E., Fensholt, R., Ambus, P., Tong, X., Gominski, D., Mueller, C. W., Poultney, D. M. N., and Oehmcke, S.: High nitrous oxide emissions from temporary flooded depressions within croplands, Commun. Earth Environ., 4, 463, https://doi.org/10.1038/s43247-023-01095-8, 2023.
Lake, R., Hlavacek, J., Fernandez, R., Qoul, C., Mandl, N., and Rigler, E.: Annual European Union greenhouse gas inventory 1990–2023 and inventory document 2025, European Environment Agency, EEA/PUBL/2025/024, 522 pp., 2025.
Hagen-Thorn, A., Callesen, I., Armolaitis, K., and Nihlgård, B.: The impact of six European tree species on the chemistry of mineral topsoil in forest plantations on former agricultural land, For. Ecol. Manage., 195, 373–384, https://doi.org/10.1016/j.foreco.2004.02.036, 2004.
Hatano, R.: Impact of land use change on greenhouse gases emissions in peatland: a review, Int. Agrophys., 33, 167–173, https://doi.org/10.31545/intagr/109238, 2019.
He, H. and Roulet, N. T.: Improved estimates of carbon dioxide emissions from drained peatlands support a reduction in emission factor, Commun. Earth Environ., 4, https://doi.org/10.1038/s43247-023-01091-y, 2023.
Hiraishi, T., Krug, T., Tanabe, K., Srivastava, N., Fukuda, M., Troxler, T., and Jamsranjav, B.: 2013 Supplement to the 2006 IPCC Guidelines for National Greenhouse Gas Inventories, Switzerland, The Intergovernmental Panel on Climate Change (IPCC), ISBN 978-92-9169-139-5, 2014.
Huang, J., Mendoza, B., Daniel, J. S., Nielsen, C. J., Rotstayn, L., and Wild, O.: Anthropogenic and natural radiative forcing, Clim. Chang. 2013 Phys. Sci. Basis Work, Gr. I Contrib. Fifth Assess. Rep. Intergov. Panel Clim. Chang., 9781107057, 659–740, https://doi.org/10.1017/CBO9781107415324.018, 2013.
Ibrahim, A., Wayayok, A., Shafri, H. Z. M., and Toridi, N. M.: Remote Sensing Technologies for Unlocking New Groundwater Insights: A Comprehensive Review, J. Hydrol. X, 23, 100175, https://doi.org/10.1016/j.hydroa.2024.100175, 2024.
Jauhiainen, J., Heikkinen, J., Clarke, N., He, H., Dalsgaard, L., Minkkinen, K., Ojanen, P., Vesterdal, L., Alm, J., Butlers, A., Callesen, I., Jordan, S., Lohila, A., Mander, Ü., Óskarsson, H., Sigurdsson, B. D., Søgaard, G., Soosaar, K., Kasimir, Å., Bjarnadottir, B., Lazdins, A., and Laiho, R.: Reviews and syntheses: Greenhouse gas emissions from drained organic forest soils – synthesizing data for site-specific emission factors for boreal and cool temperate regions, Biogeosciences, 20, 4819–4839, https://doi.org/10.5194/bg-20-4819-2023, 2023.
Jovani, A. J., Reilly, P. O., Anshari, G., Yi, X., Neil, C., Christopher, C., Stephanie, D. E., Ye, J., Christopher, G., Evi, N. G., Jamaludin, J., Jaya, A., Page, S., Yosep, Y., Upton, C., Wilson, P., and Sjögersten, S.: CH4 and N2O emissions from smallholder agricultural systems on tropical peatlands in Southeast Asia, Glob. Change Biol., 4279–4297, https://doi.org/10.1111/gcb.16747, 2023.
Kamil-Sardar, M., Laiho, R., Jauhiainen, J., Butlers, A., Schindler, T., Vahter, H., Čiuldienė, D., Vigricas, E., Teemusk, A., Kull, A., Lazdiņš, A., Haberl, A., Bārdule, A., Līcīte, I., Samariks, V., Mander, Ü., Armolaitis, K., and Soosaar, K.: Impact of drainage on soil CH4 and N2O fluxes in nutrient-rich hemiboreal peatland forests of Europe, Plant Soil, 526, https://doi.org/10.1007/s11104-026-08920-x, 2026.
Korkiakoski, M., Ojanen, P., Tuovinen, J. P., Minkkinen, K., Nevalainen, O., Penttilä, T., Aurela, M., Laurila, T., and Lohila, A.: Partial cutting of a boreal nutrient-rich peatland forest causes radically less short-term on-site CO2 emissions than clear-cutting, Agric. For. Meteorol., 332, https://doi.org/10.1016/j.agrformet.2023.109361, 2023.
Latvia's National Inventory Document: Latvia's National Inventory Document under the UNFCCC and Paris Agreement, Greenhouse Gas Emissions in Latvia from 1990 to 2023, https://unfccc.int/ghg-inventories-annex-i-parties/2024 (last access: 4 September 2025), 2025.
Lorenz, M. and Thiele-Bruhn, S.: Tree species affect soil organic matter stocks and stoichiometry in interaction with soil microbiota, Geoderma, 353, 35–46, https://doi.org/10.1016/j.geoderma.2019.06.021, 2019.
Menichetti, L., Lehtonen, A., Lindroos, A. J., Merilä, P., Huuskonen, S., Ukonmaanaho, L., and Mäkipää, R.: Soil Carbon Dynamics During Stand Rotation in Boreal Forests, Eur. J. Soil Sci., 76, https://doi.org/10.1111/ejss.70154, 2025.
Muukkonen, P. and Mäkipää, R.: Empirical biomass models of understorey vegetation in boreal forests according to stand and site attributes, Boreal Environ. Res., 11, 355–369, 2006.
Nielsen, C. K., Elsgaard, L., Jørgensen, U., and Lærke, P. E.: Soil greenhouse gas emissions from drained and rewetted agricultural bare peat mesocosms are linked to geochemistry., Sci. Total Environ., 896, 165083, https://doi.org/10.1016/j.scitotenv.2023.165083, 2023.
R Core Team: R: A Language and Environment for Statistical Computing, R Foundation for Statistical Computing, https://www.r-project.org/ (last access: 12 January 2026), 2023.
Rautakoski, H., Korkiakoski, M., Mäkelä, J., Koskinen, M., Minkkinen, K., Aurela, M., Ojanen, P., and Lohila, A.: Exploring temporal and spatial variation of nitrous oxide flux using several years of peatland forest automatic chamber data, Biogeosciences, 21, 1867–1886, https://doi.org/10.5194/bg-21-1867-2024, 2024.
Ribeiro-Kumara, C., Köster, E., Aaltonen, H., and Köster, K.: How do forest fires affect soil greenhouse gas emissions in upland boreal forests? A review, Environ. Res., 184, https://doi.org/10.1016/j.envres.2020.109328, 2020.
Rubaiyat, A., Hossain, M. L., Kabir, M. H., Sarker, M. M. H., Salam, M. M. A., and Li, J.: Dynamics of greenhouse gas fluxes and soil physico-chemical properties in agricultural and forest soils, J. Water Clim. Chang., 14, 3791–3809, https://doi.org/10.2166/wcc.2023.338, 2023.
Šantrůčková, H., Cienciala, E., Kaňa, J., and Kopáček, J.: The chemical composition of forest soils and their degree of acidity in Central Europe, Sci. Total Environ., 687, 96–103, https://doi.org/10.1016/j.scitotenv.2019.06.078, 2019.
Säurich, A., Tiemeyer, B., Dettmann, U., and Don, A.: How do sand addition, soil moisture and nutrient status influence greenhouse gas fluxes from drained organic soils?, Soil Biol. Biochem., 135, 71–84, https://doi.org/10.1016/j.soilbio.2019.04.013, 2019.
Starr, M., Saarsalmi, A., Hokkanen, T., Merilä, P., and Helmisaari, H.-S.: Models of litterfall production for Scots pine (Pinus sylvestris L.) in Finland using stand, site and climate factors, For. Ecol. Manage., 205, 215–225, https://doi.org/10.1016/j.foreco.2004.10.047, 2005.
Tiemeyer, B., Freibauer, A., Borraz, E. A., Augustin, J., Bechtold, M., Beetz, S., Beyer, C., Ebli, M., Eickenscheidt, T., Fiedler, S., Förster, C., Gensior, A., Giebels, M., Glatzel, S., Heinichen, J., Hoffmann, M., Höper, H., Jurasinski, G., Laggner, A., Leiber-Sauheitl, K., Peichl-Brak, M., and Drösler, M.: A new methodology for organic soils in national greenhouse gas inventories: Data synthesis, derivation and application, Ecol. Indic., 109, 105838, https://doi.org/10.1016/j.ecolind.2019.105838, 2020.
Tikkasalo, O.-P., Peltola, O., Alekseychik, P., Heikkinen, J., Launiainen, S., Lehtonen, A., Li, Q., Martínez-García, E., Peltoniemi, M., Salovaara, P., Tuominen, V., and Mäkipää, R.: Eddy-covariance fluxes of CO2, CH4 and N2O in a drained peatland forest after clear-cutting, Biogeosciences, 22, 1277–1300, https://doi.org/10.5194/bg-22-1277-2025, 2025.
Vancampenhout, K., De Vos, B., Wouters, K., Swennen, R., Buurman, P., and Deckers, J.: Organic matter of subsoil horizons under broadleaved forest: Highly processed or labile and plant-derived?, Soil Biol. Biochem., 50, 40–46, https://doi.org/10.1016/j.soilbio.2012.03.005, 2012.
Vesterdal, L., Clarke, N., Sigurdsson, B. D., and Gundersen, P.: Do tree species influence soil carbon stocks in temperate and boreal forests?, For. Ecol. Manage., 309, 4–18, https://doi.org/10.1016/j.foreco.2013.01.017, 2013.
Wang, H., Liu, S. R., Wang, J. X., Shi, Z. M., Xu, J., Hong, P. Z., Ming, A. G., Yu, H. L., Chen, L., Lu, L. H., and Cai, D. X.: Differential effects of conifer and broadleaf litter inputs on soil organic carbon chemical composition through altered soil microbial community composition, Sci. Rep., 6, 1–9, https://doi.org/10.1038/srep27097, 2016.
Yang, L., Niu, S., Tian, D., Zhang, C., Liu, W., Yu, Z., Yan, T., Yang, W., Zhao, X., and Wang, J.: A global synthesis reveals increases in soil greenhouse gas emissions under forest thinning., Sci. Total Environ., 804, 150225, https://doi.org/10.1016/j.scitotenv.2021.150225, 2022.
Zhou, Y., Meng, D., Osborne, B., Fan, Y., and Zou, J.: The Impact of Modifications in Forest Litter Inputs on Soil N2O Fluxes: A Meta-Analysis, Atmosphere, 13, 1–10, https://doi.org/10.3390/atmos13050742, 2022.