
the Creative Commons Attribution 4.0 License.
the Creative Commons Attribution 4.0 License.
 | 30 Oct 2026
Nitrous oxide dynamics across nitrogen and pH gradients in headwater streams
Mette V. Carstensen

Annelies J. Veraart
Ida F. Peterse
Nicole Wrage-Mönnig
Joachim Audet
Headwater streams in agricultural landscapes can contribute substantially to nitrous oxide (N2O) emissions, yet the environmental controls on stream N2O dynamics remain poorly resolved, particularly in systems with low pH. We investigated 72 Danish headwater streams spanning broad gradients in pH (5.0–8.8), land use, and soil type to identify the main drivers of N2O variability. Nitrate (NO) was the strongest predictor of N2O saturation, and its positive association with N2O intensified under acidic conditions according to linear mixed models. In the same model, ammonium, dissolved organic carbon, and stream depth also showed significant but weaker positive relationships with N2O. Spatial differences among streams explained considerably more variation than seasonal or regional patterns, underscoring the dominance of local factors. Streams with pH < 6 consistently exhibited higher N2O saturation, and generalized additive modelling indicated a marked decline in N2O levels beginning near pH 6. Despite generally high N2O saturation, approximately 9 % of observations displayed undersaturation, which occurred mainly in streams with low NO concentrations and across all seasons. Our results indicate that acidic, weakly buffered catchments may enhance in-stream N2O accumulation even at moderate nitrogen levels. These findings highlight the need to consider pH-related controls when assessing N2O dynamics in freshwater networks and when designing mitigation strategies for agricultural landscapes.
- Article
(6836 KB) - Full-text XML
- BibTeX
- EndNote


Nitrous oxide (N2O) is a potent greenhouse gas and ozone-depleting substance with agriculture as its main anthropogenic source (Ravishankara et al., 2009; IPCC, 2019). While terrestrial emissions are well studied, emissions from aquatic systems, especially ditches, streams and rivers, remain less constrained (Maavara et al., 2019; Seitzinger and Kroeze, 1998; Silverthorn et al., 2025). Recent evidence suggests riverine networks may contribute significantly to global N2O budgets (Yao et al., 2020). In agricultural areas, a considerable share of applied nitrogen (N) fertilizers bypasses crop uptake and is transported into groundwater and surface waters, eventually reaching coastal waters. Along the hydrological continuum, dissolved N undergoes various biogeochemical transformations that can generate N2O, either in soils and groundwater before entering streams, or directly within the stream channels.
Nitrous oxide is produced through a variety of biotic and abiotic transformations of N compounds in soils, sediments, and waters (Quick et al., 2019). Nitrification, the microbial oxidation of ammonia (NH3) or ammonium (NH) to nitrate (NO), can release N2O as a by-product during its initial step (Butterbach-Bahl et al., 2013). In addition, nitrifier denitrification, a process carried out by ammonia-oxidizing bacteria under low-oxygen conditions, can also contribute to N2O emissions (Wrage et al., 2001). Heterotrophic denitrification is the sequential reduction of NO to gaseous dinitrogen (N2), with N2O formed as an intermediate step just before the final reduction to N2 (Knowles, 1982). Although nitrification and denitrification are typically regarded as the main pathways of N2O production, abiotic processes, as well as their interaction, may also contribute substantially (Zhu-Barker et al., 2015; Grabb et al., 2017).
Soil acidification can strongly influence denitrification, particularly the terminal step in which N2O is reduced to N2 (Šimek and Cooper, 2002; Firestone et al., 1980). This reduction is catalyzed by nitrous oxide reductase (nosZ), and under acidic conditions it is often impaired, resulting in elevated N2O (N2+ N2O) ratios (Firestone et al., 1980). Although this effect is well documented in soils, the influence of low pH on N2O levels in aquatic systems is less investigated (Audet et al., 2020) or limited to near-neutral pH (Clough et al., 2011; Baulch et al., 2012). To address this gap, we investigated the interplay between land use, hydromorphology, and stream water chemistry across a diverse set of Danish headwater streams. Denmark is particularly well suited for such an investigation because of its extensive acidic soils (podzols). Although these soils are generally less favorable for farming, they remain widely cultivated and heavily fertilized. This combination of naturally low pH and intensive agricultural practices creates conditions that are especially suitable for investigating the links between stream water acidity, nutrient inputs, and processes such as N2O production. We hypothesize that streams with low pH exhibit disproportionately large N2O saturation, particularly in agricultural catchments with large N inputs. In addition, we explore how different environmental factors beyond N and pH contribute to spatial and temporal variability in N2O saturation, and which sources of variance, such as seasonal and temporal, are most influential.
2.1 Site and catchment characteristics
Sampling was conducted in 72 distinct headwater streams located in Denmark, selected to obtain a wide range in pH, soil type, and land cover (Figs. 1 and 2). Many of these streams have been deepened and channelized, especially those located in agricultural landscapes. Due to regional geological variation, stream pH exhibits a pronounced east-west gradient (Thodsen et al., 2024). Eastern Denmark, including Zealand, Funen, and the easternmost part of Jutland, is underlain by calcareous glacial tills deposited during the Weichselian glaciation (Madsen, 1987). These sediments, originating from an ice advance from the Baltic Sea, are rich in chalk, which imparts a higher buffering capacity and contributes to elevated pH levels in surface waters (Fig. 1). In contrast, western Jylland is dominated by older, more leached glacial and meltwater deposits with lower carbonate content, resulting in reduced buffering capacity and generally lower stream pH. The catchments associated with each sampling location were delineated using a national digital elevation model (DEM) with a 10 m spatial resolution, obtained from the Danish Agency for Data Supply and Infrastructure. Delineation was carried out in ArcGIS Pro (version 3.5; ESRI Inc., Redlands, CA, USA) using the Fill, Flow Direction, and Watershed tools. Stream slope was quantified as the change in water-surface elevation over a 100 m reach, measured with a Leica GPS at the sampling site and a point 100 m upstream; where canopy impaired satellite reception, slope was derived from the DEM. Soil pH and soil type (JB number) for each catchment were extracted for five depths (0–15, 15–30, 30–60, 60–100, and 100–200 cm depth) from Adhikari (2013). Land use within each catchment was quantified by calculating the percentage cover of major land-use categories using the polygon-based national land-use map (scale 1:25 000) from the Danish Area Information System (Nielsen et al., 2000). Daily precipitation data were obtained from the national 10 km grid, whereas air pressure data were from the corresponding 20 km grid covering the sampling sites, both provided by the Danish Meteorological Institute.
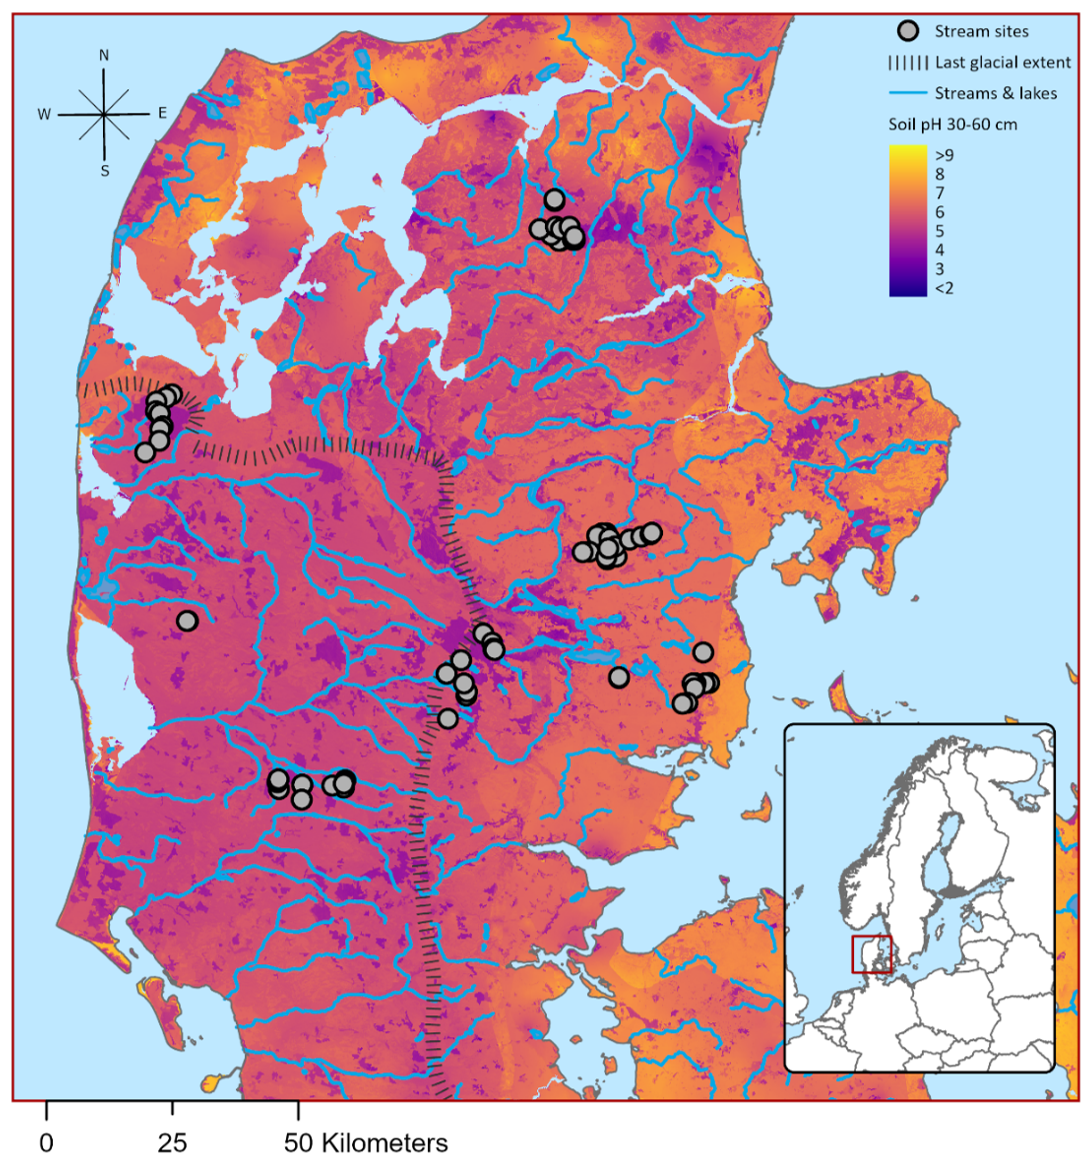
Figure 1Map of the 72 stream study sites, the pH of soil in a depth of 30–60 cm below surface, and the extent of the ice advance during the Weichselian glaciation (land area south-west of this line was ice-free).
2.2 Sampling
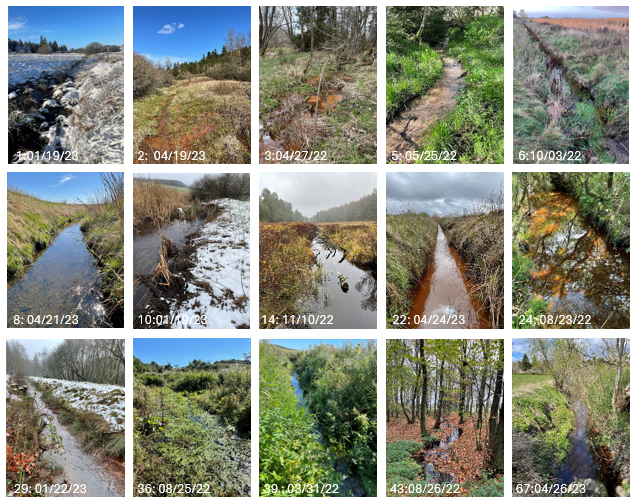
Water samples were taken from all streams seasonally during summer (19–26 August 2022), autumn (3–14 November 2022), winter (17–30 January 2023), and spring (19 April–4 May 2023) (Fig. 2). Of these, ten streams (Stream 1–10) were sampled monthly from April 2022 to April 2023. During the summer sampling campaign, 12 of the 72 streams were dry, with three remaining dry until the winter sampling period. Water samples were collected 20–30 cm from the stream bank using a 250 mL polypropylene bottle and stored in a transportable cooler. At each site, stream water velocity, width, and depth were measured. Stream water velocity and depth were measured across the stream with three points (right, middle and left). Stream velocity was measured using a vane wheel anemometer, positioned 0.4× depth from the streambed (Höntzsch GmbH & Co. KG, Germany). The discharge was calculated from average stream dimensions and average velocity. In-stream vegetation cover was visually estimated and recorded as a percentage, while the presence of iron ochre deposits in the stream was assessed on a scale from 0 to 3 (low to high abundance). To maintain consistency, the same observer conducted all assessments along a 2 m stream reach at each sampling location. Stream water temperature, dissolved oxygen, electrical conductivity, and pH were measured in situ using a multi-parameter probe (YSI Professional Plus, Xylem Analytics, USA). Samples for dissolved N2O and carbon dioxide (CO2) analysis were collected by drawing 50 mL of stream water into a syringe, followed by the addition of 10 mL of ambient air. The syringe was sealed using a stopcock and shaken vigorously for 1 min by holding the piston, while keeping the syringe in the shade to minimize changes in temperature. The 10 mL headspace gas was then transferred into a 5.9 mL pre-evacuated glass vial. Samples were stored in the dark until analysis. At each sampling location 10 mL ambient air collected above the water surface was injected into a 5.9 mL vial. Data on precipitation and atmospheric pressure were obtained from the Danish meteorological institute.
2.3 Water chemistry
The samples for analysis of dissolved organic carbon (DOC), NO, NH, and soluble reactive phosphorus (SRP) were filtered within 24 h in the laboratory using Whatman GF/C filters (pore size 0.45 µm), which were rinsed with 300 mL demineralized water before use. Both filtered and unfiltered samples were stored cold (3–5 °C) and dark until analysis. The samples for NO and sulphate (SO) determination were analysed according to Danish standard DS/EN ISO 10304 (2009) by ion chromatography (Dionex ICS-1500 IC-system) with an anion Micro Membrane Suppressor (AMMS III 4 mm) as basic eluent. The system was equipped with a guard column (IonPac AG22) and a separator column (IonPac AS22). The eluent was a mixture of 4.5 mM Na2CO3 and 1.4 mM NaHCO3. All samples for ion chromatography were filtered through a double-layered 0.22 µm glass fibre filter (SNY2225, Frisenette ApS, Knebel, Denmark). Ammonium (NH), total P (TP) and SRP were measured colorimetrically on a spectrophotometer (Shimadzu 1700, Shimadzu Corp., Kyoto, Japan) according to the Danish/European standard methods DS/EN ISO 11732 (2005) for NH and DS/EN ISO 6878 (2004) for TP and SRP. Total organic carbon, DOC and TN were both measured on a TOC-L analyser equipped with a TNM-L module (Shimadzu, Kyoto, Japan) at a temperature of 720 °C following DS/EN ISO 1484 (1997) and DS/EN 12260 (2003), respectively.
2.4 Dissolved gas analysis
The concentrations of N2O and CO2 in headspace samples and ambient air samples were determined using a dual-inlet Agilent 7890 GC system interfaced with a CTC CombiPal autosampler (Agilent, Denmark) configured and calibrated with standard gases according to Petersen et al. (2012), with detection limits of 0.15 ppm for N2O. The gas chromatograph was equipped with an electron capture detector (ECD) for N2O analysis and a thermal conductivity detector (TCD) for CO2 measurements. The headspace concentration of N2O and CO2 (ppm) were converted to moles using the ideal gas law, accounting for the headspace volume, laboratory temperature, and site-specific atmospheric pressure. The concentrations of N2O and CO2 remaining in the water phase were calculated from the headspace gas concentrations according to Henry's law and using Henry's constant corrected for water temperature and atmospheric pressure at the sampling time (Weiss and Price, 1980). The total dissolved concentration originally present in the stream water was obtained as the sum of the gas transferred to the headspace and the remaining gas dissolved in the water. The expected headspace contribution from air was based on the ambient air sample, which was subtracted from the measured headspace values to correct for the ambient air introduced during the equilibration step. Stream water was considered undersaturated with respect to N2O when dissolved concentrations were lower than the measured air concentration. The saturation levels were classified as undersaturated (<95 %), ∼ atmospheric equilibrium (95 %–105 %), and oversaturated (>105 %) following Aho et al. (2023). These threshold intervals were applied to explicitly incorporate the measurement uncertainty associated with the gas concentration determinations and the subsequent saturation calculations. Analytical precision of the GC measurements was quantified to be 2.6 % CV (SD = 0.0075 µg N L−1, n=7, range = 0.3–2.0 µg N L−1).
2.5 Data analysis and statistical analysis
All statistical analyses were performed using R version 4.4.3 (R Core Team, 2025). The N2O saturation was log transformed to ensure normality. Linear mixed-effects models (LMM) were used to identify environmental drivers of N2O saturation using the lmer() function from the lme4 R package (Bates et al., 2015). To account for the hierarchical data structure and repeated measurements within the same stream, we included a random intercept for stream number. Prior to model development, correlations between predictor variables were checked, to ensure that parameters with a correlation coefficient above 0.5 were not included (Fig. A1). In addition, we calculated the variance inflation factor (VIF) to further evaluate potential collinearity among predictors (Table A1). All continuous predictor variables were standardized (z-transformed: centered and scaled to unit variance) to ensure comparability of effect estimates and facilitate interpretation of interaction terms. Model selection followed a backward elimination procedure, where non-significant predictors were sequentially removed. Model assumptions were evaluated through residual diagnostics, including visual inspection of Q−Q plots and residual vs. fitted plots (Zuur et al., 2009). Linear mixed-effects models were also applied to assess temporal and spatial differences in N2O saturation, while accounting for repeated measures within streams. Pairwise comparisons between regions and seasons were conducted using estimated marginal means via the emmeans R package (Lenth, 2025). P-values were adjusted for multiple testing using the Bonferroni method to control the family-wise error rate (Haynes, 2013). The relationship between log-transformed N2O saturation and stream pH was modeled using a generalized additive model (GAM) with a smooth pH term fitted by Restricted Maximum Likelihood (REML). Derivatives of the smooth term were used to identify pH ranges where N2O changed significantly with pH. The first pH at which the derivative became significantly negative was defined as the onset of decline, and the pH with the most negative derivative as the point of steepest decline. Robustness of the onset threshold was evaluated using bootstrap resampling (n=500).
3.1 Spatiotemporal variation
During the study period (April 2022 to March 2023) the mean (±SD) annual precipitation was 741±102 mm and mean air temperature was 8.9±0.4 °C (Table 1). Mean stream water N2O concentration between all sampling sites was 2.4±2.8 µg N L−1 ranging from 0.1 to 22.2 µg N L−1. In the ten streams monitored monthly, N2O saturation showed substantial variability both temporally and between streams. The stream with the lowest water pH (Stream 6, mean pH ) generally exhibited higher N2O saturation (Figs. 3, A2). For most streams N2O saturation peaked during late winter and early spring coinciding with elevated NO concentrations (Figs. 3, A3). In contrast, NH levels remained low and relatively stable throughout the study period (Fig. A4). Consistent with patterns observed for streams with monthly monitoring, mean N2O saturation measurements across all distinct stream systems were significantly higher during winter, compared to summer (Tables A2 and A3). Summer N2O saturation was also significantly lower compared to spring and autumn (Table A3). Stream-level differences explained the largest share of variance, with an intra-class correlation coefficient (ICC) of 0.67 according to our LMM (between-stream variance =0.119; residual =0.059). The remaining 33 % of the variance was attributable to within-stream variability. Regional variation accounted for a smaller proportion (ICC = 0.15; variance = 0.030; residual = 0.173), while seasonal differences were negligible (ICC = 0.016; variance = 0.0032; residual = 0.195).
Table 1Mean, standard deviation (SD), min and max of key parameters for Danish headwater streams (sample size = 378), where N2O = nitrous oxide, CO2 = carbon dioxide, TN = total nitrogen, NO = nitrate, NH = ammonium, TOC = total organic carbon, DOC = dissolved organic carbon, TP = total phosphorus, SRP = soluble reactive phosphorus, SO = sulphate, and O2 = dissolved oxygen.
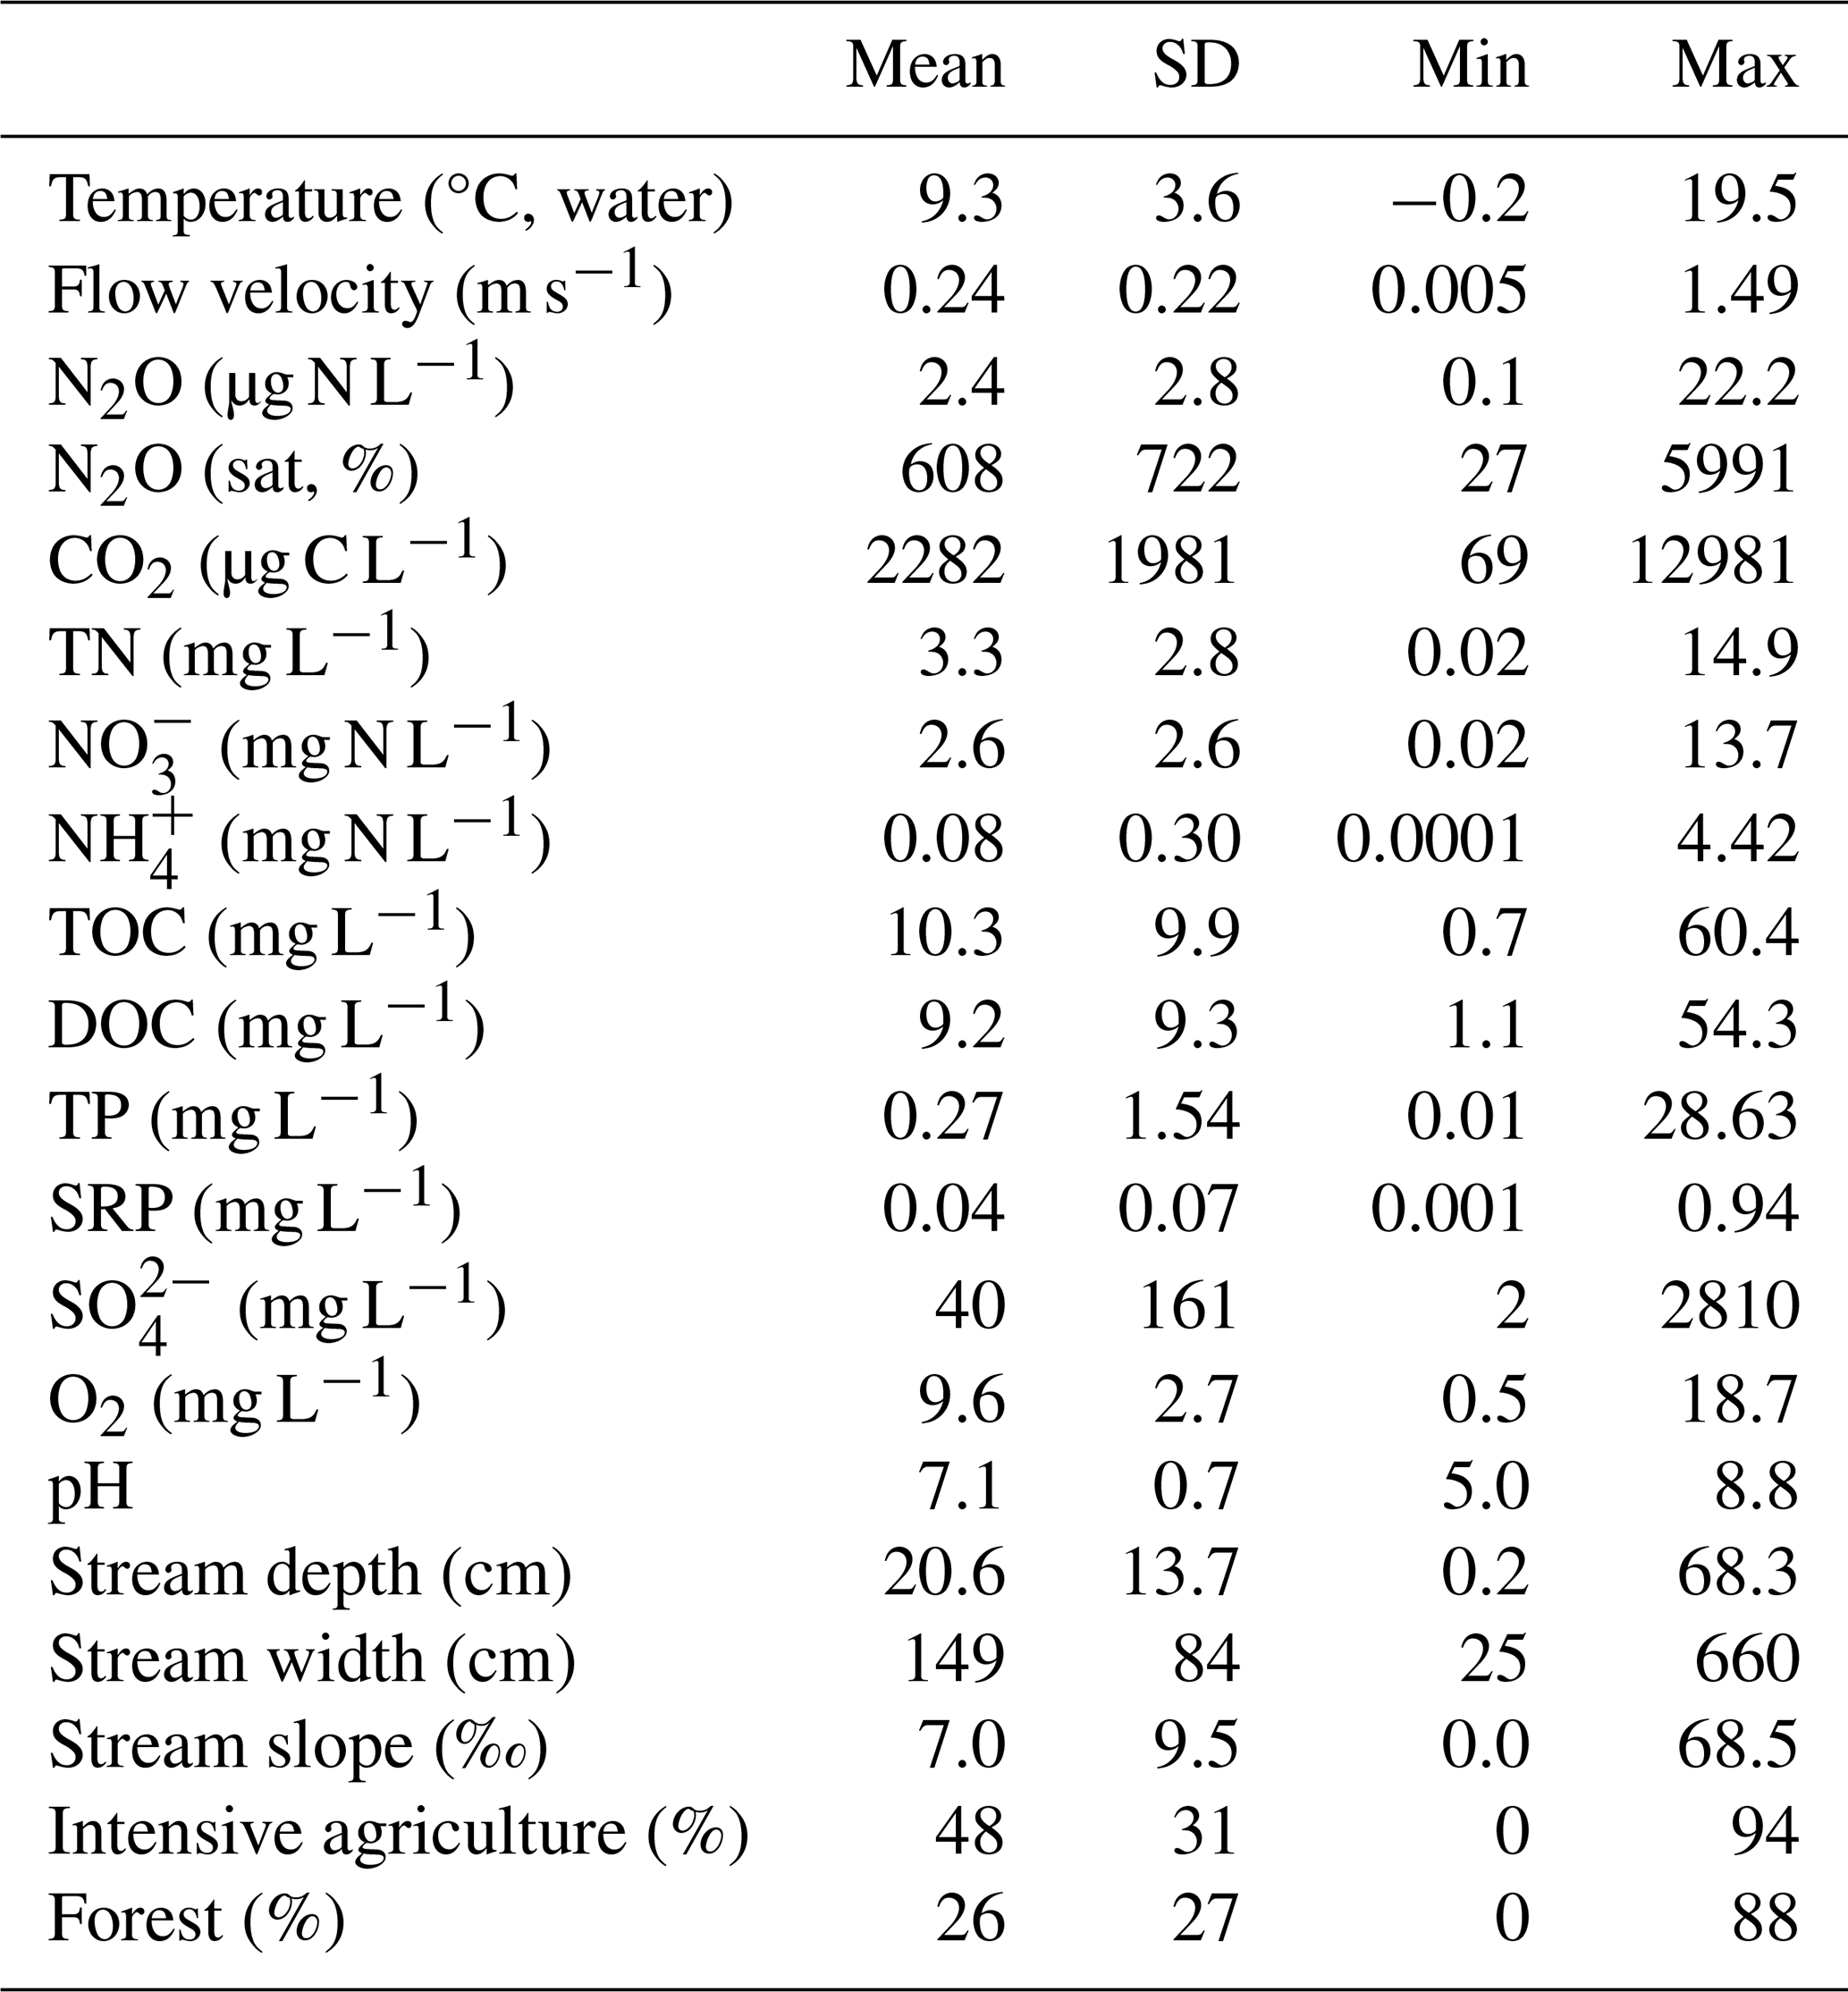
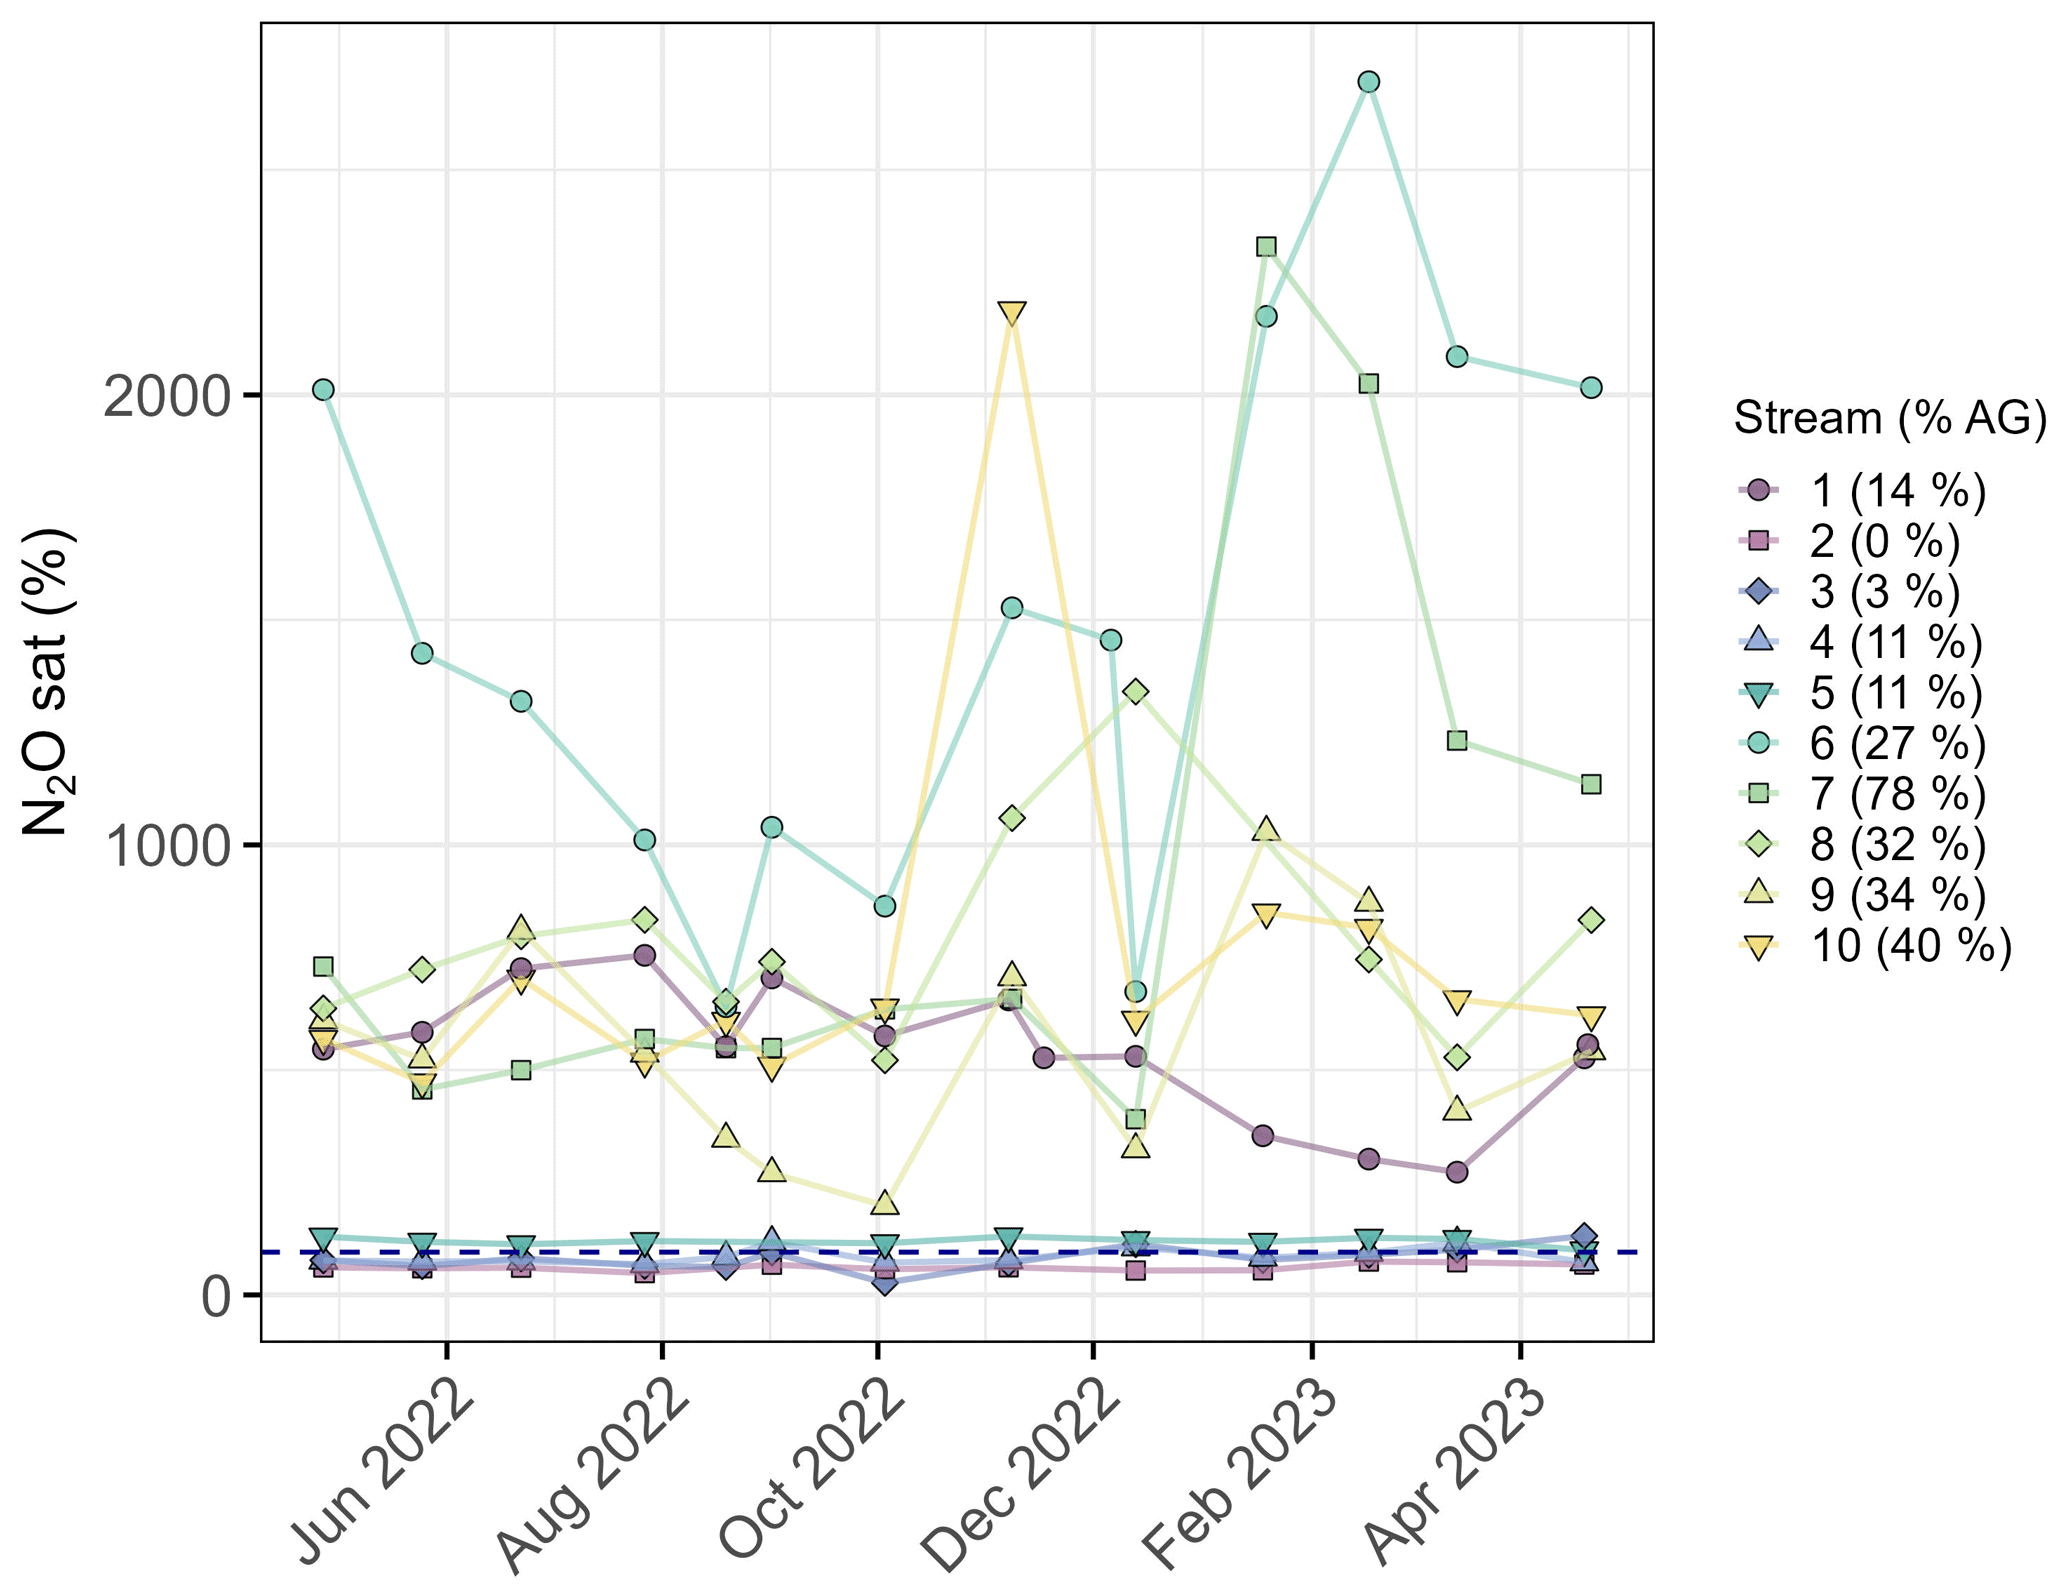
Figure 3Nitrous oxide (N2O) saturation (%) in stream water from ten streams (ID 1–10) monitored monthly. Stream-specific percentages of intensive agriculture within the catchment are given in the legend. The dark blue dashed line indicates the threshold below which N2O saturation are considered undersaturated relative to atmospheric equilibrium.
3.2 Drivers of nitrous oxide dynamics
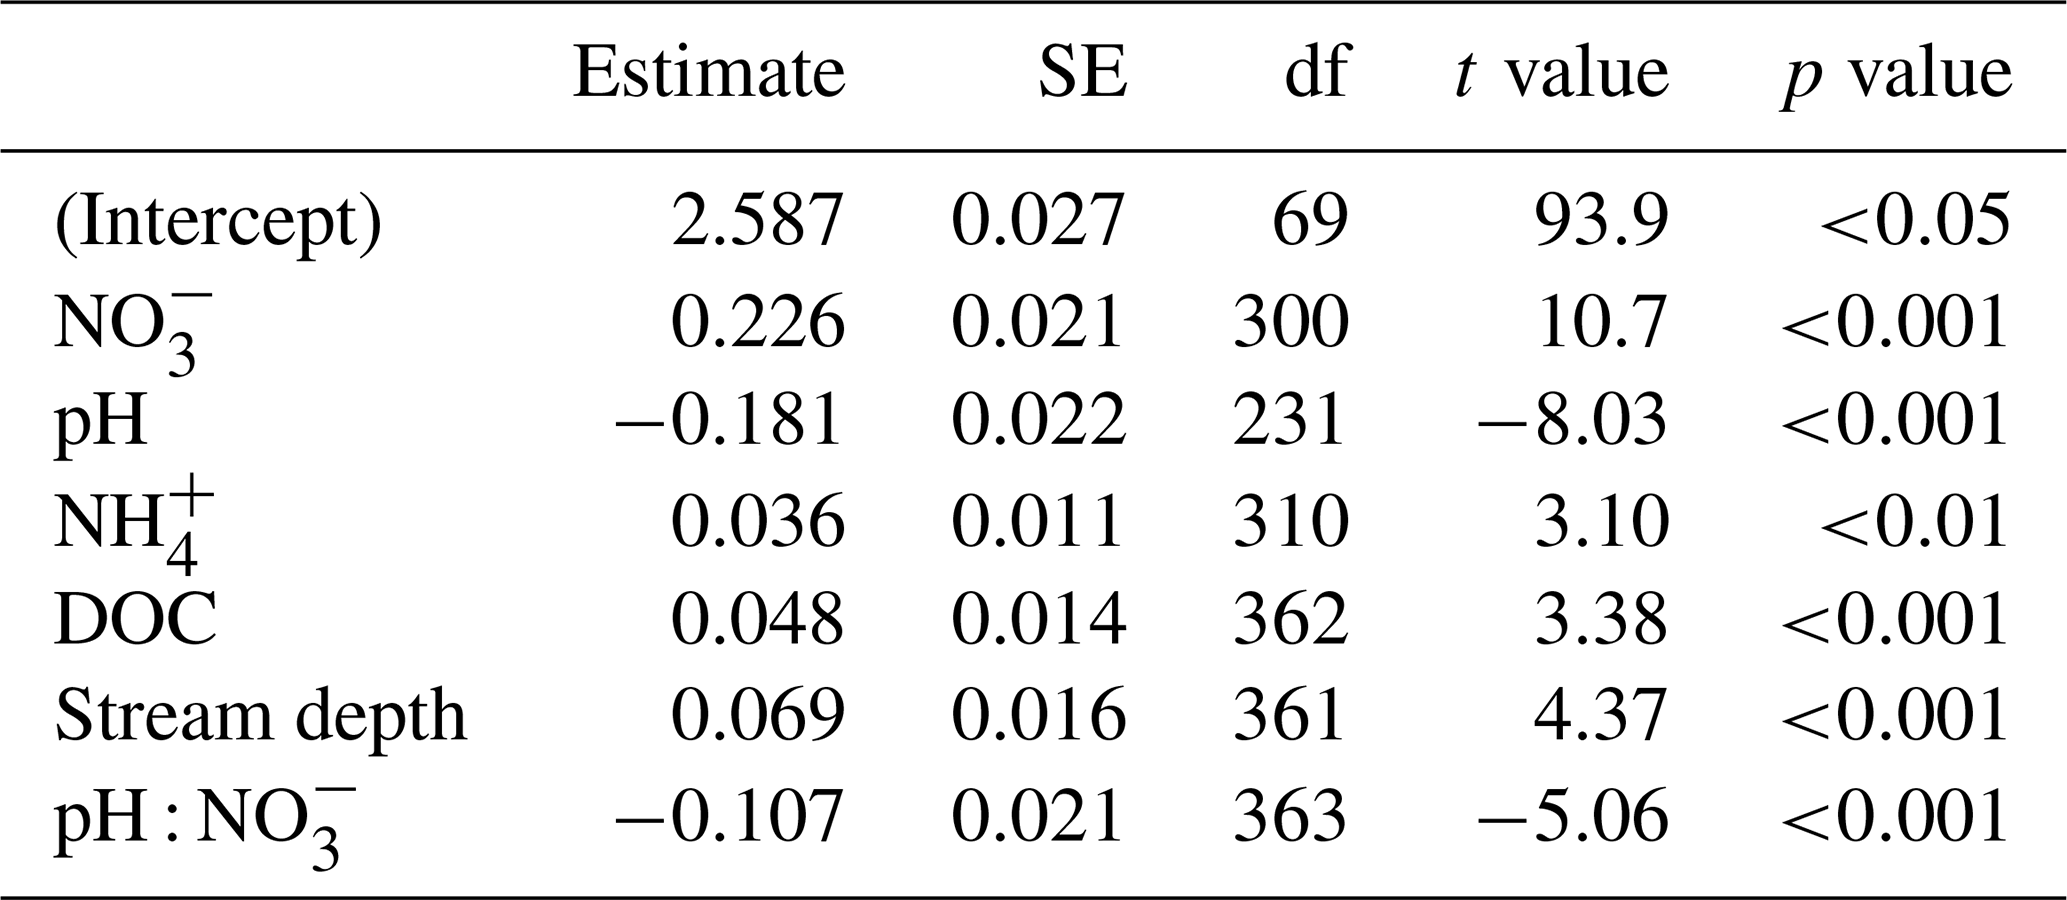
The final model retained NO, pH, NH, DOC, land use, and stream depth as significant fixed effects (Table 2, Fig. A5). All retained predictors were positively correlated with N2O concentrations, except pH. A significant negative interaction with pH (Estimate , p<0.001) was included, indicating that N2O increased with NO and the effect of NO was amplified under acidic conditions (Table 2). The model captured notable variation between stream locations (random intercept variance ), although a considerable amount of unexplained variation remained (residual variance ) (Fig. A6). Fixed effects alone explained approximately 47 % of the variation in N2O (marginal R2), while the full model (including stream-level random effects) accounted for about 73 % (conditional R2) (Table A4). Initially SRP appeared as a significant predictor of N2O saturation, but this relationship was driven by a single high observation and became non-significant upon its exclusion. Variables such as water temperature, oxygen in stream water, precipitation, sulphate and flow velocity were excluded from the final model due to a lack of statistical significance. To avoid the risk of introducing multicollinearity, CO2 was excluded due to a strong correlation with pH (Fig. A1). Nevertheless, the effect of the interaction between pH and CO2 on N2O saturation was investigated separately to shed more light on the nature of this relationship (Fig. A5). A LMM analysis revealed a significant interaction between pH and CO2 in relation to N2O saturation (CO2× pH: Estimate , p<0.001). While N2O saturation decreased with increasing pH overall, the positive relationship between CO2 and N2O became stronger at higher pH values. This was further investigated by another LMM showing that CO2 was not significantly related to N2O saturation at pH <6 (, p=0.29), whereas at pH >6 N2O saturation increased strongly with CO2 (, p<0.001).
Table 2Results from linear mixed-effects model analysis with individual streams as random effects with pH, nitrate (NO), dissolved organic carbon (DOC), ammonium (NH), stream depth and interaction between pH and NO. SE = standard error and df = degrees of freedom. All continuous predictor variables were standardized (z-transformed: centered and scaled to unit variance).
3.3 The effect of pH
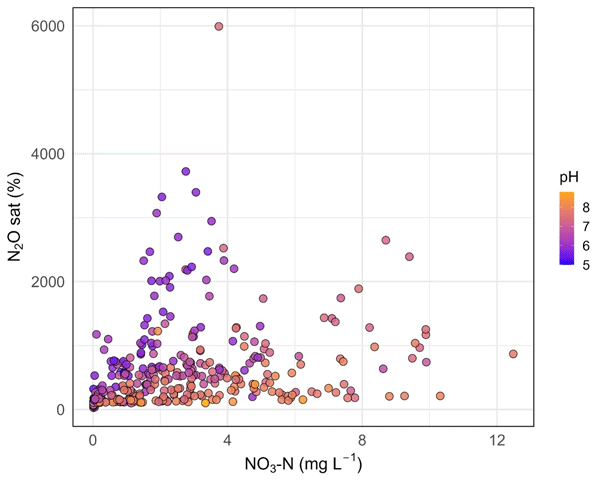
The N2O saturation increased with NO concentrations, but the magnitude of this response varied markedly with pH (Fig. 4). The highest N2O saturations were observed at low pH, particularly below pH 6, where several observations exceeded 2000 % saturation even at moderate NO levels. Derivative analysis of the GAM indicated that N2O saturation began to decline at pH ≈ 5.95, with the steepest decrease occurring at pH ≈ 6.37, defining a transition zone over which N2O saturation dropped most sharply (Fig. A7). Bootstrap resampling confirmed the robustness of the start-of-decline estimate, with a median of 5.96 and a 95 % confidence interval of 5.83–6.19. The N2O saturation was significantly higher for streams with pH < 6 (mean: 1275±927 %) compared to streams with pH > 6 (mean: 485±576 %) according to LMM analysis taking stream number into account (, p<0.001).
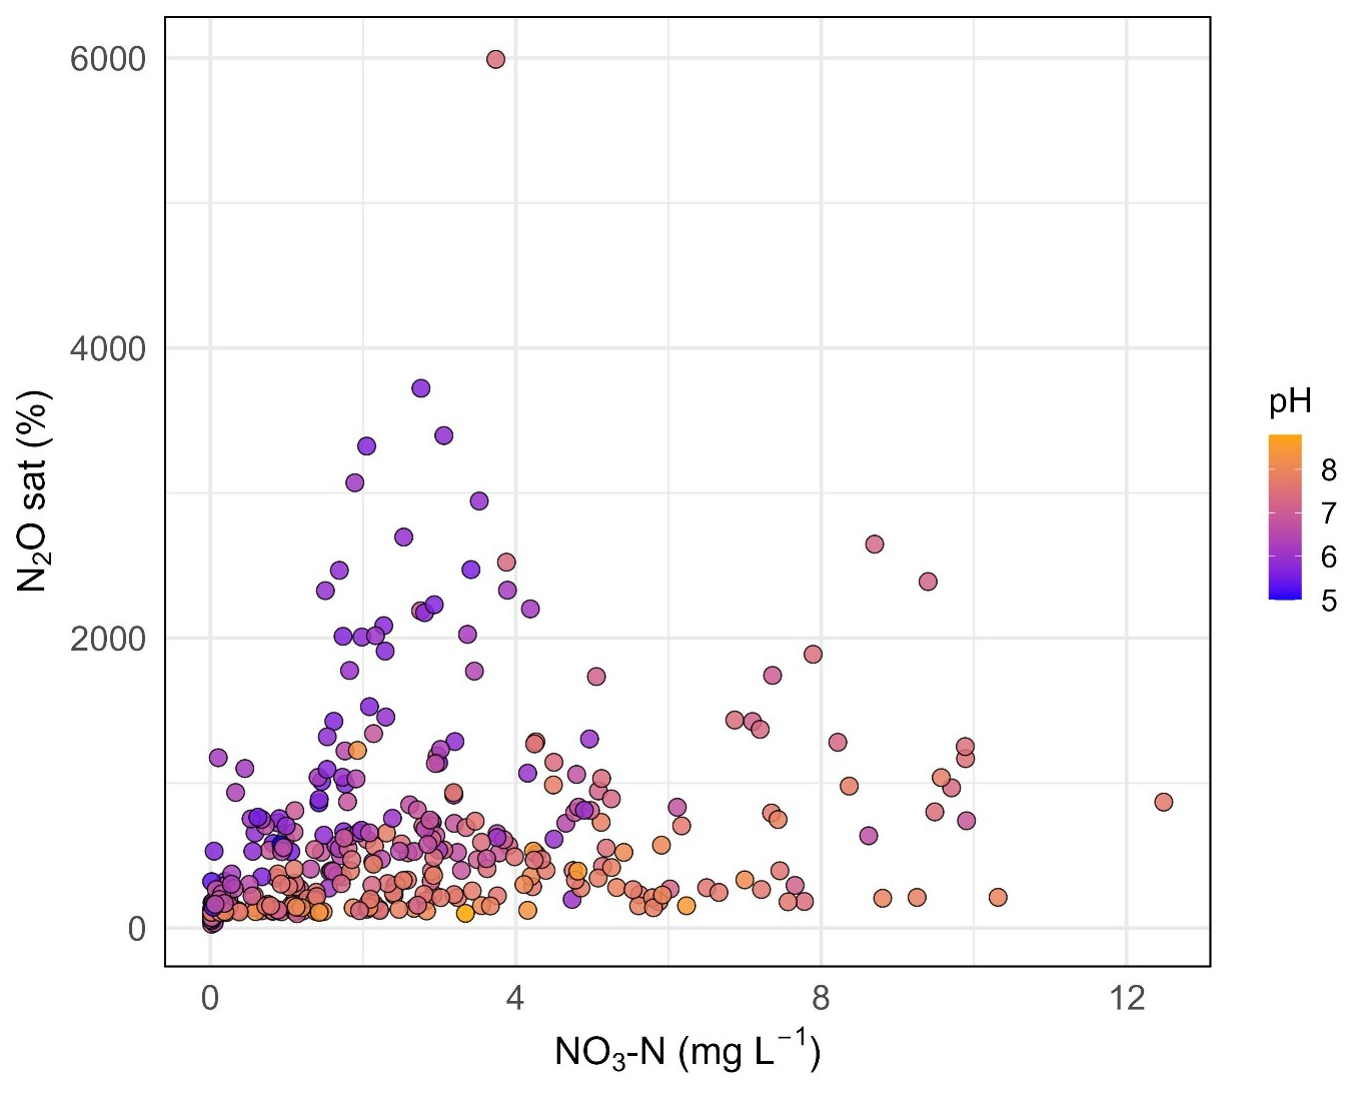
Figure 4Nitrous oxide (N2O) saturation versus nitrate (NO–N) concentration. The color gradient indicates the pH in the stream water.
3.4 Streams as net nitrous oxide sinks
Streams acted as net N2O sinks in approximately 9 % of observations (n=35), as indicated by water column undersaturation relative to atmospheric equilibrium. Mean N2O undersaturation was 69 %, with a range of 27 % to 94 %. Nitrous oxide undersaturation was observed primarily in streams with low NO concentrations, and there was no seasonal tendency. Prolonged periods of undersaturation were observed in three semi-natural streams whose catchments were characterized by a low proportion of agricultural land use. One stream (Stream 2) was undersaturated during all sampling campaigns, whereas Streams 3 and 4 were undersaturated in approximately 75 % of the campaigns. In addition, a single occurrence of undersaturation was observed in a stream receiving water from an agriculturally dominated catchment (stream 25).
4.1 In-stream nitrous oxide dynamics and variation
Our observed N2O concentrations (mean 2.4±2.8 µg N L−1 or 608±722 %) were somewhat higher than levels from past studies of stream and rivers: median 1.0 µg N L−1 in Sweden (Audet et al., 2020), mean 0.8 µg N L−1 or 236 % in Michigan in United States (Beaulieu et al., 2008), 114±20 % in New Zealand (Clough et al., 2011) and 184±1081 % in United States (Aho et al., 2023). Stream water N2O concentrations are the result of complex interactions among potential transport pathways (e.g. in-stream production, external input), within-stream physical factors (e.g. turbulence, slope) and biogeochemical conditions (e.g. pH, redox conditions). Here, we nonetheless assessed whether statistically robust relationships exist between N2O saturation and selected in-stream environmental variables associated with N2O production and consumption. Our finding that NO was a significant predictor of N2O saturation is consistent with earlier studies (Baulch et al., 2012; Clough et al., 2011; Beaulieu et al., 2009). These findings may imply that heterotrophic denitrification contributes substantially to N2O dynamics, whether through enhanced process rates or altered product ratios under elevated NO levels, though further evidence is needed to confirm this. Metagenomic analysis of the sediment from two agricultural streams from our stream network (Peterse et al., 2026) confirmed the presence of denitrification genes (nirS, norB, nosZ). Our results further indicate that the effect of NO on N2O levels is stronger under acidic conditions. This implies that low pH in streams may promote elevated N2O concentrations even under low N availability, consistent with Audet et al. (2020), who observed similar N2O concentrations in forested (pH < 6) and agricultural streams despite much higher N concentrations in the latter.
Hydrological characteristics such as water residence time, slope, stream depth, flow velocity, and physical structure also influence N2O concentration by affecting biogeochemical processes and gas exchange (Marzadri et al., 2021; Tonina et al., 2021; Mulholland et al., 2008; Mwanake et al., 2023). Our results show that deeper streams tend to exhibit higher N2O saturation (Fig. A7). This pattern may be partially explained by the negative association between stream depth and lower pH levels. Physical constraints on gas exchange may also contribute, as deeper water bodies typically have lower surface area-to-volume ratios, potentially limiting the evasion of N2O to the atmosphere, leading to higher N2O concentrations in the water column. Several potentially important controls on N2O concentrations were not accounted for in our study design, particularly those related to hydrological flow paths. Groundwater, often oversaturated with N2O (Jurado et al., 2017; von der Heide et al., 2008), can significantly influence stream concentrations, particularly in headwater systems where it constitutes a major portion of baseflow (Bisson et al., 2025). Drain systems can deliver concentrated pulses of NO and N2O directly into streams. Reay et al. (2003) reported N2O concentrations at drain outlets up to five times higher than those measured 100 m downstream, suggesting rapid degassing upon discharge. Our study showed that seasonal patterns were weak, with slightly lower N2O saturation in summer. This may reflect reduced substrate availability, enhanced N assimilation, and/or increased denitrification to N2 under warmer conditions. Overall, our findings align with previous studies reporting inconsistent seasonality (Audet et al., 2020; Beaulieu et al., 2008; Hama-Aziz et al., 2017; Aho et al., 2022; Cole and Caraco, 2001; Rosamond et al., 2012), reinforcing the importance of local over temporal drivers.
4.2 The direct effect of pH
In our study, N2O saturation was negatively correlated with pH, and this effect was most pronounced at pH values below 6. Whether this relationship reflects a direct influence of pH or an indirect one mediated by other environmental variables remains unresolved, and it will most likely depend on the dominant N2O production pathway. Only a small number of studies have investigated N2O concentrations in streams with low pH (Audet et al., 2020). In contrast, the effect of pH on N2O is well documented in soils, where numerous studies have demonstrated that low pH can impair N2O reduction and shift end-product ratios toward N2O rather than N2 (Šimek and Cooper, 2002; Firestone et al., 1980; Liu et al., 2014; Qiu et al., 2024). This impairment is linked to reduced functionality of nosZ, the enzyme responsible for reducing N2O to N2 (Firestone et al., 1980). Metagenomic data from the sediment from two of our study streams (Peterse et al., 2026) revealed that nosZ was only slightly less abundant in an acidic stream compared with a neutral stream. However, previous studies have demonstrated that gene presence alone is a poor indicator of N2O reduction capacity under low pH conditions, as acidic environments primarily impair nosZ enzyme functionality rather than gene abundance (Liu et al., 2014; Olaya-Abril et al., 2021). The limited number of studies in streams means that the generality of the pH–N2O relationship across diverse landscapes is still poorly understood. One reason this effect has not been widely reported previously may be that earlier studies examined streams with relatively narrow and high pH ranges such as 7.2–9.0 (Clough et al., 2011), or 7.55–8.43 (Baulch et al., 2012). In other cases, pH was measured, but results were not shown (Beaulieu et al., 2009; Hinshaw and Dahlgren, 2013) or pH was not measured (Baulch et al., 2011a; Stow et al., 2005). More research is needed to determine whether similar pH–N2O interactions operate under different climatic, hydrological, and biogeochemical conditions.
4.3 Indirect effects of pH
A range of environmental conditions and interactions influenced by pH may shape patterns of N2O dynamics. In particular, dissolved CO2 was strongly correlated with pH and showed a positive association with N2O saturation overall, however this association strengthened progressively at higher pH, but was not significant at pH < 6. Overall, these results indicate that observed CO2–N2O relationships vary systematically across the pH gradient. Spatially, lower pH in streams draining western Jutland is consistent with sandy, low-alkalinity catchments with limited buffering capacity. Under such conditions, shifts in inorganic carbon speciation favor dissolved CO2 (Wetzel, 2001). In addition, low buffering capacity further increases chemical pH sensitivity to dissolved CO2. This strong physicochemical coupling complicates interpretation of CO2–N2O relationships in acidic systems. At higher, circumneutral pH, the significant CO2–N2O association may be explained by dissolved CO2 acting as an integrated indicator of ecosystem metabolism and/or a direct control on N2O production. Elevated CO2 concentrations under circumneutral conditions may reflect increased respiratory activity and organic matter mineralization, processes that are often associated with enhanced nitrogen turnover and greater substrate availability for nitrification and denitrification (Hotchkiss et al., 2015; Mulholland et al., 2008). Increased respiratory oxygen demand could also promote localized low-oxygen conditions in sediments and biofilms, which are conducive to N2O production. However, as oxygen availability was not measured directly, these interpretations remain inferential. Experimental evidence from recent sediment incubations indicates that elevated CO2 can coincide with increased ammonia-oxidizing bacterial abundance and enhanced N2O production, particularly under low DOC : NO ratios (Mwanake et al., 2025). While these experimental findings are consistent with the field-based patterns observed here, their applicability to heterogeneous stream environments is uncertain. In conclusion, because CO2 and pH are inherently linked through carbonate system chemistry, their individual influences on N2O dynamics cannot be disentangled in this study. As a result, neither the direction of causality nor the relative importance of biological versus physicochemical controls can be resolved. Under acidic conditions, nitrification intermediates such as hydroxylamine (NH2OH) and nitric oxide (NO) can undergo chemical conversion to N2O via non-enzymatic pathways (Zhu-Barker et al., 2015). A significant, but weak, positive correlation between NH and N2O indicates that nitrification, nitrifier denitrification, coupled nitrification-denitrification or nitrification coupled to abiotic processes may also contribute to N2O production. The NH concentrations in streams were generally low, but it is possible that NH was released through the mineralization of organic matter in sediments, providing a substrate for nitrification (Arango and Tank, 2008). Supporting this, sediment data from ten streams with monthly monitoring showed that NH concentrations were consistently higher in sediments than in the overlying water (Peterse et al., 2026). Microbial community profiling via 16S rRNA gene sequencing revealed nitrifiers in ten streams, with acidophilic Nitrosotaleaceae dominating acidic sites, indicating that pH might alter community structure (Peterse et al., 2026). Another potential N2O source is chemodenitrification (Wankel et al., 2017), where oxidized N species are reduced by Fe2+, which may be important in iron-rich, acidic soils such as western Jutland, but its contribution could not be confirmed because Fe2+ and abiotic processes were not measured directly.
4.4 Nitrous oxide undersaturation
Freshwater ecosystems have been recognized as potential sinks for N2O for some time (Kroeze et al., 2007), yet this role remains largely ignored in both global and national greenhouse gas inventories (Aho et al., 2023; Webb et al., 2019). Kroeze et al. (2007) proposed that inland waters can be N2O undersaturated when N2O consumption processes exceed in situ production and atmospheric invasion. In our study, undersaturated was observed for three streams located in areas with low impact from agriculture, and thus low stream water N concentrations. This finding is consistent with previous studies demonstrating that low N availability is a key factor influencing N2O undersaturation in streams (Kroeze et al., 2007; Baulch et al., 2011b; Aho et al., 2023). Samples collected from streams across the United States, as part of the National Ecological Observatory Network, showed that 30 % of the samples (678 of 2288) were undersaturated. In our study undersaturation was observed across all seasons, with no statistically significant seasonal variation, implying that temporal factors such as temperature or hydrological conditions may play a lesser role than N status. Besides NO, N2O undersaturation has also been linked to low oxygen and high DOC (Baulch et al., 2011b; Borges et al., 2019).
Our study indicates that streams draining acidic catchments with low buffering capacity can exhibit elevated N2O saturation even when NO concentrations are only moderate. Consequently, landscapes with acidic soils and limited buffering capacity could contribute more to regional N2O emissions than currently assumed in large-scale inventories, although the mechanisms behind the pH sensitivity require further investigation. Globally, acidic soils cover nearly one-third of the ice-free land surface (Jones et al., 2005), and in many regions, they coincide with areas of intensive agriculture (Guo et al., 2010). Implementing management strategies that reduce N inputs or surpluses in such systems could help mitigate in-stream N2O formation. However, more research is needed to determine whether similar patterns occur in other regions of the world, particularly in tropical and subtropical landscapes. Despite generally high N2O saturation, a small fraction of the observed streams showed undersaturation, occurring mainly in nutrient poor streams with no seasonal variation, demonstrating that headwater streams can function as both sources and sinks of N2O.
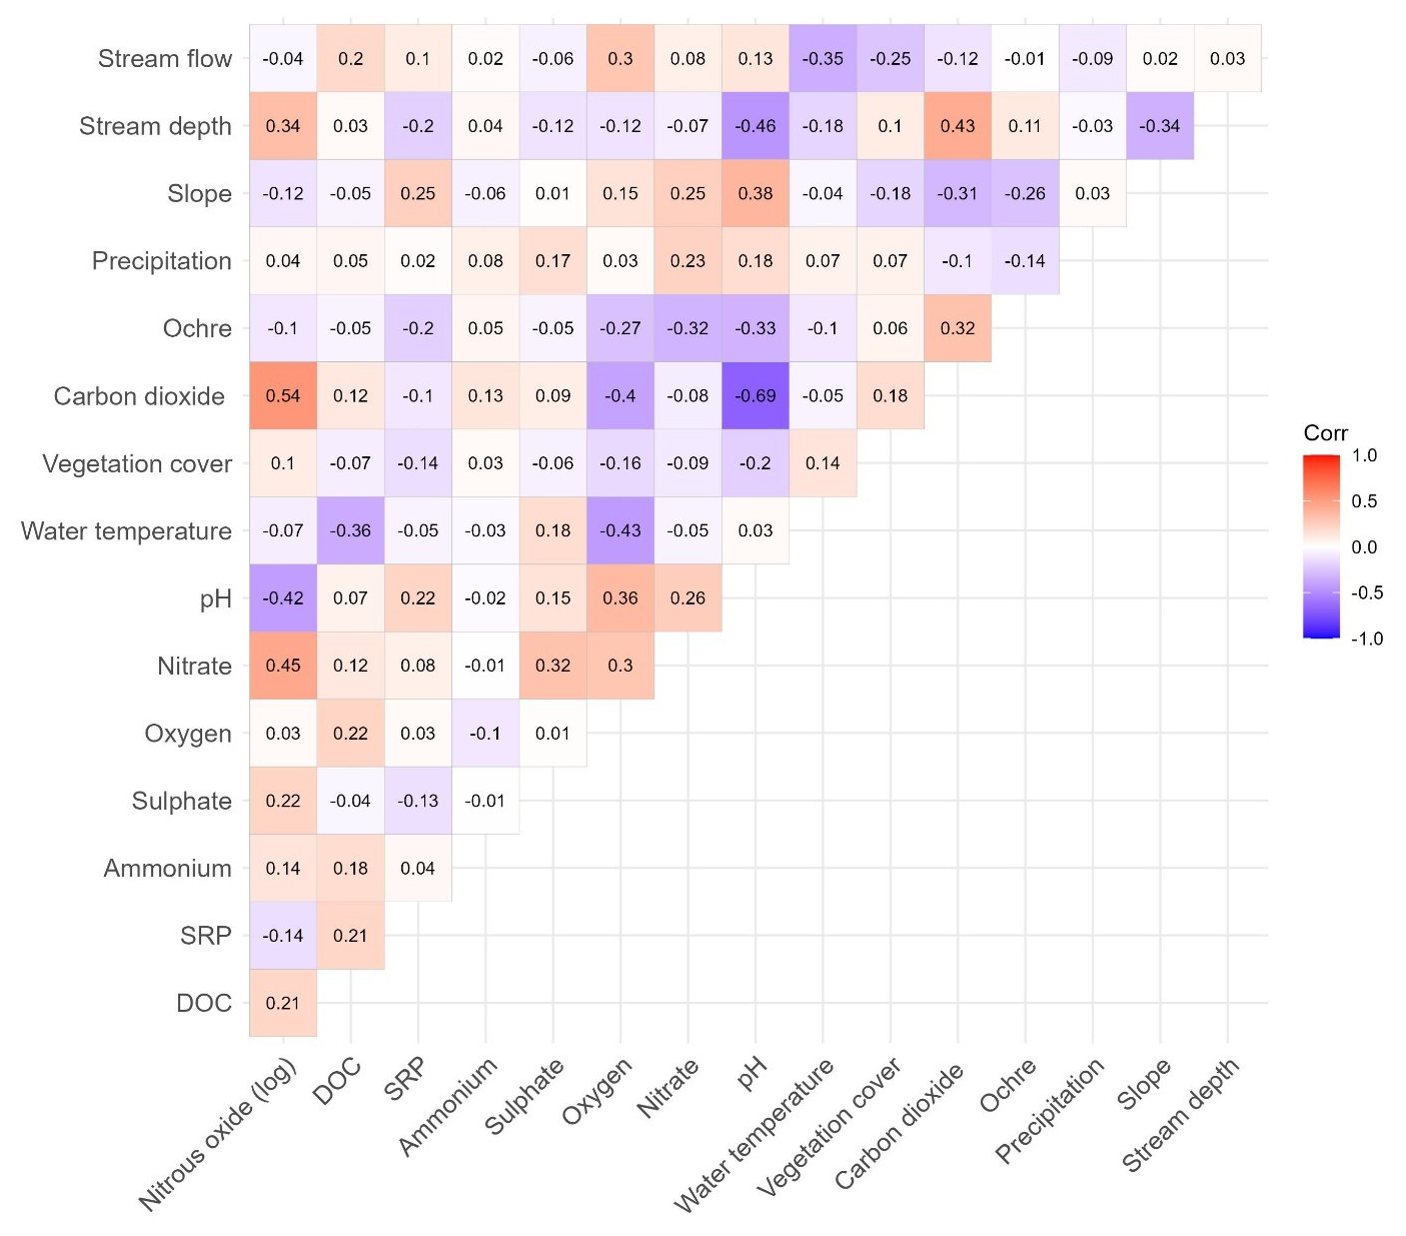
Figure A1Correlation plots based on Pearson's correlation coefficients, where unit of nitrous oxide is percentage saturation (log transformed), stream flow is m s−1, stream depth is cm, slope is permille, precipitation is mm, ochre is on scale from 0–3, vegetation cover in percentage, water temperature in Celsius degrees, carbon dioxide is µg L−1, and units of nitrate, oxygen, sulphate, ammonium, SRP (soluble reactive phosphorus) and DOC (dissolved organic carbon) are mg L−1.
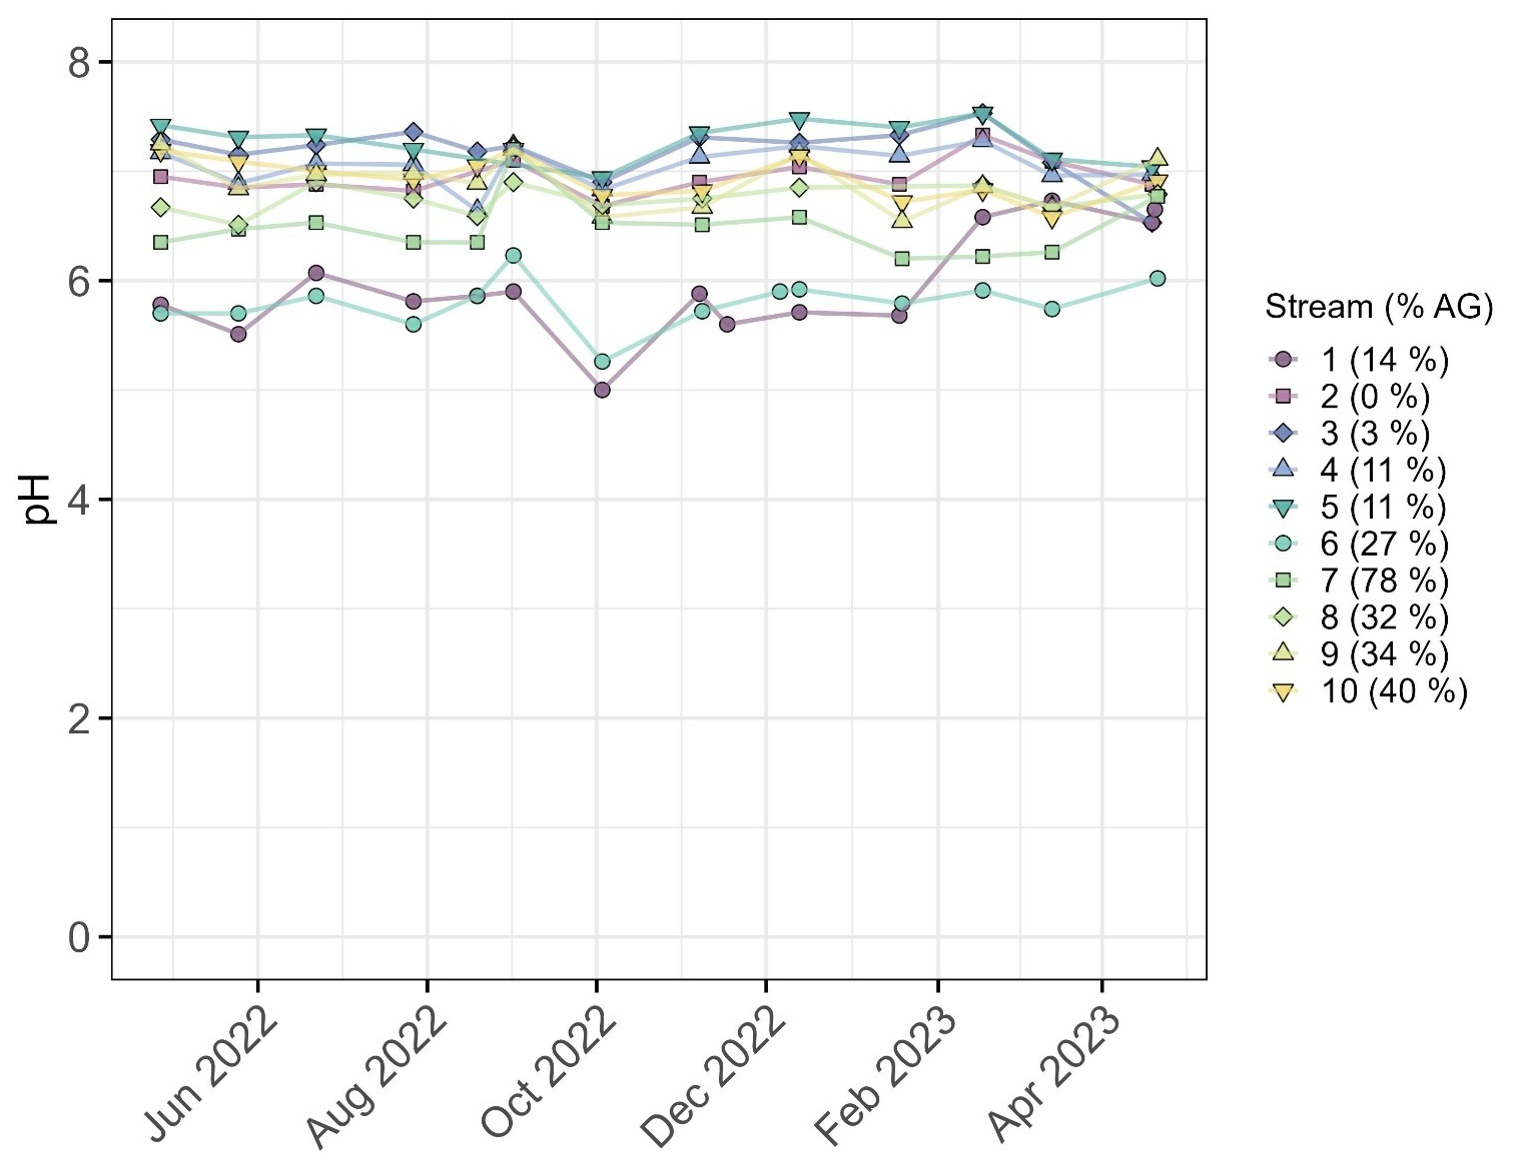
Figure A2The pH measured in the water column from the ten streams (1–10) with monthly monitoring. Stream-specific percentages of intensive agriculture within the catchment are given in the legend.
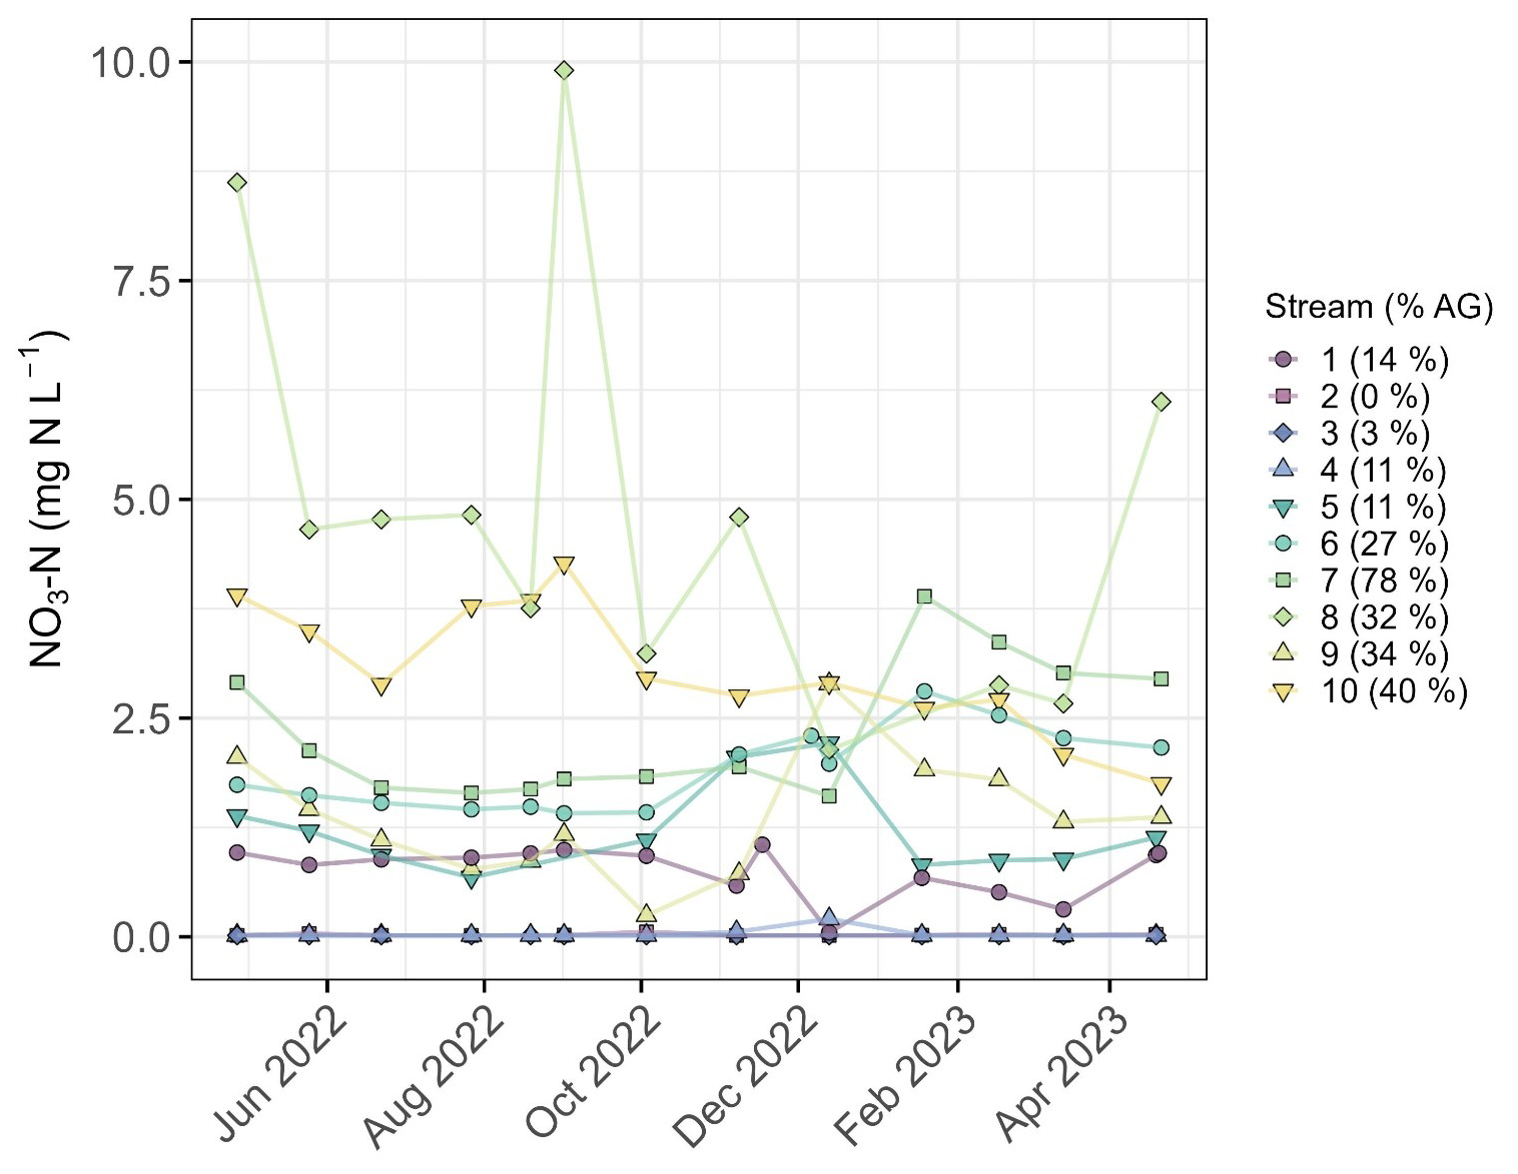
Figure A3The nitrate (NO) concentration of water from the ten streams (1–10) with monthly monitoring. Stream-specific percentages of intensive agriculture within the catchment are given in the legend.
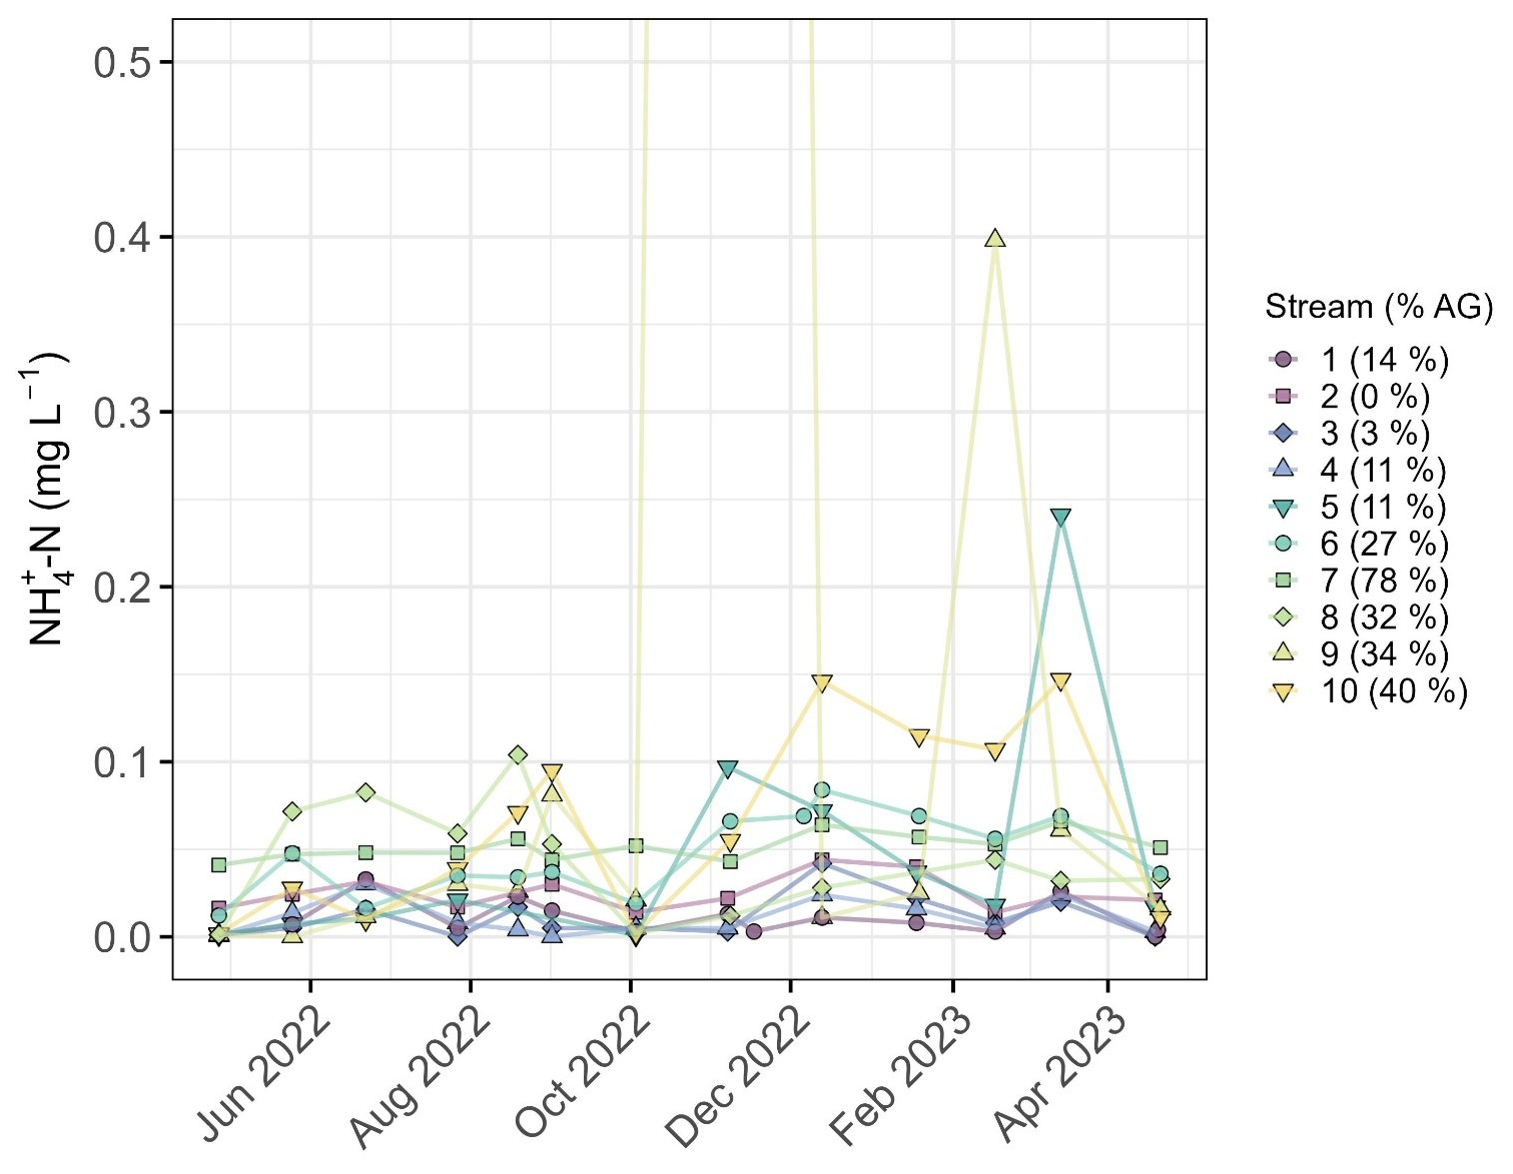
Figure A4The ammonium (NH) concentration of water from the ten streams (1–10) with monthly monitoring. A NH concentration of 4.4 mg L−1 from stream 9 from the 8 November 2022 was omitted from the graph for visual reasons. Stream-specific percentages of intensive agriculture within the catchment are given in the legend.
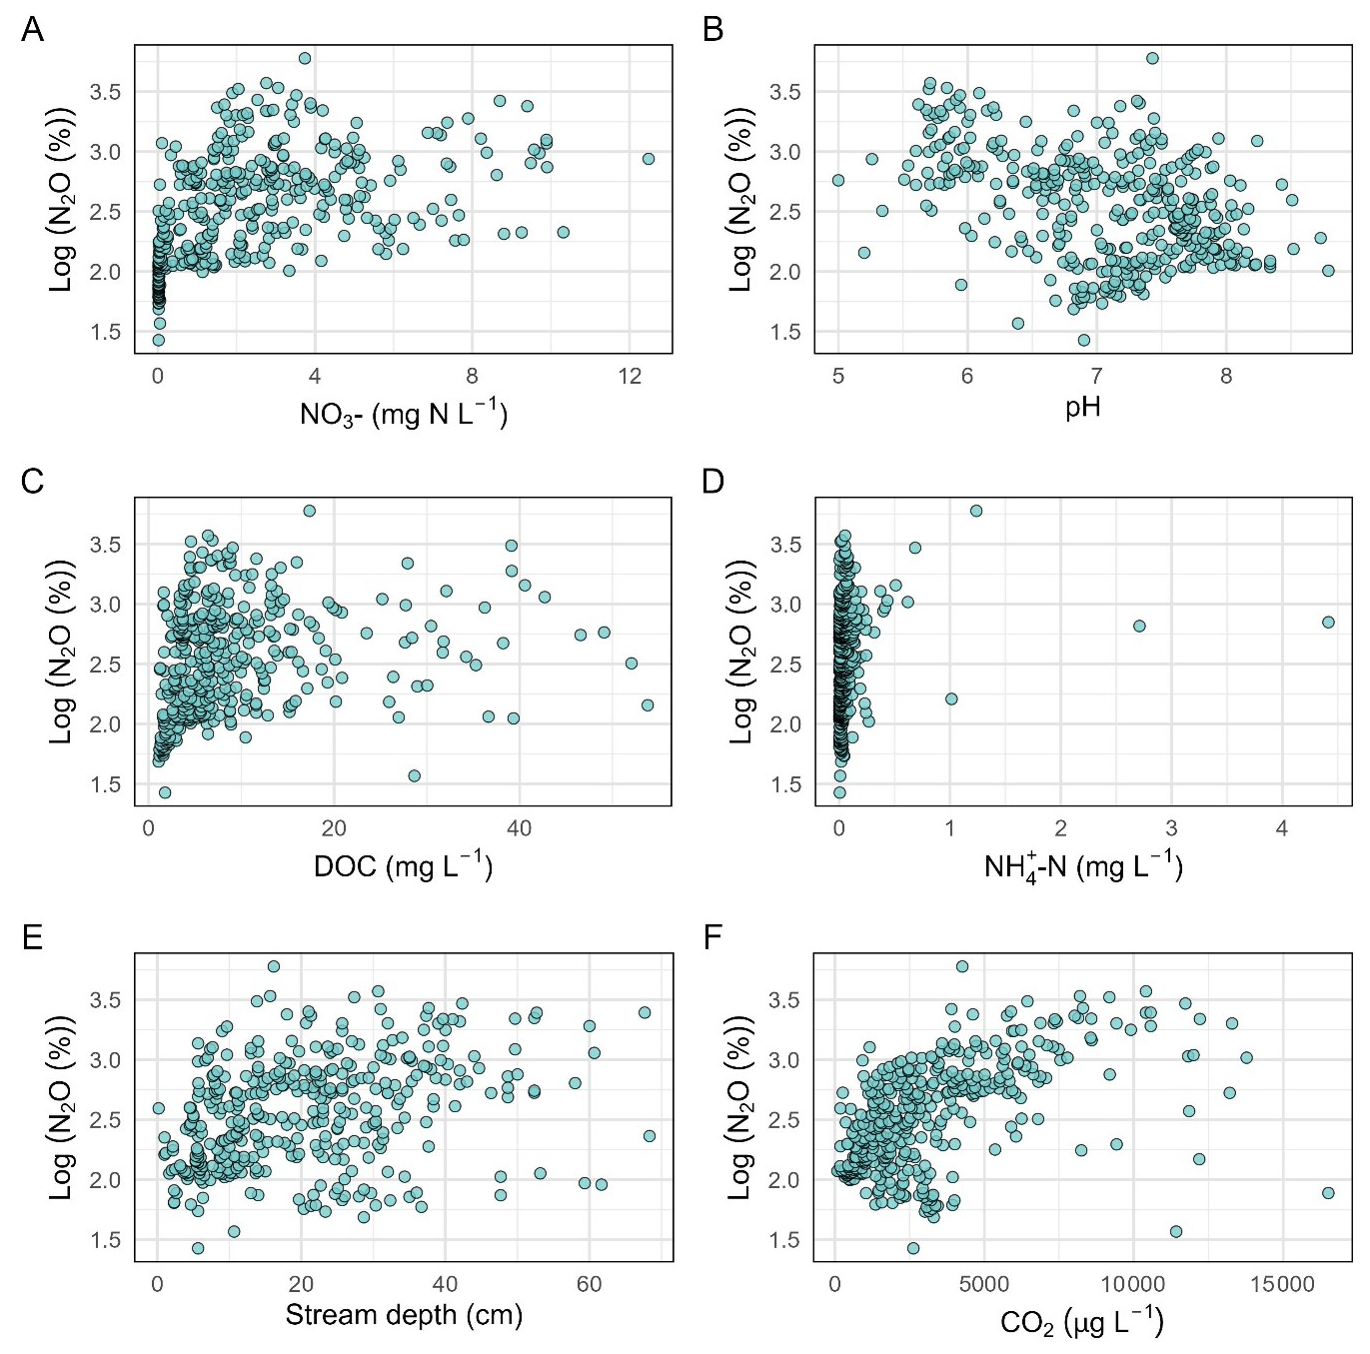
Figure A5Stream water nitrous oxide (N2O) saturation plotted against nitrate (NO) (A), pH (B), dissolved organic carbon (DOC) (C), ammonium (NH) (D), stream depth (E) and stream water carbon dioxide (CO2) (F) for Danish headwater streams.
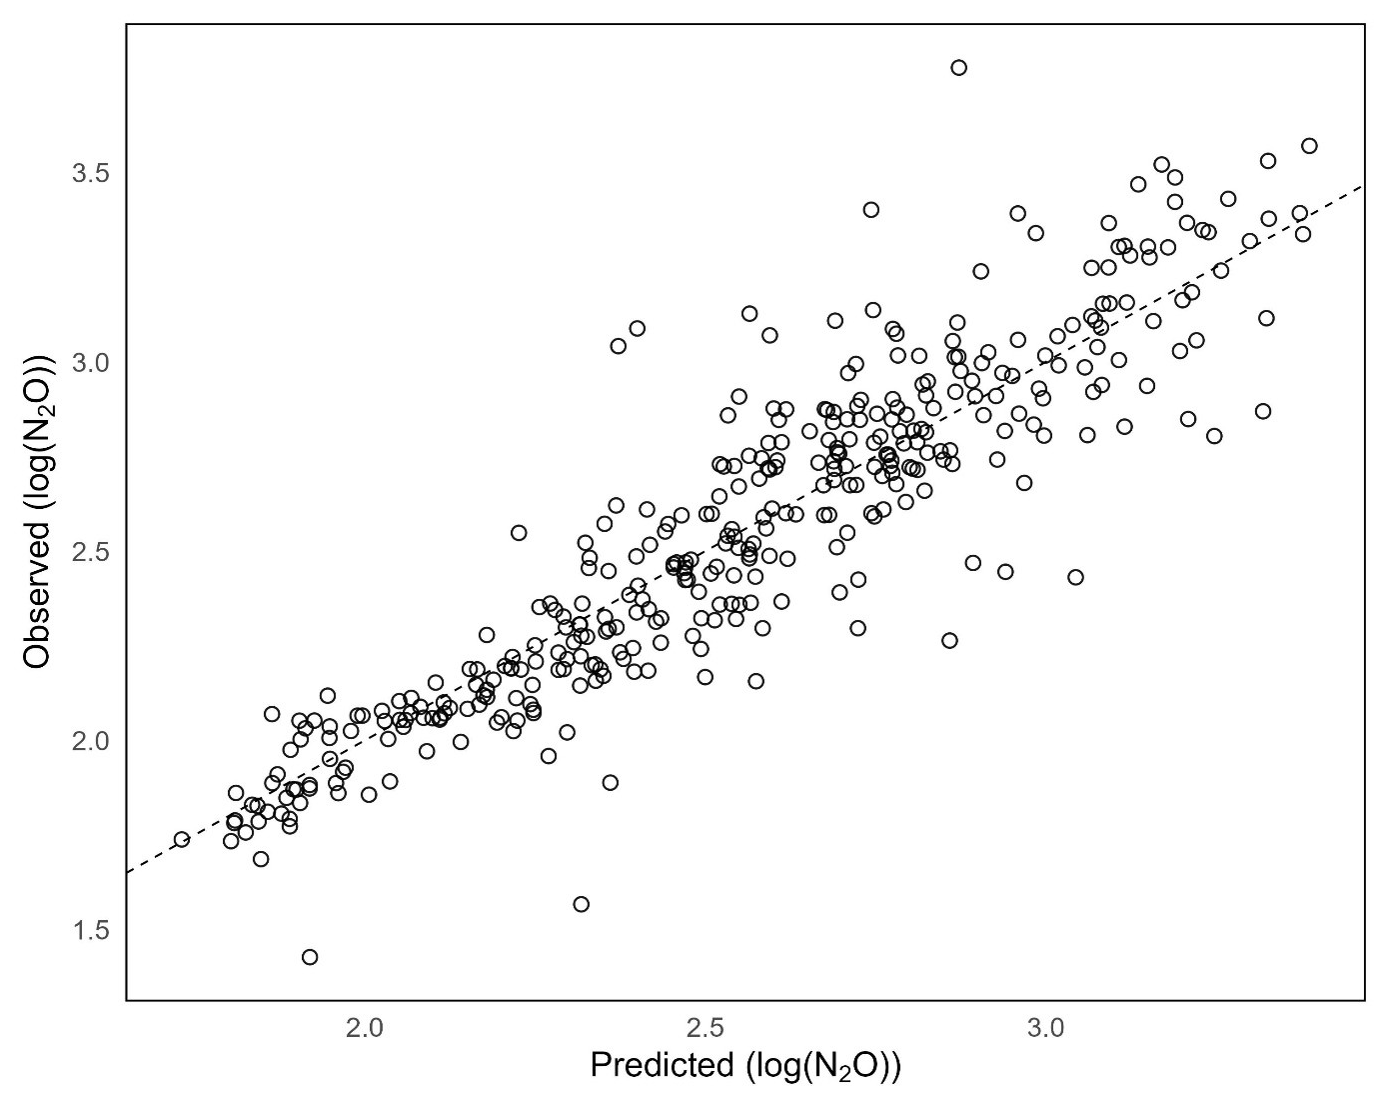
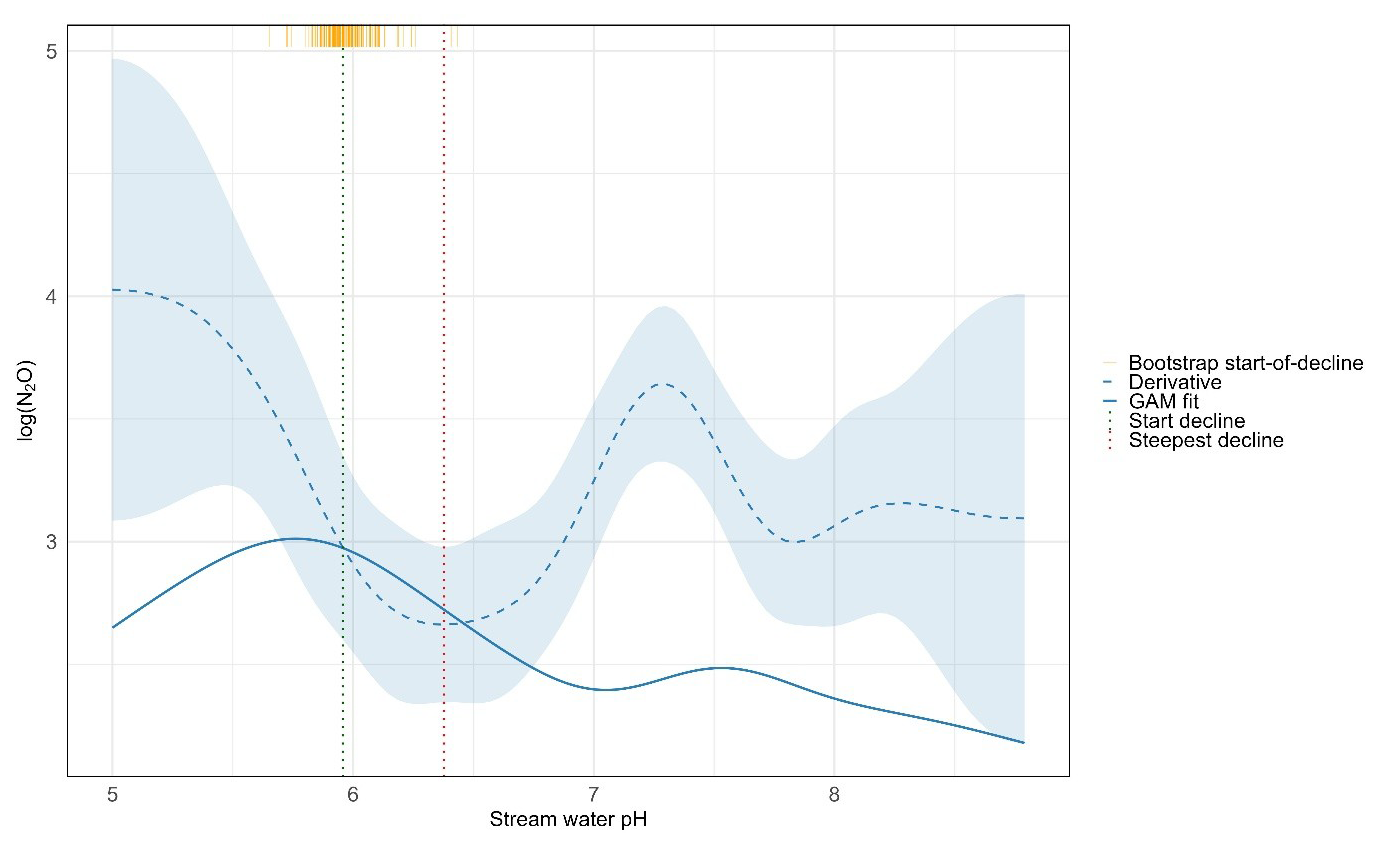
Figure A7Generalized additive model (GAM) of log(N2O) saturation vs. stream water pH. Solid blue line: predicted log(N2O); dashed blue line: derivative with 95 % confidence interval (shaded). Vertical dotted lines: start of decline (green) and steepest decline (red). Orange rug: bootstrap distribution of start-of-decline pH values.
Table A1Variance inflation factor (VIF) analysis of linear mixed-effects model (parameters included: nitrate, pH, stream depth, land use and interaction nitrate x pH). All continuous predictor variables were standardized (z-transformed: centered and scaled to unit variance), stream water during summer 2022, autumn 2022, winter 2022 and spring 2023, where N2O = nitrous oxide, NO = nitrate, NH = ammonium, and DOC = dissolved organic carbon.
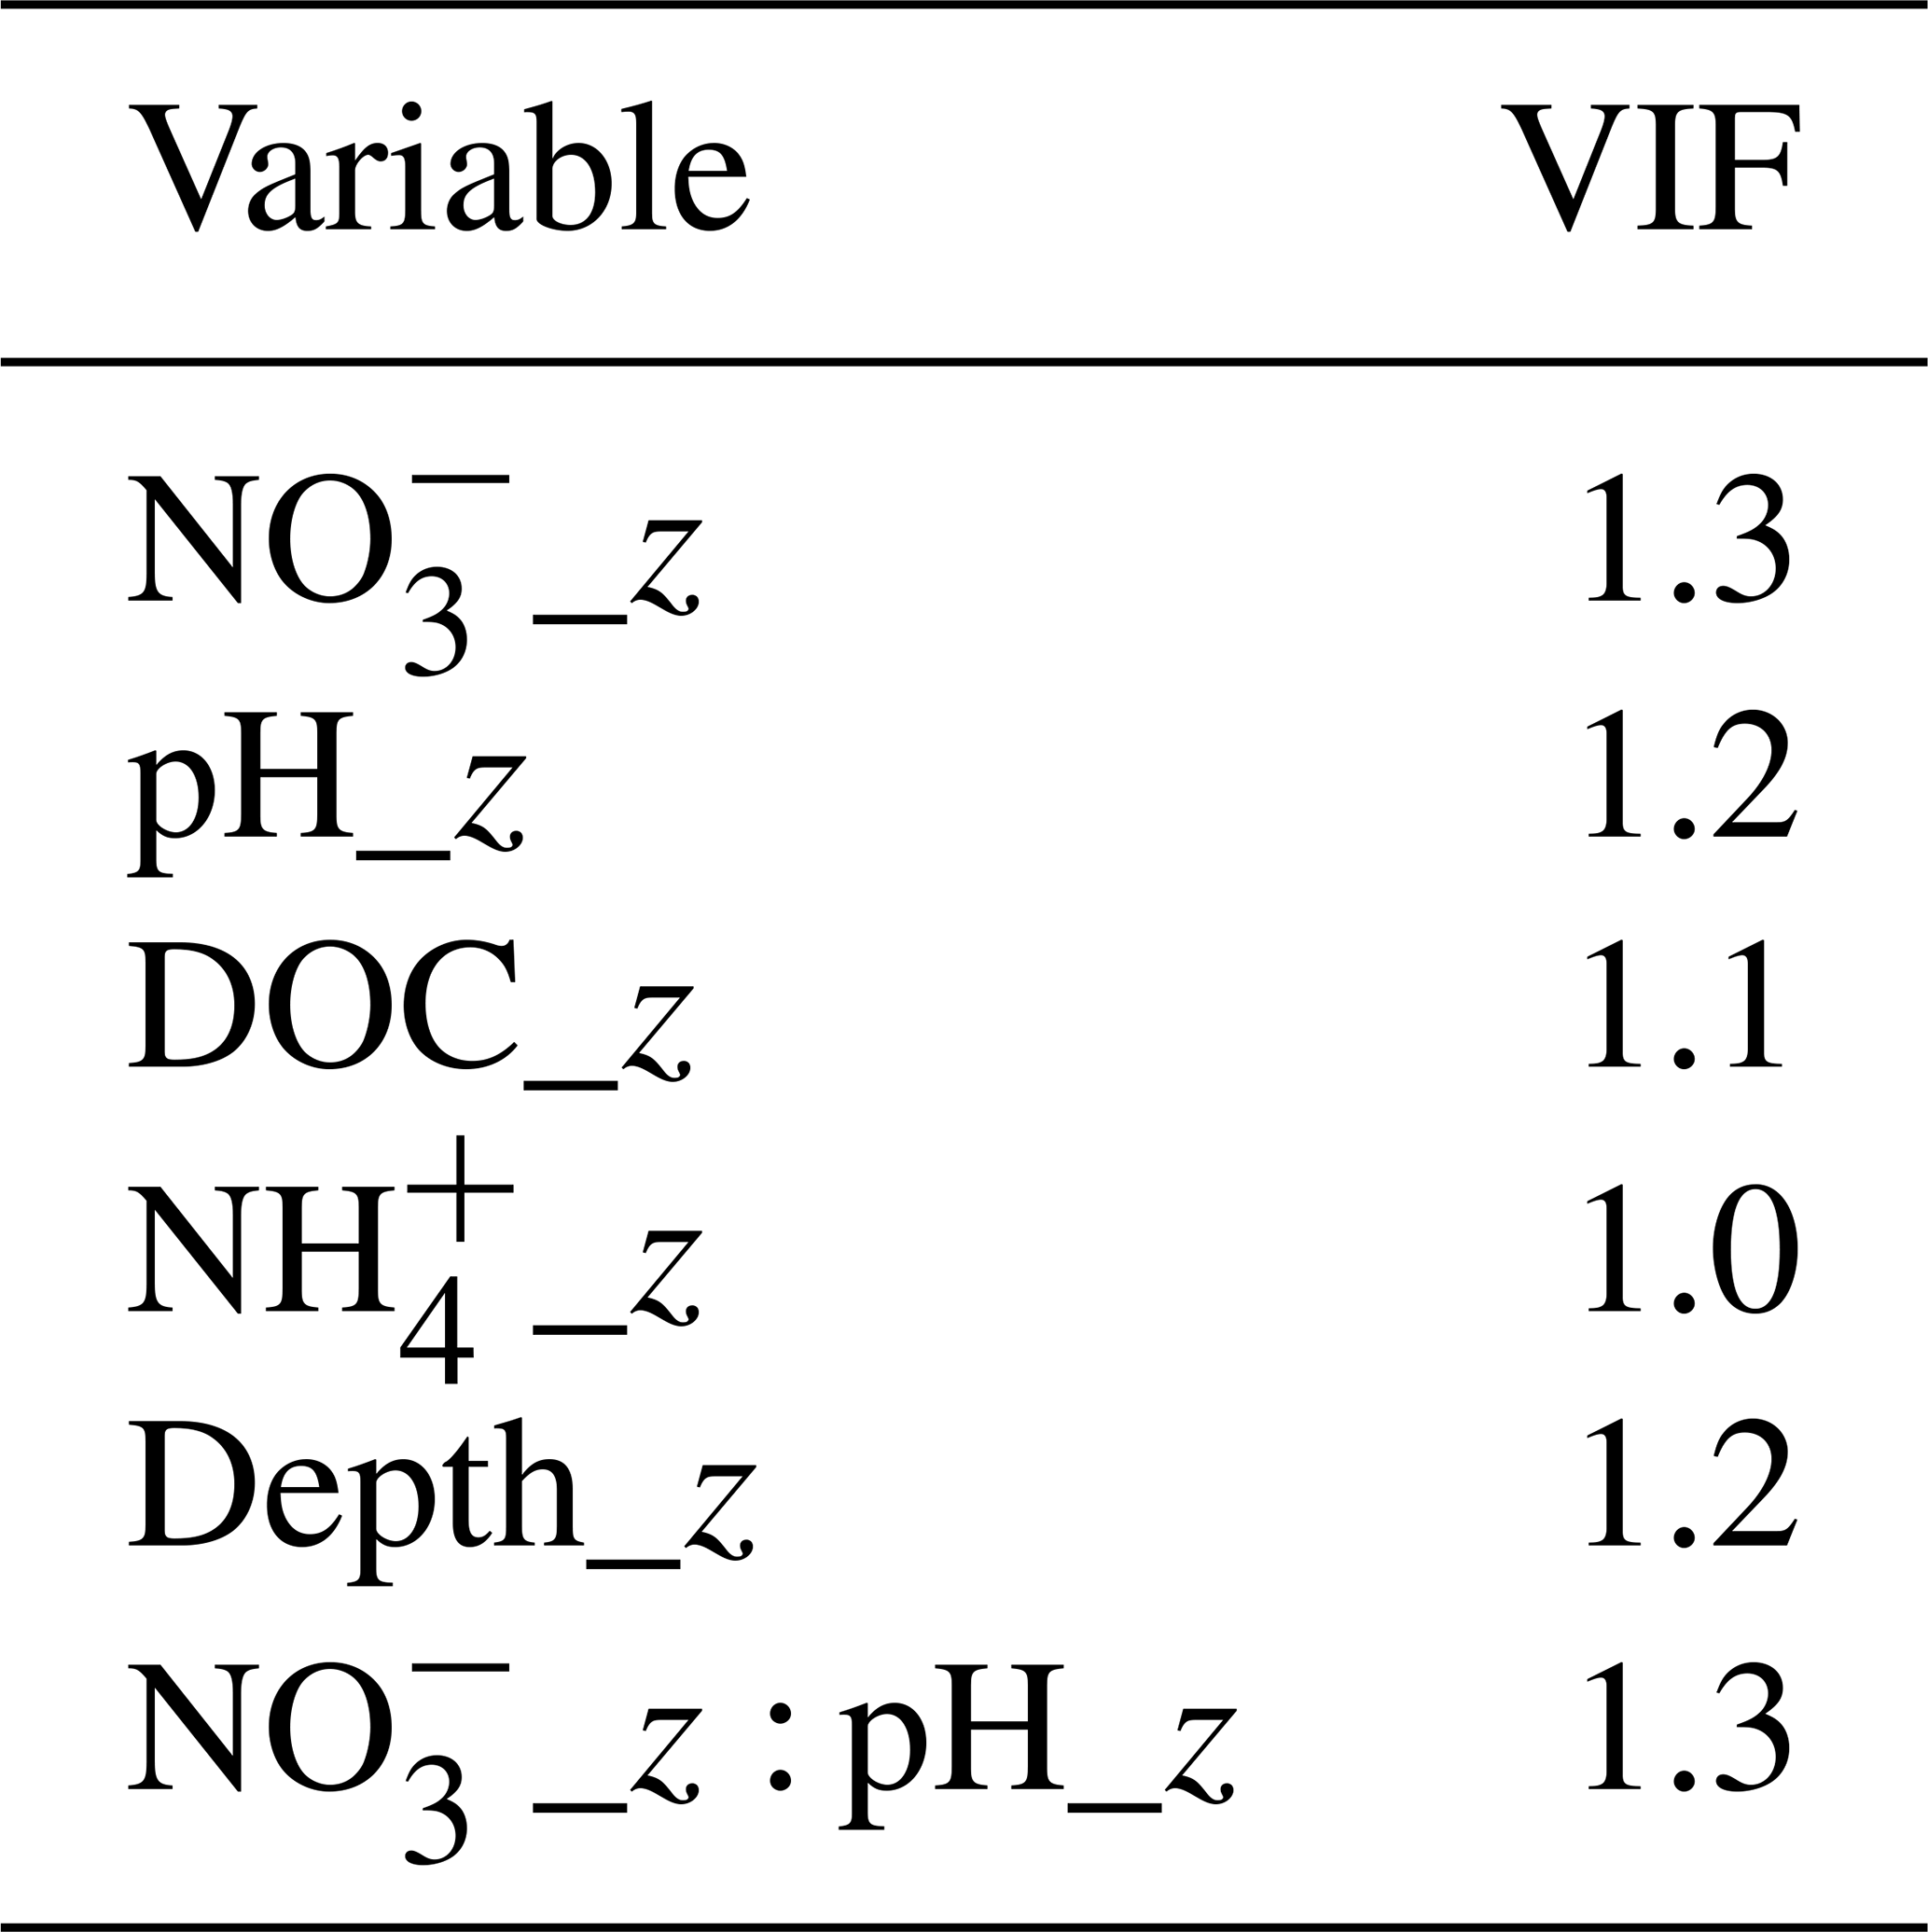
Table A2Characteristics of stream water during summer 2022, autumn 2022, winter 2022 and spring 2023, where N2O = nitrous oxide, TN = total nitrogen, NO = nitrate, NH = ammonium, CO2 = carbon dioxide, TOC = total organic carbon, DOC = dissolved organic carbon, TP = total phosphorus, SRP = soluble reactive phosphorus, SO = sulphate, and O2 = dissolved oxygen.
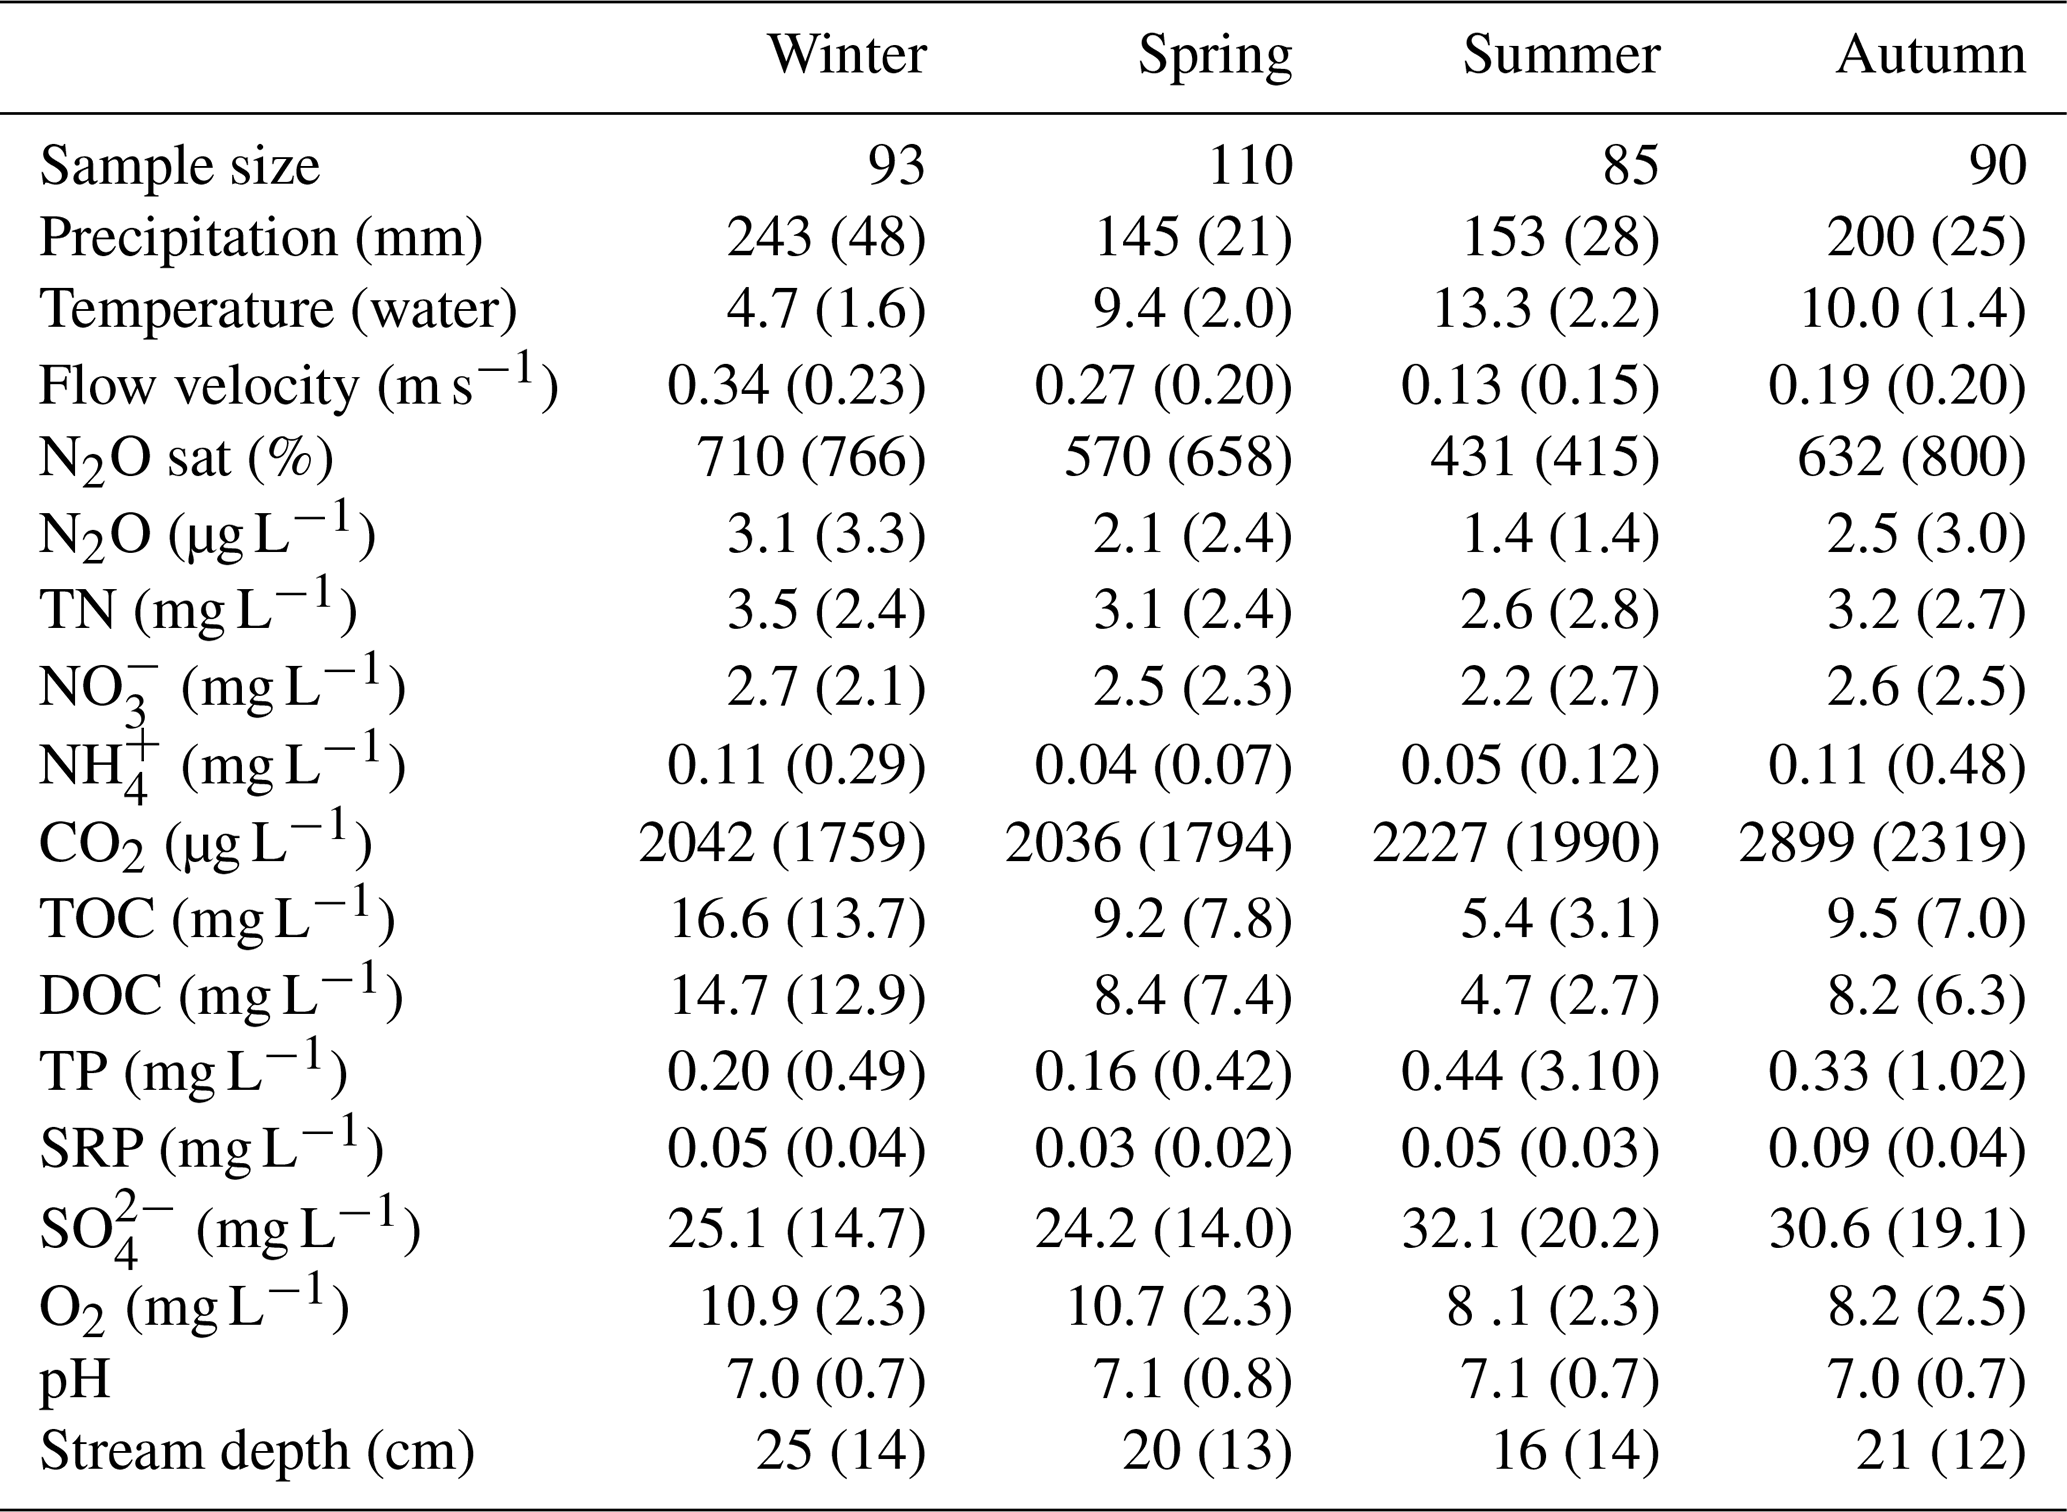
Table A3Results from linear mixed-effects model analysis with pairwise test of seasonal difference in N2O saturation (%), where SE = standard error and DF = degrees of freedom.
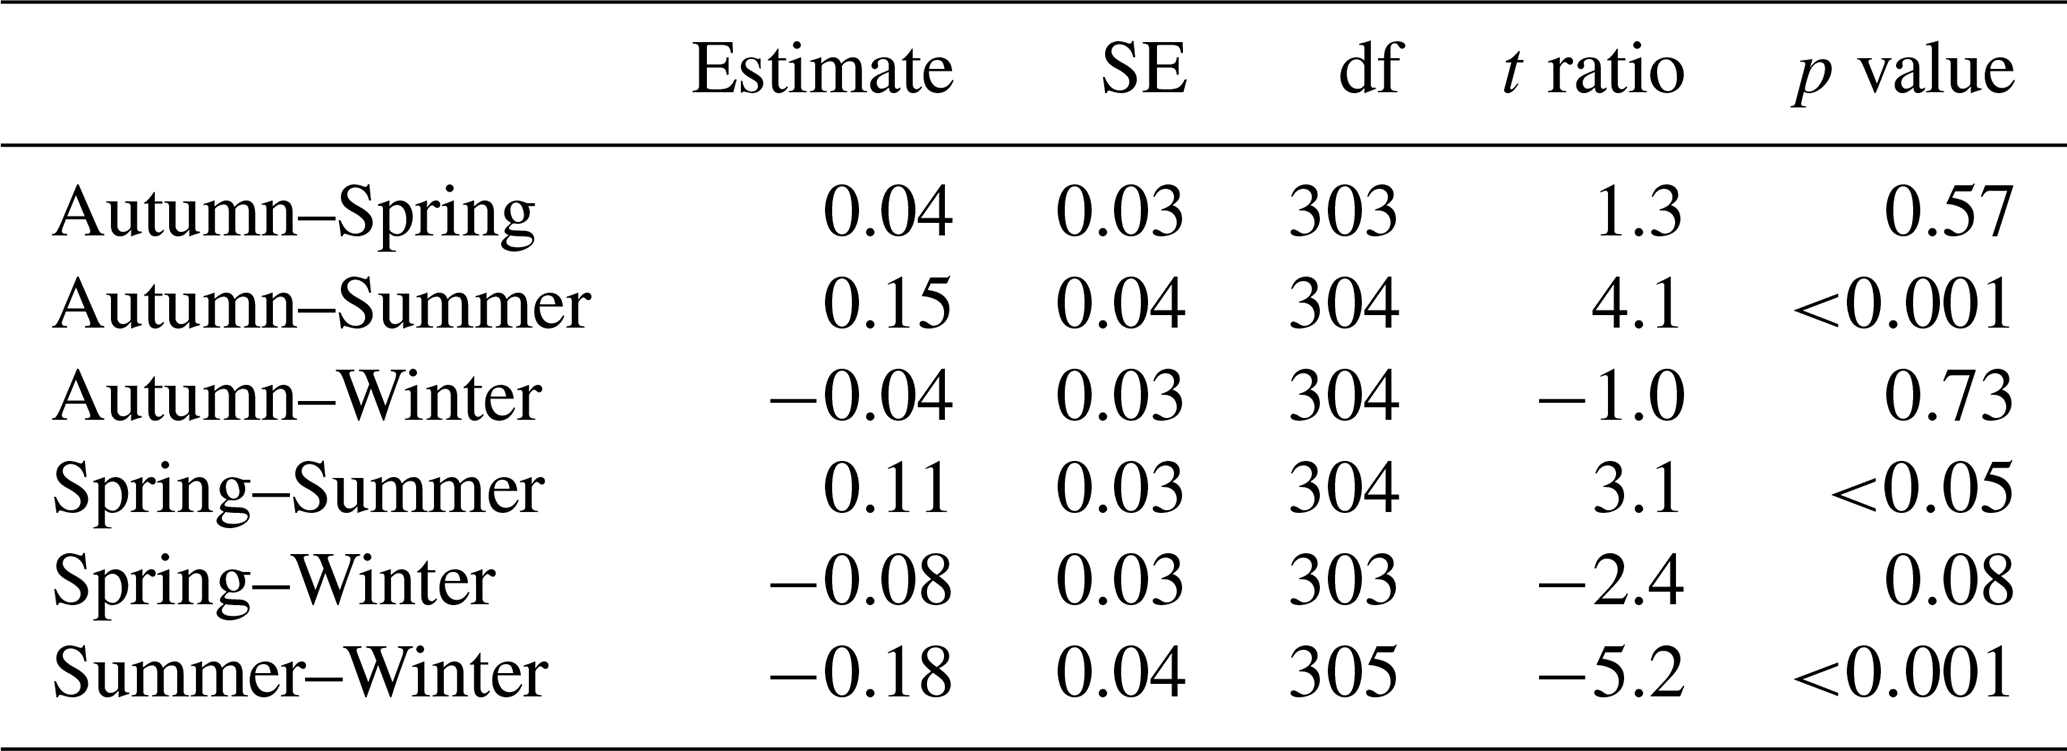
Table A4Model performance of linear mixed-effects model (parameters included: nitrate, pH, ammonium, stream depth, land use and interaction nitrate*pH). All continuous predictor variables were standardized (z-transformed: centered and scaled to unit variance).

All data used in this study are available from Zenodo at https://doi.org/10.5281/zenodo.18457449 (Carstensen and Audet, 2026).
JA and MC designed the study, JA and MC planned the field campaigns; MC and IP performed the measurements; MC analyzed the data; MC wrote the manuscript draft; JA, AV, IP and NW reviewed and edited the manuscript. JA, NW, and AV supervised the project.
The contact author has declared that none of the authors has any competing interests.
Publisher's note: Copernicus Publications remains neutral with regard to jurisdictional claims made in the text, published maps, institutional affiliations, or any other geographical representation in this paper. The authors bear the ultimate responsibility for providing appropriate place names. Views expressed in the text are those of the authors and do not necessarily reflect the views of the publisher.
We thank Anne Hasselholt Andersen, Ditte Christensen, Emil Skole and the technical staff at Aarhus University for their help in the collection and analysis of samples.
This research has been supported by the Danmarks Frie Forskningsfond (grant no. 021700021B).
This paper was edited by Lishan Ran and reviewed by two anonymous referees.
Adhikari, K.: Soil mapping in Denmark using digital soil mapping techniques. PhD thesis. Aarhus University, Denmark, 2013.
Aho, K. S., Fair, J. H., Hosen, J. D., Kyzivat, E. D., Logozzo, L. A., Weber, L. C., Yoon, B., Zarnetske, J. P., and Raymond, P. A.: An intense precipitation event causes a temperate forested drainage network to shift from N2O source to sink, Limnol. Oceanogr., 67, S242–S257, https://doi.org/10.1002/lno.12006, 2022.
Aho, K. S., Maavara, T., Cawley, K. M., and Raymond, P. A.: Inland Waters can Act as Nitrous Oxide Sinks: Observation and Modeling Reveal that Nitrous Oxide Undersaturation May Partially Offset Emissions, Geophys. Res. Lett., 50, e2023GL104987, https://doi.org/10.1029/2023GL104987, 2023.
Arango, C. P. and Tank, J. L.: Land use influences the spatiotemporal controls on nitrification and denitrification in headwater streams, J. N. Am. Benthol. Soc., 27, 90–107, https://doi.org/10.1899/07-024.1, 2008.
Audet, J., Bastviken, D., Bundschuh, M., Buffam, I., Feckler, A., Klemedtsson, L., Laudon, H., Löfgren, S., Natchimuthu, S., Öquist, M., Peacock, M., and Wallin, M. B.: Forest streams are important sources for nitrous oxide emissions, Global Change Biol., 26, 629–641, https://doi.org/10.1111/gcb.14812, 2020.
Bates, D., Mächler, M., Bolker, B., and Walker, S.: Fitting Linear Mixed-Effects Models Using lme4, J. Stat. Softw., 67, 1–48, https://doi.org/10.18637/jss.v067.i01, 2015.
Baulch, H., Dillon, P., Maranger, R., Venkiteswaran, J., Wilson, H., and Schiff, S.: Night and Day: Short-Term Variation in Nitrogen Chemistry and Nitrous Oxide Emissions from Streams, Freshwater Biol., 57, https://doi.org/10.1111/j.1365-2427.2011.02720.x, 2012.
Baulch, H. M., Schiff, S. L., Maranger, R., and Dillon, P. J.: Nitrogen enrichment and the emission of nitrous oxide from streams, Global Biogeochem. Cy., 25, https://doi.org/10.1029/2011GB004047, 2011a.
Baulch, H. M., Schiff, S. L., Thuss, S. J., and Dillon, P. J.: Isotopic Character of Nitrous Oxide Emitted from Streams, Environ. Sci. Technol., 45, 4682–4688, https://doi.org/10.1021/es104116a, 2011b.
Beaulieu, J. J., Arango, C. P., Hamilton, S. K., and Tank, J. L.: The production and emission of nitrous oxide from headwater streams in the Midwestern United States, Global Change Biol., 14, 878–894, https://doi.org/10.1111/j.1365-2486.2007.01485.x, 2008.
Beaulieu, J. J., Arango, C. P., and Tank, J. L.: The Effects of Season and Agriculture on Nitrous Oxide Production in Headwater Streams, J. Environ. Qual., 38, 637–646, https://doi.org/10.2134/jeq2008.0003, 2009.
Bisson, A. M., Liu, F., Moore, E. M., Briggs, M. A., and Helton, A. M.: Preferential Groundwater Discharges Along Stream Corridors Are Disregarded Sources of Greenhouse Gases, J. Geophys. Res.-Biogeo., 130, e2024JG008395, https://doi.org/10.1029/2024JG008395, 2025.
Borges, A. V., Darchambeau, F., Lambert, T., Morana, C., Allen, G. H., Tambwe, E., Toengaho Sembaito, A., Mambo, T., Nlandu Wabakhangazi, J., Descy, J.-P., Teodoru, C. R., and Bouillon, S.: Variations in dissolved greenhouse gases (CO2, CH4, N2O) in the Congo River network overwhelmingly driven by fluvial-wetland connectivity, Biogeosciences, 16, 3801–3834, https://doi.org/10.5194/bg-16-3801-2019, 2019.
Butterbach-Bahl, K., Baggs, E. M., Dannenmann, M., Kiese, R., and Zechmeister-Boltenstern, S.: Nitrous oxide emissions from soils: how well do we understand the processes and their controls?, Philos. T. R. Soc. B, 368, 20130122, https://doi.org/10.1098/rstb.2013.0122, 2013.
Carstensen, M. V. and Audet, J.: Danish stream water chemistry and physical parameters, Zenodo [data set], https://doi.org/10.5281/zenodo.18457449, 2026.
Clough, T. J., Buckthought, L. E., Casciotti, K. L., Kelliher, F. M., and Jones, P. K.: Nitrous Oxide Dynamics in a Braided River System, New Zealand, J. Environ. Qual., 40, 1532–1541, https://doi.org/10.2134/jeq2010.0527, 2011.
Cole, J. J. and Caraco, N. F.: Emissions of nitrous oxide (N2O) from a tidal, freshwater river, the Hudson River, New York, Environ. Sci. Technol., 35, 991–996, https://doi.org/10.1021/es0015848, 2001.
DS/EN ISO 1484: Water Analysis – Guidelines for the Determination of Total Organic Carbon (TOC) and Dissolved Organic Carbon (DOC), Danish Standards, Copenhagen, Denmark, 1997.
DS/EN ISO 6878: Water quality – Determination of phosphorus – Ammonium molybdate spectrometric method, https://www.iso.org/standard/36917.html (last access: 31 May 2023), 2004.
DS/EN ISO 10304: Water Quality – Determination of Dissolved Anions by Liquid Chromatography of Ions – Part 1: Determination of Bromide, Chloride, Fluoride, Nitrate, Nitrite, Phosphate and Sulfate, https://www.iso.org/standard/46004.html (last access: 31 May 2023), 2009.
DS/EN ISO 11732: Water Quality – Determination of Ammonium Nitrogen – Method by Flow Analysis (CFA and FIA) and Spectrometric Detection, https://www.iso.org/standard/38924.html (last access: 31 May 2023), 2005.
DS/EN 12260: Water Quality – Determination of Nitrogen – Determination of Bound Nitrogen (TNB), Following Oxidation to Nitrogen Oxides, https://webstore.ansi.org/standards/ds/dsen122602003 (last access: 31 May 2023), 2003.
Firestone, M., Firestone, B., and Tiedje, J. M.: Nitrous Oxide from Soil Denitrification: Factors Controlling Its Biological Production, Science, 208, 749–751, https://doi.org/10.1126/science.208.4445.749, 1980.
Grabb, K. C., Buchwald, C., Hansel, C. M., and Wankel, S. D.: A dual nitrite isotopic investigation of chemodenitrification by mineral-associated Fe(II) and its production of nitrous oxide, Geochim. Cosmochim. Ac., 196, 388–402, https://doi.org/10.1016/j.gca.2016.10.026, 2017.
Guo, J. H., Liu, X. J., Zhang, Y., Shen, J. L., Han, W. X., Zhang, W. F., Christie, P., Goulding, K. W. T., Vitousek, P. M., and Zhang, F. S.: Significant acidification in major Chinese croplands, Science, 327, 1008–1010, https://doi.org/10.1126/science.1182570, 2010.
Hama-Aziz, Z. Q., Hiscock, K. M., and Cooper, R. J.: Dissolved nitrous oxide (N2O) dynamics in agricultural field drains and headwater streams in an intensive arable catchment, Hydrol. Process., 31, 1371–1381, https://doi.org/10.1002/hyp.11111, 2017.
Haynes, W.: Bonferroni Correction, in: Encyclopedia of Systems Biology, edited by: Dubitzky, W., Wolkenhauer, O., Cho, K.-H., and Yokota, H., Springer New York, New York, NY, 154–154, https://doi.org/10.1007/978-1-4419-9863-7_1213, 2013.
Hinshaw, S. E. and Dahlgren, R. A.: Dissolved Nitrous Oxide Concentrations and Fluxes from the Eutrophic San Joaquin River, California, Environ. Sci. Technol., 47, 1313–1322, https://doi.org/10.1021/es301373h, 2013.
Hotchkiss, E. R., Hall Jr., R. O., Sponseller, R. A., Butman, D., Klaminder, J., Laudon, H., Rosvall, M., and Karlsson, J.: Sources of and processes controlling CO2 emissions change with the size of streams and rivers, Nat. Geosci., 8, 696–699, https://doi.org/10.1038/ngeo2507, 2015.
IPCC: 2019 Refinement to the 2006 IPCC Guidelines for National Greenhouse Gas Inventories, Intergovernmental Panel on Climate Change, https://www.ipcc-nggip.iges.or.jp/public/2019rf/ (last access: May 2025), 2019.
Jones, A., Montanarella, L., and Jones, R.: Soil Atlas of Europe, Luxembourg: European Soil Bureau Network, European Commission Joint Research Centre, 128 pp., https://esdac.jrc.ec.europa.eu/content/soil-atlas-europe (last access: April 2025), 2005.
Jurado, A., Borges, A. V., and Brouyère, S.: Dynamics and emissions of N2O in groundwater: A review, Sci. Total Environ., 584–585, 207–218, https://doi.org/10.1016/j.scitotenv.2017.01.127, 2017.
Knowles, R.: Denitrification, Microbiol. Rev., 46, 43–70, 1982.
Kroeze, C., Bouwman, A. F., and Slomp, C. P.: Sinks for nitrous oxide at the earth's surface, in: Greenhouse Gas Sinks, edited by: Reay, D. S., Hewitt, C. N., Smith, K. A., and Grace, J., Wallingford: CABI, 227–242, https://doi.org/10.1079/9781845931896.0227, 2007.
Lenth, R.: Estimated Marginal Means, aka Least-Squares Means (R package version 1.11.2), https://CRAN.R-project.org/package=emmeans (last access: 10 June 2025), 2025.
Liu, B., Frostegård, Å., and Bakken, L. R.: Impaired Reduction of N2O to N2 in Acid Soils Is Due to a Posttranscriptional Interference with the Expression of nosZ, mBio, 5, e01383-14, https://doi.org/10.1128/mBio.01383-14, 2014.
Maavara, T., Lauerwald, R., Laruelle, G. G., Akbarzadeh, Z., Bouskill, N. J., Van Cappellen, P., and Regnier, P.: Nitrous oxide emissions from inland waters: Are IPCC estimates too high?, Global Change Biol., 25, 473–488, https://doi.org/10.1111/gcb.14504, 2019.
Madsen, H. B.: Kompendium i jordbundsgeografi, 1987.
Marzadri, A., Amatulli, G., Tonina, D., Bellin, A., Shen, L. Q., Allen, G. H., and Raymond, P. A.: Global riverine nitrous oxide emissions: The role of small streams and large rivers, Sci. Total Environ., 776, 145148, https://doi.org/10.1016/j.scitotenv.2021.145148, 2021.
Mulholland, P. J., Helton, A. M., Poole, G. C., Hall, R. O., Hamilton, S. K., Peterson, B. J., Tank, J. L., Ashkenas, L. R., Cooper, L. W., Dahm, C. N., Dodds, W. K., Findlay, S. E. G., Gregory, S. V., Grimm, N. B., Johnson, S. L., McDowell, W. H., Meyer, J. L., Valett, H. M., Webster, J. R., Arango, C. P., Beaulieu, J. J., Bernot, M. J., Burgin, A. J., Crenshaw, C. L., Johnson, L. T., Niederlehner, B. R., O'Brien, J. M., Potter, J. D., Sheibley, R. W., Sobota, D. J., and Thomas, S. M.: Stream denitrification across biomes and its response to anthropogenic nitrate loading, Nature, 452, 202–205, https://doi.org/10.1038/nature06686, 2008.
Mwanake, R. M., Gettel, G. M., Wangari, E. G., Butterbach-Bahl, K., and Kiese, R.: Interactive effects of catchment mean water residence time and agricultural area on water physico-chemical variables and GHG saturations in headwater streams, Frontiers in Water, 5, https://doi.org/10.3389/frwa.2023.1220544, 2023.
Mwanake, R. M., Gettel, G. M., Wangari, E. G., Macharia, G. W., Martínez-Cuesta, R., Schulz, S., Schloter, M., Butterbach-Bahl, K., and Kiese, R.: Elevated In-Stream CO2 Concentration Stimulates Net-N2O Production from Global Fluvial Ecosystems, Water Research, 287, 124320, https://doi.org/10.2139/ssrn.5176087, 2025.
Nielsen, K., Stjernholm, M., Olsen, B. Ø., Müller-Wohlfeil, D.-I., Madsen, I.-L., Kjeldgaard, A., Groom, G., Hansen, H. S., Rolev, A. M., and Hermansen, B.: Areal informations systemet-AIS, ISBN 87-7772-567-0, 2000.
Olaya-Abril, A., Hidalgo-Carrillo, J., Luque-Almagro, V. M., Fuentes-Almagro, C., Urbano, F. J., Moreno-Vivián, C., Richardson, D. J., and Roldán, M. D.: Effect of pH on the denitrification proteome of the soil bacterium Paracoccus denitrificans PD1222, Sci. Rep., 11, 17276, https://doi.org/10.1038/s41598-021-96559-2, 2021.
Peterse, I., Carstensen, M. V., Seelen, A.-M., Lücker, S., Audet, J., and Veraart, A. J.: Microbial N2O and CH4 cycling in streams respond differently to land use and low pH, FEMS Microbiol. Ecol., submitted, 2026.
Petersen, S. O., Hoffmann, C. C., Schäfer, C.-M., Blicher-Mathiesen, G., Elsgaard, L., Kristensen, K., Larsen, S. E., Torp, S. B., and Greve, M. H.: Annual emissions of CH4 and N2O, and ecosystem respiration, from eight organic soils in Western Denmark managed by agriculture, Biogeosciences, 9, 403–422, https://doi.org/10.5194/bg-9-403-2012, 2012.
Qiu, Y., Zhang, Y., Zhang, K., Xu, X., Zhao, Y., Bai, T., Zhao, Y., Wang, H., Sheng, X., Bloszies, S., Gillespie, C. J., He, T., Wang, Y., Chen, H., Guo, L., Song, H., Ye, C., Wang, Y., Woodley, A., Guo, J., Cheng, L., Bai, Y., Zhu, Y., Hallin, S., Firestone, M. K., and Hu, S.: Intermediate soil acidification induces highest nitrous oxide emissions, Nat. Commun., 15, 2695, https://doi.org/10.1038/s41467-024-46931-3, 2024.
Quick, A. M., Reeder, W. J., Farrell, T. B., Tonina, D., Feris, K. P., and Benner, S. G.: Nitrous oxide from streams and rivers: A review of primary biogeochemical pathways and environmental variables, Earth-Sci. Rev., 191, 224–262, https://doi.org/10.1016/j.earscirev.2019.02.021, 2019.
R Core Team: R: A Language and Environment for Statistical Computing, Vienna, Austria: R Foundation for Statistical Computing, https://www.R-project.org/ (last access: August 2025), 2025.
Ravishankara, A. R., Daniel, J. S., and Portmann, R. W.: Nitrous oxide (N2O): the dominant ozone-depleting substance emitted in the 21st century, Science, 326, 123–125, https://doi.org/10.1126/science.1176985, 2009.
Reay, D. S., Smith, K. A., and Edwards, A. C.: Nitrous oxide emission from agricultural drainage waters, Global Change Biol., 9, 195–203, https://doi.org/10.1046/j.1365-2486.2003.00584.x, 2003.
Rosamond, M. S., Thuss, S. J., and Schiff, S. L.: Dependence of riverine nitrous oxide emissions on dissolved oxygen levels, Nat. Geosci., 5, 715–718, https://doi.org/10.1038/ngeo1556, 2012.
Seitzinger, S. P. and Kroeze, C.: Global distribution of nitrous oxide production and N inputs in freshwater and coastal marine ecosystems, Global Biogeochem. Cy., 12, 93–113, https://doi.org/10.1029/97GB03657, 1998.
Silverthorn, T., Audet, J., Evans, C. D., van der Knaap, J., Kosten, S., Paranaíba, J., Struik, Q., Webb, J., Wu, W., Yan, Z., and Peacock, M.: The Importance of Ditches and Canals in Global Inland Water CO2 and N2O Budgets, Global Change Biol., 31, e70079, https://doi.org/10.1111/gcb.70079, 2025.
Šimek, M. and Cooper, J. E.: The influence of soil pH on denitrification: progress towards the understanding of this interaction over the last 50 years, Eur. J. Soil Sci., 53, 345–354, https://doi.org/10.1046/j.1365-2389.2002.00461.x, 2002.
Stow, C. A., Walker, J. T., Cardoch, L., Spence, P., and Geron, C.: N2O Emissions from Streams in the Neuse River Watershed, North Carolina, Environ. Sci. Technol., 39, 6999–7004, https://doi.org/10.1021/es0500355, 2005.
Thodsen, H., Kjær, C., Tornbjerg, H., Rolighed, J., Larsen, S. E., and Blicher-Mathiesen, G.: Vandløb 2022, Aarhus Universitet, DCE – Nationalt Center for Environment og Energy, ISBN 978-87-7156-849-3, 2024.
Tonina, D., Marzadri, A., Bellin, A., Dee, M. M., Bernal, S., and Tank, J. L.: Nitrous Oxide Emissions From Drying Streams and Rivers, Geophys. Res. Lett., 48, e2021GL095305, https://doi.org/10.1029/2021GL095305, 2021.
von der Heide, C., Böttcher, J., Deurer, M., Weymann, D., Well, R., and Duijnisveld, W. H. M.: Spatial variability of N2O concentrations and of denitrification-related factors in the surficial groundwater of a catchment in Northern Germany, J. Hydrol., 360, 230–241, https://doi.org/10.1016/j.jhydrol.2008.07.034, 2008.
Wankel, S. D., Ziebis, W., Buchwald, C., Charoenpong, C., de Beer, D., Dentinger, J., Xu, Z., and Zengler, K.: Evidence for fungal and chemodenitrification based N2O flux from nitrogen impacted coastal sediments, Nat. Commun., 8, 15595, https://doi.org/10.1038/ncomms15595, 2017.
Webb, J. R., Hayes, N. M., Simpson, G. L., Leavitt, P. R., Baulch, H. M., and Finlay, K.: Widespread nitrous oxide undersaturation in farm waterbodies creates an unexpected greenhouse gas sink, Proc. Natl. A. Sci. USA, 116, 9814–9819, https://doi.org/10.1073/pnas.1820389116, 2019.
Weiss, R. F. and Price, B. A.: Nitrous‐oxide solubility in water and seawater, Mar. Chem., 8, 347–359, https://doi.org/10.1016/0304-4203(80)90024-9, 1980.
Wetzel, R. G.: Limnology: Lake and River Ecosystems, San Diego, San Francisco, New York, Boston, London, Sydney, Tokyo, ISBN 978-0127447605, 2001.
Wrage, N., Velthof, G. L., van Beusichem, M. L., and Oenema, O.: Role of nitrifier denitrification in the production of nitrous oxide, Soil Biol. Biochem., 33, 1723–1732, https://doi.org/10.1016/S0038-0717(01)00096-7, 2001.
Yao, Y., Tian, H., Shi, H., Pan, S., Xu, R., Pan, N., and Canadell, J. G.: Increased global nitrous oxide emissions from streams and rivers in the Anthropocene, Nat. Clim. Change, 10, 138–142, https://doi.org/10.1038/s41558-019-0665-8, 2020.
Zhu-Barker, X., Cavazos, A. R., Ostrom, N. E., Horwath, W. R., and Glass, J. B.: The importance of abiotic reactions for nitrous oxide production, Biogeochemistry, 126, 251–267, https://doi.org/10.1007/s10533-015-0166-4, 2015.
Zuur, A. F., Leno, E. N., Walker, N., Savelie, A. A., and Smith, G. M.: Mixed Effects Models and Extensions in Ecology with R, Statistics for Biology and Health, Springer New York, NY, XXII, 574 pp., https://doi.org/10.1007/978-0-387-87458-6, 2009.