
the Creative Commons Attribution 4.0 License.
the Creative Commons Attribution 4.0 License.
 | 06 Nov 2026
Riverine organic matter dynamics in the headwaters of the Yellow River under climate change

Jie Wang
Tianqing Ren
Jun Zhou
Alpine headwater streams play a crucial role in the global carbon cycle and are particularly sensitive to climate change. Riverine organic matter (ROM) mediates the transport and transformation of terrestrial carbon across aquatic systems. However, how ROM responds to climate change in the headwaters of the Qinghai-Tibetan Plateau (QTP) remains poorly understood, largely owing to a lack of long-term, high-spatial-resolution in-situ measurements. In this study, we used machine learning models combining satellite data and geographical variables to reconstruct historical variations in Chemical Oxygen Demand (CODMn, a proxy for ROM) along the Yellow River's Headstream (YRHS), and to predict future changes under typical Shared Socioeconomic Pathways. The results indicate that CODMn levels in the midstream region of the YRHS, characterized by greater precipitation, higher soil organic matter, and denser vegetation, were relatively high (2.73 ± 1.63 mg L−1) and exhibited an increasing trend (0.58 mg L−1) over the past decade. Driven primarily by increasing precipitation and temperature, CODMn levels are projected to rise in upstream and downstream areas but decline at midstream sites under SSP126, SSP245, and SSP585 by 2100. The annual export of riverine organic matter from the midstream of the YRHS is expected to remain stable by 2100. Therefore, our findings identify the midstream region of the YRHS as a critical and climate-sensitive region for organic matter dynamics. Though our study provides a comprehensive understanding of how climate change is reshaping riverine organic matter dynamics, substantial uncertainties remain in the future riverine organic matter changes owing to the complex interactions among precipitation, warming, hydrology and their combined effects on carbon cycles in alpine catchments.
- Article
(8489 KB) - Full-text XML
-
Supplement
(1238 KB) - BibTeX
- EndNote


Alpine regions represent some of the most vulnerable ecosystems to climate change, experiencing temperature increases nearly twice the global average (Kotlarski et al., 2023; Aryal and Pokhrel, 2025). Among them, the Qinghai–Tibetan Plateau (QTP), often referred to as the “Third Pole”, is the highest and one of the most climate-sensitive regions on Earth (Chen et al., 2022; Wang et al., 2023). In recent decades, the accelerated warming has triggered widespread environmental changes on the QTP, which are expected to significantly alter the sources, forms, and fluxes of carbon exports associated with permafrost degradation (Chen et al., 2022; Xu et al., 2024; Hong et al., 2025). Studies have shown that parts of the QTP have already shifted from carbon sinks to carbon sources and lateral transport of carbon has increased the riverine carbon fluxes on the QTP (Li et al., 2025c). Riverine organic matter (ROM) plays a pivotal role in the biogeochemical cycles of carbon (Hu et al., 2020; Giri, 2021; Regnier et al., 2022; Beusen et al., 2022), and the increase in ROM will pose threats to the water quality of rivers on the QTP. Despite growing concern regarding the ROM and its ecological consequences, our understanding of ROM dynamics across the QTP remains limited. Therefore, there is an urgent need for high spatial resolution and long-term observations of ROM dynamics and their exports on the QTP.
Headwater streams account for approximately 61 % of total riverine carbon efflux despite representing only 34 %–38 % of total stream surface area (Li et al., 2021). Over recent decades, climate change has substantially influenced the carbon dynamics of headstreams on the QTP (Yao et al., 2022; Li et al., 2025c). Long-term records show that the annual streamflow of headstreams in this region has generally increased over the past six decades (1962–2019) (Zhang et al., 2024). Warming and wetting trends have contributed to higher ROM in the headwaters (Xu et al., 2024). Furthermore, climate-induced changes have intensified sediment erosion and enhanced associated ROM transport processes across the QTP (Zhao et al., 2023; Li et al., 2024, 2025b). Nevertheless, fewer than 30 % of headstreams across the QTP are consistently monitored (Li et al., 2024), leaving the responses of ROM dynamics in headwaters to climate change poorly constrained.
The limited understanding of ROM dynamics in alpine headwaters is largely due to the scarcity of long-term, continuous in-situ measurements, where data collection remains logistically challenging. In recent years, advances in remote sensing and machine learning have provided powerful alternatives for addressing these limitations, offering new opportunities to predict water quality and infer nutrient-related parameters across extensive spatial and temporal scales (Adegun et al., 2023; Zeng et al., 2023; Zhi et al., 2024). Satellite-derived indices such as reflectance ratios, the Normalized Difference Chlorophyll Index (NDCI), the Suspended Sediment Index (SSI), etc., have been increasingly employed to assess riverine organic matter, particularly when integrated with machine learning algorithms (Liu et al., 2021; Deng et al., 2024; Yan et al., 2025). Consequently, integrating remote sensing data with in-situ measurements and machine learning holds significant potential for improving our understanding of ROM in headwaters and their responses to ongoing climate change.
The Yellow River's headstream (YRHS), located on the eastern QTP, constitute a crucial component of QTP's water resources and carbon cycling systems and have undergone substantial environmental changes in recent decades (Wen et al., 2024). Current study indicated that approximately 35 % of the Yellow River's source region serves as a net carbon source, and the lateral transport of carbon accounts for 31 % of net ecosystem production in the Yellow River's source region (Li et al., 2025c). The YRHS lies in a transition zone between permafrost and seasonally frozen ground, where climate warming has driven substantial permafrost degradation and triggered a cascade of environmental and ecological issues (Yang et al., 2023). While riverine organic matter dynamics have been extensively studied across the Yellow River Basin (Deng et al., 2025; Lan et al., 2025), the long-term and projected trajectories of ROM in its headwater region have received little attention, which is largely attributable to limited monitoring network coverage in this region. Therefore, given the critical role of the Yellow River headwaters in carbon cycling and downstream water quality and its sensitivity to climate change, there is an urgent need to investigate the dynamics of riverine organic matter in the headwaters of the Yellow River under climate change.
According to previous studies, ROM was estimated using the permanganate index (CODMn) as a proxy across China (Jiao et al., 2021; Lv et al., 2024; Wang et al., 2025b; Shang et al., 2026), and significant linear relationships exist between CODMn and dissolved organic carbon across various aquatic environments (Shang et al., 2026; Wang et al., 2026). Therefore, CODMn can be used as a proxy for riverine organic matter in the alpine study area. Accordingly, in this study, we focus on the source region of the Yellow River to develop CODMn predictive models by combining in situ water quality observations with satellite reflectance data and to assess future changes under the SSP126, SSP245, and SSP585 scenarios. The objectives are to: (1) quantify the decadal variability of CODMn in the headstreams of the Yellow River and identify its driving factors; (2) predict future changes in CODMn under projected climate change scenarios; and (3) estimate CODMn exports and assess their potential impacts on downstream ecosystems. This study aims to provide a comprehensive and scalable understanding of how climate change is reshaping riverine organic matter dynamics within one of the world's most critical headwater regions.
2.1 Study area
The source region of the Yellow River is situated in the eastern QTP (Fig. 1a), covering approximately 133 000 km2, with elevations ranging from 2650 to 6250 m. The mean annual temperature in this area ranges between −3.5 and 7.5 °C. The annual average precipitation in this area ranges from 420 to 705 mm, with the highest values occurring in the midstream region (Yang et al., 2023). The dominant land cover consists of alpine meadows and alpine steppes (Fig. S1). The area covers extensive permafrost and seasonally frozen ground, together covering more than 85 % of the region (Li et al., 2025e; Yang et al., 2025). Under the combined influence of climate warming and anthropogenic disturbances, permafrost in the upper reaches of the Yellow River source region has shown a significant trend of degradation in recent decades (Yang et al., 2023). The headwater region of the Yellow River (defined as upstream Xunhua (M4) in this study, which is located on the edge of the Tibetan Plateau) contains a dense network of tributaries with annual average discharge of 1.85 × 10¹⁰ m3 during 1987–2016. Because damming affects the hydrology downstream of Tangnaihai (M2), the discharge at M2 is considered representative of the study area's natural discharge in our study. Within the national surface water quality monitoring network, four sites (M1–M4, Maqu, Tangnaihai, Longyangxia, and Xunhua) are situated at the headwaters of the Yellow River (Fig. 1b). In this study, the upstream (source to Deang), midstream (Deang to Longwu), and downstream sections (Longwu to Xunhua) of the Yellow River's source region are divided based on their geographical characteristics and are labeled B1(source-C1), B2 (C1–C2), and B3 (C2–C3) (Fig. 1).
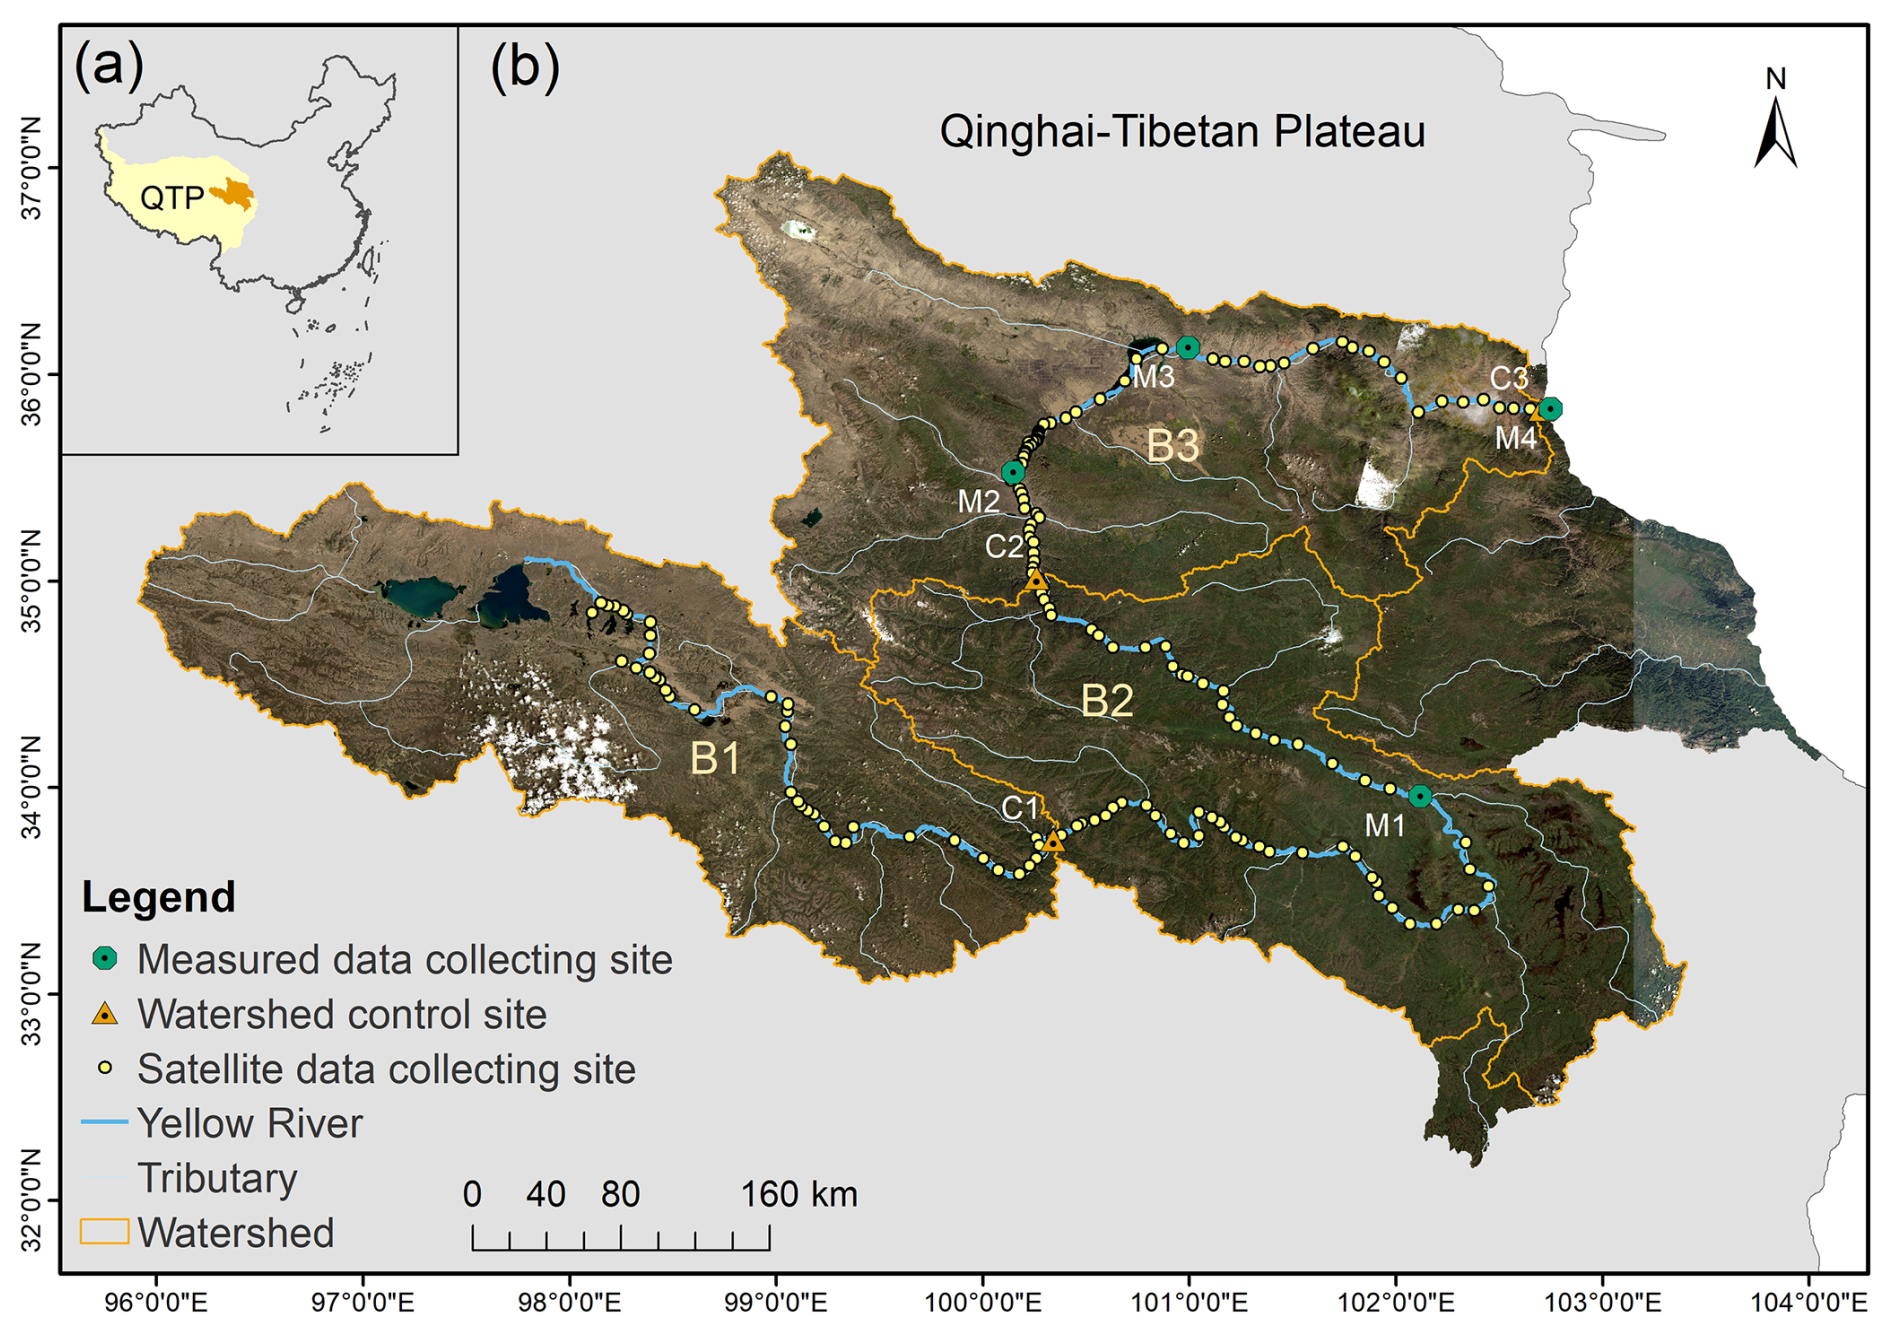
Figure 1Location of the source region of the Yellow River (a), river network within the study area and data collection sites along the mainstream of the Yellow River (b). B1–B3 represent the upstream (source-C1), midstream (C1–C2), and downstream (C2–C3) region of the Yellow River's headstream in this study. A total of 160 monitoring sites span from downstream to upstream, with Site 1 located at the basin outlet. Image sources: USGS, Esri | Powered by Esri.
2.2 Data collection
2.2.1 In-situ water quality data
Riverine CODMn data for model training were obtained from 107 monitoring sites distributed across the QTP and surrounding regions (Fig. S2), including four sites (M1–M4) positioned along the mainstream of the Yellow River (Fig. 1b). CODMn data for each site was obtained from the China National Environmental Monitoring Centre (CNEMC; https://www.cnemc.cn/, last access: 4 September 2025) for the period 2021–2023. Measurements were performed every four hours (00:00, 04:00, 08:00, 12:00, 16:00, and 20:00). Following the “Environmental Quality Standards for Surface Water” (GB 3838–2002), CODMn was determined using the acidic potassium permanganate method, in which 50 mL water sample was oxidized by standardized KMnO4 solution under controlled heating conditions. After the reaction, the residual permanganate was titrated, and CODMn was calculated from the amount of KMnO4 consumed.
2.2.2 Satellite reflectance data
Surface reflectance data for model training was acquired for the 107 monitoring sites across the QTP and its surrounding areas from 2021 to 2023 using the Google Earth Engine (GEE) platform, based on Landsat-8 OLI/TIRS and Landsat-9 OLI-2/TIRS-2 imagery. For historical CODMn estimation in the source region of the Yellow River, surface reflectance data from Landsat-8/9 OLI/TIRS was also collected for 2014–2024 at 160 sites located at the headwater of the Yellow River (Fig. 1b). The Landsat-8/9 OLI datasets include five visible and near-infrared (VNIR) bands and two shortwave infrared (SWIR) bands. Atmospheric correction for Landsat-8/9 imagery was performed using the Land Surface Reflectance Code (LaSRC, v 1.5.0). Surface reflectance was extracted within a 90 m buffer around each site, and only pixels classified as water were retained. A minimum of 3 × 3 water pixels was required for a site–date matchup to be included. Pixels affected by clouds, cloud shadows, snow, ice, or non-water surfaces were removed based on the Landsat reflectance quality assessment bands.
2.2.3 Geographical feature data
Monthly precipitation and temperature data were obtained from the 1 km “Monthly Precipitation (Mean Temperature) Dataset for China” (1901–2024) (Peng, 2025a, b). Surface soil properties, including soil texture, pH, soil organic carbon, and bulk density, were extracted from the “Harmonized World Soil Database” (FAO and IIASA, 2019). Vegetation coverage data were sourced from the “China Regional 250 m Fractional Vegetation Cover Dataset” (2000–2024) (Gao et al., 2025). Land use data were derived from the “Land Use Dataset of China” (1980–2015) provided by the Resource and Environmental Science Data Center, Chinese Academy of Sciences. Human Activity Intensity Index (HAII) were obtained from the “Human Activity Intensity Dataset of the Qinghai–Tibet Plateau” (2000–2020) (Liu, 2023). The Human Activity Intensity Index was calculated based on key human activity data, including agricultural and animal husbandry practices, industrial and mining development, urbanization, tourism, major ecological engineering projects, and pollutant discharge. Digital Elevation Model (DEM) data were retrieved from https://viewfinderpanoramas.org, last access: 11 September 2025. Historical discharge data at C1, M1, M2 and M4 were compiled from multiple published sources (Wang, 2024; Liu et al., 2025), which are based on in-situ measurements from the same gauging network, and different sources were used to obtain complementary data. Future discharge projections were obtained from a single study and include the SSP126, SSP245, and SSP585 scenarios (Ma et al., 2023a).
Future monthly temperature and precipitation data with spatial resolution of 1 km in the Yellow River source region were obtained from climate projections (Hu et al., 2025). This data was generated and bias corrected under three Shared Socioeconomic Pathways (SSPs) aligned with climate scenarios: SSP126 (sustainability-focused, low radiative forcing), SSP245 (intermediate, moderate stabilization), and SSP585 (fossil-fueled development, high radiative forcing).
2.3 Model development for historical CODMn reconstruction
2.3.1 Matching measured CODMn with satellite reflectance
CODMn data and satellite reflectance data (Landsat-8 OLI/TIRS and Landsat-9 OLI-2/TIRS-2) acquired from 107 sites across the eastern QTP and adjacent regions during 2021–2023 were used for model development (Fig. S2). Since Landsat-8/9 overpasses the study region at approximately 10:30 local time, CODMn measurements obtained at 08:00 or 12:00 on the same day were paired with corresponding satellite scenes. When multiple valid matches were available, only the 12:00 CODMn measurement was retained to ensure temporal consistency. A total of 3048 valid CODMn–reflectance matchups were obtained for the 107 sites during 2021–2023. These matched datasets covered a broad CODMn concentration range (0.25–23.2 mg L−1) and were used to develop models for CODMn prediction.
2.3.2 Input and prediction variables of models
The 3048 valid CODMn–reflectance matchups were further processed to generate input variables. Input features included raw spectral bands and derived indices, with CODMn serving as the prediction variable. The raw spectral bands comprised Landsat-8/9 reflectance from Bands 1–7 and selected band ratios (SRnir SRred, SRred SRgreen and SRred SRblue). Additionally, several spectral indices known to be sensitive to organic matter were calculated (Table S1), namely the Normalized Difference Chlorophyll Index (NDCI), Organic Carbon Index (OC_Index), Normalized Suspended Material Index (NSMI), and Hue Angle (Yan et al., 2025). Longitude and latitude were also incorporated as input variables.
2.3.3 Model training
AutoGluon is an open-source automated machine learning (AutoML) framework that builds high-accuracy predictive models for tabular data through multi-layer model ensembling and stacking. AutoGluon's TabularPredictor was configured in regression mode and trained using multiple base learners (e.g., Gradient Boosting Machines, Random Forests, Neural Networks). The framework automatically optimized model selection, hyperparameters, and ensemble weights. Therefore, models for CODMn prediction were trained on Landsat-derived spectral features using AutoGluon-Tabular (v1.3.1) via its Python API in Python 3.8.3. The matched dataset (3048 pairs) described in Sect. 2.3.2 was randomly divided into training (80 %) and testing (20 %) subsets. A total training time limit of 600 s was assigned to ensure sufficient exploration of model configurations.
2.3.4 Model evaluation
Model performance was evaluated using the negative Root Mean Squared Error (RMSE) for both the validation and test datasets (Eqs. 1–2). Lower (i.e., closer-to-zero) test and validation scores indicated superior model performance. The performance metrics for all models are summarized in Table S2.
where, N denotes the size of the observations and yi and denote the in-situ values and satellite-retrieved values, respectively.
The importance of different input variables affecting the prediction of CODMn was also assessed based on the importance scores (Eq. 3).
where, M(⋅), model performance metric (e.g., accuracy, log-loss, RMSE); D, original evaluation dataset; , same dataset, but with feature fi randomly permuted; Importance (fi), drop in performance when fi is destroyed.
2.3.5 Reconstruct of historical CODMn
The model exhibiting the highest test and validation scores was applied to reconstruct CODMn concentrations at 160 sites located in the headwater region of the Yellow River from 2014 to 2024 using Landsat-8 surface reflectance data. To evaluate model applicability and reliability, the reconstructed CODMn concentrations were compared with in situ measurements at two representative headwater sites. Two sites (M2 and M3) with abundant matched simulated and in-situ observations were selected to demonstrate the model's site-specific accuracy using the Mean Absolute Percentage Difference (MAPD), RMSE, and Bias, following the approach of Yan et al. (2025). Historical CODMn trends between 2014 and 2024 were assessed using the Mann–Kendall test and quantified using Sen's slope.
2.4 Prediction of future CODMn and its changes in the headstream of the Yellow River
To predict future CODMn levels at 160 sites in the headwaters of the Yellow River, the machine learning approach was also employed to model the relationships between geographical variables and the satellite-based estimates of CODMn levels. Soil texture (sand, silt, clay), bulk density, soil organic carbon, soil pH, altitude, human activity intensity, vegetation cover, land use, and ten-year averages of annual mean precipitation and temperature for each site during 2014–2024 were used as input features, while the ten-year average CODMn concentration for each site during 2014–2024 served as the target variable. The best-performing model, selected based on test and validation scores, was then used to predict future CODMn concentrations, incorporating both static variables (e.g., soil properties, vegetation cover, land use) and dynamic variables (future annual mean precipitation and temperature), depending on data availability. The projected future CODMn was model-based scenario projections conditional on the spatial stationarity assumption rather than independently validated forecasts. Therefore, the selected model was used to learn the spatial relationships between geographical/environmental characteristics and Landsat-derived CODMn estimates, rather than directly learning an observed CODMn response. Satellite-based CODMn estimates, rather than directly observed CODMn measurements were used in this model, prediction uncertainty from the first-stage remote-sensing model can propagate into this model.
In order to predict the future CODMn using the trained model, future monthly temperature and precipitation data was collected from Hu et al. (2025). The bias correction was performed by using the delta change method (Sect. S1) to reconcile differences in temperature and precipitation data sources (Beyer et al., 2020; Cao et al., 2026). Future annual mean precipitation and temperature were then calculated for 2025–2040, 2041–2070, and 2071–2100, representing near-, mid-, and long-term horizons. Future CODMn changes in the Yellow River source region for 2025–2040, 2041–2070, and 2071–2100 under SSP126, SSP245, and SSP585 scenarios were calculated relative to the mean values from 2014–2024.
2.5 Calculation of CODMn and DOC flux
The CODMn flux in the source region of the Yellow River was calculated using Eq. (4):
where, F (Gg), nutrient export; Ci (mg L−1), CODMn concentration at site i; Qi (108 m3), river discharge at site i. The DOC flux was calculated from the DOC–CODMn relationship in rivers across China, expressed as 1.32F (Shang et al., 2026).
3.1 Performance of developed models
3.1.1 Predicting historical CODMn using Landsat reflectance data
A total of 24 models were developed and evaluated to predict CODMn levels from Landsat reflectance data, with test and validation scores summarized in Table S2. The LightGBMLarge model demonstrated the highest predictive accuracy for CODMn across the QTP and surrounding regions, achieving test and validation scores of −0.22 and −0.67, respectively. Predicted versus in-situ measured CODMn levels for 2021–2023 based on training dataset are shown in Fig. 2a, with RMSE and R2 of 0.33 mg L−1 and 0.93, respectively, indicating strong predictive performance.
The relative importance of input variables in the LightGBMLarge model was quantified using importance scores (Fig. 2b). The five most influential predictors were longitude, latitude, SRRed SRGreen, NSMI, and Band 1. Based on its performance, the LightGBMLarge model was selected to estimate historical CODMn levels in the source region of the Yellow River.
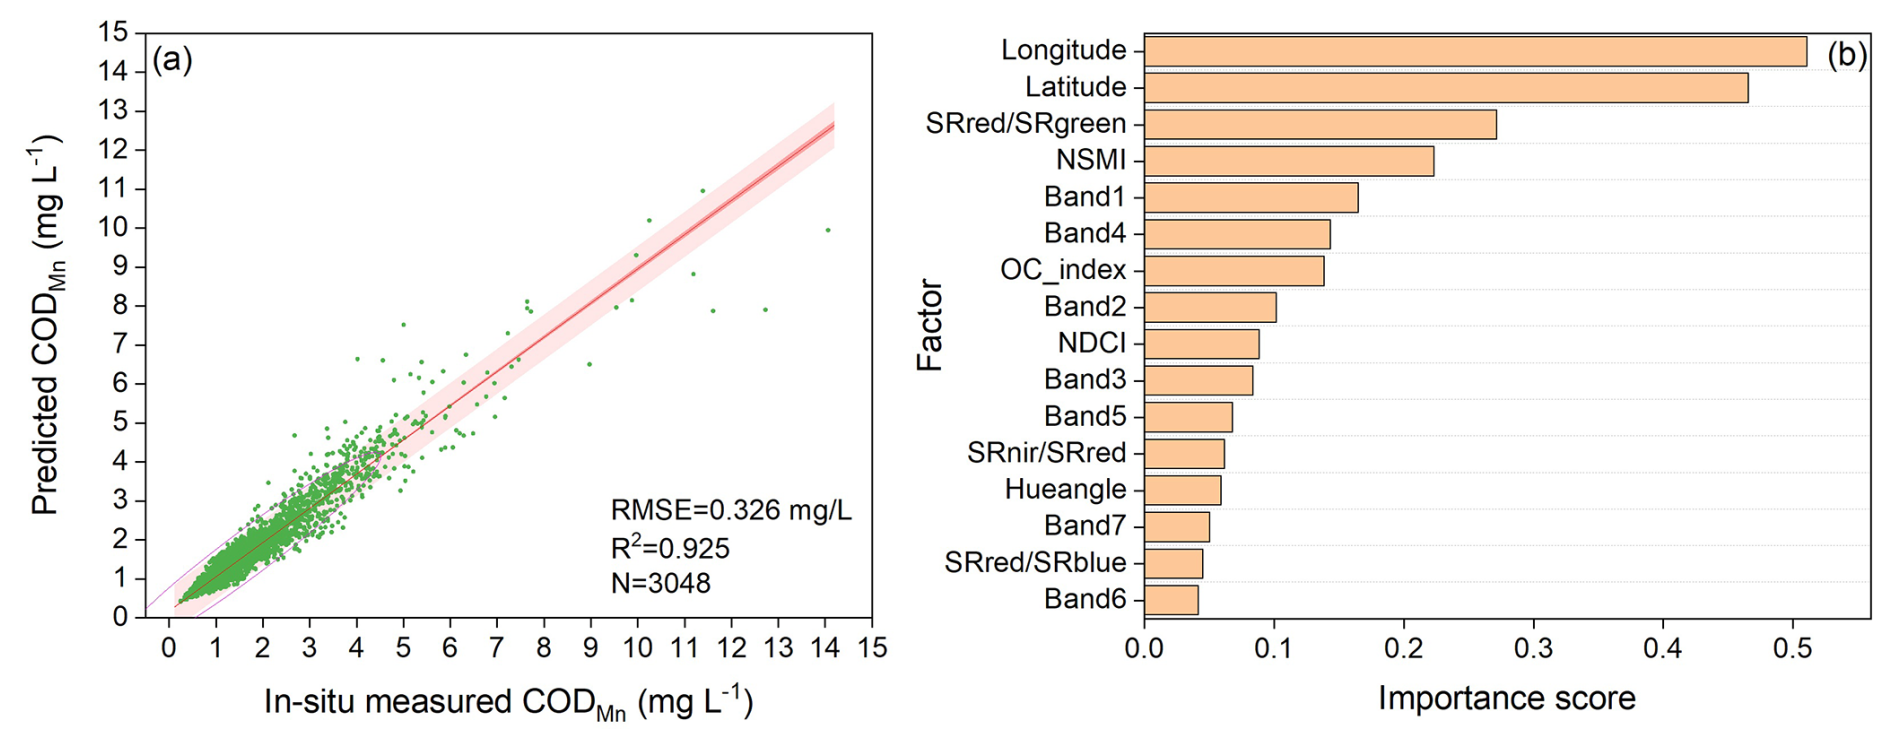
Figure 2Model performance for CODMn prediction based on training set using Landsat-8/9 reflectance data (a), and importance of input variables in CODMn prediction (b).
To present a clearer site-level model reliability, two representative sites (M2 and M3) in the Yellow River headwaters were used to compare modeled and in-situ CODMn time series (Fig. 3). The results indicate that the model can accurately capture both spatial and temporal variability of riverine CODMn in the headstreams of the Yellow River. At site M3, RMSE, MAPD, and Bias were 0.12 mg L−1, 8.16 %, and −2.38 %, respectively, and RMSE, MAPD, and Bias at site M2 were 0.58 mg L−1, 15.32 %, and −2.23 %, respectively.
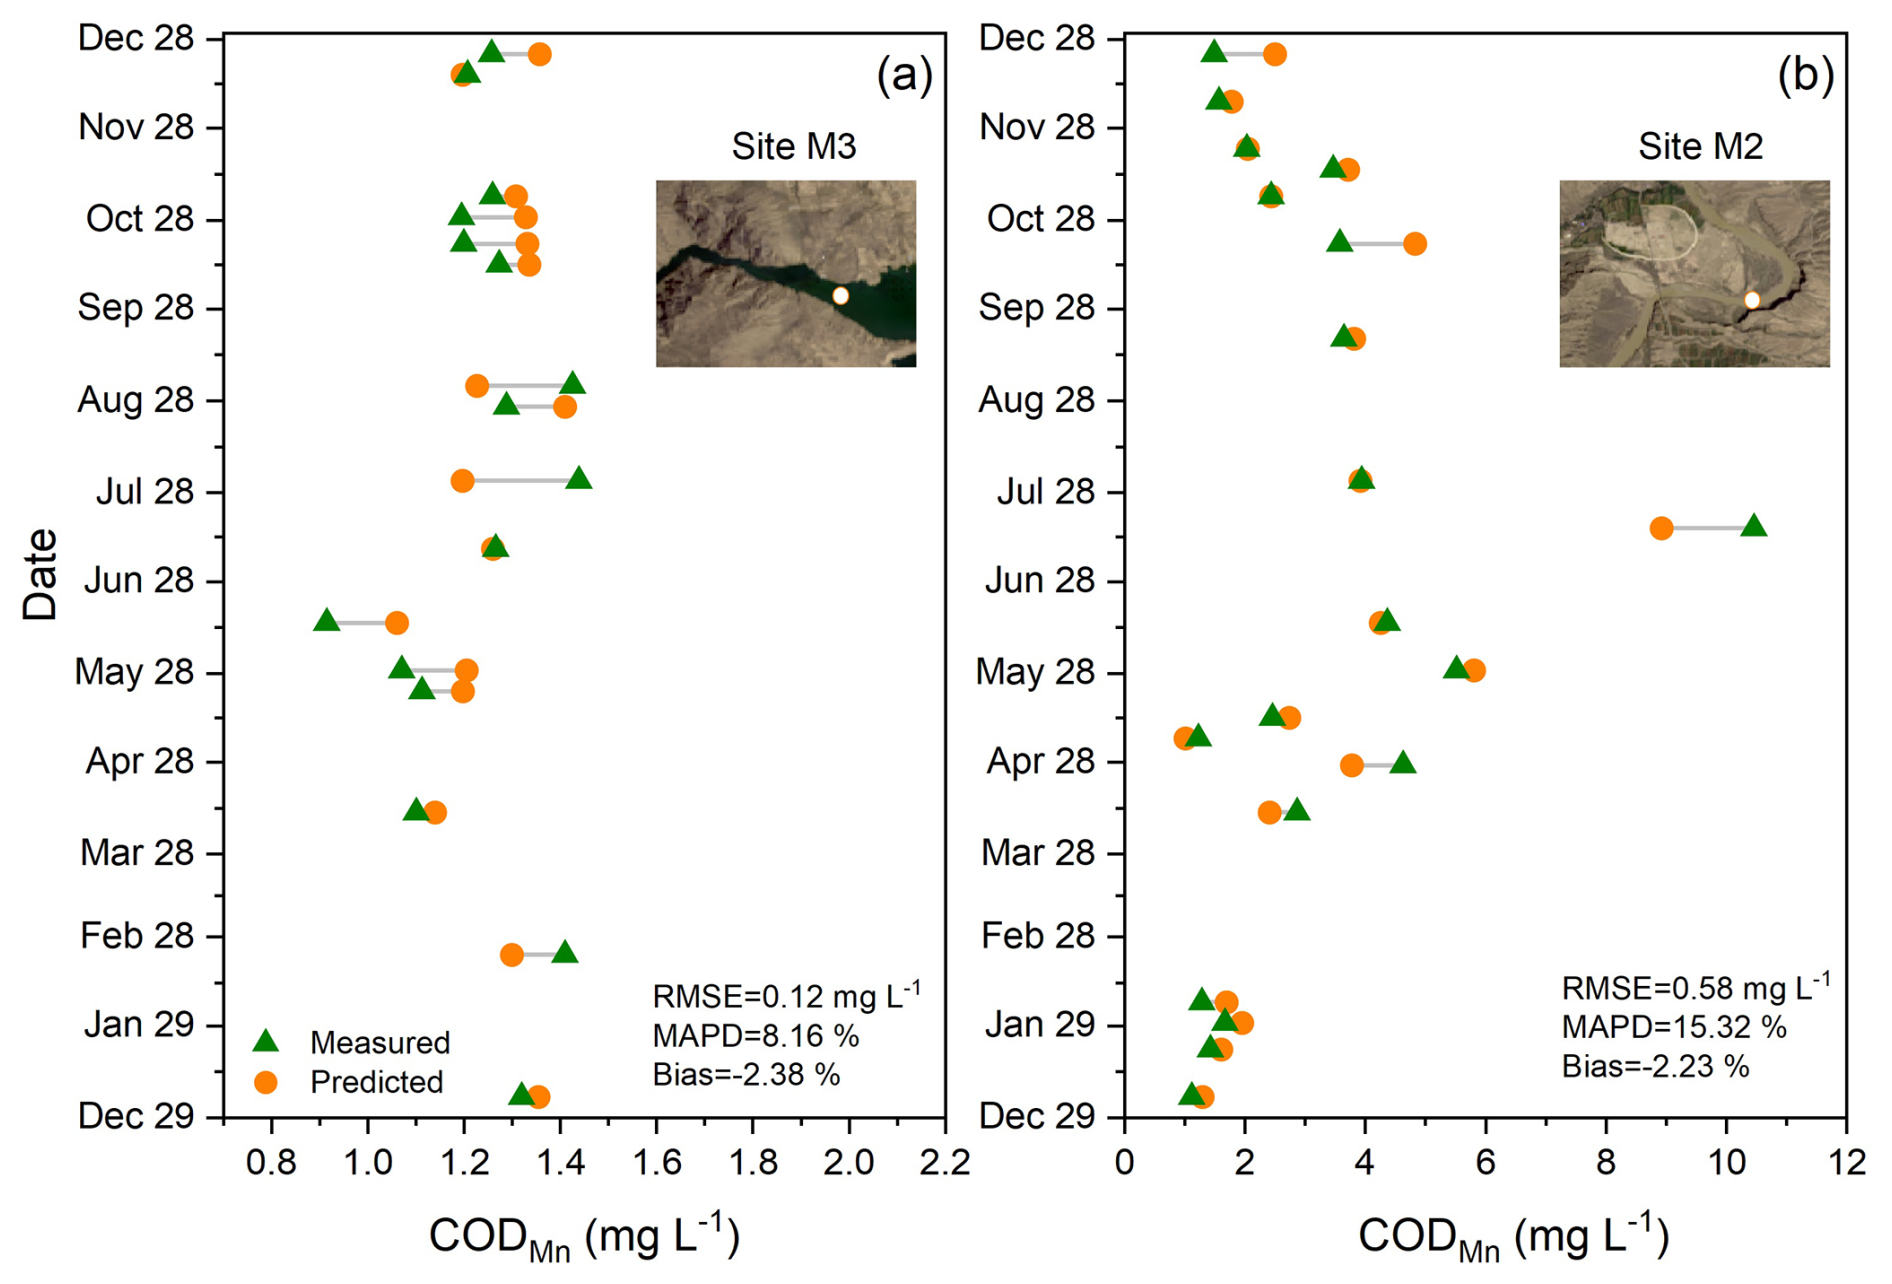
Figure 3Comparison between predicted and measured CODMn values in 2023 at sites M3 (a) and M2 (b) within the Yellow River source region. Image sources: USGS, Esri | Powered by Esri.
3.1.2 Prediction of future CODMn using geographical features
A total of 36 models for predicting future CODMn based on geographical features were evaluated (Table S3), and the LightGBMLarge model exhibited the highest performance, with test and validation scores of −0.08 and −0.26, respectively. Predicted versus satellite-based estimates of average CODMn levels based on the training dataset in the Yellow River source region are presented in Fig. 4a, achieving an R2 of 0.91 and an RMSE of 0.18 mg L−1, indicating strong predictive capability of this model. Analysis of feature importance revealed that altitude, precipitation, temperature, and vegetation contributed most significantly to CODMn variability in the study area (Fig. 4b).
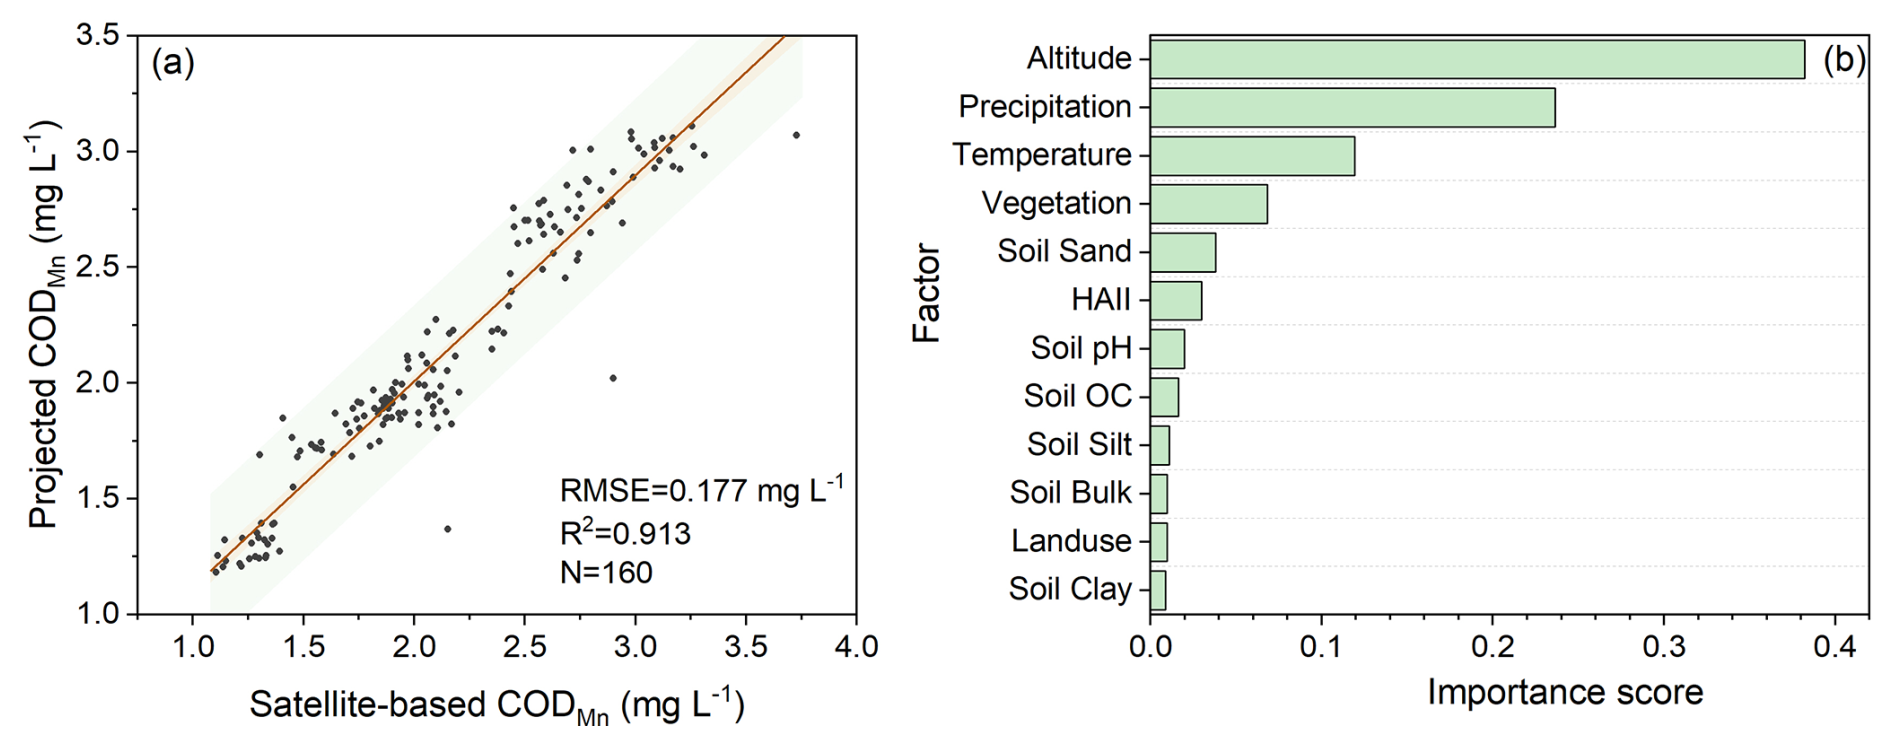
Figure 4Performance of the developed model for CODMn prediction based on the training set using geographical feature data (a), and importance of variables in the predictive model (b). HAII is Human Activity Intensity Index; Soil OC represents soil organic carbon; Soil Bulk is soil bulk density; Soil Sand, Clay and Silt are soil texture.
3.2 Spatiotemporal changes of CODMn in the headstream of the Yellow River
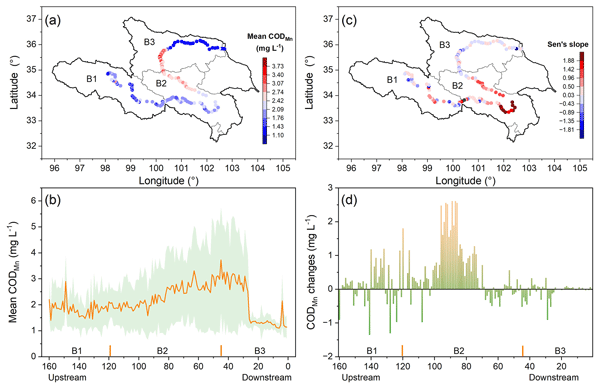
The developed model estimated an annual mean CODMn concentration of 2.14 ± 1.06 mg L−1 in the Yellow River source region from 2014 to 2024, with pronounced spatial variability. In the upstream area, the mean CODMn was 1.89 ± 0.81 mg L−1, while higher concentrations were observed in the mid-downstream region (2.73 ± 1.63 mg L−1). The downstream area, which includes large reservoirs such as Longyangxia and Lijiaxia, exhibited significantly lower CODMn levels (1.54 ± 0.50 mg L−1) (Fig. 5a, b).
Over the past decade, the midstream region showed a clear increasing trend in CODMn, with an average rise of 0.58 mg L−1 (Fig. 5c, d). In contrast, the upstream area exhibited both increasing and decreasing trends, with a mean change of 0.08 mg L−1, whereas CODMn concentrations in the downstream region remained relatively stable (mean change: −0.10 mg L−1). However, the historical CODMn trend was not statistically significant in the headwater region of the Yellow River (Fig. S3).
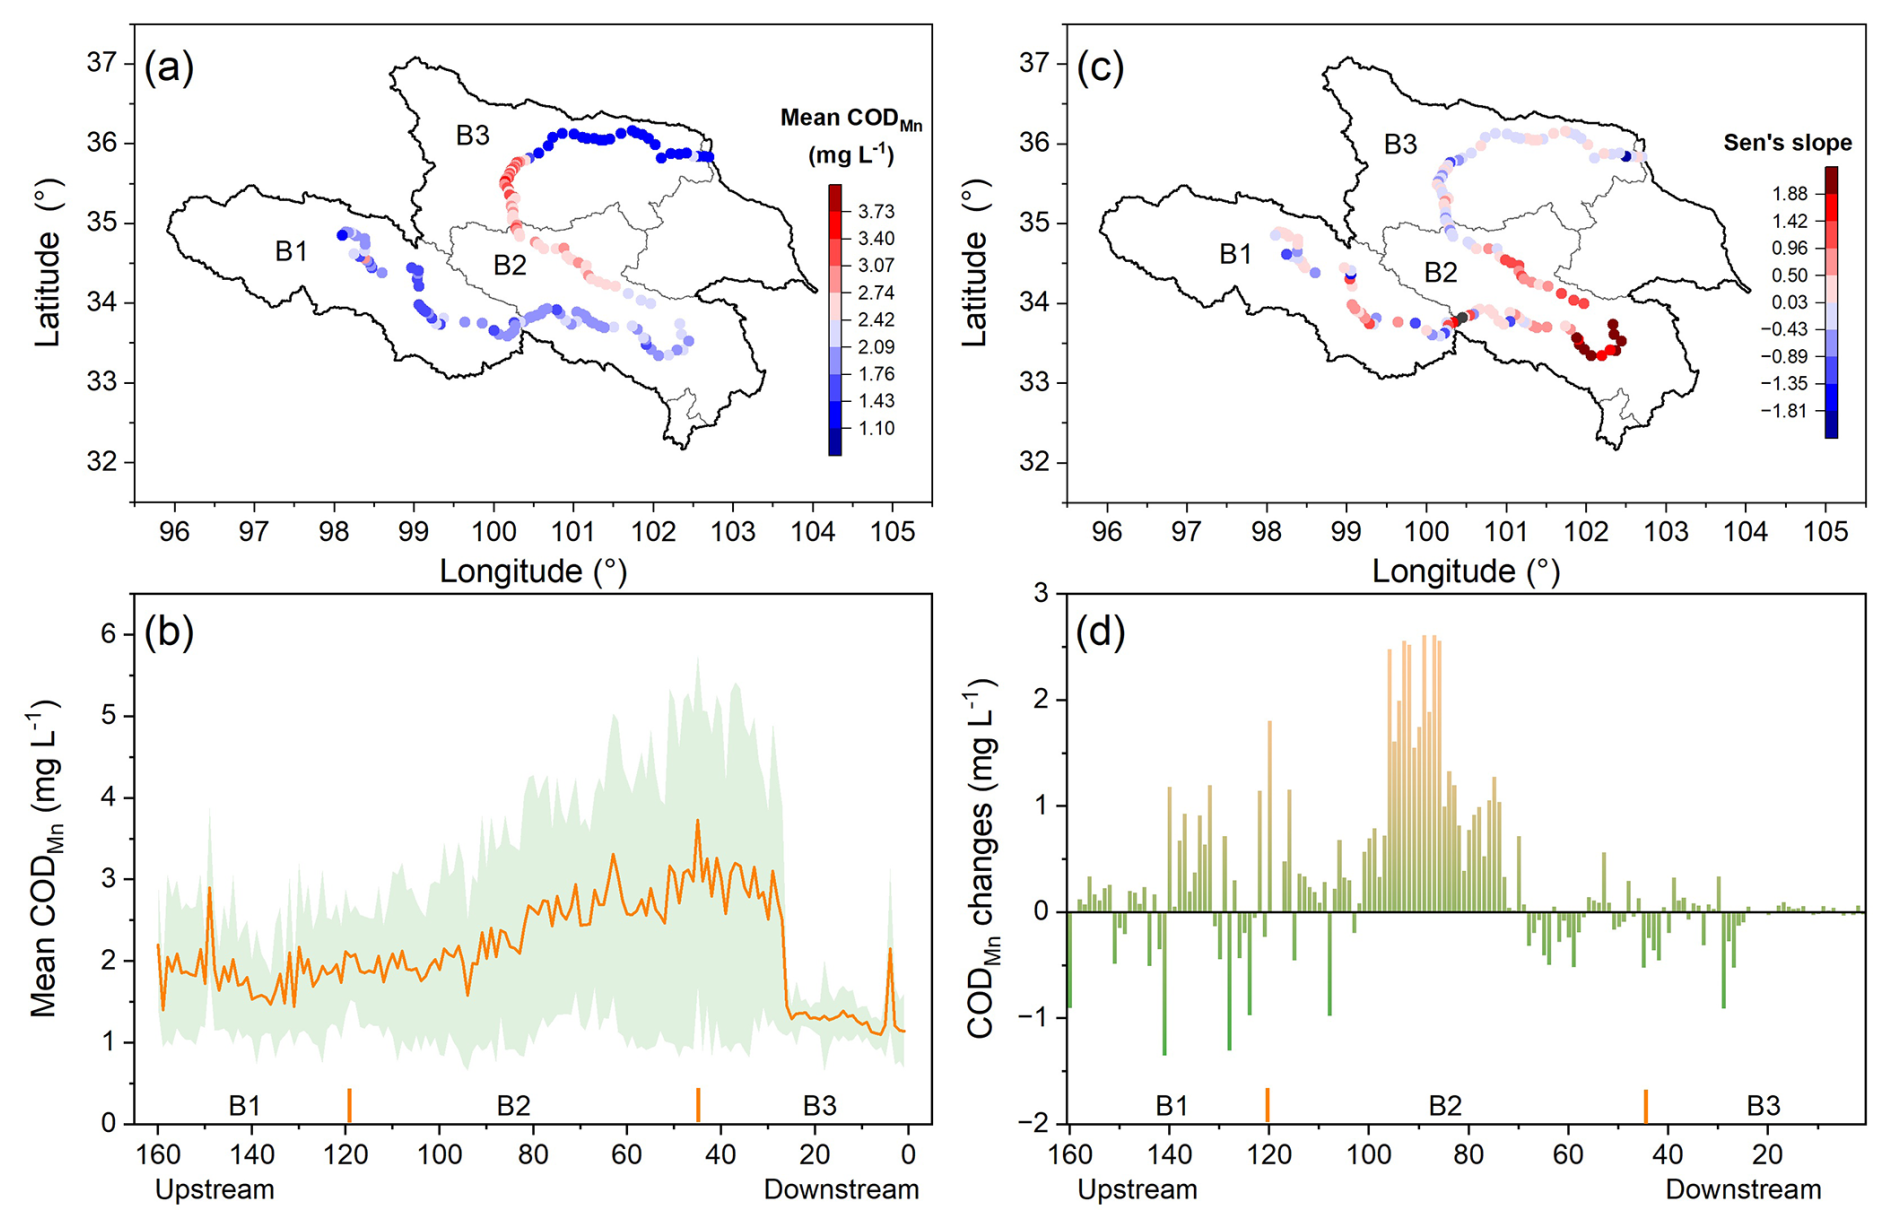
Figure 5Spatial variation of mean CODMn (a, b), Sen's slope per decade for historic CODMn trend (c), and CODMn changes during 2014–2024 (d) in the Yellow River source region. Historic CODMn trend during 2014–2024 was assessed using the Mann–Kendall test and quantified using Sen's slope (mg CODMn L−1 per decade).
Seasonal variations of CODMn were also evident during our study. Average monthly CODMn concentrations ranged from 0.8 to 8.0 mg L−1 (Fig. 6). The downstream site maintained low (0.8–2.4 mg L−1) and showed higher CODMn levels in summer (Fig. 6a), while the midstream site exhibited a pronounced increase from March, peaking in July (∼ 8 mg L−1), followed by a gradual decline (Fig. 6b). The upper–midstream site displayed two distinct peaks in late spring and summer, suggesting episodic organic inputs associated with ice melt and rainfall (Fig. 6c). Upstream sites remained low to moderate (1–3 mg L−1) with minimal seasonal variation (Fig. 6d).
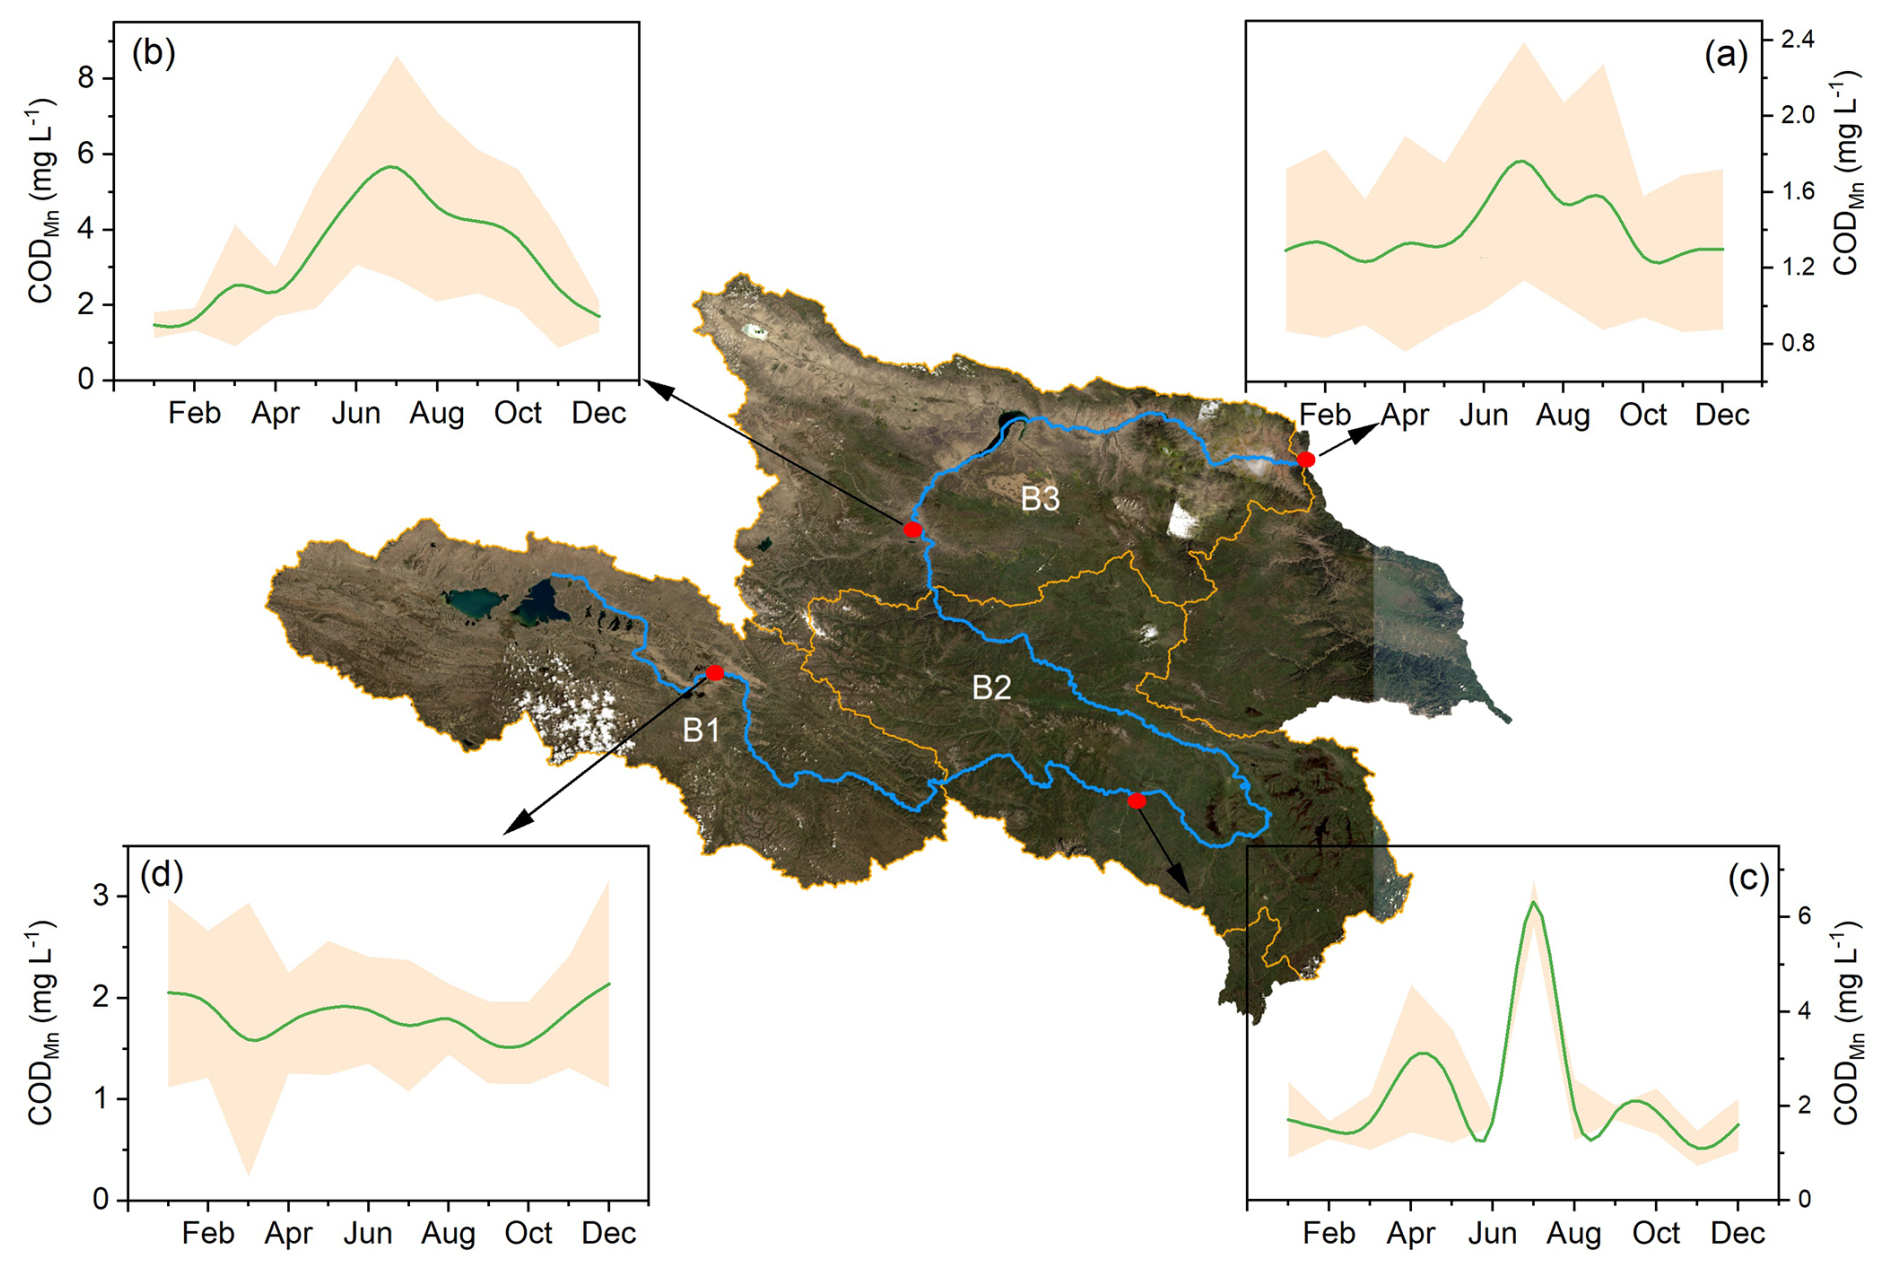
Figure 6Averaged monthly variations of CODMn during 2014–2024 within the Yellow River source region. Image sources: USGS, Esri | Powered by Esri.
3.3 Future climate and CODMn changes in the source region of the Yellow River
Across all scenarios and periods, precipitation exhibits a consistent spatial pattern, increasing from upstream reaches to a midstream maximum and subsequently decreasing toward downstream sections (Fig. 7a–c). This pattern is preserved under all SSPs, although the magnitude of precipitation varied among scenarios and time slices. Relative to current conditions, precipitation increases slightly in the midstream region under SSP126 and SSP245, particularly during the mid- and late-century periods. Under SSP585, precipitation displays enhanced increase, with higher midstream values during 2041–2070 and 2071–2100 and lower precipitation toward downstream reaches.
Compared with current conditions, future temperature rises across the entire study area (Fig. 7d–f), with the magnitude of warming increasing over time and from SSP126 to SSP585. Under SSP126, temperature increases are relatively moderate, whereas SSP245 shows stronger warming, especially during 2071–2100. The largest temperature increases occurred under SSP585, with pronounced downstream variability during the late-century period, resulting in an amplified longitudinal temperature gradient.
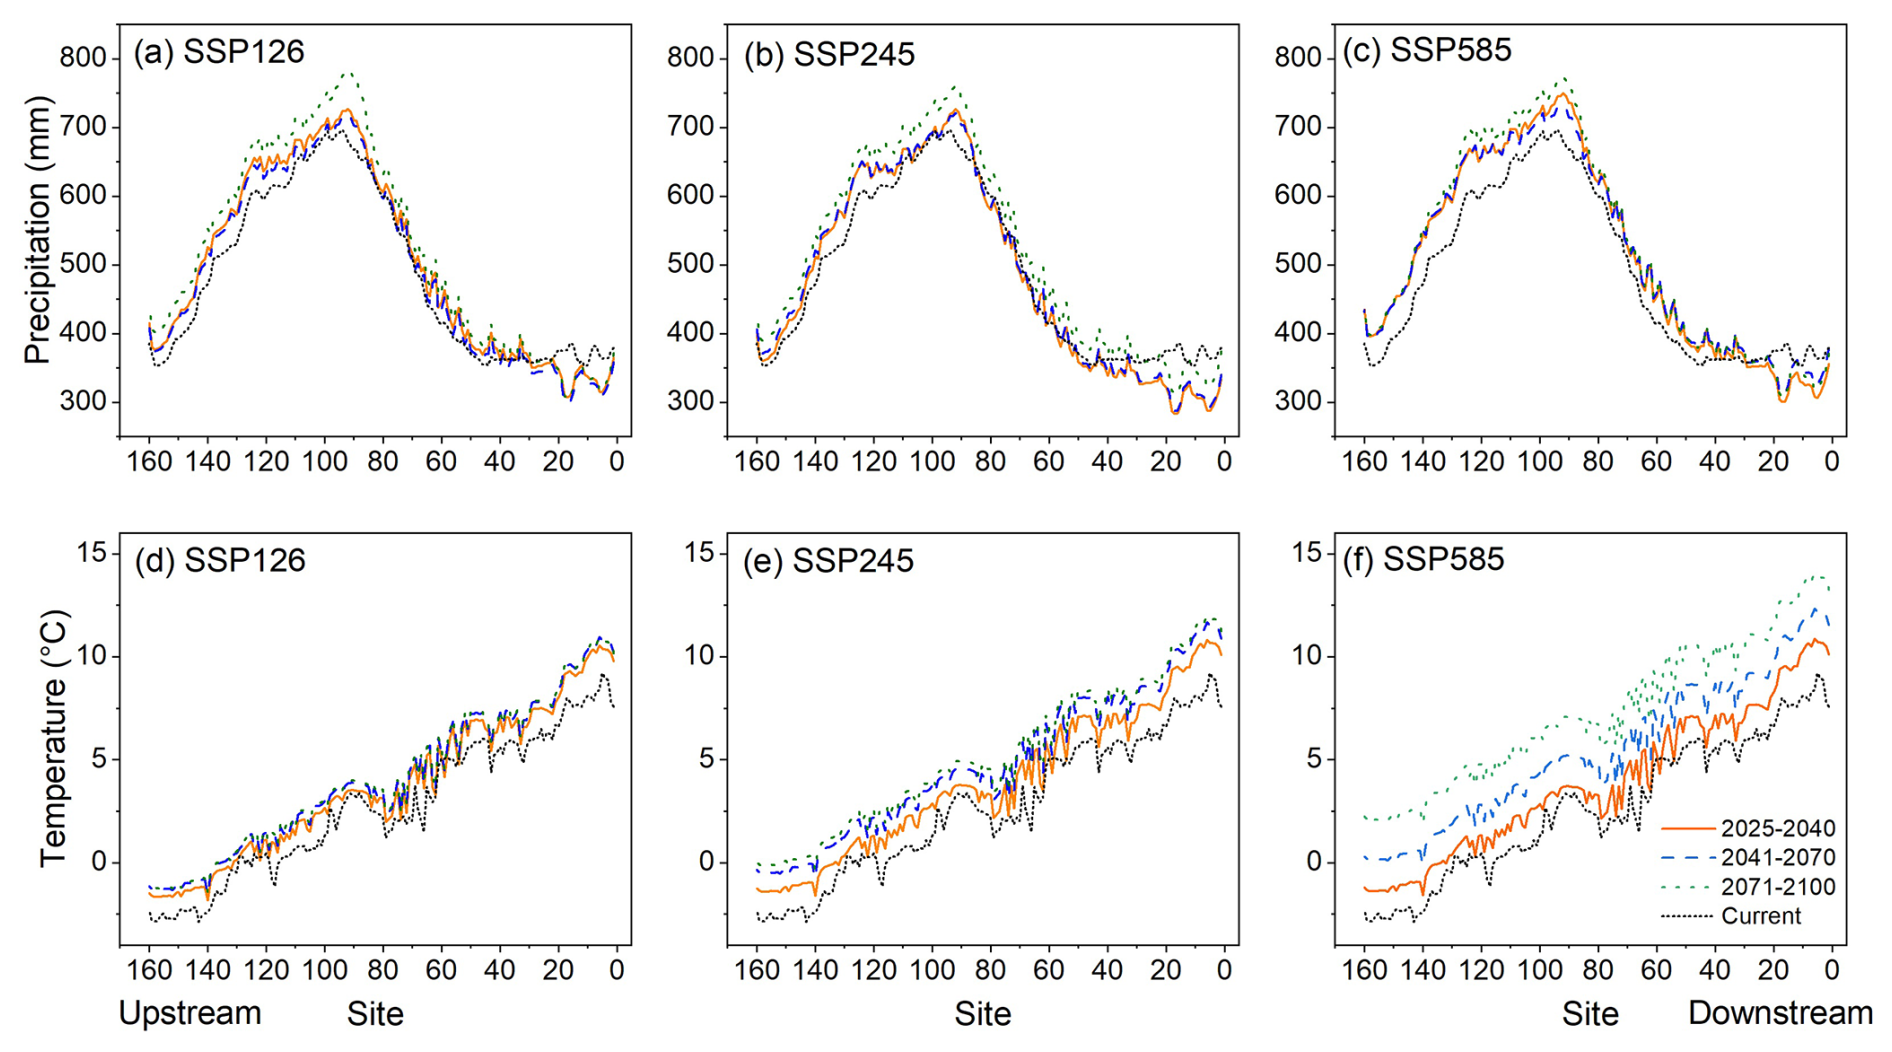
Figure 7Projected precipitation and temperature variations for 2025–2040, 2041–2070, and 2071–2100 under SSP126, SSP245, and SSP585 scenarios.
Projected changes in CODMn across the study area show pronounced spatial and temporal variability under all three scenarios (Fig. 8). During the near-term period (2025–2040), CODMn changes are generally modest, with most monitoring sites exhibiting values close to zero. In the mid-term period (2041–2070), the CODMn changes show an overall increase, with mean value of 0.05 mg L−1. Specifically, midstream sites more frequently experience decreases in CODMn, whereas upstream and downstream regions display a mixture of small increases and decreases. By the late-century period (2071–2100), the average change in CODMn is −0.01 mg L−1. CODMn shows a pronounced decrease trend in the midstream area (−0.12 mg L−1) under SSP585. Upstream and downstream areas show a higher occurrence of positive CODMn changes. Overall, CODMn shows a slight increasing trend across the three scenarios over different periods, with 877 positive changes (61 %) and 563 negative changes (39 %).
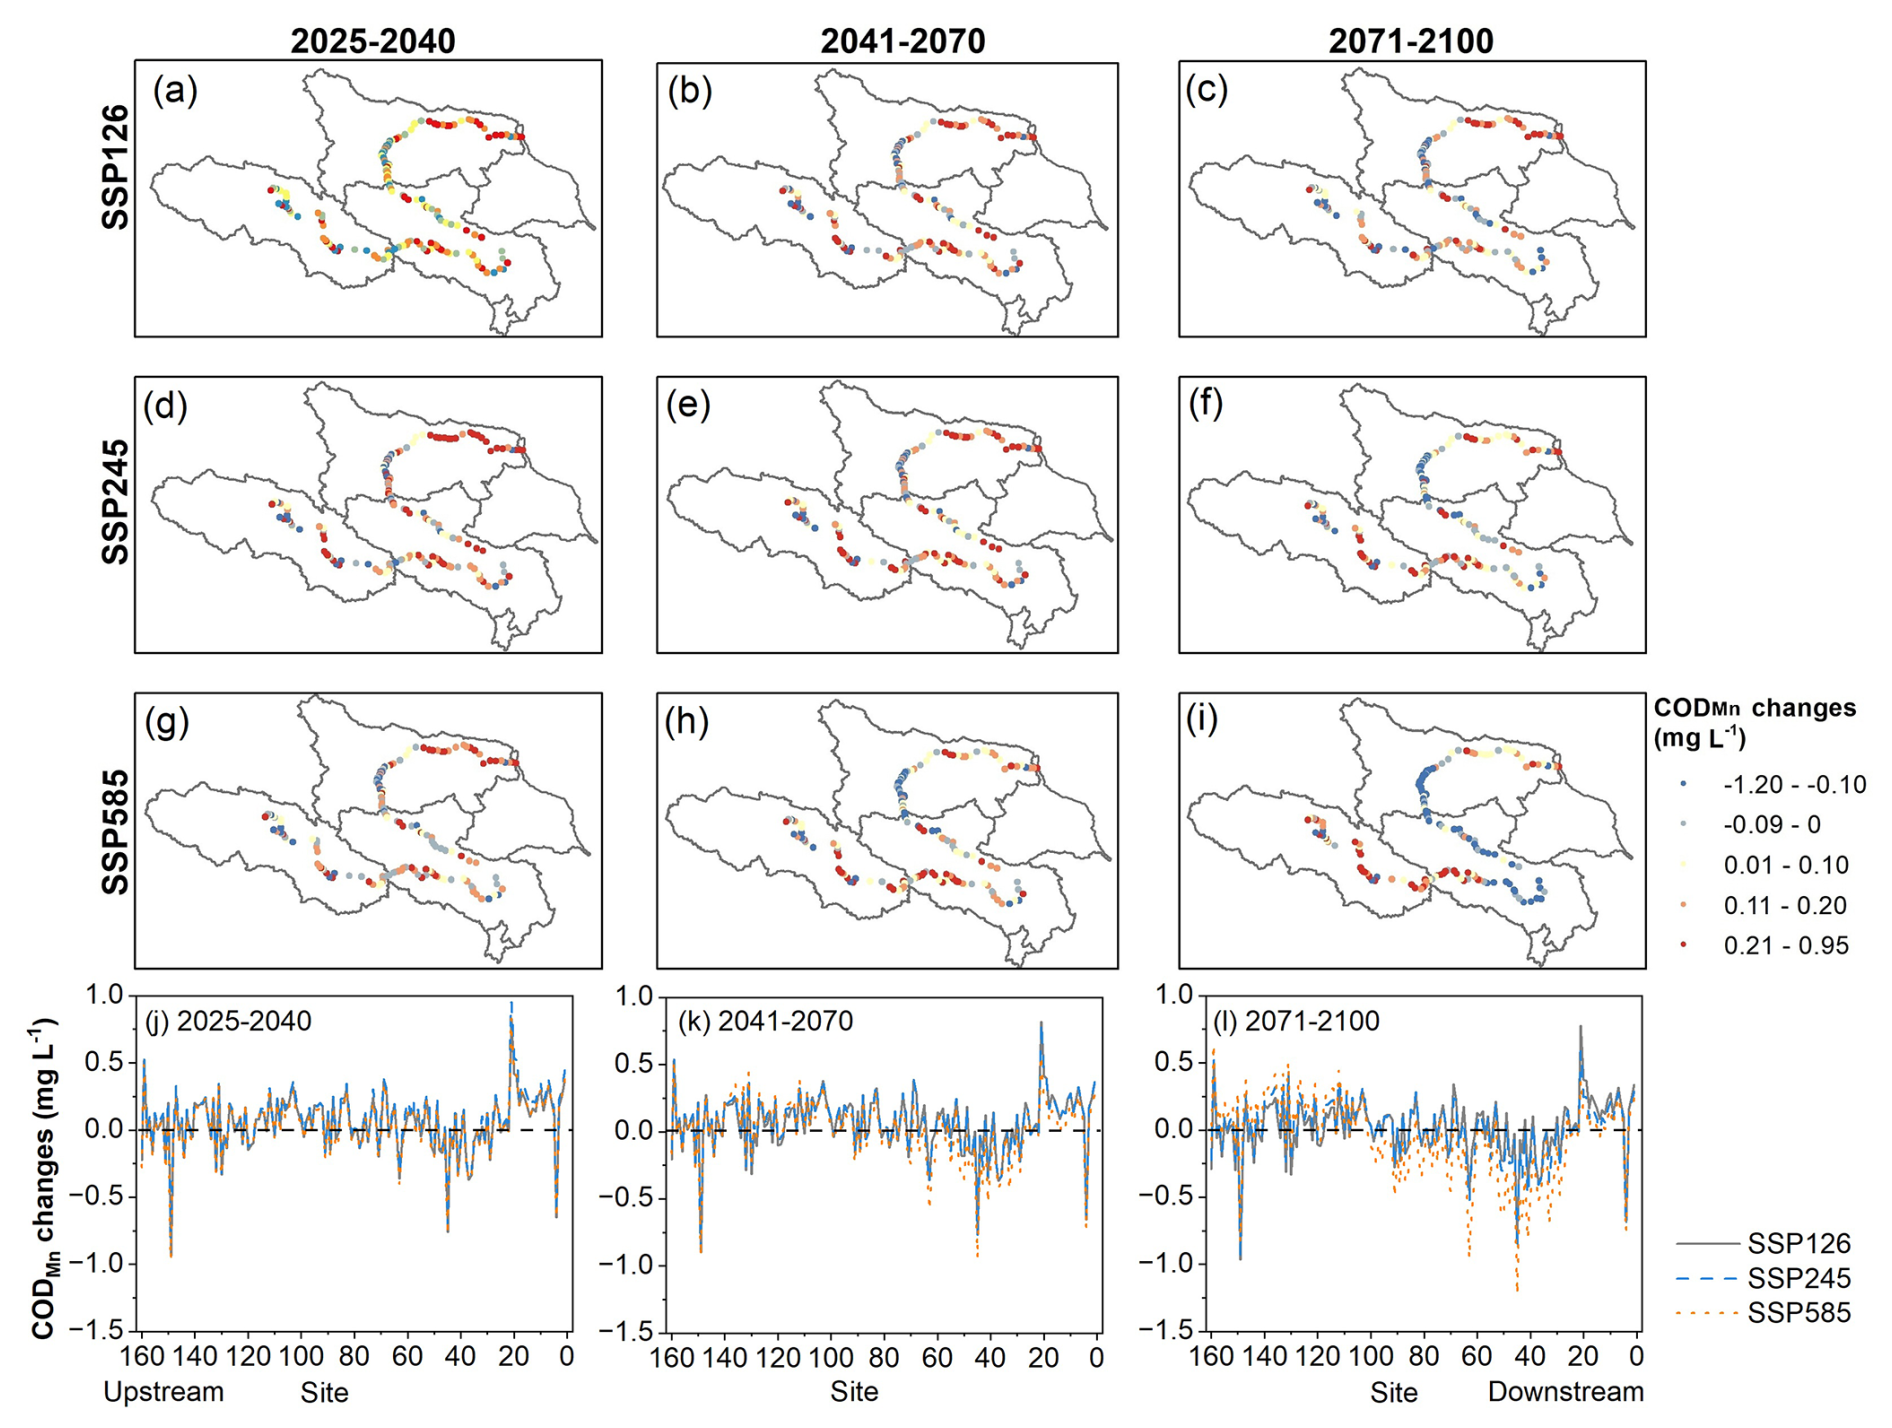
Figure 8Projected spatial variation of CODMn changes in the Yellow River source region for 2025–2040, 2041–2070, and 2071–2100 under SSP126, SSP245, and SSP585 scenarios. CODMn changes were calculated relative to the mean values from 2014–2024.
3.4 Historical and future riverine organic matter exports
Historical and future CODMn and converted DOC exports are shown in Figs. 9 and S4, respectively. Based on the annual average discharge at control site M4 (1987–2021), approximately 28.1 Gg of CODMn (37.1 Gg DOC) was exported from the entire study area. In contrast, the annual mean CODMn export at site M2 was 62.5 Gg (82.5 Gg DOC), indicating that approximately 34 Gg of COD (44.8 Gg DOC) was either deposited or decomposed between M4 and M2 along the downstream of the Yellow River's source region. The export of riverine organic matter primarily occurred during the wet season (June–October) (Figs. 9a, S4a), which contributes substantially to the annual dissolved organic matter export from the source region (Figs. 9b, S4b). Additionally, the observed increase in CODMn or DOC export between sites M1 and M2 highlights the midstream region as a major source of dissolved organic matter (Figs. 9b, S4b).
Though the projected discharge presents an overall increase trend (Fig. 9c), the calculated future CODMn (or DOC) export at site M2 indicates a slight declining trend under the three scenarios (Figs. 9d, S4c). For example, the average CODMn export at M2 under different scenarios is expected to decrease from 62.5 to 59.6 Gg (82.5 to 78.7 Gg DOC) by 2100.
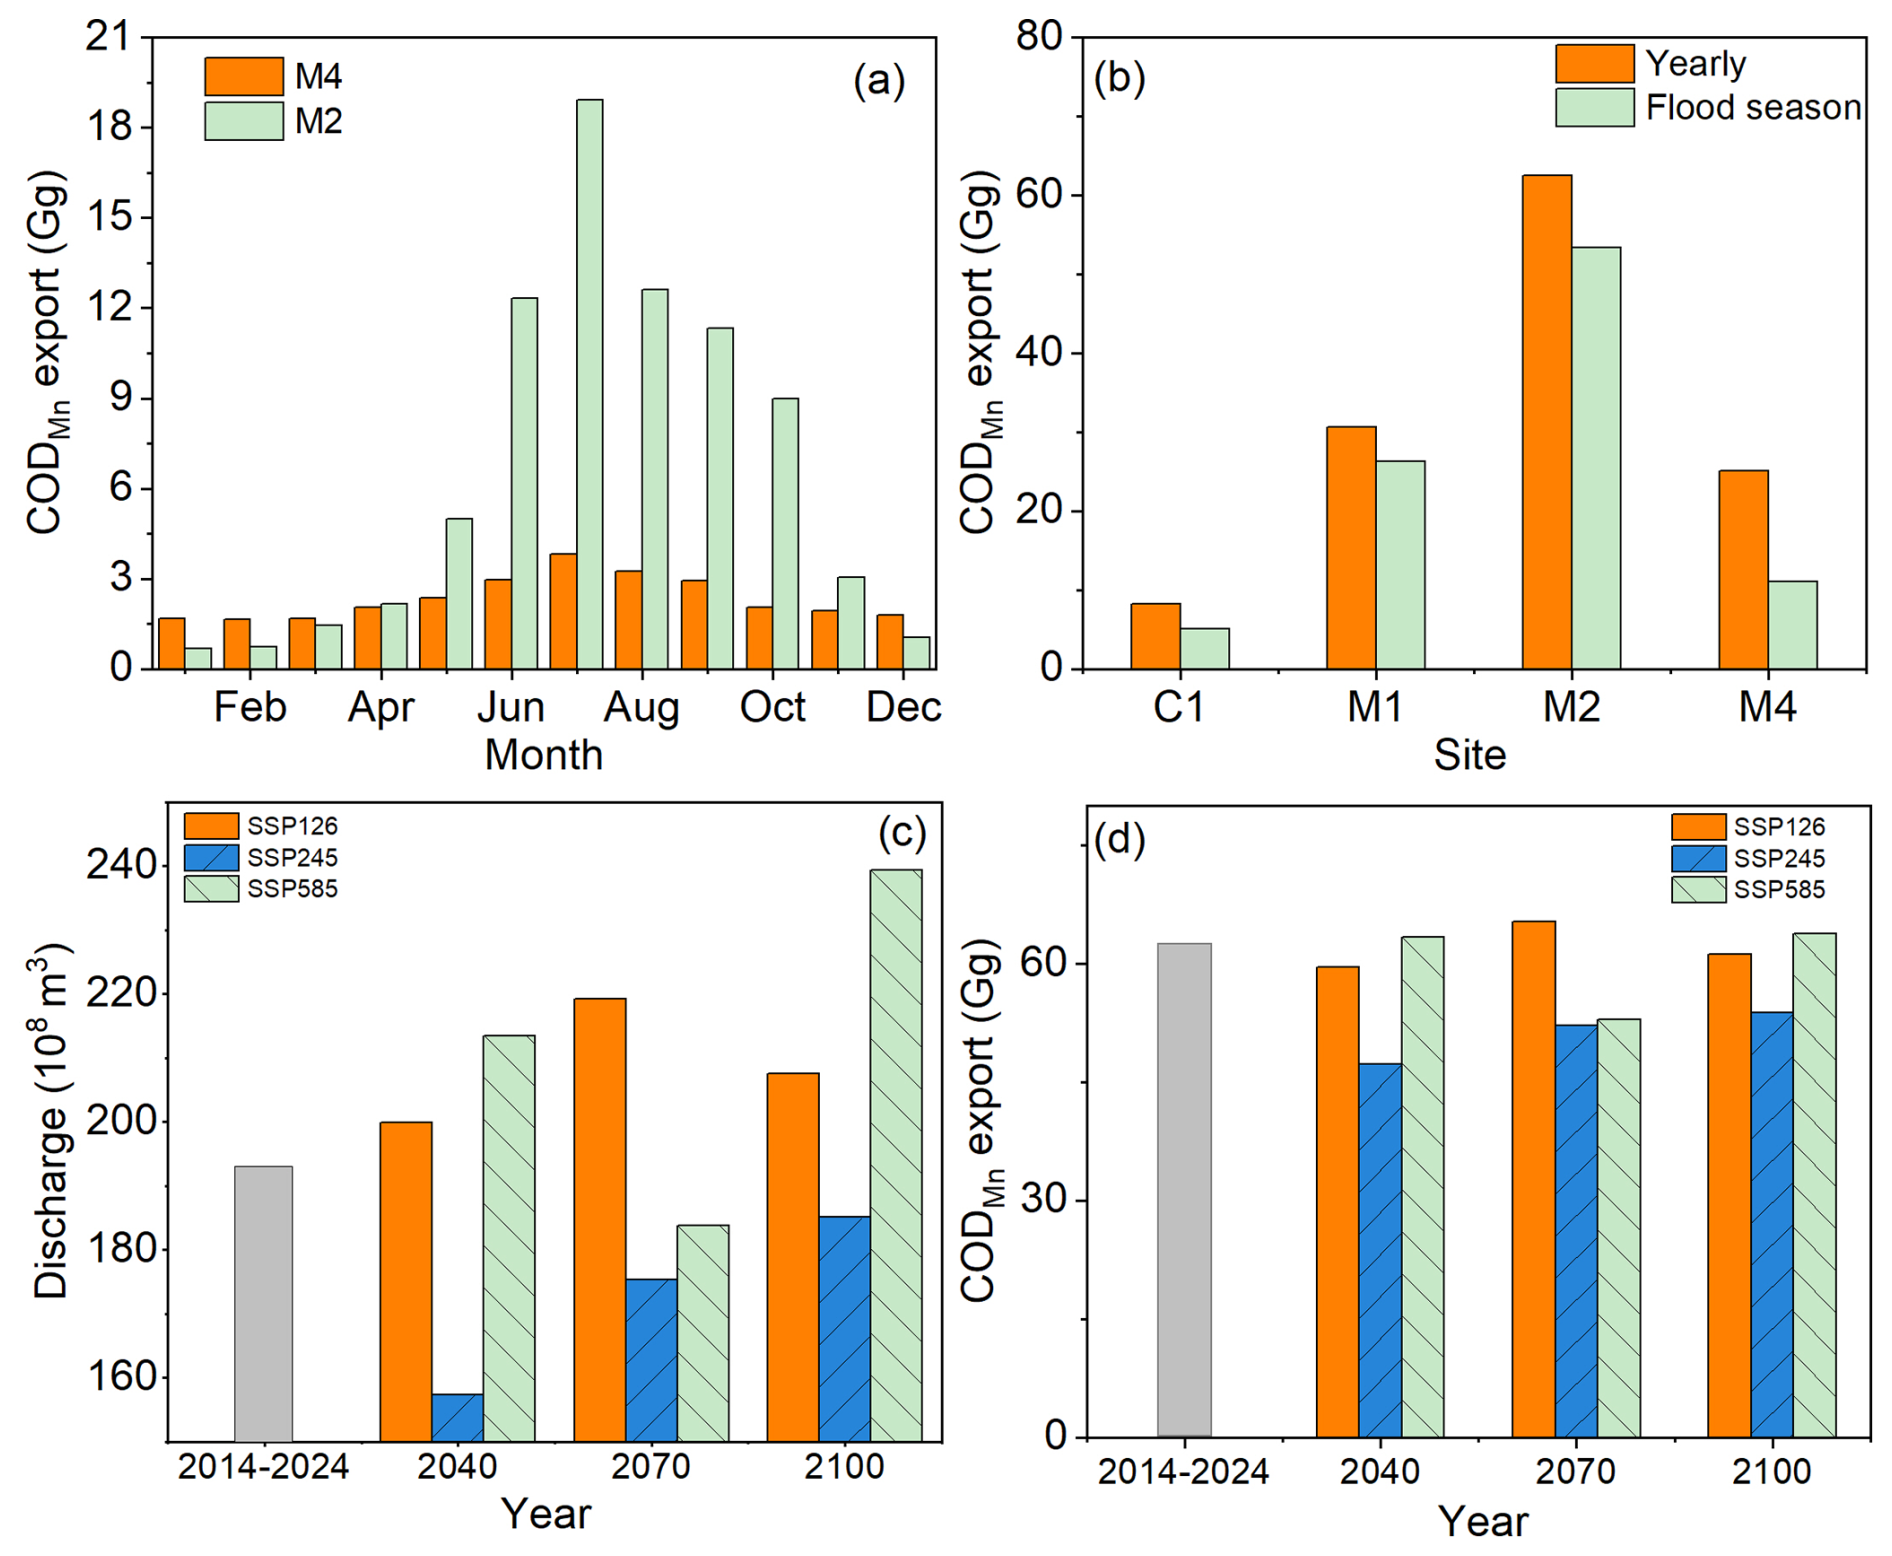
Figure 9Monthly average CODMn export at sites M2 and M4 during 2014–2024 (a); comparison between annual and flood-season CODMn exports (b); projected annual average discharge collected from Ma et al. (2023a) (c), and projected CODMn export at M2 for 2040, 2070, and 2100 under SSP126, SSP245, and SSP585 scenarios (d).
4.1 Factors driving riverine organic matter dynamics in the headstream of the Yellow River
4.1.1 Spatial variations
Primary sources of riverine organic carbon include losses from soils, plant litter, root exudates in grasslands, and permafrost thaw via surface runoff (Yan et al., 2023). In this study, precipitation, temperature, vegetation, and soil texture were identified as key drivers of CODMn variation (Fig. 4b). Notably, the overall soil organic carbon, vegetation cover, fine particle content, and precipitation are higher in the midstream region of the headwater (Fig. S5), providing abundant carbon sources and facilitating transport to nearby rivers, resulting in elevated CODMn levels and fluxes in the mid-downstream areas (Figs. 5a, 9a, b). Additionally, bare land in the mid-downstream areas of the headstream may also contribute to the soil erosion and the associated organic carbon losses (Fig. S1). Li et al. (2025c) identified the higher lateral fluxes of river organic matter in the midstream area of the Yellow River' s source region. Consequently, the midstream area represents a critical source of organic carbon for the Yellow River headwaters.
In contrast, CODMn levels decreased markedly in the downstream region (Fig. 5a, b). This decline is likely driven by damming, as three large reservoirs, Longyangxia, Laxiwa, and Lijiaxia have been constructed in the downstream headwater region since the 1970s. Reservoirs increase water residence time, promoting deposition and decomposition of organic carbon, greenhouse gas emissions, and uptake by aquatic plants (Maavara et al., 2017, 2020). Therefore, the deposition or decomposition of organic matter along the downstream areas may contribute to the decline of CODMn levels. The deposition of riverine organic matter can be inferred from the decrease in CODMn (or DOC) fluxes at the outlet (M4) of the study area relative to site M2 (Figs. 9, S4). Li et al. (2025c) also reported negative dissolved organic matter fluxes in the main channels of the Yellow River's headstreams. Additionally, the decomposition of the deposited organic matter is evidenced by CO2 outgassing from the river water. Previous study has found that CO2 outgassing from the cascade reservoirs of Yellow River's source region was estimated at 131 ± 156 mmol m−2 d−1 in dry seasons and 466 ± 366 mmol m−2 d−1 in flood seasons (Wang et al., 2022). Therefore, these observations suggest that the sedimentation and degradation of organic matter contributes to lower CODMn concentrations in the downstream area.
The CODMn concentration remained relatively stable along the upper to middle reaches of the Yellow River's headwaters. This region is characterized by permafrost and seasonally frozen ground, with low precipitation and limited runoff (Yang et al., 2023). Surface runoff in this area primarily originates from precipitation, snowmelt, and glacier melt (Li et al., 2025a). Consequently, due to the relatively uniform and stable runoff and land cover, CODMn levels exhibited a homogeneous spatial distribution along the upper to middle reaches of the Yellow River's headwaters.
4.1.2 Temporal variations
Climate-driven changes in runoff and temperature strongly influence catchment-scale carbon dynamics, altering riverine organic matter fluxes globally (Costa et al., 2023). Over the past decade, air temperature in the source region of the Yellow River has shown an increasing trend, with a basin–averaged increase of 0.67 °C, and the precipitation also presented an overall increase trend though decrease slightly after 2019 (Fig. S6). The study area is particularly sensitive to warming-induced permafrost thaw, glacier melting, soil erosion, and intensified human activities over recent decades (Chen et al., 2022; Deng et al., 2025; Lan et al., 2025), which modify organic matter sources and lateral transport between terrestrial and aquatic systems, affecting ROM levels and fluxes in rivers (Wang et al., 2020; Chen et al., 2022; Wang et al., 2025a). For example, previous studies highlighted that permafrost thaw was projected to release 129 ± 21.02 Tg soil organic carbon annually (Lan et al., 2025). Glacier melting contributes an estimated 0.19 Tg C yr−1 as dissolved organic carbon (Chen et al., 2022). Intensified rainfall has increased soil erosion by 42 % over the past four decades, resulting in an average soil carbon loss of 4 ± 1.2 Tg C yr−1 (Deng et al., 2025).
Therefore, affected by the increased temperature and precipitation, CODMn concentrations in the source region of the Yellow River exhibited an overall increasing trend over the past decade, with an average rise of 0.26 mg L−1 (Fig. 5c, d). Especially the midstream region experienced the most pronounced increase (0.58 mg L−1). The higher precipitation combined with increased runoff likely enhance organic matter leaching from grasslands, contributing to the rise of riverine CODMn in the midstream area (Yang et al., 2023; Chen et al., 2025).
In addition to climate effects, growing human activities such as land use changes, grazing, and construction on the QTP also influence carbon mobilization (Chen et al., 2022). Human-induced land-use changes, grassland degradation, construction activities, and overgrazing can lead to organic matter losses in the study area. In addition, the construction and urbanization of natural and agricultural ecosystems may further accelerate organic matter losses within the watershed. All these human activities may contribute to the rising of CODMn in the headstream of the Yellow River.
4.2 Future riverine organic matter changes in the headstream of the Yellow River under climate change
Rapid climate change in alpine regions is altering carbon cycling in both terrestrial and aquatic ecosystems (Chen et al., 2022). As carbon dynamics are highly sensitive to climatic variations, warming and wetting trends are expected to influence the stability of riverine organic matter in alpine catchments. Numerous studies indicate that precipitation and temperature on the QTP are projected to increase throughout this century, particularly in high-elevation areas (Meng et al., 2023; Karim et al., 2025). Our projections also suggest an overall increase in precipitation, especially in the up-midstream area of the Yellow River source region (Fig. 7), and significant warming is projected in the whole study area by 2100, especially under SSP245 and SSP585. Climate-driven changes are expected to induce the largest variability in CODMn concentrations in the midstream region (Fig. 8). CODMn levels are projected to increase in most parts of the source region of the Yellow River, whereas annual average CODMn exports from the whole catchment will decrease slightly from 62.5 to 59.6 Gg (82.5 to 78.7 Gg DOC) (Figs. 9d, S4c).
ROM dynamics are jointly regulated by organic matter supply and hydrological processes within catchments (Li et al., 2022; Wu et al., 2024). Increased precipitation can enhance surface runoff, leading to losses of organic matter from the catchment, and CODMn concentrations may be diluted as discharge continues to increase. The projected warming in the headwater area of the Yellow River will lead to the continuing permafrost degradation, promoting the loss of organic matter within the catchment and leading to the increase of the CODMn level in the headstreams. In addition, damming prolongs water residence time, promoting organic matter deposition in cascade reservoirs in the downstream area of the Yellow River's source region and reducing the riverine organic matter export from the study area. Under warm conditions, the degradation of deposited organic matter in the bottom of the reservoir may be enhanced, releasing additional organic carbon from reservoir sediments and contributing to the rise of CODMn levels in the downstream area (Vachon et al., 2021; Battin et al., 2023).
However, the extent to which organic matter reaches rivers depends on hydrological processes and connectivity between the source region and river channels. The characteristics of rainfall events may shift the ROM response to storms from transport-limited to supply-limited, thereby reducing ROM levels (Li et al., 2022). Consequently, the projected increase in precipitation by the year of 2100 is expected to lead to a decrease in CODMn levels within the midstream areas (Fig. 8). In addition, permafrost thaw induced by the warming can also alter runoff pathways, promoting subsurface flow and potentially reducing surface discharge to rivers (Yang et al., 2023). Increased vegetation cover can also reduce transport of organic matter through reducing soil erosion and surface runoff (Ma et al., 2023b; Liu et al., 2024). Therefore, the export of DOC from the headwaters of the Yellow River may remain stable or decrease slightly under the combined effects of climate change, hydrological variability, permafrost degradation, and human activities.
4.3 Uncertainty in riverine organic matter dynamics on the QTP
Understanding riverine organic matter dynamics is essential for assessing aquatic ecosystem feedback to climate change. Ongoing warming and wetting on the QTP are expected to alter carbon stability, increasing uncertainty in watershed organic matter losses (Bai et al., 2025). For instance, increased precipitation may enhance surface runoff, however, rising temperatures can also decrease catchment runoff by enhancing evaporation. The influence of hydrological processes on ROM dynamics depends on the characteristics of the catchment (Li et al., 2022). Previous studies have predicted both increasing and decreasing streamflow trends on the QTP under future climate scenarios (Yang et al., 2023; Li et al., 2025a; San et al., 2025). Increased streamflow may elevate CODMn in rivers, or dilute CODMn due to higher streamflow. Conversely, reduced streamflow may decrease organic matter transport to rivers or concentrate CODMn in river water.
Additionally, warming-induced permafrost thaw may accelerate topsoil organic matter mobilization, stimulate microbial activity, and promote soil organic matter decomposition, releasing more dissolved organic matter (Li et al., 2025d). However, the frozen ground degradation can also result in the decreased surface runoff by increasing the subsurface runoff (Yang et al., 2023). Vegetation greening on the QTP may both enhance soil carbon storage and reduce organic matter losses to river networks through mitigating soil erosion (Deng et al., 2025). Therefore, climate change can further differentially affect terrestrial carbon stocks and carbon losses, introducing additional complexity and uncertainty in catchment-scale organic matter sources and transport (Chen et al., 2022; Ma et al., 2023b; Liu et al., 2024).
In-stream carbon biogeochemical processes are also highly complex under changing climatic conditions. Organic matter decomposition depends on temperature, redox conditions, hydrology, microbial activity, and organic matter characteristics (Battin et al., 2023). The climate change is projected to change the hydrological processes and the associated biogeochemical processes, further altering the carbon cycling in the alpine rivers. However, interactions among these factors are not fully understood in alpine rivers, making predictions of alpine river metabolism and carbon budget under climate change uncertain (Li et al., 2025c).
Anthropogenic activities on the QTP further contribute to uncertainty. Warming and wetting may expand farming, increasing soil erosion and carbon losses (Chen et al., 2022). Future dam construction alters organic matter transport by promoting deposition, influencing greenhouse gas emissions, and facilitating organic matter degradation (Battin et al., 2023). Conversely, ecological restoration, such as afforestation, can increase soil organic matter accumulation and litterfall (Chen et al., 2022; Yan et al., 2023), leading to increase in organic matter and the CODMn levels in the alpine Rivers.
4.4 Limitations of this study
In this study, we project a general increase in levels and fluxes of CODMn based on modeled temperature, precipitation, and discharge. However, future climatic trends may deviate from current projections, and the predicted temperature and precipitation may not represent the actual future patterns. Besides, our developed model does not incorporate changes in land covers, soil carbon stocks, hydrological processes, or in-stream carbon biogeochemistry, all of which may significantly influence riverine carbon cycling. Therefore, future research should integrate these factors to develop more precise, process-based models and improve understanding of carbon dynamics in alpine river catchments.
In addition, future CODMn projection model is trained on CODMn values predicted by the first-stage retrieval model rather than on independent long-term observations, so the two models are not statistically independent and retrieval errors inevitably propagate into the climate projections. The extrapolating spatial “geographical characteristics – CODMn concentration” relationships to temporal climate change represents a space-for-time substitution that assumes stationarity, an assumption that is difficult to test rigorously with the available data. Finally, CODMn is an oxygen-equivalent index rather than a direct measure of organic matter or carbon. The DOC export estimated in this study was derived from a simplified empirical relationship between CODMn and DOC in rivers across China, which may introduce additional uncertainty into the DOC estimates.
In this study, LightGBM-Large models were developed to reconstruct the historical variations of CODMn in the source region of the Yellow River and to predict its future changes. Our findings identify the midstream region of the Yellow River's headstream, with higher CODMn levels (2.73 ± 1.63 mg L−1), is sensitive to climate change and exhibited an increasing trend of CODMn (0.58 mg L−1) in the past decade. Precipitation and temperature were identified as the key factors influencing CODMn dynamics in the headwaters of the Yellow River. Future projections suggest that increased precipitation and temperature may lead to an overall rise of CODMn levels, with decrease in some specific sites. The export of dissolved organic matter from the headwaters of the Yellow River is projected to remain stable or decrease slightly in the future. However, the limited spatial and temporal resolution of Landsat data and lack of geophysical data, still poses challenges for accurately capturing rapid variations in riverine organic matter in the source region of the Yellow River. Therefore, future research in alpine rivers should focus on developing more robust models by integrating long-term and high-resolution satellite observations and in-situ observations and incorporating a broader range of environmental variables.
Water quality data in this study are obtained from the China National Environmental Monitoring Centre (https://www.cnemc.cn, last access: 4 September 2025). Historical monthly precipitation and temperature, surface soil properties, vegetation coverage, and projected future monthly temperature and precipitation data are obtained from the Tibetan Plateau Data Centre (https://data.tpdc.ac.cn, last access: 12 January 2026). The modeled historical and projected future CODMn data in this study are openly available on Zenodo (https://doi.org/10.5281/zenodo.22766232, Wang, 2026).
The supplement related to this article is available online at https://doi.org/10.5194/bg-23-7939-2026-supplement.
XW: Conceptualization, Methodology, Writing original draft, Funding acquisition; JW: Methodology, Data curation, Review and editing; TR: Investigation, Formal analysis, Validation; JZ: Validation, Conceptualization, Review and editing.
The contact author has declared that none of the authors has any competing interests.
Publisher's note: Copernicus Publications remains neutral with regard to jurisdictional claims made in the text, published maps, institutional affiliations, or any other geographical representation in this paper. The authors bear the ultimate responsibility for providing appropriate place names. Views expressed in the text are those of the authors and do not necessarily reflect the views of the publisher.
We thank the editors and the two anonymous reviewers for their careful reading, insightful comments, and constructive suggestions, which have greatly helped us improve this manuscript.
This study was funded by China West Normal University (grant no. 22kA001), the Sichuan Science and Technology Program (grant no. 2026YFTX0001), and the Natural Science Foundation of Sichuan Province (grant no. 2026NSFSC0226).
This paper was edited by Steven Bouillon and reviewed by two anonymous referees.
Adegun, A., Viriri, S., and Tapamo, J.-R.: Review of deep learning methods for remote sensing satellite images classification: experimental survey and comparative analysis, Journal of Big Data, 10, https://doi.org/10.1186/s40537-023-00772-x, 2023.
Aryal, S. and Pokhrel, Y.: Spatio-temporal heterogeneities in hydrologic dynamics across the Asian Water Tower, J. Hydrol., 662, 133951, https://doi.org/10.1016/j.jhydrol.2025.133951, 2025.
Bai, Y., Peng, Y., Zhang, D., Yang, G., Chen, L., Kang, L., Zhou, W., Wei, B., Xie, Y., and Yang, Y.: Heating up the roof of the world: tracing the impacts of in-situ warming on carbon cycle in alpine grasslands on the Tibetan Plateau, Natl. Sci. Rev., 12, nwae371, https://doi.org/10.1093/nsr/nwae371, 2025.
Battin, T. J., Lauerwald, R., Bernhardt, E. S., Bertuzzo, E., Gener, L. G., Hall, R. O., Hotchkiss, E. R., Maavara, T., Pavelsky, T. M., Ran, L., Raymond, P., Rosentreter, J. A., and Regnier, P.: River ecosystem metabolism and carbon biogeochemistry in a changing world, Nature, 613, 449–459, https://doi.org/10.1038/s41586-022-05500-8, 2023.
Beusen, A. H. W., Doelman, J. C., Van Beek, L. P. H., Van Puijenbroek, P. J. T. M., Mogollón, J. M., Van Grinsven, H. J. M., Stehfest, E., Van Vuuren, D. P., and Bouwman, A. F.: Exploring river nitrogen and phosphorus loading and export to global coastal waters in the Shared Socio-economic pathways, Glob. Environ. Change, 72, 102426, https://doi.org/10.1016/j.gloenvcha.2021.102426, 2022.
Beyer, R., Krapp, M., and Manica, A.: An empirical evaluation of bias correction methods for palaeoclimate simulations, Clim. Past, 16, 1493–1508, https://doi.org/10.5194/cp-16-1493-2020, 2020.
Cao, Y., Yao, H., Zhang, C., Gu, C., Yang, L., Hao, R., Li, X., Wang, Z., Xiao, H., Wang, J., and Shi, Z.: Data-driven assessment of nitrogen and phosphorus buffering capacity across 460 Chinese watersheds: Spatial patterns, drivers, and future projections, Water Res., 293, 125424, https://doi.org/10.1016/j.watres.2026.125424, 2026.
Chen, H., Ju, P., Zhu, Q., Xu, X., Wu, N., Gao, Y., Feng, X., Tian, J., Niu, S., and Zhang, Y.: Carbon and nitrogen cycling on the Qinghai–Tibetan Plateau, Nat. Rev. Earth Environ., 3, 701–716, https://doi.org/10.1038/s43017-022-00344-2, 2022.
Chen, Y., Xu, C., Liu, W., De Boeck, H. J., Zhou, H., Chen, Q., Ma, Y., Liu, W., Zhao, L., Wang, H., Chen, J., Zhang, Y., and Zhang, Z.: Machine learning-based assessment of grassland degradation levels on the Qinghai-Tibet Plateau from 2000 to 2020, Ecol. Indic., 180, 114360, https://doi.org/10.1016/j.ecolind.2025.114360, 2025.
Costa, D., Sutter, C., Shepherd, A., Jarvie, H., Wilson, H., Elliott, J., Liu, J., and Macrae, M.: Impact of climate change on catchment nutrient dynamics: insights from around the world, Environ. Rev., 31, 4–25, https://doi.org/10.1139/er-2021-0109, 2023.
Deng, R., Li, D., Zhao, Y., Walling, D. E., Panagos, P., Borrelli, P., Ciais, P., Huang, Y., Bai, Y., Chalov, S., Golosov, V. N., Fu, X., Miao, C., Wei, J., and Ni, J.: Intensified rainfall overrides vegetation greening in driving erosion and carbon loss on the Tibetan Plateau, Sci. Bull., 70, 3698–3702, https://doi.org/10.1016/j.scib.2025.09.005, 2025.
Deng, Y., Zhang, Y., Pan, D., Yang, S. X., and Gharabaghi, B.: Review of Recent Advances in Remote Sensing and Machine Learning Methods for Lake Water Quality Management, Remote Sens., 16, https://doi.org/10.3390/rs16224196, 2024.
FAO and IIASA: China soil map based harmonized world soil database (HWSD) (v1.1) (2009), National Tibetan Plateau/Third Pole Environment Data Center, https://data.tpdc.ac.cn/zh-hans/data/611f7d50-b419-4d14-b4dd-4a944b141175 (last access: 12 January 2026), 2019.
Gao, J., Shi, Y., Zhang, H., Chen, X., Zhang, W., Shen, W., Xiao, T., and Zhang, Y.: China regional 250m fractional vegetation cover data set (2000–2024), National Tibetan Plateau/Third Pole Environment Data Center, https://doi.org/10.11888/Terre.tpdc.300330, 2025.
Giri, S.: Water quality prospective in Twenty First Century: Status of water quality in major river basins, contemporary strategies and impediments: A review, Environ. Pollut., 271, 116332, https://doi.org/10.1016/j.envpol.2020.116332, 2021.
Hong, J., Pang, B., Zhao, L., Shu, S., Feng, P., Liu, F., Du, Z., and Wang, X.: Soil phosphorus crisis in the Tibetan alpine permafrost region, Nat. Commun., 16, https://doi.org/10.1038/s41467-025-61501-x, 2025.
Hu, M., Liu, Y., Zhang, Y., Shen, H., Yao, M., Dahlgren, R. A., and Chen, D.: Long-term (1980–2015) changes in net anthropogenic phosphorus inputs and riverine phosphorus export in the Yangtze River basin, Water Res., 177, 115779, https://doi.org/10.1016/j.watres.2020.115779, 2020.
Hu, X., Shi, S., Zhou, B., and Ni, J.: A 1 km monthly dataset of historical and future climate changes over China, Sci. Data, 12, 436, https://doi.org/10.1038/s41597-025-04761-y, 2025.
Jiao, N., Liu, J., Edwards, B., Lv, Z., Cai, R., Liu, Y., Xiao, X., Wang, J., Jiao, F., Wang, R., Huang, X., Guo, B., Sun, J., Zhang, R., Zhang, Y., Tang, K., Zheng, Q., Azam, F., Batt, J., Cai, W.-J., He, C., Herndl, G. J., Hill, P., Hutchins, D., LaRoche, J., Lewis, M., MacIntyre, H., Polimene, L., Robinson, C., Shi, Q., Suttle, C. A., Thomas, H., Wallace, D., and Legendre, L.: Correcting a major error in assessing organic carbon pollution in natural waters, Sci. Adv., 7, eabc7318, https://doi.org/10.1126/sciadv.abc7318, 2021.
Karim, R., Li, S., Su, T., Ayugi, B. O., Babaousmail, H., and Xiao, S.: Future Climate Changes on the Qinghai–Tibetan Plateau Under CMIP6 Global Climate Models, Int. J. Climatol., e70005, https://doi.org/10.1002/joc.70005, 2025.
Kotlarski, S., Gobiet, A., Morin, S., Olefs, M., Rajczak, J., and Samacoïts, R.: 21st Century alpine climate change, Clim. Dynam., 60, 65–86, https://doi.org/10.1007/s00382-022-06303-3, 2023.
Lan, T., Ma, Q., Lai, Y., Zhang, M., Harbor, J., and Luo, X.: Quantifying the water contributions and carbon consequences of permafrost degradation on the Tibetan Plateau, Sci. Bull., https://doi.org/10.1016/j.scib.2025.09.029, 2025.
Li, G., Li, Z., Zhang, B., and Li, Z.: Changes in runoff from major alpine watersheds on the Qinghai-Tibetan plateau: A review, J. Hydrol. Reg. Stud., 60, 102514, https://doi.org/10.1016/j.ejrh.2025.102514, 2025a.
Li, J., Wang, G., Song, C., Sun, S., Ma, J., Wang, Y., Guo, L., and Li, D.: Recent intensified erosion and massive sediment deposition in Tibetan Plateau rivers, Nat. Commun., 15, 722, https://doi.org/10.1038/s41467-024-44982-0, 2024.
Li, J., Wang, G., Sun, S., Ma, J., Guo, L., Song, C., and Lin, S.: Mapping and reconstruct suspended sediment dynamics (1986–2021) in the source region of the Yangtze River, Qinghai-Tibet Plateau using Google Earth Engine, Remote Sens. Environ., 317, 114533, https://doi.org/10.1016/j.rse.2024.114533, 2025b.
Li, L., Wang, T., Yang, J., Yang, H., Tang, L., and Yang, D.: Revealing the Long-Term Catchment-Scale Carbon Budget Dynamics on the Permafrost-Dominated Eastern Tibetan Plateau, Global Biogeochem. Cy., 39, e2025GB008743, https://doi.org/10.1029/2025GB008743, 2025c.
Li, M., Peng, C., Zhang, K., Xu, L., Wang, J., Yang, Y., Li, P., Liu, Z., and He, N.: Headwater stream ecosystem: an important source of greenhouse gases to the atmosphere, Water Res., 190, 116738, https://doi.org/10.1016/j.watres.2020.116738, 2021.
Li, X., Wang, J., Lin, J., Yin, W., Shi, Y. Y., Wang, L., Xiao, H. B., Zhong, Z. M., Jiang, H., and Shi, Z. H.: Hysteresis analysis reveals dissolved carbon concentration – discharge relationships during and between storm events, Water Res., 226, 119220, https://doi.org/10.1016/j.watres.2022.119220, 2022.
Li, Z., Kang, L., Wang, L., Wanek, W., Zhang, D., Wang, G., Lambers, H., Peñuelas, J., Jiang, M., and Yang, Y.: Accelerated soil phosphorus cycling upon abrupt permafrost thaw, Nat. Clim. Change, 15, 1234–1240, https://doi.org/10.1038/s41558-025-02445-4, 2025d.
Li, Z., Liu, F., Li, H., Liu, M., Li, Z., Feng, Q., Xu, B., and Liu, X.: Driving forces of the spatiotemporal supply pattern of runoff in the source region of Yellow River, J. Hydrol. Reg. Stud., 60, 102515, https://doi.org/10.1016/j.ejrh.2025.102515, 2025e.
Liu, G., Li, S., Song, K., Wang, X., Wen, Z., Kutser, T., Jacinthe, P.-A., Shang, Y., Lyu, L., Fang, C., Yang, Y., Yang, Q., Zhang, B., Cheng, S., and Hou, J.: Remote sensing of CDOM and DOC in alpine lakes across the Qinghai-Tibet Plateau using Sentinel-2A imagery data, J. Environ. Manag., 286, 112231, https://doi.org/10.1016/j.jenvman.2021.112231, 2021.
Liu, H.: Human activity intensity dataset of the Qinghai-Tibet Plateau (2000–2020), National Tibetan Plateau/Third Pole Environment Data Center, https://doi.org/10.3974/geodb.2023.07.08.V1, 2023.
Liu, L., Yang, S., Wang, S., Hu, J., Li, C., and Yi, Y.: Influence of the Cascade Reservoir Operation of the Yellow River on the Hydrological Regime of the Main Stream of the Yellow River, Yellow River, 47, 42–47, 77, https://doi.org/10.3969/j.issn.1000-1379.2025.03.007, 2025.
Liu, P., Zeng, H., Qi, L., Degen, A. A., Boone, R. B., Luo, B., Huang, M., Peng, Z., Qi, T., and Wang, W.: Vegetation redistribution is predicted to intensify soil organic carbon loss under future climate changes on the Tibetan Plateau, Sci. Total Environ., 932, 173034, https://doi.org/10.1016/j.scitotenv.2024.173034, 2024.
Lv, Z., Ran, X., Liu, J., Feng, Y., Zhong, X., and Jiao, N.: Effectiveness of Chemical Oxygen Demand as an Indicator of Organic Pollution in Aquatic Environments, Ocean-Land-Atmos. Res., 3, 0050, https://doi.org/10.34133/olar.0050, 2024.
Ma, M., Wang, Z., Zang, H., Wang, W., Wei, M., and Cui, H.: Runoff Simulation and Prediction in the Source Region of the Yellow River Based on SSP Scenarios, Journal of North China University of Water Resources and Electric Power, 44, 31–40, https://doi.org/10.19760/j.ncwu.zk.2023054, 2023a.
Ma, W., Wu, T., Wu, X., Yang, S., Li, R., Zhou, S., Li, X., Zhu, X., Hao, J., and Ni, J.: Carbon budgets and environmental controls in alpine ecosystems on the Qinghai-Tibet Plateau, Catena, 229, 107224, https://doi.org/10.1016/j.catena.2023.107224, 2023b.
Maavara, T., Lauerwald, R., Regnier, P., and Van Cappellen, P.: Global perturbation of organic carbon cycling by river damming, Nat. Commun., 8, 15347, https://doi.org/10.1038/ncomms15347, 2017.
Maavara, T., Chen, Q., Van Meter, K., Brown, L. E., Zhang, J., Ni, J., and Zarfl, C.: River dam impacts on biogeochemical cycling, Nat. Rev. Earth Environ., 1, 103–116, https://doi.org/10.1038/s43017-019-0019-0, 2020.
Meng, Y., Duan, K., Shi, P., Shang, W., Li, S., Cheng, Y., Xing, L., Chen, R., and He, J.: Sensitive temperature changes on the Tibetan Plateau in response to global warming, Atmos. Res., 294, 106948, https://doi.org/10.1016/j.atmosres.2023.106948, 2023.
Peng, S.: 1-km monthly mean temperature dataset for China (1901–2024), National Tibetan Plateau/Third Pole Environment Data Center, https://doi.org/10.11888/Meteoro.tpdc.270961, 2025a.
Peng, S.: 1-km monthly precipitation dataset for China (1901–2024), Zenodo, https://doi.org/10.5281/zenodo.3114194, 2025b.
Regnier, P., Resplandy, L., Najjar, R. G., and Ciais, P.: The land-to-ocean loops of the global carbon cycle, Nature, 603, 401–410, https://doi.org/10.1038/s41586-021-04339-9, 2022.
San, M., Jia, S., Yang, C., Liu, J., Yu, Z., Fang, W., Shang, J., Ming, B., Guo, Y., and Cheng, L.: Runoff Prediction in the Source Region of the Yellow River Basin Based on the CMIP6 Climate Model, Soil and Water Conservation in China, 71–77, 89, https://doi.org/10.3969/j.issn.1000-0941.2025.07.020, 2025.
Shang, Y., Wen, Z., Liu, G., Fang, C., Yu, X., Liu, J., and Song, K.: Deciphering riverine CODMn sources: driver identification and carbon cycle impacts, Ecol. Indic., 190, 115312, https://doi.org/10.1016/j.ecolind.2026.115312, 2026.
Vachon, D., Sponseller, R. A., and Karlsson, J.: Integrating carbon emission, accumulation and transport in inland waters to understand their role in the global carbon cycle, Glob. Change Biol., 27, 719–727, https://doi.org/10.1111/gcb.15448, 2021.
Wang, L.: Difference and causes of runoff in different sections above Tangnaihai in the source region of the Yellow River, Journal of Qinghai Normal University, 40, 99–104, 112, https://doi.org/10.16229/j.cnki.issn1001-7542.2024313, 2024.
Wang, X.: Simulated historical and future COD in the headwater of the Yellow River, Zenodo [data set], https://doi.org/10.5281/zenodo.22766232, 2026.
Wang, M., Sun, K., Jia, J., Yu, G., and Gao, Y.: Unraveling the carbon fraction heterogeneity in China's Rivers: Hydrology, nutrients, and dam regulation, Water Res., 288, 124591, https://doi.org/10.1016/j.watres.2025.124591, 2026.
Wang, S., Shen, M., Liu, W., Ma, Y., Shi, H., Zhang, J., and Liu, D.: Developing remote sensing methods for monitoring water quality of alpine rivers on the Tibetan Plateau, GIScience Remote Sens., 59, 1384–1405, https://doi.org/10.1080/15481603.2022.2116078, 2022.
Wang, S., Benoit, G., Raymond, P. A., Yu, G., Zhou, F., Liu, S., Miao, C., Sun, K., Li, Z., Jia, J., and Gao, Y.: Dissolved carbon storage and flux dynamics in China's inland waters over the past 30 years, Natl. Sci. Rev., 12, nwaf229, https://doi.org/10.1093/nsr/nwaf229, 2025a.
Wang, T., Yang, D., Yang, Y., Piao, S., Li, X., Cheng, G., and Fu, B.: Permafrost thawing puts the frozen carbon at risk over the Tibetan Plateau, Sci. Adv., 6, eaaz3513, https://doi.org/10.1126/sciadv.aaz3513, 2020.
Wang, W., Zhong, J., Li, S.-L., Ulloa-Cedamanos, F., Xu, S., Chen, S., Lai, M., and Xu, S.: Constraining the sources and cycling of dissolved inorganic carbon in an alpine river, eastern Qinghai-Tibet Plateau, Sci. Total Environ., 901, 166262, https://doi.org/10.1016/j.scitotenv.2023.166262, 2023.
Wang, X., Wu, Y., Luo, M., Katsanou, K., Wenninger, J., and Bol, R.: Exports of organic matter, phosphorus and nitrogen from Sichuan Basin: A critical region regulating water quality of the Upper Yangtze River, China, J. Hydrol., 662, 133889, https://doi.org/10.1016/j.jhydrol.2025.133889, 2025b.
Wen, W., Gao, L., Cheng, H., Xiao, L., Zhang, S., Li, S., Jiang, X., and Xia, X.: Legacy and alternative perfluoroalkyl acids in the Yellow River on the Qinghai-Tibet Plateau: Levels, spatiotemporal characteristics, and multimedia transport processes, Water Res., 262, 122095, https://doi.org/10.1016/j.watres.2024.122095, 2024.
Wu, Y., Su, H., Cheng, L., Qin, S., Zou, K., Liu, Y., Zhou, J., Liu, P., and Zhang, L.: Exploring hydrological controls on dissolved organic carbon export dynamics in a typical flash flood catchment using a process-based model, Sci. Total Environ., 921, 171139, https://doi.org/10.1016/j.scitotenv.2024.171139, 2024.
Xu, S., Li, S.-L., Bufe, A., Klaus, M., Zhong, J., Wen, H., Chen, S., and Li, L.: Escalating Carbon Export from High-Elevation Rivers in a Warming Climate, Environ. Sci. Technol., 58, 7032–7044, https://doi.org/10.1021/acs.est.3c06777, 2024.
Yan, N., Qiu, Z., Zhang, C., Yan, Y., and Liu, D.: Landsat monitoring reveals the history of river organic pollution across China during 1984–2023, Water Res., 275, 123210, https://doi.org/10.1016/j.watres.2025.123210, 2025.
Yan, Y., Lauerwald, R., Wang, X., Regnier, P., Ciais, P., Ran, L., Gao, Y., Huang, L., Zhang, Y., and Duan, Z.: Increasing riverine export of dissolved organic carbon from China, Glob. Change Biol., 29, 5014–5032, https://doi.org/10.1111/gcb.16819, 2023.
Yang, J., Wang, T., Yang, D., and Yang, Y.: Insights into runoff changes in the source region of Yellow River under frozen ground degradation, J. Hydrol., 617, 128892, https://doi.org/10.1016/j.jhydrol.2022.128892, 2023.
Yang, M., Li, S., Wang, S., Huang, Q., Shen, Q., Kang, Y., Shi, M., Zhang, Y., and Luo, D.: Latitudinal gradient and environmental drivers of soil organic carbon in permafrost regions of the Headwater Area of the Yellow River, Carbon Neutrality, 4, 16, https://doi.org/10.1007/s43979-025-00130-1, 2025.
Yao, T., Bolch, T., Chen, D., Gao, J., Immerzeel, W., Piao, S., Su, F., Thompson, L., Wada, Y., Wang, L., Wang, T., Wu, G., Xu, B., Yang, W., Zhang, G., and Zhao, P.: The imbalance of the Asian water tower, Nat. Rev. Earth Environ., 3, 618–632, https://doi.org/10.1038/s43017-022-00299-4, 2022.
Zeng, F., Song, C., Cao, Z., Xue, K., Lu, S., Chen, T., and Liu, K.: Monitoring inland water via Sentinel satellite constellation: A review and perspective, ISPRS J. Photogramm., 204, 340–361, https://doi.org/10.1016/j.isprsjprs.2023.09.011, 2023.
Zhang, Z., Zhang, L., Liu, Y., and Jin, M.: Responses of annual streamflow variability to annual precipitation, extreme climate events and large-scale climate phenomena in the Qinghai-Tibet Plateau, J. Hydrol., 632, 130969, https://doi.org/10.1016/j.jhydrol.2024.130969, 2024.
Zhao, W., Cheng, Y., Jian, J., Jiao, J., Cheng, C., Li, J., and Chen, T.: Water erosion changes on the Qinghai-Tibet Plateau and its response to climate variability and human activities during 1982–2015, CATENA, 229, 107207, https://doi.org/10.1016/j.catena.2023.107207, 2023.
Zhi, W., Appling, A. P., Golden, H. E., Podgorski, J., and Li, L.: Deep learning for water quality, Nat. Water, 2, 228–241, https://doi.org/10.1038/s44221-024-00202-z, 2024.