
the Creative Commons Attribution 4.0 License.
the Creative Commons Attribution 4.0 License.
 | 09 Nov 2026
Spatiotemporal dynamics and drivers of bare soil albedo in European croplands

Philippe Ciais
Ronny Lauerwald
David Makowski
Tianqi Shi
Shengbiao Wu
Petra Sieber
Chuanlong Zhou
Daniel S. Goll
Bare soil albedo plays a critical role in regulating surface energy balance and land-atmosphere interactions in agricultural systems, yet its spatiotemporal variability and controlling factors remain poorly quantified at the field scale across heterogeneous cropland landscapes. To address this, we investigate the spatial patterns and temporal dynamics of bare soil albedo in European croplands. We develop a method to reconstruct field-scale, spatiotemporally continuous bare soil albedo at a 5 d temporal resolution and 0.3 km spatial resolution using Sentinel-2 reflectance observations. Bare soil periods are identified by multiple spectral indices and the corresponding soil albedo values are derived for the period 2018–2020 using a novel machine learning framework. Two random forest models were employed to separately capture the long-term spatial structure and short-term temporal anomalies of bare soil albedo, allowing gaps caused by clouds, snow, and vegetation cover to be bridged. Model evaluation against independent site observations and existing products shows that the estimated bare soil albedo reproduces observed spatial gradients and seasonal variability across European croplands. Such variations in bare soil albedo are jointly controlled by soil properties, observation geometry and short-term soil moisture dynamics rather than by any single factor. Because these variations are of the same order of magnitude as radiation management solutions, soil radiative properties must be considered in their assessment. The resulting bare soil albedo offers a process-oriented basis for improving the representation of surface radiative properties and land-atmosphere coupling in agroecosystem and land surface models.
- Article
(2622 KB) - Full-text XML
-
Supplement
(1028 KB) - BibTeX
- EndNote


Albedo, the proportion of incoming solar radiation reflected by a surface, modulates the local and global heat budgets by controlling the amount of incoming solar radiation that is absorbed and transformed into heat. Given that croplands occupy 37 % of the Earth's land area (FAO, 2023), it is important to quantify the albedo-related climate impacts of agricultural practices (Davin et al., 2014; Sieber et al., 2022) as they can offset or enhance the effects of greenhouse gas emissions (Bright et al., 2015).
In agricultural areas, the soil is bare (i.e., without any plant or litter cover) between successive growing periods, typically during a few months between the harvest of one crop and the sowing of the next crops. Bare soil albedo affects crop growth by modulating the local surface energy balance (e.g., through soil temperature and soil moisture) (Bsaibes et al., 2009; Zhang et al., 2022). It also influences the magnitude of agriculture-induced albedo changes and the resulting climate impacts (i.e., radiative forcing). Bare soil albedo is controlled by a combination of intrinsic soil properties and varying environmental conditions (He et al., 2019). Soil properties, including texture, mineral composition, roughness, organic matter content, and bulk density determine the optical characteristics of soil surface (Matthias et al., 2000; Cierniewski et al., 2018). As a result, they affect soil albedo directly and indirectly (via modulating the relationship between albedo and water availability). Soil moisture and solar illumination geometry further modulate the short-term temporal variability of soil albedo by altering the amount and direction of the observed reflected solar radiation (Hapke, 1981; Gascoin et al., 2009; Badía et al., 2016). The interaction of these factors, as well as the frequent agricultural activities (e.g., harvest, changes of crop types), gives rise to pronounced spatial heterogeneity and rapid temporal variability, particularly in intensively managed agricultural landscapes (Starr et al., 2020; Sieber et al., 2022). Nevertheless, the spatiotemporal variability and controlling mechanisms of bare soil albedo remain insufficiently quantified at field scale across heterogeneous cropland regions.
Ground-based measurements, airborne or unmanned aerial vehicle measurements measure incoming and outgoing solar radiation over the soil surface, but have limited spatial coverage (Canisius et al., 2019; Pastorello et al., 2020; Amazirh et al., 2021; Pan et al., 2024). Satellites observations provide comprehensive spectral reflectance data with extensive temporal and spatial coverage, allowing for the monitoring of bare soil albedo datasets at regional to global scale (Lesaignoux et al., 2009; Verheijen et al., 2013; Carrer et al., 2014; Cierniewski et al., 2017; Rizzo et al., 2023). However, commonly used satellite-based products, such as those derived from MODIS, typically operate at spatial resolutions of several hundred meters to kilometers and temporal resolutions of weeks to months, which limits their ability to resolve field-scale heterogeneity and short-term albedo dynamics driven by soil moisture fluctuations and agricultural management (Zhou et al., 2005; Houldcroft et al., 2009; Cheng and Liang, 2014; He et al., 2019).
For example, the ECOCLIMAP project provides bare soil albedo datasets at a coarse spatial resolution of 1 km and a temporal resolution ranging from 10 d to monthly, which is designed for use in climate modelling, but does not meet the resolution requirements for effective agricultural monitoring able to capture the impacts of agricultural management (Masson et al., 2003; Faroux et al., 2013; Carrer et al., 2014). While products at sufficiently high spatiotemporal resolution exist but are limited to small regions or short time periods, constraining their applicability for continental-scale process analysis (Bsaibes et al., 2009; Roujean et al., 2018).
Numerical models based on physical processes such as radiative transfer models are also applied to produce bare soil albedo combined with satellite-based reflectance (Jacquemoud et al., 1992; Bablet et al., 2018). For example, a global ∼50 km monthly bare soil albedo map was generated by radiative transfer equations from 2001 to 2009 based on MODIS surface albedo (Pinty et al., 2011). However, this coarse spatiotemporal resolution limits its utility in evaluating albedo-related climate impacts of land management. Additionally, because of issues related to calibration and validation, the reliability of the simulations provided by process-based models is limited (Bsaibes et al., 2009).
Machine learning can investigate bare soil albedo dynamics by considering complex dependencies between variables and deliver more accurate and reliable predictions than traditional statistical methods (Jones, 2017; Nguyen, 2021; Buster et al., 2024). This capability is particularly valuable for understanding the complex interactions between bare soil albedo, climate, and pedological features, as opposed to traditional statistical approaches that typically rely on simple relationships between bare soil albedo and single features such as the exponential relationship between bare soil albedo and soil water content (Lesaignoux et al., 2009; Gascoin et al., 2009; Verheijen et al., 2013). Additionally, machine learning-based predictions of bare soil albedo can address spatiotemporal gaps in satellite observations (Ren et al., 2022) caused by snow and cloud cover, enabling large-scale continuous and dynamic analysis and simulation of bare soil albedo in crop regions under historical, present and future scenarios. When combined with high-resolution satellite imagery (e.g., Sentinel-2 satellite with 0.01 km spatial resolution), machine learning enables the reconstruction of continuous bare soil albedo at both large scales and high resolution, especially in cropland regions.
In this study, we investigate the spatiotemporal variability and drivers of bare soil albedo across European croplands by integrating Sentinel-2 observations with a machine-learning reconstruction framework. We test two hypotheses: (1) for the spatial distribution of bare soil albedo, soil properties exert a stronger control than radiative factors, and (2) for temporal variability of bare soil albedo, fluctuation in soil moisture is more influential than static soil properties. To address these hypotheses, our objectives are to (1) quantify the spatial patterns of bare soil albedo at the field scale across Europe, (2) characterize the temporal dynamics of bare soil albedo during bare soil periods, and (3) identify the relative contributions of soil and topographic properties versus dynamic drivers such as soil moisture and solar geometry. By doing so, we provide a process-oriented assessment of bare soil albedo variability that is relevant for understanding the energy balance of agricultural systems and improving the representation of surface radiative properties in land surface models.
2.1 Data source and processing
Our approach consists of the following steps (Fig. 1): First, we identified bare soil periods and extracted corresponding bare soil albedo (αbs) values from Sentinel-2 surface albedo products based on thresholds of satellite-derived indices. Second, we trained two random forest (RF) models on Sentinel-2 surface albedo during bare soil periods for the prediction of spatial distribution and temporal anomaly of αbs at the European cropland scale. Third, we compared the predicted αbs to existing αbs datasets at site or European scales.
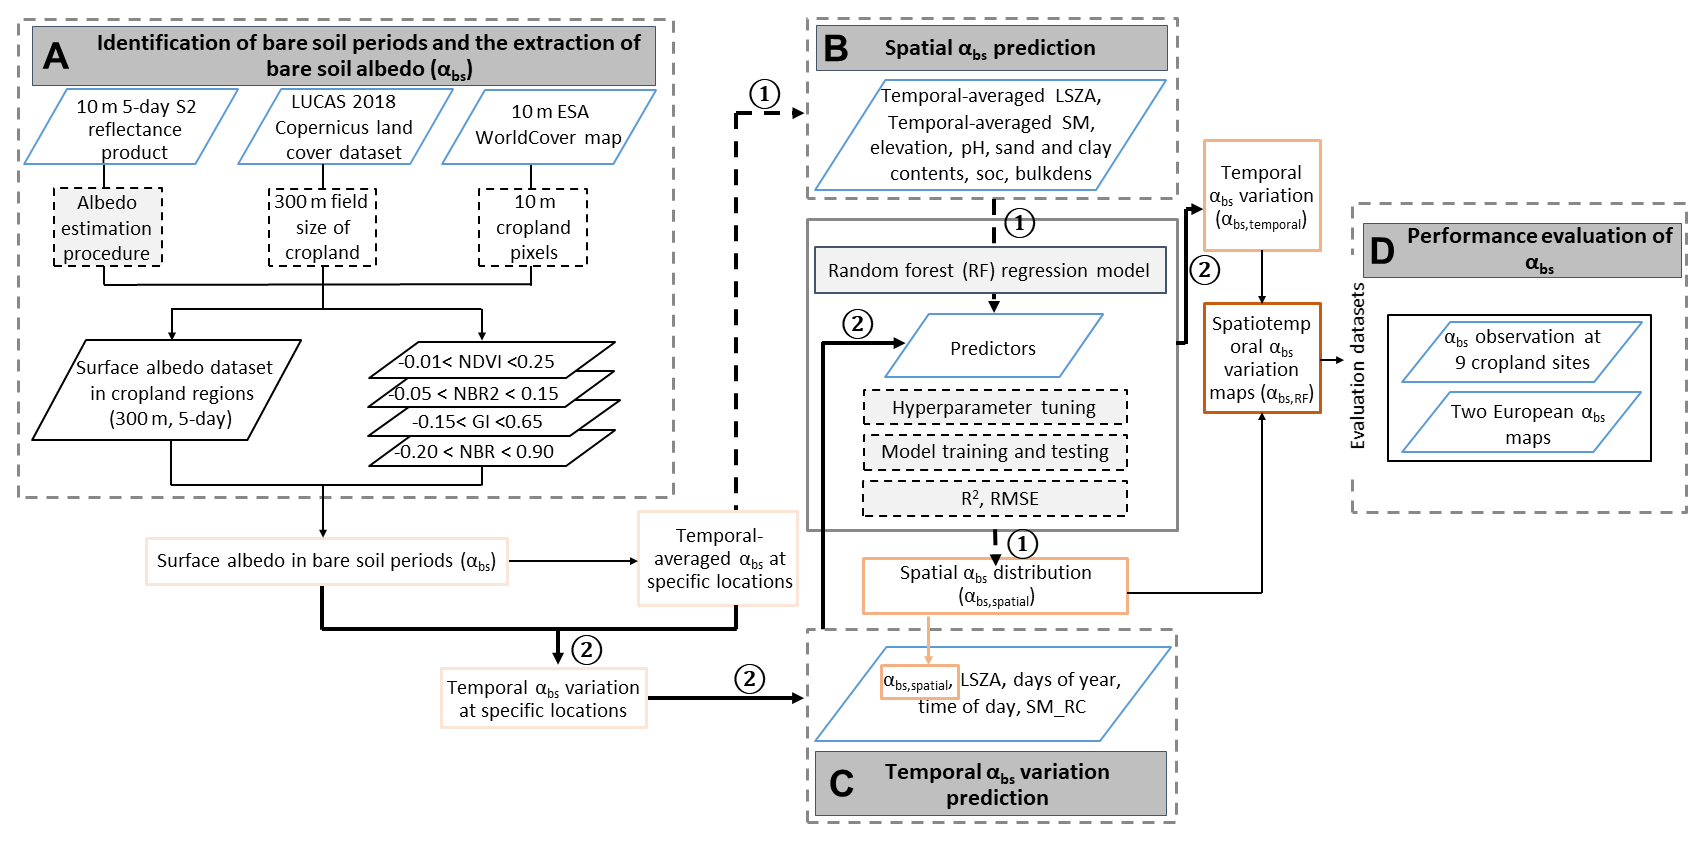
Figure 1The flow chart of the data processing procedure. “NDVI, NBR2, GI, NBR” are the normalized difference vegetation index (NDVI), normalized burn ratio 2 index (NBR2), greenness index (GI) and the normalized burn ratio index (NBR), respectively. “LSZA, SM, SM_RC, SOC, bulkdens” represent local solar zenith angle (LSZA), soil moisture (SM), relative SM anomaly (SM_RC), soil organic carbon (SOC) and bulk density (bulkdens), respectively. “αbs,spatial”, “αbs,temporal” and “αbs,RF” are the spatial distribution and temporal variation of bare soil albedo (αbs) predicted by random forest models, and the final spatiotemporal αbs maps, respectively. R2 and RMSE are the coefficient of determination and root mean square error. The bold black dotted (“1”) and solid arrow (“2”) lines represent the procedure of spatial and temporal αbs prediction, respectively.
2.1.1 Daily surface albedo
We derived 5 d 0.3 km black-sky albedo (BSA) and white-sky albedo (WSA) from the 0.01 km Sentinel-2 surface reflectance product for the period 2018–2020 using the approach of Lin et al. (2022). This approach uses a look-up table trained on prior information on the angular-based relationships between surface reflectance and broadband albedo derived from the 0.5 km resolution MODIS BRDF product (MCD43A1). The look-up table is used to derive BSA and WSA from Sentinel-2 surface reflectance product assuming the same relationship as between BSA and WSA and MODIS BRDF product. The daily albedo derived from Sentinel-2 reflectance shows a higher correlation with site observations (n=588) (R2=0.44, RMSE = 0.004) compared to the MODIS product (R2=0.16, RMSE = 0.06) (Fig. S7 in the Supplement). This provides support for the use of the Sentinel-2 reflectance in combination with the look-up table trained on MODIS.
A cloud probability product was utilized to filter out images affected by cloud cover. This process employed cloud masking parameters as outlined in the Google Earth Engine Sentinel-2 cloud masking tutorial (https://developers.google.com/earth-engine/tutorials/community/sentinel-2-s2cloudless, last access: 31 October 2026).
Specifically, the “CLOUD FILTER” and the “BUFFER” parameters were set to 10 % and 0.02 km in this process. This framework was accomplished on the Google Earth Engine platform to produce the datasets of BSA and WSA with a spatial resolution of 0.3 km at a European scale. We used 0.3 km as the spatial resolution to match the average field size in Europe and ensure a sufficiently large number of data points required for machine learning (see below).
We finally obtained the 5 d shortwave surface albedo (α) from BSA and WSA weighted by the fraction of diffuse solar radiation (kd):
The parameter kd is computed based on the global surface solar radiation (S0, MJ m−2 d−1) and extra-terrestrial solar radiation (Se, MJ m−2 d−1) during the same periods with BSA and WSA datasets. Details of the diffuse solar radiation model can be found in Yang et al. (2019). S0 corresponds to the daily average of hourly downward surface solar radiation at the spatial resolution of ∼11.1 km from the European Centre for Medium-Range Weather Forecasts (ECMWF) Reanalysis 5 (ERA5) (Hersbach et al., 2020). Se is estimated from the solar constant, the solar declination and the time of the year in a specific location, which is described by Allen et al. (2006).
Filtering Sentinel-2 surface albedo during bare soil periods from 2018 to 2020 using spectral indices, we obtained 132 487 soil samples in the European cropland regions. The average Sentinel-2 αbs of all 0.3 km resolution bare soil pixels is approximately 0.18±0.03 (mean ± standard deviation). Details of extracting bare soil periods in European cropland regions and defining the 0.3 km spatial resolution of Sentinel-2 αbs are described below.
We computed (1) the temporal average at each 0.3 km sample location for training and testing an RF model for the spatial pattern of αbs, and (2) the temporal anomaly of αbs as the difference between the original αbs and the temporal average. Samples with an anomaly of 0 were removed as they represent locations with only a single αbs observation, thus lacking temporal representativeness. The αbs anomaly dataset was used as the dependent feature for training and testing RF for the temporal anomaly of αbs.
2.1.2 European cropland mask
The ESA WorldCover product at 0.01 km spatial resolution generated from Sentinel-1 and Sentinel-2 observations in 2021 was utilized to identify croplands in Europe (https://esa-worldcover.org/, last access: 31 October 2026) (Zanaga et al., 2022). This time-invariant product includes 11 land cover types, including one class for croplands.
2.1.3 Average crop field size
We leveraged the Land Use/Cover Area frame Survey (LUCAS) 2018 Copernicus land cover dataset (d'Andrimont et al., 2021) to estimate the averaged field size in European croplands to decide on the spatial resolution. The LUCAS dataset encompasses 63 287 polygons distributed across various land cover types with 120 attributes in Europe, including artificial lands (0.6 %), croplands (34.1 %), woodlands (30.0 %), shrublands (4.5 %), grasslands (28.0 %), bare lands (2.5 %), wetlands (0.3 %) and water (0.0 %). The field sizes of cropland in the LUCAS dataset were labelled as categorical attributes in four levels, including “>10 ha”, “1–10 ha”, “0.5–1 ha” and “<0.5 ha”. We assigned representative values of 15, 5, 0.75 and 0.25 ha for each category (Fig. S8) to approximate the averaged radius of external circles of cropland regions at 0.16 km, varying from 0.03 to 0.22 km (n=36 199). For simplification, 0.15 km radius (pixel size of 0.3 km) was finally defined as the spatial scale of the Sentinel-2 αbs dataset in this study. Aggregation of 0.01 km observations to 0.3 km is also a strategy to increase temporal Sentinel-2 coverage. While it loses fine-scale details (like hedges, within field heterogeneity), it not only increases the likelihood for suited conditions for bare soil observations at a given location but also gains robustness, reduces noise, and facilitates processing.
2.1.4 Periods of bare soil exposure
To extract periods with bare soil in European cropland regions, we used four spectral indices and their thresholds from previous analysis (Rizzo et al., 2023), including greenness index (GI) (GI <0.65), normalized difference vegetation index (NDVI) (), normalized burn ratio index (NBR) (NBR ) and normalized burn ratio 2 index (NBR2) (). The thresholds of these four indices were determined based on the spectra of 8005 soil samples collected globally (Rizzo et al., 2023). In this analysis, these indices were computed from the Sentinel-2 reflectance product on GEE (Table 1). We further utilized the NDVI and normalized difference snow index (NDSI) to eliminate the periods influenced by water or snow cover on soils. Dates with NDVI lower than 0 were excluded to avoid water bodies, rocks or other non-vegetated land surfaces (Korchagina et al., 2020). An NDSI threshold of 0.1 was utilized to obtain snow-free bare soil periods, which is stricter than the commonly used threshold of 0.4 (Riggs et al., 2016; Härer et al., 2018). Bare soil period is identified if the conditions of all indices are satisfied. Finally, data points outside mean ± two standard deviations were considered outliers and removed.
Table 1The vegetation index for extracting the bare soil periods in European cropland regions from 2018 to 2020.
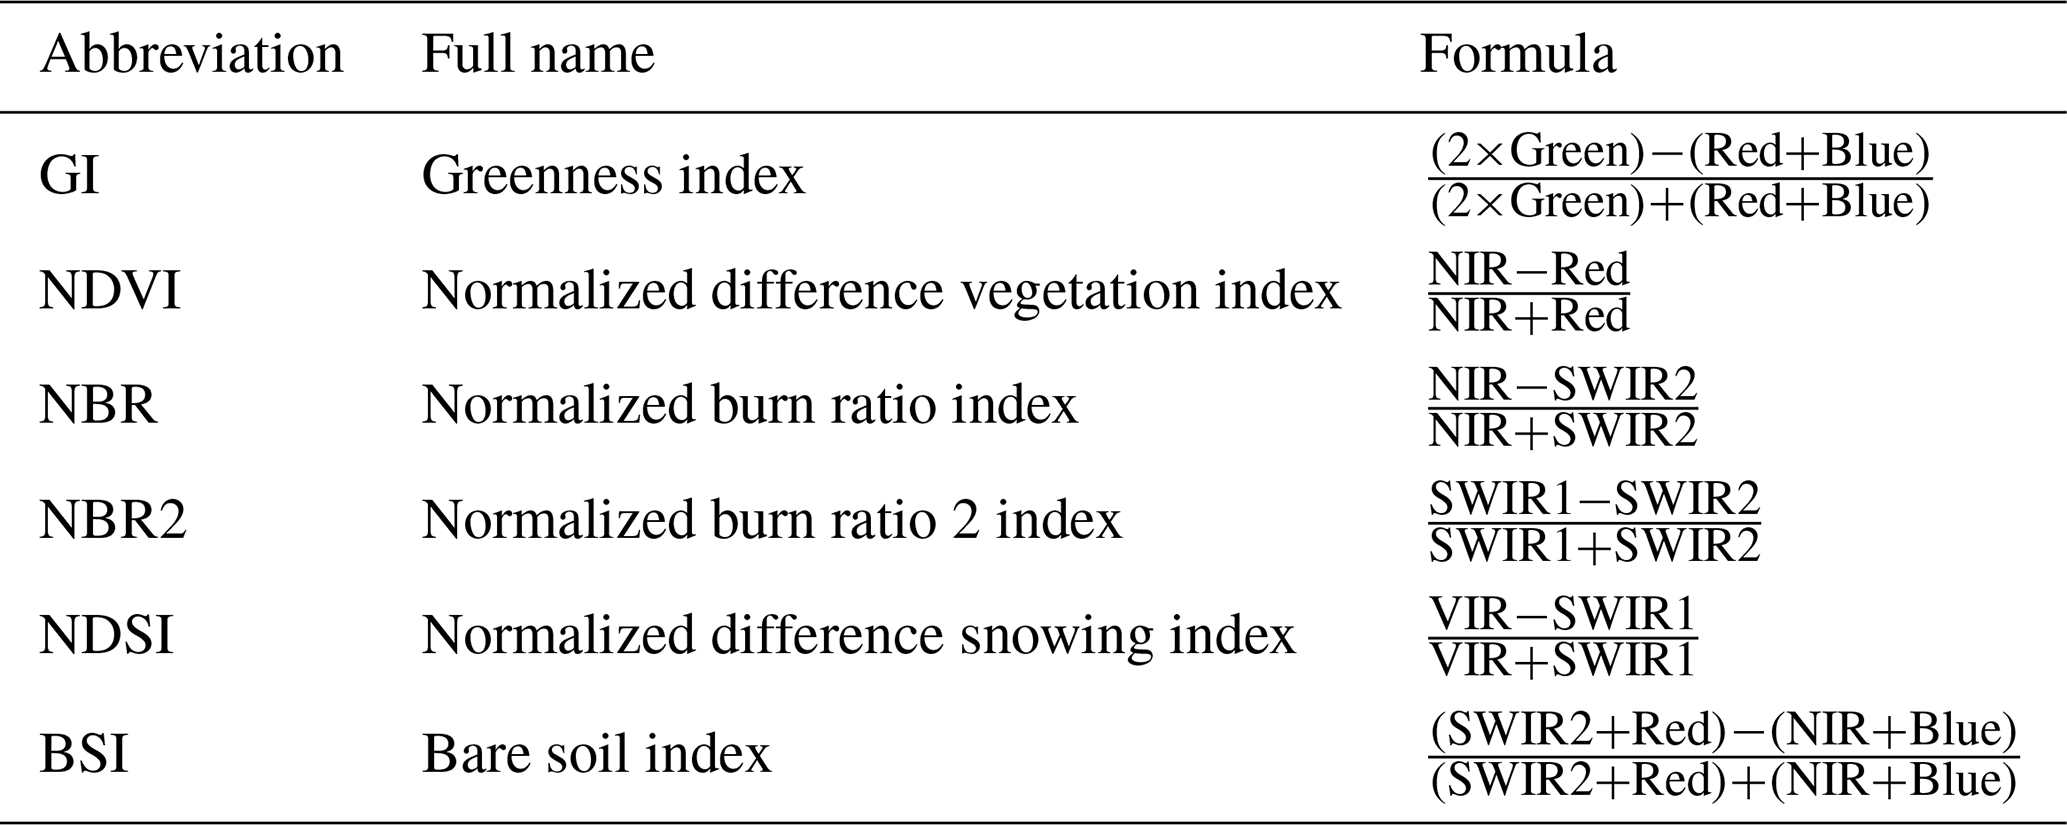
The Blue, Green (VIR), Red, NIR, SWIR1 and SWIR2 are represented by bands 2, 3, 4, 8, 11 and 12 of Sentinel-2 products, respectively.
2.2 Random Forest models for mapping bare soil albedo
2.2.1 Rationale and design choices
The Sentinel-2 time series over Europe contains frequent gaps due to cloud and snow cover, which hinder regular sampling of bare soil conditions. To obtain spatiotemporally continuous fields, we used a RF model to learn the relationship between observed αbs dynamics and potential drivers, thereby extending Sentinel-2 observations in time and space. RF is well-suited to nonlinear responses, mixed predictors, and heterogeneous sampling, and is widely applied in remote sensing regression and gap filling (Breiman, 2001).
2.2.2 Model inputs and outputs
Two RF models were developed. The first model aimed at predicting the spatial distribution of the temporal average of αbs (αbs,spatial). Predictions were performed from the following input features: temporal-averaged local solar zenith angle (LSZA), soil organic carbon (SOC), sand and clay contents, bulk density, pH, temporally averaged soil moisture (SM) and elevation (Table 2).
Table 2Features used in the analysis, including satellite properties, atmosphere, soil and surface conditions, as well as country identity.
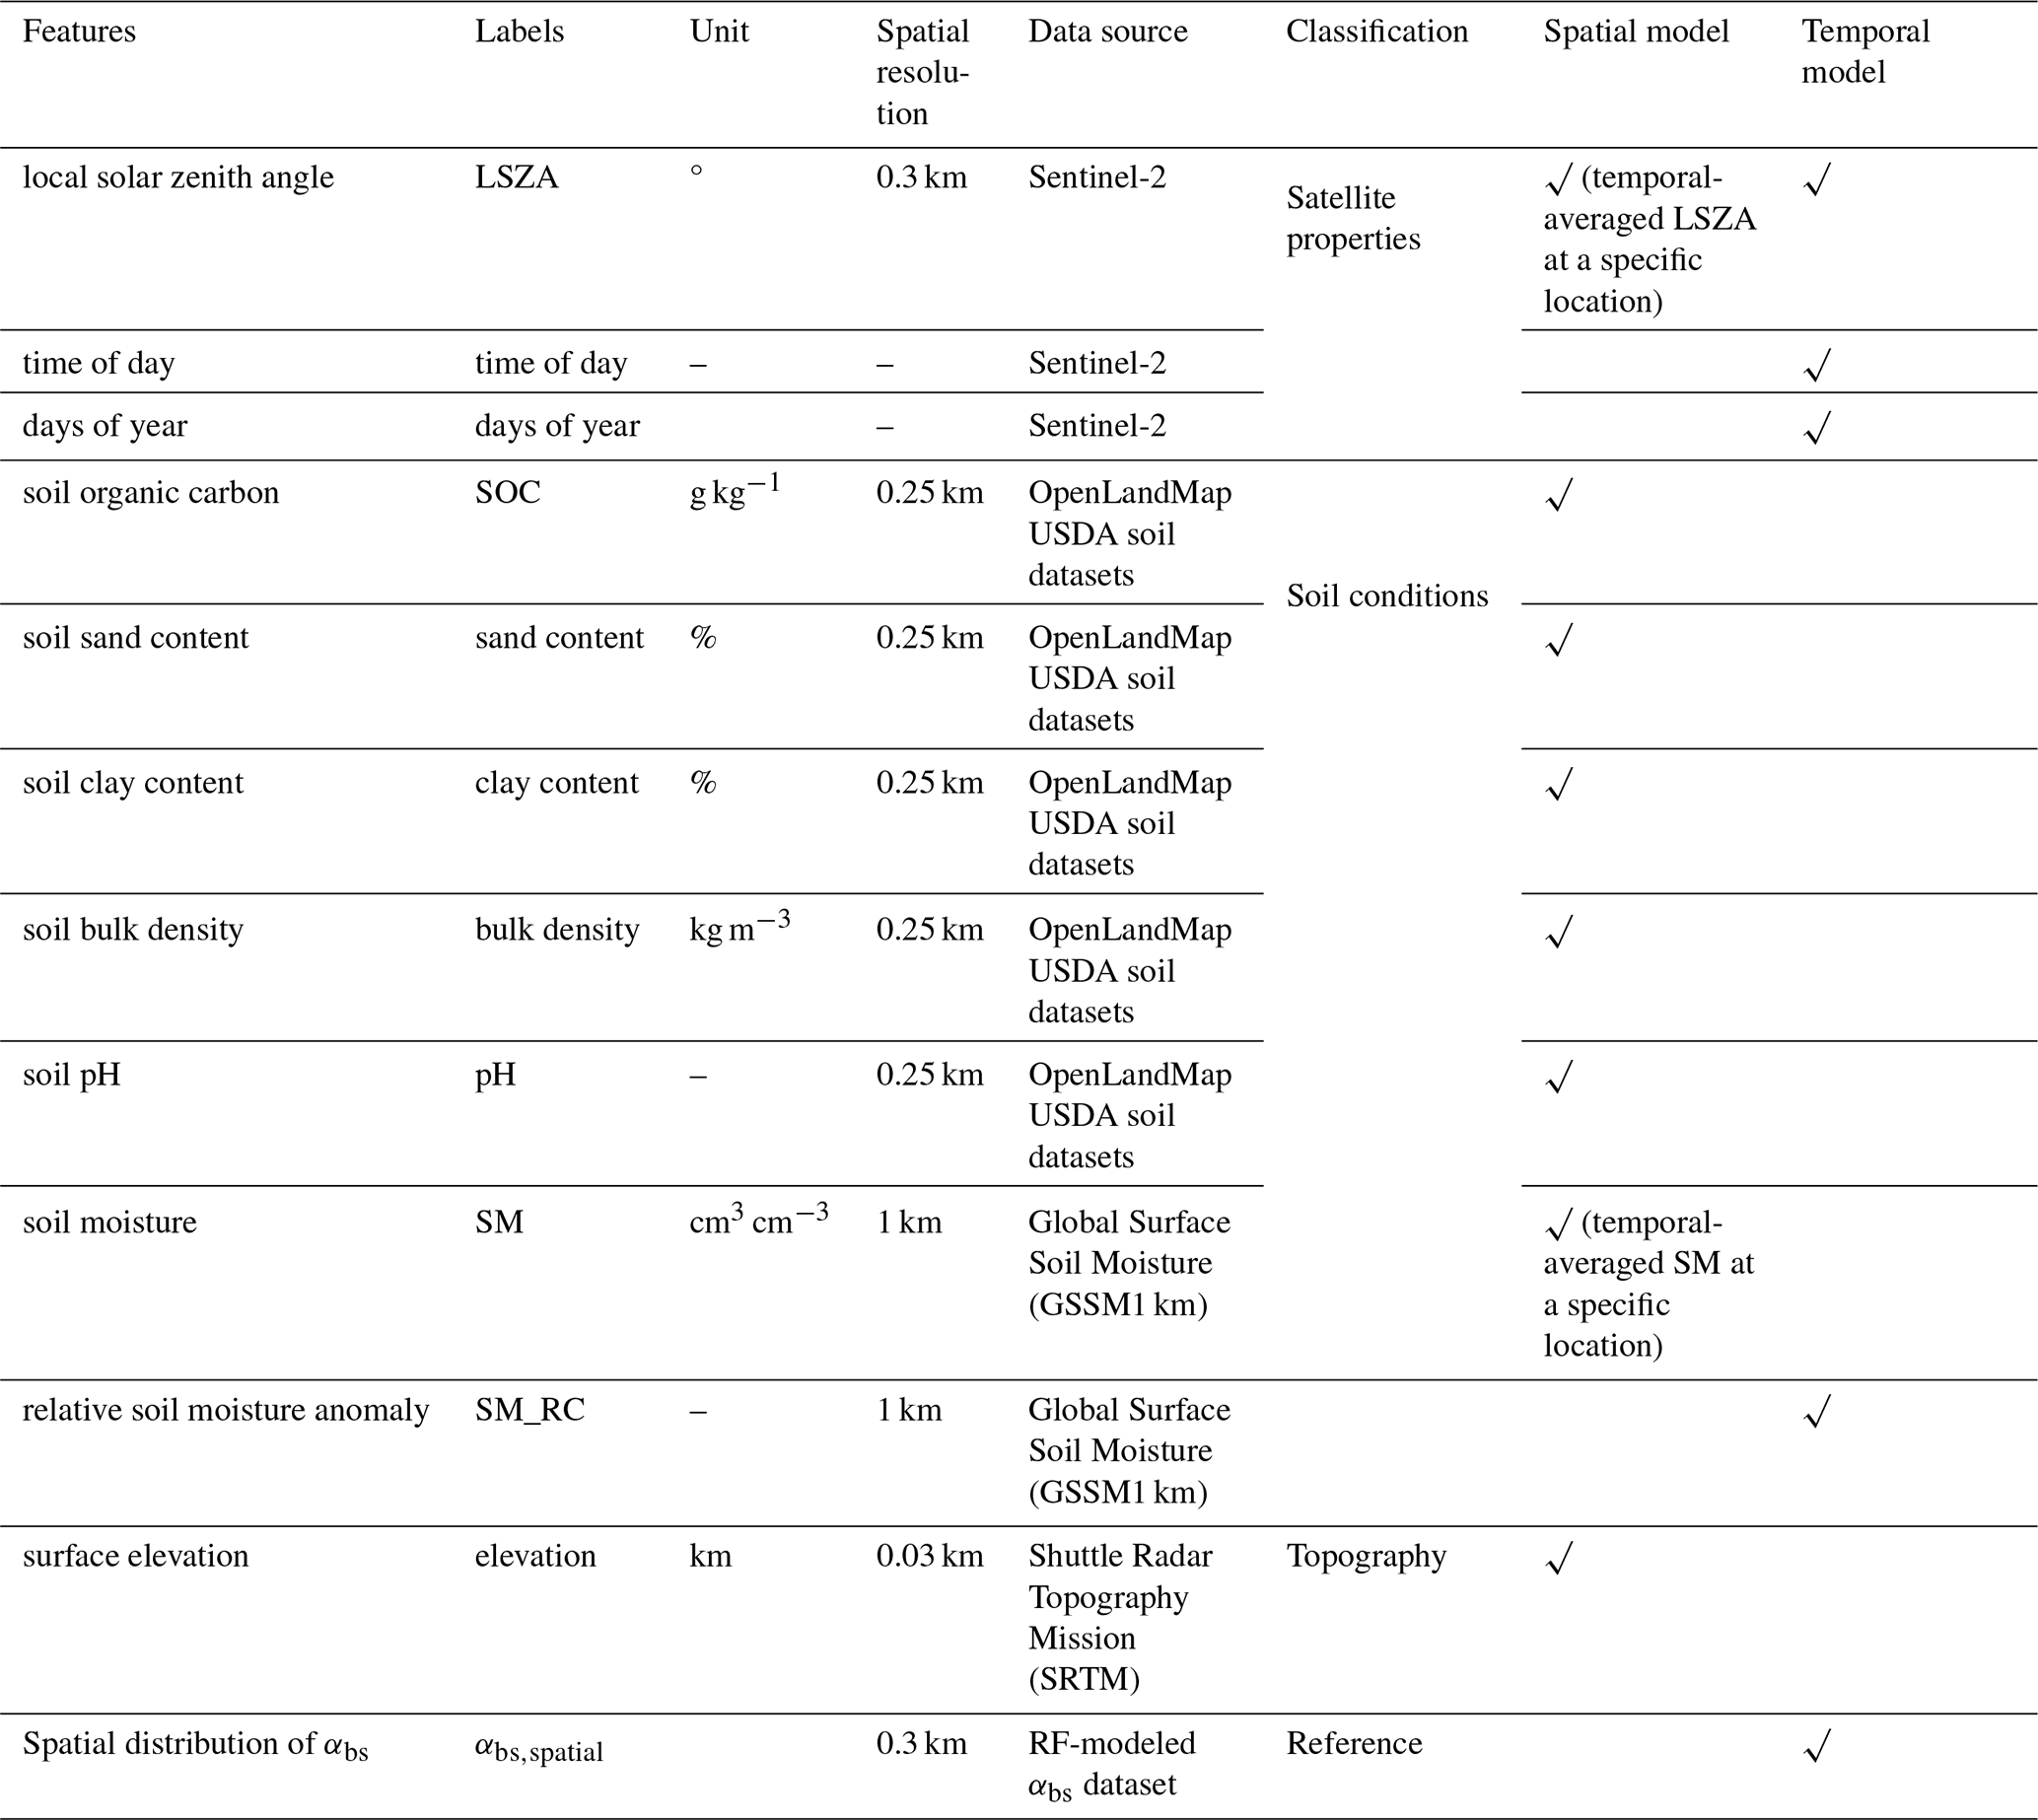
The second model aimed at predicting the temporal variation of αbs, defined as . The input features of this second model were LSZA, time of day, days of year, relative SM anomaly (SM_RC) and the predicted values of αbs,spatialprovided by the first RF model (Table 2). All the input features were linearly resampled from the original resolution to 0.3 km pixel size and 5 d temporal resolution to match the pixel size of αbs.
The selection of features was based on theoretical and empirical evidence for their potential control on αbs. SOC, sand and clay contents, bulk density and pH affect αbs by modulating soil color, microtopography, surface roughness and water-holding capacity (Cierniewski et al., 2014; Sadeghi et al., 2018; Elfarisna et al., 2024). For example, light-colored sand soil generally has a higher αbs due to larger particles with smoother surfaces, as well as weaker water-holding capacity for reflecting solar radiation, compared to clay and silt (Sun et al., 2015). The elevation, extracted from the digital elevation model (DEM), affects the distribution of incoming solar radiation on the soil and, consequently αbs (Wen et al., 2013). The LSZA, days of year and time of day affect αbs by controlling the direction and the path length of solar radiation in the sun-surface-satellite geometry (Yang et al., 2008). SM is negatively correlated with αbs by changing soil colors and influencing the soil roughness for specific soil types (e.g., dry soil tends to form clods or aggregates, increasing surface roughness) (Gascoin et al., 2009; Sugathan et al., 2014; Rizzo et al., 2023).
The five 0.25 km time-invariant top (upper 30 cm) soil properties (SOC, sand and clay contents, bulk density and pH) were extracted from the U.S. Department of Agriculture (USDA) soil datasets of OpenLandMap (Hengl, 2018a, b, c; Hengl and Wheeler, 2018). The 0.03 km static DEM was obtained from the Shuttle Radar Topography Mission (SRTM) (Farr et al., 2007). The satellite properties (LSZA, days of year and time of day) were derived from Sentinel-2 reflectance products with a 5 d interval and 0.3 km spatial resolution. The SM dataset is from the 1 km daily Global Surface Soil Moisture (GSSM) product (Han et al., 2023), which provides the temporal dynamics of the daily surface soil moisture (0–5 cm) in cm3 cm−3, at a coarse spatial resolution of 1 km in European scale from 2000 to 2020. GSSM was predicted from machine learning using the datasets of the International Soil Moisture Network, satellite and meteorology (Han et al., 2022).
The SM_RC is calculated as the relative deviation from the temporal-averaged SM in each pixel:
Where SMi,j and SM_RCi,j are the SM value and relative SM anomaly at time i in pixel j, respectively. SMave,j is the temporal-averaged SM in pixel j.
2.2.3 Training and testing of the models
The procedure involves hyperparameter tuning, model training and testing. This procedure was implemented to build the two RF models predicting αbs,spatial and αbs,temporal.
We used a dataset including a total of 75 941 values of the temporal average of αbs for training and testing the first model, and a dataset including a total of 56 754 values of the temporal anomaly of αbs for training and testing the second model. Each dataset was randomly split into two samples: one for training and hyperparameter tuning (80 %), and one for out-of-box testing (20 %). Hyperparameter tuning was conducted for each model separately, using 10-fold cross-validation with grid searching on the training dataset. Hyperparameters include the number of decision trees (ntrees) from 300 to 1000, and the number of variables sampled (mtry) from 2 to 7 at each split. Specifically, for each pair of hyperparameters (e.g. ntrees of 300 and mtry of 2). The procedure of 10-fold cross-validation is described in Sect. S1 in the Supplement.
With the selected optimal hyperparameters, the RF model was trained on the whole training dataset and hyperparameter tuning sample, and assessed on the out-of-box testing sample using R2 and RMSE as quality indicators. Overfitting was additionally checked by comparing the final R2 against the R2 obtained during cross-validation.
The SHAP (SHapley Additive exPlanations) values indicate the contribution of each value for each feature to the individual model prediction by considering all possible combinations of feature subsets (Zhang et al., 2022). The SHAP values of the features in spatial and temporal RF models were induced to visualize the dependencies among features in jointly deciding the αbs variation.
2.2.4 Predicting bare soil albedo over European croplands
The trained spatial and temporal RF models were then applied to produce the 5 d 0.3 km European αbs datasets based on the selected features: (1) LSZA, SM, elevation, SOC, pH, clay content, sand content and bulk density for predicting αbs,spatial with the spatial RF model; (2) LSZA, αbs,spatial, SM_RC, days of year, and time of day for predicting αbs,temporal with the temporal RF model. The final continuous spatial-temporal predictions (αbs,RF) were derived by adding the predictions of αbs,temporal and αbs,spatial, as follows
2.3 Independent evaluation datasets
Five types of αbs datasets were utilized to evaluate the performance of the final spatiotemporal albedo predictions (αbs,RF) at seven ICOS European cropland sites (BE-Lon, FR-Lam, FR-Aur, FR-EM2, DE-RuS, DE-Geb, DE-Kli), one European Fluxes Database Cluster (EFDC) European cropland site (CZ-KrP), and one Swedish cropland site in Uppsala, and the overall European cropland regions during bare soil periods (Fig. 3, Table 3). The bare soil periods at ICOS and EFDC sites were manually identified by checking daily or weekly site photos from 2018 to 2020, selecting periods when the soil within the visual range of the camera was visibly exposed without any covers (Fig. S2). The bare soil periods at Swedish cropland sites were obtained from records directly provided in the literature.
Table 3Evaluation datasets of bare soil albedo (αbs) at sites or European cropland regions from the literature.
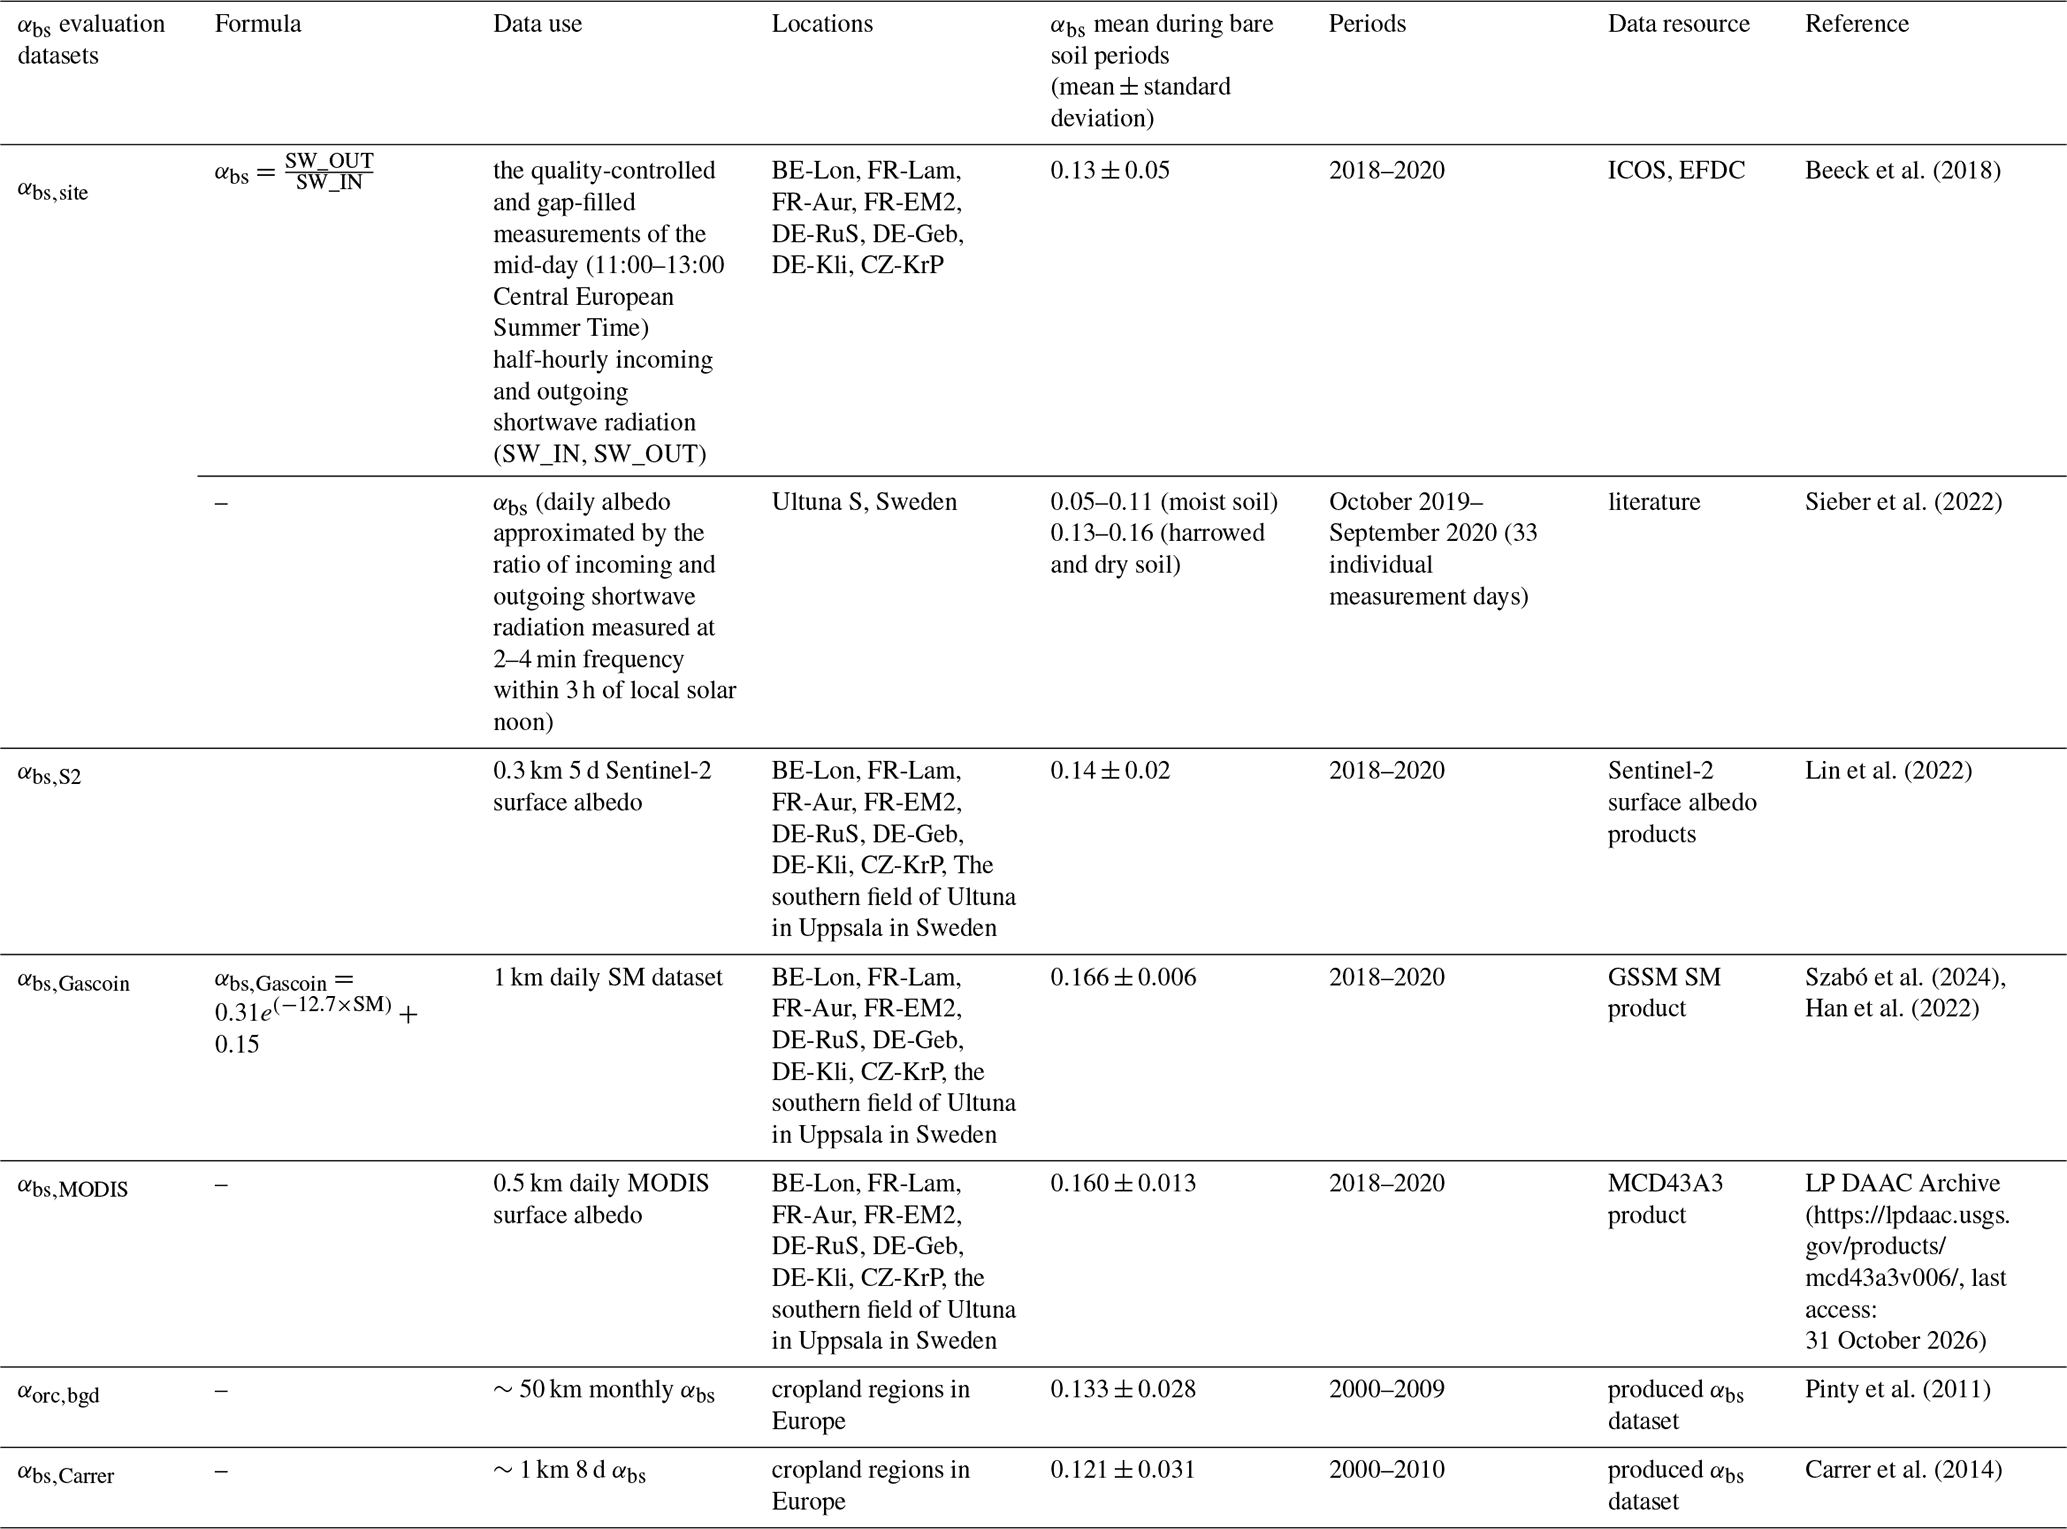
The αbs datasets of all sites, derived either from site eddy covariance measurements or 5 d 0.3 km Sentinel-2 surface albedo observations, are denoted as αbs,site and αbs,S2 to represent the αbs we used for evaluation at site scale in the following text. The αbs,site at the Swedish site, composed of six cropland fields, was extracted from literature directly for comparison (Sieber et al., 2022). The selected eight sites encompass a broad pedoclimatic and management gradient across European croplands (Table S1 in the Supplement). They represent contrasting soil conditions, including Luvisol, Fluvisol, Cambisol, and Chernozem/Phaeozem, with the ranges of silt, clay and sand contents from 26.6 % to 78.1 %, from 14.7 % to 53.0 %, and from 7.2 % to 38.0 %, respectively. These sites also cover diverse climatic conditions in air temperature, incoming shortwave solar radiation, precipitation and cloud cover at annual scale. Seasonal variability in solar radiation and soil moisture (characterized by the seasonal minimum and maximum values in Table S1) captures the range of environmental conditions experienced across seasons. In addition, these sites implement different agricultural management practices, including crop rotations of 2–8 years and bare soil periods occurring mainly in spring, autumn and winter (approximately 30–180 d, Fig. S2).
We aggregated the field data to represent the αbs,site for this site. The comparison at site scale is only implemented if the sample size at each site is more than three.
We additionally examined the relationships between the daily soil sensor SM measurements and different αbs datasets to evaluate their consistency in expressing the dependence of αbs on SM, including αbs,RF, αbs,MODIS, αbs,Gascoin, αbs,S2 and αbs,site (Table 3).
3.1 Controls on spatial and temporal variability of bare soil albedo
The random forest models successfully reproduced both the spatial patterns and temporal variability of αbs across European croplands (Fig. 2a and c), providing a basis for diagnosing the dominant controls on αbs at different scales. The spatial model achieved an R2 of 0.46, while the temporal anomaly model explained 35 % of the observed variability, with both models yielding RMSEs of 0.02 based on out-of-bag evaluation datasets.
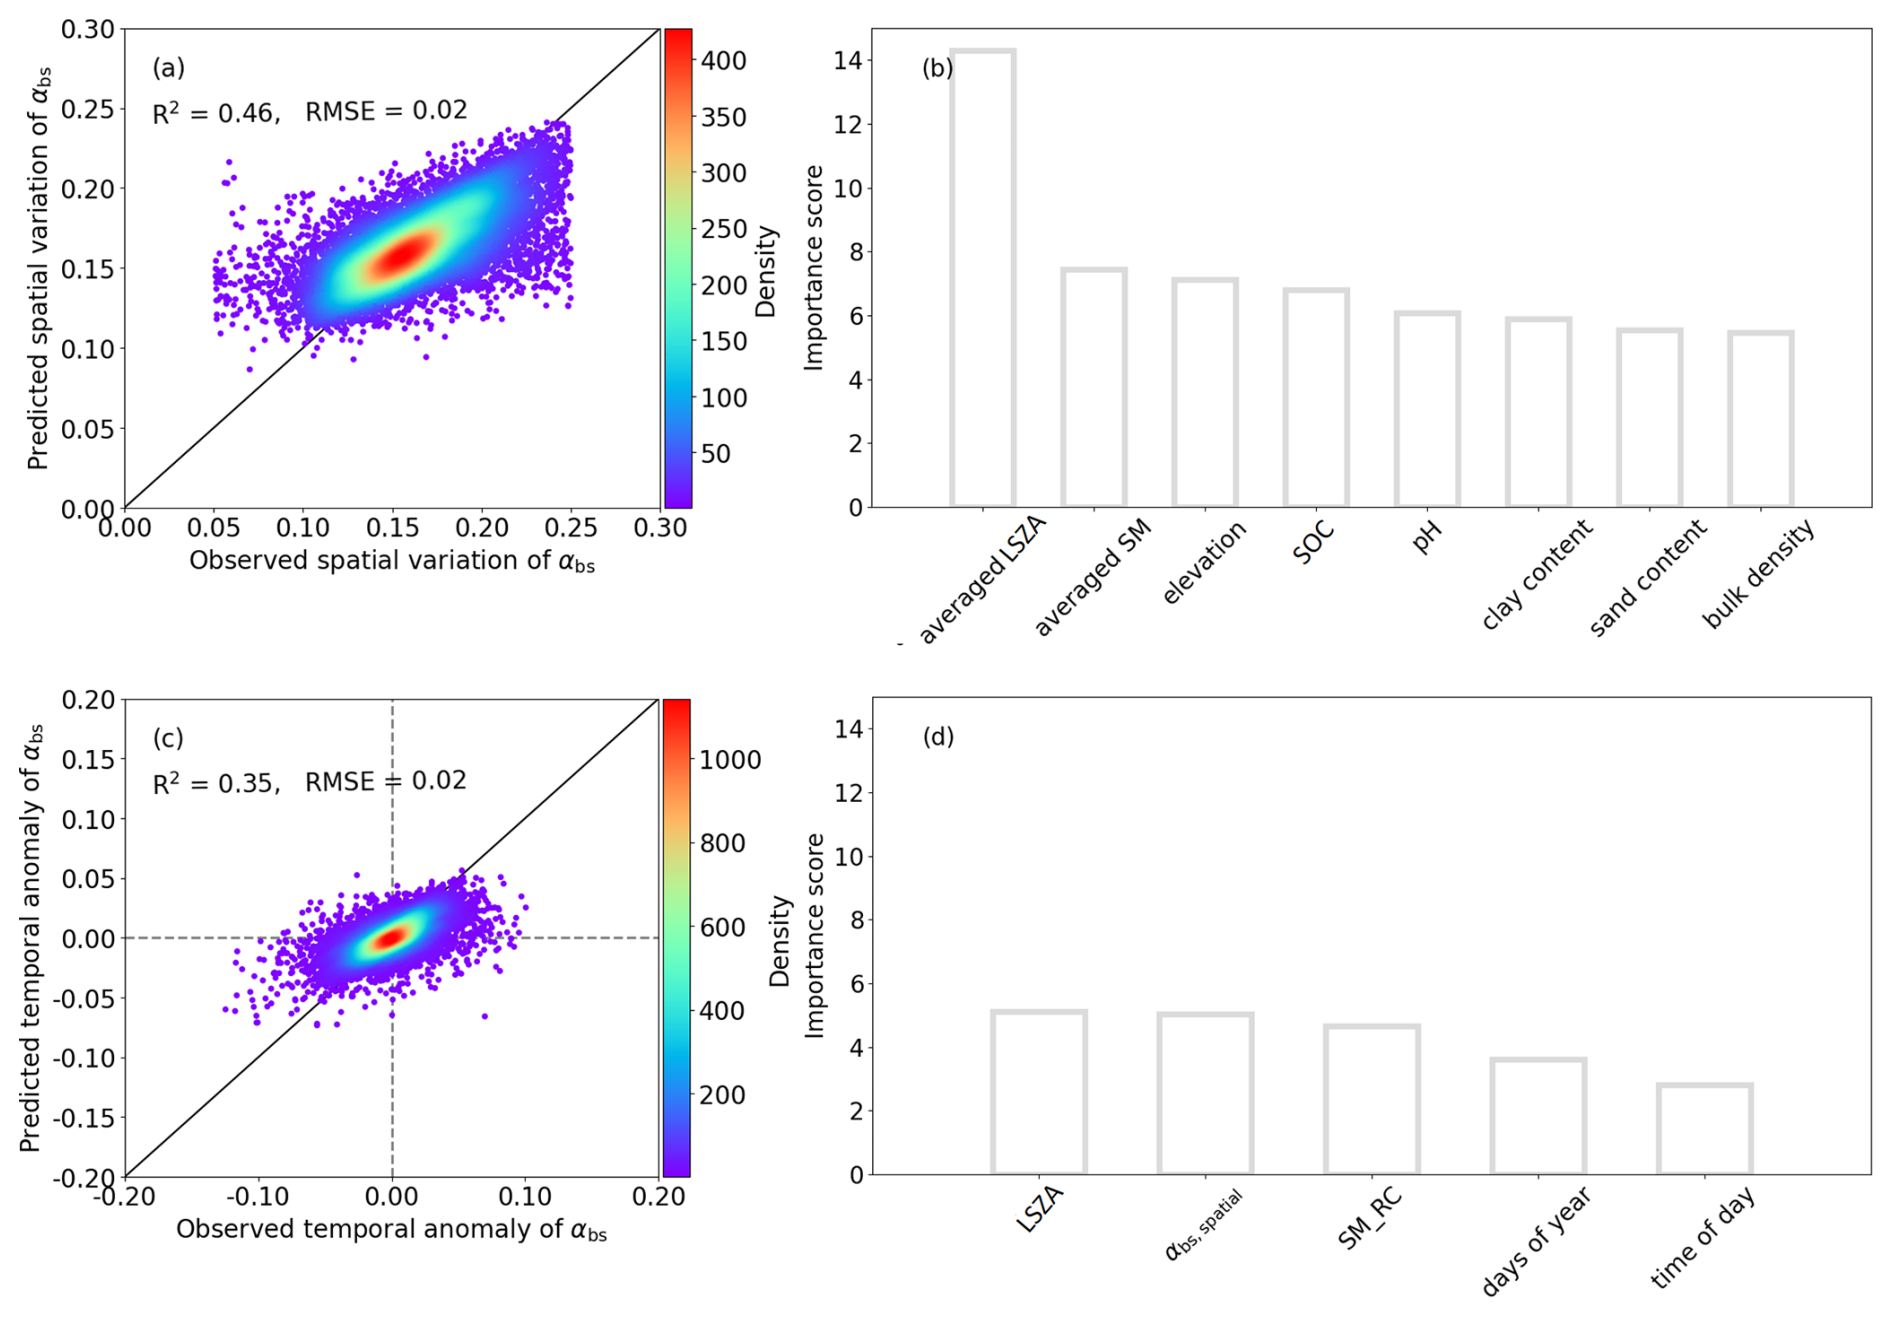
Figure 2The performance of the two random forest models (RF) for predicting European bare soil albedo (αbs,RF) in time and space. (a) and (c) are the scatter plots between the predicted and observed spatial bare soil albedo, and between predicted and observed temporal albedo variations from the test dataset, respectively. (b) and (d) are the importance rankings of selected features for spatial and temporal RF modelling. αbs,spatial is the predicted spatial distribution of bare soil albedo. “LSZA, SM, SM_RC, SOC” represent local solar zenith angle (LSZA), soil moisture (SM), relative SM anomaly (SM_RC) and soil organic carbon (SOC), respectively.
The long-term spatial distribution of αbs (αbs,spatial) is primarily controlled by temporally averaged solar zenith angle (LSZA), mean soil moisture conditions and elevation (Fig. 2b). In contrast, temporal variability during bare soil periods is most strongly influenced by instantaneous solar zenith angle, the underlying spatial albedo pattern, and soil moisture anomalies (Fig. 2d). The importance of these variables on αbs has been widely explored in previous studies (Idso et al., 1975; Post et al., 2000; Yang et al., 2008; Gascoin et al., 2009; Roosjen et al., 2015; Cierniewski and Ceglarek, 2023). The remaining predictors contribute to weaker but non-negligible impacts. It is reasonable that soil properties (e.g., soil organic carbon, pH) control the spatial distribution of αbs by adjusting soil colors via the contents of organic matter and nutrients (Sirisathitkul and Sirisathitkul, 2025) while time records adjust its temporal variation (Yu et al., 2024).
Partial dependence analysis further illustrates the physical consistency of these controls. Both LSZA and SM have negative effects on αbs,spatial and αbs,temporal predictions (Fig. S3a, b, d and f). The elevation increases αbs,spatial by representing specific soil types with elevation (Fig. S3c) (Badía et al., 2016; Praeg, 2020). An impact of αbs,spatial on αbs,temporal is expected as it represents the location-specific climatic and environmental conditions which are otherwise not represented by the selected predictors (Fig. S3e).
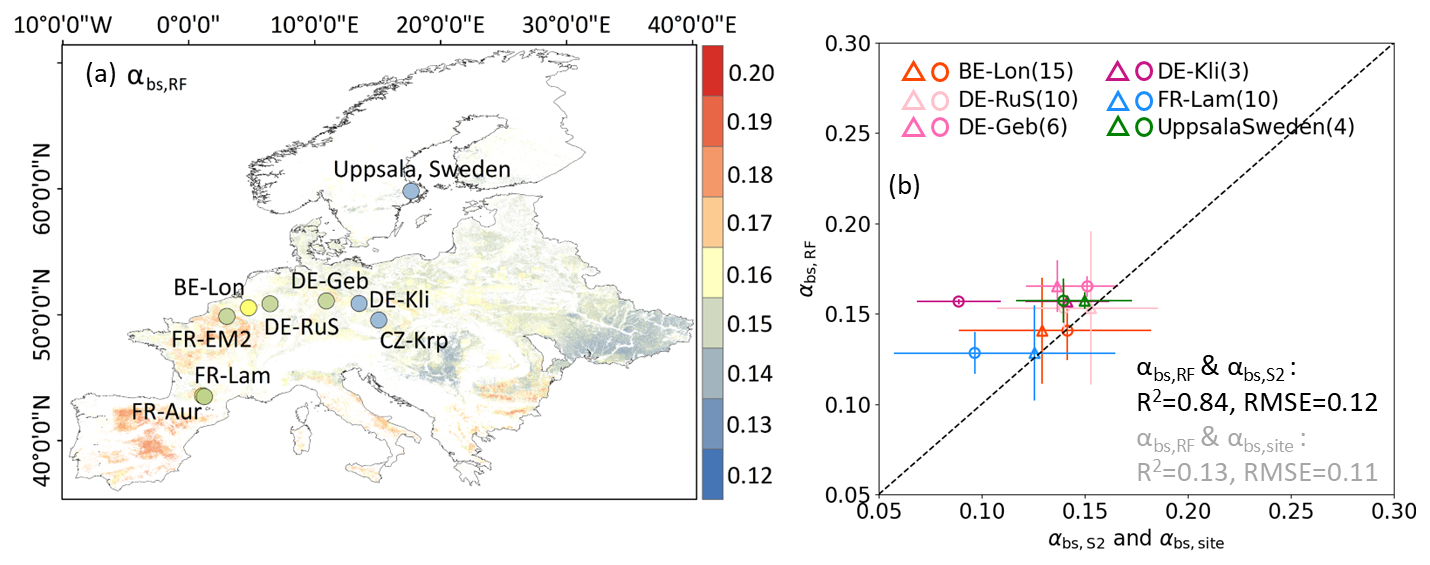
Figure 3(a) The averaged bare soil albedo (αbs) at 300 m resolution derived from the random forest models over the period from 2018 to 2020 in the European cropland regions (αbs,RF). Dots with colors represent the temporal average of αbs,RF at site scale; (b) The comparison between αbs,RF and αbs,S2 (triangles, with αbs,S2 extracted from the Sentinel-2 surface albedo products), and between αbs,RF and αbs,site (circles, with αbs,site computed from site radiation measurements) at six site fields during the same bare soil periods. The triangles and circles in different colors correspond to the averages of αbs,RF, αbs,S2 and αbs,site at different sites, and the bars represent two standard deviations. The numbers in legend brackets represent the sample size (Table 3 for details). Statistics shown in black indicate the correlation passes the significance level of 0.05 (p<0.05), while the one in gray indicates non-significance (p>0.05).
3.2 European-scale spatial pattern of bare soil albedo
The spatiotemporal average of αbs,RF is 0.15±0.01 over European cropland from 2018 to 2020 which is within the range of αbs found in the literature, which spans from 0.15 to 0.22 derived from 7537 European topsoil samples in 2022 (Szabó et al., 2024). Our αbs dataset has a higher spatiotemporal average than earlier products including αbs,Carrer of 0.12±0.03 (2001–2010) and αorc,bgd of 0.13±0.03 (2000–2009), respectively, which have coarser spatial resolutions of 1 km and ∼ 55.5 km (Figs. 4 and S4) (Carrer et al., 2014; He et al., 2019). The distribution of the final predictions αbs,RF was similar to the distribution of the αbs data extracted from Sentinel-2 observations by vegetation indices within European cropland regions from 2018 to 2020 (Fig. S4). This indicates that our predictions cover the spatio-temporal variations in European croplands.
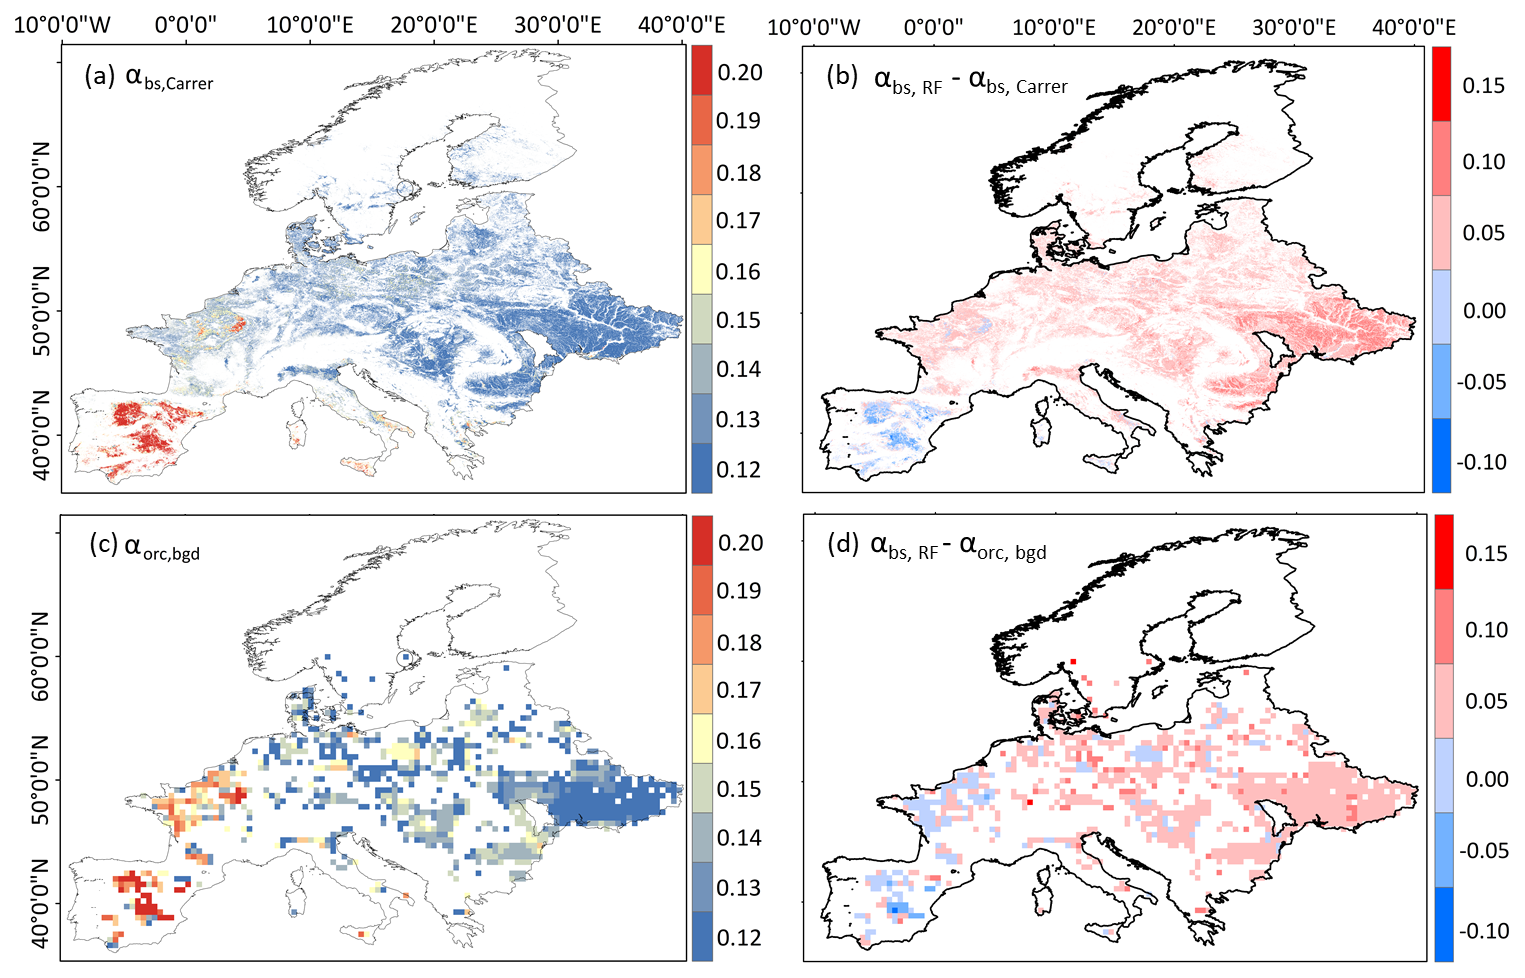
Figure 4The spatial comparison between the new albedo product αbs,RF and two existing bare soil albedo products in European cropland scale. (a) the averaged ∼1 km 8 d European bare soil albedo dataset from 2000 to 2010 (αbs,Carrer); (b) the difference between the averaged 2018–2020 αbs,RF and the averaged 2001–2010 αbs,Carrer; (c) the averaged ∼50 km monthly bare soil albedo dataset from 2001 to 2009 (αorc,bgd); (d) the difference between the averaged 2018–2020 αbs,RF and the averaged 2001–2009 αorc,bgd.
The multi-year spatial pattern exhibits broad west-east and north-south gradients (Fig. 3a) that align with major soil zones, with darker surfaces where organic matter is higher and brighter surfaces where carbonates are more prevalent, a contrast repeatedly reported for European croplands (Carrer et al., 2018; Rizzo et al., 2023). The Iberian Peninsula, southwestern and southern France, and the Mediterranean coastal regions have bright soils with αbs of 0.18–0.20. While the soil in north-central and eastern Europe (e.g., Germany and Poland) is dark with αbs of 0.12–0.15.
Despite general agreement in continental-scale gradients, spatial correlations between our field-scale αbs,RF estimates and existing coarse-resolution products remain low (Pearson r=0.07–0.15; Fig. 4).
3.3 Site-scale characteristics of bare soil albedo
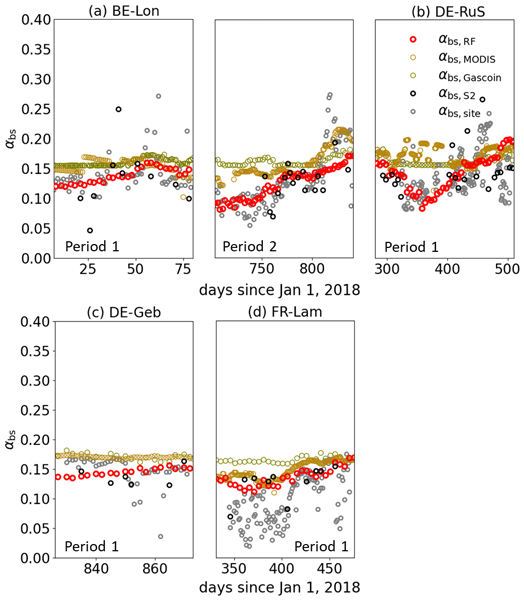
During bare soil windows, αbs,RF has an average of 0.15±0.01 across six eddy-covariance cropland sites, with time series showing coherent field-scale dynamics (Figs. 3b and 6). Time series of αbs,RF exhibit site-specific background levels with short-term fluctuations.
The daily αbs,site and αbs,S2 at the sites, for which bare soil albedo estimates were available, were utilized to compare with daily variations in αbs,RF (Figs. 5 and 6). Results show that the time-averaged predicted albedo was close to observation (R2=0.84, RMSE = 0.12 for comparison with αbs,S2), while the agreement with in-site observations is weaker (R2=0.12, RMSE = 0.11 for comparison with αbs,site) (Fig. 3b). αbs,RF is % (mean ± standard deviation) higher than αbs,site (0.14±0.02) for the same periods (Figs. 5 and 6). While the difference between αbs,RF and underlying training data (αbs,S2, 0.12±0.02) across sites is smaller ( %). It implies that the difference between αbs,RF and αbs,site is a mix of biases in the RF to capture Sentinel-2 observations and differences between αbs,S2 from αbs,site. We also found that the difference of the model predictions between αbs,RF and αbs,site varies across different soil types. BE-Lon, FR-EM2 and FR-Lam sites, belonging to alfisols (light brown to reddish-brown), have lower bias compared with site measurements (Fig. 3). While DE-Geb and DE-Kli (dark brown to black molisols) and CZ-KrP (brown to yellowish-brown inceptisols) induce higher differences from measurements.
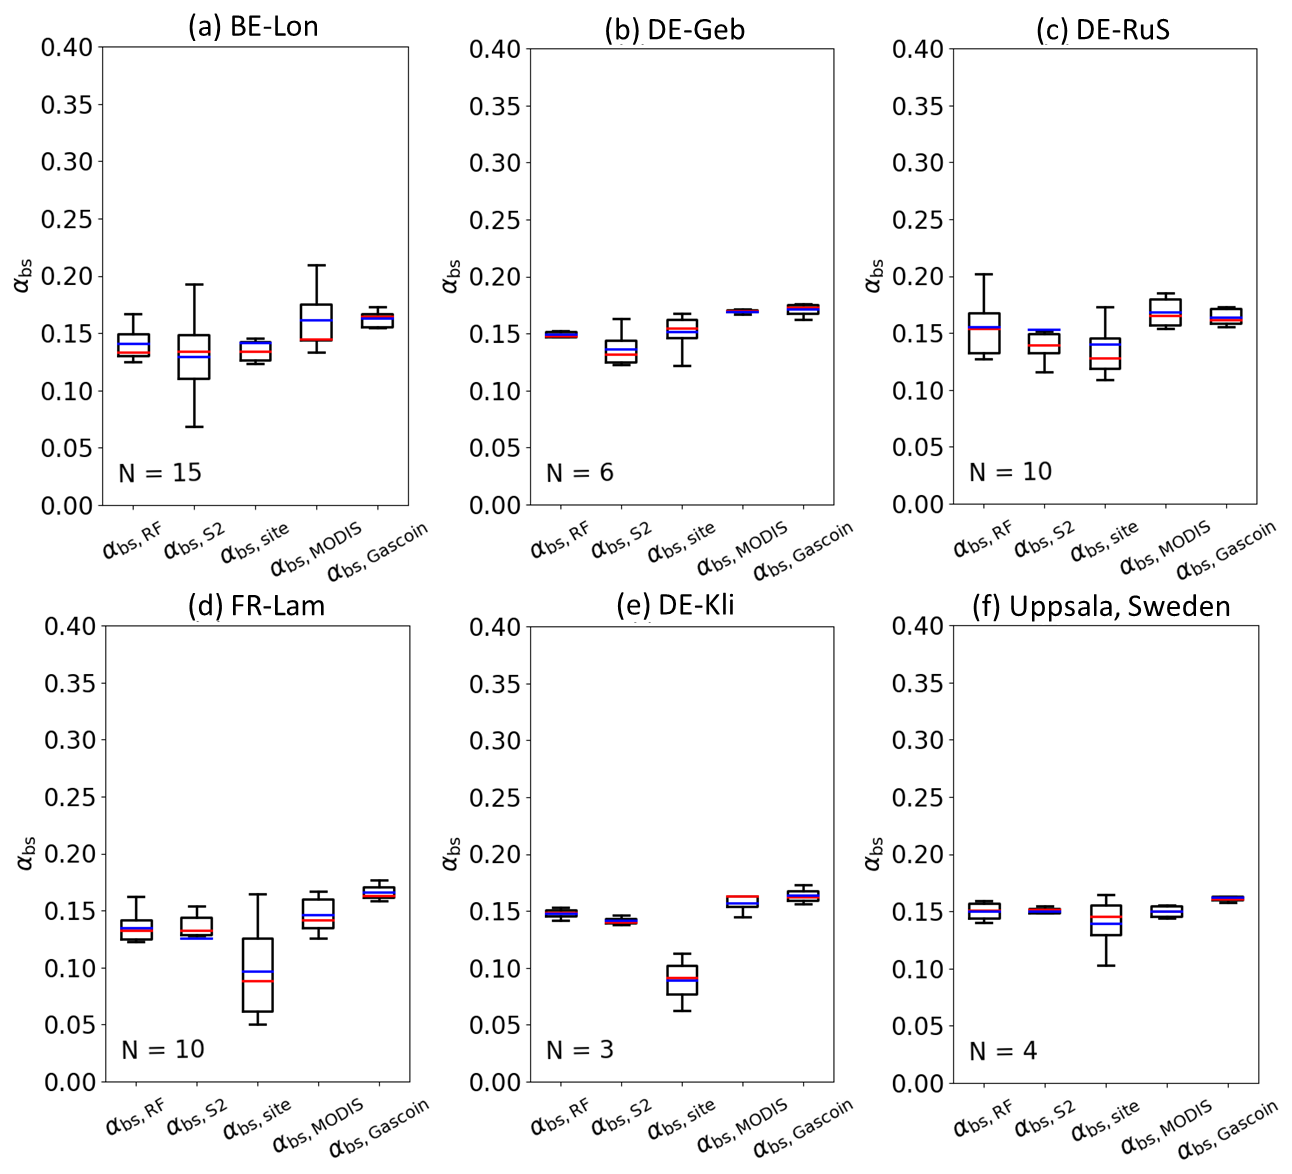
Figure 5The boxplots of αbs,RF, αbs,MODIS, αbs,Gascoin, αbs,S2 and αbs,site at six cropland sites during the same bare soil periods from 2018 to 2020. The values of αbs,RF are the bare soil albedo derived from the spatiotemporal random forest models. The values of αbs,S2 are extracted from the Sentinel-2 surface albedo products, while the values αbs,site are computed by site eddy covariance measurements (see Table 3). The values of αbs,MODIS are extracted from 500 m daily MODIS surface albedo product (MCD43A3). αbs,Gascoin are computed by the exponential function of SM using the 1 km GSSM SM product (see Table 3). The red and blue lines in each figure represent the median and mean values, respectively.
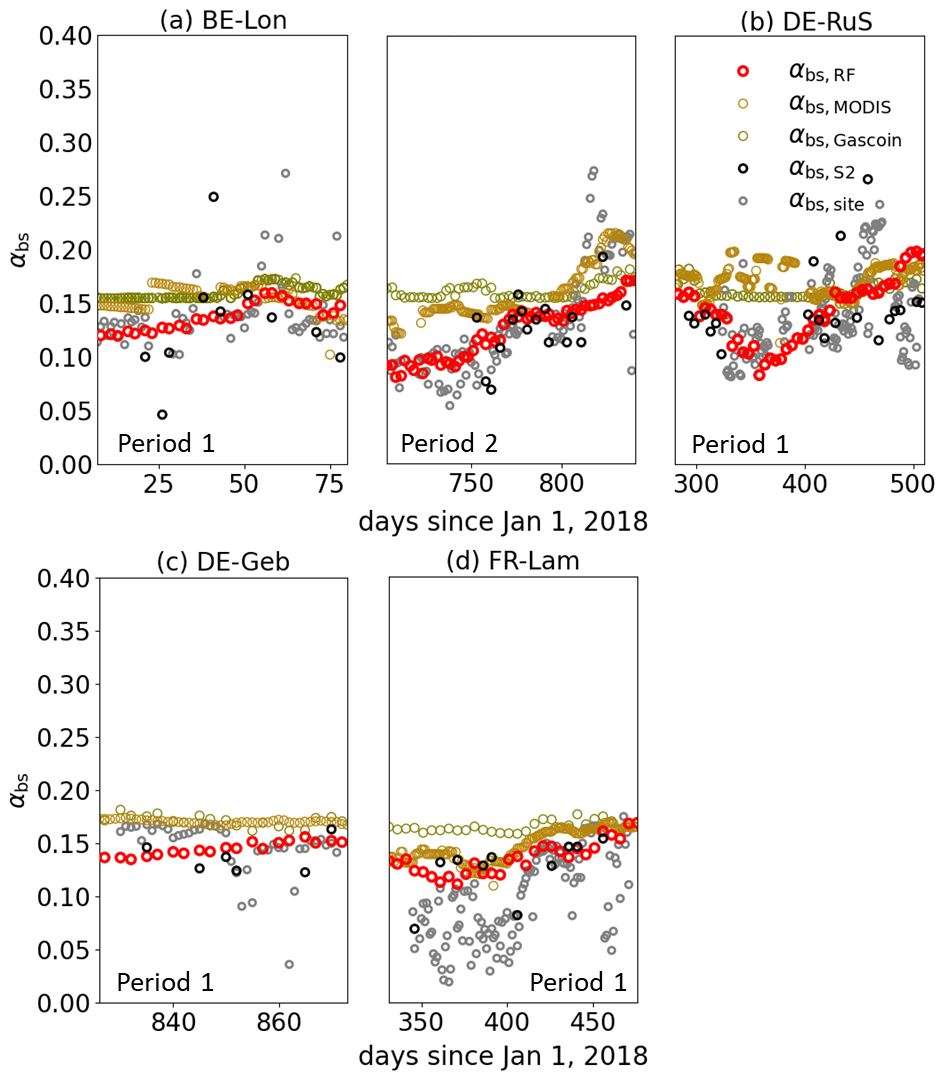
Figure 6Values of αbs,RF, αbs,MODIS, αbs,Gascoin at four sites during the same bare soil periods from 2018 to 2020, compared with αbs,S2 and αbs,site (see Table 3). Values of αbs,RF are the bare soil albedo derived from the spatiotemporal random forest models (red hollow dots). Values of αbs,S2 are extracted from the Sentinel-2 surface albedo products (black hollow dots), while αbs,site values are computed by site radiation measurements (gray hollow dots). The values of αbs,MODIS are extracted from 500 m daily MODIS surface albedo product (MCD43A3) (yellow hollow dots). The values of αbs,Gascoin are computed by the function of soil moisture (SM) using the 1 km GSSM SM product (brown hollow dots). “Period X” in each plot indicates the bare soil period identified by daily or weekly site photos. Plot in-between (a) and (b) belongs to BE-Lon site but in Period 2.
For reference, αbs,Gascoin (0.17±0.01) and αbs,MODIS (0.16±0.02) are higher than αbs,RF and αbs,site at the same sites and times (Fig. 5). Correlation analyses showed that temporal variations in αbs,RF, as prescribed by Eq. (3), tracked soil moisture dynamics (R2=0.51, RMSE = 0.006), which is darkening after wetting and progressive brightening during dry-downs (Fig. 7). This correspondence is stronger than αbs,site (R2=0.30, RMSE = 0.02) and αbs,S2 (R2=0.06, RMSE = 0.01), comparable to αbs,MODIS (R2=0.46, RMSE = 0.007), and weaker than αbs,Gascoin (R2=0.94, RMSE = 0.001). The particularly high correlation for αbs,Gascoin is expected because αbs,Gascoin is directly derived from soil moisture. Compared with αbs,site, αbs,RF is consistently brighter across the soil moisture range (∼ 0.01–0.02 higher in αbs), with the positive bias most pronounced for soil moisture >50 %. αbs,RF also exhibits a smaller amplitude and variance than αbs,site, smoothing the peak darkening seen in the site observations.
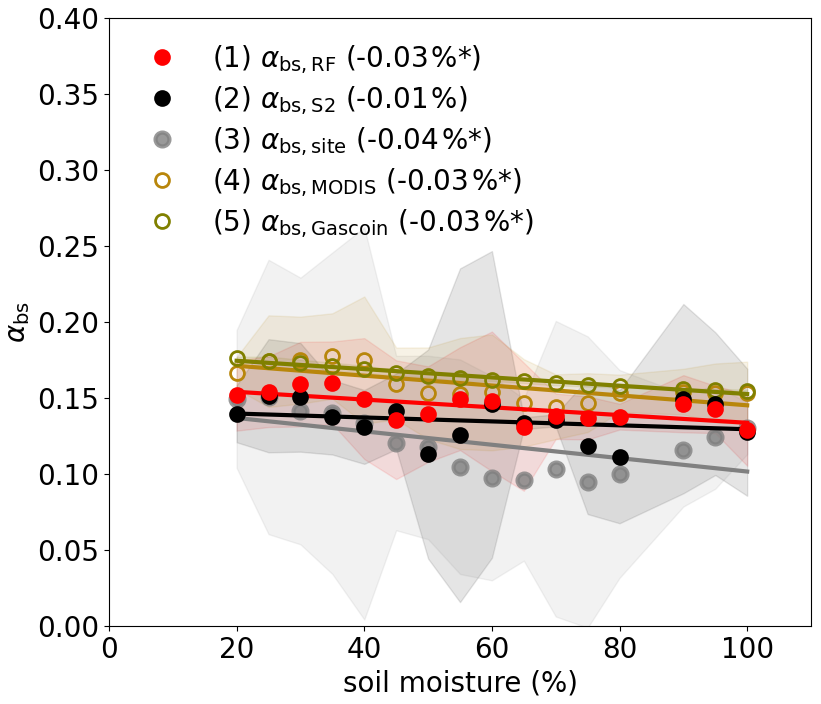
Figure 7The linear relationship between αbs,site and soil moisture (SM), αbs,RF and SM, αbs,MODIS and SM, and αbs,Gascoin and SM, respectively (see Table 3). The superficial SM dataset in the x axis is derived from daily soil sensor measurements which have an SM step of 5 % during the same bare soil periods from 2018 to 2020. The dots with areas in different colors show the averages and 2-time standard deviations of all datasets in each SM step. The αbs,RF is produced by the trained random forest models using daily GSSM SM product as one of the predictors (red dots). The αbs,S2 is extracted from the Sentinel-2 surface albedo products (black dots), while αbs,site is computed by site eddy covariance measurements (gray dots). The αbs,MODIS is extracted from 500 m daily MODIS surface albedo product (MCD43A3) (yellow hollow dots). αbs,Gascoin is computed by the function of SM using the 1 km GSSM SM product (brown dots). “*” means the linear relationship (solid lines) passes the significance level of 0.05.
4.1 Characteristics of the reconstructed bare soil albedo
The reconstructed αbs is designed to capture the dominant physical controls on bare soil albedo while balancing the trade-offs behind continuity and representativeness based on Sentinel-2 reflectance. It enables the characterization of bare soil albedo variability at spatial and temporal scales relevant for agricultural surface energy exchange across Europe. Compared with earlier continental-scale estimates (αorc,bgd and αbs,Carrer), the reconstructed αbs resolves sub-kilometer heterogeneity that is critical for diagnosing field-scale radiative contrasts in fragmented cropland landscapes (Pinty et al., 2011; Carrer et al., 2014; He et al., 2019).
The differences among estimates could be attributed to differences in the periods covered: 2001–2009 for αorc,bgd, 2001–2010 for αbs,Carrer, and 2018–2020 for αbs,RF. Changes in climate and environmental conditions during these periods, such as the observed decreasing trend of soil moisture on a European scale from 1991 to 2020 compared to 1991, especially in central and eastern Europe (Almendra-Martín et al., 2022), can theoretically result in average higher 2018–2020 αbs compared to the period before 2010.
The estimation of αbs largely reflects the seasonal variability of αbs in European cropland fields (Fig. 6), providing a basis to quantify measures for radiation management in agriculture (Yu et al., 2024). This dataset reduces sampling discontinuities associated with cloud cover, snow, and vegetation masking (Figs. 6, S1 and S2), allowing seasonal envelopes and inter-site contrasts in αbs to be examined more consistently (Wang et al., 2025). The selected features for RF models enable αbs prediction in regions with limited satellite observations due to cloud cover or aerosols, because the necessary predictors of the RF model, including soil properties and solar-surface-satellite geometry, are not affected by atmospheric conditions (Fig. 2b and d).
4.2 Physical controls of the reconstructed bare soil albedo
The decomposition of bare soil albedo into spatial and temporal components provides a framework for interpreting its physical controls. Intrinsic soil properties affect bare soil albedo by establishing the optical characteristics of the soil surface and regulating soil-water interaction, while soil moisture dynamics and radiative geometry control the temporal fluctuations of the observed bare soil albedo.
Our analysis supports this framework by isolating and quantifying the contributions of soils, weather and management on spatio-temporal variations in bare soil albedo. It reveals that the αbs dynamics arise from the interplay of multiple controls rather than any single dominant driver (Yang et al., 2008). Temporal changes (αbs,temporal) are primarily associated with variations in soil moisture and local solar zenith angle, with additional seasonality represented by time-of-day and day-of-year terms (Fig. 3b). This underscores the role of short-term variations in illumination geometry and surface wetness in shaping bare soil albedo dynamics (Yu et al., 2024). Whereas spatial contrasts (αbs,spatial) reflect long-term patterns associated with soil moisture and solar geometry, further modulated by invariant factors such as elevation and soil type (Fig. 3d). This suggests that stable radiative conditions and soil-related properties (e.g., soil organic carbon and pH) exert dominant controls on large-scale albedo variability (Sirisathitkul and Sirisathitkul, 2025). Approaches that rely solely on soil moisture as drivers of αbs (Gascoin et al., 2009) are thus likely to misestimate αbs such as overestimating αbs during dry-down over dark, carbon-rich Mollisols, and underestimating αbs during wet periods under low solar zenith angles, when viewing geometry elevates apparent reflectance.
Soil moisture acts as a short-term control on αbs by changes in soil color and soil roughness through wetting, darkening and dry-down brightening (Rizzo et al., 2023). The magnitude and duration of these responses depend on the soil water retention capacity (Post et al., 2000), resulting in different αbs responses to the same soil moisture change for different soil textures. The impact of local solar zenith angle is expected due to its impact on the relative position between the spaceborne sensor and the observed areas, affecting the amount of reflected solar radiation (Yang et al., 2008): a small zenith angle (e.g., 25°) results in nearly vertical solar radiation reflectance and a high αbs (Fig. S3a). It is treated as a physical control on the measured radiative signal (Liu et al., 2009). Its contribution is separate from soil moisture and soil properties and reflects the presence of sun-surface-satellite geometry rather than a proxy of unavailable factors, meaning that αbs can be understood in light of seasonal changes in observation geometry as well as surface state.
Soil properties explain much of the stable spatial structure onto which moisture and geometry act (Rizzo et al., 2023). For example, soil texture influences αbs through both direct and indirect pathways. Particle size, mineral composition directly influences soil optical properties (e.g., surface color and scattering characteristics), thereby establishing the inherent αbs. In addition, these properties related with texture regulate the soil hydraulic behaviour (Sadeghi et al., 2018). Variables such as elevation or bulk density do not change αbs directly but act as proxies for topographic setting or soil structure where more specific drivers (e.g., aspect or slope at the same scale) are not available in the RF model (Fig. 2b and d). For instance, higher elevations generally have lighter soil colors, which might increase αbs,spatial (Fig. S3c) (Badía et al., 2016; Praeg, 2020). Because of the collinearity of bulk density and clay content (Heuscher et al., 2005), their importance reflects predictive utility rather than causal influence on αbs. They stabilize spatial patterns and improve field coherence, not to assign mechanistic primacy. A day-of-year term is included to capture recurring within-year patterns that arise from sunlight, crop calendars, and hydro-meteorology (Reichstein et al., 2019). Since the same day-of-year repeats across years, this term is not intended to encode year-specific events. It provides a seasonal envelope that supports interpolation and extension. A consequence is that unusual events that deviate strongly from the typical seasonal trajectory can be damped in the reconstructed series, even if they appear clearly in individual clear-sky observations.
Although soil type is related to soil albedo (Post et al., 2000; Rizzo et al., 2023), we excluded it from the RF because of the coarse soil type map (∼ 55.5 km, USDA NRCS, 2023) and due to significant within soil type variation of surface soil color (not shown). Site comparison reveals that the model performs well for soils of intermediate brightness, but its errors increase for very dark or very bright soils (Fig. 3b). This result indicates that the soil type carries information not captured by bulk density, clay, sand, or SOC (e.g., mineral composition and the type of organic matter). It also implies that the importance rankings of predictors influencing αbs may exhibit spatiotemporal heterogeneity.
Overall, these controls are interacting components governing αbs rather than independent drivers. Among the intrinsic soil properties, soil texture plays an important role because it establishes the background optical characteristics of the soil surface and regulates soil-water interactions, while soil moisture and solar geometry determine the short-term variability of the observed αbs.
4.3 Limitations
Despite the process-oriented reconstruction of bare soil albedo across European croplands, several limitations remain, primarily associated with situations in which surface heterogeneity or dynamics operate at spatial or temporal scales finer than those resolved by the available predictors.
First, the mismatched scales between field and satellite observations introduce representativeness errors. αbs,site is representative for 8–1000 m2 (Eichler, 2022) and satellite-based αbs,RF is for 90 000 m2. Soils might show substantial variation in soil properties such as texture, color, crusting, residue, and moisture at the scales of meters (Garten et al., 2007), and the bare soil fraction within a 0.3 km footprint can shift rapidly during sowing and post-harvest. Thus, the resulting αbs,RF, possibly represents an area-weighted mixture of exposed soil, crop residues, and smooth signals of αbs dynamics (Yue and Tian, 2020; Dai et al., 2022; Yu et al., 2024).
Second, a sampling bias exists in the training data as periods with crop, clouds or snow covers with extreme soil moisture conditions were excluded. Bare soil is often exposed in autumn or winter periods, only about 35 d in each year from Sentinel-2 data averaged at the 8 ICOS sites satisfied our criteria (Figs. S1 and S2). Fixed local overpass time of Sentinel-2 (∼ 10:30) provides sparse directional sampling of αbs at the pixel level. Thus, anisotropy is averaged and variance related to extreme cases in the subfield is reduced, with a tendency to underestimate high-magnitude fluctuations (Figs. 2, 5 and 6), such as few observed αbs,S2 during the periods of 2019 winter at BE-Lon, DE-RuS, and FR-Lam sites (Figs. 6a, b and d) (Sudmanns et al., 2019; Harmel et al., 2018).
Third, base soil masking is not perfect. Crop residue visible or occasional sparse regrowth normally have a higher albedo than the soil (Fig. S5) (Yu et al., 2024), while surface shadows created by terrain or clouds exhibit low reflectance similar to dark soil (Qiu et al., 2019). Using multiple indices in this analysis mitigates but does not eliminate these confusions entirely.
Fourth, the selection of predictors in the RF model might induce uncertainty. The use of coarse resolution (1 km) soil moisture data together with high resolution data could have led to an underestimation of the effect of spatial variation of soil moisture on αbs. A test of adding soil moisture as a predictor for αbs,spatial led to the elimination of it during the feature elimination procedure, which deviated from the earlier findings of a well-known negative correlation of spatial patterns of soil moisture and αbs (Gascoin et al., 2009). Compared with the stable seasonal variation of local solar zenith angle, soil moisture has a higher potential to be disturbed by the environment such as cloud or snow covering periods, which adds noise and reduces the explanatory power. It might explain the higher ranking of local solar zenith angle than soil moisture in predicting αbs,RF (Fig. 2b and d). In theory, the relative contribution of these two predictors depends on specific scenarios. The comparably higher importance of zenith angle in this study should not be taken to mean that soil moisture is intrinsically less influential in controlling αbs (Yang et al., 2008; Roosjen et al., 2015). In addition, very sharp post-event shifts of αbs, especially caused by frequent agricultural activities in sub-regions such as irrigation or tillage, can be muted if the relevant proxy indicators are missing in RF (Mohr et al., 2023; Yu et al., 2024; Goodwell et al., 2025). One important example is varying soil surface roughness which varies according to agriculture practices, rainfall events and crust formation. Its impact on αbs was not explicitly represented as the required spatiotemporal datasets of soil roughness are currently unavailable at the European scale. In addition, assessing the impact of temporal variation of soil roughness on predicted αbs at site scale remains challenging as no soil roughness measurements are available at the evaluation sites. Our RF framework relies on intrinsic soil properties that may partially capture roughness-related variability (Herodowicz-Mleczak et al., 2022; Rizzo et al., 2023) but cannot explicitly resolve the effects of agricultural practices, rainfall-induced smoothing, or soil crust formation. In their absence, the model smooths these rapid dynamics and underestimates the abrupt changes in αbs, yielding a weak response (Fig. 2a and c). Uncertainty of predicted αbs,RF therefore increases when these rapid physical changes occur on the surface.
Collectively, these scale and sampling properties explain why αbs,RF preserves seasonal envelopes and regional patterns yet under-represents rapid, high-magnitude extremes. These limitations also highlight the need for future integration of higher-resolution meteorological and soil moisture products, improved surface characterization, and more continuous albedo observations to better capture short-term variability in agricultural landscapes.
By integrating explicit bare soil screening of Sentinel-2 surface albedo observation with a random forest reconstruction framework, this study provides a spatially explicit and temporally continuous estimate of bare soil albedo across European croplands at field-relevant scales. The reconstructed dataset captures the pronounced seasonal variability in bare soil albedo and exhibits spatial patterns. Contrary to our initial expectation that soil properties control the spatial distribution, they define relatively stable spatial contrasts in bare soil albedo, without dominating the predictor importance rankings. Additional spatial variability is explained by radiative geometry and temporally averaged soil moisture. The temporal evolution of the estimated soil albedo shows improved coherence with site-scale measurements compared to existing continental satellite products, particularly in resolving seasonal dynamics of soil albedo. This result further indicates that short-term temporal variations are more closely linked to fluctuations in soil moisture than to static soil properties, while variations in solar radiation act as a secondary modulating factor, thereby supporting our second hypothesis regarding the drivers of temporal dynamics.
While uncertainties remain under conditions of rapid surface change such as immediately following rainfall or irrigation events, residue redistribution, or tillage, these limitations primarily reflect constraints in observational sampling and predictor resolution rather than inconsistencies in the reconstructed patterns. Such uncertainties are expected to diminish with the integration of higher-resolution hydrometeorological drivers (e.g., soil moisture) and denser temporal sampling of bare soil conditions. Overall, the dataset is well-suited for characterizing seasonal bare soil albedo variability across heterogeneous agricultural landscapes.
Quantifying high spatiotemporal bare soil albedo provides a physically grounded basis to diagnose the seasonal water and energy dynamics that couple agriculture to climate, especially in agroecosystem modelling. Bare soil albedo directly modulates surface radiation partitioning, influencing soil temperature, evaporation, near-surface energy exchange, and cropland-climate coupling. Incorporation of daily bare soil albedo information into land surface and agroecosystem models has the potential to improve simulations of short-term thermal and moisture dynamics, which are poorly represented when albedo is prescribed at coarse spatial resolution or monthly time steps. Existing modelling approaches typically rely on static or climatological representations of bare soil albedo, limiting their ability to capture rapid transitions that arise from soil wetting-drying cycles and agricultural management. Comparably, the reconstructed albedo presented has more stable temporal evolutions and smoother trends. Incorporating daily bare soil albedo into surface energy balance frameworks enable these dynamics to be explicitly represented, offering new opportunities to diagnose surface energy feedbacks, thereby improving the simulation of temperature stress on plants and soil organisms. Such diagnostics are not attainable with monthly bare soil albedo products due to its temporal aggregation effect. With planned temporal extension and application beyond Europe, this reconstructed bare soil albedo opens new opportunities for climate assessment, crop system evaluation across large spatial and temporal scales, thereby facilitating climate-smart cropland management.
The bare soil albedo dataset for European cropland regions from 2018 to 2020, with a spatial resolution of 0.3 km and a time step of 5 d, is freely available at https://doi.org/10.6084/m9.figshare.30488027.v1 (Yu et al., 2025). The data is stored in a zip archive “albedo_bs_RF.zip” in GeoTiff format, organized into three subfolders by year. An example file name of “bsa_spatiotemporal_2018_01_01” means αbs,RF on 1 January 2018. The coordinate system is WGS84 (“EPSG:4326”). Observation dataset from Sentinel-2 product used for training and testing in the spatial and temporal RF models are provided as “Training_RF_spatial.csv” and “Training_RF_temporal.csv”. We run all models on the R programming Language, which are named as “s2albedo-RF-spatial.R” and “s2albedo-RF-temporal.R”. The observation dataset and codes can be derived from the link above.
The supplement related to this article is available online at https://doi.org/10.5194/bg-23-7973-2026-supplement.
KY, DSG and YS conceived the idea and designed the study. KY processed all data, produced the dataset and initiated the manuscript. DSG, PC, and RL supervised the study. DM improved the methodology. SW contributed to the data processing. DSG, YS, PC, RL, DM, TS, SW, PS, and CZ contributed to the data processing, result analysis, and the manuscript improvements.
At least one of the (co-)authors is a member of the editorial board of Biogeosciences. The peer-review process was guided by an independent editor, and the authors also have no other competing interests to declare.
Publisher's note: Copernicus Publications remains neutral with regard to jurisdictional claims made in the text, published maps, institutional affiliations, or any other geographical representation in this paper. The authors bear the ultimate responsibility for providing appropriate place names. Views expressed in the text are those of the authors and do not necessarily reflect the views of the publisher.
We thank Eric Ceschia, Tiphaine Tallec, Aurore Brut, Bernard Heinesch, Christian Brümmer, Frederik Schrader, Marius Schmidt, Manuel Acosta, Pauline Buysse, and Thomas Gruenwald from ICOS and EFDC stations for providing the ecosystem flux datasets used in our validation process. We are grateful to Gaétan Pique and Dominique Carrer for providing the European bare-soil albedo map used in our comparison. We also thank ChatGPT for assistance with English editing, proofreading, and improving the clarity of the manuscript.
This research has been supported by the European Union's Horizon 2020 research and innovation programme through the ClieNFarms project (grant no. 101036822).
This paper was edited by Cornelius Senf and reviewed by one anonymous referee.
Amazirh, A., Bouras, E. H., Olivera-Guerra, L. E., Er-Raki, S., and Chehbouni, A.: Retrieving crop albedo based on radar Sentinel-1 and random forest approach, Remote Sens., 13, 3181, https://doi.org/10.3390/rs13163181, 2021.
Almendra-Martín, L., Martínez-Fernández, J., Piles, M., González-Zamora, A., Benito-Verdugo, P., and Gaona, J.: Analysis of soil moisture trends in Europe using rank-based and empirical decomposition approaches, Global Planet. Change, 215, 103868, https://doi.org/10.1016/j.gloplacha.2022.103868, 2022.
Allen, L., de Benoist, B., Dary, O., and Hurrell, R. (Eds.): Guidelines on food fortification with micronutrients, World Health Organization and Food and Agriculture Organization of the United Nations, Geneva, ISBN 978-92-4-159401-1, 2006.
Bablet, A., Vu, P. V. H., Jacquemoud, S., Viallefont-Robinet, F., Fabre, S., X. Briottet, X., Sadeghi, M., Whiting, M.L., Baret, F., and Tian, J.: MARMIT: A Multilayer Radiative Transfer Model of Soil Reflectance to Estimate Surface Soil Moisture Content in the Solar Domain (400–2500 nm), Remote Sens. Environ., 217, 1–17, https://doi.org/10.1016/j.rse.2018.07.031, 2018.
Badía, D., Ruiz, A., Girona, A., Martí, C., Casanova, J., Ibarra, P., and Zufiaurre, R.: The influence of elevation on soil properties and forest litter in the Siliceous Moncayo Massif, SW Europe, J. Mt. Sci., 13, 2155–2169, https://doi.org/10.1007/s11629-015-3773-6, 2016.
Beeck, M., Gielen, B., Merbold, L., Ayres, E., Serrano-Ortiz, P., Acosta, M., Pavelka, M., Montagnani, L., Nilsson, M., Klemedtsson, L., Vincke, C., De Ligne, A., Moureaux, C., Marańon-Jimenez, S., Saunders, M., Mereu, S., and Hörtnagl, L.: Soil-meteorological measurements at ICOS monitoring stations in terrestrial ecosystems, Int. Agrophys., 32, 619–631, https://doi.org/10.1515/intag-2017-0049, 2018.
Breiman, L.: Random forests, Mach. Learn., 45, 5–32, https://doi.org/10.1023/A:1010933404324, 2001.
Bright, R. M., Zhao, K., Jackson, R. B., and Cherubini, F.: Quantifying surface albedo and other direct biogeophysical climate forcings of forestry activities, Glob. Change Biol., 21, 3246–3266, https://doi.org/10.1111/gcb.12951, 2015.
Bsaibes, A., Courault, D., Baret, F., Marie, W., Olioso, A., Jacob, F., Olivier, H., Marloie O., Bertrand, N., Desfond, V., and Kzemipour, F.: Albedo and LAI estimates from FORMOSAT-2 data for crop monitoring, Remote Sens. Environ., 113, 716–729, https://doi.org/10.1016/j.rse.2008.12.005, 2009.
Buster, G., Benton, B. N., Glaws, A., and King, R. N.: High-resolution meteorology with climate change impacts from global climate model data using generative machine learning, Nat. Energy, 9, 894–906, https://doi.org/10.1038/s41560-024-01507-9, 2024.
Canisius, F., Wang, S. S., Croft, H., Leblanc, S. G., Russell, H. A. J., Chen, J., and Wang, R.: A UAV-based sensor system for measuring land surface albedo: tested over a boreal peatland ecosystem, Drones, 3, 27, https://doi.org/10.3390/drones3010027, 2019.
Carrer, D., Meurey, C., Ceamanos, X., Roujean, J. L., Calvet, J. C., and Liu, S. L.: Dynamic mapping of snow-free vegetation and bare soil albedos at global 1 km scale from 10-year analysis of MODIS satellite products, Remote Sens. Environ., 140, 420–432, https://doi.org/10.1016/j.rse.2013.09.005, 2014.
Carrer, D., Pique, G., Ferlicoq, M., Ceamanos, X., and Ceschia, E.: What is the potential of cropland albedo management in the fight against global warming? A case study based on the use of cover crops, Environ. Res. Lett., 13, 044030, https://doi.org/10.1088/1748-9326/aab650, 2018.
Cheng, J. and Liang, S.: Estimating the broadband longwave emissivity of global bare soil from the MODIS shortwave albedo product, J. Geophys. Res.-Atmos., 119, 614–634, https://doi.org/10.1002/2013JD020505, 2014.
Cierniewski, J. and Ceglarek, J.: Influence of arable land location incorporating its roughness on blue-sky albedo variation, J. Quant. Spectrosc. Ra., 296, 108440, https://doi.org/10.1016/j.jqsrt.2022.108440, 2023.
Cierniewski, J., Karnieli, A., Kaźmierowski, C., and Ceglarek, J.: A tool for predicting diurnal soil albedo variation in Poland and Israel, EARSeL eProceedings, 13, 36–40, https://doi.org/10.12760/02-2014-1-07, 2014.
Cierniewski, J., Ceglarek, J., Karnieli, A., and Królewicz, S., Kaźmierowski, C., and Zagajewski, B.: Predicting the diurnal blue-sky albedo of soils using their laboratory reflectance spectra and roughness indices, J. Quant. Spectrosc. Ra., 200, 25–31, https://doi.org/10.1016/j.jqsrt.2017.06.002, 2017.
Cierniewski, J., Ceglarek, J., and Kazmierowski, C.: Estimating the diurnal blue-sky albedo of soils with given roughness using their laboratory reflectance spectra, J. Quant. Spectrosc. Ra., 217, 213–223, https://doi.org/10.1016/j.jqsrt.2018.06.003, 2018.
Dai, Z. W., Ding, Y. L., Xu, C., Chen, Y. H., and Liu, L.: Evaluation of the impact of crop residue on fractional vegetation cover estimation by vegetation indices over conservation tillage cropland, Int. J. Remote Sens., 43, 9454–9479, https://doi.org/10.1080/01431161.2022.2151432, 2022.
d'Andrimont, R., Verhegghen, A., Meroni, M., Lemoine, G., Strobl, P., Eiselt, B., Yordanov, M., Martinez-Sanchez, L., and van der Velde, M.: LUCAS Copernicus 2018: Earth-observation-relevant in situ data on land cover and use throughout the European Union, Earth Syst. Sci. Data, 13, 1119–1133, https://doi.org/10.5194/essd-13-1119-2021, 2021.
Davin, E. L., Seneviratne, S. I., Ciais, P., Olioso, A., and Wang, T.: Preferential cooling of hot extremes from cropland albedo management, P. Natl. Acad. Sci. USA, 111, 9757–9761, https://doi.org/10.1073/pnas.1317323111, 2014.
Eichler, S. E.: Portable apparatus for high spatial and temporal resolution of in situ real-time surface albedo measurement in agricultural fields, Environ. Sci. Adv., 1, 297–304, https://doi.org/10.1039/d1va00051a, 2022.
Elfarisna, E., Rahmayuni, E., Herman, W., Putri, E. L., and Kurniati, K.: Soil organic matter and its correlation with several chemical properties of Inceptisols in rice fields in Java, Univ. J. Agric. Res., 12, 242–248, https://doi.org/10.13189/ujar.2024.120204, 2024.
Faroux, S., Kaptué Tchuenté, A. T., Roujean, J.-L., Masson, V., Martin, E., and Le Moigne, P.: ECOCLIMAP-II/Europe: a twofold database of ecosystems and surface parameters at 1 km resolution based on satellite information for use in land surface, meteorological and climate models, Geosci. Model Dev., 6, 563–582, https://doi.org/10.5194/gmd-6-563-2013, 2013.
Farr, T. G., Rosen, P. A., Caro, E., Crippen, R., Duren, R., Hensley, S., Kobrick, M., Paller, M., Rodriguez, E., Roth, L., Seal, D., Shaffer, S., Shimada, J., Umland, J., Werner, M., Oskin, M., Burbank, D., and Alsdorf, D.: The Shuttle Radar Topography Mission, Rev. Geophys., 45, RG2004, https://doi.org/10.1029/2005RG000183, 2007.
Food and Agriculture Organization of the United Nations (FAO): Land statistics 2001–2022: Global, regional and country trends, FAOSTAT Analytical Briefs, Rome, 2023.
Garten, C. T., Kang, S., Brice, D. J., Schadt, C. W., and Zhou, J. Variability in soil properties at different spatial scales (1 m–1 km) in a deciduous forest ecosystem, Soil Biol. Biochem., 39, 2621–2627, https://doi.org/10.1016/j.soilbio.2007.04.033, 2007.
Gascoin, S., Ducharne, A., Ribstein, P., Perroy, E., and Wagnon, P.: Sensitivity of bare soil albedo to surface soil moisture on the moraine of the Zongo Glacier (Bolivia), Geophys. Res. Lett., 36, L02405, https://doi.org/10.1029/2008GL036377, 2009.
Goodwell, A., Zahan, M., Cao, J. Z., and Urycki, D. R.: Spatial heterogeneity of agricultural evapotranspiration as quantified by satellite and flux tower sources, Agr. Forest Meteorol., 372, 110608, https://doi.org/10.1016/j.agrformet.2025.110608, 2025.
Han, Q., Zeng, Y. J., Zhang, L. J., Wang, C., Prikaziuk, E., Niu, Z. G., and Su, B.: Global long-term daily 1 km surface soil moisture dataset with physics-informed machine learning (GSSM1 km), figshare [data set], https://doi.org/10.6084/m9.figshare.21806457.v2, 2022.
Han, Q., Zeng, Y. J., Zhang, L. J., Wang, C., Prikaziuk, E., Niu, Z. G., and Su, B.: Global long-term daily 1 km surface soil moisture dataset with physics-informed machine learning, Sci. Data, 10, 101, https://doi.org/10.1038/s41597-023-02011-7, 2023.
Hapke, B.: Bidirectional reflectance spectroscopy: 1. Theory, J. Geophys. Res.-Sol. Ea., 86, 3039–3054, https://doi.org/10.1029/JB086iB04p03039, 1981.
Härer, S., Bernhardt, M., Siebers, M., and Schulz, K.: On the need for a time- and location-dependent estimation of the NDSI threshold value for reducing existing uncertainties in snow cover maps at different scales, The Cryosphere, 12, 1629–1642, https://doi.org/10.5194/tc-12-1629-2018, 2018.
Harmel, T., Chami, M., Tormos, T., Reynaud, N., and Danis, P. A.: Sunglint correction of the Multi-Spectral Instrument (MSI)-Sentinel-2 imagery over inland and sea waters from SWIR bands, Remote Sens. Environ., 204, 308–321, https://doi.org/10.1016/j.rse.2017.10.044, 2018.
He, T., Gao, F., Liang, S., and Peng, Y.: Mapping climatological bare soil albedos over the contiguous United States using MODIS data, Remote Sens., 11, 666, https://doi.org/10.3390/rs11060666, 2019.
Hengl, T.: Sand content in % (kg kg−1) at 6 standard depths (0, 10, 30, 60, 100, and 200 cm) at 250 m resolution (Version v02), Zenodo [data set], https://doi.org/10.5281/zenodo.2525667, 2018a.
Hengl, T.: Soil bulk density (fine earth) ×10 kg m−3 at 6 standard depths (0, 10, 30, 60, 100, and 200 cm) at 250 m resolution (Version v02), Zenodo [data set], https://doi.org/10.5281/zenodo.2525665, 2018b.
Hengl, T.: Soil pH in H2O at 6 standard depths (0, 10, 30, 60, 100, and 200 cm) at 250 m resolution (Version v02), Zenodo [data set], https://doi.org/10.5281/zenodo.2525666, 2018c.
Hengl, T. and Wheeler, I.: Soil organic carbon content in × 5 g kg−1 at 6 standard depths (0, 10, 30, 60, 100, and 200 cm) at 250 m resolution (Version v02), Zenodo [data set], https://doi.org/10.5281/zenodo.2525664, 2018.
Herodowicz-Mleczak, K., Piekarczyk, J., Kaźmierowski, C., Nowosad, J., and Mleczak, M.: Estimating soil surface roughness with models based on the information about tillage practises and soil parameters, J. Adv. Model. Earth Sy., 14, e2021MS002578, https://doi.org/10.1029/2021MS002578, 2022.
Hersbach, H., Bell, B., Berrisford, P., Hirahara, S., Horányi, A., Muñoz-Sabater, J., Nicolas, J., Peubey, C., Radu, R., Schepers, D., Simmons, A. J., Soci, C., Abdalla, S., Abellan, X., Balsamo, G., Bechtold, P., Biavati, G., Bidlot, J., Bonavita, M., De Chiara, G., Dahlgren, P., Dee, D., Diamantakis, M., Dragani, R., Flemming, J., Forbes, R., Fuentes, M., Geer, A., Haimberger, L., Healy, S., Hogan, R. J., Hólm, E., Janisková, M., Keeley, S., Laloyaux, P., Lopez, P., Lupu, C., Radnoti, G., de Rosnay, P., Rozum, I., Vamborg, F., Villaume, S., and Thépaut, J.-N.: The ERA5 global reanalysis, Q. J. Roy. Meteor. Soc., 146, 1999–2049, https://doi.org/10.1002/qj.3803, 2020.
Heuscher, S. A., Brandt, C. C., and Jardine, P. M.: Using soil physical and chemical properties to estimate bulk density, Soil Sci. Soc. Am. J., 69, 51–56, https://doi.org/10.2136/sssaj2005.0051, 2005.
Houldcroft, C. J., Grey, W. M. F., Barnsley, M., Taylor, C. M., Los, S. O., and North, P. R. J.: New vegetation albedo parameters and global fields of soil background albedo derived from MODIS for use in a climate model, J. Hydrometeorol., 10, 183–198, https://doi.org/10.1175/2008JHM1055.1, 2009.
Idso, S. B., Jackson, R. D., Reginato, R. J., Kimball, B. A., and Nakayama, F. S.: The dependence of bare soil albedo on soil water content, J. Appl. Meteorol. Climatol., 14, 109–113, https://doi.org/10.1175/1520-0450(1975)014<0109:TDOBSA>2.0.CO;2, 1975.
Jacquemoud, S., Baret, F., and Hanocq, J. F.: Modeling spectral and bidirectional soil reflectance, Remote Sens. Environ., 41, 123–132, https://doi.org/10.1016/0034-4257(92)90072-R, 1992.
Jones, N.: How machine learning could help to improve climate forecasts, Nature, 548, 379, https://doi.org/10.1038/548379a, 2017.
Korchagina, I. A., Goleva, O. G., Savchenko, Y. Y., and Bozhikov, T. S.: The use of geographic information systems for forest monitoring, J. Phys. Conf. Ser., 1515, 032077, https://doi.org/10.1088/1742-6596/1515/3/032077, 2020.
Lesaignoux, A., Fabre, S., Briottet, X., and Olioso, A.: Soil moisture impact on lab measured reflectance of bare soils in the optical domain [0.4–15 µm], 2009 IEEE Int. Geosci. Remote Sens. Symp., Cape Town, South Africa, III-522-III-525, https://doi.org/10.1109/IGARSS.2009.5417807, 2009.
Lin, X., Wu, S., Chen, B., Lin, Z., Yan, Z., Chen, X., Yin, G., You, D., Wen, J., Liu, Q., Xiao, Q., Liu, Q., and Lafortezza, R.: Estimating 10-m land surface albedo from Sentinel-2 satellite observations using a direct estimation approach with Google Earth Engine, ISPRS J. Photogramm. Remote Sens., 194, 1–20, https://doi.org/10.1016/j.isprsjprs.2022.10.001, 2022.
Liu, J., Schaaf, C., Strahler, A., Jiao, Z., Shuai, Y., Zhang, Q., Roman, M., Augustine, J. A., and Dutton, E. G.: Validation of Moderate Resolution Imaging Spectroradiometer (MODIS) albedo retrieval algorithm: dependence of albedo on solar zenith angle, J. Geophys. Res., 114, D09103, https://doi.org/10.1029/2008JD009969, 2009.
Masson, V., Champeaux, J.-L., Chauvin, F., Meriguet, C., and Lacaze, R.: A global database of land surface parameters at 1-km resolution in meteorological and climate models, J. Climate, 16, 1261–1282, https://doi.org/10.1175/1520-0442(2003)16<1261:AGDOLS>2.0.CO;2, 2003.
Matthias, A. D., Fimbres, A., Sano, E. E., Post, D. F., Accioly, L., Batchily, A. K., and Ferreira, L. G.: Surface roughness effects on soil albedo, Soil Sci. Soc. Am. J., 64, 1035–1041, https://doi.org/10.2136/sssaj2000.6431035x, 2000.
Mohr, J., Tewes, A., Ahrends, H., and Gaiser, T.: Assessing the within-field heterogeneity using RapidEye NDVI time series data, Agriculture, 13, 1029, https://doi.org/10.3390/agriculture13051029, 2023.
Nguyen, T. T.: Predicting agricultural soil carbon using machine learning, Nat. Rev. Earth Environ., 2, 825, https://doi.org/10.1038/s43017-021-00243-y, 2021.
Pan, F., Wu, X., Zeng, Q., Tang, R., Wang, J., Lin, X., You, D., Wen, J., and Xiao, Q.: A coarse pixel-scale ground “truth” dataset based on global in situ site measurements to support validation and bias correction of satellite surface albedo products, Earth Syst. Sci. Data, 16, 161–176, https://doi.org/10.5194/essd-16-161-2024, 2024.
Pastorello, G., Trotta, C., Canfora, E., Chu, H., Christianson, D., Cheah, Y.-W., Poindexter, C., Chen, J., Elbashandy, A., Humphrey, M., Isaac, P., Polidori, D., Reichstein, M., Ribeca, A., van Ingen, C., Vuichard, N., Zhang, L., Amiro, B., Ammann, C., Arain, M. A., Ardö, J., Arkebauer, T., Arndt, S. K., Arriga, N., Aubinet, M., Aurela, M., Baldocchi, D., Barr, A., Beamesderfer, E., Belelli Marchesini, L., Bergeron, O., Beringer, J., Bernhofer, C., Berveiller, D., Billesbach, D., Black, T. A., Blanken, P. D., Bohrer, G., Boike, J., Bolstad, P. V., Bonal, D., Bonnefond, J.-M., Bowling, D. R., Bracho, R., Brodeur, J., Brümmer, C., Buchmann, N., Burban, B., Burns, S. P., Buysse, P., Cale, P., Cavagna, M., Cellier, P., Chen, S., Chini, I., Christensen, T. R., Cleverly, J., Collalti, A., Consalvo, C., Cook, B. D., Cook, D., Coursolle, C., Cremonese, E., Curtis, P. S., D'Andrea, E., da Rocha, H., Dai, X., Davis, K. J., De Cinti, B., de Grandcourt, A., De Ligne, A., De Oliveira, R. C., Delpierre, N., Desai, A. R., Di Bella, C. M., di Tommasi, P., Dolman, H., Domingo, F., Dong, G., Dore, S., Duce, P., Dufrêne, E., Dunn, A., Dušek, J., Eamus, D., Eichelmann, U., ElKhidir, H. A. M., Eugster, W., Ewenz, C. M., Ewers, B., Famulari, D., Fares, S., Feigenwinter, I., Feitz, A., Fensholt, R., Filippa, G., Fischer, M., Frank, J., Galvagno, M., Gharun, M., Gianelle, D., Gielen, B., Gioli, B., Gitelson, A., Goded, I., Goeckede, M., Goldstein, A. H., Gough, C. M., Goulden, M. L., Graf, A., Griebel, A., Gruening, C., Grünwald, T., Hammerle, A., Han, S., Han, X., Hansen, B. U., Hanson, C., Hatakka, J., He, Y., Hehn, M., Heinesch, B., Hinko-Najera, N., Hörtnagl, L., Hutley, L., Ibrom, A., Ikawa, H., Jackowicz-Korczynski, M., Janouš, D., Jans, W., Jassal, R., Jiang, S., Kato, T., Khomik, M., Klatt, J., Knohl, A., Knox, S., Kobayashi, H., Koerber, G., Kolle, O., Kosugi, Y., Kotani, A., Kowalski, A., Kruijt, B., Kurbatova, J., Kutsch, W. L., Kwon, H., Launiainen, S., Laurila, T., Law, B., Leuning, R., Li, Y., Liddell, M., Limousin, J.-M., Lion, M., Liska, A. J., Lohila, A., López-Ballesteros, A., López-Blanco, E., Loubet, B., Loustau, D., Lucas-Moffat, A., Lüers, J., Ma, S., Macfarlane, C., Magliulo, V., Maier, R., Mammarella, I., Manca, G., Marcolla, B., Margolis, H. A., Marras, S., Massman, W., Mastepanov, M., Matamala, R., Matthes, J. H., Mazzenga, F., McCaughey, H., McHugh, I., McMillan, A. M. S., Merbold, L., Meyer, W., Meyers, T., Miller, S. D., Minerbi, S., Moderow, U., Monson, R. K., Montagnani, L., Moore, C. E., Moors, E., Moreaux, V., Moureaux, C., Munger, J. W., Nakai, T., Neirynck, J., Nesic, Z., Nicolini, G., Noormets, A., Northwood, M., Nosetto, M., Nouvellon, Y., Novick, K., Oechel, W., Olesen, J. E., Ourcival, J.-M., Papuga, S. A., Parmentier, F.-J., Paul-Limoges, E., Pavelka, M., Peichl, M., Pendall, E., Phillips, R. P., Pilegaard, K., Pirk, N., Posse, G., Powell, T., Prasse, H., Prober, S. M., Rambal, S., Rannik, Ü., Raz-Yaseef, N., Rebmann, C., Reed, D., Resco de Dios, V., Restrepo-Coupe, N., Reverter, B. R., Roland, M., Sabbatini, S., Sachs, T., Saleska, S. R., Sánchez-Cañete, E. P., Sanchez-Mejia, Z. M., Schmid, H. P., Schmidt, M., Schneider, K., Schrader, F., Schroder, I., Scott, R. L., Sedlák, P., Serrano-Ortíz, P., Shao, C., Shi, P., Shironya, I., Siebicke, L., Šigut, L., Silberstein, R., Sirca, C., Spano, D., Steinbrecher, R., Stevens, R. M., Sturtevant, C., Suyker, A., Tagesson, T., Takanashi, S., Tang, Y., Tapper, N., Thom, J., Tomassucci, M., Tuovinen, J.-P., Urbanski, S., Valentini, R., van der Molen, M., van Gorsel, E., van Huissteden, K., Varlagin, A., Verfaillie, J., Vesala, T., Vincke, C., Vitale, D., Vygodskaya, N., Walker, J. P., Walter-Shea, E., Wang, H., Weber, R., Westermann, S., Wille, C., Wofsy, S., Wohlfahrt, G., Wolf, S., Woodgate, W., Li, Y., Zampedri, R., Zhang, J., Zhou, G., Zona, D., Agarwal, D., Biraud, S., Torn, M., and Papale, D.: The FLUXNET2015 dataset and the ONEFlux processing pipeline for eddy covariance data, Sci. Data, 7, 225, https://doi.org/10.1038/s41597-020-0534-3, 2020.
Pinty, B., Andredakis, I., Clerici, M., Kaminski, T., Taberner, M., Verstraete, M. M., Gobron, N., Plummer, S., and Widlowski, J.-L.: Exploiting the MODIS albedos with the Two-stream Inversion Package (JRC-TIP): 1. Effective leaf area index, vegetation, and soil properties, J. Geophys. Res., 116, D09105, https://doi.org/10.1029/2010JD015372, 2011.
Post, D. F., Fimbres, A., Matthias, A. D., Sano, E. E., Accioly, L., Batchily, A. K., and Ferreira, L. G.: Predicting soil albedo from soil color and spectral reflectance data, Soil Sci. Soc. Am. J., 64, 1027–1034, https://doi.org/10.2136/sssaj2000.6431027x, 2000.
Praeg, N.: The role of land management and elevation in shaping soil microbial communities: insights from the Central European Alps, Soil Biol. Biochem., 150, 107951, https://doi.org/10.1016/j.soilbio.2020.107951, 2020.
Qiu, S., Zhu, Z., and He, B.: Fmask 4.0: Improved cloud and cloud shadow detection in Landsats 4-8 and Sentinel-2 imagery, Remote Sens. Environ., 231, 111205, https://doi.org/10.1016/j.rse.2019.05.024, 2019.
Reichstein, M., Camps-Valls, G., Stevens, B., Jung, M., Denzler, J., Carvalhais, N., and Prabhat: Deep learning and process understanding for data-driven Earth system science, Nature 566, 195–204, https://doi.org/10.1038/s41586-019-0912-1, 2019.
Ren, H., Cromwell, E., Kravitz, B., and Chen, X.: Technical note: Using long short-term memory models to fill data gaps in hydrological monitoring networks, Hydrol. Earth Syst. Sci., 26, 1727–1743, https://doi.org/10.5194/hess-26-1727-2022, 2022.
Riggs, G. A., Hall, D. K., and Román, M. O.: MODIS snow products user guide for collection 6, NSIDC – US National Snow and Ice Data Center, Boulder, CO, http://modis-snow-ice.gsfc.nasa.gov/?c=userguide (last access: 13 April 2022), 2016.
Rizzo, R., Wadoux, A. M. J.-C., Demattê, J. A. M., Minasny, B., Barrón, V., Ben-Dor, E., Francos, N., Savin, I., Poppiel, R., Silvero, N. E. Q., Terra, F. da S., Rosin, N. A., Rosas, J. T. F., Greschuk, L. T., Ballester, M. V. R., Rico Gómez, A. M., Belllinaso, H., Safanelli, J. L., Chabrillat, S., Fiorio, P. R., and Salama, E. S. M.: Remote sensing of the Earth's soil color in space and time, Remote Sens. Environ., 299, 113845, https://doi.org/10.1016/j.rse.2023.113845, 2023.
Roosjen, P. P. J., Bartholomeus, H. M., and Clevers, J. G. P. W.: Effects of soil moisture content on reflectance anisotropy-laboratory goniometer measurements and RPV model inversions, Remote Sens. Environ., 170, 229–238, https://doi.org/10.1016/j.rse.2015.08.015, 2015.
Roujean, J.-L., Leon-Tavares, J., Smets, B., Claes, P., Camacho De Coca, F., and Sanchez-Zapero, J.: Surface albedo and TOC-R 300 m products from PROBA-V instrument in the framework of Copernicus Global Land Service, Remote Sens. Environ., 215, 57–73, https://doi.org/10.1016/j.rse.2018.05.031, 2018.
Sadeghi, M., Babaeian, E., Tuller, M., and Jones, S. B.: Particle size effects on soil reflectance explained by an analytical radiative transfer model, Remote Sens. Environ., 210, 375–386, https://doi.org/10.1016/j.rse.2018.03.028, 2018.
Sieber, P., Böhme, S., Ericsson, N., and Hansson, P. A.: Albedo on cropland: field-scale effects of current agricultural practices in Northern Europe, Agric. For. Meteorol., 321, 108978, https://doi.org/10.1016/j.agrformet.2022.108978, 2022.
Sirisathitkul, Y. and Sirisathitkul, C.: Decoding soil color: origins, influences, and methods of analysis, AgriEngineering, 7, 58, https://doi.org/10.3390/agriengineering7030058, 2025.
Starr, J., Zhang, J., Reid, J. S., and Roberts, D. C.: Albedo impacts of changing agricultural practices in the United States through space-borne analysis, Remote Sens., 12, 2887, https://doi.org/10.3390/rs12182887, 2020.
Sudmanns, M., Tiede, D., Augustin, H., and Lang, S.: Assessing global Sentinel-2 coverage dynamics and data availability for operational Earth observation (EO) applications using the EO-Compass, Int. J. Digit. Earth, 13, 768–784, https://doi.org/10.1080/17538947.2019.1572799, 2019.
Sugathan, N., Biju, V., and Renuka, G.: Influence of soil moisture content on surface albedo and soil thermal parameters at a tropical station, J. Earth Syst. Sci., 123, 1115–1128, https://doi.org/10.1007/s12040-014-0452-x, 2014.
Sun, Z., Lv, Y., and Lu, S.: An assessment of the bidirectional reflectance models basing on laboratory experiment of natural particulate surfaces, J. Quant. Spectrosc. Ra., 163, 102–119, https://doi.org/10.1016/j.jqsrt.2015.01.004, 2015.
Szabó, B., Kassai, P., Plunge, S., Nemes, A., Braun, P., Strauch, M., Witing, F., Mészáros, J., and Čerkasova, N.: Addressing soil data needs and data gaps in catchment-scale environmental modelling: the European perspective, SOIL, 10, 587–617, https://doi.org/10.5194/soil-10-587-2024, 2024.
USDA NRCS: Web Soil Survey, http://websoilsurvey.sc.egov.usda.gov/, last access: 20 November 2023.
Verheijen, F. G. A., Jeffery, S., Velde, M. V. D., and Penizek, V.: Reductions in soil surface albedo as a function of biochar application rate: implications for global radiative forcing, Environ. Res. Lett., 8, 044008, https://doi.org/10.1088/1748-9326/8/4/044008, 2013.
Wang, X., Chen, S., Zhou, C., Duan, S. B., and Shi, Z.: Cross-sensor data reconstruction for optical remote sensing gap-filling with attention-enhanced multi-scale fusion network, Int. J. Appl. Earth Obs., 140, 104571, https://doi.org/10.1016/j.jag.2025.104571, 2025.
Wen, J. G., Zhao, X. J., Liu, Q., Tang, Y., and Dou, B. C.: An improved land-surface albedo algorithm with DEM in rugged terrain, IEEE Geosci. Remote Sens. Lett., 11, 883–887, https://doi.org/10.1109/LGRS.2013.2280696, 2013.
Yang, F., Mitchell, K., Hou, Y.-T., Dai, Y., Zeng, X., Wang, Z., and Liang, X.-Z.: Dependence of land surface albedo on solar zenith angle: observations and model parameterization, J. Appl. Meteorol. Climatol., 47, 2963–2982, https://doi.org/10.1175/2008JAMC1843.1, 2008.
Yang, X., Li, J., Yu, Q., Ma, Y., Tong, X., Feng, Y., and Tong, Y.: Impacts of diffuse radiation fraction on light use efficiency and gross primary production of winter wheat in the North China Plain, Agr. Forest Meteorol., 275, 233–242, https://doi.org/10.1016/j.agrformet.2019.05.028, 2019.
Yu, K., Su, Y., Ciais, P., Lauerwald, R., Ceschia, E., Makowski, D., Xu, Y., Abbessi, E., Bazzi, H., Tallec, T., Brut, A., Heinesch, B., Brümmer, C., Schmidt, M., Acosta, M., Buysse, P., Gruenwald, T., and Goll, D. S.: Quantifying albedo impact and radiative forcing of management practices in European wheat cropping systems, Environ. Res. Lett., 19, 074042, https://doi.org/10.1088/1748-9326/ad5859, 2024.
Yu, K., Su, Y., Ciais, P., Lauerwald, R., Makowski, D., Shi, T. Q., Wu, S. B., Sieber, P., Zhou, C. L., and Goll, D.: Bare soil albedo datasets at high spatio-temporal resolution from Sentinel-2 observations, figshare [code and data set], https://doi.org/10.6084/m9.figshare.30488027.v1, 2025.
Yue, J. B. and Tian, Q. J.: Estimating fractional cover of crop, crop residue, and soil in cropland using broadband remote sensing data and machine learning, Int. J. Appl. Earth Obs., 89, 102089, https://doi.org/10.1016/j.jag.2020.102089, 2020.
Zanaga, D., Van De Kerchove, R., Daems, D., De Keersmaecker, W., Brockmann, C., Kirches, G., Wevers, J., Cartus, O., Santoro, M., Fritz, S., Lesiv, M., Herold, M., Tsendbazar, N. E., Xu, P., Ramoino, F., and Arino, O.: ESA WorldCover 10 m 2021 v200, Zenodo [data set], https://doi.org/10.5281/zenodo.7254221, 2022.
Zhang, X., Jiao, Z., Zhao, C., Qu, Y., Liu, Q., Zhang, H., Tong, Y., Wang, C., Li, S., Guo, J., Zhu, Z., Yin, S., and Cui, L.: Review of Land Surface Albedo: Variance Characteristics, Climate Effect and Management Strategy, Remote Sens., 14, 1382. https://doi.org/10.3390/rs14061382, 2022.
Zhang, Y., Narayanappa, D., Ciais, P., Li, W., Goll, D., Vuichard, N., De Kauwe, M. G., Li, L., and Maignan, F.: Evaluating the vegetation–atmosphere coupling strength of ORCHIDEE land surface model (v7266), Geosci. Model Dev., 15, 9111–9125, https://doi.org/10.5194/gmd-15-9111-2022, 2022.
Zhou, L., Dickinson, R. E., and Tian, Y.: Derivation of a soil albedo dataset from MODIS using principal component analysis: Northern Africa and the Arabian Peninsula, Geophys. Res. Lett., 32, L21407, https://doi.org/10.1029/2005GL024448, 2005.