
the Creative Commons Attribution 4.0 License.
the Creative Commons Attribution 4.0 License.
 | 11 Nov 2026
CO2 fertilization to climate limitation: shifting drivers in a dryland forest

Liling Chang
Yakir Preisler
Sebastian Fiedler
Matthias Büchner
José M. Grünzweig
Efrat Sheffer
Dryland forests represent a significant but uncertain component of the terrestrial carbon sink, where rising CO2 and intensifying drought and heat stress exert opposing controls on carbon and water fluxes. Using ED2.2-hydraulics calibrated against 21 years of flux tower and inventory data from Yatir Forest, an arid pine plantation in Israel, we simulated carbon fluxes, biomass dynamics, and water-use efficiency under current climate and high-emission scenarios (SSP3-7.0, SSP5-8.5) through 2100 using five general circulation models.
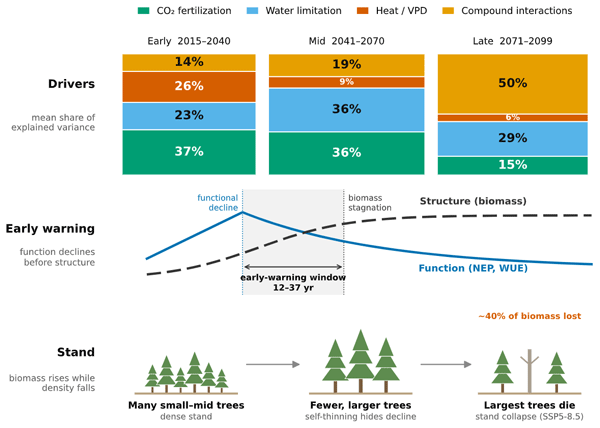
CO2 fertilization initially enhanced productivity and biomass accumulation despite periodic drought, with the strongest response under SSP3-7.0. Under SSP5-8.5, compound heat and drought stress suppressed productivity below SSP3-7.0 levels despite higher CO2 concentrations, triggering stand collapse in two projections and eliminating approximately 40 % of accumulated biomass. Driver decomposition showed that forest responses shifted from CO2-dominated to interaction-dominated by late century, with compound heat and drought stress explaining 39 %–66 % of the relative importance of all drivers by late century. Apparent biomass gains under severe scenarios reflected accumulation in fewer, larger surviving individuals as stand density declined, masking structural deterioration in aggregate metrics.
Functional decline (productivity, water-use efficiency) preceded structural changes by 7–37 years depending on scenario, providing an early warning window before visible deterioration. These results show that CO2 fertilization benefits cannot compensate for the compound climate extremes that accompany high emissions, and that functional indicators must be monitored alongside structural metrics to detect forest vulnerability in dryland afforestation systems.
- Article
(1764 KB) - Full-text XML
-
Supplement
(4462 KB) - BibTeX
- EndNote


Under climate change, dryland forests are shaped by two opposing forces: rising atmospheric CO2, which can stimulate growth, and intensifying climate stress from warming and drought, which can suppress it (Peñuelas et al., 2017). Currently, terrestrial ecosystems absorb approximately 25 %–30 % of anthropogenic CO2 emissions, acting as a net carbon sink that takes up more CO2 through photosynthesis and subsequent carbon storage in biomass and in the soil than they release via respiration and decomposition (Friedlingstein et al., 2022). Because of their vast extent and potential for carbon storage, dryland forests and dryland afforestation have been promoted as key climate mitigation tools (Yosef et al., 2018), although the extent and long-term stability of this carbon sink remain debated (Friedlingstein et al., 2019; Rohatyn et al., 2022). CO2 fertilization plays a key role in sustaining the land carbon sink by increasing plant growth, carbon assimilation and water use efficiency (WUE), particularly when other resources are not limiting (Ruehr et al., 2023). However, whether the dryland forest carbon sink will persist or shift to a carbon source depends on how these opposing drivers interact over time (Morán-Ordóñez et al., 2021), particularly under intensifying climate stress (Novick et al., 2016; Rohatyn et al., 2022).
Climate variability in dryland forests spans from severe droughts that challenge physiological thresholds to wet years that permit structural recovery (Klein et al., 2011). In dryland systems, elevated CO2 can increase photosynthesis, improve intrinsic water-use efficiency, and prolong the period of positive carbon balance. However, these benefits are easily offset by water deficits and heat stress (Choat et al., 2018; Preisler et al., 2021). Furthermore, because dryland environmental variability dominates interannual fluctuations in carbon uptake (Ahlström et al., 2015), understanding the climatic drivers of drylands is critical for assessing the future of dryland carbon sink–source dynamics. For example, in the Mediterranean Basin, where precipitation limits productivity, climate change is shortening the cool, wet winters that define the growing season (Cos et al., 2022; Drori et al., 2021), increasing the risk for declines in dryland forest productivity to the point that these forests may shift from carbon sinks to carbon sources.
Crucially, dryland forest processes differ in both their sensitivity and response timescales to environmental change. Functional processes such as water uptake, gross primary productivity (GPP) and net ecosystem productivity (NEP) react rapidly, whereas changes in forest structure, such as biomass and leaf area, are buffered by internal tree reserves and allocation dynamics. Such differences can lead to responses at different timescales and magnitudes between forest function and structure, meaning that declines in water and carbon uptake may occur well before visible structural changes, or conversely, that structure may appear stable while function has already deteriorated (Preisler et al., 2021). These divergent response patterns are particularly evident in dryland forests during drought stress, which affects trees through multiple pathways operating across timescales.
Immediate drought responses include reduced photosynthesis and growth due to stomatal closure and declining leaf water potential (McDowell et al., 2008). Drought and high temperatures act synergistically, increasing vapor pressure deficits, whereas stomatal closure reduces evaporative cooling, further amplifying heat stress (Adams et al., 2009; Huang et al., 2024). If stress persists, physiological thresholds can be crossed, leading to hydraulic failure (Nadal-Sala et al., 2024), reduced carbon available for growth due to increased allocation to tissue maintenance and repair, and canopy damage (Adams et al., 2009; Choat et al., 2018). These processes can drive sharp declines in NEP, sometimes shifting dryland and drought-prone forests from net carbon sinks to sources and causing widespread mortality, as observed in the Mediterranean and other drought- or fire-prone regions (Dorman et al., 2015; Fatichi et al., 2019). Importantly, drought impacts extend beyond immediate responses: lagged mortality, reduced regeneration, and decomposition can prolong carbon losses for years (Anderegg et al., 2020; Reichstein et al., 2013). In already water-limited systems, even moderate events can trigger long-term decline (Kannenberg et al., 2020; McDowell et al., 2020). Understanding these dynamics across multiple timescales, from immediate physiological responses to longer-term structural changes, is therefore essential to determine not only if dryland forests will decline under climate change but also how and why.
Planted forests in climatically marginal regions, areas near the dry or thermal limits of forest viability, provide valuable test cases for understanding the temporal dynamics of ecosystem responses to multiple environmental drivers (Dorado-Liñán et al., 2019). Unlike natural forests, planted systems typically have well-documented histories, known tree ages, and simplified species compositions, allowing a clearer attribution of observed changes to specific environmental pressures. While empirical studies in dryland forests have advanced our understanding of short-term physiological responses to climatic events (Ogaya and Peñuelas, 2021; Väänänen et al., 2020), long-term, interacting feedbacks between CO2, temperature, and water availability remain poorly understood. Drivers co-vary in the field, and isolating their individual and interactive effects across decades is impractical. Process-based models offer a complementary approach by explicitly representing physiological and structural processes and enabling mechanistic attribution of forest responses to environmental changes.
Here, we address this gap by using a process-based Ecosystem Demography Model (ED2.2-hydraulics; Xu et al., 2016; Longo et al., 2019) to examine how different functional and structural forest responses evolve under current and projected future climate scenarios (Chang et al., 2025). We focused on the well-equipped and well-monitored Pinus halepensis stand in the Yatir Forest, Israel (Grünzweig et al., 2003; Preisler et al., 2019). We first evaluated ED2.2-hydraulics' ability to reproduce observed fluxes and stand dynamics over two decades of monitoring, then used it to quantify the relative importance of CO2 fertilization, water limitation, and heat stress as well as their interactions for stand dynamics and how these effects differ across time periods. Through this approach, we aim to identify the dominant environmental controls across timescales, assess when forest responses show signs of decline and which variables are most sensitive, and evaluate the long-term viability of dryland afforestation as a carbon sequestration strategy. Specifically, we asked: How does the relative contribution of climate stress and CO2 fertilization to structural and functional forest responses shift over time under various climate change scenarios in a dryland plantation? We hypothesized that CO2 fertilization can partially offset climate-driven stress in the short term, but that increasing water and heat stress progressively constrain carbon uptake and structural stability over longer timescales.
2.1 Research Site
Our study focused on the Yatir Forest (31°20′ N 35°03′ E, 550–700 m elevation), a 2800 ha arid pine plantation established at the northern edge of the Negev Desert in Israel during the early 1960s. The forest has an average density of 300 trees ha−1 and is dominated by Aleppo pine (Pinus halepensis Mill.), a species widely regarded as being drought resilient and physiologically adapted to arid climates through traits such as efficient stomatal regulation and a deep rooting system. Yatir forest represents one of the largest and oldest afforestation projects in arid environments globally (Klein et al., 2014). Yatir Forest is actively managed by the Jewish National Fund (KKL-JNF), with periodic thinning interventions, firebreak maintenance, and access management. No irrigation or fertilization is applied. Thinning experiments conducted within the forest have informed density management guidelines for dryland pine plantations in Israel (Calev et al., 2016). The area has a Mediterranean-type climate (with precipitation concentrated in winter and spring, November–April), and is located within an arid zone (aridity index of 0.18; Rohatyn et al., 2022). It has a mean annual precipitation of 283±84 mm and a mean annual temperature of 18.5±0.5 °C (2000–2020). The soils are predominantly light Rendzina (Haploxeroll), which is characterized by shallow depths and high carbonate contents. The forest is located at the climatic threshold for tree establishment making it an ideal case for examining how dryland forests respond to changing environmental conditions projected by future climate scenarios.
2.2 Ecosystem Demography Model ED2.2
We employed the Ecosystem Demography model version 2 (Longo et al., 2019; Moorcroft et al., 2001), a process-based terrestrial biosphere model that has been successfully applied to predict vegetation dynamics across diverse water-limited ecosystems, including Mediterranean forests and woodlands (Chang et al., 2025; Johnston, 2021) and semi-arid sites (Xu et al., 2016; Dashti et al., 2021; Pandit et al., 2019), but with limited application in arid ecosystems. ED2.2 integrates cohort-level plant demography with spatial heterogeneity and ecosystem-scale biogeochemical processes, making it particularly suitable for examining forest responses to climate variability and extremes.
The model architecture combines several key components: (i) plant physiological processes, including photosynthesis, respiration, stomatal regulation, and carbon allocation; (ii) cohort-based demographic processes that track growth, mortality, and recruitment; (iii) canopy radiative transfer and energy balance calculations; (iv) soil-plant-atmosphere water and carbon fluxes; and (v) biogeochemical cycling of carbon (Fig. S1 in the Supplement). ED2.2 operates at hourly to daily time steps while tracking long-term ecosystem dynamics, enabling the simulation of both immediate physiological responses to weather and their cascading demographic consequences. A comprehensive model description is provided in Longo et al. (2019).
Specifically, we employed a version of ED2.2 that incorporates a trait-driven mechanistic plant hydraulic module, ED2.2-hydraulics (Xu et al., 2016), which explicitly simulates water transport through the soil–plant–atmosphere continuum and couples leaf water potential dynamics to both stomatal regulation and drought induced leaf shedding. The hydraulic framework tracks water flow based on tissue-specific conductance, accounts for xylem cavitation, and triggers leaf shedding when predawn leaf water potential falls below the turgor loss point, replacing the empirical water stress formulation of standard ED2 with mechanistic plant hydraulics suited to extreme drought conditions. Unlike simpler water-focused models that operate on annual timesteps, ED2.2-hydraulics resolves sub-daily flux dynamics and size-structured demography, both of which are required to simulate the cohort-level mortality and lag between functional and structural responses that are central to our research questions.
Soil parameterization was based on Klein et al. (2014) and Preisler et al. (2019) and included adjustments to the soil layer configuration, texture, albedo, and rooting depth distribution. Water retention and hydraulic conductivity were derived from soil texture with the Campbell–Mualem model and the pedotransfer functions of Cosby et al. (1984). Furthermore, we adjusted the decomposition-specific soil moisture and temperature thresholds, along with the decomposition rates, to slow turnover to better represent arid conditions (Table S2).
2.3 Model Initialization
We initialized the model in two stages. First, we spun up ED2.2 from 1850 to 2014 using recycled historical climate and historical atmospheric CO2 concentrations to equilibrate soil carbon pools. We extracted only the equilibrated soil carbon pools from this spin-up; all vegetation structure was discarded. Second, we initialized vegetation structure directly based on forest inventory measurements (individual tree height, diameter at breast height, species composition). The equilibrated soil carbon pools from the spin-up were then combined with the observed vegetation structure to initialize both the calibration simulations (2000–2020) and future projections (2015–2099). This approach ensured simulations began with observed forest structure while maintaining realistic soil carbon dynamics.
2.4 Model Parameterization and Calibration
We developed a P. halepensis Plant Functional Type (PFT) using western pine parameters from California's Sierra Nevada applications (Antonarakis et al., 2022; Chang et al., 2025) as a starting point. Plant functional types in ED2.2 are characterized by physiological, anatomical, and morphological parameters governing photosynthesis, respiration, hydraulic conductance, carbon allocation, and mortality thresholds.
We replaced the default parameters with P. halepensis-specific values (Table S2) through three approaches: (i) direct substitution with locally measured values, including: allometric relationships for tree diameter at breast height (DBH) and height, DBH-aboveground biomass, DBH and tree leaf area index (LAI), DBH-root length (Sect. S1.4) as well as leaf structural traits and hydraulic properties, (ii) calibration within literature-informed ranges for parameters with observed variability but strong influence on model behavior (photosynthetic capacity, stomatal sensitivity, allocation fractions, cavitation thresholds), and (iii) calibration for parameters without direct measurements but identified as influential through sensitivity analysis (phenology triggers, decomposition rates; Sect. S1.1). All calibrated parameters were constrained within ranges informed by literature values and local ecosystem knowledge (detailed calibration description in Sect. S1).
We first tuned soil hydraulic parameters to match observed soil moisture, then adjusted photosynthesis, stomatal regulation, phenology, and carbon allocation parameters to simultaneously match carbon fluxes, water fluxes, and growth trajectories. Parameter adjustments included soil and plant hydraulics, photosynthetic capacity, stomatal sensitivity, cavitation resistance, carbon allocation, leaf structural traits, and litter decomposition rates. These adjustments collectively transformed the model from a growth-maximizing temperate forest into a survival-optimized, water-limited forest model (details in Table S2).
Model evaluation used a 21-year dataset (2000–2020) that combines eddy covariance carbon and water fluxes, soil moisture records (Rotenberg and Yakir, 2010), independent observations of the leaf area index (LAI, Sprintsin et al., 2011) and tree growth measurements from permanent plots (Klein and Livne-Luzon, unpublished data, 2026). We evaluated model performance against observations using the coefficient of determination (R2), root mean square error (RMSE), and bias, defined as the mean signed difference between modelled and observed values, with positive values indicating model overestimation. All metrics were computed on paired monthly values over the full observational record, and relative bias was expressed as a percentage of the observed mean. To check the intraannual dynamics under different climatic conditions, we show the fit specifically for a dry, a typical (close to mean annual precipitation) and a wet year.
2.5 Model Scenarios
We first evaluated model performance by simulating the observation period (2000–2020) against measured fluxes and stand characteristics at Yatir Forest (see Results, Sects. 3.1, S1.2). Building on this validation, we simulated three climate scenarios from 2015–2099 to address our research question. The current climate serves as a baseline, representing climate conditions if present-day patterns persisted throughout the 21st century. This scenario was constructed by cycling the 21-year observed records (2000–2020) from Yatir Forest to generate the full 86-year simulation period.
For future climate projections, we used downscaled outputs from five general circulation models (GCMs, GFDL-ESM4, IPSL-CM6A-LR, MPI-ESM1-2-HR, MRI-ESM2-0, UKESM1-0-LL) under two contrasting shared socioeconomic pathways (SSPs) (IPCC, 2022): SSP3-7.0, a pathway with moderate-to-high greenhouse gas emissions; and SSP5-8.5, a fossil-fueled development pathway representing high emissions and the upper end of plausible radiative forcing by the end of the century. SSP5-8.5 was included as an upper-bound stress test to characterize the risk envelope under high-end forcing, consistent with its intended use in IPCC AR6 (IPCC, 2021), while SSP3-7.0 represents a more policy-relevant intermediate pathway for the primary assessment of decline timing and driver transitions in CMIP7 (Van Vuuren et al., 2026). By using five GCMs for each SSP, we aimed to capture the uncertainty in climate projections. Hereafter, the term “scenario” refers to the ensemble of projections from the five climate models within each SSP pathway (SSP3-7.0, or SSP5-8.5) or their mean without additional repetitions.
2.5.1 Climate Input Data
We used bias-corrected climate projections from five CMIP6 (Coupled Model Intercomparison Project) GCMs at 0.5° spatial resolution. These models were selected to represent a broad range of climate sensitivities and processed following the ISIMIP3b (Inter-Sectoral Impact Model Intercomparison Project, phase 3b) bias-correction protocol (Lange and Büchner, 2021). The ISIMIP3b protocol applies trend-preserving statistical bias correction to adjust systematic biases in the mean, variability, and distribution of climate variables in the GCM outputs relative to observations. The climate data were obtained as bias-corrected outputs from the ISIMIP3b data repository, where the ISIMIP3BASD v2.5 statistical bias adjustment and downscaling method (Lange, 2019) has been applied by the ISIMIP3b team specifically for the Israeli grid. The daily meteorological variables included temperature, relative humidity, air pressure, wind speed, and global radiation and were associated with the atmospheric CO2 concentrations of the respective emission scenarios. Specific humidity q was calculated as a function of e (partial water pressure) and P (atmospheric pressure in Pascal) via the humidity R package (Cai, 2019).
For future precipitation (2015–2100), we used high-resolution daily re-analysis data (0.25°) from Gebrechorkos et al. (2023) derived from the same five GCMs and SSP scenarios used in the ISIMIP3b dataset, which better captures seasonal dynamics critical for dryland systems. ISIMIP3b precipitation reproduced annual totals but showed spurious summer rainfall and distorted seasonal patterns. We therefore combined ISIMIP3b atmospheric forcing with Gebrechorkos et al. (2023) precipitation, applying bias correction (Sect. S3.2.1). All forcings were downscaled to hourly resolution to capture diurnal cycles and drought stress dynamics (Sect. S3.2).
2.5.2 Model Outputs and Variables Analyzed
We focused on a set of structural and functional response variables derived from the ED2.2 simulations and supported by site calibration. Structural variables included aboveground biomass, aboveground biomass growth rate, and leaf area index, which together characterize forest structure. Among these, AGB and average DBH capture long-term, cumulative growth, and the LAI and AGB growth rates reflect intermediate responses that adjust over seasons to years. Functional responses (net ecosystem productivity and water-use efficiency: WUE = GPP Evapotranspiration) are rapidly-reacting flux-based processes that respond immediately to climatic variation and physiological regulation. Together, these response variables provide complementary perspectives on forest dynamics across short- to long-term timescales.
2.6 Statistical Analysis of Drought Trends and Forest Responses
To characterize projected drought dynamics under the different scenarios and their influence on forest responses, we quantified an annual drought severity index based on four stress indicators: (1) low precipitation (below the 20th percentile), (2) low soil moisture (below the 20th percentile), (3) extended dry season (dry months/year, ≤5 mm rain event per month), and (4) high vapor pressure deficit (VPD; above the 80th percentile), with the first three representing soil drought and the last representing atmospheric drought (Shekhar et al., 2024). Each indicator was binary (present or absent), and the composite index ranged from 0 (no drought) to 4 (extreme compound drought) for each projected year. Percentile thresholds (20th for precipitation and soil moisture, 80th for VPD) follow established conventions for identifying anomalously dry and hot conditions in drought assessments (Spinoni et al., 2019; Zscheischler et al., 2020). The 5 mm rain event per month threshold for dry season classification follows the standard Walter-Lieth convention for defining climatologically dry months.
For the current climate scenario (2015–2099), we recycled the 21-year observational period (2000–2020) by randomly sampling years without replacement in successive 21-year blocks. This approach preserved realistic climate variability while avoiding artificial persistence of specific drought sequences. Consequently, precipitation patterns repeat every 21 years (as a direct climate forcing), but soil moisture, dry season length, and VPD reflect lagged and integrated responses that differ across cycles due to antecedent conditions and ecosystem state. For future scenarios (SSP3-7.0, SSP5-8.5), we calculated the annual proportion of models (N=5 GCMs) experiencing each stress indicator and visualized annual ensemble-mean contributions through 2100.
Probability density functions (PDFs) and summary statistics were computed for each climate scenario across three temporal periods (early: 2015–2040, mid: 2041–2070, late: 2071–2099), including the percentage of years with severe (drought severity = 3) or extreme (drought severity = 4) drought severity. Temporal periods align with the IPCC AR6 near-term, mid-term, and long-term projection horizons (IPCC, 2021), facilitating comparison with broader climate impact assessments. Changes in drought severity distributions between these periods were assessed within each scenario using a Kruskal-Wallis test, a non-parametric alternative to one-way ANOVA appropriate for comparing distributions across more than two groups without assuming normality, given the small ensemble size (N=5 GCMs) and ordinal drought severity scores. Between-scenario differences were evaluated via Kruskal-Wallis tests for drought severity distributions and chi-square tests for drought component dominance patterns. When significant differences were detected (p<0.05), Dunn's tests with Bonferroni correction were applied for post hoc pairwise comparisons to control the family-wise error rate across multiple comparisons. All analyses were performed via R software, version 4.5.1 (R Core Team, 2025).
2.6.1 Projected Drought Severity
Drought severity was quantified using the multicomponent index described in Sect. 2.6., combining four binary stress indicators (low precipitation, low soil moisture, extended dry season, and high VPD) into a composite score ranging from 0 to 4 for each year. The projected climate trajectories consistently indicate more frequent and severe droughts throughout the 21st century, particularly under SSP3-7.0 and SSP5-8.5 (Figs. 1, Sect. S19; Tables S8, S9). While the mean annual precipitation generally decreased, SSP5-8.5 is characterized by heightened variability, with both extremely dry and wet years becoming more common. Ensemble averaging across GCMs compresses this variability; individual projections show more severe precipitation deficits than the mean representation suggests. Drought years (<200 mm, roughly corresponding to the 20th percentile of the current climate distribution) are projected to increase from ∼7 % under the current climate to 20 %–34 % by the late century, with severe droughts (<150 mm, ∼10th percentile) tripling in frequency. In addition, the rainy season will be several weeks shorter, and increasing evaporative demand further exacerbates aridity (Fig. 1).

Figure 1Temporal composition of compound drought severity averaged per climate scenario, showing the relative contributions of four key stress indicators: high atmospheric demand (warming-induced VPD), extremely dry months, low soil moisture, and low precipitation. Drought components represent ensemble means across 5 GCMs for each future SSP scenario, smoothing individual model drought events, whereas Current represents a single observed climate sequence.
Our multicomponent drought severity analysis revealed a fundamental shift in drought type under climate change. While current climate conditions showed stable drought patterns over time (trend test p>0.05), both SSP3-7.0 and SSP5-8.5 exhibited significant temporal intensification (p<0.01), with severe drought frequency doubling under SSP3-7.0 and increasing 6.7-fold under SSP5-8.5. Critically, SSP5-8.5 was distinguished by a complete compositional shift toward VPD-dominated drought events (occurring in 99.8 % of the years), indicating that atmospheric demand became the primary drought driver rather than a precipitation deficit. Full statistical comparisons across models and scenarios, including drought severity distributions and changes in rainy season length, are provided in the supporting material (Sect. S3).
2.6.2 Early Warning Signal Analysis
We quantified temporal lags between forest functional decline and structural change to identify early warning indicators of ecosystem stress (Tables S3, S4). For functional variables (NEP, WUE) and structural growth rates (AGB growth, LAI), we detected decline onset as the first year when 15-year rolling mean trends showed significant negative slopes (p<0.1, slope thresholds: −0.002 yr−1 for NEP and WUE, −0.001 yr−1 for AGB growth, −0.005 yr−1 for LAI). Slope thresholds were informed by the magnitude of interannual variability observed in the historical simulation period (2000–2020), representing the minimum rate of sustained change distinguishable from natural drought-driven fluctuations. A 15-year window was chosen to filter the high interannual variability characteristic of dryland systems, where single drought years can suppress productivity without indicating sustained decline, while remaining short enough to detect meaningful trends within the projection period; windows of this length are consistent with multi-year lag analyses in comparable forest productivity studies (Anderegg et al., 2020; Reichstein et al., 2013). For cumulative structural variables (total AGB, mean DBH), we detected growth stagnation when 15-year rolling window relative growth rates fell below 0.5 % yr−1 for AGB and 0.2 % yr−1 for DBH, reflecting the point at which new biomass production no longer exceeds turnover and mortality losses, effectively indicating the cessation of net structural growth. Analysis began in 2030 to exclude model spin-up artifacts.
Time lags were calculated as the number of years passed between the onset of functional decline (earliest of NEP or WUE decline) and the onset of structural stagnation. The physiological basis for such lags is well established: stomatal closure and reduced carbon assimilation precede structural growth reductions by months to years due to the buffering effects of carbon storage in the trees and structural inertia (Anderegg et al., 2019; Hartmann et al., 2022), and lagged mortality following hydraulic stress has been documented in P. halepensis at Yatir specifically (Klein et al., 2016; Tatarinov et al., 2016). We computed mean lags and standard deviations across models within each scenario.
2.6.3 Environmental Driver Analysis
To quantify the relative influence of environmental drivers on forest structural (DBH, AGB, AGB growth rate, LAI) and functional (NEP, WUE) responses, and to assess how driver importance and their interactions differ across time periods, we used generalized additive models (GAMs) with tensor product interactions (Wood, 2017). The analyses were based on annual summaries of simulated outputs, aggregated by hydrological year (October–September), with seasonal metrics calculated where relevant. The analysis exploits the quasi-factorial structure inherent in the simulation design: two emission scenarios provide different CO2 trajectories, multiple GCMs generate climate variability within each scenario, and current climate simulation isolates CO2 effects from climate change, together creating spread across driver combinations without requiring controlled manipulation.
For each response variable, we fitted separate GAM models for three temporal periods (early: 2015–2040; mid: 2041–2070; late: 2071–2099) to capture the evolving relationships between environmental drivers and forest responses. Each model included smooth terms for nine environmental predictors (CO2 concentration, mean annual temperature, number of heat stress months (Temp >3rd quartile), mean soil moisture, dry season soil moisture, wet season soil moisture, mean annual precipitation, evapotranspiration/precipitation ratio, and mean annual VPD), plus tensor product interaction terms (ti) for seven key driver combinations (CO2× soil moisture, CO, heat stress × dry season soil moisture, temperature × precipitation, precipitation × , CO2× VPD, CO2× dry season soil moisture). We used the bam function from the mgcv package (Wood, 2017) with fast restricted maximum likelihood (fREML) estimation and automatic shrinkage of non-significant terms. To account for temporal autocorrelation within each GCM-scenario run, we specified a first-order autoregressive (AR1) residual correlation structure (ρ=0.3) grouped by simulation run. Each GAM was fitted to annual values of one response variable, pooled across all scenario and GCM runs within one time period. Variance explained by each driver or interaction was calculated as its proportion of the summed F statistic × effective degrees of freedom of all terms in that model. The resulting relative importance reflects variation among years and simulation runs within a period, not variation across periods, and does not depend on predictor scale or range. To facilitate comparison across response variables and periods, we grouped individual drivers into three categories based on their physiological effects: CO2 fertilization (CO2), water limitation (all soil moisture and precipitation metrics), and temperature and atmospheric stress (temperature, heat stress months, VPD). We report the summed variance explained by drivers within each group and by all significant interactions (p<0.05).
We first present the results of the Model Calibration, then we show the resulting ecosystem dynamics simulated by our calibrated model for the Yatir Forest under current and future scenarios, with a focus on (i) structural and functional forest responses, (ii) early warning signals of functional decline and (iii) the relative importance and temporal transition of environmental drivers.
3.1 Model Evaluation and Fit
Model evaluation used a 21-year dataset (2000–2020) that combines eddy covariance carbon and water fluxes, soil moisture records, and independent observations of the leaf area index (Sprintsin et al., 2011) and tree growth. Standard evaluation metrics (RMSE, R2, and bias) are reported in Table 1; seasonal breakdown for GPP and ET, additional figures and data sources are provided in Sect. S1.2.
The calibrated model reproduced seasonal cycles across all evaluated variables (Table 1). Agreement was strongest for growing season LAI (R2=0.92, Figs. 2a, S2), soil moisture (R2=0.89, Fig. 2b), and carbon fluxes (GPP R2=0.86, Fig. 2c; NPP R2=0.84, Fig. S4; NEP R2=0.79, Fig. 2d). Model performance varied across years. The model systematically underestimated spring GPP (g C m−2 d−1, relative bias −38 %; Table S1). In the dry (2019) year and typical year, close to mean annual precipitation (2006), GPP R2 was 0.84 and 0.89 with mean bias of +0.13 and −0.12 g C m−2 d−1, and NEP R2 was 0.91 and 0.82 with mean bias of +0.17 and −0.13 g C m−2 d−1. In the wet year (2003), agreement was lower (GPP R2=0.73, bias −0.96 g C m−2 d−1; NEP R2=0.68, bias −0.45 g C m−2 d−1; Fig. S5), with observed March and April GPP exceeding simulated values by roughly a factor of two. In those wet years, deeper and more persistent soil moisture recharge advances the observed spring productivity window, a response the model cannot fully capture because phenological triggers, including budburst temperature thresholds and growing degree day accumulation, are fixed parameters in the model calibrated to mean seasonal conditions rather than varying with antecedent winter conditions. ET showed moderate overall agreement (R2=0.70, r=0.84; Fig. S3), indicating that the seasonal shape is well captured while absolute magnitude is less well reproduced. Summer ET was systematically underestimated (bias: −11.3 mm per month, −66 % relative; Table S1), though observed mean summer fluxes are small (∼17 mm per month), reflecting ED2.2-hydraulics’ effective shutdown of transpiration under combined soil moisture and VPD stress. Winter ET was slightly overestimated (+6.8 mm per month), and spring and fall showed the best agreement (−3.6 and 1.8 mm per month). This is discussed further in Sect. 4.4. Independent validation against dendrometer measurements (Klein and Livne-Luzon, unpublished data, 2026) confirms realistic DBH growth rates (simulated: 4.5 mm per year vs. observed 5.0 mm per year; Fig. S6). Overall, the calibrated model reproduced the seasonal cycles and drought-response patterns characteristic of the Yatir Forest, indicating robust performance across both structural and functional responses.

Figure 2Comparison of simulated and observed mean seasonal dynamics of leaf area index (a), soil moisture (b), GPP (c) and NEP (d) at Yatir Forest. Panel (a) shows LAI for the period 2004 to 2006 only, corresponding to the Sprintsin et al. (2011) observational dataset; the ribbon shows interannual variability (±1 SD) across these three years. Panels (b) to (d) show monthly means averaged over 21 years (2000–2020), to characterize the typical seasonal pattern critical to dryland forest function. Lines show monthly means (black = simulation, dashed blue = observations) and ribbons show the interannual variability (±1 SD across years). In (b) monthly mean soil water content plotted alongside mean monthly precipitation (bars, right axis).
Table 1Model performance against eddy covariance flux tower data (monthly climatology, 2000–2020). LAI evaluated against Sprintsin et al. (2011).

3.2 Forest Response
3.2.1 Structural Responses Show Early Increase and Late-century Divergence Under High Emissions
The future climate reshaped forest structure but in different directions and magnitudes depending on the response variable. Mean DBH increased steadily under all scenarios, with the greatest increase occurring under high-emission scenarios (SSP5-8.5, SSP3-7.0) reaching 70–80 cm by 2100, while under current conditions DBH only increased to near 40 cm (Fig. 3a.1). Rising mean DBH reflected survivor bias and persistent recruitment bottleneck rather than enhanced growth: as smaller cohorts grew into larger size classes or died without replacement, the population mean shifted towards fewer, larger trees (Fig. S7). However, two of five SSP5-8.5 projections (GFDL-ESM4, MPI-ESM1-2-HR) experienced abrupt stand-level collapse, with mean DBH dropping to ∼30 cm within a single year (see the sharp drop of two lines around 2080 in Fig. 3a.1). In these projections, CO2-driven biomass accumulation had produced the largest trees (AGB exceeding 5 kg C m−2, Fig. 3a.2). During subsequent hot and dry years, GPP declined sharply whereas ecosystem respiration decreased less strongly (Figs. S12, S13), leading to a marked reduction in net carbon balance before the onset of widespread mortality and AGB collapse. Cohort-level analysis of the collapse events confirmed that mortality was concentrated in trees with DBH >50 cm, which disappeared entirely within one to two years, while mid-size cohorts (40 to 50 cm DBH) survived and expanded their LAI under reduced competition for light and water. Mortality events triggered site-level structural reorganization, coinciding with AGB losses (Fig. 3a.2) and LAI redistribution (Fig. 3a.4).
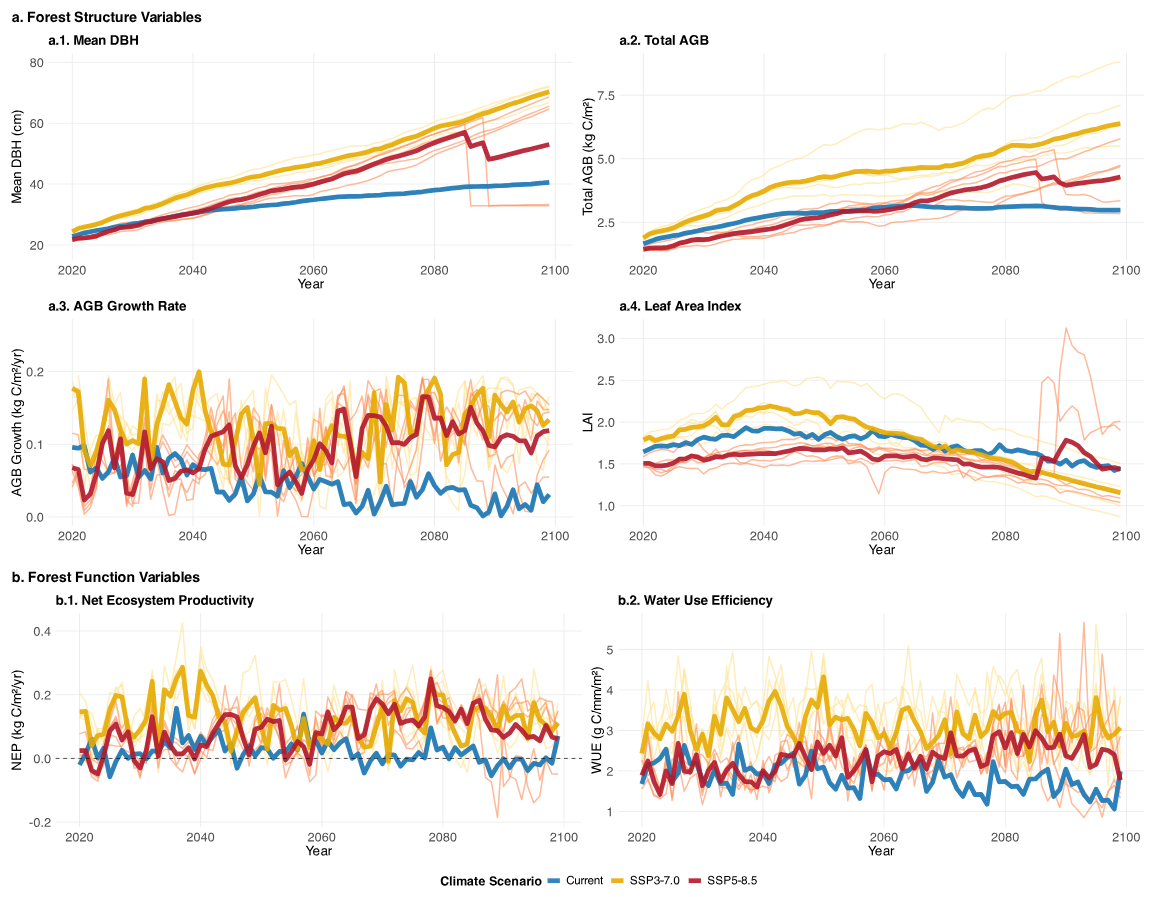
Figure 3Time series of key structural and functional responses of a dryland pine forest 2020–2100 under current (blue), and two high emission scenarios, SSP3-7.0 (amber), and SSP5-8.5 (red) scenarios. Thick lines represent the mean of five models per scenario (thin lines). (a) Simulated temporal trajectories of forest structural responses under different climate scenarios: (a.1.) mean diameter at breast height (DBH), (a.2.) aboveground biomass (AGB), (a.3.) AGB growth rate and (a.4.) leaf area index (LAI). (b) Simulated temporal trajectories of forest functional responses under different climate scenarios: (b.1.) net ecosystem productivity (NEP) and (b.2.) water use efficiency (WUE).
For AGB, SSP3-7.0 showed the strongest accumulation, reaching 5–8 kg C m−2 by 2100 (Fig. 3a.2). SSP5-8.5 accumulated less biomass than SSP3-7.0 throughout the simulation and remained comparable to or below Current climate levels for most projections, reflecting the earlier onset of climate limitation under more severe warming and drought. Two SSP5-8.5 projections experienced abrupt AGB losses coinciding with the stand-level collapse described above, dropping from >5 to ∼3 kg C m−2 (Fig. 3a.2). Current climate showed slow, steady accumulation plateauing around 3 kg C m−2 through 2100 (Fig. 3a.2). Continued AGB accumulation, despite declining stem density (Fig. S7) and increasing mortality (Fig. S10), reflected the nonlinear scaling of wood biomass with diameter: per-tree biomass gains temporarily outpaced losses from tree mortality and consequential decomposition. AGB growth rates remained highly variable, with high-emission scenarios showing higher but unstable rates and current climate showing lower rates and even zero growth in dry years (Fig. 3a.3; individual models in Fig. S8).
LAI patterns revealed different climate constraint mechanisms (Fig. 3a.4). Current climate maintained stable LAI (∼1.5–2.0) throughout most of the century with slight declines in the last decades. The SSP3-7.0 scenario initially supported higher LAI (∼1.7–2.5) through mid-century but later showed decline in all model projections, falling to levels comparable to or below Current climate. SSP5-8.5 showed the lowest LAI for most of the simulation period (∼1.1–1.7). Some of its projections showed episodic spikes after 2080, coinciding with tree mortality events (Fig. 3a.2): selective mortality of the largest cohorts releases light and water for surviving mid-size trees, temporarily expanding stand-level canopy despite the reduction in total AGB.
3.2.2 Productivity Increases with CO2 Fertilization but Destabilizes with Drought
Net ecosystem productivity diverged sharply by scenario, but also by GCM within each scenario. Current climate NEP oscillated frequently between carbon source and sink throughout the century, with many years showing negative NEP, indicating that without CO2 fertilization the forest operates near carbon neutrality (Fig. 3b.1). Both high emission scenarios showed higher mean NEP than Current climate, but individual projections frequently crossed into negative values throughout the century, reflecting the high interannual sensitivity to drought conditions. SSP3-7.0 showed the highest mean productivity early in the century, while SSP5-8.5 mean NEP exceeded SSP3-7.0 by late century despite more severe climate conditions, likely reflecting sustained CO2 fertilization benefits for fewer surviving trees under reduced competition. SSP5-8.5 showed the greatest interannual variability, with individual projections spanning from strongly positive to negative NEP in consecutive years. The two projections that experienced stand-level dieback (Fig. 3a.1, 3a.2) showed corresponding sharp NEP declines. Stand-level GPP declined sharply at the collapse events in both projections, followed by partial recovery over the subsequent years (Fig. S13).
Water-use efficiency showed clear scenario separation (Fig. 3b.2). SSP3-7.0 exhibited the highest WUE, increasing steadily through the century as CO2-driven stomatal regulation improved carbon gain per unit water transpired. SSP5-8.5 showed moderate WUE increases with high interannual variability; two projections displayed sharp late-century spikes as a result of the stand-level dieback events described above. WUE shows high interannual variability throughout the projection period, reflecting its ratio structure: dividing GPP by ET amplifies variance in both components under dryland conditions where precipitation-driven fluctuations affect both fluxes simultaneously. Current climate maintained the lowest WUE (∼1.5–2.0 g C mm−1 m−2) with a slight decline in the final decades.
3.3 Early Warning Signals
We identified the onset of sustained decline (negative 15-year rolling trend, p<0.1) for each response variable across climate scenarios (Tables S3, S4). Under SSP3-7.0, functional decline (NEP or WUE) and AGB growth rate stagnation occurred simultaneously in all five models (mean onset 2037±0). LAI declined 2±3 years later (mean onset 2039 ± 3). However, biomass stagnation followed 18 ± 6 years after the onset of functional decline (range: 12–25 years, mean onset 2055±6), occurring in all five models by 2099. Under SSP5-8.5, decline started later and was more variable across models. WUE declined earliest (mean onset 2041±10, models), followed by AGB growth rate (2048±16, models), LAI (2049±7, models), and NEP (2053±16, models). The later mean NEP onset under SSP5-8.5 reflects trajectory divergence across models rather than greater forest resilience, as discussed in Sect. 4.1. Biomass stagnation occurred in only two of five models, with a mean warning window of 22±21 years after functional decline (range: 7–37 years, mean onset 2067±21). The temporal sequence of decline onset is illustrated for two representative models in Fig. S11, showing functional decline detectable up to 25 years before AGB stagnation under SSP3-7.0.
3.4 Driver Shifts from CO2 Fertilization to Drought Stress
To identify the dominant environmental controls of forest structure and function and how they change over time, we analyzed driver importance across all climate scenarios and models via GAM-based variance decomposition (Fig. 4; Tables S5, S6).

Figure 4Temporal evolution of environmental driver effects. (a) Proportion of total variance explained by individual driver effects (blue) versus combined interactive effects (orange) across three time periods in the simulations (early: 2015–2040, mid: 2041–2070, late: 2071–2099) for the response of structural (mean DBH, total AGB, AGB growth rate, LAI) and functional (NEP, WUE) forest variables. (b) Heatmap of variance explained by grouped drivers across response variables and time periods. Environmental drivers are grouped into CO2 fertilization, water stress, and stress categories. Cell values indicate the summed variance explained by all significant individual drivers (p<0.05) within each group. Missing cells indicate no significant effects. Darker colors represent greater variance explained.
In the early century period (2015–2040), individual drivers explained the majority of variance across all response variables (72 %–93 %; Fig. 4a; Table S5), with interactive effects contributing 7 %–27 % (Table S6). CO2 was the dominant individual driver for mean DBH (85 %) and total AGB (76 %; Fig. 4b), while water stress dominated AGB growth (49 %), NEP (41 %) and WUE (39 %). Temperature and VPD stress combined explained substantial early-century variance for LAI (46 %) and NEP (41 %) but tended to decline in importance along the century for most variables. Interaction effects were small in this period, but CO2× VPD was the most consistent, explaining only 2 %–8 % of variance across most variables, while CO2× dry season soil moisture contributed to NEP (5 %) and AGB (3 %) (Table S6).
By mid-century (2041–2070), individual drivers remained dominant across most variables (66 %–95 %; Fig. 4a, Table S5), with interactive effects increasing notably only for LAI (34 %) and AGB (26 %). Among individual drivers, CO2 remained dominant for DBH (83 %) but declined for AGB (40 %). Stand-level AGB variance is less explained by CO2 than DBH because AGB integrates both individual biomass gain and density-driven biomass loss through self-thinning. That is, future projections show that faster individual growth under elevated CO2 accelerates competitive suppression of smaller trees, so biomass gains in surviving individuals are partially offset by mortality-driven density reduction. Water stress became the dominant individual driver for WUE (67 %), AGB growth (65 %), and NEP (49 %). The most prominent interactions were CO2× VPD for LAI (13 %), heat stress × dry season soil moisture for AGB (10 %), and temperature × precipitation for NEP (10 %) (Table S6).
By late century (2071–2099), interactive effects accounted for 26 %–66 % of variance in structural variables and 60 %–66 % in functional variables (Fig. 4a, Table S5), reflecting increasingly non-additive responses to combined environmental forcing. Among individual drivers, CO2 effects weakened for most structural variables (DBH: 32 %, AGB: 26 %) and became non-significant for NEP and WUE in isolation. The decline in the variance explained by CO2 between mid and late century coincides with increasing between-model variance in climate trajectories, particularly in water availability and temperature stress, which account for increasing variability in the late period (Fig. 4b). Water stress maintained consistent importance for AGB growth (55 %), WUE (32 %), and LAI (32 %). End-of-century mean DBH covaried with total annual rainfall across scenarios and model members (Fig. S9). The dominant interactions, all related to water stress as well, intensified: heat stress × dry season soil moisture explained 11 %–25 % of variance across variables (up to 25 % for AGB), while temperature × precipitation explained 12 %–21 % (up to 21 % for WUE). For NEP, CO2× dry season soil moisture interactions became prominent (20 %) (Table S6).
We investigated how climate change affects forest structure and function in a planted dryland pine forest, focusing on the interactive effects of elevated CO2, water limitation, and warming over time. Our findings offer new insights into (i) the temporal evolution of dominant environmental drivers, including the transition from CO2 fertilization to climate limitation; (ii) the differential responses of forest structure and function; and (iii) the implications for monitoring, afforestation, and forest management.
4.1 Temporal Transitions in Environmental Drivers
CO2 fertilization benefits in dryland forests depend on climate conditions and forest state. Early century, CO2 enrichment increased photosynthesis and water-use efficiency, driving increases in net ecosystem productivity and biomass accumulation (Fig. 3). As conditions became warmer and drier, with higher VPD and reduced soil moisture (Fig. 1), CO2 benefits saturated and water availability increasingly constrained productivity.
Under current climate with constant CO2 concentration (400 ppm), the dryland forest operated near carbon neutrality, with cumulative NEP of 15 Mg C ha−1 over 2015 to 2100 and NEP periodically negative as the dryland forest shifted between operating as either carbon sink or source. Under elevated CO2, cumulative sequestration averaged 106 Mg C ha−1 under SSP3-7.0 (range 77 to 139 Mg C ha−1) and 70 Mg C ha−1 under SSP5-8.5 (range 62 to 85 Mg C ha−1), reflecting the dominant role of CO2 fertilization in driving net carbon gain over the century, despite intensifying drought stress. Models projecting stand collapse under SSP5-8.5 accumulated 69 to 74 Mg C ha−1 before structural decline, only marginally lower than non-collapsing projections, as most sequestration occurred prior to collapse. Attempts to decompose drivers of the ensemble mean NEP trajectory directly confirmed that water stress influences NEP primarily through nonlinear interactions with CO2 and temperature rather than as an independent additive effect, consistent with the compound driver dynamics shown in Fig. 4 and precluding clean mean attribution with the available ensemble size. The positive effect of CO2 enrichment is also visible in productivity, which increased compared to climate-change-only simulations (Fig. S18). In that projection, enhancement relative to the simulation without CO2 fertilization rose from 16 % to 67 % for NEP but only from 1 % to 20 % for AGB between early and late century (Table S7), the same divergence between functional and structural gains that the variance decomposition shows. CO2 fertilization affected processes distinctly: it drove cumulative biomass increase (explaining 85 % of DBH variance and 76 % of AGB variance in early century; Fig. 4b) but had minimal effect on annual growth rates (4 % of AGB Growth variance), which were controlled primarily by water availability (49 % of variance, Fig. 4b). Our implemented CO2 fertilization constraint, calibrated to water-limited FACE experiments (Sect. S2.4), represents the saturating response observed where nutrient and hydraulic constraints limit photosynthetic enhancement (Terrer et al., 2019; Zhu et al., 2021). Uncertainty remains regarding long-term allocation responses to elevated CO2, particularly whether sustained exposure will alter carbon partitioning to roots, stems, or reproduction in ways not captured by short-term FACE experiments (Körner, 2006; Walker et al., 2021). CO2 influenced cumulative biomass but not growth rates, suggesting that these effects operate through stand dynamics rather than accelerated individual growth. We hypothesize that CO2-driven biomass accumulation intensified competition for water, increasing mortality of smaller trees and concentrating resources in fewer, larger individuals (Fig. S7). The resulting size class homogenization produced a forest with higher mean DBH and AGB under emission scenarios compared to current, despite lower stand density, a pattern consistent with self-thinning under resource limitation (Jiang et al., 2020). However, late-century biomass projections under high CO2 should be interpreted cautiously given allocation uncertainties.
The temporal transition from the effects of CO2 to compound climate control is evident in driver importance (Fig. 4). Early-century responses were dominated by individual drivers (72 %–93 % of variance), particularly CO2 effects on structure. By late century, interactive effects accounted for 39 %–66 % of variance, while individual CO2 effects weakened for structural variables and became non-significant for NEP and WUE. Water stress maintained consistent importance throughout (AGB growth: 49 %–65 %, NEP: 29 %–49 %). The dominant late-century interactions were heat stress × dry season soil moisture (11 %–25 % across variables) and temperature × precipitation (12 %–21 %), with CO2× soil moisture also prominent for NEP (20 %), confirming that CO2 benefits require adequate water availability, and that compound stresses create non-additive effects. The scenario comparison illustrates this transition directly (Fig. 4). SSP3-7.0 produced the strongest dryland forest response with highest biomass accumulation, WUE, and early-century productivity, because moderate CO2 enrichment enhanced photosynthesis while climate stress remained within physiological tolerance thresholds. Under SSP5-8.5, GPP was lower than SSP3-7.0 across all periods despite CO2 concentrations exceeding 800 ppm (Fig. S12). No single climate variable explained this suppression; temperature, VPD, and water stress effects were individually weak within CO2 levels (Figs. S14 to S16). This is consistent with the dominance of compound interactive effects in the driver analysis (Fig. 4): the combined effect of higher temperatures, VPD, and reduced water availability under SSP5-8.5 suppressed photosynthetic capacity beyond what elevated CO2 could compensate.
Under SSP5-8.5, the stronger CO2 forcing produced a counterintuitive pattern: mean NEP decline onset was later (2053±16) than under SSP3-7.0 (2037±0), despite more severe climate conditions. This reflects trajectory divergence across models and not greater forest resilience. Two of five models showed no sustained NEP decline within the century, and among the three that did, GFDL-ESM4’s late detection (2071) reflects abrupt stand-level collapse captured by the rolling window only after the trajectory became catastrophic. In the remaining models, the stronger CO2 fertilization under SSP5-8.5 buffered carbon assimilation in survivors under reduced competition, temporarily delaying sustained functional decline, aligning with the driver decomposition showing sustained CO2 contributions to NEP into late century under SSP5-8.5 (Fig. 4).
Mechanistically, the transition from CO2 fertilization to water control reflects three intersecting processes evident in our simulations: (1) stomatal control initially improves WUE under elevated CO2 but increasingly constrains carbon assimilation as VPD rises (Leuzinger and Körner, 2007; Novick et al., 2016), explaining the divergence between structural and functional responses (Fig. 3); (2) hydraulic risk reduces growth and triggers lagged mortality (Choat et al., 2018; McDowell et al., 2008), captured in our model through the hydraulic module's representation of cavitation and water potential thresholds. We observed this mechanism operating in the high-emission scenarios where CO2 fertilization drove rapid biomass accumulation. Cumulative drought stress drove abrupt hydraulic failure in the largest cohorts, whose high water demand made them most vulnerable once soil moisture fell below critical thresholds; CO2 driven biomass accumulation predisposed the stand to this outcome by sustaining growth of large, water-demanding individuals beyond what the climate trajectory could support (Figs. 3a.1, 3a.2, S7, S12, S13); (3) the hydraulic module triggers drought-deciduous leaf shedding when predawn water potential falls below the turgor loss point, effectively shortening the growing season and limiting the window for CO2 benefits (Tatarinov et al., 2016). These three mechanisms together explain why functional decline preceded structural collapse by 7–37 years and why compound climate stress progressively constrained CO2 fertilization benefits.
4.2 Different Response Timescales for Structure Versus Function
Functional responses were more drought sensitive than structural responses. Standardized time series showed NEP was 2–3 times more sensitive to drought than AGB (Fig. S17). Similar patterns have been observed across water-limited forest systems: structural growth persisted despite declining gross primary production and net ecosystem exchange in the Mediterranean Basin (Dorado-Liñán et al., 2019), and LAI declined with increasingly variable carbon fluxes despite stable biomass in Sierra Nevada forests under future climate scenarios (Chang et al., 2025). Such analyses demonstrate that structural persistence can mask physiological stress across water-limited systems.
Functional physiological processes (photosynthesis, transpiration) respond within days, hours or even minutes to moisture deficits and atmospheric dryness via stomatal control, reduced carbon assimilation, and downregulated water fluxes (Adams et al., 2017). Structural stocks respond slowly because of structural inertia and physiological buffering, storage use, long turnover times and mortality lags (Anderegg et al., 2019; Hartmann et al., 2022).
Functional decline preceded structural changes by 18±6 years under SSP3-7.0 and 22±21 years under SSP5-8.5 (Tables S3, S4). NEP and WUE plateaued or declined by mid-century while structural variables continued increasing. Under SSP5-8.5 surviving trees grew larger in response to lower tree densities. Moreover, two of five SSP5-8.5 GCMs experienced stand-level dieback post-2080, with mean DBH dropping to ∼30 cm within a single year (Fig. 3a.1), indicating that physiological thresholds had been crossed. The remaining GCMs maintained biomass accumulation, masking the vulnerability revealed by earlier functional decline. The lag between functional and structural responses provides an early warning window: declining and increasingly volatile carbon uptake and water-use efficiency signal impending structural vulnerability years to decades before visible deterioration.
However, it is important to note that regeneration is effectively absent at Yatir. Long-term field studies report no surviving seedlings under current arid conditions (Osem et al., 2013; Pozner et al., 2022), with drought and grazing preventing natural recruitment (Schiller and Atzmon, 2009). ED2.2-hydraulics was initialized with observed forest inventory, effective regeneration was absent and no management interventions were simulated. Dryland forest persistence therefore reflects survival and growth of the existing cohort only. Without recruitment, aging forests face a demographic trap where biomass accumulates but declining functional capacity hides vulnerability and threatens long-term persistence.
4.3 Management and Monitoring in a Shifting Climate
Structural responses alone mask early stress. While AGB may remain stable or even increase under mounting stress, functional responses and LAI decline much earlier, providing a window of 1–4 decades for intervention. LAI decline appears particularly valuable as an early-warning indicator of climate vulnerability, preceding biomass loss by decades in our dryland pine forest as well as in Sierra Nevada predictions (Chang et al., 2025). Detecting functional decline requires monitoring tools sensitive to physiological stress, such as satellite-derived LAI, eddy covariance flux measurements, solar-induced fluorescence (Yang et al., 2015) rather than structural inventories alone.
Our simulations also reveal a demographic trap: functional decline combined with a complete absence of regeneration means that high biomass stocks provide only temporary stability. Once the aging cohort declines, losses may be abrupt (De Kauwe et al., 2014). The apparent paradox of increasing AGB alongside declining stem density illustrates why structural metrics can mislead: coarse inventory or remote-sensing estimates of total AGB can mask the absence of recruitment, misrepresenting forest health until surviving individuals succumb. The LAI recovery following mortality events in our simulations suggests that density reduction can temporarily restore canopy function, consistent with experimental thinning results in dryland P. halepensis plantations showing improved growth, reduced drought sensitivity, and lower mortality (Calev et al., 2016), findings that have since informed thinning as an endorsed forest management intervention in Israeli dryland afforestation. Adaptive thinning may therefore extend forest longevity under increasing drought, though it cannot substitute for regeneration. While fire disturbance was not simulated due to active suppression at Yatir, fuel accumulation for wildfires under increasing climatic stress raises additional risk of abrupt carbon release (Steel et al., 2015). Long-term dryland forest persistence requires species that combine drought tolerance, regeneration capacity, fire resilience, and complementary functional traits (Hisano et al., 2024; Irob et al., 2023).
Although this study focused on a single planted forest, Yatir, its lessons extend to other afforestation projects in Mediterranean, subtropical, arid and semiarid zones facing similar constraints. Afforestation remains an important climate-mitigation tool: under future scenarios, rising CO2 drove substantial net carbon accumulation well above the current climate baseline, even in projections with eventual stand collapse, as most sequestration occurred before structural decline. However, continued growth of surviving trees can mask progressive stand thinning, giving a false sense of permanence. Our results question the long-term viability of dryland afforestation without adaptive management and emphasize that studies promoting large-scale dryland planting initiatives (Bastin et al., 2019) overlook these critical constraints.
4.4 Model Performance and Limitations in Dryland Forests
ED2.2 with hydraulics reproduced structural growth, seasonal fluxes, and drought responses in an extreme dryland system with modest adjustments. Accurate simulation required matching carbon and water fluxes, LAI, and biomass simultaneously (Feng et al., 2018; Zhang et al., 2022); calibration to GPP alone was insufficient (Pandit et al., 2019). Proper model initialization with observed ecosystem structure was critical, since initialization effects can persist for decades (Chang et al., 2025).
However, as with any model, limitations remain and affect the interpretation of model predictions in specific ways. The model underestimated ecosystem respiration, with the largest discrepancies during the wet season. The simplified decomposition module lacks photodegradation and post-rainfall pulse dynamics that dominate dryland carbon cycling (Grünzweig et al., 2022), and insufficient soil carbon substrate from the historical spin-up may further reduce heterotrophic respiration. Together, these likely cause projected NEP to be high. Carbon fluxes peak in spring, when soil moisture is adequate, temperature rises, and low VPD levels simultaneously relax environmental constraints. The model underestimates this spring peak due to two specific fixed parameter constraints. First, P. halepensis is assigned a strictly evergreen phenology with fixed seasonal growth elongation factors (spring =1.45, summer =0.38), which prescribe the relative seasonal distribution of growth independent of preceding climatic conditions. As a result, the spring productivity window cannot advance or extend in response to antecedent winter soil moisture recharge, and the model responds to instantaneous climate forcing only. Second, the maximum carboxylation rate ( parameterized in ED2.2 as Vm0=21.8 µmol m−2 s−1 at 15 °C) and the Ball-Berry stomatal slope (m=10.5) are also fixed parameters calibrated to seasonal carbon and water fluxes simultaneously, which constrains peak spring photosynthetic responses under exceptionally favorable conditions. Because the 21-year calibration period was dominated by average and dry years, with only four wetter-than-average years, the optimized parameter set primarily reflects the ecosystem's typical hydroclimatic conditions. Together with the fixed phenology and physiology, this limits the model's ability to reproduce the nonlinear productivity response during exceptionally wet years. Fixed physiological parameters that cannot reproduce such nonlinear responses are a known limitation also reported in other ED2.2 applications to dryland systems (Dashti et al., 2021; Pandit et al., 2019), and is most pronounced in anomalously wet years where deeper soil moisture recharge advances observed spring onset beyond what fixed seasonal elongation factors can capture (Fig. S5). Since projections focus on a drying trajectory where spring conditions become progressively more limiting, this wet-year bias does not propagate into the primary conclusions about forest vulnerability, but results in a potential underestimation of early-century CO2 fertilization benefits.
Another limitation is the underestimation of summer ET (bias: −11.3 mm per month, −66 % relative to observed mean of ∼17 mm per month; Table S1), as ED2.2 effectively shuts down transpiration under combined soil moisture and VPD stress. The same conservative downregulation of ET under peak VPD stress has been found in another model application of Yatir forest (Nadal-Sala et al., 2024). Recent measurements at Yatir document residual summer fluxes from brief morning stomatal opening, stem water storage drawdown, and cuticular water loss that the model does not capture (Klein et al., 2016; Preisler et al., 2021, 2022). Since summer carbon fluxes are near zero and soil moisture bias remains small (+2.8 %), this limitation is unlikely to alter projected carbon trajectories but may cause slight underestimation of cumulative hydraulic stress through summer. The muted summer LAI reduction indicates that the evergreen phenology module underestimates seasonal drought response of P. halepensis. The hydraulic module's leaf shedding mechanism provides insufficient adjustment under moderate water stress, potentially delaying projected functional decline. The model also lacks hydraulic redistribution, which may overestimate shallow-soil drought stress. CO2 fertilization was constrained based on FACE experiments and limited by the hydraulic module's water stress response, producing realistic elevated CO2 responses under water limitation, though projections may be slightly optimistic given uncertainties in nutrient constraints. Furthermore, parameters were calibrated manually because the run time of ED2.2-hydraulics prevented convergence of a formal Bayesian calibration on our cluster. A global sensitivity analysis that includes the hydraulic parameters could identify in more detail which parameters control simulated drought responses at Yatir.
Future improvements of the model fall into three tiers. Dynamic phenology responsive to antecedent soil moisture and hydraulic redistribution are highest priority, as they directly affect projected functional decline timing and magnitude. Photodegradation and post-rainfall heterotrophic respiration pulses are medium priority, improving current-climate carbon balance accuracy without affecting the primary vulnerability conclusions. Dynamic nutrient cycling, formal parameter optimization, and explicit fire disturbance represent longer-term structural developments that would extend the model's applicability across dryland ecosystems more broadly.
ED2.2 has been rarely applied to dryland ecosystems and this study represents the first application to an arid forest. The model nevertheless captured core dryland forest dynamics, highlighting its potential for evaluating afforestation strategies and ecosystem resilience under climate change.
Our study demonstrated that the responses of dryland afforestation systems are not static but evolve with climate trajectories: early gains from CO2 fertilization give way to water limitation and heat stress, resulting in increasing volatility and declines in forest functioning. Under the highest emission scenario, compound climate stress suppressed productivity below the moderate-emission scenario despite higher CO2, confirming that fertilization benefits cannot compensate for the extremes they accompany. In P. halepensis, drought tolerance has allowed growth to persist under increasingly arid conditions, but productivity and water-use efficiency declined earlier, with functional responses preceding structural decline. This lag reveals a demographic trap in which aging cohorts mask emerging forest vulnerability.
These findings emphasize that traditional dryland forest surveys cannot serve alone as indicators of forest health. Instead, functional monitoring is essential for detecting vulnerability early and sustaining forest services under accelerating climate change.
Beyond Yatir, our results highlight a broader principle: afforestation projects at the dry margin of forest viability may provide only temporary carbon sinks. Models such as ED2.2-hydraulics, when calibrated to multiple functional and structural responses, can help anticipate these temporal shifts and guide climate policy. Ensuring the long-term contribution of forests to climate mitigation requires embracing their dynamic nature, acknowledging that resilience today does not guarantee persistence tomorrow.
Model code, simulation data and scripts to reproduce the results and figures of this manuscript are available via the Zenodo Digital Repository (https://doi.org/10.5281/zenodo.23735322, Irob, 2026). The original and current versions of the ED2.2 model are openly accessible on GitHub at https://github.com/EDmodel/ED2 (ED2 Model Development Team, 2026), where it is actively maintained and regularly updated by the repository developers.
The supplement describes model parameterization and calibration (Sect. S1, Figs. S1–S6, Tables S1 and S2), extended model outputs including forest structure, drought sensitivity, CO2 fertilization effects and the CO2 fertilization constraint (Sect. S2, Figs. S7–S18, Tables S3–S7), and climate data, bias correction, temporal downscaling and drought severity analyses (Sect. S3, Fig. S19, Tables S8 and S9). The supplement related to this article is available online at https://doi.org/10.5194/bg-23-8097-2026-supplement.
Katja Irob: Conceptualization, Methodology, Software, Formal analysis, Visualization, Writing – Original draft preparation. Efrat Sheffer: Conceptualization, Writing – Reviewing and Editing, Supervision. José Grünzweig: Conceptualization, Writing – Reviewing and Editing, Supervision. Yakir Preisler: Conceptualization, Methodology. Liling Chang: Conceptualization, Methodology, Writing – Reviewing and Editing. Sebastian Fiedler: Software, Validation, Writing – Reviewing and Editing. Matthias Büchner: Data curation, Resources.
The contact author has declared that none of the authors has any competing interests.
Publisher's note: Copernicus Publications remains neutral with regard to jurisdictional claims made in the text, published maps, institutional affiliations, or any other geographical representation in this paper. The authors bear the ultimate responsibility for providing appropriate place names. Views expressed in the text are those of the authors and do not necessarily reflect the views of the publisher.
The authors would like to thank the Hebrew University Research Computing Service (HURCS) for their support. We thank Paul Moorcroft for his insightful input on this study, Dan Yakir for the Yatir eddy covariance flux tower data and Tamir Klein for provision of validation data. For their roles in producing, coordinating, and making the ISIMIP input data available, we acknowledge the ISIMIP cross-sectoral science team. We used Generative AI to support writing refinement and language editing, as well as to help synthesize the literature. All content was subsequently reviewed, verified, and edited by the authors to ensure scientific accuracy and integrity. We used Anthropic's Claude AI (accessed in 2025) to assist in drafting R scripts for figure generation and to support parts of the model calibration process, specifically for code generation and identifying key parameter-process linkages in ED2.2. All scripts and analytical decisions were critically reviewed, tested, and validated by the authors to ensure scientific integrity and reproducibility.
This research has been supported by the Ministry of Environmental Protection (grant no. 22-1-17) and the Azrieli Foundation (Azrieli Fellowship).
This paper was edited by Andrew Feldman and reviewed by two anonymous referees.
Adams, H. D., Guardiola-Claramonte, M., Barron-Gafford, G. A., Villegas, J. C., Breshears, D. D., Zou, C. B., Troch, P. A., and Huxman, T. E.: Temperature sensitivity of drought-induced tree mortality portends increased regional die-off under global-change-type drought, P. Natl. Acad. Sci. USA, 106, 7063–7066, https://doi.org/10.1073/pnas.0901438106, 2009.
Adams, H. D., Zeppel, M. J. B., Anderegg, W. R. L., Hartmann, H., Landhäusser, S. M., Tissue, D. T., Huxman, T. E., Hudson, P. J., Franz, T. E., Allen, C. D., Anderegg, L. D. L., Barron-Gafford, G. A., Beerling, D. J., Breshears, D. D., Brodribb, T. J., Bugmann, H., Cobb, R. C., Collins, A. D., Dickman, L. T., Duan, H., Ewers, B. E., Galiano, L., Galvez, D. A., Garcia-Forner, N., Gaylord, M. L., Germino, M. J., Gessler, A., Hacke, U. G., Hakamada, R., Hector, A., Jenkins, M. W., Kane, J. M., Kolb, T. E., Law, D. J., Lewis, J. D., Limousin, J.-M., Love, D. M., Macalady, A. K., Martínez-Vilalta, J., Mencuccini, M., Mitchell, P. J., Muss, J. D., O'Brien, M. J., O'Grady, A. P., Pangle, R. E., Pinkard, E. A., Piper, F. I., Plaut, J. A., Pockman, W. T., Quirk, J., Reinhardt, K., Ripullone, F., Ryan, M. G., Sala, A., Sevanto, S., Sperry, J. S., Vargas, R., Vennetier, M., Way, D. A., Xu, C., Yepez, E. A., and McDowell, N. G.: A multi-species synthesis of physiological mechanisms in drought-induced tree mortality, Nat. Ecol. Evol., 1, 1285–1291, https://doi.org/10.1038/s41559-017-0248-x, 2017.
Ahlström, A., Raupach, M. R., Schurgers, G., Smith, B., Arneth, A., Jung, M., Reichstein, M., Canadell, J. G., Friedlingstein, P., Jain, A. K., Kato, E., Poulter, B., Sitch, S., Stocker, B. D., Viovy, N., Wang, Y. P., Wiltshire, A., Zaehle, S., and Zeng, N.: The dominant role of semi-arid ecosystems in the trend and variability of the land CO2 sink, Science, 348, 895–899, https://doi.org/10.1126/science.aaa1668, 2015.
Anderegg, W. R. L., Trugman, A. T., Bowling, D. R., Salvucci, G., and Tuttle, S. E.: Plant functional traits and climate influence drought intensification and land–atmosphere feedbacks, P. Natl. Acad. Sci. USA, 116, 14071–14076, https://doi.org/10.1073/pnas.1904747116, 2019.
Anderegg, W. R. L., Trugman, A. T., Badgley, G., Anderson, C. M., Bartuska, A., Ciais, P., Cullenward, D., Field, C. B., Freeman, J., Goetz, S. J., Hicke, J. A., Huntzinger, D., Jackson, R. B., Nickerson, J., Pacala, S., and Randerson, J. T.: Climate-driven risks to the climate mitigation potential of forests, Science, 368, eaaz7005, https://doi.org/10.1126/science.aaz7005, 2020.
Antonarakis, A. S., Bogan, S. A., Goulden, M. L., and Moorcroft, P. R.: Impacts of the 2012–2015 Californian drought on carbon, water and energy fluxes in the Californian Sierras: Results from an imaging spectrometry-constrained terrestrial biosphere model, Glob. Change Biol., 28, 1823–1852, https://doi.org/10.1111/gcb.15995, 2022.
Bastin, J.-F., Finegold, Y., Garcia, C., Mollicone, D., Rezende, M., Routh, D., Zohner, C. M., and Crowther, T. W.: The global tree restoration potential, Science, 365, 76–79, https://doi.org/10.1126/science.aax0848, 2019.
Cai, J.: humidity: Calculate Water Vapor Measures from Temperature and Dew Point, R package version 0.1.5, CRAN [code], https://doi.org/10.32614/CRAN.package.humidity, 2019.
Calev, A., Zoref, C., Tzukerman, M., Moshe, Y., Zangy, E., and Osem, Y.: High-intensity thinning treatments in mature Pinus halepensis plantations experiencing prolonged drought, Eur. J. For. Res., 135, 551–563, https://doi.org/10.1007/s10342-016-0954-y, 2016.
Chang, L.-L., Liu, S., Antonarakis, A. S., Longo, M., Tang, H., Armston, J. D., Dubayah, R., and Moorcroft, P.: Legacies of model initialization on predictions of future ecosystem dynamics in California's Sierra Nevada: insights from GEDI, New Phytol., 248, 2809–2832, https://doi.org/10.1111/nph.70657, 2025.
Choat, B., Brodribb, T. J., Brodersen, C. R., Duursma, R. A., López, R., and Medlyn, B. E.: Triggers of tree mortality under drought, Nature, 558, 531–539, https://doi.org/10.1038/s41586-018-0240-x, 2018.
Cos, J., Doblas-Reyes, F., Jury, M., Marcos, R., Bretonnière, P.-A., and Samsó, M.: The Mediterranean climate change hotspot in the CMIP5 and CMIP6 projections, Earth Syst. Dynam., 13, 321–340, https://doi.org/10.5194/esd-13-321-2022, 2022.
Cosby, B. J., Hornberger, G. M., Clapp, R. B., and Ginn, T. R.: A statistical exploration of the relationships of soil moisture characteristics to the physical properties of soils, Water Resour. Res., 20, 682–690, https://doi.org/10.1029/WR020i006p00682, 1984.
Dashti, H., Pandit, K., Glenn, N. F., Shinneman, D. J., Flerchinger, G. N., Hudak, A. T., de Graaf, M. A., Flores, A., Ustin, S., Ilangakoon, N., and Fellows, A. W.: Performance of the ecosystem demography model (EDv2.2) in simulating gross primary production capacity and activity in a dryland study area, Agric. For. Meteorol., 297, 108270, https://doi.org/10.1016/j.agrformet.2020.108270, 2021.
De Kauwe, M. G., Medlyn, B. E., Zaehle, S., Walker, A. P., Dietze, M. C., Wang, Y.-P., Luo, Y., Jain, A. K., El-Masri, B., Hickler, T., Wårlind, D., Weng, E., Parton, W. J., Thornton, P. E., Wang, S., Prentice, I. C., Asao, S., Smith, B., McCarthy, H. R., Iversen, C. M., Hanson, P. J., Warren, J. M., Oren, R., and Norby, R. J.: Where does the carbon go? A model–data intercomparison of vegetation carbon allocation and turnover processes at two temperate forest free-air CO2 enrichment sites, New Phytol., 203, 883–899, https://doi.org/10.1111/nph.12847, 2014.
Dorado-Liñán, I., Piovesan, G., Martínez-Sancho, E., Gea-Izquierdo, G., Zang, C., Cañellas, I., Castagneri, D., Di Filippo, A., Gutiérrez, E., Ewald, J., Fernández-de-Uña, L., Hornstein, D., Jantsch, M. C., Levanič, T., Mellert, K. H., Vacchiano, G., Zlatanov, T., and Menzel, A.: Geographical adaptation prevails over species-specific determinism in trees' vulnerability to climate change at Mediterranean rear-edge forests, Glob. Change Biol., 25, 1296–1314, https://doi.org/10.1111/gcb.14544, 2019.
Dorman, M., Perevolotsky, A., Sarris, D., and Svoray, T.: The effect of rainfall and competition intensity on forest response to drought: lessons learned from a dry extreme, Oecologia, 177, 1025–1038, https://doi.org/10.1007/s00442-015-3229-2, 2015.
Drori, R., Ziv, B., Saaroni, H., Etkin, A., and Sheffer, E.: Recent changes in the rain regime over the Mediterranean climate region of Israel, Clim. Change, 167, 15, https://doi.org/10.1007/s10584-021-03161-6, 2021.
ED2 Model Development Team: Ecosystem Demography model version 2 (ED2), GitHub [code], https://github.com/EDmodel/ED2, last access: 4 November 2026.
Fatichi, S., Pappas, C., Zscheischler, J., and Leuzinger, S.: Modelling carbon sources and sinks in terrestrial vegetation, New Phytol., 221, 652–668, https://doi.org/10.1111/nph.15451, 2019.
Feng, X., Uriarte, M., González, G., Reed, S., Thompson, J., Zimmerman, J. K., and Murphy, L.: Improving predictions of tropical forest response to climate change through integration of field studies and ecosystem modeling, Glob. Change Biol., 24, e213–e232, https://doi.org/10.1111/gcb.13863, 2018.
Friedlingstein, P., Allen, M., Canadell, J. G., Peters, G. P., and Seneviratne, S. I.: Comment on “The global tree restoration potential”, Science, 366, eaay8060, https://doi.org/10.1126/science.aay8060, 2019.
Friedlingstein, P., O'Sullivan, M., Jones, M. W., Andrew, R. M., Gregor, L., Hauck, J., Le Quéré, C., Luijkx, I. T., Olsen, A., Peters, G. P., Peters, W., Pongratz, J., Schwingshackl, C., Sitch, S., Canadell, J. G., Ciais, P., Jackson, R. B., Alin, S. R., Alkama, R., Arneth, A., Arora, V. K., Bates, N. R., Becker, M., Bellouin, N., Bittig, H. C., Bopp, L., Chevallier, F., Chini, L. P., Cronin, M., Evans, W., Falk, S., Feely, R. A., Gasser, T., Gehlen, M., Gkritzalis, T., Gloege, L., Grassi, G., Gruber, N., Gürses, Ö., Harris, I., Hefner, M., Houghton, R. A., Hurtt, G. C., Iida, Y., Ilyina, T., Jain, A. K., Jersild, A., Kadono, K., Kato, E., Kennedy, D., Klein Goldewijk, K., Knauer, J., Korsbakken, J. I., Landschützer, P., Lefèvre, N., Lindsay, K., Liu, J., Liu, Z., Marland, G., Mayot, N., McGrath, M. J., Metzl, N., Monacci, N. M., Munro, D. R., Nakaoka, S.-I., Niwa, Y., O'Brien, K., Ono, T., Palmer, P. I., Pan, N., Pierrot, D., Pocock, K., Poulter, B., Resplandy, L., Robertson, E., Rödenbeck, C., Rodriguez, C., Rosan, T. M., Schwinger, J., Séférian, R., Shutler, J. D., Skjelvan, I., Steinhoff, T., Sun, Q., Sutton, A. J., Sweeney, C., Takao, S., Tanhua, T., Tans, P. P., Tian, X., Tian, H., Tilbrook, B., Tsujino, H., Tubiello, F., van der Werf, G. R., Walker, A. P., Wanninkhof, R., Whitehead, C., Willstrand Wranne, A., Wright, R., Yuan, W., Yue, C., Yue, X., Zaehle, S., Zeng, J., and Zheng, B.: Global Carbon Budget 2022, Earth Syst. Sci. Data, 14, 4811–4900, https://doi.org/10.5194/essd-14-4811-2022, 2022.
Gebrechorkos, S., Leyland, J., Slater, L., Wortmann, M., Ashworth, P. J., Bennett, G. L., Boothroyd, R., Cloke, H., Delorme, P., Griffith, H., Hardy, R., Hawker, L., McLelland, S., Neal, J., Nicholas, A., Tatem, A. J., Vahidi, E., Parsons, D. R., and Darby, S. E.: A high-resolution daily global dataset of statistically downscaled CMIP6 models for climate impact analyses, Sci. Data, 10, 611, https://doi.org/10.1038/s41597-023-02528-x, 2023.
Grünzweig, J. M., Lin, T., Rotenberg, E., Schwartz, A., and Yakir, D.: Carbon sequestration in arid-land forest, Glob. Change Biol., 9, 791–799, https://doi.org/10.1046/j.1365-2486.2003.00612.x, 2003.
Grünzweig, J. M., De Boeck, H. J., Rey, A., Santos, M. J., Adam, O., Bahn, M., Belnap, J., Deckmyn, G., Dekker, S. C., Flores, O., Gliksman, D., Helman, D., Hultine, K. R., Liu, L., Meron, E., Michael, Y., Sheffer, E., Throop, H. L., Tzuk, O., and Yakir, D.: Dryland mechanisms could widely control ecosystem functioning in a drier and warmer world, Nat. Ecol. Evol., 6, 1064–1076, https://doi.org/10.1038/s41559-022-01779-y, 2022.
Hartmann, H., Bastos, A., Das, A. J., Esquivel-Muelbert, A., Hammond, W. M., Martínez-Vilalta, J., McDowell, N. G., Powers, J. S., Pugh, T. A. M., Ruthrof, K. X., and Allen, C. D.: Climate Change Risks to Global Forest Health: Emergence of Unexpected Events of Elevated Tree Mortality Worldwide, Annu. Rev. Plant Biol., 73, 673–702, https://doi.org/10.1146/annurev-arplant-102820-012804, 2022.
Hisano, M., Ghazoul, J., Chen, X., and Chen, H. Y. H.: Functional diversity enhances dryland forest productivity under long-term climate change, Sci. Adv., 10, eadn4152, https://doi.org/10.1126/sciadv.adn4152, 2024.
Huang, X., Zhen, Z., Zhao, W., and Wang, X.: Forest carbon sink in North China increased in recent two decades, but decreased in extreme drought years, GIScience Remote Sens., 61, 2383040, https://doi.org/10.1080/15481603.2024.2383040, 2024.
IPCC: Climate Change 2021: The Physical Science Basis. Contribution of Working Group I to the Sixth Assessment Report of the Intergovernmental Panel on Climate Change, edited by: Masson-Delmotte, V., Zhai, P., Pirani, A., Connors, S. L., Péan, C., Berger, S., Caud, N., Chen, Y., Goldfarb, L., Gomis, M. I., Huang, M., Leitzell, K., Lonnoy, E., Matthews, J. B. R., Maycock, T. K., Waterfield, T., Yelekçi, O., Yu, R., and Zhou, B., Cambridge University Press, Cambridge, UK and New York, NY, USA, https://doi.org/10.1017/9781009157896, 2021.
IPCC: Climate Change 2022: Impacts, Adaptation, and Vulnerability. Contribution of Working Group II to the Sixth Assessment Report of the Intergovernmental Panel on Climate Change, edited by: Pörtner, H.-O., Roberts, D. C., Tignor, M., Poloczanska, E. S., Mintenbeck, K., Alegría, A., Craig, M., Langsdorf, S., Löschke, S., Möller, V., Okem, A., and Rama, B., Cambridge University Press, Cambridge, UK and New York, NY, USA, https://doi.org/10.1017/9781009325844, 2022.
Irob, K.: Data CO2 Fertilization to Climate Limitation: Shifting Drivers in a Dryland Forest, Zenodo [data set], https://doi.org/10.5281/zenodo.23735322, 2026.
Irob, K., Blaum, N., Weiss-Aparicio, A., Hauptfleisch, M., Hering, R., Uiseb, K., and Tietjen, B.: Savanna resilience to droughts increases with the proportion of browsing wild herbivores and plant functional diversity, J. Appl. Ecol., 60, 251–262, https://doi.org/10.1111/1365-2664.14351, 2023.
Jiang, M., Medlyn, B. E., Drake, J. E., Duursma, R. A., Anderson, I. C., Barton, C. V. M., Boer, M. M., Carrillo, Y., Castañeda-Gómez, L., Collins, L., Crous, K. Y., De Kauwe, M. G., dos Santos, B. M., Emmerson, K. M., Facey, S. L., Gherlenda, A. N., Gimeno, T. E., Hasegawa, S., Johnson, S. N., Kännaste, A., Macdonald, C. A., Mahmud, K., Moore, B. D., Nazaries, L., Neilson, E. H. J., Nielsen, U. N., Niinemets, Ü., Noh, N. J., Ochoa-Hueso, R., Pathare, V. S., Pendall, E., Pihlblad, J., Piñeiro, J., Powell, J. R., Power, S. A., Reich, P. B., Renchon, A. A., Riegler, M., Rinnan, R., Rymer, P. D., Salomón, R. L., Singh, B. K., Smith, B., Tjoelker, M. G., Walker, J. K. M., Wujeska-Klause, A., Yang, J., Zaehle, S., and Ellsworth, D. S.: The fate of carbon in a mature forest under carbon dioxide enrichment, Nature, 580, 227–231, https://doi.org/10.1038/s41586-020-2128-9, 2020.
Johnston, M.: Plant temperature in a Mediterranean woodland savanna: Measurements and models, PhD thesis, Harvard University, Cambridge, MA, USA, https://dash.harvard.edu/entities/publication/8b11b19a-a77d-4bd9-ac16-8d9875031322 (last access: 4 November 2026), 2021.
Kannenberg, S. A., Schwalm, C. R., and Anderegg, W. R. L.: Ghosts of the past: how drought legacy effects shape forest functioning and carbon cycling, Ecol. Lett., 23, 891–901, https://doi.org/10.1111/ele.13485, 2020.
Klein, T., Cohen, S., and Yakir, D.: Hydraulic adjustments underlying drought resistance of Pinus halepensis, Tree Physiol., 31, 637–648, https://doi.org/10.1093/treephys/tpr047, 2011.
Klein, T., Rotenberg, E., Cohen-Hilaleh, E., Raz-Yaseef, N., Tatarinov, F., Preisler, Y., Ogée, J., Cohen, S., and Yakir, D.: Quantifying transpirable soil water and its relations to tree water use dynamics in a water-limited pine forest, Ecohydrology, 7, 409–419, https://doi.org/10.1002/eco.1360, 2014.
Klein, T., Cohen, S., Paudel, I., Preisler, Y., Rotenberg, E., and Yakir, D.: Diurnal dynamics of water transport, storage and hydraulic conductivity in pine trees under seasonal drought, iForest-Biogeosciences and Forestry, 9, 710, https://doi.org/10.3832/ifor2046-009, 2016.
Körner, C.: Plant CO2 responses: an issue of definition, time and resource supply, New Phytol., 172, 393–411, https://doi.org/10.1111/j.1469-8137.2006.01886.x, 2006.
Lange, S.: Trend-preserving bias adjustment and statistical downscaling with ISIMIP3BASD (v1.0), Geosci. Model Dev., 12, 3055–3070, https://doi.org/10.5194/gmd-12-3055-2019, 2019.
Lange, S. and Büchner, M.: ISIMIP3b bias-adjusted atmospheric climate input data (v1.1), ISIMIP Repository [data set], https://doi.org/10.48364/ISIMIP.842396.1, 2021.
Leuzinger, S. and Körner, C.: Water savings in mature deciduous forest trees under elevated CO2, Glob. Change Biol., 13, 2498–2508, https://doi.org/10.1111/j.1365-2486.2007.01467.x, 2007.
Longo, M., Knox, R. G., Medvigy, D. M., Levine, N. M., Dietze, M. C., Kim, Y., Swann, A. L. S., Zhang, K., Rollinson, C. R., Bras, R. L., Wofsy, S. C., and Moorcroft, P. R.: The biophysics, ecology, and biogeochemistry of functionally diverse, vertically and horizontally heterogeneous ecosystems: the Ecosystem Demography model, version 2.2 – Part 1: Model description, Geosci. Model Dev., 12, 4309–4346, https://doi.org/10.5194/gmd-12-4309-2019, 2019.
McDowell, N., Pockman, W. T., Allen, C. D., Breshears, D. D., Cobb, N., Kolb, T., Plaut, J., Sperry, J., West, A., Williams, D. G., and Yepez, E. A.: Mechanisms of plant survival and mortality during drought: why do some plants survive while others succumb to drought?, New Phytol., 178, 719–739, https://doi.org/10.1111/j.1469-8137.2008.02436.x, 2008.
McDowell, N. G., Allen, C. D., Anderson-Teixeira, K., Aukema, B. H., Bond-Lamberty, B., Chini, L., Clark, J. S., Dietze, M., Grossiord, C., Hanbury-Brown, A., Hurtt, G. C., Jackson, R. B., Johnson, D. J., Kueppers, L., Lichstein, J. W., Ogle, K., Poulter, B., Pugh, T. A. M., Seidl, R., Turner, M. G., Uriarte, M., Walker, A. P., and Xu, C.: Pervasive shifts in forest dynamics in a changing world, Science, 368, eaaz9463, https://doi.org/10.1126/science.aaz9463, 2020.
Moorcroft, P. R., Hurtt, G. C., and Pacala, S. W.: A method for scaling vegetation dynamics: the ecosystem demography model (ED), Ecol. Monogr., 71, 557–586, 2001.
Morán-Ordóñez, A., Ramsauer, J., Coll, L., Brotons, L., and Ameztegui, A.: Ecosystem services provision by Mediterranean forests will be compromised above 2 °C warming, Glob. Change Biol., 27, 4210–4222, https://doi.org/10.1111/gcb.15745, 2021.
Nadal-Sala, D., Grote, R., Kraus, D., Hochberg, U., Klein, T., Wagner, Y., Tatarinov, F., Yakir, D., and Ruehr, N. K.: Integration of tree hydraulic processes and functional impairment to capture the drought resilience of a semiarid pine forest, Biogeosciences, 21, 2973–2994, https://doi.org/10.5194/bg-21-2973-2024, 2024.
Novick, K. A., Ficklin, D. L., Stoy, P. C., Williams, C. A., Bohrer, G., Oishi, A. C., Papuga, S. A., Blanken, P. D., Noormets, A., Sulman, B. N., Scott, R. L., Wang, L., and Phillips, R. P.: The increasing importance of atmospheric demand for ecosystem water and carbon fluxes, Nat. Clim. Change, 6, 1023–1027, https://doi.org/10.1038/nclimate3114, 2016.
Ogaya, R. and Peñuelas, J.: Climate Change Effects in a Mediterranean Forest Following 21 Consecutive Years of Experimental Drought, Forests, 12, 306, https://doi.org/10.3390/f12030306, 2021.
Osem, Y., Yavlovich, H., Zecharia, N., Atzmon, N., Moshe, Y., and Schiller, G.: Fire-free natural regeneration in water limited Pinus halepensis forests: a silvicultural approach, Eur. J. For. Res., 132, 679–690, https://doi.org/10.1007/s10342-013-0704-3, 2013.
Pandit, K., Dashti, H., Glenn, N. F., Flores, A. N., Maguire, K. C., Shinneman, D. J., Flerchinger, G. N., and Fellows, A. W.: Developing and optimizing shrub parameters representing sagebrush (Artemisia spp.) ecosystems in the northern Great Basin using the Ecosystem Demography (EDv2.2) model, Geosci. Model Dev., 12, 4585–4601, https://doi.org/10.5194/gmd-12-4585-2019, 2019.
Peñuelas, J., Ciais, P., Canadell, J. G., Janssens, I. A., Fernández-Martínez, M., Carnicer, J., Obersteiner, M., Piao, S., Vautard, R., and Sardans, J.: Shifting from a fertilization-dominated to a warming-dominated period, Nat. Ecol. Evol., 1, 1438–1445, https://doi.org/10.1038/s41559-017-0274-8, 2017.
Pozner, E., Bar-On, P., Livne-Luzon, S., Moran, U., Tsamir-Rimon, M., Dener, E., Schwartz, E., Rotenberg, E., Tatarinov, F., Preisler, Y., Zecharia, N., Osem, Y., Yakir, D., and Klein, T.: A hidden mechanism of forest loss under climate change: The role of drought in eliminating forest regeneration at the edge of its distribution, For. Ecol. Manag., 506, 119966, https://doi.org/10.1016/j.foreco.2021.119966, 2022.
Preisler, Y., Tatarinov, F., Grünzweig, J. M., Bert, D., Ogée, J., Wingate, L., Rotenberg, E., Rohatyn, S., Her, N., Moshe, I., Klein, T., and Yakir, D.: Mortality versus survival in drought-affected Aleppo pine forest depends on the extent of rock cover and soil stoniness, Funct. Ecol., 33, 901–912, https://doi.org/10.1111/1365-2435.13302, 2019.
Preisler, Y., Tatarinov, F., Grünzweig, J. M., and Yakir, D.: Seeking the “point of no return” in the sequence of events leading to mortality of mature trees, Plant Cell Environ., 44, 1315–1328, https://doi.org/10.1111/pce.13942, 2021.
Preisler, Y., Hölttä, T., Grünzweig, J. M., Oz, I., Tatarinov, F., Ruehr, N. K., Rotenberg, E., and Yakir, D.: The importance of tree internal water storage under drought conditions, Tree Physiol., 42, 771–783, 2022.
R Core Team: R: A Language and Environment for Statistical Computing, R Foundation for Statistical Computing, Vienna, Austria, https://www.R-project.org/ (last access: 4 November 2026), 2025.
Reichstein, M., Bahn, M., Ciais, P., Frank, D., Mahecha, M. D., Seneviratne, S. I., Zscheischler, J., Beer, C., Buchmann, N., Frank, D. C., Papale, D., Rammig, A., Smith, P., Thonicke, K., van der Velde, M., Vicca, S., Walz, A., and Wattenbach, M.: Climate extremes and the carbon cycle, Nature, 500, 287–295, https://doi.org/10.1038/nature12350, 2013.
Rohatyn, S., Yakir, D., Rotenberg, E., and Carmel, Y.: Limited climate change mitigation potential through forestation of the vast dryland regions, Science, 377, 1436–1439, https://doi.org/10.1126/science.abm9684, 2022.
Rotenberg, E. and Yakir, D.: Contribution of Semi-Arid Forests to the Climate System, Science, 327, 451–454, https://doi.org/10.1126/science.1179998, 2010.
Ruehr, S., Keenan, T. F., Williams, C., Zhou, Y., Lu, X., Bastos, A., Canadell, J. G., Prentice, I. C., Sitch, S., and Terrer, C.: Evidence and attribution of the enhanced land carbon sink, Nat. Rev. Earth Environ., 4, 518–534, https://doi.org/10.1038/s43017-023-00456-3, 2023.
Schiller, G. and Atzmon, N.: Performance of Aleppo pine (Pinus halepensis) provenances grown at the edge of the Negev desert: A review, J. Arid Environ., 73, 1051–1057, https://doi.org/10.1016/j.jaridenv.2009.06.003, 2009.
Shekhar, A., Hörtnagl, L., Paul-Limoges, E., Etzold, S., Zweifel, R., Buchmann, N., and Gharun, M.: Contrasting impact of extreme soil and atmospheric dryness on the functioning of trees and forests, Sci. Total Environ., 916, 169931, https://doi.org/10.1016/j.scitotenv.2024.169931, 2024.
Spinoni, J., Barbosa, P., De Jager, A., McCormick, N., Naumann, G., Vogt, J. V., Magni, D., Masante, D., and Mazzeschi, M.: A new global database of meteorological drought events from 1951 to 2016, J. Hydrol. Reg. Stud., 22, 22, 100593, https://doi.org/10.1016/j.ejrh.2019.100593, 2019.
Sprintsin, M., Cohen, S., Maseyk, K., Rotenberg, E., Grünzweig, J., Karnieli, A., Berliner, P., and Yakir, D.: Long term and seasonal courses of leaf area index in a semi-arid forest plantation, Agric. For. Meteorol., 151, 565–574, https://doi.org/10.1016/j.agrformet.2011.01.001, 2011.
Steel, Z. L., Safford, H. D., and Viers, J. H.: The fire frequency-severity relationship and the legacy of fire suppression in California forests, Ecosphere, 6, art8, https://doi.org/10.1890/ES14-00224.1, 2015.
Tatarinov, F., Rotenberg, E., Maseyk, K., Ogée, J., Klein, T., and Yakir, D.: Resilience to seasonal heat wave episodes in a Mediterranean pine forest, New Phytol., 210, 485–496, https://doi.org/10.1111/nph.13791, 2016.
Terrer, C., Jackson, R. B., Prentice, I. C., Keenan, T. F., Kaiser, C., Vicca, S., Fisher, J. B., Reich, P. B., Stocker, B. D., Hungate, B. A., Peñuelas, J., McCallum, I., Soudzilovskaia, N. A., Cernusak, L. A., Talhelm, A. F., Van Sundert, K., Piao, S., Newton, P. C. D., Hovenden, M. J., Blumenthal, D. M., Liu, Y. Y., Müller, C., Winter, K., Field, C. B., Viechtbauer, W., Van Lissa, C. J., Hoosbeek, M. R., Watanabe, M., Koike, T., Leshyk, V. O., Polley, H. W., and Franklin, O.: Nitrogen and phosphorus constrain the CO2 fertilization of global plant biomass, Nat. Clim. Change, 9, 684–689, https://doi.org/10.1038/s41558-019-0545-2, 2019.
Väänänen, P. J., Osem, Y., Cohen, S., and Grünzweig, J. M.: Differential drought resistance strategies of co-existing woodland species enduring the long rainless Eastern Mediterranean summer, Tree Physiol., 40, 305–320, https://doi.org/10.1093/treephys/tpz130, 2020.
Van Vuuren, D. P., O'Neill, B. C., Tebaldi, C., Sanderson, B. M., Chini, L. P., Friedlingstein, P., Hasegawa, T., Riahi, K., Govindasamy, B., Bauer, N., Eyring, V., Fall, C. M. N., Frieler, K., Gidden, M. J., Gohar, L. K., Högner, A., Jones, A. D., Kikstra, J., King, A., Knutti, R., Kriegler, E., Lawrence, P., Lennard, C., Lowe, J., Mathison, C., Mehmood, S., Nicholls, Z., Prado, L. F., Zhang, Q., Rose, S. K., Ruane, A. C., Sandstad, M., Schleussner, C.-F., Seferian, R., Sillmann, J., Smith, C., Sörensson, A. A., Panickal, S., Tachiiri, K., Vaughan, N., Vishwanathan, S. S., Yokohata, T., Zecchetto, M., and Ziehn, T.: The Scenario Model Intercomparison Project for CMIP7 (ScenarioMIP-CMIP7), Geosci. Model Dev., 19, 2627–2656, https://doi.org/10.5194/gmd-19-2627-2026, 2026.
Walker, A. P., De Kauwe, M. G., Bastos, A., Belmecheri, S., Georgiou, K., Keeling, R. F., McMahon, S. M., Medlyn, B. E., Moore, D. J. P., Norby, R. J., Zaehle, S., Anderson-Teixeira, K. J., Battipaglia, G., Brienen, R. J. W., Cabugao, K. G., Cailleret, M., Campbell, E., Canadell, J. G., Ciais, P., Craig, M. E., Ellsworth, D. S., Farquhar, G. D., Fatichi, S., Fisher, J. B., Frank, D. C., Graven, H., Gu, L., Haverd, V., Heilman, K., Heimann, M., Hungate, B. A., Iversen, C. M., Joos, F., Jiang, M., Keenan, T. F., Knauer, J., Körner, C., Leshyk, V. O., Leuzinger, S., Liu, Y., MacBean, N., Malhi, Y., McVicar, T. R., Penuelas, J., Pongratz, J., Powell, A. S., Riutta, T., Sabot, M. E. B., Schleucher, J., Sitch, S., Smith, W. K., Sulman, B., Taylor, B., Terrer, C., Torn, M. S., Treseder, K. K., Trugman, A. T., Trumbore, S. E., van Mantgem, P. J., Voelker, S. L., Whelan, M. E., and Zuidema, P. A.: Integrating the evidence for a terrestrial carbon sink caused by increasing atmospheric CO2, New Phytol., 229, 2413–2445, https://doi.org/10.1111/nph.16866, 2021.
Wood, S. N.: Generalized Additive Models: An Introduction with R, 2nd edn., Chapman and Hall/CRC, Boca Raton, https://doi.org/10.1201/9781315370279, 2017.
Xu, X., Medvigy, D., Powers, J. S., Becknell, J. M., and Guan, K.: Diversity in plant hydraulic traits explains seasonal and inter-annual variations of vegetation dynamics in seasonally dry tropical forests, New Phytol., 212, 80–95, https://doi.org/10.1111/nph.14009, 2016.
Yang, X., Tang, J., Mustard, J. F., Lee, J.-E., Rossini, M., Joiner, J., Munger, J. W., Kornfeld, A., and Richardson, A. D.: Solar-induced chlorophyll fluorescence that correlates with canopy photosynthesis on diurnal and seasonal scales in a temperate deciduous forest, Geophys. Res. Lett., 42, 2977–2987, https://doi.org/10.1002/2015GL063201, 2015.
Yosef, G., Walko, R., Avisar, R., Tatarinov, F., Rotenberg, E., and Yakir, D.: Large-scale semi-arid afforestation can enhance precipitation and carbon sequestration potential, Sci. Rep., 8, 996, https://doi.org/10.1038/s41598-018-19265-6, 2018.
Zhang, J., Bras, R. L., Longo, M., and Heartsill Scalley, T.: The impact of hurricane disturbances on a tropical forest: implementing a palm plant functional type and hurricane disturbance module in ED2-HuDi V1.0, Geosci. Model Dev., 15, 5107–5126, https://doi.org/10.5194/gmd-15-5107-2022, 2022.
Zhu, Z., Zeng, H., Myneni, R. B., Chen, C., Zhao, Q., Zha, J., Zhan, S., and MacLachlan, I.: Comment on “Recent global decline of CO2 fertilization effects on vegetation photosynthesis”, Science, 373, eabg5673, https://doi.org/10.1126/science.abg5673, 2021.
Zscheischler, J., Martius, O., Westra, S., Bevacqua, E., Raymond, C., Horton, R. M., van den Hurk, B., AghaKouchak, A., Jézéquel, A., Mahecha, M. D., Maraun, D., Ramos, A. M., Ridder, N. N., Thiery, W., and Vignotto, E.: A typology of compound weather and climate events, Nature Reviews Earth and Environment, 1, 333–347, https://doi.org/10.1038/s43017-020-0060-z, 2020.