
the Creative Commons Attribution 4.0 License.
the Creative Commons Attribution 4.0 License.
 | 11 Nov 2026
Plant hydraulic traits regulating productivity and drought resistance in boreal crops

Samuli Launiainen
Julius Vira
Liisa Kulmala
Taru Palosuo
Hermanni Aaltonen
Olli Nevalainen
Istem Fer
Henriikka Vekuri
Jari-Pekka Nousu
Mika Korkiakoski
Jari Liski
Plant hydraulics play a critical role in coordinating photosynthesis, water use, and hydraulic safety when facing water scarcity. The hydraulic traits of boreal crops and their relevance to productivity and drought resistance, however, remain poorly researched. In this study, we combined multi-year carbon and water flux measurements from two Finnish fields representing contrasting boreal cropping systems – a perennial forage grass mixture and an annual cereal crop (oats) – with a novel modelling framework coupling plant photosynthesis, hydraulics, and soil moisture dynamics to decipher the field-level effective hydraulic traits (i.e., apparent hydraulic traits) of the crops and their association with crop performance under varying drought conditions. The model reproduced the observed carbon and water fluxes well and revealed relatively low maximum whole-plant hydraulic conductance and conservative water-use strategies in both crops. Under drought, low hydraulic efficiency prevented soil water depletion and thereby supported high productivity through drought avoidance, whereas its advantage diminished under wetter conditions. Both crops were substantially more susceptible to atmospheric dryness than to low soil moisture, highlighting vapor pressure deficit as an important constraint on crop productivity under boreal conditions. The remaining discrepancy between the model-inferred apparent hydraulic traits and available empirical measurements for temperate crops indicates the need for more direct hydraulic measurements of boreal crops. Our findings further underscore the importance of incorporating crop hydraulic processes in process-based crop models to gain physiological insights into crop performance and to enhance their accuracy and predictive power under current and future climates.
- Article
(8103 KB) - Full-text XML
-
Supplement
(3648 KB) - BibTeX
- EndNote


Hydraulic traits are plant properties regulating water extraction and transport from the soil to the aerial organs, which play a fundamental role in plant productivity, notably when faced with water scarcity (Cardoso et al., 2025; Torres-Ruiz et al., 2024; Sperry and Love, 2015). Among these traits, two have been most widely studied. One is the maximum hydraulic conductance, which quantifies the efficiency with which water is transported through the whole plant or its individual organs (e.g. roots, stems and leaves) to meet photosynthetic demands (Holloway-Phillips and Brodribb, 2011a; Ocheltree et al., 2016; Gleason et al., 2021). The other is the water potential at which a plant loses 50 % of its maximum conductance. It is often used to quantify plant hydraulic safety, i.e. its resistance to drought-induced embolism, loss of water-transport capacity, and the resultant mortality (Choat et al., 2012; Anderegg et al., 2016). These two traits, which characterise, respectively, the hydraulic efficiency and safety of a plant, together play a critical role in shaping the plant's water use strategy.
A trade-off between hydraulic efficiency and safety has been widely documented (Ocheltree et al., 2016; Huo et al., 2022; Zhao et al., 2025), stating that plants capable of efficiently transporting water are often more vulnerable to embolism, and vice versa, because the wider and more interconnected xylem conduits that enable such efficient transport are also more prone to cavitation. An analogous trade-off has also been proposed for stomatal regulation (Henry et al., 2019), whereby maximising stomatal conductance promotes carbon gain but also increases transpirational water loss and the risk of desiccating plant water potential to a damaging level. However, the strength of such a trade-off is still hotly debated (Gleason et al., 2016; Sanchez-Martinez et al., 2020; Liu et al., 2021a), indicating that different species adopt different positions along the efficiency–safety spectrum to improve their fitness under variable environmental conditions. For instance, common crop species (mostly annual cereal crops from temperate and tropical regions) often exhibit high hydraulic efficiency but low hydraulic safety (Holloway-Phillips and Brodribb, 2011a; Lamarque et al., 2020; Corso et al., 2020; Canales et al., 2021; Gleason et al., 2021) to obtain high crop productivity, referred to as acquisitive hydraulic strategy. This is particularly the case for annual cereals (Liu et al., 2019). On the other hand, hydraulic traits indicating high safety but low efficiency (i.e., conservative hydraulic strategy) have been widely observed in species like boreal pine and spruce (Li et al., 2023) as well as perennial crops, which are known for their conservative hydraulic strategy to survive harsh winters and tolerate more stresses (Vico and Brunsell, 2018; Liu et al., 2019). Although plant hydraulic traits are often considered relatively conserved compared with more plastic plant traits such as photosynthetic capacity (Lamy et al., 2014; Ramírez-Valiente et al., 2025), substantial phenotypical plasticity has also been found in various plants under different conditions (Pritzkow et al., 2020; Sun et al., 2021; Alves et al., 2024; Matzner et al., 2014) and growing stages (Yao et al., 2021). For example, Sun et al. (2021) showed that barley grown under conventional no-tillage management exhibited higher hydraulic vulnerability than that under organic farming with intensive tillage.
Despite their significance, it remains elusive how hydraulic traits coordinate in boreal crops and modulate their productivity and drought response. Historically, water limitation has not been a primary concern for humid boreal agroecosystems. Therefore, hydraulic traits and drought tolerance have been less of a priority when selecting or breeding crops for the region, while other traits such as early maturity, cold tolerance, and disease resistance have received more attention (Roitsch et al., 2022). However, the situation has changed in recent years (Poque et al., 2025), as more frequent and severe drought events, characterised by both limited soil water availability (soil drought) and high atmospheric evaporative demand (atmospheric drought), have been observed and are projected to occur in the future (Spinoni et al., 2018; Aalto et al., 2026). The hydraulic traits governing the crop response to drought are therefore expected to be under strong selective pressure in the region. Thus, a deeper understanding of the impacts of different types of drought on boreal crops and their association with crop hydraulic traits is urgently needed.
Process-based models with an explicit representation of plant hydraulic processes have emerged only recently and have been shown to better describe plant responses to drought, especially atmospheric drought, than models without hydraulic processes (Kennedy et al., 2019; Liu et al., 2020; Kubota et al., 2026; Hu et al., 2026). They are also shown to be valuable tools for revealing plant's hydraulic traits through model inversion or calibration approaches (Wang et al., 2020; Gleason et al., 2022; Liu et al., 2021b; Lu et al., 2022). In particular, the use of field-level flux measurements to constrain the hydraulic parameters of such models has been proven effective in retrieving plant hydraulic traits at the field or ecosystem level (Liu et al., 2020). We refer to the average of the hydraulic traits over collective individuals of the same or different species at this scale as “apparent” hydraulic traits, in contrast to the organ- or individual-level hydraulic traits measured on single plants in laboratory or field studies.
In this study, we leveraged multi-year observations of carbon and water fluxes from two Finnish crop fields under a perennial forage grass mixture and an annual cereal (oats), respectively. Combining with a novel modelling framework that explicitly couples plant hydraulics, photosynthesis, and soil moisture dynamics, we infer apparent hydraulic traits of the two dominant and contrasting cropping systems in boreal agriculture, and examine their implications for crop functioning at field level. Specifically, our objective is to (i) evaluate the ability of the novel modelling framework to reproduce observed gross primary productivity and evapotranspiration, providing a basis for hydraulic trait inference; (ii) quantify and compare the apparent hydraulic traits of perennial and annual crops and assess their influence on productivity and water-use efficiency; and (iii) determine whether the two cropping systems differ in their resistance to drought and how these differences are associated with their hydraulic traits. In the following, we first describe the modelling framework, study sites and observations, and modelling experiments and workflow for addressing these objectives. We then evaluate the performance of the model, compare inferred hydraulic traits and their effects on crop functioning and drought responses, and finally discuss the broader implications and remaining uncertainties.
2.1 Structure of SPY-C
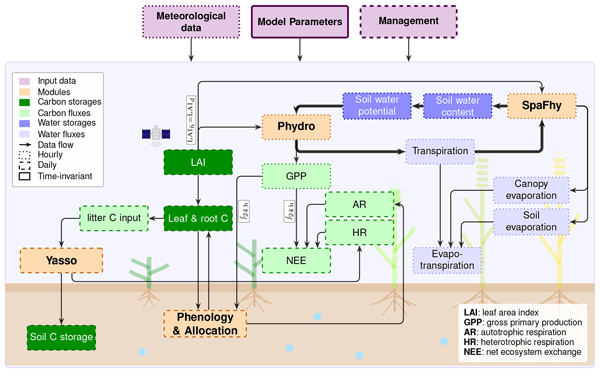
We developed a comprehensive soil-plant-atmosphere modelling framework, SPY-C, illustrated in Fig. 1. SPY-C is composed of four interlinked modules mostly from existing models: plant photosynthesis and hydraulics (Phydro), soil water balance (SpaFHy), soil organic carbon decomposition (Yasso), and a simple data-driven phenology and allocation module (PA). SPY-C here stands for SpaFHy-Phydro-Yasso for Carbon calculation.

Figure 1The model structure of SPY-C. Amber and lavender boxes denote model components and input data, respectively. The light and dark green boxes denote carbon fluxes and storages. The light and dark blue boxes denote water fluxes and storages. The outline line style denotes the time step of each module and data stream: dotted = hourly, dashed = daily, and solid = time-invariant. The arrows between boxes denote data flows. The thicker arrows denote the two-way coupling between Phydro and SpaFHy.
2.1.1 Plant hydraulic and photosynthesis module (Phydro)
Phydro is based on Joshi et al. (2022), which unifies plant photosynthesis and hydraulics through a trait-based optimality theory implemented through a single cost-benefit function. The first principle in Phydro is the steady-state leaf water balance, that is, the hydraulic flow rate at which water enters the leaf (the left side of Eq. 1) equals the transpiration rate (the right side of Eq. 1):
Here, Kp (unit: m) is the maximum whole-plant conductance per unit leaf area, which lumps the entire soil-to-leaf hydraulic pathway (including root, stem, and leaf) into a single effective conductance. η (unit: Pa s) is the dynamic viscosity of water, which is a function of air temperature (T) and pressure (Patm). Note that T, Patm, VPD, PAR, LAI, and ca, which are defined in the following sections, are all input variables to the model. ψsoil (Pa) is the soil water potential. Δψ (Pa) is the difference in water potential between the soil and the leaf (i.e., ψsoil − ψleaf). gs (mol CO2 m−2 s−1) is the stomatal conductance to CO2. D is the vapor pressure deficit (VPD) divided by Patm. P(ψ) is the vulnerability curve (Eq. 2) that describes the decline in plant water conductance K(ψ) with its water potential (ψ) (Eq. 3):
where ψ50 is the water potential at which 50 % of hydraulic conductivity is lost, and b determines the sensitivity of conductivity loss to water potential. Note that although the hydraulic framework underlying Phydro was developed primarily in the context of woody plants, its principles are also applicable to grass-like crops, where water is transported through functional xylem vessels within vascular bundles that provide a continuous hydraulic pathway from roots to leaves, despite the hollow stem structure and absence of secondary woody tissues (Heckwolf et al., 2015).
The second principle is the photosynthetic coordination hypothesis, which states that under typical day time conditions, the photosynthetic capacity is optimized so that the carboxylation-limited photosynthesis rate Ac (i.e., the left side of Eq. 4) and light-limited photosynthesis rate Aj (i.e., the right side of Eq. 4) are equal:
Here, Vcmax (µmol CO2 m−2 s−1) is the maximum carboxylation capacity of leaves. ci is the leaf-internal CO2 partial pressure divided by Patm. KM and Γ* are the Michaelis–Menten coefficient for C3 photosynthesis, and the photosynthetic light-compensation point, respectively. Both are a function of T and Patm. Rd is the dark respiration, which is assumed to be proportional to Vcmax (Eq. 5). J (µmol CO2 m−2 s−1) is the effective electron transport capacity of leaves, which is described by Eq. (6). We note that there are still uncertainties on the time scale on which the optimisation of photosynthetic capacity operates, spanning from instantaneous to weekly time scales (Joshi et al., 2022). Here, we assume that the optimization occurs at an hourly time scale to be tightly coupled with soil moisture dynamics during the day, which is also supported by a recent study by Drake et al. (2026).
where br is a unitless coefficient set to 0.015 in this study (Atkin et al., 2015).
where ϕ0 is the intrinsic quantum-yield efficiency, which is a function of T. Jmax (µmol CO2 m−2 s−1) is the maximum electron transport capacity of leaves under light saturation. Iabs (leaf) is the incident photosynthetic photon-flux density per unit leaf area, which is calculated following Eq. (7):
where PAR is photosynthetically active radiation (), LAI (m2 m−2) is the total one-sided green leaf area per unit ground surface area. fapar is the fraction of absorbed photosynthetically active radiation by the plant, which can be approximated following Beer's law:
where k is the “effective” canopy light attenuation parameter (including the effect of leaf reflectance and transmittance), which is assumed to be 0.5 in this study. For simplicity, the model does not resolve sunlit/shaded leaf fractions or multiple canopy layers.
The third principle is the steady-state leaf CO2 balance, which states that the rate of photosynthesis (the left side of Eq. 9, based on Eq. 4), equals the rate at which CO2 diffuses into the leaves (the right side of Eq. 9):
Here, ca is the atmospheric CO2 partial pressure divided by Patm and χ is the ratio of ci and ca.
Furthermore, a cost-benefit function F () is defined for plants as the benefit of net photosynthetic assimilation (Aj) minus the costs of maintaining the photosynthetic capacity (Jmax) and the hydraulic pathway (Δψ), as given by Eq. (10):
Here, α is a unitless coefficient denoting the unit cost of maintaining photosynthetic capacity, such as the regeneration of RuBP and electron transport proteins. γ () denotes the unit cost of maintaining the plant hydraulic pathway, such as the construction cost to build xylem vessels and fibres. Both are conceptual parameters that are inferred rather than directly measured. It is assumed that plants have adapted to their living environment in such a way that they can modulate their stomatal conductance gs (and thus Δψ according to Eq. 1) and their electron-transport capacity Jmax independently to maximise their net profit F.
Using Eqs. (1)–(9), the variable Aj in Eq. (10) can be expressed as a function of Jmax and Δψ. As a result, finding the values of Jmax and Δψ that maximize F becomes a two-dimensional bound-constrained optimisation problem and can be solved using a two-dimensional root finding algorithm (Morales and Nocedal, 2011).
With Jmax and Δψ being determined, plant gross primary productivity (GPP, µmol CO2 m−2 s−1) and transpiration (Tr, µmol H2O m−2 s−1) can be calculated according to Eqs. (11) and (12):
where factor 1.6 accounts for the relative diffusivity of water vapor to that of CO2. Vcmax, Rd, and gs can also be derived according to Eqs. (4), (5), and (1), respectively, once Jmax and Δψ are determined.
2.1.2 Soil water balance module SpaFHy
The soil water balance in SPY-C describes the processes such as infiltration, drainage, and evapotranspiration (ET), the latter consisting of plant transpiration (Eq. 12) and soil evaporation. We adopted representations of rainfall interception, snow accumulation and melt, and a single-layer soil water balance from the SpaFHy (Spatial Forest Hydrology, Launiainen et al., 2019) model. The hydrological processes can be simulated at hourly resolution to enable close coupling with Phydro. The simulated volumetric soil water content is converted to soil water potential using the van Genuchten soil water retention function (Schaap and Van Genuchten, 2006) and passed to Phydro as an input variable (Fig. 1 and Eq. 13):
where ψsoil (kPa) is the soil water matric potential and αv, n, and m are empirical shape parameters. The parameter m is commonly expressed as m = 1 − . Se is the effective saturation as given by Eq. (14):
where θ is the volumetric soil water content (m3 m−3), θs is the saturated soil water content, and θr is the residual water content.
To be consistent, the soil hydraulic conductivity (Ksoil) affecting drainage is also derived using the van Genuchten model (Schaap and Van Genuchten, 2006), which can be written as:
Here, Ksat (m s−1) is the saturated hydraulic conductivity. When soil water potential is above field capacity, free drainage according to Ksoil can occur at the lower boundary of the soil in SpaFHy. There is no explicit estimation of root water potential. Root water conductance has also been lumped into whole-plant hydraulic conductance (Kp) in Phydro. Root water uptake from soil is merely the transpiration demand given by Phydro met from the total soil water storage simulated in SpaFHy (Fig. 1). The calculation of canopy interception evaporation and soil evaporation follow the SpaFHy formulations, using Penman–Monteith equation and soil-water availability restricted Priestley–Taylor approach, respectively (Launiainen et al., 2019). Total ET is the sum of canopy and soil evaporation given by SpaFHy and transpiration flux given by Phydro (Fig. 1).
2.1.3 Phenology and allocation module
The phenology and carbon allocation module (PA) directly allocates daily assimilated carbon () into above- (i.e., leaf) and below-ground (i.e., root) carbon pools according to specific allometric ratios, following the concept from Sierra et al. (2022) (Eqs. 16 and 17).
where denotes the daily accumulation of hourly GPP flux derived by Eq. (11), CFgpp : leaf and CFgpp : root (µmol m−2 d−1) are the carbon fluxes from to leaf and root, and aleaf and aroot are the respective proportions of allocated to leaf and root carbon storage at each daily time step. For cereal crops, grains can constitute a significant proportion of the aboveground biomass. The grain filling flux (CFgpp : grain) is thus considered and described following Eq. (18):
where agrain denotes the proportion of allocated to grain carbon pool at each daily time step. The details on how aleaf, aroot, and agrain are derived and constrained by observation can be found in Methods S1 in the Supplement.
The newly allocated carbon is then subject to autotrophic respiration (AR), consisting of growth (CFgr,leaf, CFgr,root, CFgr,grain) and maintenance respiration (CFmr,leaf, CFmr,root, CFmr,grain) of the plant organs. In addition, it is assumed that both leaf and root lose their carbon through turnover (CFleaf : litter, CFroot : litter), which produces litter carbon input to soil (Fig. 1). More detailed formulation of these fluxes can also be found in Methods S1.
The changes in carbon storage of leaf (ΔCSleaf), root (ΔCSroot), and grain (ΔCSgrain) at each time step are given by Eqs. (19), (20), (21), respectively:
Note that root carbon is tracked as a prognostic pool (Eq. 20) subject to allocation, respiration, and turnover, and it supplies litter to soil decomposition model Yasso. However, this root carbon does NOT dynamically change rooting depth or hydraulic traits: the root-zone depth (0.6 m) and Kp are fixed within a simulation, hence is decoupled from the plant hydraulic routine in the model.
In the current model version, phenology is prescribed rather than dynamically simulated: the seasonal canopy development is imposed through the daily LAI interpolated from Sentinel-2 product (see more details in Sect. 2.2.2), and reported management events such as harvest, grazing, fertilisation (see more details in Methods S2).
2.1.4 Soil decomposition module Yasso
We describe soil carbon balance dynamics and heterotrophic respiration (HR) using a daily timestep version of Yasso20 soil carbon model, which formulation has been described in previous studies (Viskari et al., 2022; Heimsch et al., 2024). In our modelling framework, the litter input (CFleaf : litter, CFroot : litter) to Yasso is provided by the PA module (Eqs. S8 and S9 in the Supplement) and the litter quality (i.e., carbon fractions) is prescribed depending on crop types following the study by Palosuo et al. (2015).
Combining the HR derived from Yasso with the autotrophic respiration flux (AR) calculated by the PA module (Eq. S7) sum up to the total ecosystem respiration (RECO):
Further, combining , the net ecosystem exchange (NEE) at a daily time step (Fig. 1) can be expressed as:
2.1.5 Coupling between model components
As shown in Fig. 1, SPY-C runs on two nested time steps. Phydro and SpaFHy are integrated hourly and two-way coupled: each hour, SpaFHy's soil moisture is converted to soil water potential before passing to Phydro; Phydro solves stomatal conductance and thus transpiration (Eq. 12); the transpiration is then sent to SpaFHy and is withdrawn from the soil water store together with soil evaporation, updating soil moisture for the next hour. The PA and Yasso modules run daily: hourly GPP from Phydro is accumulated to a daily total, allocated by PA to leaf, root, and grain pools (Eqs. 16–18), and the resulting litter drives Yasso, yielding RECO and NEE on daily scale (Eqs. 22–23). The hourly to daily link is GPP accumulation, while the daily to hourly link is the prescribed canopy state (i.e., LAI). Daily leaf area growth enters the hourly Phydro calculations through absorbed PAR (Eqs. 7–8) and is used to scale GPP and transpiration to the canopy level (Eqs. 11–12), modulating both carbon and water fluxes every hour. In the current version of SPY-C, daily LAI is an observation-driven boundary condition (Fig. 1), rather than a prognostic variable predicted in the PA module. Consequently, two-way coupling between PA and Phydro/SpaFHy is not yet fully implemented.
2.2 Model experiments
2.2.1 Study sites and observation data
Two agricultural fields on mineral (i.e., non-peat) soils in Southern Finland were used in this study (Fig. 2a). The sites were selected to represent two agronomically important and contrasting boreal cropping systems: a perennial forage grass mixture and an annual cereal crop. They differ in crop life form, soil texture, and management, and both are equipped with multi-year eddy covariance flux measurements that support model evaluation and inversion. The Qvidja site (60.29550° N, 22.39281° E; elevation 5 m) is on the southwestern coast of Finland, which has continuous eddy covariance (EC) flux measurements since May 2018 (Heimsch et al., 2021). During the study period, the footprint area of flux measurement was covered by a mixture of perennial grasses and legumes, dominated by timothy (Phleum pratense) and meadow fescue (Festuca pratensis). The soil is a relatively fine textured clay loam. The Hauho site (61.13977° N, 24.58401° E; elevation 89.5 m) has continuous EC measurements since June 2022 (Vira et al., 2025b). The footprint area of the flux measurement was primarily covered by oats (Avena sativa); in 2023, Italian ryegrass (Lolium multiflorum) was additionally sown as a cover crop during the growing season. Unlike Qvidja, Hauho has a coarser-textured silty loam soil. Together, these contrasting sites provide a useful test of the model across different crop types and growing conditions and allow us to examine whether field-scale hydraulic traits and water-use strategies differ between perennial and annual boreal cropping systems.
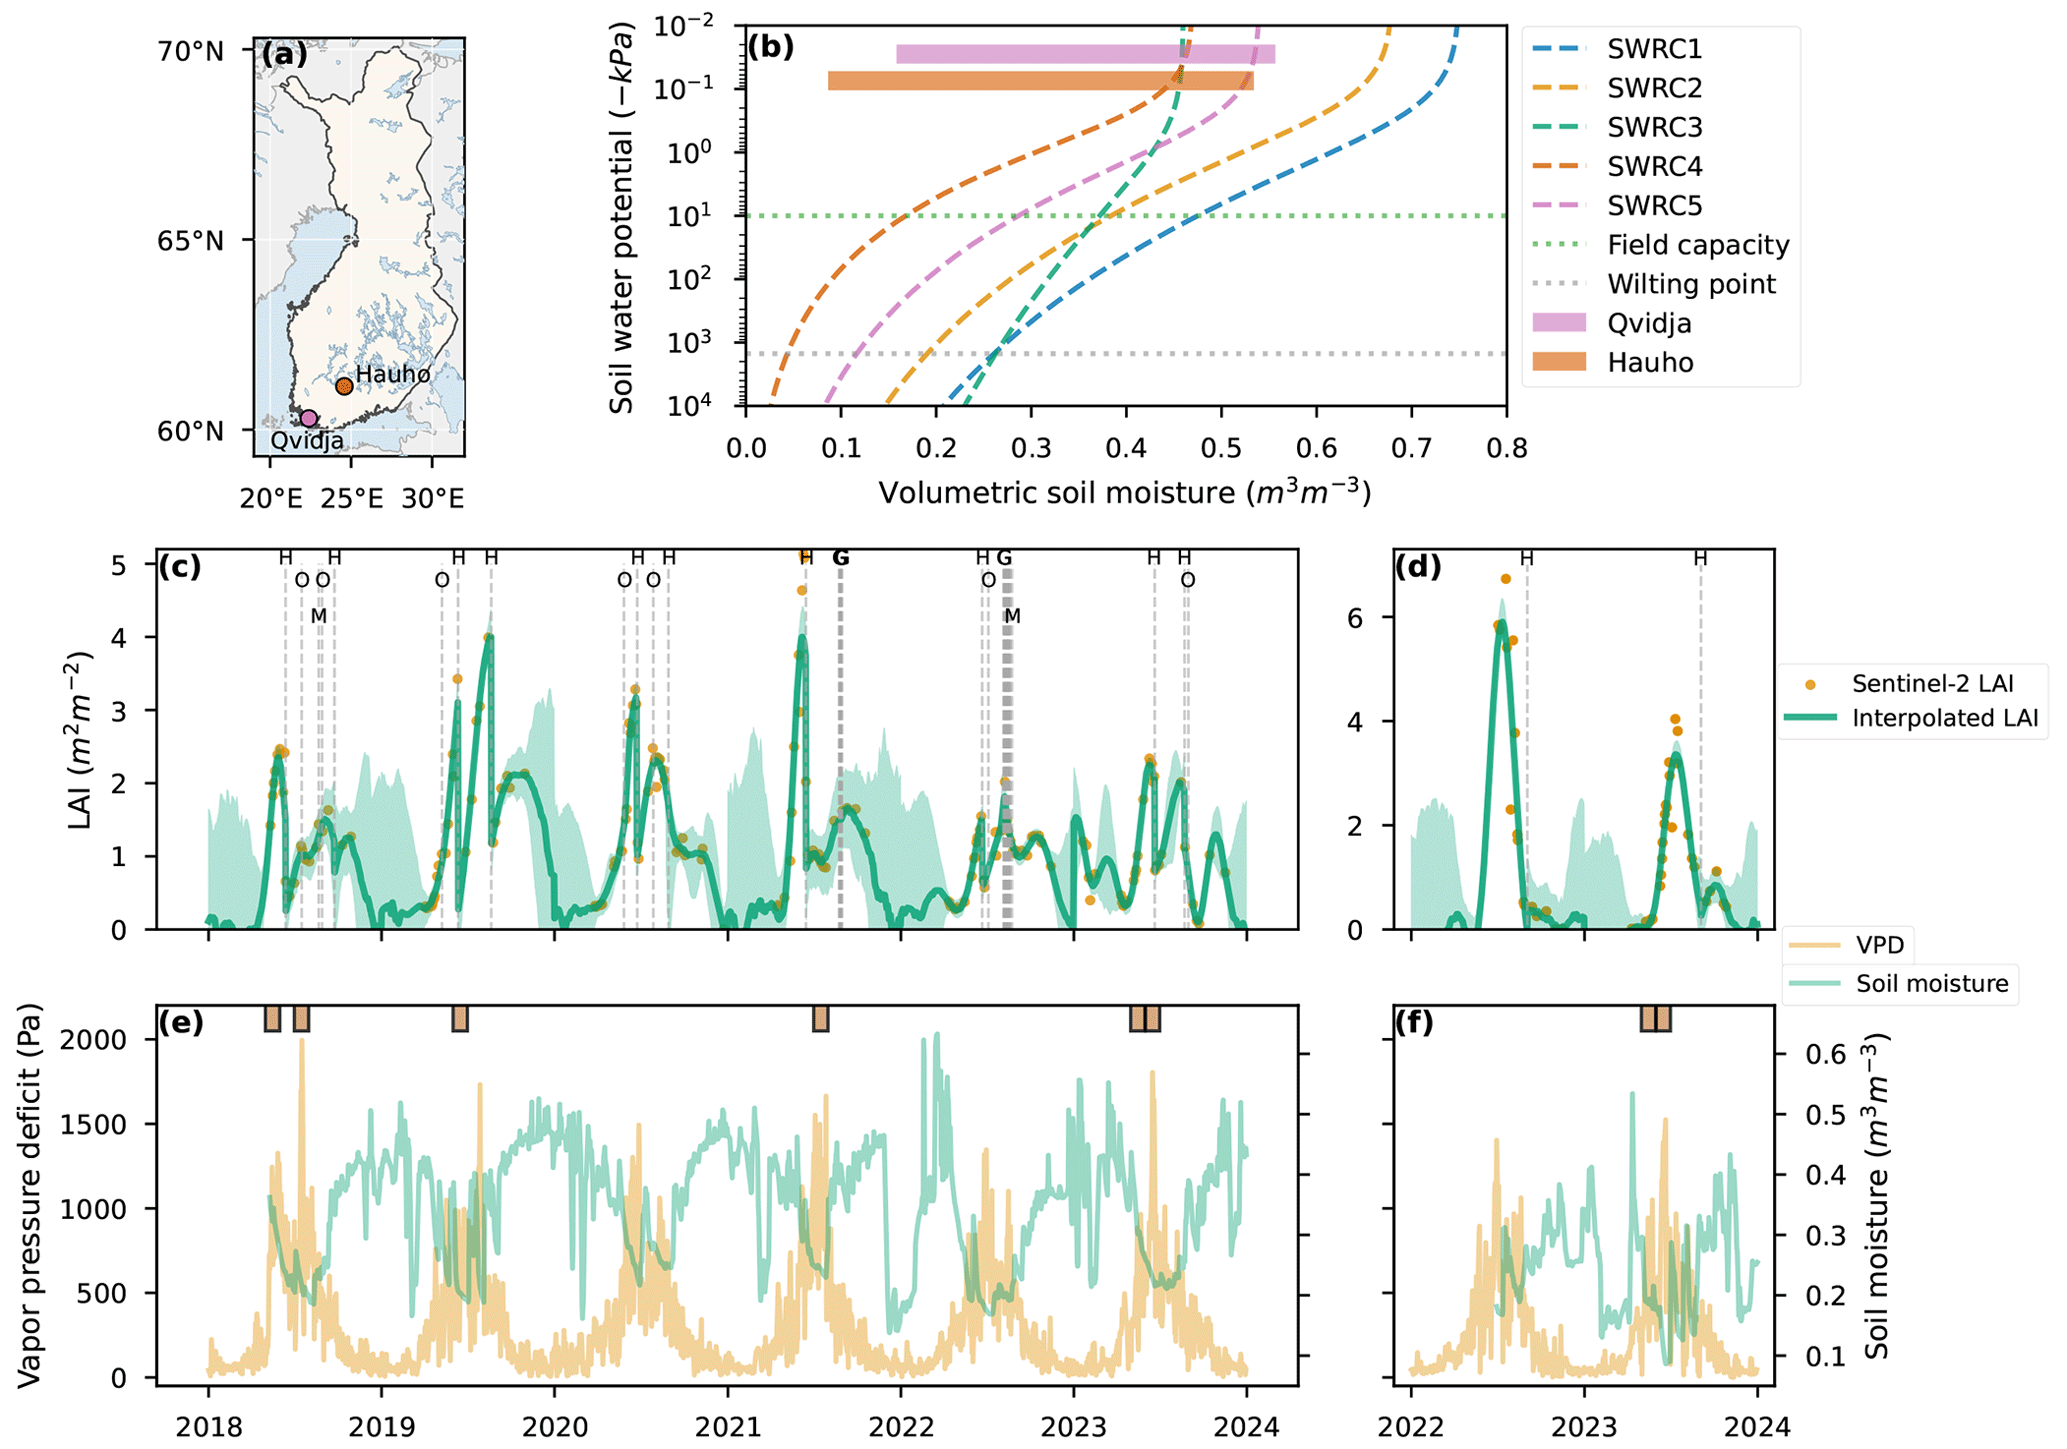
Figure 2(a) Locations of the study sites; (b) five representative soil water retention curves for Finnish forest soils (dashed lines) (Launiainen et al., 2022), together with the observed ranges of volumetric soil moisture at the study sites (colour bars); (c, d) Sentinel-2 leaf area index (LAI) observations (dots) and daily LAI interpolated using Gaussian process regression (line) (Vira et al., 2025b) for Qvidja and Hauho, respectively, and (e, f) daily vapor pressure deficit and soil moisture observed at Qvidja and Hauho, respectively. Management events included in the simulations are indicated in panels (c) and (d): H, Harvest; O, Organic fertilizer; G, Grazing; M, Mowing. Drought events identified using the Standardised Precipitation-Evapotranspiration Index (SPEI < −1.5) from the global SPEI database (https://spei.csic.es/database.html, last access: 15 May 2025) are denoted by brown bars in panels (e) and (f).
The EC instrumentation at both sites was the same, measuring mixing ratio (LI-7200, LI-COR Biosciences, USA), and three-dimensional wind at 10 Hz frequency (u-Sonic3 Scientific, METEK GmbH, Germany). Besides flux measurements, auxiliary meteorological measurements close to the EC tower were also performed, such as air temperature and relative humidity (Humicap HMP155, Vaisala Oyj, Finland), photosynthetically active radiation, soil temperature (5 or 10 cm below the surface; Pt100 IKES sensors, Nokeval Oy, Finland), and soil moisture (5 or 10 cm below the surface; ML3 ThetaProbe sensor, Delta-T Devices Ltd., UK). The half-hourly turbulent fluxes were calculated using the Eddypro software (v.7.0.9, LI-COR Biosciences, USA), following standard quality control and filtering protocols (Vira et al., 2025b). The gap-filling of the flux data was performed using the method developed by Vekuri et al. (2023). As environmental drivers for gap-filling, we used air and soil temperature, photosynthetically active radiation, soil moisture, and VPD at both sites, with LAI and precipitation additionally included for the Qvidja site. NEE was partitioned into GPP and RECO. RECO was assumed to follow an Arrhenius-type temperature response function (Lloyd and Taylor, 1994) and parameters were fitted following Reichstein et al. (2005). The parametrisation of the GPP was based on a non-linear radiation response function as in Gerin et al. (2023). For more detailed information about the sites and data, we refer to the aforementioned references, as well as the Field Observatory (https://fieldobservatory.org, last access: 9 November 2025), which is an open platform for real-time monitoring of crop fields in Finland (Nevalainen et al., 2022a).
2.2.2 Model initialization
All input data required to initialize SPY-C are summarised in Methods S2. Specifically, the meteorological forcing data for the two sites (e.g., T, Patm, PAR, and VPD) were obtained directly or derived from ERA5-Land reanalysis data (Muñoz-Sabater et al., 2021) using their geographical locations. ERA5-Land was used because it provides a gap-free and internally consistent set of all meteorological drivers required by SPY-C over the entire simulation period. Its use also facilitates the transferability of the modelling framework to sites and periods where complete in situ meteorological observations are unavailable, supporting its intended future applications. ERA5-Land showed good agreement with the on-site measurements for key meteorological variables at our study sites, such as air temperature, precipitation, and VPD (data not shown).
The annual LAI cycle was prescribed by interpolating the LAI extracted from Sentinel-2 remote sensing products to daily values (Fig. 2c) using a Gaussian process regression as described in Vira et al. (2025b). The retrieval of LAI was based on Sentinel-2 level-2A (bottom-of-atmosphere reflectance) products and follows the LAI algorithm (v1.1) developed by Weiss et al. (2020) for the European Space Agency's SNAP software (Science Toolbox Exploitation Platform) and implemented in the satellitetools Python package (https://doi.org/10.5281/zenodo.5993291, Nevalainen and Vira, 2022). The retrieval provides a total single-sided green LAI at 20 × 20 m, which was then aggregated over the EC flux footprint at each site to obtain the field-level total LAI that drives the model. This aggregation is consistent with the model's big-leaf canopy representation and with the spatial scale at which modelled fluxes were compared with EC observations. Gaussian process regression was used to interpolate satellite-derived LAI to a daily time step because it accommodates irregularly spaced observations while providing both smooth interpolation and an explicit estimate of prediction uncertainty. In the presence of data gaps, the interpolation gradually approaches the mean of the Gaussian process, which was set to zero. This approach was found to perform well under Finnish conditions (Vira et al., 2025b), since extended data gaps were almost exclusively during winter, when the fields were snow-covered and LAI was effectively zero. These gaps are reflected in the larger prediction uncertainty of the interpolated time series.
All model parameters used in SPY-C and their values for the two study fields are listed in Table S2 in the Supplement. Most parameters were kept at their default values and were identical between sites, except for the SpaFHy soil hydraulic parameters, which were adjusted to represent site-specific soil texture, and the Phydro plant hydraulic parameters, which were calibrated for each crop type (Sect. 2.2.3). The soil depth for root water uptake is set to 0.6 m, which was found to represent available root-zone water storage (Methods S3) and reproduce observed surface soil moisture dynamics at both sites (Fig. S1 in the Supplement). Parameters for the soil water retention function (Eq. 13) were selected by comparing observed volumetric soil moisture ranges with soil water retention curves (SWRCs) established for major Finnish soil types by Launiainen et al. (2022) (Fig. 2b). SWRC5 and SWRC4 best encompassed the observed soil moisture ranges at Qvidja and Hauho, respectively, and were therefore used in the baseline simulations. The lower wilting point of SWRC4 is consistent with the coarser soil texture at Hauho. SWRC3 was additionally tested at Qvidja because, at a given volumetric soil moisture, it produces lower soil water potentials and thus stronger water stress than SWRC5 (Fig. 2b), allowing crop responses to stronger soil water stress to be evaluated.
The model simulations started on 1 January 2018 for Qvidja and 1 January 2022 for Hauho, and both ended on 31 December 2023. As the simulations were initialized in winter, soil moisture was set to full saturation, consistent with observations at both sites (Fig. 2e, f). Soil organic carbon pools in SPY-C were initialized in two steps. First, the relative fractions of the four faster-cycling Yasso carbon pools were assumed to be at steady state under a fixed litter carbon composition according to Palosuo et al. (2015) and mean climatological conditions. The slowest-cycling pool (humus) was assigned a prescribed fraction of legacy carbon that does not equilibrate with contemporary litter inputs. Second, the relative carbon pool sizes were rescaled to match the observed total soil organic carbon stock in the 0–100 cm soil layer: 16.0 kg m−2 at Qvidja (measured range: 14.3–18.8 kg m−2) (Heimsch et al., 2021), and 12.0 kg m−2 at Hauho (measured range: 8.5–15 kg m−2) (Fig. S2). We tuned the legacy carbon fraction to match the observed RECO flux at both Qvidja and Hauho. The resulted values were 0.3 for Qvidja and 0.1 for Hauho. The lower legacy carbon fraction at Hauho is in line with its coarser soil texture and thus lower capacity to stabilize carbon through mineral protection (Haddix et al., 2020).
2.2.3 Parameter perturbation ensemble and sensitivity analysis
Although the studied fields (i.e., EC flux footprints) contained mixtures of crop species, these species were spatially well mixed and were therefore represented in the model as a single effectively homogeneous canopy. This treatment is consistent with the model's field-scale representation and allows the inference of apparent hydraulic traits, whereby one effective trait set is estimated for each footprint and study period. To infer these traits and assess their impacts on productivity and drought resistance at each field, we selected four tunable Phydro parameters for parameter perturbation ensemble (PPE) experiments. Three parameters, Kp, ψ50, and γ, characterize plant hydraulic properties or strategies, whereas α represents the photosynthetic cost associated with maintaining photosynthetic capacity.
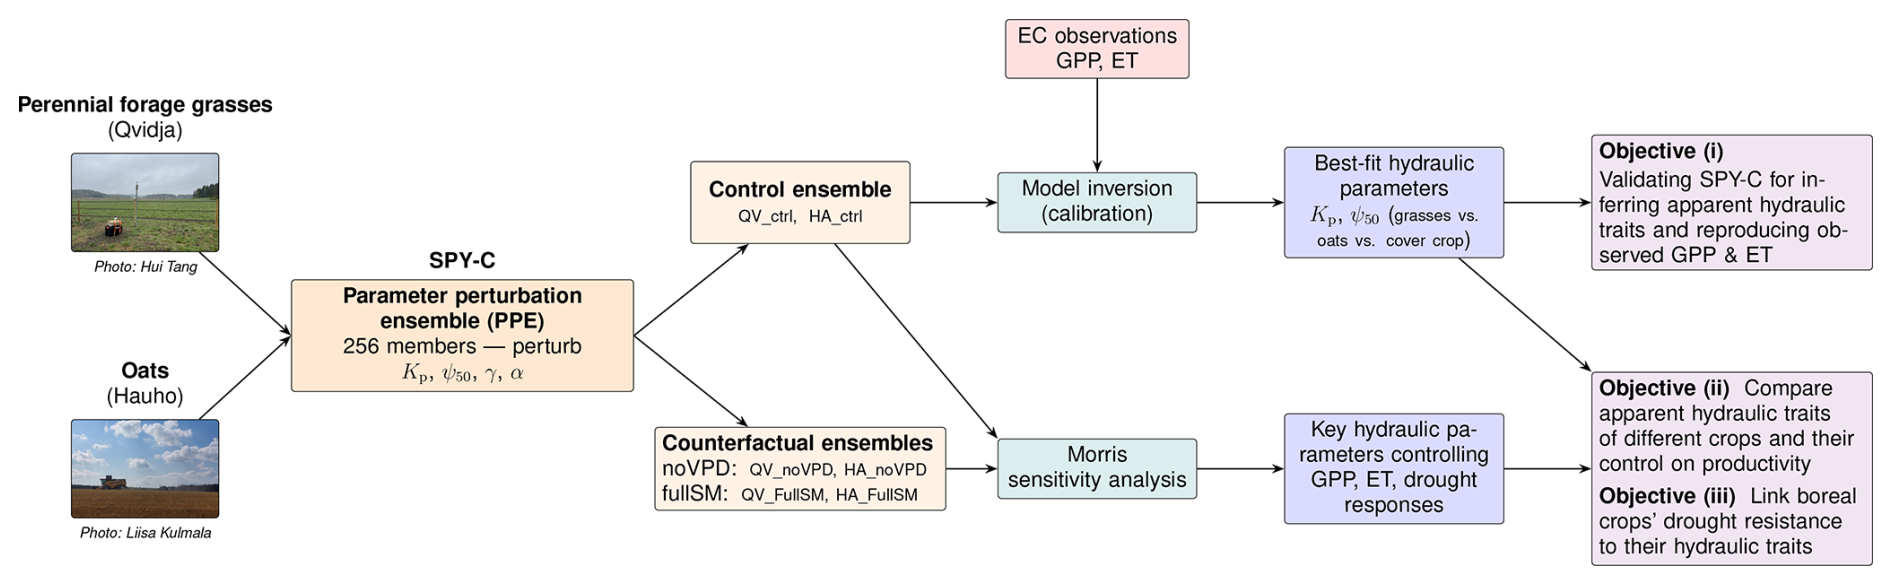
Figure 3Workflow for using the SPY-C parameter perturbation ensemble (PPE) experiments at two boreal crop sites to address the objectives of this study. QV = Qvidja; HA = Hauho; noVPD = No atmospheric drought; fullSM = Fully saturated soil.
For each PPE, four evenly spaced values were drawn from the prior range of each parameter and combined factorially, yielding 256 ensemble members. The prior ranges of each parameter were defined based on the literature. For the conceptual Phydro parameters α and γ, the ranges were directly from Joshi et al. (2022), who examined a broad set of plant species: [0.03,0.12] for α and [0.1,5] () for γ. For the hydraulic parameters Kp and ψ50, Joshi et al. (2022) reported ranges of m and MPa, respectively. Because relatively few herbaceous species were included in that study, we refined these priors using observational studies of herbaceous crops (Table S3). Accordingly, Kp was set to m and ψ50 to MPa. These ranges encompass values reported for crops, while remaining sufficiently broad to avoid overly constraining the parameter space.
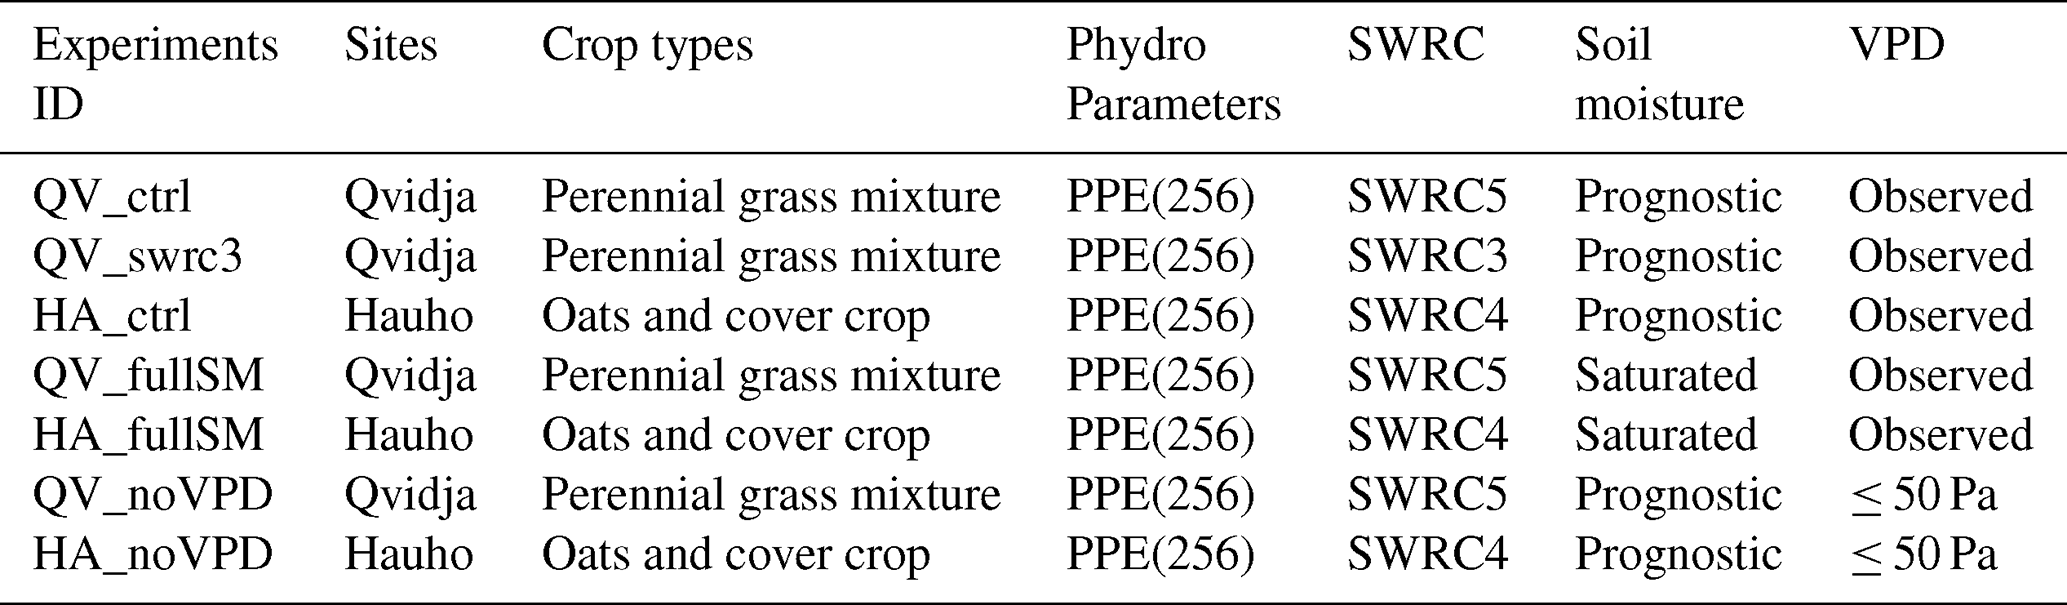
The main PPE experiments performed in this study and their purposes are summarised in Table 1 and Fig. 3, respectively. For Qvidja, a baseline PPE experiment using SWRC5 (QV_ctrl) and a sensitivity PPE experiment using SWRC3 (QV_swrc3) were conducted. Since both sites experienced drought events of varying severity during the study periods (Fig. 2e, f), two additional PPE experiments were conducted to better assess the impacts of drought on crop performance: one with soil moisture maintained at full saturation throughout the simulation period (QV_fullSM) and one with VPD constrained to very low values (≤ 50 Pa; QV_noVPD). The effects of soil (atmospheric) drought can then be deduced by the differences between QV_fullSM (QV_noVPD) and QV_ctrl. The PPE experiments for Hauho (HA_ctrl, HA_fullSM, HA_noVPD) followed the same design, except that SWRC4 was used in all PPEs (Table 1).
Table 1Summary of the settings for the major parameter perturbation ensemble (PPE) experiments performed and analyzed in this study.
The PPE experiments QV_ctrl and HA_ctrl were used for model inversion to infer the apparent hydraulic traits of the crops at each study site by identifying the ensemble members that best reproduced the observed daily GPP and ET fluxes (Fig. 3). Because plant photosynthesis and hydraulics are tightly coupled, we employed both GPP and ET fluxes to provide stronger constraints on the four perturbed Phydro parameters than either flux alone. Model performance for each PPE member was evaluated using the Pearson correlation coefficient (cor) and normalized mean square error (NMSE) (Eqs. 24 and 25). The five members that ranked highest in cor and lowest in NMSE jointly for GPP and ET were selected, and their corresponding Phydro parameter sets were interpreted as the best-fit apparent hydraulic traits of each crop. Details of the ranking procedure are provided in Methods S4. Both cor and NMSE were calculated using daily data to emphasize the model's ability to reproduce daily variability and subseasonal drought responses. Using monthly data yielded similar parameter rankings and is therefore not shown here.
where i is the time step and n the total number of time steps; Xobs,i and Xsim,i are the observed and simulated values at each time step, respectively; and μobs and μsim are their respective mean values over all time steps. Here, the periods used to calculate these metrics correspond to the model inversion periods for inferring apparent hydraulic traits and were therefore selected separately for each crop. Specifically, the inversion periods were January 2019–December 2022 for the perennial grass mixture at Qvidja and June 2022–December 2023 for oats at Hauho. For the cover crop at Hauho, the inversion period was September–October 2023, when it was actively growing and had become dominant in the field. At Qvidja, year 2018 and 2023 were excluded from the inversion period because sowing events in those years may have altered species composition. Instead, these years were used as independent tests of whether the inferred apparent hydraulic traits were transferable beyond the inversion period. Additional analyses using alternative inversion periods are described in Methods S4.
To detect the effects of crop hydraulic traits on crop performance and drought response, the Morris sensitivity analysis (Morris, 1991) was also conducted using the PPE experiments for both sites, including both the control and counterfactual PPEs (Fig. 3). The sensitivities of monthly GPP, ET, and water use efficiency (WUE) to the 4 Phydro parameters perturbed were quantified. Here, WUE was defined at both the plant level (pWUE, unit: µmol CO2 (mmol H2O)−1) as given by:
and the leaf level, often called intrinsic WUE (iWUE, unit: µmol CO2 (mol H2O)−1) as given by:
The Morris method is an efficient global sensitivity analysis technique for parameter screening (Campolongo et al., 2007), especially when the sampling size is limited (Gan et al., 2014). It is conceptually similar to the commonly used one-at-a-time sensitivity analysis, yet also considers the interactions among parameters. The overall effect and interaction effect of each parameter are approximated by the mean (μ) and standard deviation (σ) of the elementary effects of each parameter sampled. In addition, the mean of the absolute effects (μ*) is also used to provide a more robust measure of overall parameter importance when elementary effects have opposite signs (Campolongo et al., 2007). The analysis was performed using the Python package SALib version 1.4.8 (Herman and Usher, 2017).
3.1 Apparent hydraulic traits at Qvidja and Hauho
We identified five Phydro parameter sets that best reproduced daily GPP and ET at both sites. The results are shown in Table 2. For the perennial grass mixture at Qvidja and oats at Hauho, these best-fit parameter sets, interpreted as apparent field-scale hydraulic traits, were consistently characterized by low Kp and high γ, indicating relatively low hydraulic efficiency and a conservative water-use strategy. A low α (i.e., the cost of maintain photosynthetic capacity) was also required to reproduce the observed fluxes for both crops, implying relatively high photosynthetic capacity (Fig. S3). Compared to the perennial grass mixture, oats showed slightly lower best-fit α and γ values (Table 2), pointing to higher photosynthetic capacity and a slightly more acquisitive hydraulic strategy. The cover crop at Hauho exhibited higher inferred Kp, indicating greater hydraulic efficiency than oats or the perennial grass mixture. In contrast, no clear preference for ψ50, a commonly used indicator of hydraulic safety, emerged across the studied crops, whereas the other three Phydro parameters were more strongly constrained.
Table 2Summary of the prior ranges of the Phydro parameters used in the parameter perturbation ensemble (PPE) experiments, and the five best-fit PPE members for the forage grass mixture at Qvidja (based on QV_ctrl) and for oats (cash crop) and Italian ryegrass (cover crop) at Hauho (based on HA_ctrl). These parameter sets reflect effective field-scale hydraulic traits (i.e., apparent hydraulic traits) of the dominant crop community within each EC footprint and model-inversion period. Kp: maximum whole-plant conductance per unit leaf area (10−16 m). ψ50: water potential at which 50 % of plant hydraulic conductivity (MPa) is lost. α: unit cost of maintaining photosynthetic capacity. γ: the unit cost of maintaining plant hydraulic pathways. corgpp and coret: correlation coefficients between model and observation for GPP and ET, respectively (Eq. 24). nmsegpp and nmseet: normalized mean square error between modelled and observed GPP and ET, respectively (Eq. 25).
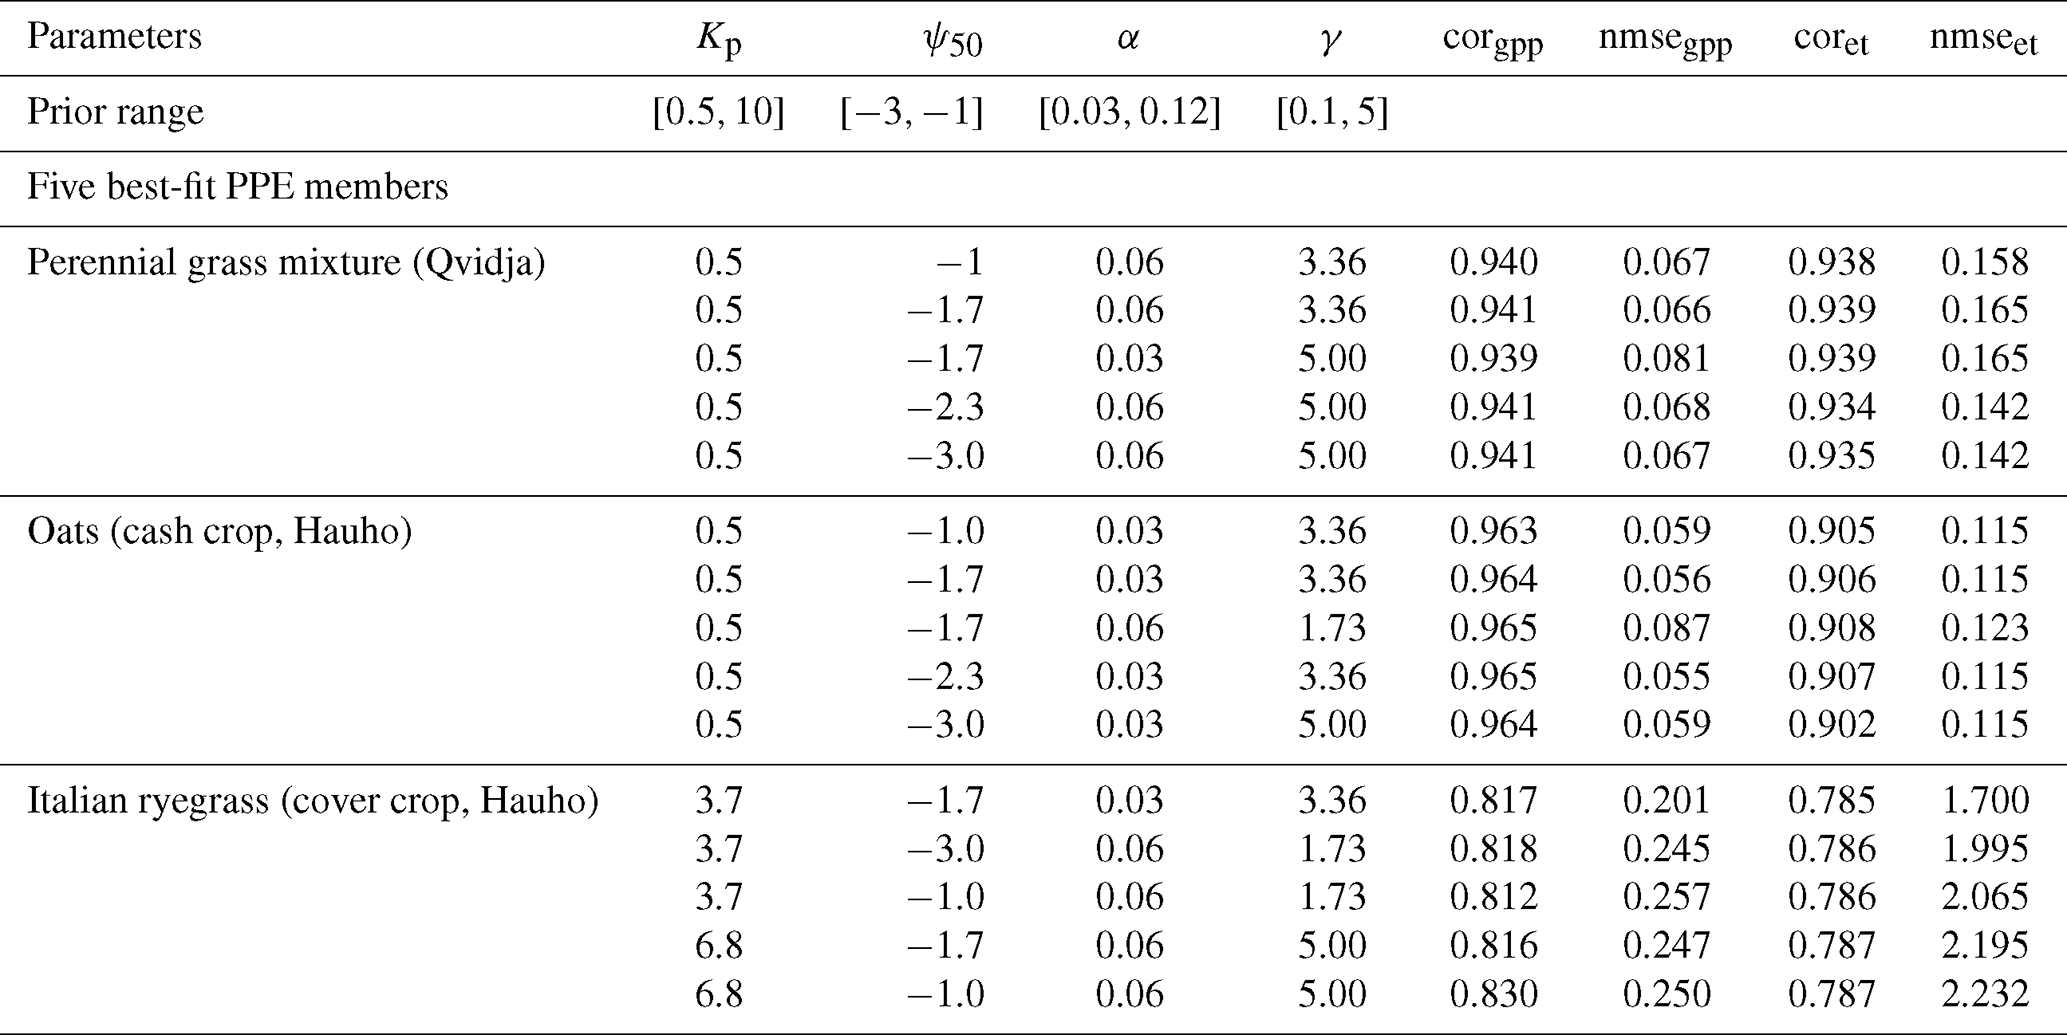
Figure 4a–h shows how the five best-fit PPE members selected for the perennial grass mixture and oats performed in simulating daily GPP and ET at the study sites. Overall, the simulated GPP and ET matched the observed fluxes very well, with cor ≈ 0.94 and NMSE ≤ 0.14 for the Qvidja site, and cor ≥ 0.91, NMSE ≤ 0.11 for the Hauho site. Only a slight overestimation of daily ET was observed at Qvidja (Fig. 4c, d), and a mismatch in ET occurred at Hauho in early spring of 2023 when the model failed to capture the observed high ET (Fig. 4g), largely due to a bias in the timing of snowmelt onset in the meteorological forcing data (Fig. S7). The observed diurnal cycles of GPP and ET in summer were also well captured by the best-fit PPE members (Fig. 5), except for a slight underestimation (overestimation) of GPP (ET) in the early morning and late afternoon, probably resulting from a different light absorption rate from what was assumed in the model (see Eq. 8) under low sun angles.
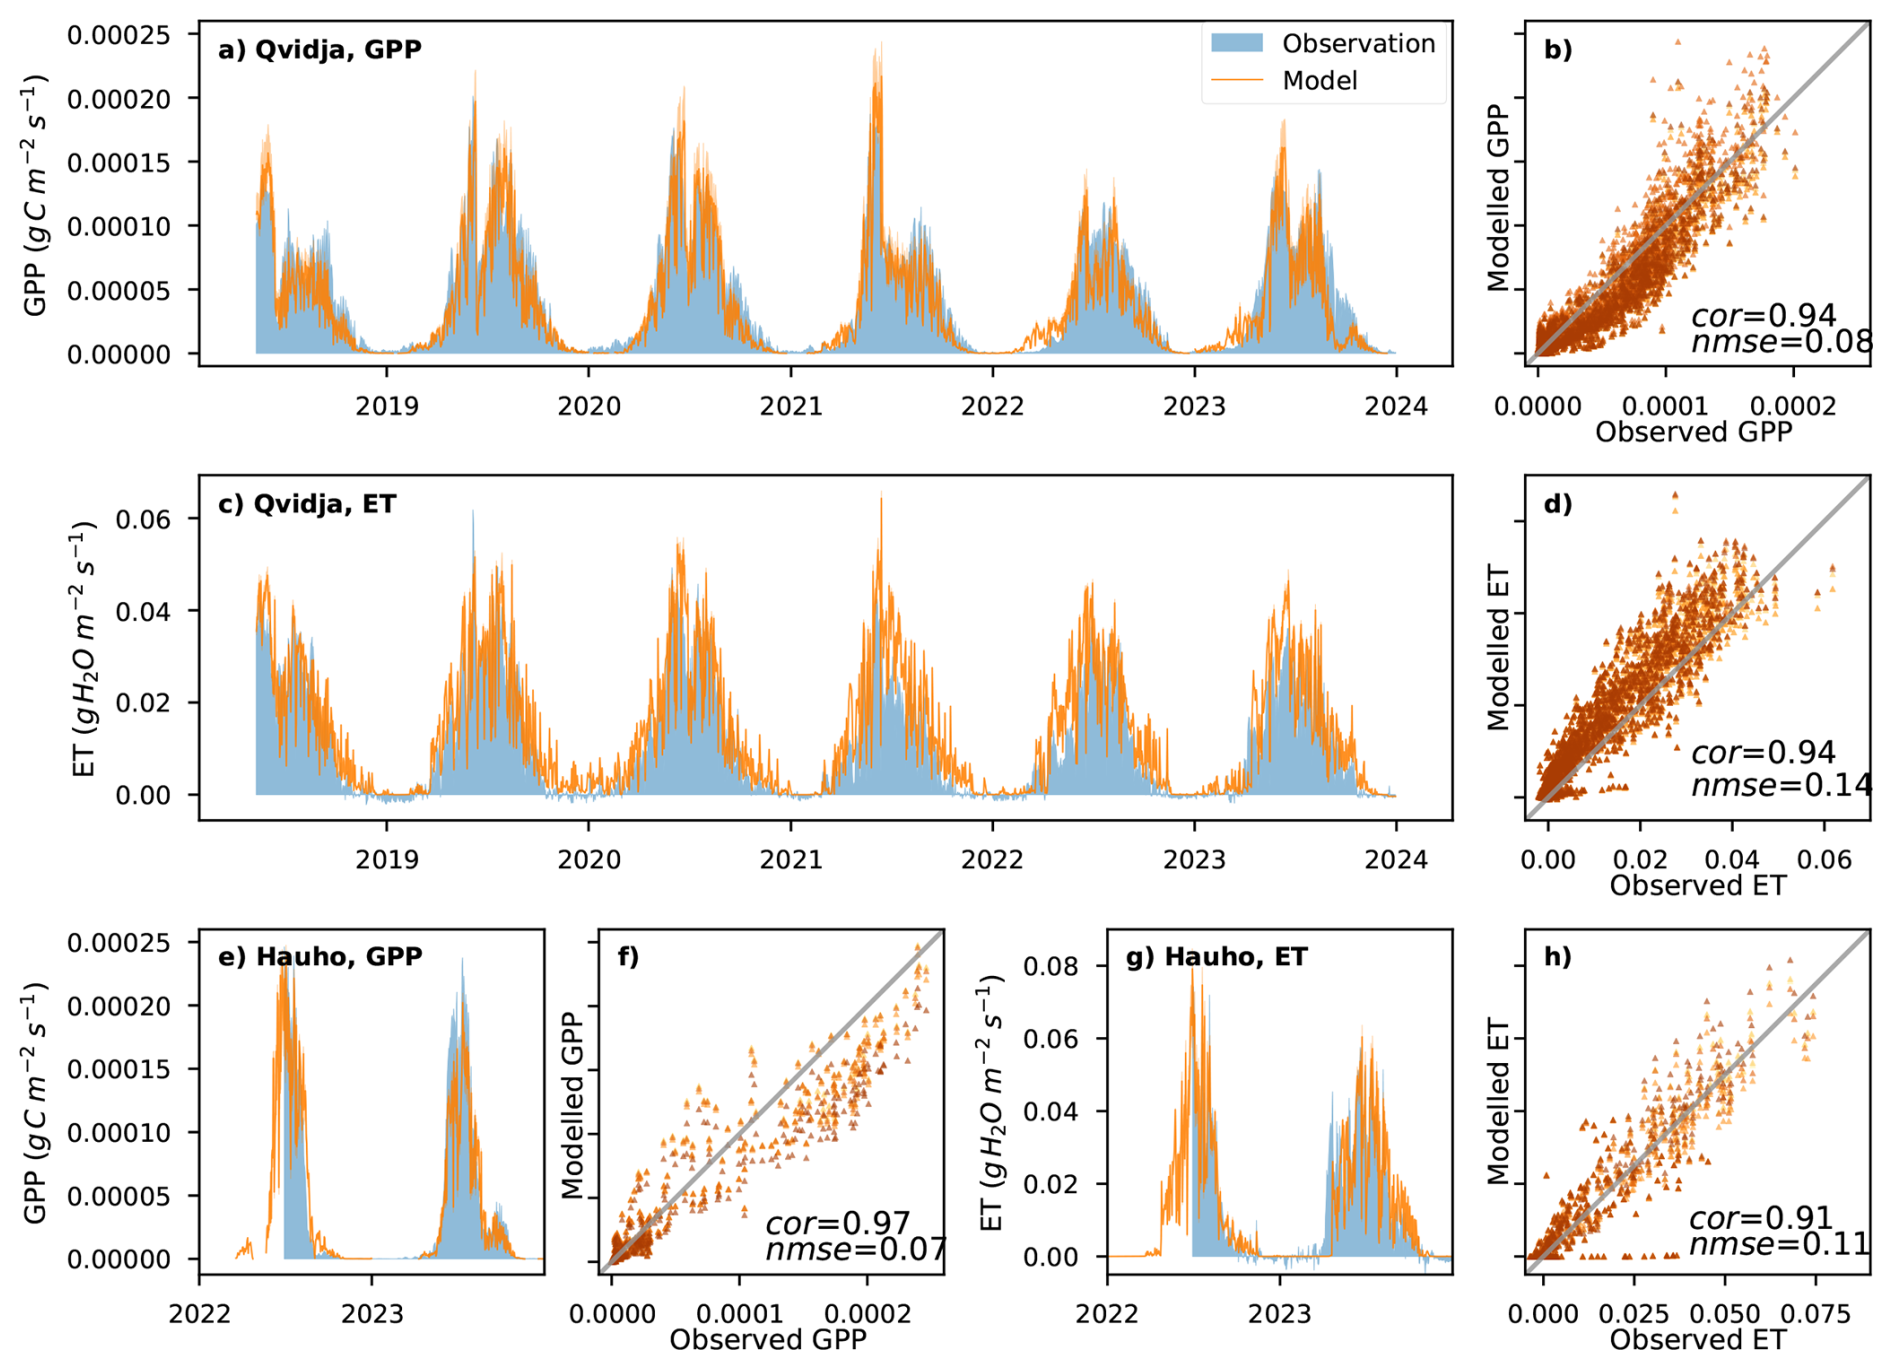
Figure 4(a–d) Daily mean gross primary production (GPP) and evapotranspiration (ET) modelled by the five best-fit PPE members from QV_ctrl and HA_ctrl (see Table 2) and their comparison with observation at Qvidja (a–d) and Hauho (e–h), respectively. The modelling results based on the five best-fit PPE members of QV_swrc3 can be found in Fig. S4.
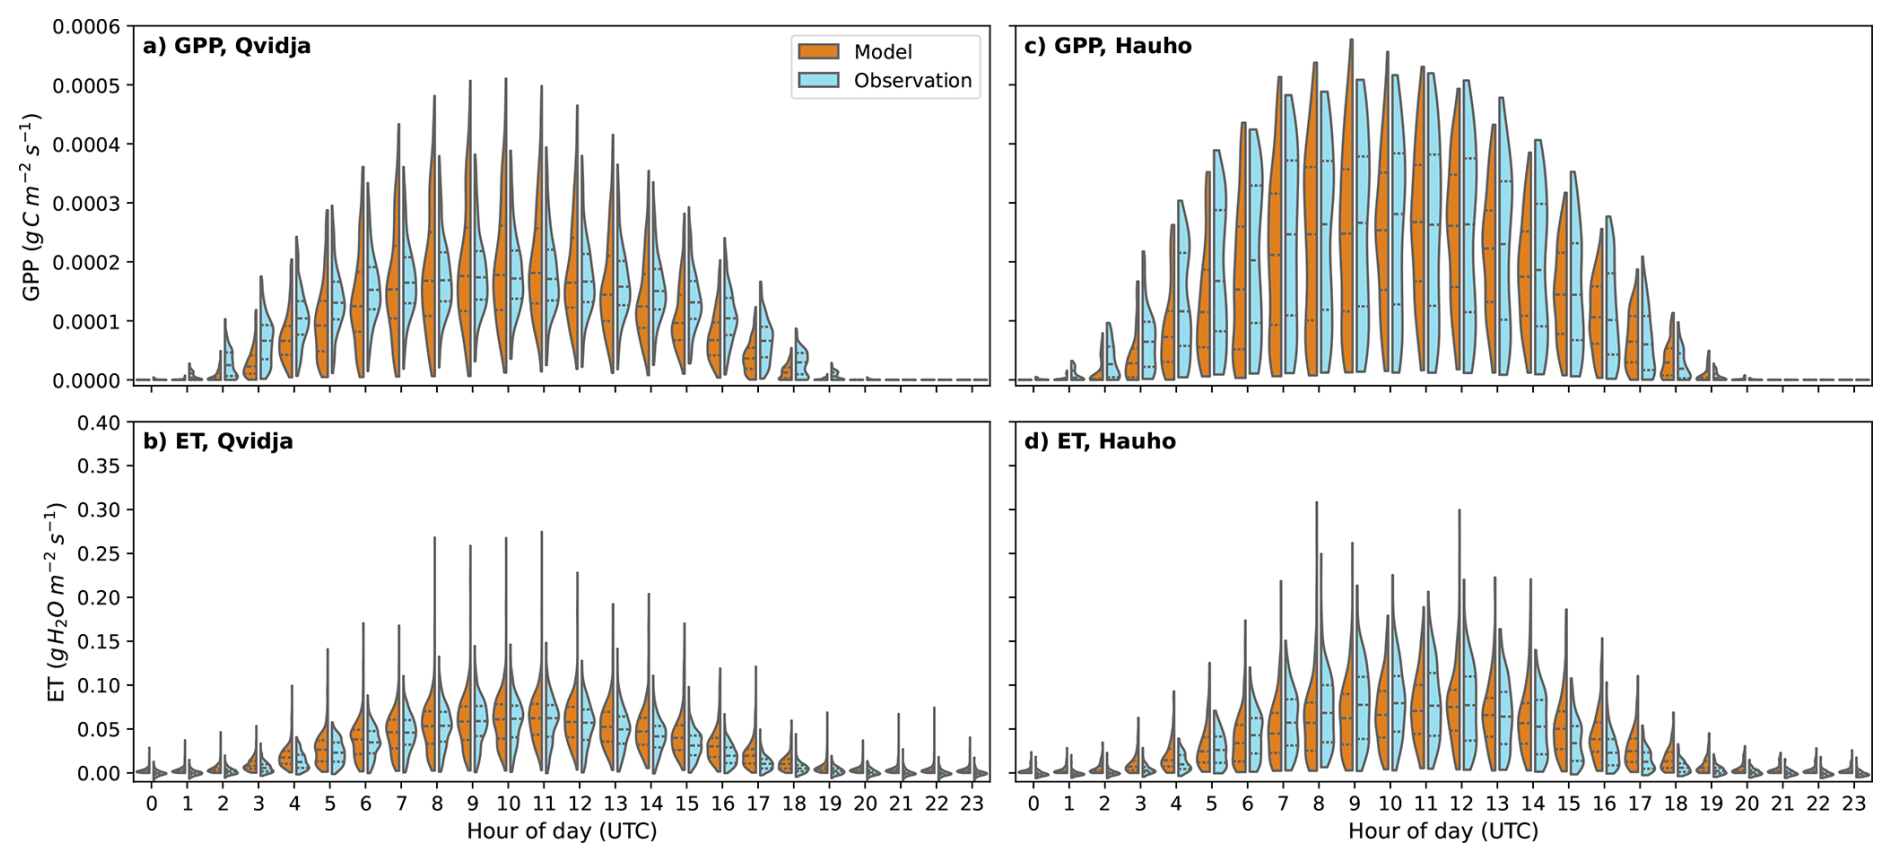
Figure 5Diurnal cycle of gross primary productivity (GPP) and evapotranspiration (ET) fluxes in summer (June, July and August) modelled by the average of the five best-fit PPE members from QV_ctrl and HA_ctrl and their comparison with observations at Qvidja (a, b) and Hauho (c, d), respectively. The violin denotes the distribution of hourly values across all summer days, and the horizontal lines within the violins indicate the 25th, 50th (median), and 75th percentiles.
We further examined the results of the five best-fit PPE members in the context of the full PPE experiments spanning a wide hydraulic and photosynthetic trait space (Fig. 6). For GPP, the best-fit PPE members generally fell in the upper range of the full PPE (Fig. 6a, b), except in May at Qvidja, when they shifted towards the lower end of the spread. But for ET, the best-fit PPE members tended to lie in the lower range (Fig. 6c, d), except during dry summer months, such as June 2018, 2019, and 2023 and July 2021 at Qvidja and July–August 2022 at Hauho. Consequently, their monthly mean pWUE and iWUE were close to the upper limit of the PPE, except in those same drought periods (Fig. 6e–h). Notably, the soil moisture simulated by the best-fit PPE members consistently lies in the upper range of the PPE (Fig. 6i–j), far above the wilting point.
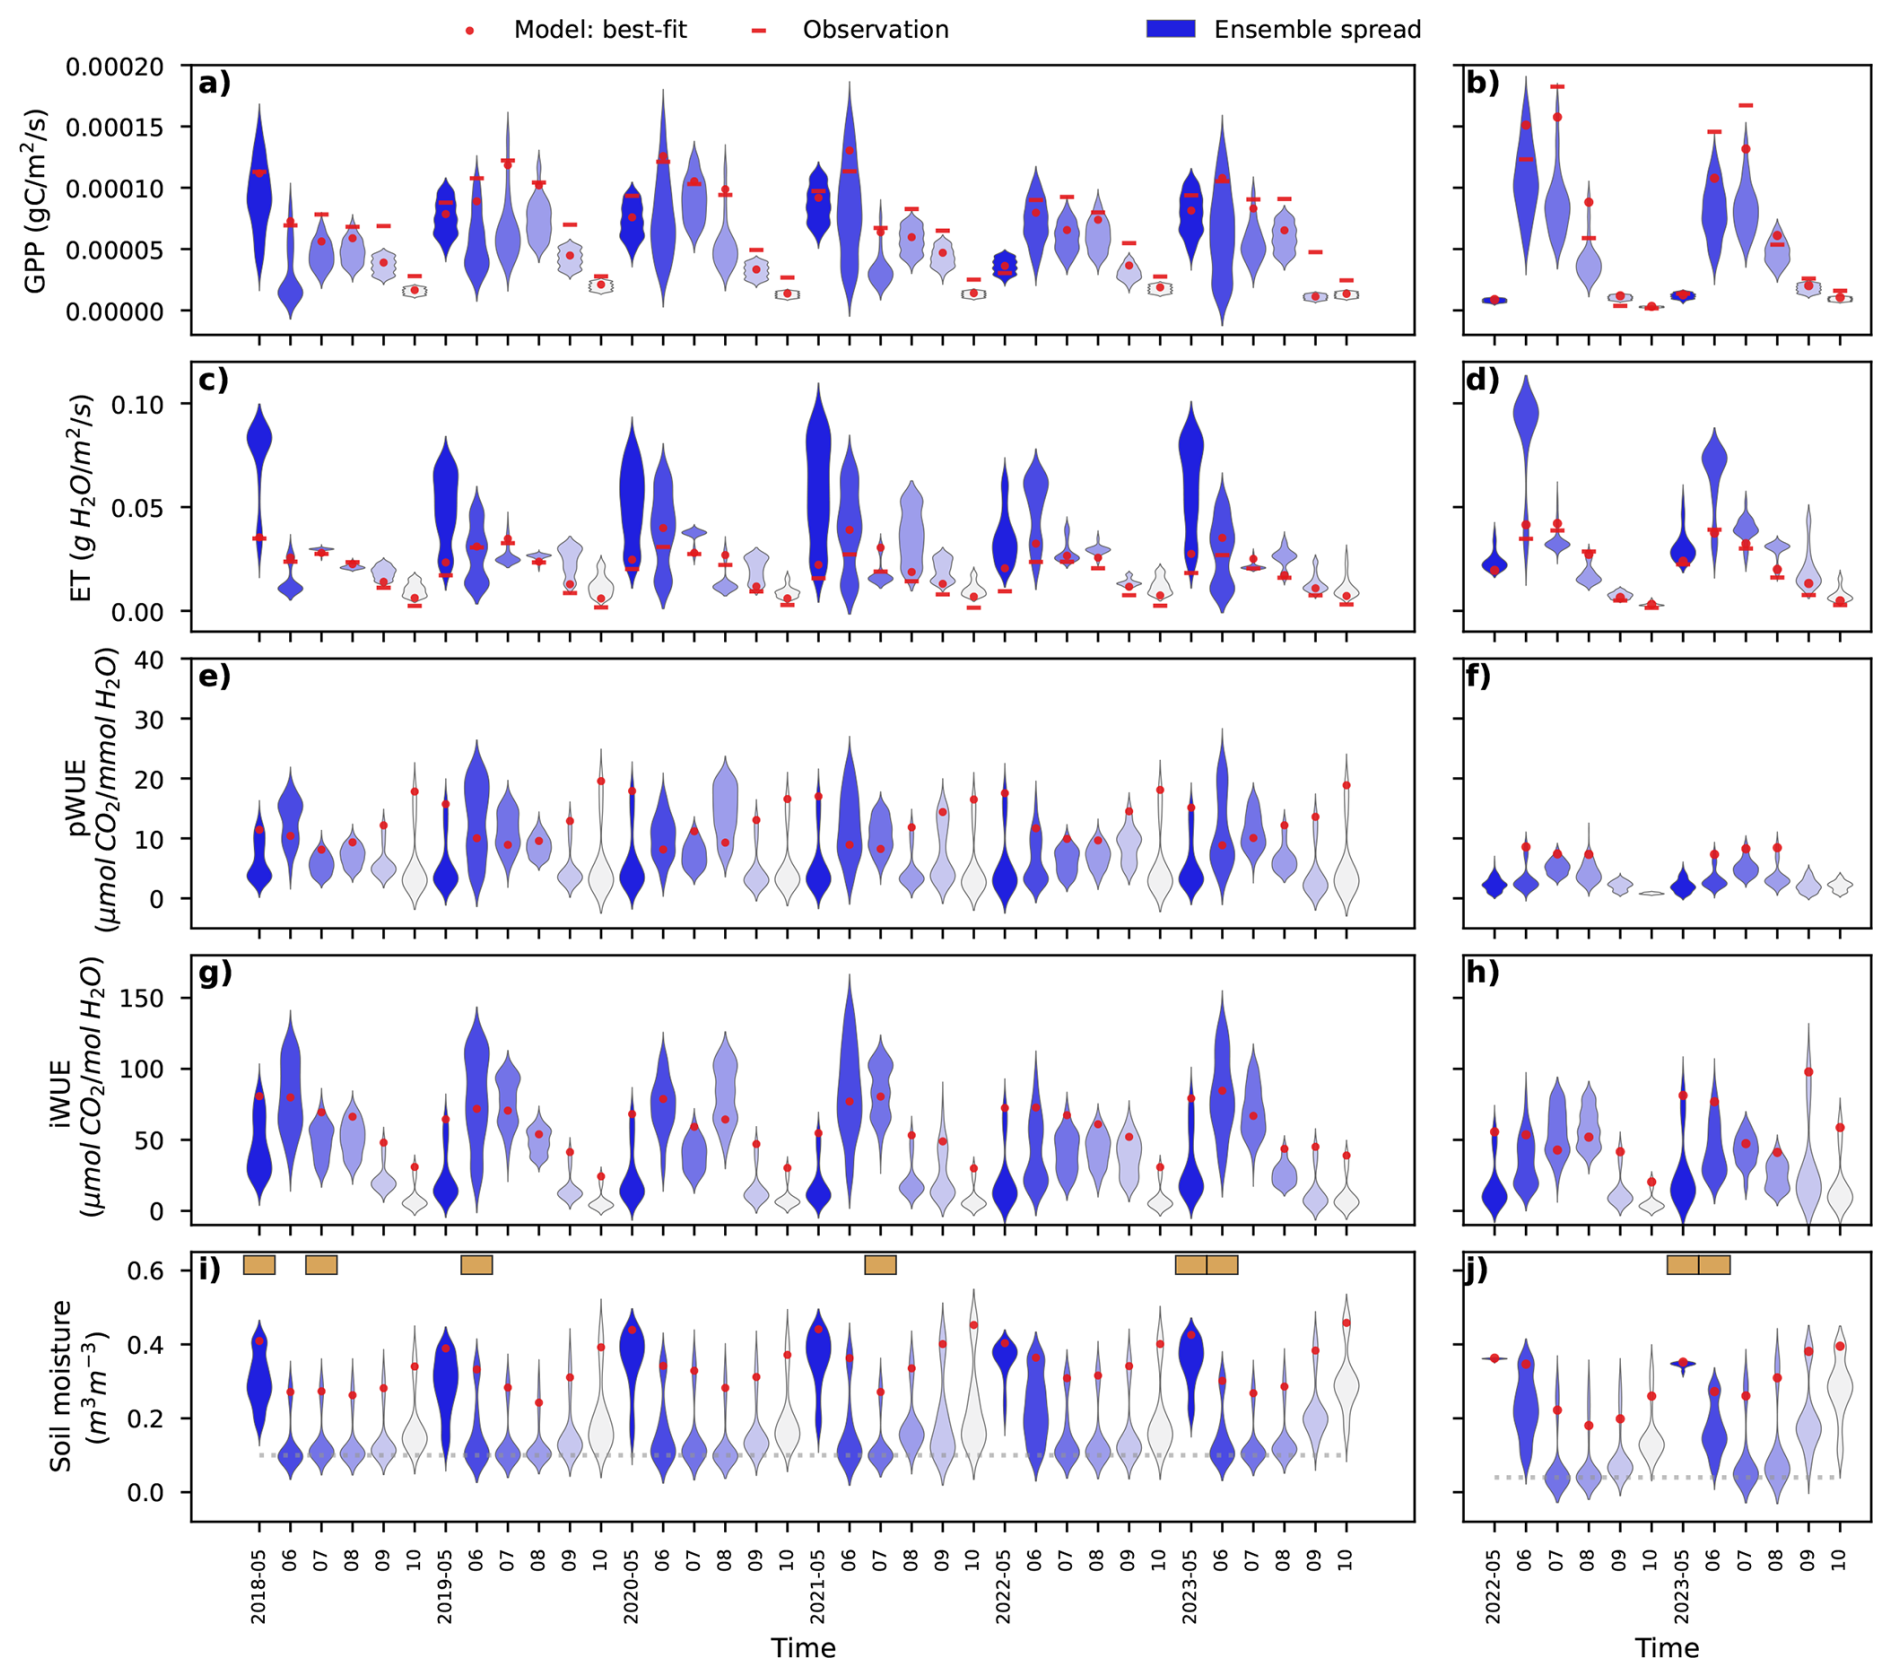
Figure 6Violin plots showing the spread of monthly mean gross primary production (GPP), evapotranspiration (ET), water use efficiency (pWUE and iWUE), and bulk root-zone soil moisture in the PPE for Qvidja (QV_ctrl) (a, c, e, g, i) and Hauho (HA_ctrl) (b, d, f, h, j). The width of each violin denotes the probability density of the ensemble members yielding a given values. The red circles represent the mean of the five best-fit PPE members. The red bars in panels (a)–(d) denote the observations. The brown boxes in panels (i) and (j) denote drought events defined by a Standardised Precipitation-Evapotranspiration Index (SPEI) below −1.5. The dotted lines in panels (i) and (j) denote the wilting point (i.e., the soil moisture at a matric potential of −1.5 MPa). Results from the additional Qvidja PPE experiment, QV_swrc3, can be found in Fig. S5.
3.2 Sensitivity of crop performance to hydraulic traits
The Morris sensitivity analysis of GPP, ET, pWUE, and iWUE to the four Phydro parameters in QV_ctrl and HA_ctrl is shown in Fig. 7a–h. The sensitivities are context-dependent and vary seasonally, but show broadly similar patterns at the two study sites. GPP is dominated by a negative sensitivity to α (the cost of maintaining photosynthetic capacity) throughout the growing season, except in June–July, when Kp and γ exert strong negative and positive effects, respectively, suggesting that lower hydraulic efficiency may promote crop productivity during these months. ET, pWUE, and iWUE exhibit more pronounced sensitivities to the hydraulic parameters. In particular, Kp (γ) negatively (positively) influences pWUE and iWUE in May, September, and October, while the effects often reverse in summer, suggesting a positive effect of hydraulic efficiency on pWUE and iWUE during peak growth, opposite to its effect on GPP.
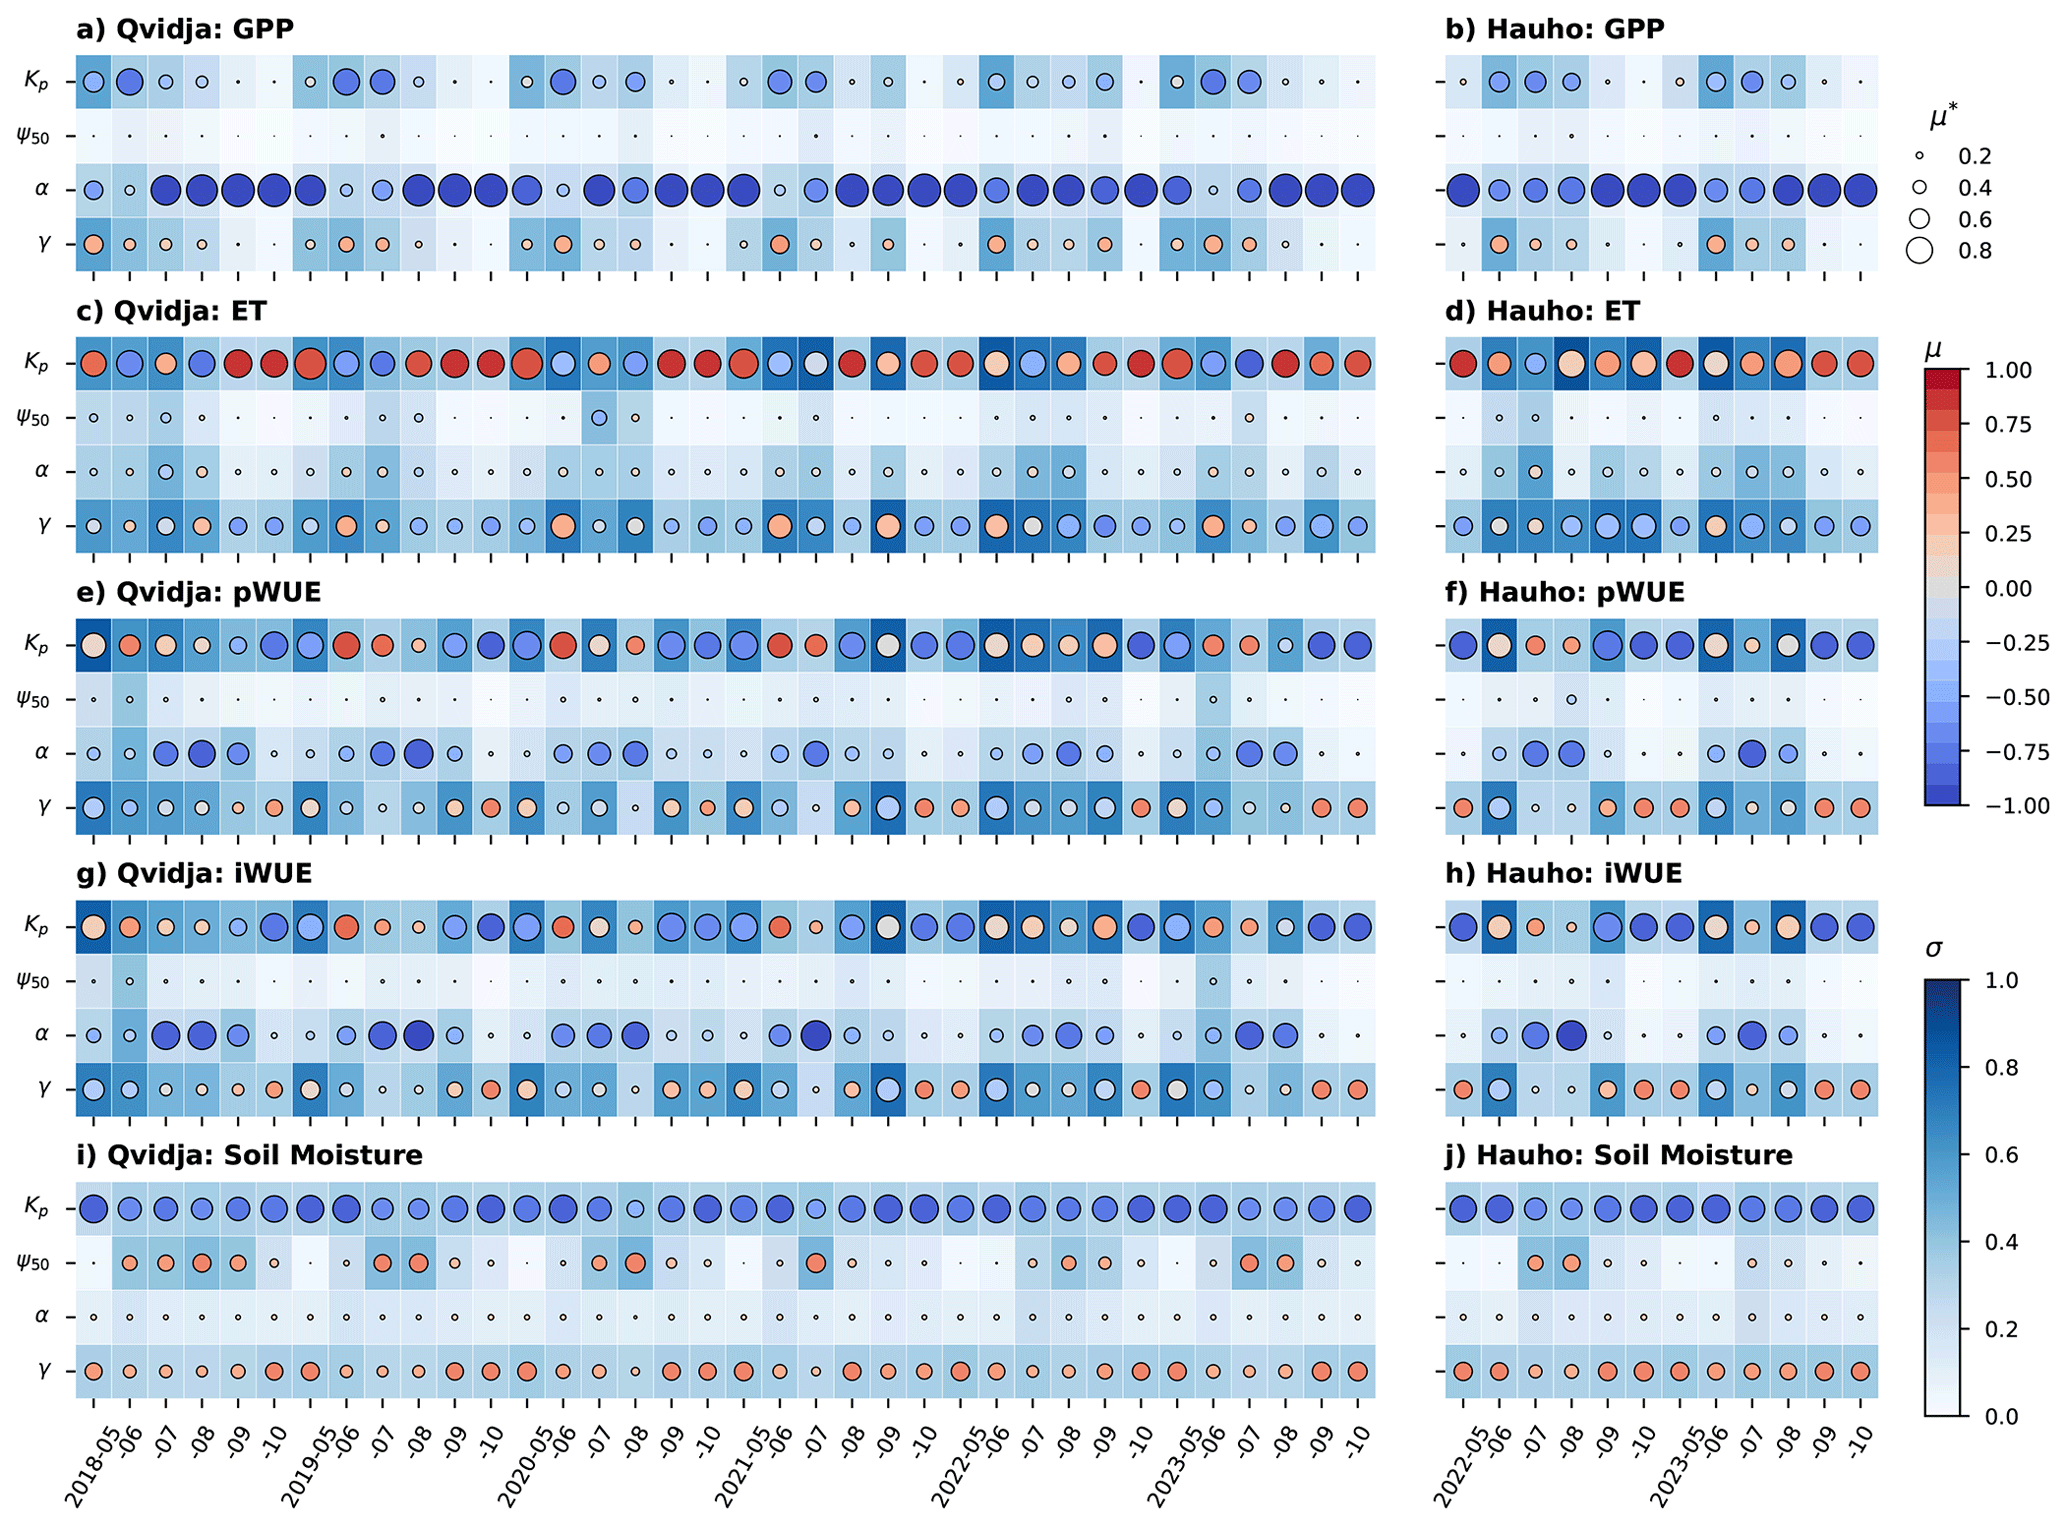
Figure 7Morris sensitivity analysis of monthly mean gross primary production (GPP) (a, b), evapotranspiration (ET) (c, d), plant-level water use efficiency (pWUE) (e, f), intrinsic water use efficiency (iWUE) (g, h) and bulk root-zone soil moisture (i, j) to Phydro parameters (Kp, ψ50, α, and γ) in the PPE experiments for Qvidja (QV_ctrl) and Hauho (HA_ctrl) during the growing season (May–October). The mean of the absolute elementary effects (μ*) is denoted by the size of the circles. The mean of the elementary effects (μ) is denoted by the colour shading of the circles. The standard deviation of the elementary effects (σ) is denoted by the colour shading of the rectangles. Results from the additional Qvidja PPE experiment, QV_swrc3, are shown in Fig. S6.
We note that while the effects of α are relatively independent of the other parameters (low σ), the effects of Kp and γ are more dependent on parameter interactions (high σ). We observe little influence of ψ50 on GPP, ET, and WUE at either study sites, but a noticeable positive effect on soil moisture in summer (Fig. 7i, j). A consistently negative (positive) effect of Kp (γ) on soil moisture (Fig. 7i, j) suggests that lower crop hydraulic efficiency may reduce crop water extraction and thereby conserve soil water.
3.3 Response to soil and atmospheric drought
As illustrated in Fig. 8, the removal of soil drought and VPD increases GPP during the summer months in most PPE members (Fig. 8a–d) with the magnitude of the increase positively related to Kp. In contrast, transpiration responds differently to the absence of soil and atmospheric droughts (Fig. 8e–h): removing soil drought produces a consistently positive change, whereas reducing atmospheric drought induces a large spread with both positive and negative responses. Changes in transpiration are again most sensitive to Kp with positive effects mainly in summer.

Figure 8Modelled response of monthly mean gross primary production (GPP) and transpiration to the removal of soil drought (FullSM-CTRL) (a, b, e, f) and atmospheric drought (NoVPD-CTRL) (c, d, g, h) at Qvidja (a, c, e, g) and Hauho (b, d, f, h). FullSM: QV_fullSM and HA_fullSM; NoVPD: QV_noVPD and HA_noVPD; CTRL: QV_ctrl and HA_ctrl. The upper panel of each subplot shows the spread of the PPE members (violins), and the mean of the five best-fit PPE members (red dots). The lower panel of each subplot shows the Morris sensitivity of the simulated responses to the Phydro parameters (Kp, ψ50, α, and γ).
The five best-fit PPE members display little change in GPP and transpiration when soil drought is removed (Fig. 8a, b, e, f), indicating that crop photosynthesis and transpiration may have not suffered from soil drought, even though drought events were widely observed at the study sites (Fig. 2e, f). In contrast, a discernible rise in GPP and a reduction in transpiration during summer is shown in these best-fit PPE members when atmospheric drought is removed (Fig. 8c, d, g, h), suggesting that VPD may have exerted a more prevalent effect on crop performance than soil drought at the study sites.
The effect of VPD is further manifested in Fig. 9, where the five best-fit PPE members from QV_ctrl, HA_ctrl and QV_swrc3 display a clear impact of VPD on photosynthetic assimilation rate, pWUE, and iWUE (Fig. 9b, n, p) at the daily time scale. This can be associated with its strong regulation of stomatal conductance (Fig. 9d) and particularly the soil-to-leaf water potential difference (Fig. 9l), which further impact leaf internal-to-external CO2 ratio (χ) (Fig. 9h) and thus carboxylation and electron-transport capacity (Fig. 9f, j). The modelled effect of VPD appears to be strongly nonlinear: while the impact on hydraulic behaviours, such as stomatal conductance, pWUE, and iWUE, mainly occurs during the initial increase in VPD (VPD ≤ 0.8 kPa) (Fig. 9d, h, i, n, p), the downregulation of photosynthetic activity emerges primarily at higher VPD (VPD ≥ 0.8 kPa) (Fig. 9b, f, j).
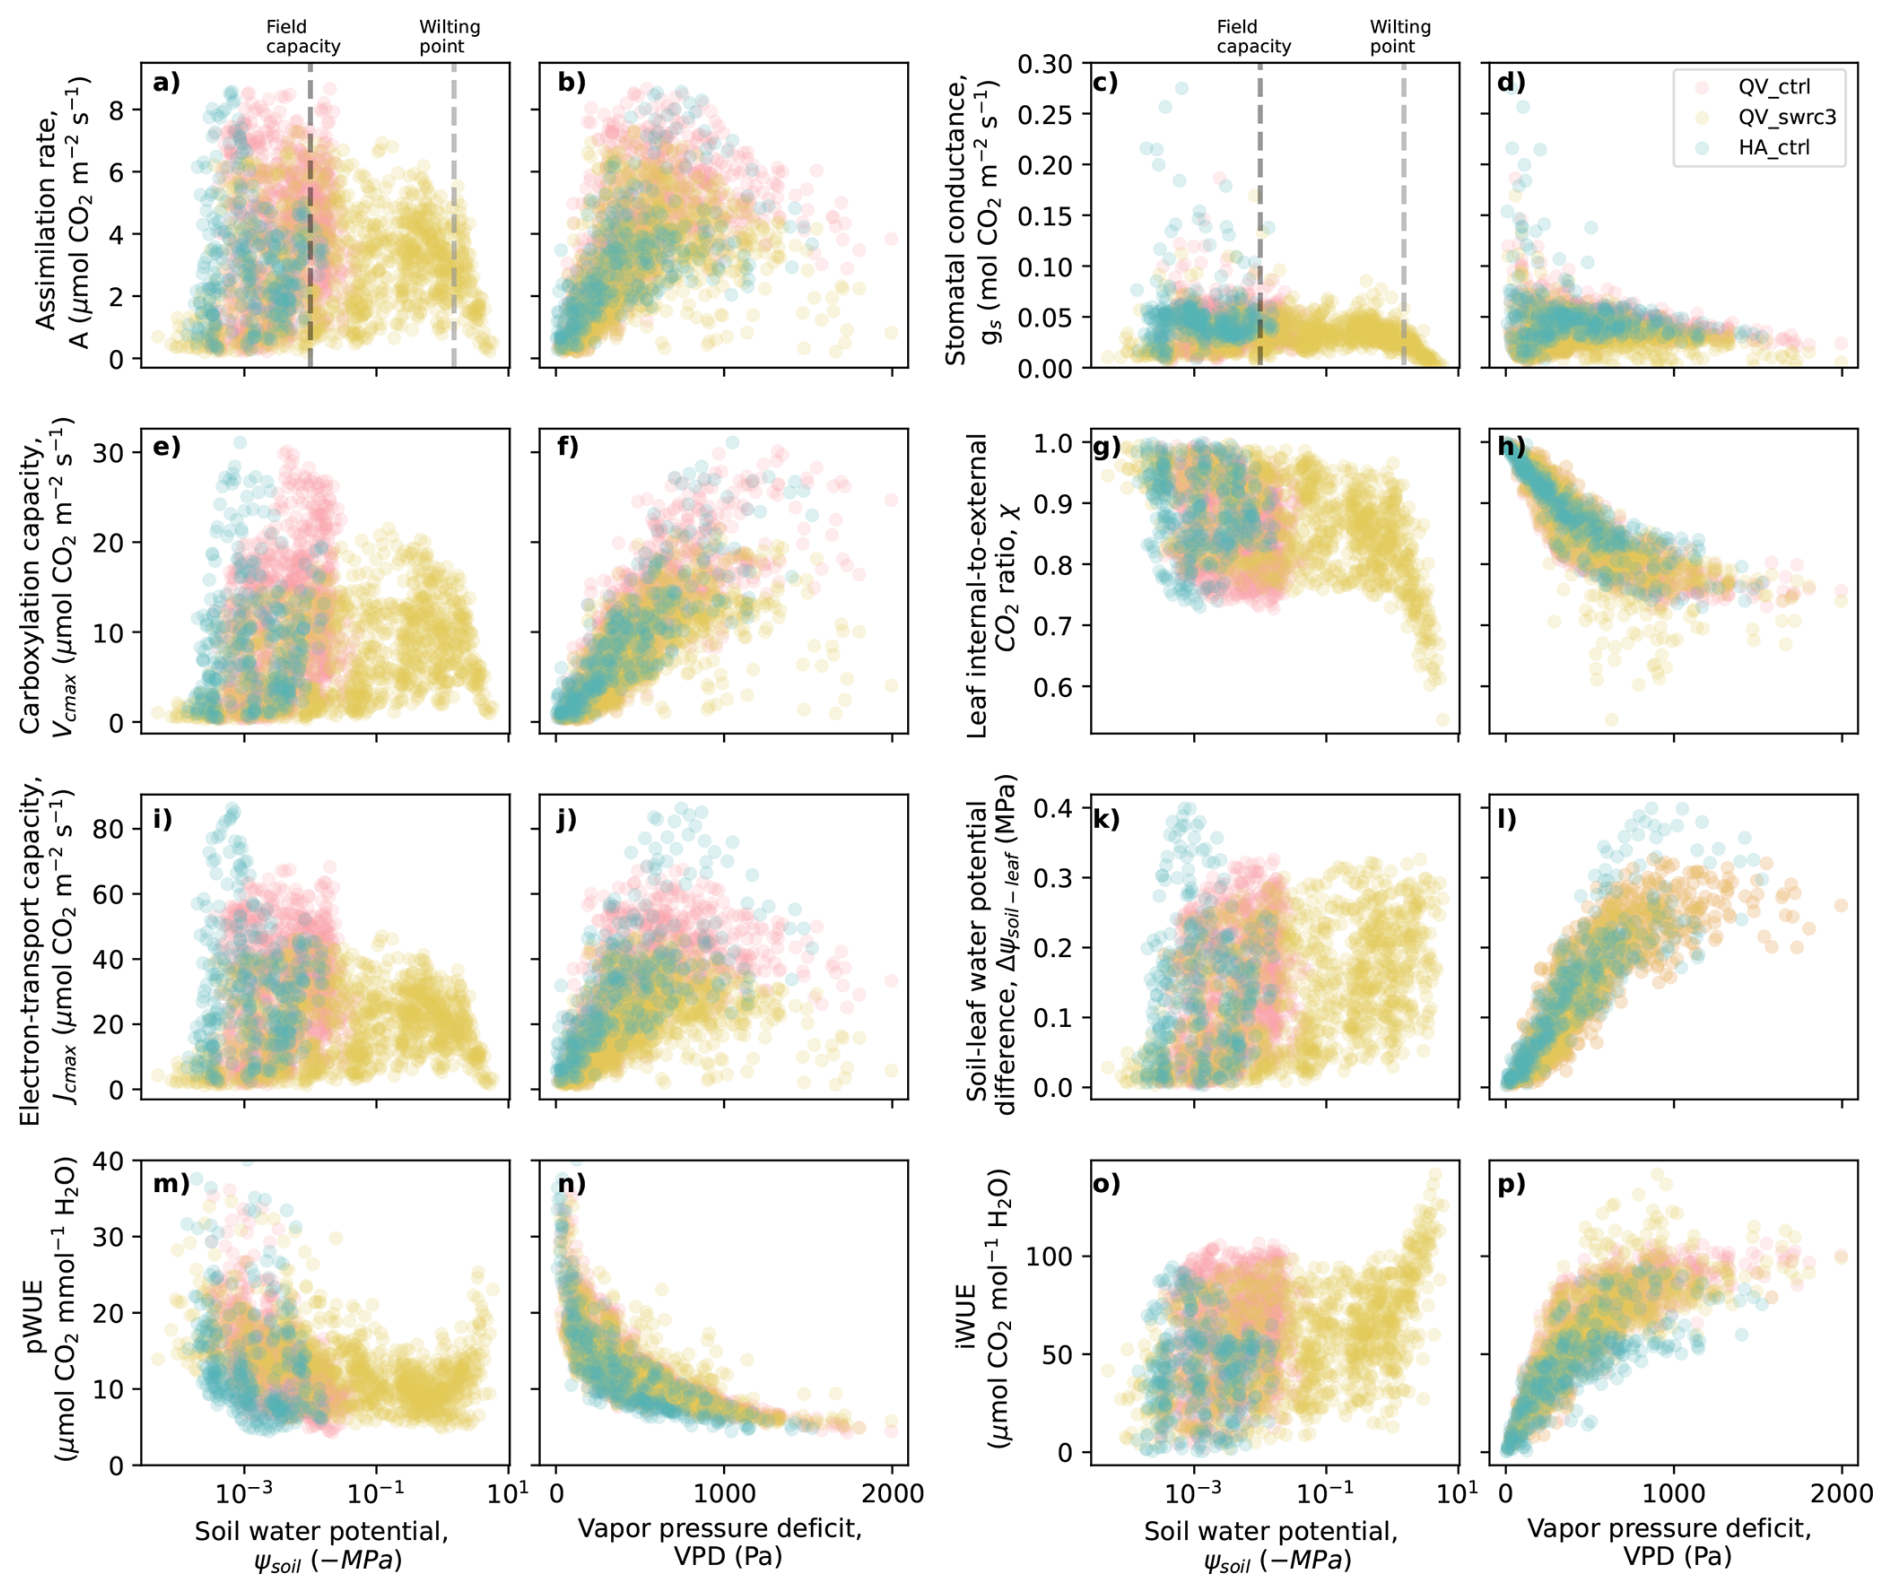
Figure 9Daily response of photosynthetic and hydraulic variables to soil water potential (first and third columns) and vapor pressure deficit (second and fourth columns) simulated by the five best-fit PPE members selected from QV_ctrl, QV_swrc3, and HA_ctrl. (a, b) Assimilation rate (A, µmol CO2 m−2 s−1); (c, d) stomatal conductance (gs, mol CO2 m−2 s−1); (e, f) carboxylation capacity (Vcmax, µmol CO2 m−2 s−1); (g, h) leaf internal-to-external CO2 ratio (χ); (i, j) electron-transport capacity (Jmax, µmol CO2 m−2 s−1); (k, l) soil-to-leaf water potential difference (Δψsoil−leaf, MPa), (m,n) plant-level water use efficiency (pWUE, µmol CO2 (mmol H2O)−1), (o, p) intrinsic water use efficiency (iWUE, µmol CO2 (mol H2O)−1).
In comparison, soil drought and its impacts are barely evident in the five best-fit PPE members, as soil water potential in these simulations remains well above the wilting point (Fig. 9a, c), except for those from QV_swrc3 with a more drought-prone SWRC. When soil moisture approaches the wilting point, photosynthetic capacity, assimilation rate, and stomatal conductance (Fig. 9a, c, e, i) decrease drastically, whereas pWUE and iWUE increase with lower soil water potential (Fig. 9m, o). Such response contrasts with the effect of increasing VPD, which tends to promote iWUE but reduce pWUE (cf. Fig. 9m, o and n, p).
4.1 Apparent hydraulic traits of boreal crops
Crop hydraulic traits have often been overlooked in boreal crop studies (Roitsch et al., 2022). By employing SPY-C and EC flux measurements, we were able to infer apparent hydraulic traits at field scale and assess their impacts on crop performance under typical boreal conditions. Constrained by both observed carbon and water fluxes, the maximum whole-plant hydraulic conductance (Kp) inferred for both the perennial forage grass mixture and the annual cereal (oats) was toward the lower end of values reported for crop species (cf., Tables 2 and S3), suggesting relatively low hydraulic efficiency and a conservative water-use strategy. This contrasts with the relatively high hydraulic efficiency reported for many crops (Table S3), but is consistent with observations of relatively lower hydraulic efficiency in plants from cold boreal environments (He et al., 2020). This similarity supports the role of environmental water stress in shaping hydraulic traits across species (Bartlett et al., 2016), implying that environmental stresses associated with the boreal climate may favour relatively conservative water-use strategies in boreal crop species.
The inferred apparent hydraulic traits of both crops show little variation when using different model-inversion periods (Methods S4), consistent with evidence that hydraulic traits can be relatively conserved within a species (Lamy et al., 2014). We also inferred a slightly more acquisitive water-use strategy (e.g., lower γ or higher Kp) for the annual cereal crop (oats) and cover crop (Italian ryegrass) than for the perennial forage grass mixture (timothy, meadow fescue, and white clover) (Table 2), which is in broad agreement with the empirical evidence summarized in Table S3.
To further evaluate the plausibility of the inferred apparent hydraulic traits, we compared the modelled responses of stomatal conductance and whole-plant hydraulic conductance to changes in leaf water potential with available empirical observations. As shown in Fig. 10, the model inferred plant hydraulic conductance (K) and stomatal conductance for the perennial grass mixture are generally lower than those reported empirically (Fig. 10a, d). Agreement improved at lower leaf water potentials. One possible reason for such discrepancy can be the difference in scale: model-inferred K reflects whole-plant hydraulic conductance at the field scale, whereas empirical studies typically measure hydraulic conductance at the organ or individual plant scale (Wang and Frankenberg, 2022; Jiménez-Rodríguez et al., 2024). Differences in species, cultivars, and climatic origin may also contribute, as the available measurements were all from temperate rather than boreal cultivars. Additional hydraulic measurements of Nordic crops are therefore needed to better constrain and evaluate the model-inferred hydraulic traits and behaviours.

Figure 10Modelled response of stomatal conductance (1.6 × gs, mol H2O m−2 s−1) (a–c) and hydraulic conductance (K, 10−16 m) (d–f) to declining leaf water potential (ψplant, MPa) and comparison with observations for similar crops reported in the literature. Panels (a) and (d) are for forage grasses, (b) and (e) are for oats and (c) and (f) are for the cover crop (Italian ryegrass). The modelled results (small circles) correspond to the QV_swrc3 PPE members using the five best-fit parameter sets listed in Table 2 for each crop, with best-fit members 1–5 following the same order as in the table. We use QV_swrc3 here because it produces a wider range of leaf water potentials, allowing hydraulic responses to be more clearly evaluated. The empirical data are denoted by triangles, and were obtained from Holloway-Phillips and Brodribb (2011b) (Lolium perenne), Jacob et al. (2022) (Festuca arundinacea, Phalaris aquatica), Canales et al. (2021) (Avena sativa) and Holloway-Phillips and Brodribb (2011a) (Lolium multiflorum cv. Feast). Hourly model output from the growing season (May–October, 2018–2023) that matched the environmental conditions of the corresponding leaf gas-exchange measurements were selected. L. perenne and L. multiflorum: VPD 1.35–1.65 kPa, PAR 900–1100 , and temperature 18–22 °C; F. arundinacea and P. aquatica: VPD 1–2 kPa, PAR 1620–1980 , and temperature 26–30 °C; A. sativa: VPD 0.72–0.88 kPa, PAR 225–275 , and temperature 18–22 °C.
For oats and Italian ryegrass, the model generally captured the observed stomatal responses to declining leaf water potential (Fig. 10b, c), except that the observation exhibited more rapid stomatal closure during dehydration than predicted by the model for Italian ryegrass, indicating more isohydric behaviour. A higher ψ50 (i.e., −1 MPa) produced a closer match to the observed response to leaf dehydration. As values above −1 MPa have recently been reported for some crops (Cardoso et al., 2025), increasing ψ50 above −1 MPa may further improve agreement between the model and observations. Increasing γ (the cost of maintaining hydraulic pathways) also shifted the simulated response toward more isohydric behaviour (data not shown). These sensitivities highlight the need for direct hydraulic measurements of boreal crops to better constrain both ψ50 and γ and to assess the remaining model–observation discrepancies.
4.2 Role of hydraulic coordination in crop productivity and drought resistance
Previous studies have widely reported positive relationships between hydraulic efficiency (as indicated by maximum plant hydraulic conductance) and productivity (Holloway-Phillips and Brodribb, 2011a; Ocheltree et al., 2016; Gleason et al., 2021). Such a relationship was also detected in our study, but only during cooler and wetter months, such as May (Fig. 7a, b). During summer, when drought events were often present (Fig. 2e, f), however, we found a pronounced negative relationship between hydraulic efficiency (Kp) and productivity (GPP) across the full PPE (Fig. 7a, b) in both perennial and annual boreal crops. Therefore, the low hydraulic efficiency inferred for the studied crops appears to be particularly important for maintaining high productivity under boreal summer conditions. This can be attributed to the fact that plants with lower hydraulic efficiency withdraw soil water more slowly, thereby preventing soil moisture from being depleted to a critical threshold at which productivity becomes strongly constrained (Figs. 6i, j and 7i, j). A similar mechanism has been reported in forest ecosystem model simulations (Jiménez-Rodríguez et al., 2024). Consistently, previous empirical studies also suggest that crops with a conservative water-use strategy (i.e., lower hydraulic efficiency) can sustain higher yields than those with an acquisitive water-use strategy (i.e., higher hydraulic efficiency) (Holloway-Phillips and Brodribb, 2011a; Gleason et al., 2022; Schell et al., 2026). Importantly, the negative effect of hydraulic efficiency on productivity largely disappeared when either soil or atmospheric drought was removed (Figs. S10 and S11), indicating that the advantage of low hydraulic efficiency for maintaining high productivity is manifested primarily when soil and atmospheric drought co-limit crop productivity.
Overall, for the five best-fit PPE members, our modelling results indicate that atmospheric drought exerted a much stronger effect on crop productivity than soil drought at the two study sites (Fig. 8). Little evidence of soil-water limitation was found in the best-fit members from the baseline PPEs (i.e., QV_ctrl and HA_ctrl), whereas substantial soil drought effects emerged only in the best-fit members of the PPE with a more drought-prone soil water retention curve (i.e., QV_swrc3) (Fig. 9). The limited role of soil drought was further supported by the absence of a critical soil-moisture threshold in either the flux observations or the best-fit PPE members from QV_ctrl and HA_ctrl (Fig. S8b–d), following the diagnostic proposed by Fu et al. (2024). The hydraulic safety margin of the studied crops, defined as the difference between the minimum leaf water potential experienced during the growing season (ψmin) and ψ50 (Choat et al., 2012; Anderegg et al., 2016), remained well above zero despite the large uncertainties in ψ50 (Fig. S9). Together, this evidence suggests that although soil water stress was indeed a potential constraint on crop productivity during drought events under current boreal climate conditions, the inferred conservative hydraulic strategies of the studied crops appear to have helped them largely avoid this constraint, thereby exhibiting high resistance to the exposure of drought events primarily through drought avoidance rather than tolerance (Haugum et al., 2021; Alves et al., 2024; Pereira et al., 2024; Cardoso et al., 2025). We note that the current version of SPY-C does not account for potential impacts of soil drought on above- and below-ground carbon allocation, which have been widely recognised in previous studies (Qiao et al., 2021; Xia et al., 2017). Whether such responses occurred at our study sites remains to be investigated. Incorporating a dynamic carbon allocation scheme responsive to soil water availability would help address this limitation.
In contrast to the limited effect of soil drought, atmospheric drought exerted a clear and consistent constraint on crop productivity at both sites (Figs. 8c, d and 9). The extensive periods of high VPD may have contributed substantially to the yield reductions observed during drought years at Qvidja (Heimsch et al., 2021), consistent with evidence for a dominant role of atmospheric dryness in regulating plant productivity in boreal regions (Mirabel et al., 2023). The model inferred relatively low stomatal conductance (Fig. 9c, d) and a faster decline in leaf water potential than in soil water potential (Fig. S8a), an indicator of anisohydric stomatal behaviour (Hochberg et al., 2018; Ratzmann et al., 2019). Stomatal closure generally occurred only after significant loss of hydraulic conductivity (Fig. S9), implying a relatively “risky” stomatal regulation and a low stomatal safety margin (Gleason et al., 2022; Martin-StPaul et al., 2017; Pereira et al., 2024). These model-inferred behaviours broadly concur with empirical evidence from perennial forage grasses (e.g. Holloway-Phillips and Brodribb, 2011b; Jacob et al., 2022) and some cereal crops (e.g. Corso et al., 2020), and may explain the strong sensitivity to atmospheric drought found in our simulations. The relatively low hydraulic efficiency, however, appeared to partly buffer the crops against atmospheric drought, as evidenced by a positive effect of hydraulic efficiency (Kp) on the response of GPP to the removal of VPD (Fig. 8c, d). The buffering was nevertheless insufficient at daily VPD ≥ 0.8 kPa, when hydraulic adjustment could no longer sustain leaf water balance and both stomatal conductance and photosynthesis declined (Fig. 9b, d, f, j). This is in agreement with the close coordination between plant hydraulic function, stomatal regulation, and photosynthesis under drought conditions discussed by Flexas et al. (2018).
There has been controversy over how plant hydraulic traits and their coordination affect its water use efficiency. While high (low) hydraulic efficiency (safety) has often been suggested to promote plant-level WUE (Holloway-Phillips and Brodribb, 2011b; Gleason et al., 2022), low hydraulic efficiency has also been found to promote intrinsic water use efficiency for alpine shrubs (Yao et al., 2024). Our results showed that the effect of hydraulic efficiency (Kp) on plant water-use efficiency (both pWUE and iWUE) was generally opposite to its effect on GPP (cf. Fig. 7a, b and e–h). Accordingly, hydraulic strategies that favoured GPP did not necessarily maximize pWUE or iWUE (Fig. 6), especially under drought conditions. In our simulations, higher hydraulic efficiency (Kp) tended to increase pWUE and iWUE during summer water deficit but decrease it during wetter spring and autumn conditions (Fig. 7e–h). This is in agreement with the contrasting effects of hydraulic efficiency reported in a previous study on annual ryegrass (see Table 4 in Holloway-Phillips and Brodribb, 2011a). Under summer drought, plants with higher hydraulic efficiency (Kp) may accelerate soil-water depletion and lower soil and plant water potentials (Fig. 11a), giving rise to a substantial decline in realized plant hydraulic conductance (K) (Eq. 3). This reduction in realized conductance decreases both GPP and transpiration, but transpiration declines more strongly than GPP, thereby increasing pWUE (Fig. 11b–d). In contrast, under wetter spring and autumn conditions, plants with higher hydraulic efficiency can sustain higher realized hydraulic conductance, and thus exhibit lower pWUE than their less hydraulically efficient counterparts.

Figure 11Relationship between whole-plant hydraulic conductance (K, 10−16 m) and soil water potential (ψsoil, MPa) (a), and between the ratio of whole-plant hydraulic conductance and the corresponding ratios of GPP (b), transpiration (c), and pWUE (d). The ratios were calculated between simulations with higher Kp and the simulation with the lowest Kp (0.5 × 10⁻¹⁶ m). All results are from the QV_noVPD PPE. The intersection of the horizontal and vertical grey dashed lines in panels (b), (c), (d) denotes the reference point where both ratios equal 1.
4.3 Model uncertainties and future development
Several structural simplifications in the current version of SPY-C may contribute to uncertainties in the simulated carbon and water fluxes and the inferred apparent hydraulic traits. First, SPY-C adopts a big-leaf canopy representation, in which prescribed total one-sided green LAI is combined with within-canopy light attenuation using Beer's law. The model therefore does not explicitly distinguish sunlit and shaded leaves or resolve multiple canopy layers. This simplification may contribute to biases in the diurnal partitioning of GPP and ET, particularly during the early morning and late afternoon (Fig. 5). A two-leaf or multilayer canopy representation could improve the treatment of within-canopy radiation and associated carbon and water fluxes.
A second important simplification concerns the representation of roots dynamics and its influence on whole-plant hydraulics. In the current framework, Kp represents the maximum whole-plant hydraulic conductance per unit leaf area and therefore integrates the entire soil-to-leaf hydraulic pathway, including roots and the root–soil interface. Root hydraulic traits are thus represented only implicitly rather than as separate root, stem, and leaf conductances. Moreover, water uptake occurs from a fixed effective root zone (0.6 m in this study), while root biomass is tracked as a carbon pool but does not feed back on rooting depth, water uptake, or hydraulic conductance. Dynamic rooting depth, root distribution, hydraulic redistribution, and drought-induced changes in root hydraulic conductivity are therefore not represented. These processes can play an important role in drought adaptation of cereals and grasses (e.g. Canales et al., 2021). Coupling dynamic root growth to water uptake and hydraulic conductance, together with prognostic leaf growth, is therefore an important direction for future development. Such extensions would also allow drought avoidance mediated through root-zone dynamics to be represented more explicitly.
Uncertainty also arises from model structural biases, parameterization, and model inversion approach. We note indications that canopy and ground evaporation may be overestimated leading to the overestimation of ET (Fig. 4d, h). However, sensitivity experiments with reduced evaporation did not alter the inferred Kp (data not shown), suggesting that this bias has little influence on the inferred apparent hydraulic traits. Although the PPE approach enabled us to constrain apparent hydraulic traits using both carbon and water fluxes, the present ensembles varied only a limited set of plant hydraulic and photosynthetic parameters. Future applications should propagate uncertainty from a broader range of parameters, particularly soil hydraulic properties, rooting characteristics, and canopy processes. More efficient multi-objective calibration and inversion approaches (Denager et al., 2023; Bell et al., 2025) may further improve both parameter identifiability and robustness. An additional source of uncertainty also lies in the representation of mixed cropping systems. At Qvidja, the forage grass and legume species are represented as a single effectively homogeneous canopy, although individual species may differ in hydraulic traits, stomatal regulation, and drought response. Resolving such within-canopy hydraulic heterogeneity would therefore be a valuable direction for future development.
Despite these uncertainties, the strong influence of plant hydraulics on crop productivity, water use, and drought responses demonstrated here highlights the value of explicitly representing hydraulic processes in modelling boreal crops. SPY-C also reproduced net ecosystem exchange reasonably well at the study sites (Fig. S12), suggesting potential for applications in monitoring, reporting, and verification (MRV) of agricultural carbon balances (Smith et al., 2020; Guan et al., 2023; Wijmer et al., 2024). Developing SPY-C toward a robust MRV tool will nevertheless require a more complete representation of management and nutrient constraints. In particular, improved descriptions of sowing, harvesting, fertilization, and crop rotation, together with coupling of nitrogen dynamics to the carbon and water cycles (e.g. Stocker and Prentice, 2024), would allow crop growth and carbon–water exchange to respond more realistically to management. Combined with improved canopy, root, and parameter-inference schemes, these developments would strengthen the transferability of SPY-C across crop types, sites, and management regimes.
We examined the apparent hydraulic traits of typical annual and perennial boreal crops and their impact on crop productivity, water use efficiency, and drought response by combining multi-year carbon and water flux measurements from two Finnish crop fields with the newly developed model framework SPY-C, which explicitly couples plant hydraulic, photosynthesis, and soil moisture dynamics. SPY-C reproduced the observed carbon and water fluxes well to support field-scale inference of apparent hydraulic traits. Both oats and the perennial forage grass mixture exhibited relatively low apparent hydraulic efficiency and conservative hydraulic strategies, which are crucial for reducing rapid soil-water depletion and partly buffered crop functioning against atmospheric drought, thereby promoting drought avoidance and productivity under boreal summer conditions. Here, we present SPY-C as an efficient tool for inferring apparent hydraulic traits and assessing their effects on crop performance across contrasting pedoclimate conditions. This can be fundamental for selecting and developing better crops and management to support climate-smart and sustainable agriculture. We also underscore the good potential of SPY-C for broader applications in agricultural carbon monitoring, reporting, and verification to enhance accuracy and predictive power in both current and future boreal climates.
The meteorological and Sentinel-2 LAI data for Qvidja and Hauho sites are available from the Field Observatory website (https://www.fieldobservatory.org/, last access: 24 February 2025) or from the Field Observatory dynamic data storage at https://doi.org/10.23728/fmi-b2share.56513f096ca442b19abdef30f63644ed (Nevalainen et al., 2022b). The codes to retrieve Sentinel-2 satellite data and to calculate the leaf area index (LAI) are available from the Python satellitetools package at https://doi.org/10.5281/zenodo.5993291 (Nevalainen and Vira, 2022). Data for the gap-filled eddy covariance measurements are available at https://doi.org/10.57707/fmi-b2share.353cc686b81449d69117df30aeb3613c (Vira et al., 2025a). The SPY-C model version used in this study (v1.0.0) is archived at https://doi.org/10.5281/zenodo.23468303 (Tang and Launiainen, 2026). The model input and output are available at https://doi.org/10.57707/fmi-b2share.7536bc09eed44c71a08e87e545bc9406 (Tang, 2025).
The supplement related to this article is available online at https://doi.org/10.5194/bg-23-8183-2026-supplement.
HT, SL, JV, LK, TP, JL designed the research. LK, HA, ON, MK, HV, JL collected observation data. HT, SL, JV, TP, IF, JPN, JL developed the SPY-C model. HT performed the research and data analysis. All the authors contribute to interpreting the results and writing the manuscript.
The contact author has declared that none of the authors has any competing interests.
Neither the European Commission nor ECMWF is responsible for any use that may be made of the Copernicus information or data it contains.
Publisher's note: Copernicus Publications remains neutral with regard to jurisdictional claims made in the text, published maps, institutional affiliations, or any other geographical representation in this paper. The authors bear the ultimate responsibility for providing appropriate place names. Views expressed in the text are those of the authors and do not necessarily reflect the views of the publisher.
We thank Maria Tenkanen for helping improve the figures, Quentin Bell for inspiration about the model name and language checking, Laura Heimsch and Layla Höckerstedt for providing information of the study sites, Olli Niemitalo, Samu Varjonen and Iivari Kunttu for helpful discussions on the development of SPY-C. The authors wish to acknowledge CSC – IT Center for Science, Finland, for computational resources. ERA5-Land was downloaded from the Copernicus Climate Change Service (C3S).
This work was supported by the Research Council of Finland (grant nos. 353073, 359342, 359533, 356138), the Strategic Research Council at the Research Council of Finland (grant no. 352431, 358257), the Ministry of Agriculture and Forestry of Finland (grant nos. VN/5094/2021 and VN/27979/2021), Business Finland (project 8391/31/2021), European Research Executive Agency (REA) through the Mission Soil project MARVIC (Grant Agreement: 101112942), Lantmännen Research Foundation and Lantmännen Group in Finland. In addition, this project has received funding from EU Horizon 2020 (grant no. 101056921).
This paper was edited by Jun Zhong and reviewed by two anonymous referees.
Aalto, J., Kämäräinen, M., Rantanen, M., Niittynen, P., Phoenix, G. K., Lenoir, J., Maclean, I., and Luoto, M.: A new era of bioclimatic extremes in the terrestrial Arctic, Sci. Adv., 12, eadw5698, https://doi.org/10.1126/sciadv.adw5698, 2026. a
Alves, R. D. F. B., Menezes-Silva, P. E., Loram-Lourenço, L., Abreu, I. M. P. G., Alencar, K. M., Sousa, L. F., Almeida, S. E. S., Aun, M. A., Silva, M. L. F., Vasconcelos-Filho, S. C., Silva, F. G., Sales, J. F., and Farnese, F. S.: Exploring the coordinated hydraulic plasticity across organs in soybean plants exposed to drought cycles, Environ. Exp. Bot., 226, 105871, https://doi.org/10.1016/j.envexpbot.2024.105871, 2024. a, b
Anderegg, W. R. L., Klein, T., Bartlett, M., Sack, L., Pellegrini, A. F. A., Choat, B., and Jansen, S.: Meta-analysis reveals that hydraulic traits explain cross-species patterns of drought-induced tree mortality across the globe, P. Natl. Acad. Sci. USA, 113, 5024–5029, https://doi.org/10.1073/pnas.1525678113, 2016. a, b
Atkin, O. K., Bloomfield, K. J., Reich, P. B., Tjoelker, M. G., Asner, G. P., Bonal, D., Bönisch, G., Bradford, M. G., Cernusak, L. A., Cosio, E. G., Creek, D., Crous, K. Y., Domingues, T. F., Dukes, J. S., Egerton, J. J. G., Evans, J. R., Farquhar, G. D., Fyllas, N. M., Gauthier, P. P. G., Gloor, E., Gimeno, T. E., Griffin, K. L., Guerrieri, R., Heskel, M. A., Huntingford, C., Ishida, F. Y., Kattge, J., Lambers, H., Liddell, M. J., Lloyd, J., Lusk, C. H., Martin, R. E., Maksimov, A. P., Maximov, T. C., Malhi, Y., Medlyn, B. E., Meir, P., Mercado, L. M., Mirotchnick, N., Ng, D., Niinemets, Ü., O'Sullivan, O. S., Phillips, O. L., Poorter, L., Poot, P., Prentice, I. C., Salinas, N., Rowland, L. M., Ryan, M. G., Sitch, S., Slot, M., Smith, N. G., Turnbull, M. H., VanderWel, M. C., Valladares, F., Veneklaas, E. J., Weerasinghe, L. K., Wirth, C., Wright, I. J., Wythers, K. R., Xiang, J., Xiang, S., and Zaragoza-Castells, J.: Global variability in leaf respiration in relation to climate, plant functional types and leaf traits, New Phytol., 206, 614–636, https://doi.org/10.1111/nph.13253, 2015. a
Bartlett, M. K., Klein, T., Jansen, S., Choat, B., and Sack, L.: The correlations and sequence of plant stomatal, hydraulic, and wilting responses to drought, P. Natl. Acad. Sci. USA, 113, 13098–13103, https://doi.org/10.1073/pnas.1604088113, 2016. a
Bell, Q., Gerin, S., Douglas, N., Quaife, T., Liski, J., and Viskari, T.: Calibrating primary crop parameters to capture undersown species impacts, Eur. J. Agron., 169, 127676, https://doi.org/10.1016/j.eja.2025.127676, 2025. a
Campolongo, F., Cariboni, J., and Saltelli, A.: An effective screening design for sensitivity analysis of large models, Environ. Modell. Softw., 22, 1509–1518, https://doi.org/10.1016/j.envsoft.2006.10.004, 2007. a, b
Canales, F. J., Rispail, N., García-Tejera, O., Arbona, V., Pérez-de-Luque, A., and Prats, E.: Drought resistance in oat involves ABA-mediated modulation of transpiration and root hydraulic conductivity, Environ. Exp. Bot., 182, 104333, https://doi.org/10.1016/j.envexpbot.2020.104333, 2021. a, b, c
Cardoso, A. A., Andrade, M. T., Bucior, E. R., and Martins, S. C. V.: Plant hydraulic traits influencing crop production in water-limited environments, Plant Physiol., 199, kiaf521, https://doi.org/10.1093/plphys/kiaf521, 2025. a, b, c
Choat, B., Jansen, S., Brodribb, T. J., Cochard, H., Delzon, S., Bhaskar, R., Bucci, S. J., Feild, T. S., Gleason, S. M., Hacke, U. G., Jacobsen, A. L., Lens, F., Maherali, H., Martínez-Vilalta, J., Mayr, S., Mencuccini, M., Mitchell, P. J., Nardini, A., Pittermann, J., Pratt, R. B., Sperry, J. S., Westoby, M., Wright, I. J., and Zanne, A. E.: Global convergence in the vulnerability of forests to drought, Nature, 491, 752–755, https://doi.org/10.1038/nature11688, 2012. a, b
Corso, D., Delzon, S., Lamarque, L. J., Cochard, H., Torres-Ruiz, J. M., King, A., and Brodribb, T.: Neither xylem collapse, cavitation, or changing leaf conductance drive stomatal closure in wheat, Plant Cell Environ., 43, 854–865, https://doi.org/10.1111/pce.13722, 2020. a, b
Denager, T., Sonnenborg, T. O., Looms, M. C., Bogena, H., and Jensen, K. H.: Point-scale multi-objective calibration of the Community Land Model (version 5.0) using in situ observations of water and energy fluxes and variables, Hydrol. Earth Syst. Sci., 27, 2827–2845, https://doi.org/10.5194/hess-27-2827-2023, 2023. a
Drake, P. L., Veneklaas, E. J., Smith, N. G., Driever, S. M., and de Boer, H. J.: Temperature acclimation of chlorophyll fluorescence and carboxylation capacity from near-instantaneous to weekly time scales, Plant Cell Environ., 49, 5497–5510, https://doi.org/10.1111/pce.70555, 2026. a
Flexas, J., Carriquí, M., and Nadal, M.: Gas exchange and hydraulics during drought in crops: Who drives whom?, J. Exp. Bot., 69, 3791–3795, https://doi.org/10.1093/jxb/ery235, 2018. a
Fu, Z., Ciais, P., Wigneron, J.-P., Gentine, P., Feldman, A. F., Makowski, D., Viovy, N., Kemanian, A. R., Goll, D. S., Stoy, P. C., Prentice, I. C., Yakir, D., Liu, L., Ma, H., Li, X., Huang, Y., Yu, K., Zhu, P., Li, X., Zhu, Z., Lian, J., and Smith, W. K.: Global critical soil moisture thresholds of plant water stress, Nat. Commun., 15, 4826, https://doi.org/10.1038/s41467-024-49244-7, 2024. a
Gan, Y., Duan, Q., Gong, W., Tong, C., Sun, Y., Chu, W., Ye, A., Miao, C., and Di, Z.: A comprehensive evaluation of various sensitivity analysis methods: A case study with a hydrological model, Environ. Modell. Softw., 51, 269–285, https://doi.org/10.1016/j.envsoft.2013.09.031, 2014. a
Gerin, S., Vekuri, H., Liimatainen, M., Tuovinen, J.-P., Kekkonen, J., Kulmala, L., Laurila, T., Linkosalmi, M., Liski, J., Joki-Tokola, E., and Lohila, A.: Two contrasting years of continuous N2O and CO2 fluxes on a shallow-peated drained agricultural boreal peatland, Agr. Forest Meteorol., 341, 109630, https://doi.org/10.1016/j.agrformet.2023.109630, 2023. a
Gleason, S. M., Westoby, M., Jansen, S., Choat, B., Hacke, U. G., Pratt, R. B., Bhaskar, R., Brodribb, T. J., Bucci, S. J., Cao, K.-F., Cochard, H., Delzon, S., Domec, J.-C., Fan, Z.-X., Feild, T. S., Jacobsen, A. L., Johnson, D. M., Lens, F., Maherali, H., Martínez-Vilalta, J., Mayr, S., McCulloh, K. A., Mencuccini, M., Mitchell, P. J., Morris, H., Nardini, A., Pittermann, J., Plavcová, L., Schreiber, S. G., Sperry, J. S., Wright, I. J., and Zanne, A. E.: Weak tradeoff between xylem safety and xylem-specific hydraulic efficiency across the world's woody plant species, New Phytol., 209, 123–136, https://doi.org/10.1111/nph.13646, 2016. a
Gleason, S. M., Nalezny, L., Hunter, C., Bensen, R., Chintamanani, S., and Comas, L. H.: Growth and grain yield of eight maize hybrids are aligned with water transport, stomatal conductance, and photosynthesis in a semi-arid irrigated system, Physiol. Plantarum, 172, 1941–1949, https://doi.org/10.1111/ppl.13400, 2021. a, b, c
Gleason, S. M., Barnard, D. M., Green, T. R., Mackay, S., Wang, D. R., Ainsworth, E. A., Altenhofen, J., Brodribb, T. J., Cochard, H., Comas, L. H., Cooper, M., Creek, D., DeJonge, K. C., Delzon, S., Fritschi, F. B., Hammer, G., Hunter, C., Lombardozzi, D., Messina, C. D., Ocheltree, T., Stevens, B. M., Stewart, J. J., Vadez, V., Wenz, J., Wright, I. J., Yemoto, K., and Zhang, H.: Physiological trait networks enhance understanding of crop growth and water use in contrasting environments, Plant Cell Environ., 45, 2554–2572, https://doi.org/10.1111/pce.14382, 2022. a, b, c, d
Guan, K., Jin, Z., Peng, B., Tang, J., DeLucia, E. H., West, P. C., Jiang, C., Wang, S., Kim, T., Zhou, W., Griffis, T., Liu, L., Yang, W. H., Qin, Z., Yang, Q., Margenot, A., Stuchiner, E. R., Kumar, V., Bernacchi, C., Coppess, J., Novick, K. A., Gerber, J., Jahn, M., Khanna, M., Lee, D., Chen, Z., and Yang, S.-J.: A scalable framework for quantifying field-level agricultural carbon outcomes, Earth-Sci. Rev., 243, 104462, https://doi.org/10.1016/j.earscirev.2023.104462, 2023. a
Haddix, M. L., Gregorich, E. G., Helgason, B. L., Janzen, H., Ellert, B. H., and Francesca Cotrufo, M.: Climate, carbon content, and soil texture control the independent formation and persistence of particulate and mineral-associated organic matter in soil, Geoderma, 363, 114160, https://doi.org/10.1016/j.geoderma.2019.114160, 2020. a
Haugum, S. V., Thorvaldsen, P., Vandvik, V., and Velle, L. G.: Coastal heathland vegetation is surprisingly resistant to experimental drought across successional stages and latitude, Oikos, 130, 2015–2027, https://doi.org/10.1111/oik.08098, 2021. a
He, P., Gleason, S. M., Wright, I. J., Weng, E., Liu, H., Zhu, S., Lu, M., Luo, Q., Li, R., Wu, G., Yan, E., Song, Y., Mi, X., Hao, G., Reich, P. B., Wang, Y., Ellsworth, D. S., and Ye, Q.: Growing-season temperature and precipitation are independent drivers of global variation in xylem hydraulic conductivity, Glob. Change Biol., 26, 1833–1841, https://doi.org/10.1111/gcb.14929, 2020. a
Heckwolf, S., Heckwolf, M., Kaeppler, S. M., de Leon, N., and Spalding, E. P.: Image analysis of anatomical traits in stalk transections of maize and other grasses, Plant Methods, 11, 26, https://doi.org/10.1186/s13007-015-0070-x, 2015. a
Heimsch, L., Lohila, A., Tuovinen, J.-P., Vekuri, H., Heinonsalo, J., Nevalainen, O., Korkiakoski, M., Liski, J., Laurila, T., and Kulmala, L.: Carbon dioxide fluxes and carbon balance of an agricultural grassland in southern Finland, Biogeosciences, 18, 3467–3483, https://doi.org/10.5194/bg-18-3467-2021, 2021. a, b, c
Heimsch, L., Vira, J., Fer, I., Vekuri, H., Tuovinen, J.-P., Lohila, A., Liski, J., and Kulmala, L.: Impact of weather and management practices on greenhouse gas flux dynamics on an agricultural grassland in southern Finland, Agr. Ecosyst. Environ., 374, 109179, https://doi.org/10.1016/j.agee.2024.109179, 2024. a
Henry, C., John, G. P., Pan, R., Bartlett, M. K., Fletcher, L. R., Scoffoni, C., and Sack, L.: A stomatal safety-efficiency trade-off constrains responses to leaf dehydration, Nat. Commun., 10, 3398, https://doi.org/10.1038/s41467-019-11006-1, 2019. a
Herman, J. and Usher, W.: SALib: An open-source Python library for sensitivity analysis, J. Open Source Softw., 2, 97, https://doi.org/10.21105/joss.00097, 2017. a
Hochberg, U., Rockwell, F. E., Holbrook, N. M., and Cochard, H.: Iso/anisohydry: A plant–environment interaction rather than a simple hydraulic trait, Trends Plant Sci., 23, 112–120, https://doi.org/10.1016/j.tplants.2017.11.002, 2018. a
Holloway-Phillips, M.-M. and Brodribb, T. J.: Contrasting hydraulic regulation in closely related forage grasses: Implications for plant water use, Funct. Plant Biol., 38, 594–605, https://doi.org/10.1071/FP11029, 2011a. a, b, c, d, e, f
Holloway-Phillips, M.-M. and Brodribb, T. J.: Minimum hydraulic safety leads to maximum water-use efficiency in a forage grass, Plant Cell Environ., 34, 302–313, https://doi.org/10.1111/j.1365-3040.2010.02244.x, 2011b. a, b, c
Hu, L., Wu, M., Ju, W., Xing, X., Chen, J. M., and Zhu, H.: Improved simulation of gross primary production and evapotranspiration in a drought-prone temperate deciduous forest with the BEPS-EcoHydro, Agr. Forest Meteorol., 379, 111031, https://doi.org/10.1016/j.agrformet.2026.111031, 2026. a
Huo, J., Shi, Y., Chen, J., Zhang, H., Feng, L., Zhao, Y., and Zhang, Z.: Hydraulic trade-off and coordination strategies mediated by leaf functional traits of desert shrubs, Front. Plant Sci., 13, 938758, https://doi.org/10.3389/fpls.2022.938758, 2022. a
Jacob, V., Choat, B., Churchill, A. C., Zhang, H., Barton, C. V. M., Krishnananthaselvan, A., Post, A. K., Power, S. A., Medlyn, B. E., and Tissue, D. T.: High safety margins to drought-induced hydraulic failure found in five pasture grasses, Plant Cell Environ., 45, 1631–1646, https://doi.org/10.1111/pce.14318, 2022. a, b
Jiménez-Rodríguez, C. D., Sulis, M., and Schymanski, S.: The role of the intraspecific variability of hydraulic traits for modeling the plant water use in different European forest ecosystems, J. Adv. Model. Earth Sy., 16, e2022MS003494, https://doi.org/10.1029/2022MS003494, 2024. a, b
Joshi, J., Stocker, B. D., Hofhansl, F., Zhou, S., Dieckmann, U., and Prentice, I. C.: Towards a unified theory of plant photosynthesis and hydraulics, Nat. Plants, 8, 1304–1316, https://doi.org/10.1038/s41477-022-01244-5, 2022. a, b, c, d
Kennedy, D., Swenson, S., Oleson, K. W., Lawrence, D. M., Fisher, R., Lola da Costa, A. C., and Gentine, P.: Implementing plant hydraulics in the Community Land Model, version 5, J. Adv. Model. Earth Sy., 11, 485–513, https://doi.org/10.1029/2018MS001500, 2019. a
Kubota, S., Nishida, K., and Yoshida, S.: A soil–plant–atmosphere continuum model reflecting the responses of plant hydraulic resistance to waterlogging, J. Hydrol., 672, 135402, https://doi.org/10.1016/j.jhydrol.2026.135402, 2026. a
Lamarque, L. J., Delzon, S., Toups, H., Gravel, A.-I., Corso, D., Badel, E., Burlett, R., Charrier, G., Cochard, H., Jansen, S., King, A., Torres-Ruiz, J. M., Pouzoulet, J., Cramer, G. R., Thompson, A. J., and Gambetta, G. A.: Over-accumulation of abscisic acid in transgenic tomato plants increases the risk of hydraulic failure, Plant Cell Environ., 43, 548–562, https://doi.org/10.1111/pce.13703, 2020. a
Lamy, J.-B., Delzon, S., Bouche, P. S., Alia, R., Vendramin, G. G., Cochard, H., and Plomion, C.: Limited genetic variability and phenotypic plasticity detected for cavitation resistance in a Mediterranean pine, New Phytol., 201, 874–886, https://doi.org/10.1111/nph.12556, 2014. a, b
Launiainen, S., Guan, M., Salmivaara, A., and Kieloaho, A.-J.: Modeling boreal forest evapotranspiration and water balance at stand and catchment scales: a spatial approach, Hydrol. Earth Syst. Sci., 23, 3457–3480, https://doi.org/10.5194/hess-23-3457-2019, 2019. a, b
Launiainen, S., Kieloaho, A.-J., Lindroos, A.-J., Salmivaara, A., Ilvesniemi, H., and Heiskanen, J.: Water retention characteristics of mineral forest soils in Finland: Impacts for modeling soil moisture, Forests, 13, 1797, https://doi.org/10.3390/f13111797, 2022. a, b
Li, S., Wang, J., Lu, S., Salmon, Y., Liu, P., and Guo, J.: Trade-off between hydraulic safety and efficiency in plant xylem and its influencing factors, Forests, 14, 1817, https://doi.org/10.3390/f14091817, 2023. a
Liu, H., Taylor, S. H., Xu, Q., Lin, Y., Hou, H., Wu, G., and Ye, Q.: Life history is a key factor explaining functional trait diversity among subtropical grasses, and its influence differs between C3 and C4 species, J. Exp. Bot., 70, 1567–1580, https://doi.org/10.1093/jxb/ery462, 2019. a, b
Liu, H., Ye, Q., Gleason, S. M., He, P., and Yin, D.: Weak tradeoff between xylem hydraulic efficiency and safety: Climatic seasonality matters, New Phytol., 229, 1440–1452, https://doi.org/10.1111/nph.16940, 2021a. a
Liu, Y., Kumar, M., Katul, G. G., Feng, X., and Konings, A. G.: Plant hydraulics accentuates the effect of atmospheric moisture stress on transpiration, Nat. Clim. Change, 10, 691–695, https://doi.org/10.1038/s41558-020-0781-5, 2020. a, b
Liu, Y., Holtzman, N. M., and Konings, A. G.: Global ecosystem-scale plant hydraulic traits retrieved using model–data fusion, Hydrol. Earth Syst. Sci., 25, 2399–2417, https://doi.org/10.5194/hess-25-2399-2021, 2021b. a
Lloyd, J. and Taylor, J. A.: On the temperature dependence of soil respiration, Funct. Ecol., 8, 315–323, https://doi.org/10.2307/2389824, 1994. a
Lu, Y., Sloan, B., Thompson, S. E., Konings, A. G., Bohrer, G., Matheny, A., and Feng, X.: Intra-specific variability in plant hydraulic parameters inferred from model inversion of sap flux data, J. Geophys. Res.-Biogeo., 127, e2021JG006777, https://doi.org/10.1029/2021JG006777, 2022. a
Martin-StPaul, N., Delzon, S., and Cochard, H.: Plant resistance to drought depends on timely stomatal closure, Ecol. Lett., 20, 1437–1447, https://doi.org/10.1111/ele.12851, 2017. a
Matzner, S. L., Rettedal, D. D., Harmon, D. A., and Beukelman, M. R.: Constraints to hydraulic acclimation under reduced light in two contrasting Phaseolus vulgaris cultivars, J. Exp. Bot., 65, 4409–4418, https://doi.org/10.1093/jxb/eru212, 2014. a
Mirabel, A., Girardin, M. P., Metsaranta, J., Way, D., and Reich, P. B.: Increasing atmospheric dryness reduces boreal forest tree growth, Nat. Commun., 14, 6901, https://doi.org/10.1038/s41467-023-42466-1, 2023. a
Morales, J. L. and Nocedal, J.: Remark on “Algorithm 778: L-BFGS-B: Fortran subroutines for large-scale bound constrained optimization”, ACM T. Math. Software, 38, 7, https://doi.org/10.1145/2049662.2049669, 2011. a
Morris, M. D.: Factorial sampling plans for preliminary computational experiments, Technometrics, 33, 161–174, https://doi.org/10.1080/00401706.1991.10484804, 1991. a
Muñoz-Sabater, J., Dutra, E., Agustí-Panareda, A., Albergel, C., Arduini, G., Balsamo, G., Boussetta, S., Choulga, M., Harrigan, S., Hersbach, H., Martens, B., Miralles, D. G., Piles, M., Rodríguez-Fernández, N. J., Zsoter, E., Buontempo, C., and Thépaut, J.-N.: ERA5-Land: a state-of-the-art global reanalysis dataset for land applications, Earth Syst. Sci. Data, 13, 4349–4383, https://doi.org/10.5194/essd-13-4349-2021, 2021. a
Nevalainen, O. and Vira, J.: satellitetools, Zenodo [code], https://doi.org/10.5281/zenodo.5993291, 2022. a, b
Nevalainen, O., Niemitalo, O., Fer, I., Juntunen, A., Mattila, T., Koskela, O., Kukkamäki, J., Höckerstedt, L., Mäkelä, L., Jarva, P., Heimsch, L., Vekuri, H., Kulmala, L., Stam, Å., Kuusela, O., Gerin, S., Viskari, T., Vira, J., Hyväluoma, J., Tuovinen, J.-P., Lohila, A., Laurila, T., Heinonsalo, J., Aalto, T., Kunttu, I., and Liski, J.: Towards agricultural soil carbon monitoring, reporting, and verification through the Field Observatory Network (FiON), Geosci. Instrum. Method. Data Syst., 11, 93–109, https://doi.org/10.5194/gi-11-93-2022, 2022a. a
Nevalainen, O., Niemitalo, O., Fer, I., Juntunen, A., Mattila, T., Koskela, O., Kukkamäki, J., Höckerstedt, L., Mäkelä, L., Jarva, P., Heimsch, L., Vekuri, H., Kulmala, L., Stam, Å., Kuusela, O., Gerin, S., Viskari, T., Vira, J., Hyväluoma, J., Tuovinen, J.-P., Hatakka, J., Rainne, J., Skogberg, M., Lohila, A., Laurila, T., Heinonsalo, J., Aalto, T., Kunttu, I., and Liski, J.: Field Observatory dynamic data storage, Finnish Meteorological Institute [data set], https://doi.org/10.23728/fmi-b2share.56513f096ca442b19abdef30f63644ed, 2022b. a
Ocheltree, T. W., Nippert, J. B., and Prasad, P. V. V.: A safety vs efficiency trade-off identified in the hydraulic pathway of grass leaves is decoupled from photosynthesis, stomatal conductance and precipitation, New Phytol., 210, 97–107, https://doi.org/10.1111/nph.13781, 2016. a, b, c
Palosuo, T., Heikkinen, J., and Regina, K.: Method for estimating soil carbon stock changes in Finnish mineral cropland and grassland soils, Carbon Manag., 6, 207–220, https://doi.org/10.1080/17583004.2015.1131383, 2015. a, b
Pereira, T. S., Oliveira, L. A., Andrade, M. T., Haverroth, E. J., Cardoso, A. A., and Martins, S. C. V.: Linking water-use strategies with drought resistance across herbaceous crops, Physiol. Plantarum, 176, e14114, https://doi.org/10.1111/ppl.14114, 2024. a, b
Poque, S., Carlson-Nilsson, U., Omer, M., Himanen, K., and Khazaei, H.: Exploring an automated indoor high-throughput phenotyping facility to investigate the response of faba bean to water stress, Research Square [preprint], https://doi.org/10.21203/rs.3.rs-6461902/v1, 2025. a
Pritzkow, C., Williamson, V., Szota, C., Trouvé, R., and Arndt, S. K.: Phenotypic plasticity and genetic adaptation of functional traits influences intra-specific variation in hydraulic efficiency and safety, Tree Physiol., 40, 215–229, https://doi.org/10.1093/treephys/tpz121, 2020. a
Qiao, S., Wang, H., Prentice, I. C., and Harrison, S. P.: Optimality-based modelling of climate impacts on global potential wheat yield, Environ. Res. Lett., 16, 114013, https://doi.org/10.1088/1748-9326/ac2e38, 2021. a
Ramírez-Valiente, J. A., Poyatos, R., Blackman, C. J., Cabon, A., Castells, E., Cochard, H., Creek, D., Delzon, S., García-Valdés, R., Limousin, J.-M., López, R., Martin-StPaul, N., Moreno, M., Rowland, L., Santiago, L. S., Schuldt, B., Torres-Ruiz, J. M., Valade, A., Martínez-Vilalta, J., and Mencuccini, M.: Limited plastic responses in safety traits support greater hydraulic risk under drier conditions, Nat. Ecol. Evol., 9, 1825–1836, https://doi.org/10.1038/s41559-025-02830-4, 2025. a
Ratzmann, G., Meinzer, F. C., and Tietjen, B.: Iso/anisohydry: Still a useful concept, Trends Plant Sci., 24, 191–194, https://doi.org/10.1016/j.tplants.2019.01.001, 2019. a
Reichstein, M., Falge, E., Baldocchi, D., Papale, D., Aubinet, M., Berbigier, P., Bernhofer, C., Buchmann, N., Gilmanov, T., Granier, A., Grünwald, T., Havránková, K., Ilvesniemi, H., Janous, D., Knohl, A., Laurila, T., Lohila, A., Loustau, D., Matteucci, G., Meyers, T., Miglietta, F., Ourcival, J.-M., Pumpanen, J., Rambal, S., Rotenberg, E., Sanz, M., Tenhunen, J., Seufert, G., Vaccari, F., Vesala, T., Yakir, D., and Valentini, R.: On the separation of net ecosystem exchange into assimilation and ecosystem respiration: Review and improved algorithm, Glob. Change Biol., 11, 1424–1439, https://doi.org/10.1111/j.1365-2486.2005.001002.x, 2005. a
Roitsch, T., Himanen, K., Chawade, A., Jaakola, L., Nehe, A., and Alexandersson, E.: Functional phenomics for improved climate resilience in Nordic agriculture, J. Exp. Bot., 73, 5111–5127, https://doi.org/10.1093/jxb/erac246, 2022. a, b
Sanchez-Martinez, P., Martínez-Vilalta, J., Dexter, K. G., Segovia, R. A., and Mencuccini, M.: Adaptation and coordinated evolution of plant hydraulic traits, Ecol. Lett., 23, 1599–1610, https://doi.org/10.1111/ele.13584, 2020. a
Schaap, M. G. and Van Genuchten, M. T.: A modified Mualem–van Genuchten formulation for improved description of the hydraulic conductivity near saturation, Vadose Zone J., 5, 27–34, https://doi.org/10.2136/vzj2005.0005, 2006. a, b
Schell, V., Kervroëdan, L., Corso, D., N'do, D. Y., Faucon, M.-P., and Delzon, S.: Greater resistance to drought-induced embolism is linked to higher yield maintenance in soybean, Plant Cell Environ., 49, 4027–4040, https://doi.org/10.1111/pce.15538, 2026. a
Sierra, C. A., Ceballos-Núñez, V., Hartmann, H., Herrera-Ramírez, D., and Metzler, H.: Ideas and perspectives: Allocation of carbon from net primary production in models is inconsistent with observations of the age of respired carbon, Biogeosciences, 19, 3727–3738, https://doi.org/10.5194/bg-19-3727-2022, 2022. a
Smith, P., Soussana, J.-F., Angers, D., Schipper, L., Chenu, C., Rasse, D. P., Batjes, N. H., van Egmond, F., McNeill, S., Kuhnert, M., Arias-Navarro, C., Olesen, J. E., Chirinda, N., Fornara, D., Wollenberg, E., Álvaro-Fuentes, J., Sanz-Cobena, A., and Klumpp, K.: How to measure, report and verify soil carbon change to realize the potential of soil carbon sequestration for atmospheric greenhouse gas removal, Glob. Change Biol., 26, 219–241, https://doi.org/10.1111/gcb.14815, 2020. a
Sperry, J. S. and Love, D. M.: What plant hydraulics can tell us about responses to climate-change droughts, New Phytol., 207, 14–27, https://doi.org/10.1111/nph.13354, 2015. a
Spinoni, J., Vogt, J. V., Naumann, G., Barbosa, P., and Dosio, A.: Will drought events become more frequent and severe in Europe?, Int. J. Climatol., 38, 1718–1736, https://doi.org/10.1002/joc.5291, 2018. a
Stocker, B. D. and Prentice, I. C.: CN-model: A dynamic model for the coupled carbon and nitrogen cycles in terrestrial ecosystems, bioRxiv [preprint], https://doi.org/10.1101/2024.04.25.591063, 2024. a
Sun, Q., Gilgen, A. K., Signarbieux, C., Klaus, V. H., and Buchmann, N.: Cropping systems alter hydraulic traits of barley but not pea grown in mixture, Plant Cell Environ., 44, 2912–2924, https://doi.org/10.1111/pce.14054, 2021. a, b
Tang, H.: Model data for “Plant hydraulic traits regulating productivity and drought resistance in boreal crops”, Finnish Meteorological Institute [data set], https://doi.org/10.57707/fmi-b2share.7536bc09eed44c71a08e87e545bc9406, 2025. a
Tang, H. and Launiainen, S.: SPY-C: v1.0.0, Zenodo [code], https://doi.org/10.5281/zenodo.23468303, 2026. a
Torres-Ruiz, J. M., Cochard, H., Delzon, S., Boivin, T., Burlett, R., Cailleret, M., Corso, D., Delmas, C. E. L., De Caceres, M., Diaz-Espejo, A., Fernández-Conradi, P., Guillemot, J., Lamarque, L. J., Limousin, J.-M., Mantova, M., Mencuccini, M., Morin, X., Pimont, F., De Dios, V. R., Ruffault, J., Trueba, S., and Martin-StPaul, N. K.: Plant hydraulics at the heart of plant, crops and ecosystem functions in the face of climate change, New Phytol., 241, 984–999, https://doi.org/10.1111/nph.19463, 2024. a
Vekuri, H., Tuovinen, J.-P., Kulmala, L., Papale, D., Kolari, P., Aurela, M., Laurila, T., Liski, J., and Lohila, A.: A widely-used eddy covariance gap-filling method creates systematic bias in carbon balance estimates, Sci. Rep., 13, 1720, https://doi.org/10.1038/s41598-023-28827-2, 2023. a
Vico, G. and Brunsell, N. A.: Tradeoffs between water requirements and yield stability in annual vs. perennial crops, Adv. Water Resour., 112, 189–202, https://doi.org/10.1016/j.advwatres.2017.12.014, 2018. a
Vira, J., Vekuri, H., Nevalainen, O., Korkiakoski, M., Mattila, T., Aaltonen, H., Koskinen, M., Lohila, A., Pihlatie, M., and Liski, J.: Data for “Improving agricultural carbon monitoring with Sentinel-2 and eddy-covariance-based plant productivity estimates”, Finnish Meteorological Institute [data set], https://doi.org/10.57707/fmi-b2share.353cc686b81449d69117df30aeb3613c, 2025a. a
Vira, J., Vekuri, H., Nevalainen, O., Korkiakoski, M., Mattila, T., Aaltonen, H., Koskinen, M., Lohila, A., Pihlatie, M., and Liski, J.: Improving agricultural carbon monitoring with Sentinel-2 and eddy-covariance-based plant productivity estimates, Carbon Manag., 16, 2568042, https://doi.org/10.1080/17583004.2025.2568042, 2025b. a, b, c, d, e
Viskari, T., Pusa, J., Fer, I., Repo, A., Vira, J., and Liski, J.: Calibrating the soil organic carbon model Yasso20 with multiple datasets, Geosci. Model Dev., 15, 1735–1752, https://doi.org/10.5194/gmd-15-1735-2022, 2022. a
Wang, D. R., Venturas, M. D., Mackay, D. S., Hunsaker, D. J., Thorp, K. R., Gore, M. A., and Pauli, D.: Use of hydraulic traits for modeling genotype-specific acclimation in cotton under drought, New Phytol., 228, 898–909, https://doi.org/10.1111/nph.16751, 2020. a
Wang, Y. and Frankenberg, C.: Technical note: Common ambiguities in plant hydraulics, Biogeosciences, 19, 4705–4714, https://doi.org/10.5194/bg-19-4705-2022, 2022. a
Weiss, M., Baret, F., and Jay, S.: S2ToolBox Level 2 products: LAI, FAPAR, FCOVER, version 2.0, Tech. rep., European Space Agency, https://step.esa.int/docs/extra/ATBD_S2ToolBox_V2.0.pdf (last access: 19 October 2026), 2020. a
Wijmer, T., Al Bitar, A., Arnaud, L., Fieuzal, R., and Ceschia, E.: AgriCarbon-EO v1.0.1: large-scale and high-resolution simulation of carbon fluxes by assimilation of Sentinel-2 and Landsat-8 reflectances using a Bayesian approach, Geosci. Model Dev., 17, 997–1021, https://doi.org/10.5194/gmd-17-997-2024, 2024. a
Xia, J., Yuan, W., Wang, Y.-P., and Zhang, Q.: Adaptive carbon allocation by plants enhances the terrestrial carbon sink, Sci. Rep., 7, 3341, https://doi.org/10.1038/s41598-017-03574-3, 2017. a
Yao, G.-Q., Nie, Z.-F., Zeng, Y.-Y., Waseem, M., Hasan, M. M., Tian, X.-Q., Liao, Z.-Q., Siddique, K. H. M., and Fang, X.-W.: A clear trade-off between leaf hydraulic efficiency and safety in an aridland shrub during regrowth, Plant Cell Environ., 44, 3347–3357, https://doi.org/10.1111/pce.14156, 2021. a
Yao, G.-Q., Qi, S.-H., Li, Y.-R., Duan, Y.-N., Jiang, C., Nie, Z.-F., Liu, X.-D., Hasan, M. M., Xu, D.-H., Jing, W.-M., McAdam, S., and Fang, X.-W.: The combination of high leaf hydraulic safety and water use efficiency allows alpine shrubs to adapt to high-altitude habitats, Funct. Ecol., 38, 2506–2517, https://doi.org/10.1111/1365-2435.14660, 2024. a
Zhao, Q., Chen, J., Kang, J., and Kang, S.: Trade-offs between hydraulic efficiency and safety in cotton (Gossypium hirsutum L.) stems under elevated CO2 and salt stress, Plants, 14, 298, https://doi.org/10.3390/plants14020298, 2025. a
How do crops in northern regions cope with drought? We combined several years of field measurements with computer simulations to study oats and forage grasses in Finland. Both crops used water cautiously, helping preserve soil moisture and sustain growth during dry periods. However, dry air limited their growth more strongly than dry soil. These findings can help improve predictions of crop performance and support farming as drought risks increase in northern regions.
How do crops in northern regions cope with drought? We combined several years of field...