
the Creative Commons Attribution 4.0 License.
the Creative Commons Attribution 4.0 License.
 | 13 Nov 2026
Morphological and phylogenic variability of red snow algae in snowpacks along a glacial valley in Alaska

Kino Kobayashi
Takumi Suzuki
Ryohei Abe
Suzunosuke Usuba
Jun Uetake
Nozomu Takeuchi
Red snow blooms are visually similar but can be composed of different algal species and cell morphologies across sites, and the factors determining this spatial heterogeneity remain poorly understood. In this study, we investigated spatial variation in community structure, algal cell size, and morphology along gradients of elevation across a glacier and its forefield in Alaska. Microscopic observations revealed that the ice-based snowpack was characterized by a greater proportion of spherical cells, whereas the soil-based snowpack was characterized by a greater proportion of non-spherical cells and larger spherical cells. Molecular analyses revealed that Sanguina predominated in the ice-based snowpack, while the relative abundance of other genera, including Chloromonas and Rosetta, were more abundant in the soil-based snowpack. Redundancy analysis showed that community structure was explained primarily by snow depth and elevation, whereas it was not significantly influenced by nutrient concentrations. Linear models further indicated that size of spherical cell decreased with elevation, and the abundance of non-spherical cells decreased with snow depth. These results suggest that while snowmelt-driven environmental gradients govern the overall morphological and phylogenetic variability of red snow algae, the underlying substrate (ice vs. soil) also contributes to community turnover, likely by providing access to distinct local cell reservoirs during melt progression. Collectively, these factors shape the taxonomic composition, morphotype assemblage, and spatial development of red snow blooms.
- Article
(6242 KB) - Full-text XML
- BibTeX
- EndNote


Snow algae are photosynthetic microorganisms adapted to cold environments that actively grow in snowpacks during the snowmelt season. In polar and alpine snowpacks, environmental stress (e.g., intense ultraviolet radiation, low temperatures, freeze-thaw cycles, and nutrient limitation) induces the accumulation of secondary carotenoid pigments, causing red snow (Remias et al., 2005; Leya et al., 2009; Hoham and Remias, 2020). Red snow markedly reduces surface albedo and accelerates snowmelt (Yallop et al., 2012; Cook et al., 2017), highlighting biologically mediated albedo (bioalbedo) feedback on the energy balance at the snow surface (Lutz et al., 2016; Hotaling et al., 2021; Roussel et al., 2024).
Research on red snow algae has primarily focused on their phylogenetic classification. Red snow is mainly caused by algae belonging to the genera Sanguina (Procházková et al., 2019), Chloromonas (Novakovskaya et al., 2018; Procházková et al., 2024), Rosetta (Engstrom et al., 2024), and Chlainomonas (Novis, 2002; Procházková et al., 2018). Among these, Sanguina nivaloides (originally classified as Chlamydomonas nivalis; Procházková et al., 2019) is characterized by spherical cells and is widely distributed in snowpacks globally (Segawa et al., 2018). In contrast, other genera exhibit a wide diversity of morphotypes (Novakovskaya et al., 2018; Engstrom et al., 2024; Procházková et al., 2024), and their occurrence appears to be more spatially heterogeneous, often showing regionally distinct morphotypes and community structure (Nakashima et al., 2021; Almela et al., 2025).
Morphotypes of snow algae exhibit substantial diversity depending on life cycle stage even within a single species. Many red snow forming taxa exhibit marked morphological transitions from small flagellated or vegetative cells to enlarged non motile resting cells associated with carotenoid accumulation during late developmental stages (Procházková et al., 2019; Hoham and Remias, 2020). At the same time, morphologically distinct forms can occur among different taxa, whereas some unrelated taxa may display similar morphotypes, making species level identification based solely on morphology difficult (Novakovskaya et al., 2018; Engstrom et al., 2024). In particular, spherical cells, commonly observed in red snow, show substantial variation in cell size across sites and life cycle stages. This size variability may reflect differences in community structure, but it may also arise within a single species in response to environmental conditions or developmental stage (Procházková et al., 2019; Hoham and Remias, 2020). Consequently, morphological traits alone do not necessarily correspond directly to taxonomic identity and may instead reflect physiological status or life cycle progression. Because physically based bioalbedo models represent algal cells as light-absorbing particles with explicit geometric dimensions, variation in cell size is potentially relevant not only to taxonomy and physiology but also to snow optical properties and albedo reduction (Cook et al., 2017). However, the primary factors determining resulting morphotype and community structure in snowpacks remain poorly understood.
Within the same region, spatial variation in algal community structure has often been discussed in relation to differences in algal life cycles, especially in their sources that supply cells to the snow surface. These sources can be broadly divided into two pathways: atmospheric deposition and supply from the subsurface. Some species (e.g., Sanguina nivaloides and Chloromonas nivalis), are delivered to snowpacks through atmospheric transport and deposition, including wind and snowfall, which can disperse algae over long distances (Müller et al., 2001; Hoham and Duval, 2001; Procházková et al., 2019). Other species, including locally retained forms such as vegetative or cyst stages of Chlainomonas sp. (Matsumoto et al., 2024), can originate from local reservoirs, such as cysts retained within the snowpack or cells associated with underlying firn, ice surface, soils, and vegetation. An experimental field study on the Harding Icefield demonstrated that algal blooms can be dominated by resurfacing algae originating from subsurface snow, rather than being solely supplied by passive dispersal (Rea and Dial, 2024). Previous studies further suggest that resting cells from deeper snow layers over glacier ice or from snow–ground interfaces can become available at the snow surface through interstitial meltwater during the melt season (Hoham and Duval, 2001). Within this framework, snowmelt duration can be viewed as an approximation of the time available for in situ algal growth, while snow depth may influence the relative contribution of cells associated with the underlying substrate to surface snow communities. However, direct comparisons between contrasting underlying environments such as glacier ice and soil within the same region have not been conducted to evaluate this framework.
Various studies on red snow algae have been conducted in Alaska, making it an ideal region to evaluate these ideas. In addition to its extensive glaciated landscapes, North America, including Alaska and Arctic Canada, is known to host a particularly high diversity of snow algal taxa and morphotypes, with multiple co-occurring lineages such as Sanguina, Chloromonas, and the recently described Rosetta group showing regionally distinct community compositions (Kol, 1968; Novakovskaya et al., 2018; Procházková et al., 2019; Engstrom et al., 2024). This diversity suggests that spatial variation in community structure is likely to be especially pronounced in this region, providing an opportunity to examine how environmental gradients shape algal assemblages. Satellite-based work on the Harding Icefield further demonstrated that red snow distribution can be mapped at landscape scales, indicating a broad spatial structure in algal bloom (Takeuchi et al., 2006). At the cellular level, detailed microscopy and spectroscopy have revealed multiple morphotypes with distinct fluorescence and pigment-related characteristics, indicating functional diversity even within visually similar blooms (Fiołka et al., 2020). Despite these advances, existing studies have rarely integrated glaciers and forefield snowpacks within a single glacial valley framework, nor have they systematically compared surface and subsurface snow layers, to explain how community structure and morphological traits co-occur in red snow.
This study aimed to characterize the spatial variability of community structure and morphological traits in snowpacks along a glacial valley in Alaska, where snow algae have been previously reported (Takeuchi, 2001, 2013; Fiołka et al., 2020). We collected red snow from ice-based snowpack and soil-based snowpack during the early melting season. We quantified algal morphotypes and algal community structure using microscopy and molecular approaches and discussed how elevation, snow depth, nutrient availability, and the environment beneath the snow relate to coordinated transitions in community structure and morphotype assemblage.
2.1 Study site and sample collection
The study was conducted in a glacial valley of Gulkana Glacier in the Alaska Range, USA (Fig. 1a). Gulkana Glacier, located at the valley head, flows southward from the mountain ridge and peaks of 2000 to 3000 m. The area of the glacier is estimated to be 16.0 km2 (O'Neel et al., 2019). Gulkana Glacier has been a benchmark glacier for long-term observations by the USGS, and meteorological conditions and glacier mass balance have been monitored since the 1960s (U.S. Geological Survey Benchmark Glacier Program et al., 2024). The glacier flows down to approximately 1160 m at the current terminus, and the glacial forefield extends downstream. The surface of the forefield was mainly deposits of gravels and silts without vegetation within approximate 1 km from the glacial terminus, and grass and shrubs appear at 1 km from the glacial terminus (Fig. 1a, b).
Red snow samples were collected at the 30 sites on the snowpack along the valley from 2 to 5 July 2023. At the time of sampling, the glacier surface was entirely covered by seasonal snow, and the snowline had not yet retreated above the glacier terminus. In the glacier forefield, the snow cover was patchy and discontinuous. The sampling sites were located on soil-based snowpack (10 sites) and ice-based snowpack (20 sites). In this study, the site farthest downstream from the glacier terminus was defined as S1 (distance from the glacier terminus: 3.6 km), and the remaining sites were numbered consecutively upstream. The boundary between soil-based snowpack and ice-based snowpack was located between S10 and S11. Elevation and snow depth varied systematically along the site sequence, with measured snow depth ranging from 4 to 235 cm across the sampling sites (Fig. 1c). Red snow was collected from a 10 × 10 cm area using a stainless-steel scoop (Fig. 2). The upper 2 cm was defined as the surface layer because visible red-snow blooms are generally concentrated in the uppermost few centimeters of the snowpack, and a 0–2 cm layer has commonly been used to quantify surface snow algal communities (Onuma et al., 2022). However, recent studies have shown that snow algae can also occur below the immediate surface, including within deeper snow layers (Schuler and Mikucki, 2023). We therefore additionally collected the underlying 2–5 cm layer as a subsurface sample at the ice-based sites. Subsurface sampling was not conducted at soil-based sites because the snowpack was generally shallow and deeper sampling could have introduced soil particles and soil-associated organisms. Collected samples were melted and transferred into 6 mL tubes for microscopic observation and chemical analysis. Samples for microscopic observations were stored with 3 % formaldehyde. For chemical analysis, the meltwater was filtered immediately after melting through a 0.45 µm ion-free disposable filter designed for ion-chromatographic sample preparation (25AI ChromatoDisk, GL Sciences, Japan) to minimize the potential influence of particulate material on the dissolved solute measurements, following procedures used in previous studies of snow and glacier samples (Terashima et al., 2017; Takeuchi et al., 2019; Román et al., 2026). In addition, samples were also transferred into 6 ml tubes for molecular analysis at selected sites located (S1, S4, S7, S9, S10, S14, S22, S25, and S30). Samples for chemical and molecular analyses were transported frozen and stored in a freezer (−20 °C) at Chiba University and thawed immediately before analysis whereas samples for microscopic observations were stored at room temperature.
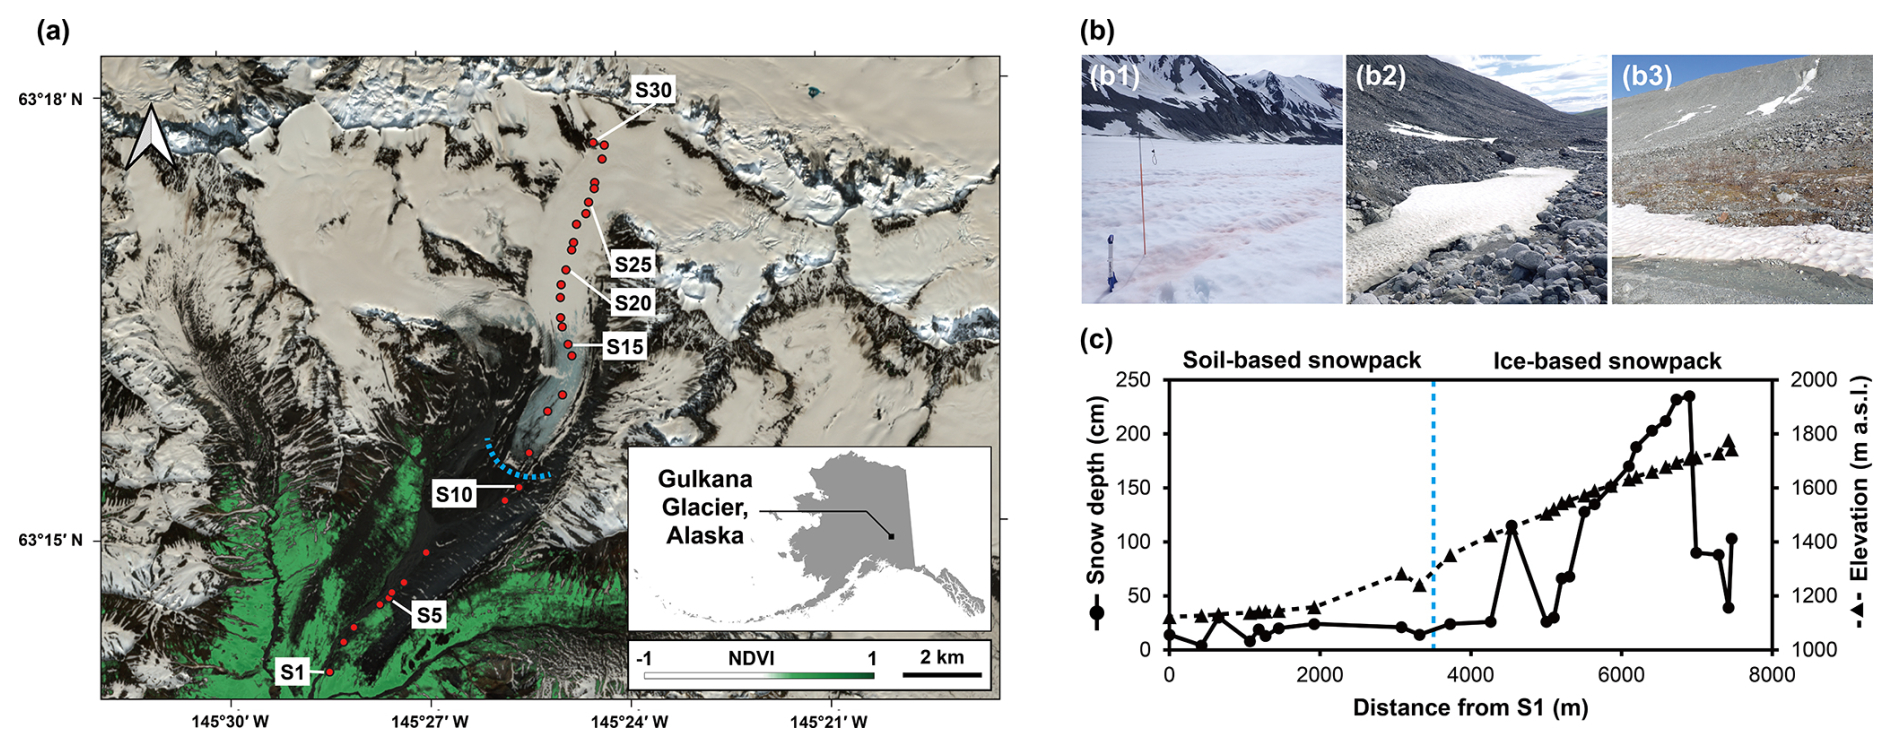
Figure 1The study site. (a) A map of Gulkana Glacier, red circles indicate locations where samples were collected. The source of a satellite image was acquired by Sentinel-2 on 22 June 2024, and downloaded from Copernicus browser (https://browser.dataspace.copernicus.eu/, last access: 21 October 2024). Areas shown in green represent the normalized difference vegetation index (NDVI) calculated by image processing using QGIS v3.40.2 (QGIS Development Team, 2024). Contains modified Copernicus Sentinel data 2024. (b) Conditions at the study site: (b1) ice-based snowpack, (b2) glacier terminus, and (b3) soil-based snowpack. (c) Snow depth and elevation across the study area. S1 indicates the site farthest from the glacier. The blue dashed line in (a) and (c) indicates the boundary between the ice-based snowpack and the soil-based snowpack. Within the soil-based snowpack, although snow cover appears absent at the macroscale, red snow samples were collected from localized, patchy snow remnants that persisted in topographic depressions, as shown in panels (b2) and (b3).
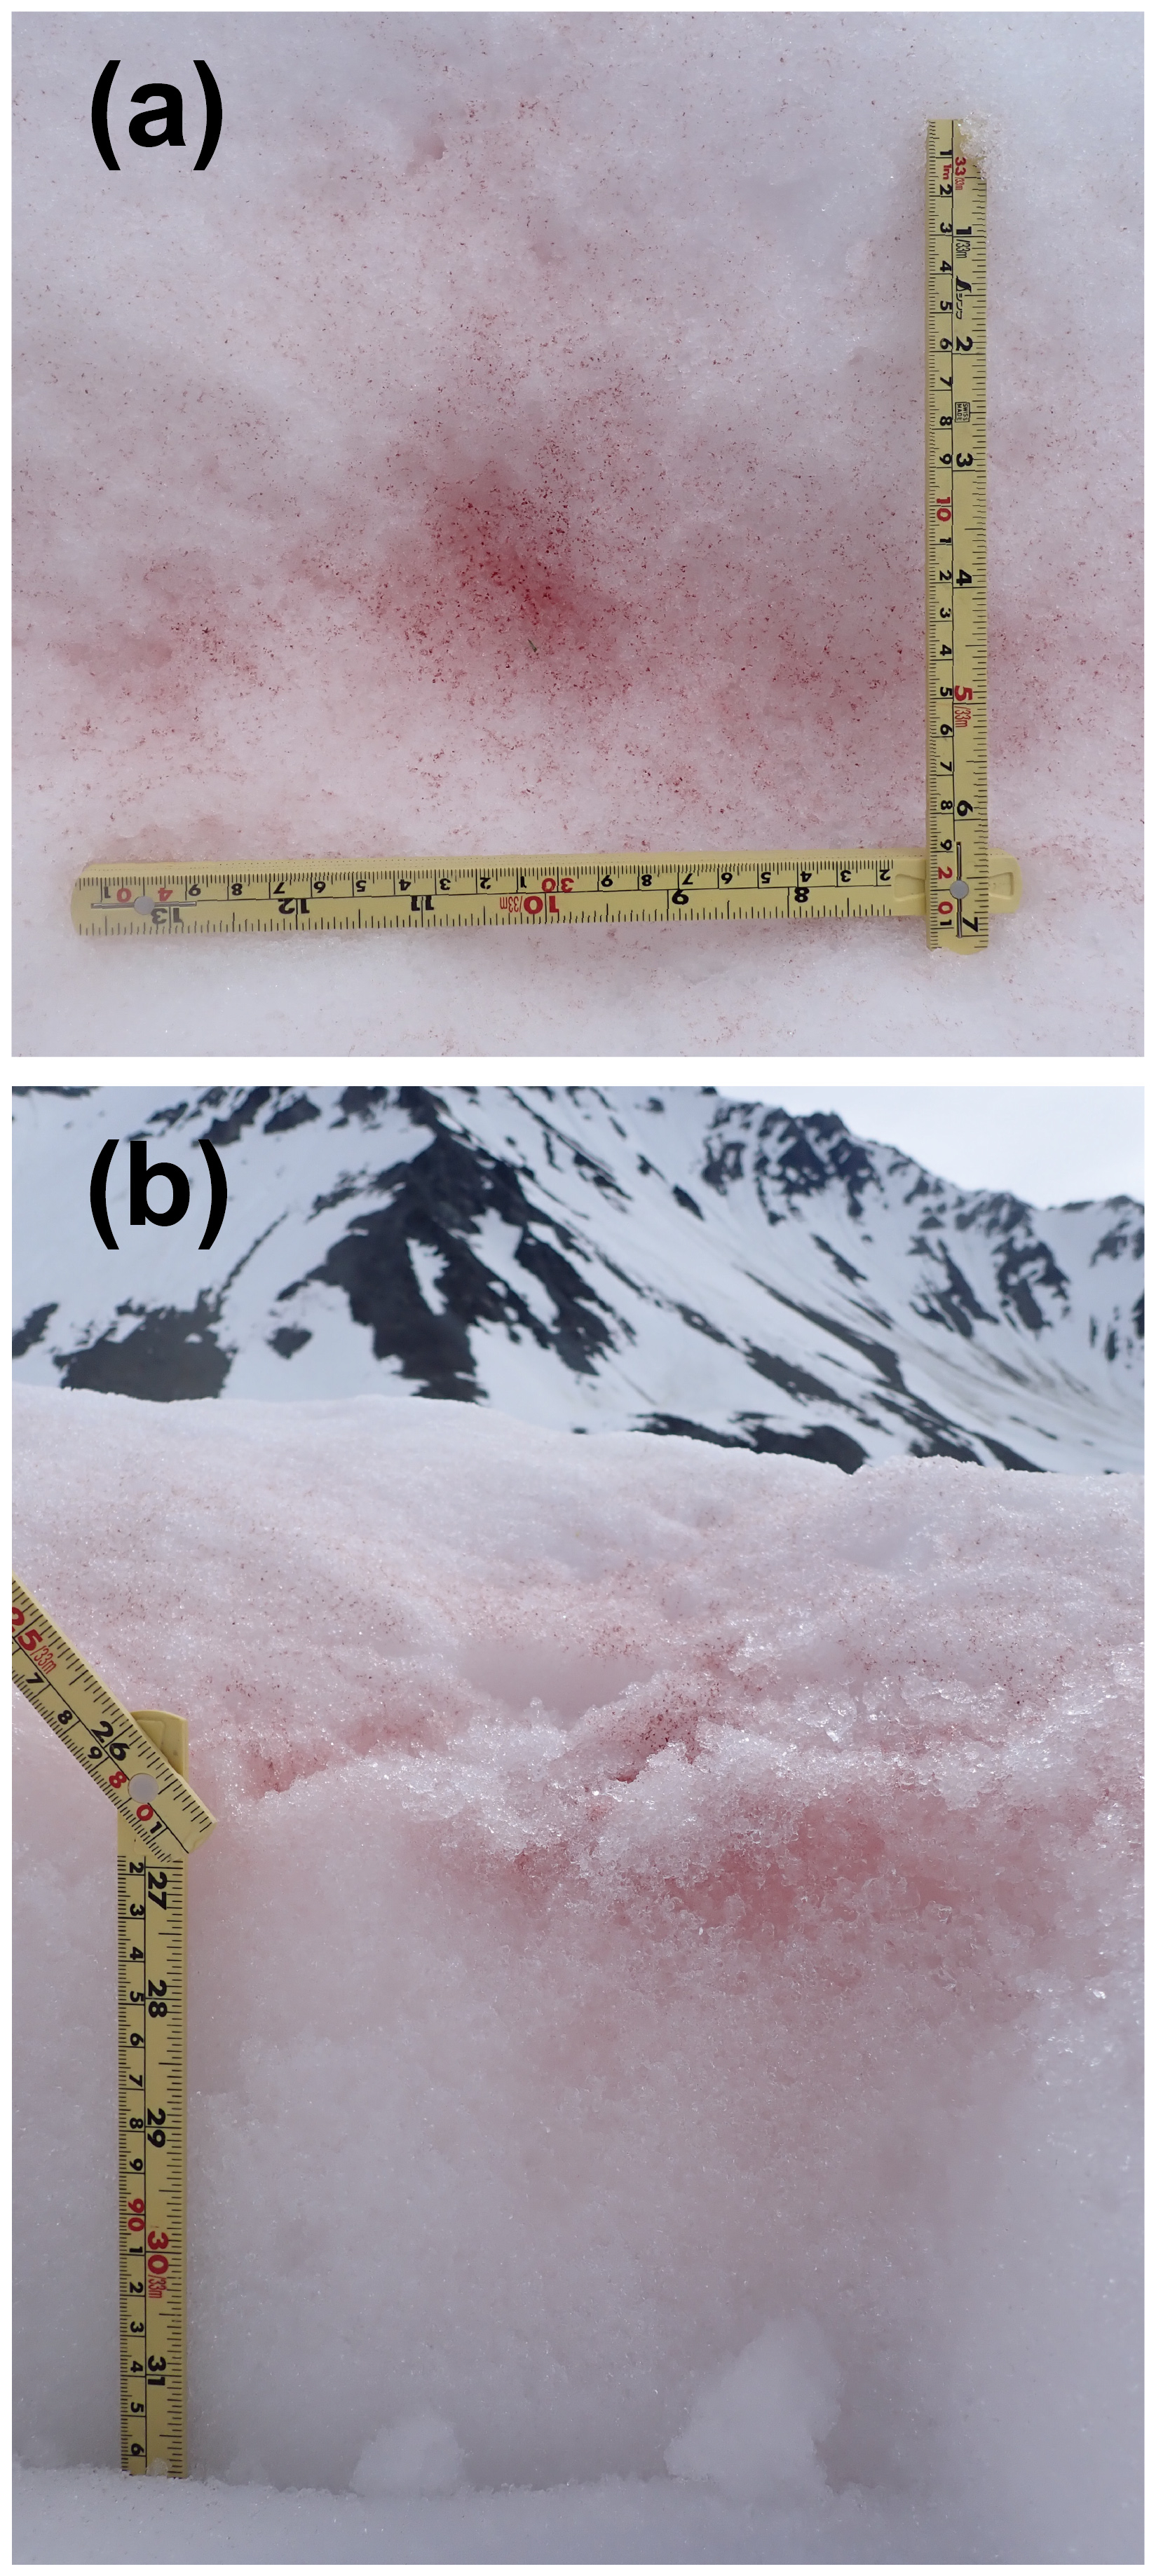
Figure 2Snowpack conditions at site S19 on 5 July 2023. (a) Snow surface. (b) Cross-section of the snowpack.
2.2 Microscopic observations
Microscopic observations were conducted to describe the morphology of the snow algal cells in the samples. The sample (20 µL) was transferred to a slide glass. Images of algae were captured using a fluorescence microscope (BX51, Olympus, Japan) equipped with a digital camera (DP21, Olympus, Japan). The geometric size of the algal cells (diameter or length and width) was measured using an image processing software (ImageJ 1.38X, National Institutes of Health, USA). For geometric cell-size calculation, the dimensions of at least five cells were measured for each algal morphotype using samples in which the respective morphotype was abundant. Additionally, the diameter of spherical cells was measured in a minimum of 100 cells in each sample to describe the distribution of algal cell sizes.
The cell numbers of snow algae in the snow samples were counted to calculate cell concentrations. 100–500 µL aliquots of the sample were collected on a 0.45 µm PTFE membrane filter (JHWP01300, Merck Millipore, Germany), then filtered using a pump (Linicon LV-125, Nitto Kohki, Japan). The filter was then placed on a slide, covered with a cover glass, and immersed in Milli-Q water. Cell counts were performed three times for each sample using a fluorescence microscope. The average cell counts and the volume of sample examined were used to calculate the concentration of each morphotype per unit volume of snow meltwater (cells mL−1). For each morphotype, volumetric biomass (µL L−1) was calculated by multiplying its cell concentration by its mean cell volume. For samples subjected to molecular analysis, morphotype composition based on relative volumetric biomass was compared with molecular taxonomic composition based on relative sequence abundance.
2.3 Chemical analysis
The concentrations of soluble nutrients (NH, NO, and PO), were analyzed with an ion-chromatography system (for anion: AQUION, Thermo Fisher Scientific, USA, for cation: ICS-1100, Thermo Fisher Scientific, USA). Concentrations were given in equivalent units per meltwater of snow (µEq kg−1).
2.4 DNA sequencing
Genomic DNA of snow samples were extracted using the DNeasy PowerSoil Pro Kit (QIAGEN, Germany) following the manufacturer's protocol. Partial 18S rRNA gene sequences including the V4–V5 regions were amplified using the primers Bakt_341F (CCTACGGGNGGCWGCAG) and 528F (5′-GCGGTAATTCCAGCTCCAA-3′) and 706R (5′-AATCCRAGAATTTCACCTCT-3′) (Cheung et al., 2010), with Illumina overhang adapter sequences (Forward: 5′-TCGTCGGCAGCGTCAGATGTGTATAAGAGACAG-3′; Reverse: 5′-GTCTCGTGGGCTCGGAGATGTGTATAAGA GACAG-3′) attached to their 5′ ends. The PCR mixture was prepared containing 5 U µL−1 AmpliTaq Gold DNA Polymerase (Thermo Fisher Scientific, USA), 10× AmpliTaq Gold Buffer (Thermo Fisher Scientific, USA), 10 mM dNTPs, 25 mM MgCl2, and 20 µM of each primer. Polymerase chain reaction (PCR) cycle was performed with an initial denaturation at 94 °C for 3 min, followed by 35 cycles of denaturation at 94 °C for 15 s, annealing at 54 °C for 15 s, and extension at 72 °C for 30 s, with a final extension at 72 °C for 10 min by CFX96 Touch (Bio-Rad Laboratories, CA, USA). The resulting PCR products were purified using AMPure XP beads (Beckman Coulter, USA). Subsequently, sequencing adapters and index sequences were attached via a second PCR (95 °C for 5 min; 10 cycles of 95 °C for 30 s, 60 °C for 30 s, and 72 °C for 30 s; and a final extension at 72 °C for 5 min), followed by another purification step with AMPure XP. DNA concentrations were measured using a Quantus™ Fluorometer (Promega Corporation, WI, USA), and all samples were pooled and adjusted to a final DNA amount of 40 ng. Sequencing was performed on a MiSeq using the the MiSeq Reagent Kit v3 (Illumina, USA) at Macrogen Japan.
2.5 Amplicon sequence variant analysis
To understand the community structure of snow algae based on the V4–V5 region sequences, the sequences were classified into amplicon sequence variants (ASVs). Raw reads were processed using the R package “DADA2” (Callahan et al., 2016). Quality filtering, trimming, and denoising were performed, including error rate learning and correction. Paired-end reads were merged, and chimeric sequences were removed. Taxonomic assignment was performed using the assign Taxonomy function in DADA2 (Wang et al., 2007) against customed Silva 132 database (Callahan, 2018). Custom Silva 132 database is including both standard sequences and additional sequences from Engstrom et al. (2024) which studied snow algae genus Rosetta, in order to reflect recent taxonomic update. Downstream analyses were conducted using the R packages “microViz” (Barnett et al., 2021) and “phyloseq” (McMurdie and Holmes, 2013). To determine the proportions of snow algae relative to all eukaryotes and red snow algae relative to all Chlorophyta, relative abundances were calculated for each taxonomic group based on the total number of reads at the phylum or genus level.
2.6 Statistical analysis
Differences in algal abundance, algal cell size, and nutrient concentrations were evaluated using non-parametric two-group tests. Comparisons between surface samples from soil-based and ice-based snowpacks were conducted using Mann–Whitney U-tests. For the ice-based snowpack, surface (0–2 cm) and subsurface (2–5 cm) samples collected at the same site were treated as paired observations and compared using Wilcoxon signed-rank tests. Values below the analytical detection limits were treated as zero for statistical comparisons. Linear models were used to examine the relationships between environmental variables and algal abundance (log-transformed) and algal cell size. Spherical and non-spherical cell concentrations were log(x+1)-transformed prior to analysis, whereas spherical cell size was analyzed without transformation. Model assumptions were assessed using standard residual diagnostic plots. Because each non-spherical morphotype occurred only sporadically and at low abundance, their separate site-level biomass proportions could not be estimated reliably. They were therefore pooled into a descriptive category (“non-spherical cells”) for the broad comparison with spherical cells. This pooling does not imply taxonomic or ecological equivalence among the constituent morphotypes. Redundancy analysis (RDA) based on Hellinger-transformed community composition data was used to examine the relationships between algal community structure and environmental variables. The significance of the overall model, constrained axes, and explanatory variables was assessed using permutation tests with 999 permutations. All analyses were conducted using R software (R Core Team, 2025).
3.1 Red snow algae morphotypes in snow samples
Microscopic observations revealed that the red snow samples contained snow algae of various sizes and morphotypes (Fig. 3). The observed algae were classified into five distinct morphotypes: (1) spherical cells of various sizes (Fig. 3a); (2) spherical cells with a stalk-like protrusion (Fig. 3b), with a cell diameter of 21.3 ± 8.0 µm (mean ± SD); (3) elliptical cells (Fig. 3c), with a length of 20.1 ± 2.5 µm and a width of 11.3 ± 1.0 µm; (4) oval shaped cells (Fig. 3d), a length of 31.3 ± 7.2 µm and a width of 26.3 ± 7.2 µm; (5) oval shaped cells with a ribbed cell wall (Fig. 3e), with a cell length of 24.8 ± 2.6 µm and a cell width of 15.3 ± 2.3 µm.
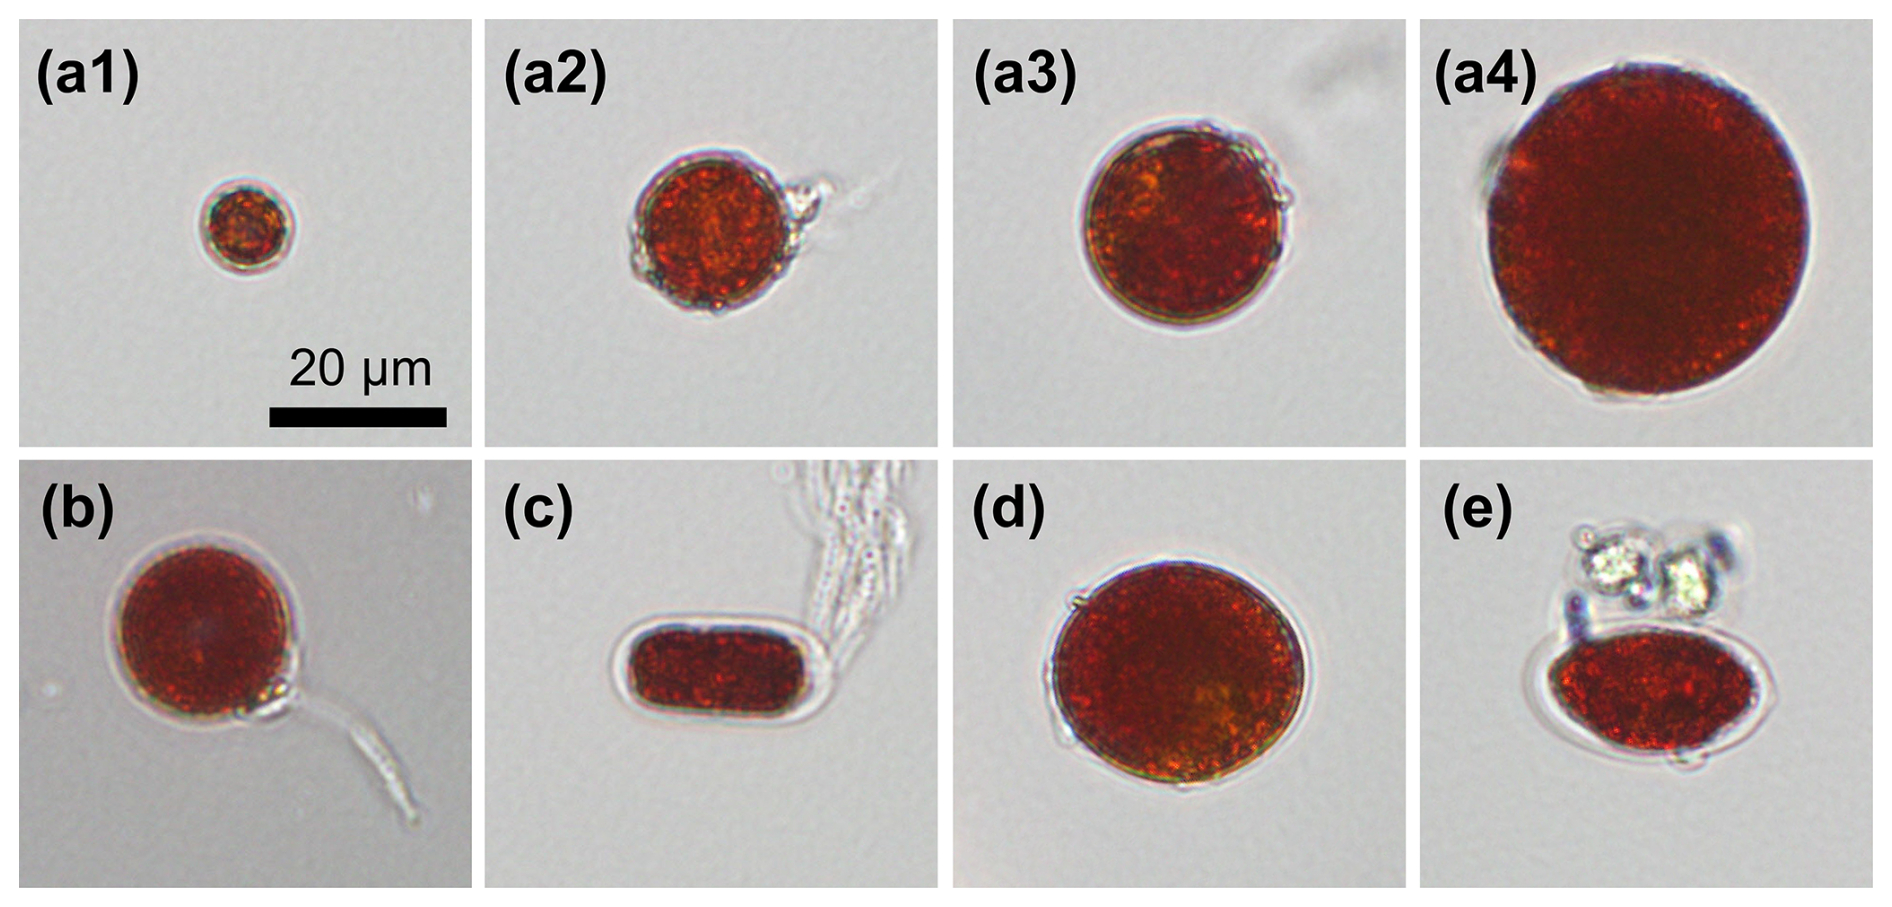
Figure 3Microphotographs of red snow algae observed in this study. (a1)–(a4) Spherical cells of different sizes. (b) Spherical cell with a stalk-like protrusion. (c) Elliptical cell. (d) Oval-shaped cell. (e) Oval-shaped cells with ribbed cell walls and non-spherical cells.
3.2 Distributions in snow algal assemblages on the snow surface
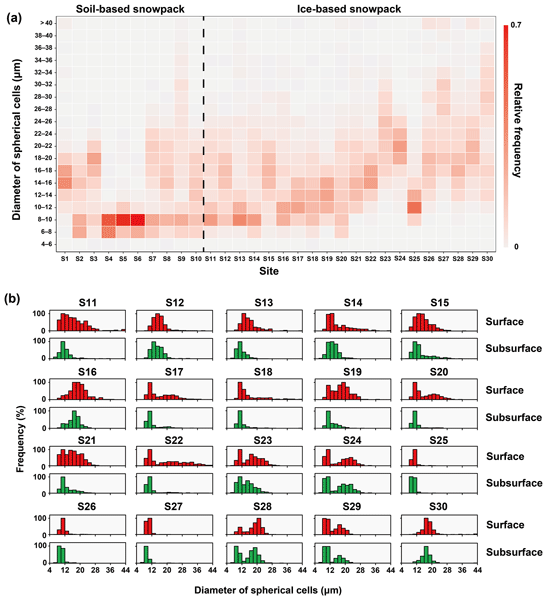
Algal abundances on the snow surface showed different spatial patterns between spherical and non-spherical morphotypes (Fig. 4). Spherical cells were observed across both ice-based and soil-based snowpack, and their mean concentrations were similar between the two environments (2.6 ± 1.1 × 10⁴ cells mL−1 in ice-based snowpack and 2.6 ± 1.4 × 10⁴ cells mL−1 in soil-based snowpack; Mann-Whitney U = 97, p = 0.912). By contrast, non-spherical cells were observed more consistently in soil-based snowpack and lower ice-based sites (S1–S20) than in upper ice-based sites (S21–S30). Among the non-spherical morphotypes, elliptical cells accounted for the majority of observed cells, and their mean concentration was significantly higher in soil-based snowpack (1.9 ± 1.3 × 10³ cells mL−1) than in ice-based snowpack (1.3 ± 1.9 × 10³ cells mL−1; U = 51, p = 0.033).
The size distribution of spherical cells also differed between the two underlying environments (Figs. 4, 5). In ice-based snowpack, mean size of spherical cell was 13.9 ± 2.5 µm, and most sites were dominated by cells with diameters of 8–12 µm, although an additional peak at 14–24 µm was observed at several sites. In soil-based snowpack, larger spherical cells were more frequent, with a mean size of 20.4 ± 3.7 µm. Size distributions there commonly showed peaks not only at 12–24 µm but also at larger diameters (28–40 µm). Consequently, mean size of spherical cell differed significantly between ice-based and soil-based snowpack (U = 18, p < 0.001).
3.3 Differences between surface and subsurface layers in algal abundance and size of spherical cell in the ice-based snowpack
Within ice-based snowpack, the contrast between the surface and subsurface varied along the glacier valley in a downstream-to-upstream direction (Fig. 4). At lower sites (S11–S19), spherical cell concentration was higher on the snow surface than in the subsurface, whereas at upper sites (S20–S30), concentrations were broadly similar between the two layers. Non-spherical cells were detectable in the subsurface at lower sites (S11–S20) but were rarely observed in the subsurface at upper sites (S21–S30), while surface concentrations remained higher overall. Despite these local differences, the overall difference in spherical cell concentration between the surface and subsurface was significant (Wilcoxon signed-rank test, V = 178, p = 0.007), and the difference for elliptical cells was also significant (V = 164, p < 0.001).
The direction of layer differences in spherical cell size was consistent with that in cell concentration (Figs. 4, 5). At lower to middle sites (S11–S23), spherical cells on the snow surface were consistently larger than those in the subsurface. In contrast, at upper sites (S24–S30), mean size of spherical cell was similar between the surface and subsurface. Overall, spherical cells were significantly larger on the snow surface than within the snowpack (V = 210, p < 0.001).
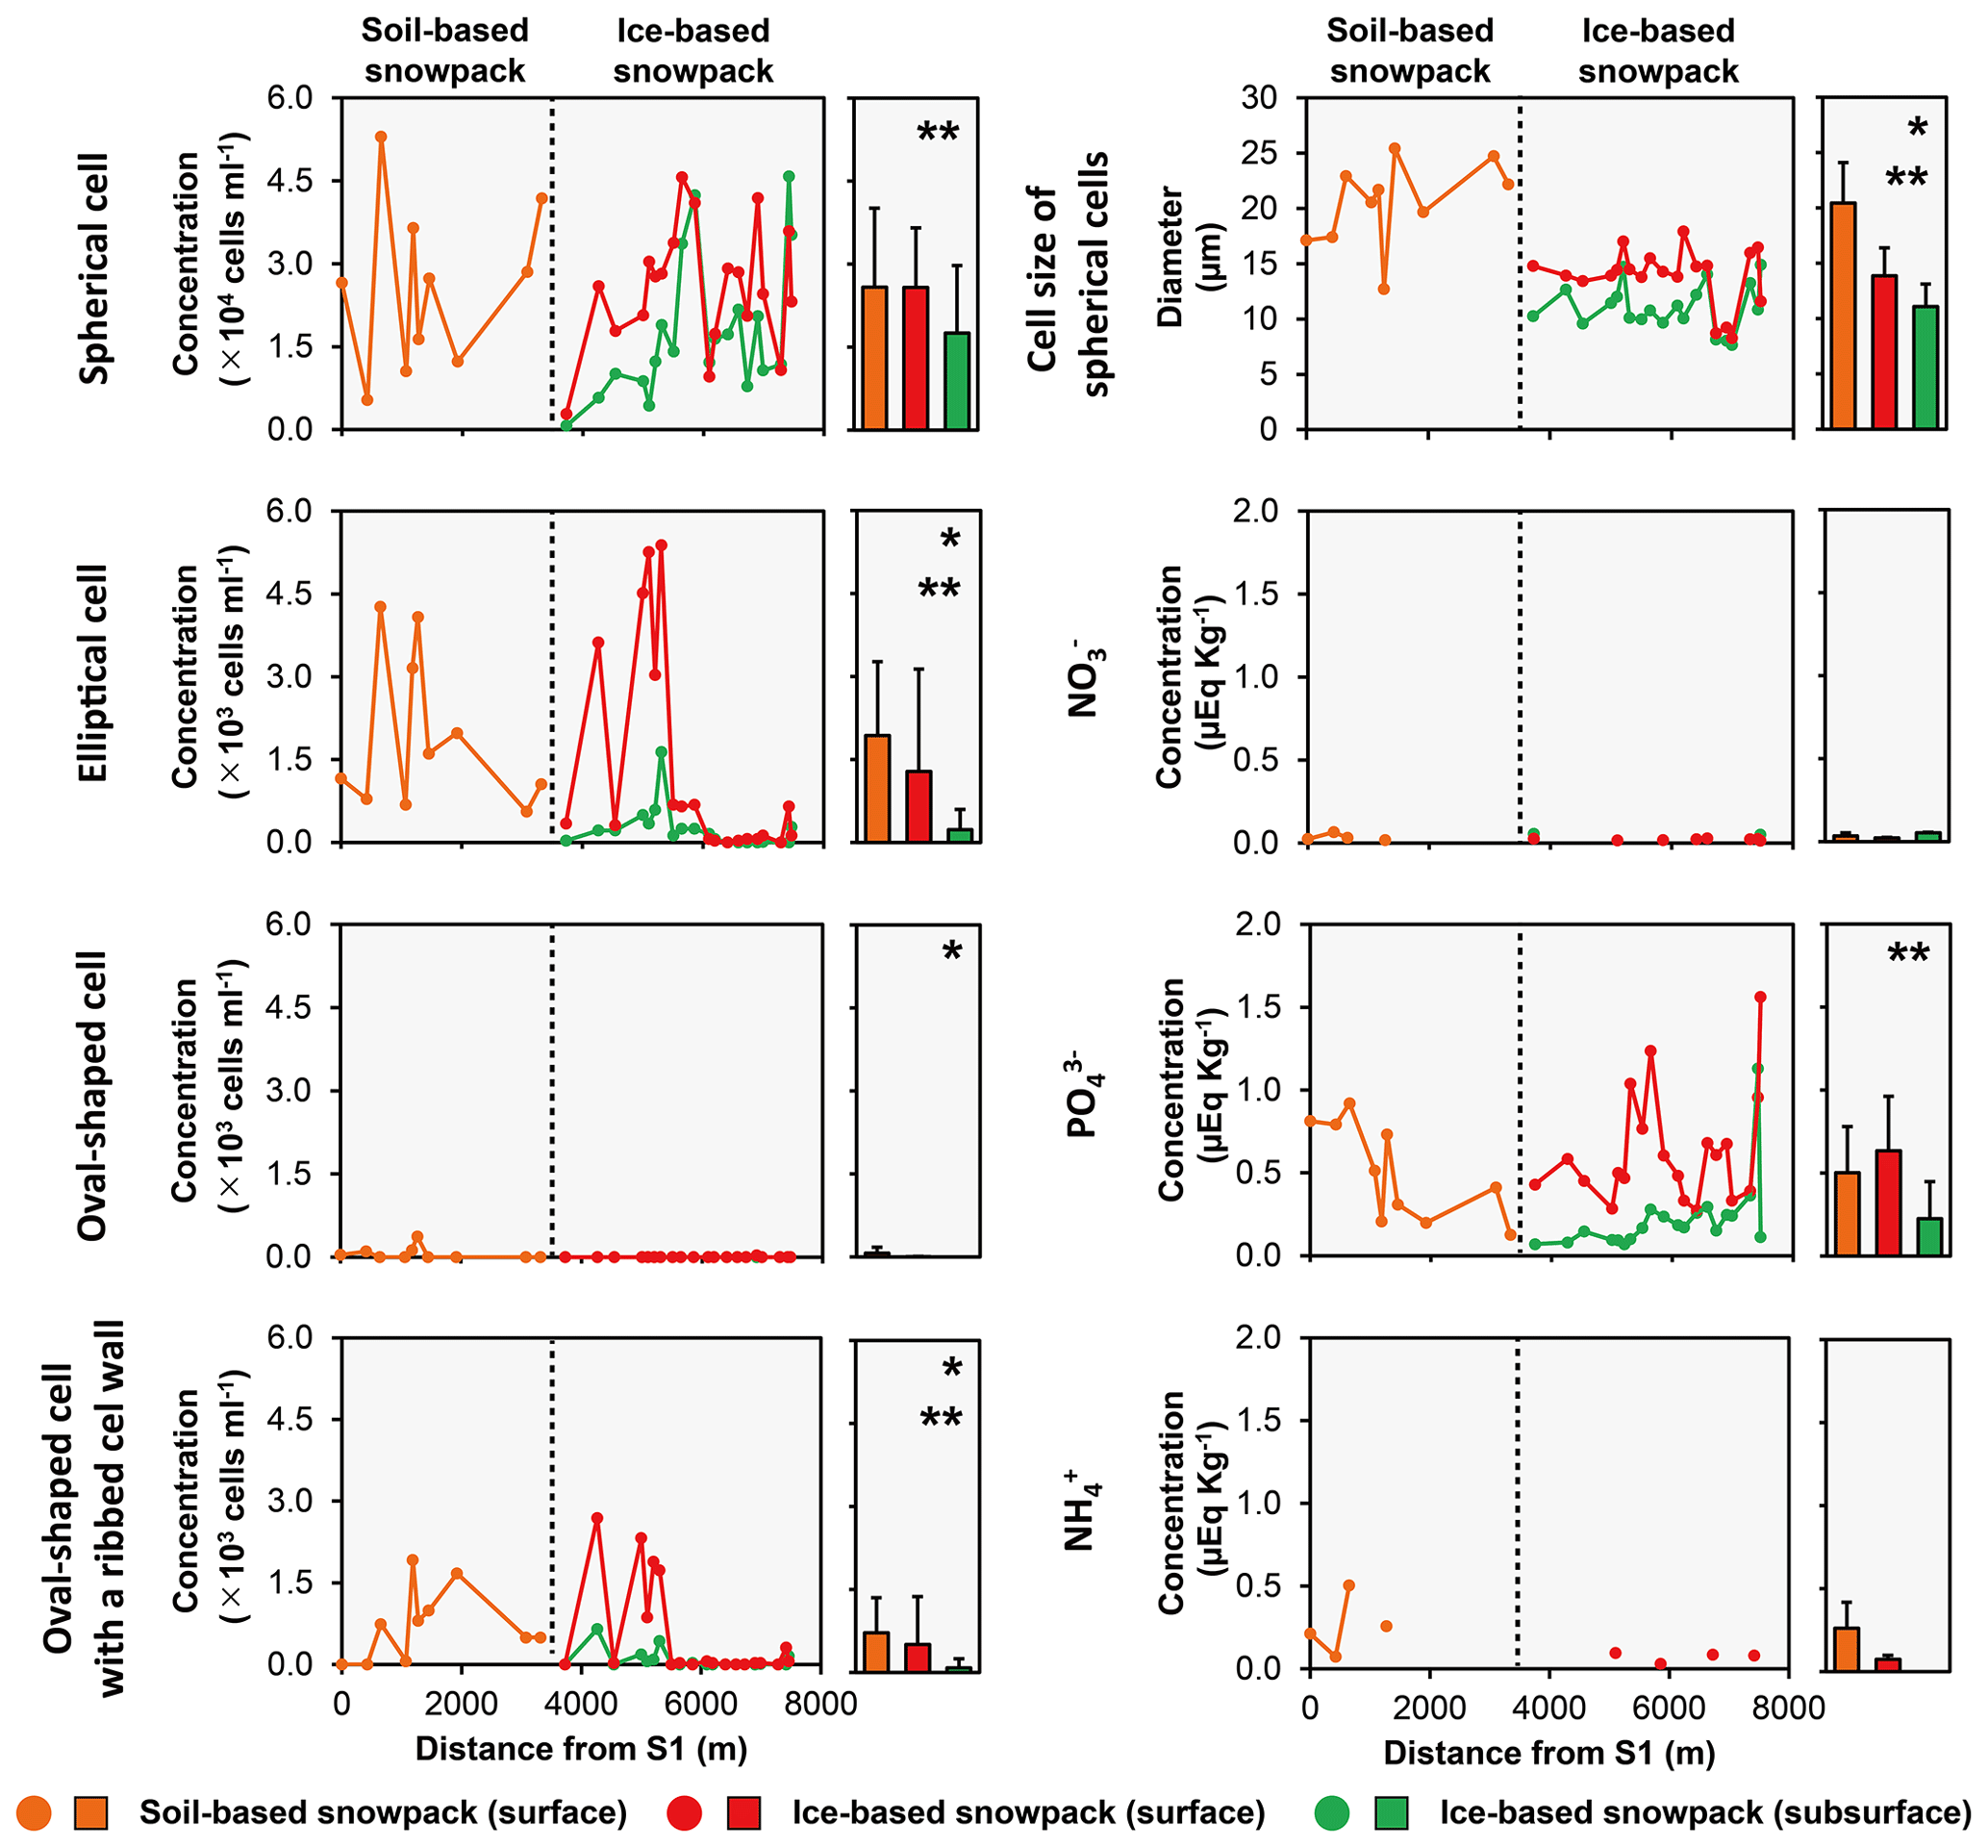
Figure 4Spatial variability of algal abundance, size of spherical cell, and nutrient concentrations. Spatial distributions are shown in the left panels, and comparisons among the ice-based snowpack (surface and subsurface) and the soil-based snowpack (snow surface) are shown in the right panels. * Indicates a significant difference between the ice-based snowpack and the soil-based snowpack (Mann-Whitney U-test, p < 0.05), and indicates a significant difference between the surface and subsurface within the ice-based snowpack (Wilcoxon signed-rank test, p < 0.05). NO and NH concentrations below the respective limits of detection were not plotted.
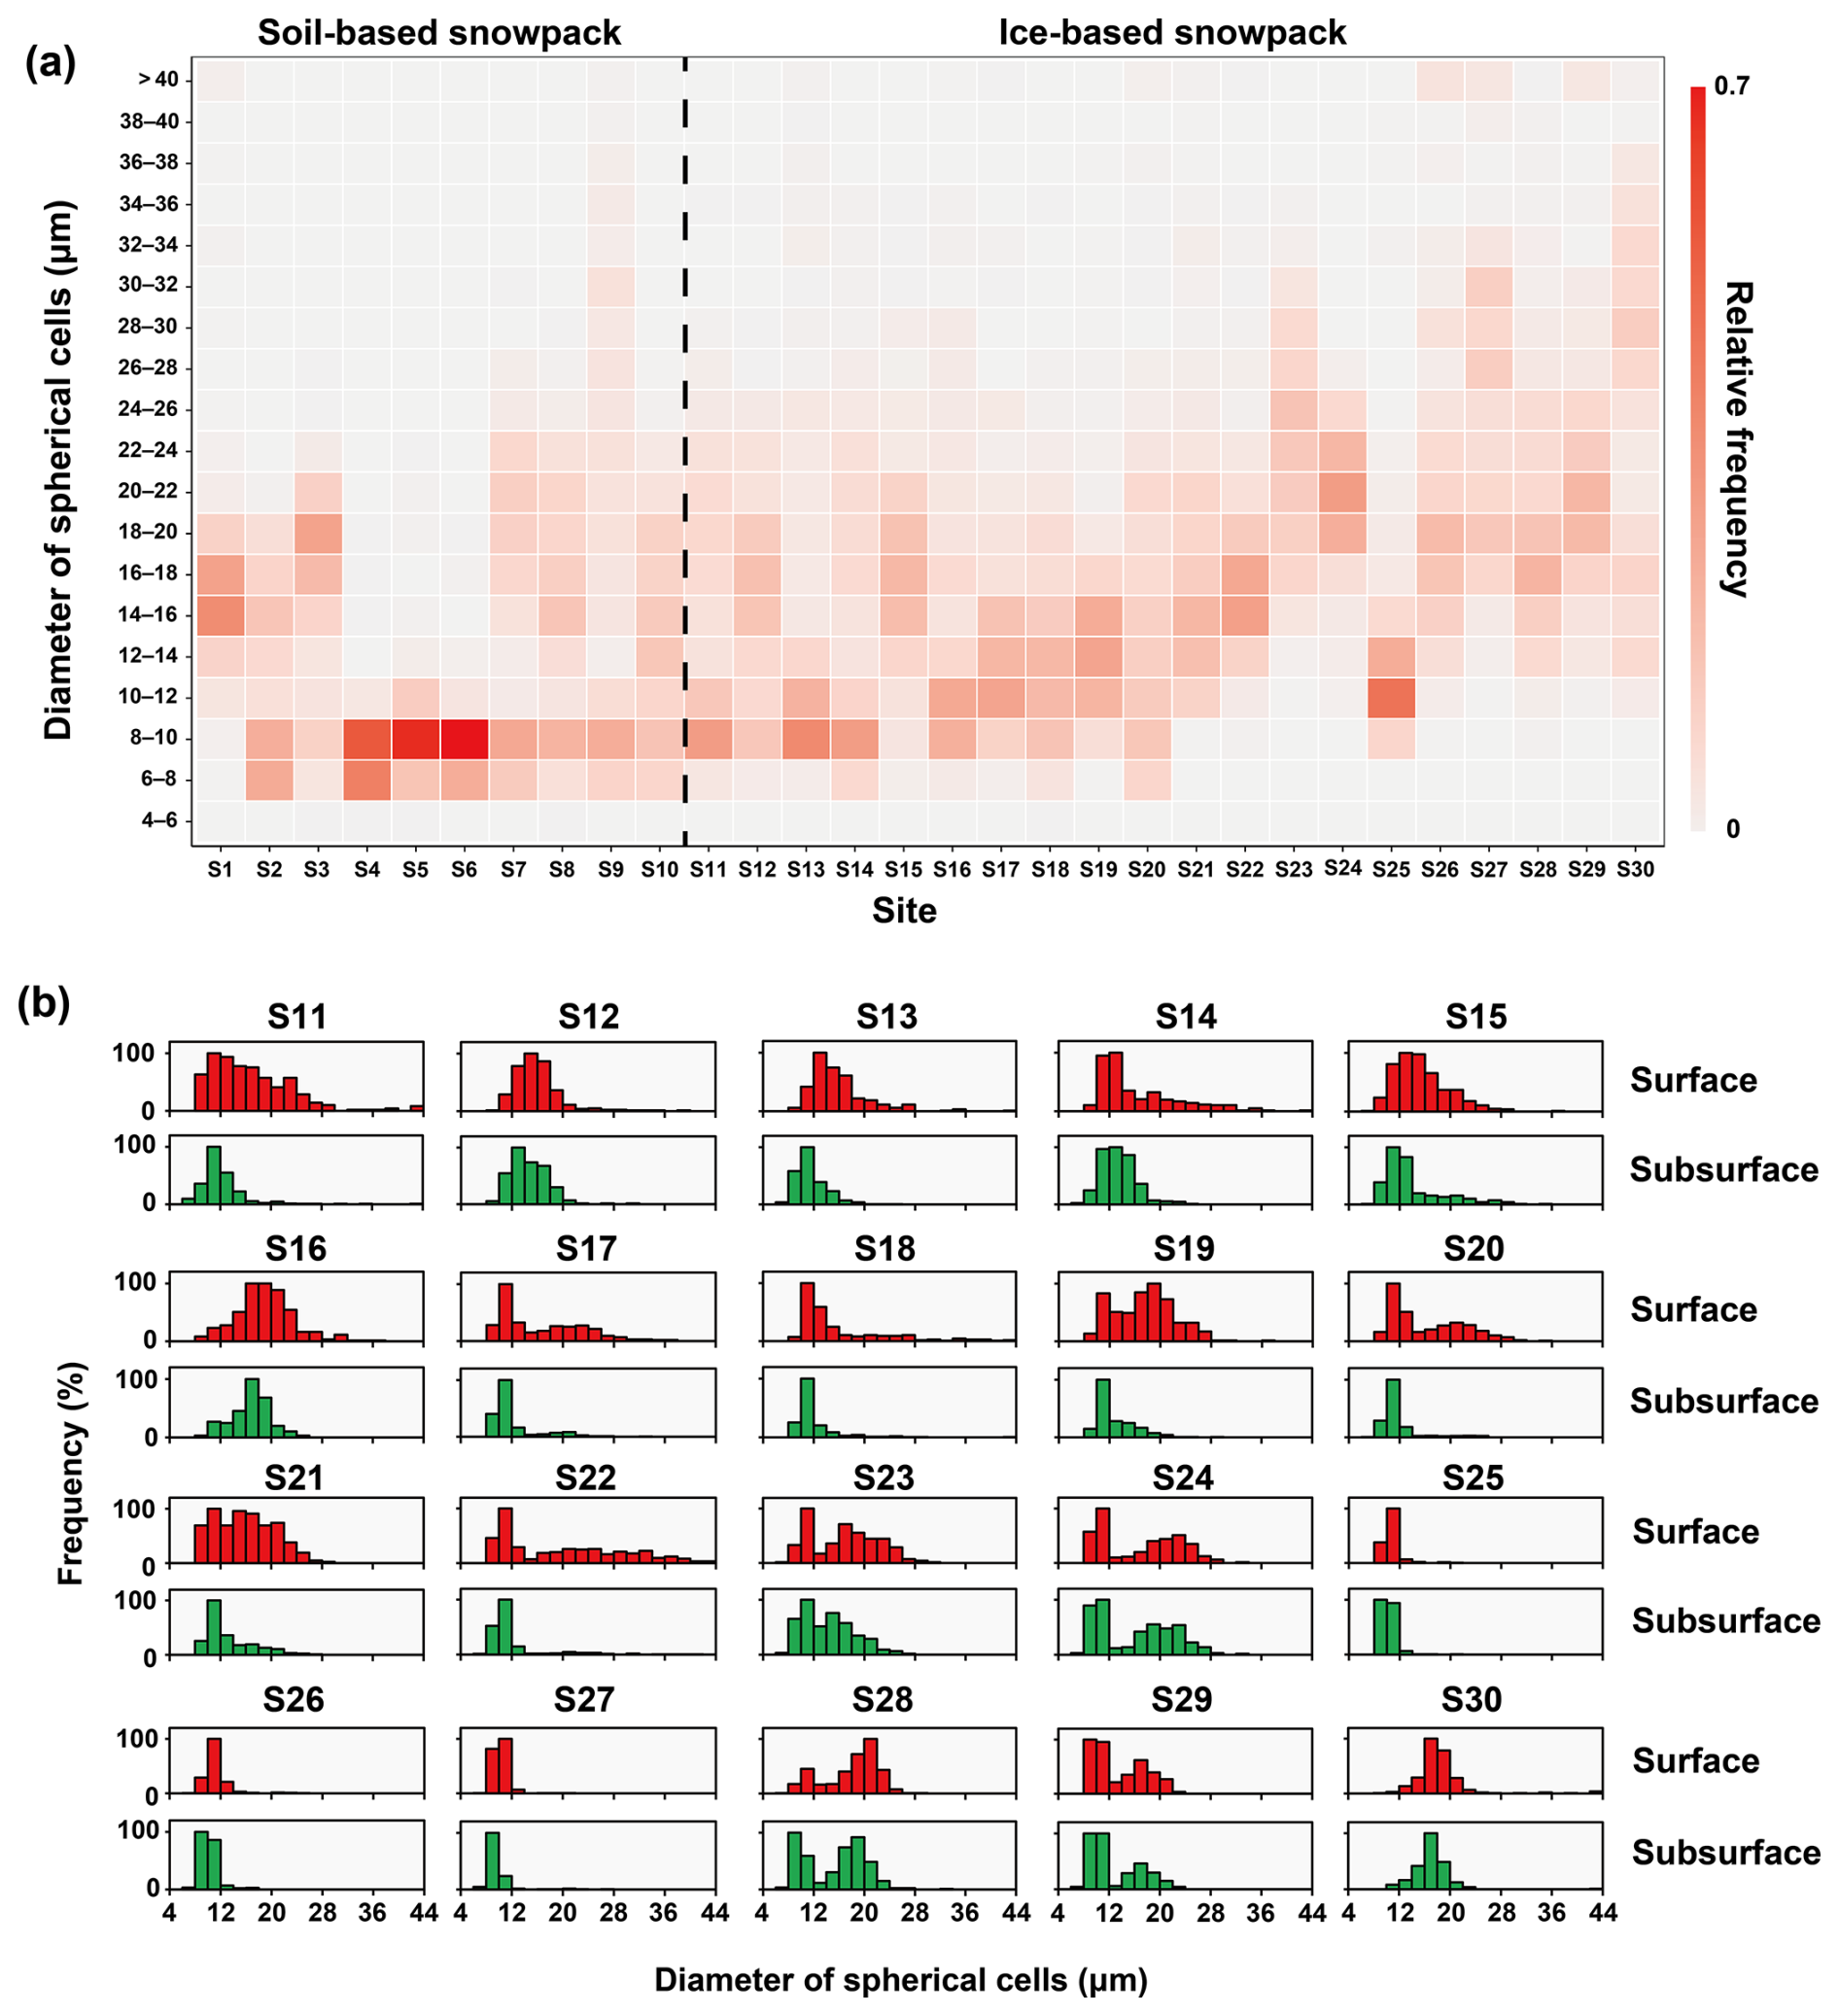
Figure 5Size distribution of spherical cells (a) Size distribution of spherical cells on the snow surface. (b) Histograms of size of spherical cells on the surface and subsurface within ice-based snowpack. Frequency is expressed as relative frequency, with the most frequently observed size class in each sample set normalized to 100 %.
3.4 Spatial variation in microbial community structure in 18S rRNA analysis
After quality filtering and chimera removal, a total of 386 368 high-quality 18S rRNA reads were obtained from the snow samples, with an average of 29 721 reads per sample. In red snow samples, mainly four phyla were abundant: Chlorophyte, Ascomycote, Basidiomycote, and Cercozoa (Figs. 6a, 7a).
The community structure of Chlorophyta associated with red snow varied systematically from downstream to upstream (Figs. 6b, c, 7b, c). In this study area, the Chlorophyta community was dominated by four genera: Sanguina, Rosetta, Chloromonas, and Raphidonema (Figs. 6b, 7b). Focusing on taxa potentially responsible for red pigmentation (Sanguina, Rosetta, and Chloromonas; Figs. 6c, 7c), clear spatial shifts in relative abundance were observed. In soil-based snowpack (S1, S4, S7, S9, S10), Sanguina accounted for 32 %–82 % of the community, while Rosetta and Chloromonas also contributed substantially (3 %–34 % and 4 %–22 %, respectively).
Within the ice-based snowpack, the subsurface snow exhibited an altitudinal pattern broadly similar to that observed in the surface snow. Chloromonas was more abundant in the lower part of the ice-based snowpack, whereas Sanguina remained dominant at upper sites.
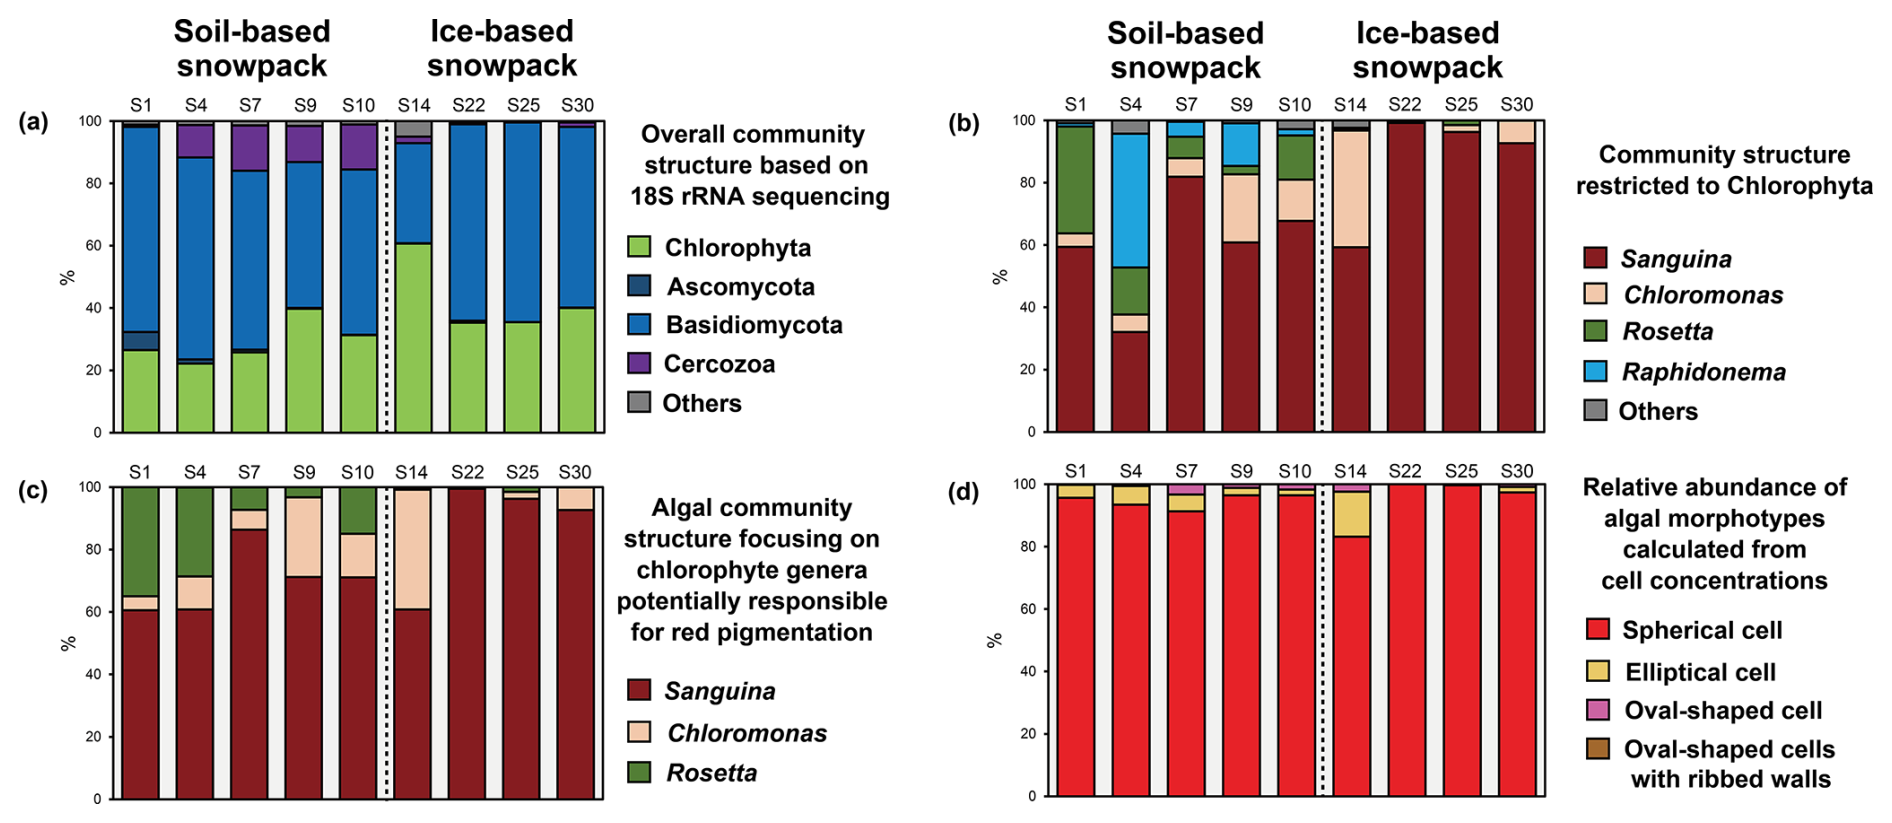
Figure 6Microbial community structure on the snow surface based on 18S rRNA gene sequencing and morphological observations. Community structure at each elevation is presented as stacked bar charts normalized to 100 %. For the molecular dataset, only phyla or genera accounting for > 5 % of the total reads were included in the analysis.
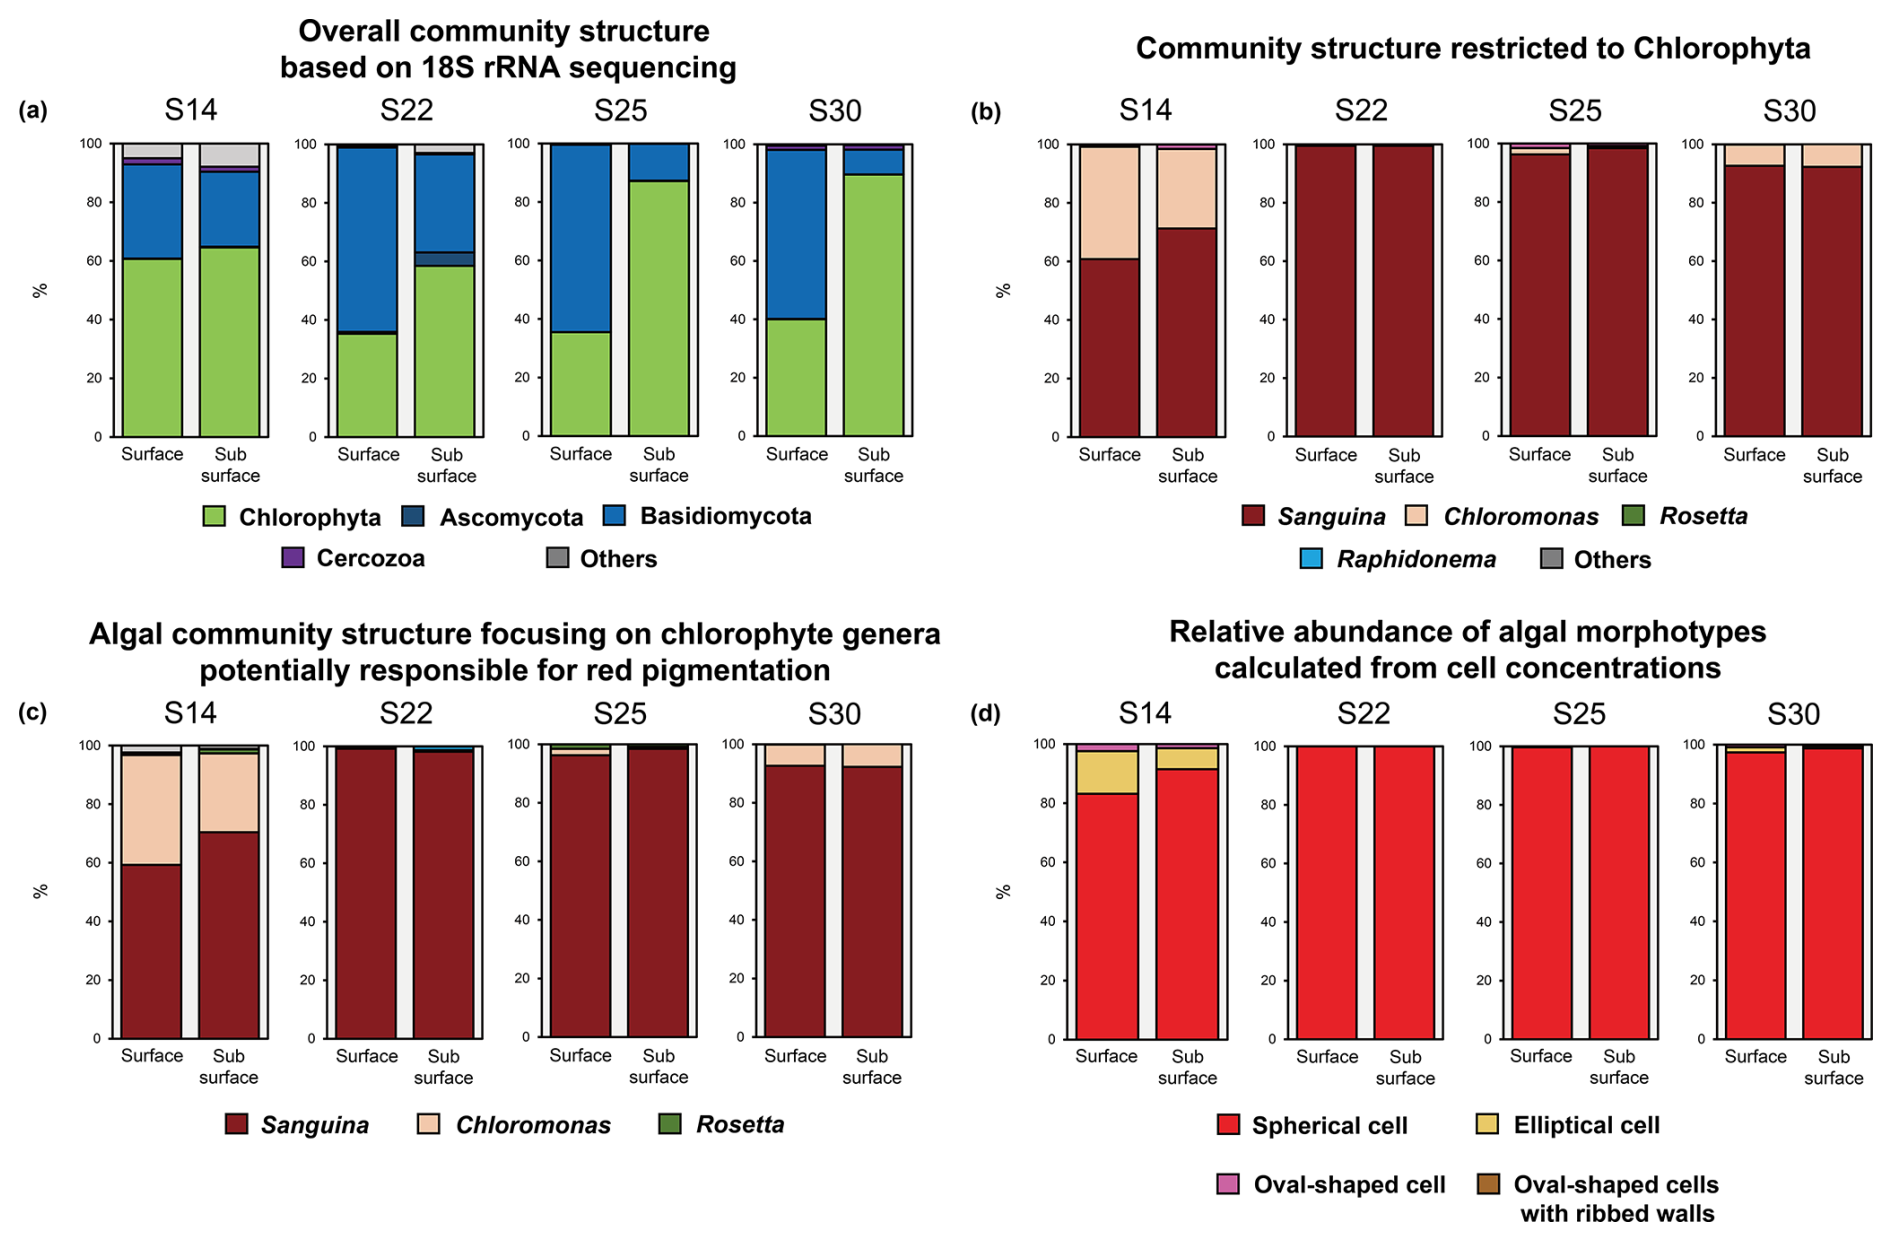
Figure 7Microbial community structure on the surface and subsurface in ice-based snowpack. Community structure is presented as stacked bar charts normalized to 100 % for each site, comparing the snow surface (left) and snow subsurface (right) across four sites. For the molecular dataset, only phyla or genera accounting for > 5 % of the total reads were included.
3.5 Spatial variability in nutrients in snowpacks
Among the soluble nutrients measured, PO was the only species consistently detected across all sites, while dissolved inorganic nitrogen (NO and NH) was extremely scarce (< 0.1 µEq kg−1) regardless of the underlying environment or depth (Fig. 4). The only exception was slightly elevated NH (0.2–0.5 µEq kg−1) found on the snow surface at a few downstream sites (S2, S3, and S5).
Regarding spatial distribution across the glacier, PO concentrations on the snow surface ranged from 0.1 to 1.6 µEq kg−1 and showed no significant difference between soil-based and ice-based snowpacks (U = 80, p = 0.391). However, within the ice-based snowpack, a distinct elevational trend was observed: PO levels were significantly higher at the upper sites (S18–S30; 0.1–1.1 µEq kg−1) compared to the lower and middle sites (S11–S17; ≤ 0.1 µEq kg−1).
Comparisons between surface and subsurface in the ice-based snowpack revealed that nutrient availability was predominantly higher at the surface. Across all ice-based sites, surface PO concentrations were significantly higher than those in the subsurface, averaging 4.3 ± 3.3 times greater (V = 210, p < 0.001). Inorganic nitrogen followed a pattern similar to that of the snow surface, with subsurface concentrations remaining below 0.1 µEq kg−1 across all sampling sites.
3.6 Environmental factors associated with algal morphology and community structure
Linear models showed that spherical cell size at the snow surface decreased significantly with elevation (t26 = −2.62, p = 0.014), whereas non-spherical cell abundance decreased significantly with snow depth (t26 = −2.56, p = 0.017; Table 1). None of the examined environmental variables was significantly associated with spherical cell abundance at the surface. In the subsurface, snow depth was negatively associated with non-spherical cell abundance (t16 = −2.71, p = 0.016), elevation was positively associated with spherical cell abundance (t16 = 2.53, p = 0.022), and nutrient concentration was negatively associated with non-spherical cell abundance (t16 = −2.31, p = 0.035). Inspection of residual diagnostic plots did not indicate substantial violations for the main surface-snow models, although several potentially influential observations were identified. Sensitivity analyses excluding these observations did not alter the principal results for the surface models, including the negative association between non-spherical cell abundance and snow depth. Some associations in the subsurface models were more sensitive to influential observations and were therefore interpreted cautiously.
RDA explained 72.2 % of the total variation in algal community composition (adjusted R2 = 0.555, Fig. 8), and the overall constrained model was significant (F3,5 = 4.32, p = 0.009). Among the constrained axes, RDA1 was significant (F1,5 = 9.41, p = 0.009), whereas RDA2 (F1,5 = 3.53, p = 0.187) was not significant. Sequential permutation tests showed significant effects of snow depth (F1,5 = 6.24, p = 0.009) and elevation (F1,5 = 6.61, p = 0.006), whereas nutrients were not significant (F1,5 = 0.12, p = 0.907).
Table 1Results of linear models examining the relationships between environmental variables and, spherical cell concentration, non-spherical cell concentration, and size of spherical cell in (a) snow surface and (b) subsurface. Bold values indicate statistically significant predictors (p < 0.05).
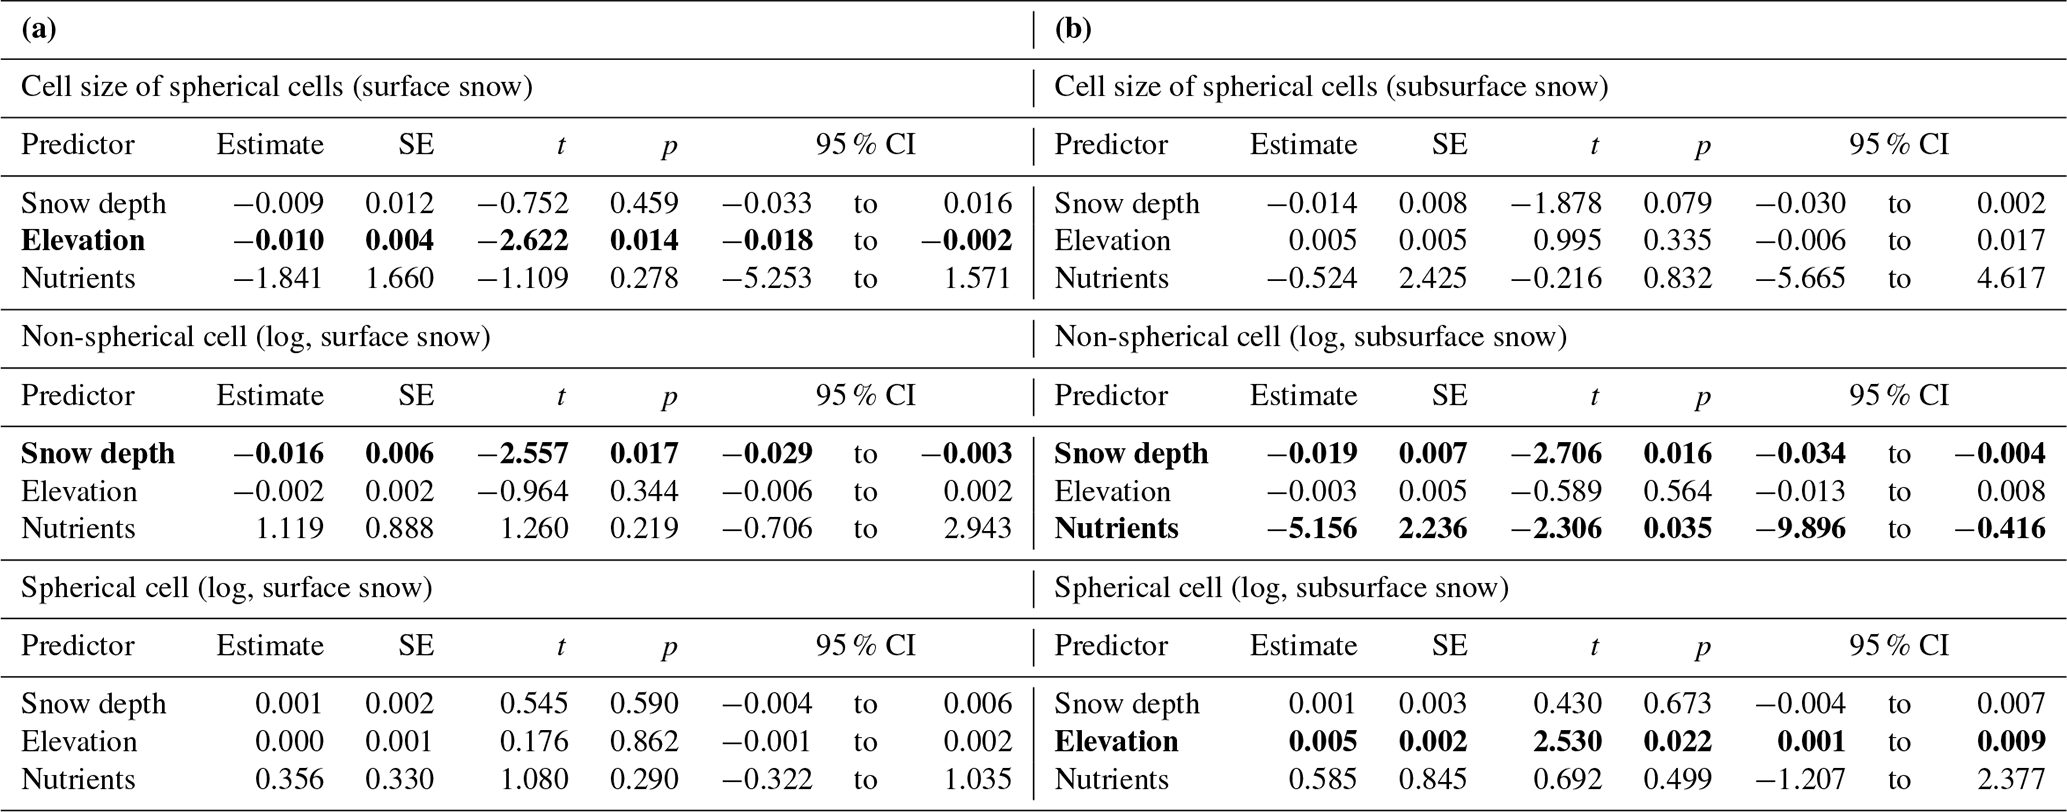
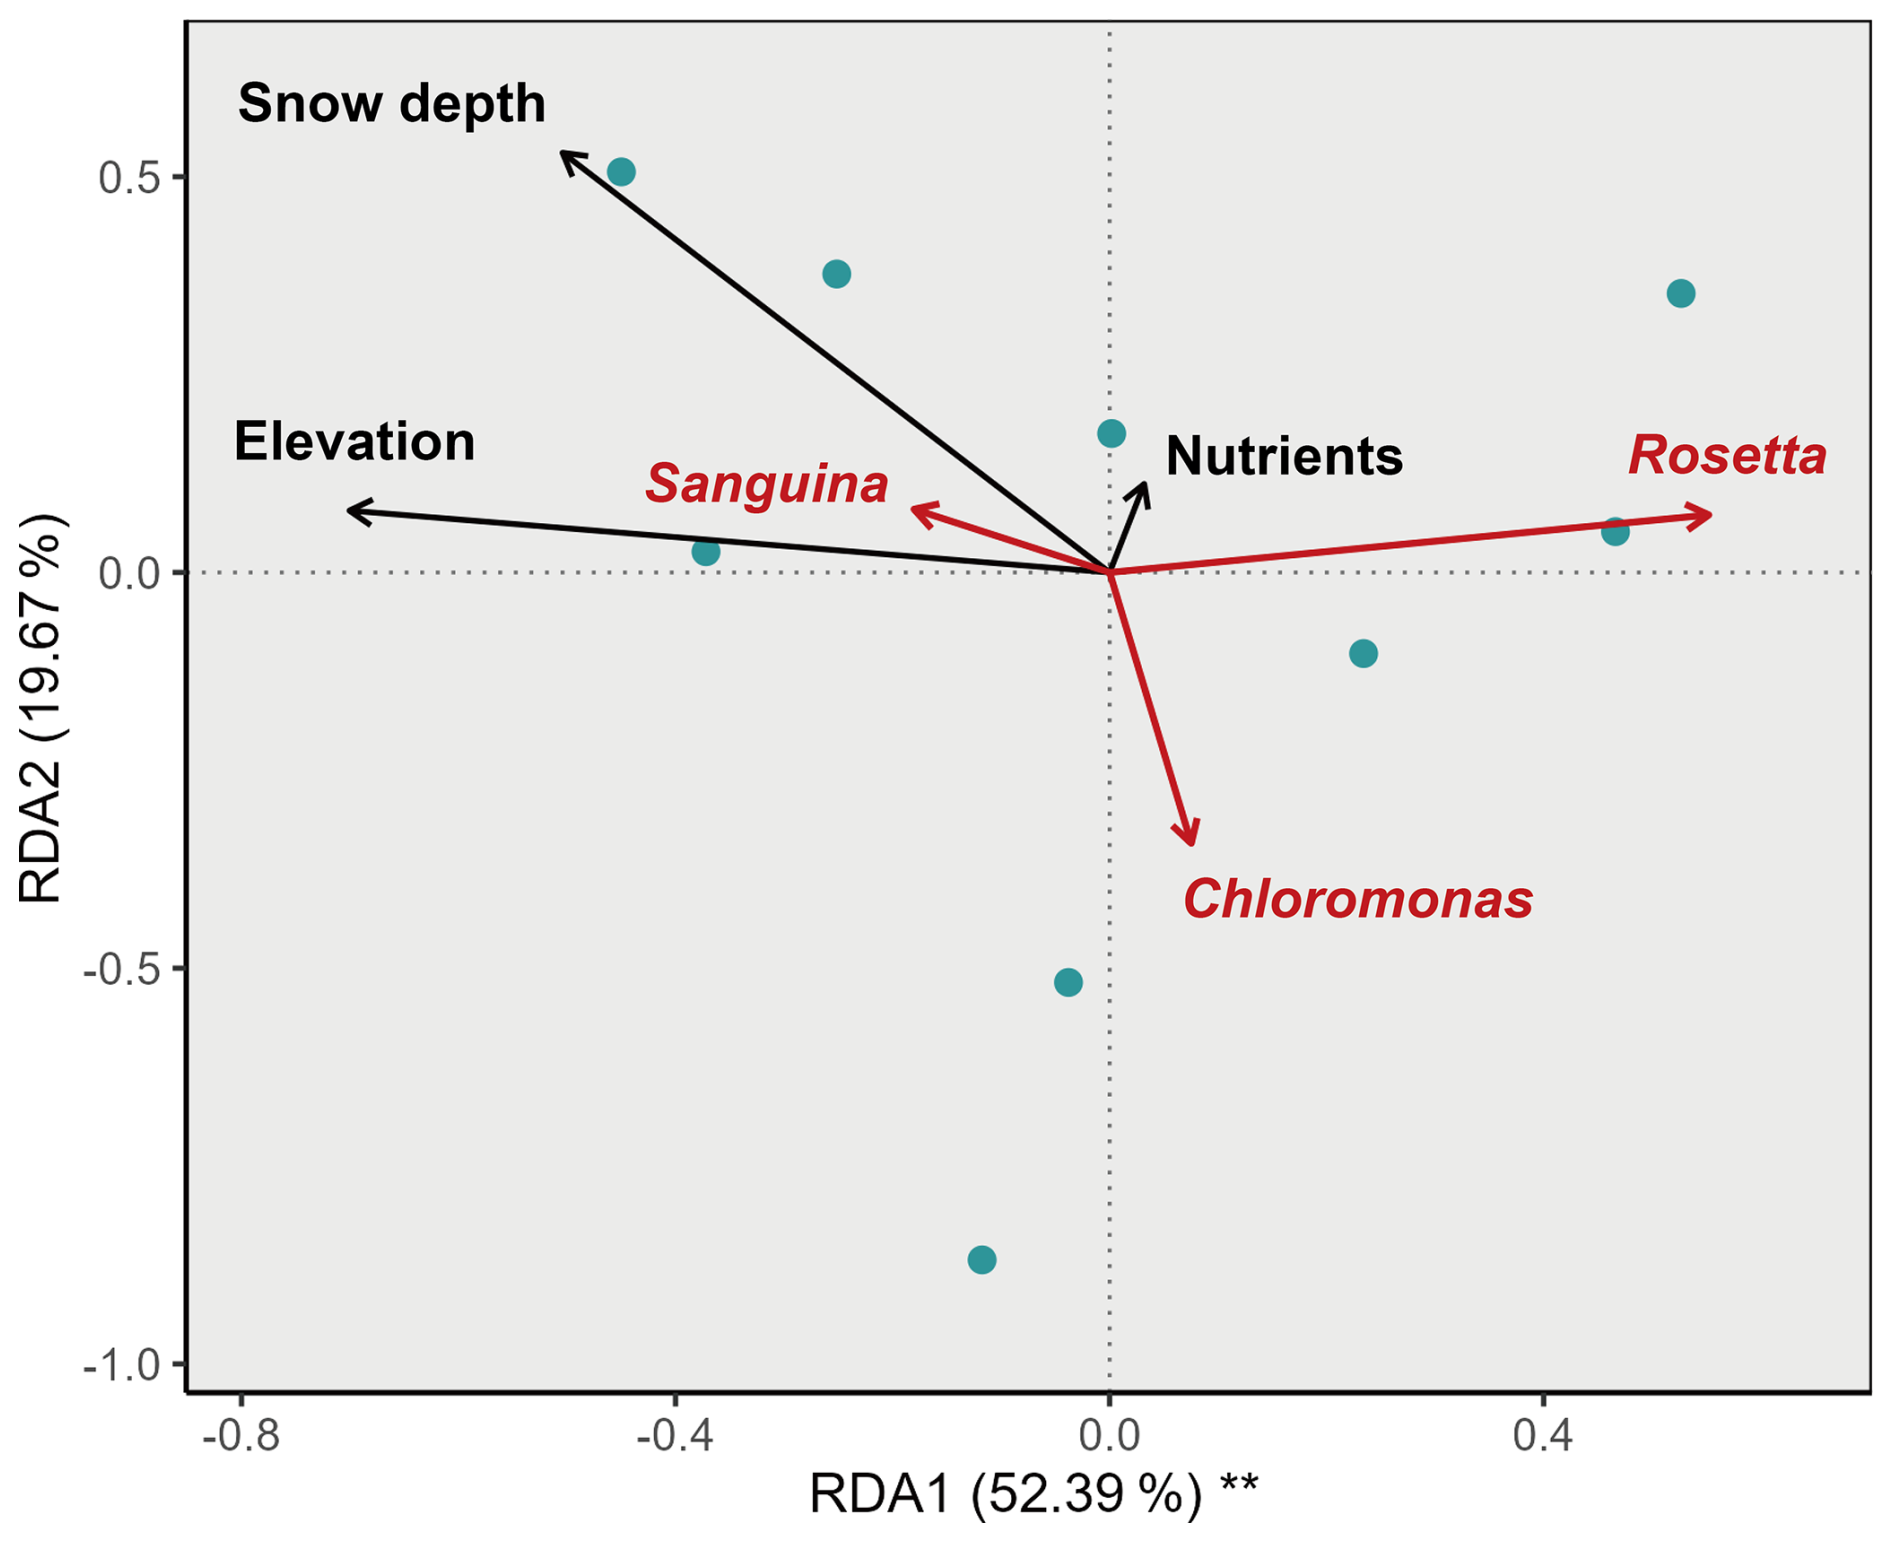
Figure 8Redundancy analysis (RDA) correlation biplot of algal community composition based on Hellinger-transformed relative abundance data. Blue points indicate sampling sites. Black arrows indicate environmental variables included in the RDA, and red arrows indicate the directions of algal taxa in the ordination space. Percentages on the axes represent the proportion of total variance explained by each constrained axis. Asterisks indicate the significance of each axis based on permutation tests ( p < 0.01).
4.1 Relationship between morphotypes assemblages and algal community structure
The combined morphological observations and molecular analyses show that morphotype assemblages in red snow are partially consistent with 18S rRNA-based algal community structure, but the strength of this correspondence differs among morphotypes. Across the glacier valley, Chloromonas and Rosetta were relatively abundant at the soil-based site and the lower ice-based site, including S14 (Fig. 6c). These sites also showed a higher proportion of non-spherical cells in the morphotype data (Fig. 6d). In contrast, Sanguina dominated at the upper ice-based sites, where spherical cells accounted for a greater proportion of the algal community (Fig. 6c, d). At the same time, the comparison between microscopy and molecular analysis reveals an important mismatch between morphology and taxonomy. At several sites, spherical cells remained the dominant morphotype even when the algal community included substantial contributions from Chloromonas and Rosetta (Figs. 6c, d, 7c, d). This indicates that the spherical morphotype is taxonomically heterogeneous and cannot be interpreted as a single lineage. Sanguina nivaloides is typically observed as spherical cells during blooms and is widely distributed across polar and alpine snowpacks (Segawa et al., 2018; Procházková et al., 2019). In contrast, Chloromonas and Rosetta include multiple cell forms, including spherical or nearly spherical stages depending on species and life stage (Novakovskaya et al., 2018; Engstrom et al., 2024; Procházková et al., 2024).
This mismatch is important for interpreting spatial variability in red snow. Morphological observations are useful for describing visible morphotype assemblages, whereas 18S rRNA-based analyses are required to resolve which taxa contribute to those assemblages. In the present study, the clearest example is the spherical morphotype, which includes both Sanguina-rich assemblages and mixed assemblages containing greater contributions from Chloromonas and Rosetta. Accordingly, shifts in morphology should be interpreted together with taxonomic data rather than as direct proxies for species composition. The individual non-spherical morphotypes occurred at low abundance and were therefore pooled for the broad compositional comparison. However, this pooled category should not be interpreted as a single taxonomic or functional group. Morphologically similar snow algae may comprise genetically distinct lineages with different ecological characteristics (Remias et al., 2023), and pooling the non-spherical morphotypes may therefore obscure taxon-specific distribution patterns.
4.2 Factors controlling algal community structure along the glacier valley
The RDA indicated that spatial variation in algal community structure was associated primarily with snow depth and elevation rather than nutrient concentration (Fig. 8). Elevation likely represents a gradient in the timing and duration of snowmelt along the valley. In the present dataset, soil-based and lower ice-based sites contained higher relative abundances of Chloromonas and Rosetta, whereas upper ice-based sites were strongly dominated by Sanguina. A similar explanation has been proposed for Gulkana Glacier, where snow algal species distributions varied with altitude and presumably with melt progression (Takeuchi, 2001, 2013). Because Sanguina is a widespread constituent of red snow communities and can colonize melting snow surfaces broadly across alpine and polar environments (Segawa et al., 2018; Procházková et al., 2019; Hoham and Remias, 2020), its dominance at higher-elevation sites may reflect earlier-stage or less-developed habitats along the seasonal melt gradient.
Snow depth provides a second key control because it governs connectivity between the illuminated snow surface and potential local cell reservoirs below. Snow depth is often related to elevation, with lower-elevation sites typically exhibiting shallower snowpacks due to enhanced melt and longer exposure periods (Anderton et al., 2004; Clark et al., 2011). In our study, such a relationship was partially observed within the ice-based snowpack (e.g., S18–S26, Fig. 1c), where snow depth decreased with decreasing elevation. However, this pattern was not consistent across all sites, indicating that local variability in snow accumulation and melt conditions can decouple snow depth from elevation. These results suggest that snow depth acts as an additional control that cannot be fully explained by elevation alone. Recent experimental work on the Harding Icefield showed that red snow blooms can be strongly influenced by the resurfacing of algal cells from subsurface snow and firn, rather than by passive atmospheric deposition alone (Rea and Dial, 2024). Likewise, life-cycle syntheses for snow algae indicate that cells retained deeper in snow or at the snow-substrate interface can become available as snowmelt progresses (Hoham and Duval, 2001; Matsumoto et al., 2024). Within this framework, shallower or more melted snowpacks at soil-based and lower ice-based sites may more readily connect the snow surface with subsurface or boundary-associated sources, whereas deeper snowpacks at upper sites may delay upward supply from local reservoirs. This is consistent with our vertical sampling, which showed stronger surface-subsurface contrasts at lower ice-based sites than at upper sites.
Nutrients, by contrast, did not show a significant independent effect in the RDA, and dissolved inorganic nitrogen was rarely detected at most sites. This suggests that the broad spatial turnover in algal community structure was not primarily determined by concentrations of dissolved NO and NH at the time of sampling. However, nutrient availability may still influence local algal growth once cells reach the snow surface (Almela et al., 2024). PO was consistently detected and was higher on the snow surface than in the subsurface, indicating that nutrient conditions differ vertically within the snowpack, but those differences were secondary to elevation and snow depth in explaining among-site community variation.
The substrate under the snowpacks (i.e. ice or soil) also appears to matter, although it is partly intertwined with snow depth and melt stage. Soil-based snowpack in downstream contained more non-spherical cells, larger spherical cells, and more mixed taxonomic communities than ice-based snowpack (Fig. 4). This pattern is consistent with the idea that the environment beneath the snow influences which local source populations can enter the snowpack during melt. In soil-based snowpack, the snow-ground interface may provide an additional reservoir of locally retained cells and cysts, as proposed for snow algae associated with terrestrial substrates and snow-ground boundaries (Hoham and Duval, 2001; Matsumoto et al., 2024). In ice-based snowpack, by contrast, likely source environments include retained cells in subsurface snow, firn, or the glacier surface (Hoham and Duval, 2001). Direct source tracing was beyond the scope of this study, so we cannot conclude whether substrate type itself or the shallower, more melt-advanced conditions of downstream snowpack are the dominant cause. Nevertheless, the observed differences indicate that whether the snow overlies ice or soil is not neutral for red snow community development.
4.3 Factors controlling size of spherical cell and interpretation of the spherical morphotype
The microscopic and molecular analysis results show that the spherical morphotype includes multiple taxa, suggesting that variation in size of spherical cell cannot be attributed solely to life-cycle progression within a single species. Instead, the observed size distribution (Fig. 5) likely reflects two overlapping processes: changes in the taxonomic composition contained within the spherical cells and size variation within taxa across life stages and environmental conditions. This means a shift toward larger spherical cells at a site does not necessarily indicate only growth or maturation of Sanguina; it may also reflect increasing contributions of other taxa that are included within the spherical morphotype.
Even so, the observed environmental pattern in spherical cell size suggests that within-taxon variation may also contribute. Spherical cells were larger in soil-based snowpack and at the snow surface, and elevation was a significant predictor at the surface (Table 1). If elevation reflects melt timing, this pattern is consistent with progressive cell enlargement during melt, as reported for Sanguina nivaloides (Remias et al., 2005; Procházková et al., 2019).
Cell size is also important because it can influence the albedo effect of red snow blooms. Larger spherical cells generally contain more pigment per cell and may therefore contribute more strongly to snow darkening where they occur at high abundance (Halbach et al., 2022; Chevrollier et al., 2023). The observed tendency for larger cells in the soil-based snowpack and at the surface suggests that the radiative impact of blooms varies spatially along the glacier valley. Specifically, the presence of larger cells, combined with high cell abundance, likely exacerbates albedo reduction, as larger and more pigmented cells can enhance bulk light absorption, given that algal optical properties depend on cell size, pigmentation, and intracellular light scattering (Cook et al., 2020; Halbach et al., 2022). Consequently, the soil-based snowpack at lower elevations may experience more pronounced biological snowmelt than the ice-based snowpack due to this shift in cell size structure.
4.4 Vertical distribution of red snow algae within the snowpack and its implications for bloom development
The vertical distribution of red snow algae suggests that their populations are not restricted to the snow surface but can persist within the underlying snowpack. The observed variation in surface–subsurface differentiation along the elevational gradient may reflect progressive redistribution of algal cells during snowmelt. As melting proceeds at lower elevations, algae initially distributed within the snowpack may become concentrated toward the surface, while cells remaining below the surface may provide a persistent reservoir that contributes to subsequent bloom development (Ono et al., 2025).
The taxonomic composition also differed between the surface and subsurface layers. Although Sanguina was detected in both layers, the relative abundance of Chloromonas was higher at the surface. This pattern indicates taxonomic differentiation between layers but does not identify the mechanism responsible for the observed distribution. The red spherical cells associated with Sanguina represent non-motile cyst stages (Procházková et al., 2019; Hoham and Remias, 2020), making short-term active migration during sampling unlikely. However, motile stages of other taxa, passive redistribution with meltwater, and environmental conditions preceding sampling may have contributed to the vertical distributions. Although solar radiation, a critical factor shaping vertical microhabitats, was not directly measured during the sampling period and should therefore be considered when interpreting the vertical patterns, our findings suggest that vertical positioning is influenced by both physical transport and taxon-specific traits.
Overall, these results underscore that the subsurface snowpack serves as an essential, persistent seed bank that feeds surface blooms as snowmelt progresses. Because surface-only observations risk underestimating total algal biomass and missing early-stage dynamics, incorporating subsurface biomass reservoirs into spatial models will be crucial for accurately predicting future red snow blooms and their feedback on glacier albedo.
In this study, combined morphological observations and molecular analyses showed that red snow varies systematically along a glacial valley in Alaska in both morphotype assemblage and algal community structure. Redundancy analysis demonstrated that this spatial variability was explained primarily by snow depth and elevation, whereas nutrients did not show a significant independent effect. These results indicate that community turnover along the valley is governed mainly by a snowmelt-driven environmental gradient, with soil-based and lower ice-based sites representing relatively more melted habitats that favor mixed communities with greater contributions from Chloromonas and Rosetta, whereas deeper and higher-elevation snowpacks in the upper ice-based sites represent relatively less-developed habitats. At the same time, differences in community structure and size of spherical cells between ice-based and soil-based snowpack suggest that the environment beneath the snow also contributes to community development, most likely because melt progression changes how readily locally retained cells at subsurface or snow-substrate boundaries can reach the snow surface. We also found that spherical cells were taxonomically heterogeneous, indicating that morphology alone can obscure community shifts, and that bloom development involves vertical redistribution within the snowpack rather than only processes at the visible surface. Together, these results provide a framework for understanding red snow heterogeneity as the outcome of snowmelt progression, source-environment differences beneath the snow, and vertical development within the snowpack.
Source data for all figures are available through the UTokyo Repository (https://doi.org/10.82337/1000017, Ono, 2026). No custom code or algorithms were generated during the current study.
Sampling for research: MO, TS, RA; manuscript conception: MO and NT; microscopy: MO; DNA analysis: KK, JU; chemical analysis: MO; and statistical analysis: MO. All authors have edited and reviewed the manuscript.
The contact author has declared that none of the authors has any competing interests.
Publisher's note: Copernicus Publications remains neutral with regard to jurisdictional claims made in the text, published maps, institutional affiliations, or any other geographical representation in this paper. The authors bear the ultimate responsibility for providing appropriate place names. Views expressed in the text are those of the authors and do not necessarily reflect the views of the publisher.
This article is part of the special issue “Cryospheric ecosystems: climate feedback loops, threatened ecosystems, and consequences of climate change”. It is not associated with a conference.
We sincerely thank Roman Dial and Peggy Dial for their invaluable support during our stay in Alaska. Generative AI tools were used for English language refinement during manuscript preparation. All scientific interpretations and conclusions were made by the authors.
This research has been supported by JSPS KAKENHI (grant nos. 19H01143, 20K21840, 20H00196, 21H03612, 22J11017, 22KJ0471, 24H00260, 24KJ0118, and 25K21373) and the Arctic Challenge for Sustainability II (ArCS II, Program grant no. JPMXD1420318865).
This paper was edited by Roberto Ambrosini and reviewed by two anonymous referees.
Almela, P., Elser, J. J., Giersch, J. J., Hotaling, S., Rebbeck, V., and Hamilton, T. L.: Laboratory experiments suggest a limited impact of increased nitrogen deposition on snow algae blooms, Environ. Microbiol. Rep., 16, e70052, https://doi.org/10.1111/1758-2229.70052, 2024.
Almela, P., Elser, J. J., Giersch, J. J., Hotaling, S., and Hamilton, T. L.: Influence of snow cover on albedo reduction by snow algae, mBio, 16, e03630-24, https://doi.org/10.1128/mbio.03630-24, 2025.
Anderton, S. P., White, S. M., and Alvera, B.: Evaluation of spatial variability in snow water equivalent for a high mountain catchment, Hydrol. Process., 18, 435–453, https://doi.org/10.1002/hyp.1319, 2004.
Barnett, D., Arts, I., and Penders, J.: microViz: an R package for microbiome data visualization and statistics, J. Open Sour. Softw., 6, 3201, https://doi.org/10.21105/joss.03201, 2021.
Callahan, B.: Silva Taxonomic Training Data Formatted For Dada2 (Silva Version 132), Zenodo, https://doi.org/10.5281/ZENODO.1172783, 2018.
Callahan, B. J., McMurdie, P. J., Rosen, M. J., Han, A. W., Johnson, A. J. A., and Holmes, S. P.: DADA2: High-resolution sample inference from Illumina amplicon data, Nat. Methods, 13, 581–583, https://doi.org/10.1038/nmeth.3869, 2016.
Cheung, M. K., Au, C. H., Chu, K. H., Kwan, H. S., and Wong, C. K.: Composition and genetic diversity of picoeukaryotes in subtropical coastal waters as revealed by 454 pyrosequencing, ISME J., 4, 1053–1059, https://doi.org/10.1038/ismej.2010.26, 2010.
Chevrollier, L.-A., Cook, J. M., Halbach, L., Jakobsen, H., Benning, L. G., Anesio, A. M., and Tranter, M.: Light absorption and albedo reduction by pigmented microalgae on snow and ice, J. Glaciol., 69, 333–341, https://doi.org/10.1017/jog.2022.64, 2023.
Clark, M. P., Hendrikx, J., Slater, A. G., Kavetski, D., Anderson, B., Cullen, N. J., Kerr, T., Örn Hreinsson, E., and Woods, R. A.: Representing spatial variability of snow water equivalent in hydrologic and land-surface models: A review, Water Resour. Res., 47, 2011WR010745, https://doi.org/10.1029/2011WR010745, 2011.
Cook, J. M., Hodson, A. J., Taggart, A. J., Mernild, S. H., and Tranter, M.: A predictive model for the spectral “bioalbedo” of snow: Bioalbedo of Snow, J. Geophys. Res. Earth Surf., 122, 434–454, https://doi.org/10.1002/2016JF003932, 2017.
Cook, J. M., Tedstone, A. J., Williamson, C., McCutcheon, J., Hodson, A. J., Dayal, A., Skiles, M., Hofer, S., Bryant, R., McAree, O., McGonigle, A., Ryan, J., Anesio, A. M., Irvine-Fynn, T. D. L., Hubbard, A., Hanna, E., Flanner, M., Mayanna, S., Benning, L. G., van As, D., Yallop, M., McQuaid, J. B., Gribbin, T., and Tranter, M.: Glacier algae accelerate melt rates on the south-western Greenland Ice Sheet, The Cryosphere, 14, 309–330, https://doi.org/10.5194/tc-14-309-2020, 2020.
Engstrom, C. B., Raymond, B. B., Albeitshawish, J., Bogdanovic, A., and Quarmby, L. M.: Rosetta gen. nov. (Chlorophyta): Resolving the identity of red snow algal rosettes, J. Phycol., 60, 275–298, https://doi.org/10.1111/jpy.13438, 2024.
Fiołka, M. J., Takeuchi, N., Sofiska-Chmiel, W., Mieszawska, S., and Treska, I.: Morphological and physicochemical diversity of snow algae from Alaska, Sci. Rep., 10, 19167, https://doi.org/10.1038/s41598-020-76215-x, 2020.
Halbach, L., Chevrollier, L.-A., Doting, E. L., Cook, J. M., Jensen, M. B., Benning, L. G., Bradley, J. A., Hansen, M., Lund-Hansen, L. C., Markager, S., Sorrell, B. K., Tranter, M., Trivedi, C. B., Winkel, M., and Anesio, A. M.: Pigment signatures of algal communities and their implications for glacier surface darkening, Sci. Rep., 12, 17643, https://doi.org/10.1038/s41598-022-22271-4, 2022.
Hoham, R. W. and Duval, B.: Microbial ecology of snow and freshwater ice Snow Ecology, Cambridge, Cambridge University Press, ISBN: 978-0-521-58483-8, 2001.
Hoham, R. W. and Remias, D.: Snow and Glacial Algae: A Review, J. Phycol., 56, 264–282, https://doi.org/10.1111/jpy.12952, 2020.
Hotaling, S., Lutz, S., Dial, R. J., Anesio, A. M., Benning, L. G., Fountain, A. G., Kelley, J. L., McCutcheon, J., Skiles, S. M., Takeuchi, N., and Hamilton, T. L.: Biological albedo reduction on ice sheets, glaciers, and snowfields, Earth-Sci. Rev., 220, 103728, https://doi.org/10.1016/j.earscirev.2021.103728, 2021.
Kol, E.: Kol, Erzsébet, Kryobiologie, Biologie und limnologie des schnees und eises, I. Kryovegetation, Schweizerbart'sche Verlagsbuchhandlung, 1968.
Leya, T., Rahn, A., Lütz, C., and Remias, D.: Response of arctic snow and permafrost algae to high light and nitrogen stress by changes in pigment composition and applied aspects for biotechnology: Pigment change in snow algae, FEMS Microbiol. Ecol., 67, 432–443, https://doi.org/10.1111/j.1574-6941.2008.00641.x, 2009.
Lutz, S., Anesio, A. M., Raiswell, R., Edwards, A., Newton, R. J., Gill, F., and Benning, L. G.: The biogeography of red snow microbiomes and their role in melting arctic glaciers, Nat. Commun., 7, 11968, https://doi.org/10.1038/ncomms11968, 2016.
Matsumoto, M., Hanneman, C., Camara, A. G., Krueger-Hadfield, S. A., Hamilton, T. L., and Kodner, R. B.: Hypothesized life cycle of the snow algae Chlainomonas sp. (Chlamydomonadales, Chlorophyta) from the Cascade Mountains, USA, J. Phycol., 60, 724–740, https://doi.org/10.1111/jpy.13454, 2024.
McMurdie, P. J. and Holmes, S.: phyloseq: An R Package for Reproducible Interactive Analysis and Graphics of Microbiome Census Data, PLoS ONE, 8, e61217, https://doi.org/10.1371/journal.pone.0061217, 2013.
Müller, T., Leya, T., and Fuhr, G.: Persistent Snow Algal Fields in Spitsbergen: Field Observations and a Hypothesis about the Annual Cell Circulation, Arct. Antarct. Alp. Res., 33, 42–51, https://doi.org/10.1080/15230430.2001.12003403, 2001.
Nakashima, T., Uetake, J., Segawa, T., Procházková, L., Tsushima, A., and Takeuchi, N.: Spatial and Temporal Variations in Pigment and Species Compositions of Snow Algae on Mt. Tateyama in Toyama Prefecture, Japan, Front. Plant Sci., 12, 689119, https://doi.org/10.3389/fpls.2021.689119, 2021.
Novakovskaya, I. V., Patova, E. N., Boldina, O. N., Patova, A. D., and Shadrin, D. M.: Molecular Phylogenetic Analyses, Ecology and Morphological Characteristics of Chloromonas reticulata (Goroschankin) Gobi Which Causes Red Blooming of Snow in the Subpolar Urals, Cryptogamie, Algologie, 39, 199–213, https://doi.org/10.7872/crya/v39.iss2.2018.199, 2018.
Novis, P. M.: Ecology of the snow alga Chlainomonas kolii (Chlamydomonadales, Chlorophyta) in New Zealand, Phycologia, 41, 280–292, https://doi.org/10.2216/i0031-8884-41-3-280.1, 2002.
O'Neel, S., McNeil, C., Sass, L. C., Florentine, C., Baker, E. H., Peitzsch, E., McGrath, D., Fountain, A. G., and Fagre, D.: Reanalysis of the US Geological Survey Benchmark Glaciers: long-term insight into climate forcing of glacier mass balance, J. Glaciol., 65, 850–866, https://doi.org/10.1017/jog.2019.66, 2019.
Ono, M.: 23GU_Redsnow_forarchive, UTokyo Repository, https://doi.org/10.82337/1000017, 2026.
Ono, M., Kobayashi, K., Seto, D., Konishi, F., Wada, K., Usuba, S., and Takeuchi, N.: Temporal and vertical changes in snow microbial communities during the melting season below canopy in Northern Japan, The Cryosphere, 19, 5983–5999, https://doi.org/10.5194/tc-19-5983-2025, 2025.
Onuma, Y., Yoshimura, K., and Takeuchi, N.: Global Simulation of Snow Algal Blooming by Coupling a Land Surface and Newly Developed Snow Algae Models, J. Geophys. Res.-Biogeo., 127, https://doi.org/10.1029/2021JG006339, 2022.
Procházková, L., Remias, D., Holzinger, A., Řezanka, T., and Nedbalová, L.: Ecophysiological and morphological comparison of two populations of Chlainomonas sp. (Chlorophyta) causing red snow on ice-covered lakes in the High Tatras and Austrian Alps, Eur. J. Phycol., 53, 230–243, https://doi.org/10.1080/09670262.2018.1426789, 2018.
Procházková, L., Leya, T., Křízžková, H., and Nedbalová, L.: Sanguina nivaloides and Sanguina aurantia gen. et spp. nov. (Chlorophyta): the taxonomy, phylogeny, biogeography and ecology of two newly recognised algae causing red and orange snow, FEMS Microbiol. Ecol., 95, fiz064, https://doi.org/10.1093/femsec/fiz064, 2019.
Procházková, L., Remias, D., Suzuki, H., Kociánová, M., and Nedbalová, L.: Chloromonas rubrosalmonea sp. nov. (Chlorophyta) causes blooms of salmon-red snow due to high astaxanthin and low chlorophyll content, Bot. Lett., 1–19, https://doi.org/10.1080/23818107.2023.2301608, 2024.
QGIS Development Team: QGIS Geographic Information System (3.40.2), QGIS Association, https://doi.org/10.5281/zenodo.14535634, 2024.
R Core Team: R: A language and environment for statistical computing., R Foundation for Statistical Computing, Vienna, Austria, https://doi.org/10.32614/R.manuals, 2025.
Rea, M. E. and Dial, R. J.: An experimental assessment of active and passive dispersal of red snow algae on the Harding Icefield, southcentral Alaska, Arct. Antarct. Alp. Res., 56, 2370905, https://doi.org/10.1080/15230430.2024.2370905, 2024.
Remias, D., Lütz-Meindl, U., and Lütz, C.: Photosynthesis, pigments and ultrastructure of the alpine snow alga Chlamydomonas nivalis, Eur. J. Phycol., 40, 259–268, https://doi.org/10.1080/09670260500202148, 2005.
Remias, D., Procházková, L., Nedbalová, L., Benning, L. G., and Lutz, S.: Novel insights in cryptic diversity of snow and glacier ice algae communities combining 18S rRNA gene and ITS2 amplicon sequencing, FEMS Microbiol. Ecol., 99, fiad134, https://doi.org/10.1093/femsec/fiad134, 2023.
Román, A., Navarro, G., Barbero, L., Fernández-Marín, B., García-Plazaola, J. I., González-Ortegón, E., Caballero, I., and Tovar-Sánchez, A.: Unveiling the large coverage of red snow algae blooms in antarctic coastal snowfields, Commun. Earth Environ., 7, 53, https://doi.org/10.1038/s43247-025-03156-6, 2026.
Roussel, L., Dumont, M., Gascoin, S., Monteiro, D., Bavay, M., Nabat, P., Ezzedine, J. A., Fructus, M., Lafaysse, M., Morin, S., and Maréchal, E.: Snowmelt duration controls red algal blooms in the snow of the European Alps, P. Natl. Acad. Sci. USA, 121, e2400362121, https://doi.org/10.1073/pnas.2400362121, 2024.
Schuler, C. G. and Mikucki, J. A.: Microbial ecology and activity of snow algae within a Pacific Northwest snowpack, Arct. Antarct. Alp. Res., 55, 2233785, https://doi.org/10.1080/15230430.2023.2233785, 2023.
Segawa, T., Matsuzaki, R., Takeuchi, N., Akiyoshi, A., Navarro, F., Sugiyama, S., Yonezawa, T., and Mori, H.: Bipolar dispersal of red-snow algae, Nat. Commun., 9, 3094, https://doi.org/10.1038/s41467-018-05521-w, 2018.
Takeuchi, N.: The altitudinal distribution of snow algae on an Alaska glacier (Gulkana Glacier in the Alaska Range), Hydrol. Process., 15, 3447–3459, https://doi.org/10.1002/hyp.1040, 2001.
Takeuchi, N.: Seasonal and altitudinal variations in snow algal communities on an Alaskan glacier (Gulkana glacier in the Alaska range), Environ. Res. Lett., 8, 035002, https://doi.org/10.1088/1748-9326/8/3/035002, 2013.
Takeuchi, N., Dial, R., Kohshima, S., Segawa, T., and Uetake, J.: Spatial distribution and abundance of red snow algae on the Harding Icefield, Alaska derived from a satellite image, Geophys. Res. Lett., 33, L21502, https://doi.org/10.1029/2006GL027819, 2006.
Takeuchi, N., Tanaka, S., Konno, Y., Irvine-Fynn, T. D. L., Rassner, S. M. E., and Edwards, A.: Variations in Phototroph Communities on the Ablating Bare-Ice Surface of Glaciers on Brøggerhalvøya, Svalbard, Front. Earth Sci., 7, 4, https://doi.org/10.3389/feart.2019.00004, 2019.
Terashima, M., Umezawa, K., Mori, S., Kojima, H., and Fukui, M.: Microbial Community Analysis of Colored Snow from an Alpine Snowfield in Northern Japan Reveals the Prevalence of Betaproteobacteria with Snow Algae, Front. Microbiol., 8, 1481, https://doi.org/10.3389/fmicb.2017.01481, 2017.
U.S. Geological Survey Benchmark Glacier Program: Glacier-Wide Mass Balance and Compiled Data Inputs: USGS Benchmark Glaciers, https://doi.org/10.5066/F7HD7SRF, 2024.
Wang, C., Mitsuya, Y., Gharizadeh, B., Ronaghi, M., and Shafer, R. W.: Characterization of mutation spectra with ultra-deep pyrosequencing: Application to HIV-1 drug resistance, Genome Res., 17, 1195–1201, https://doi.org/10.1101/gr.6468307, 2007.
Yallop, M. L., Anesio, A. M., Perkins, R. G., Cook, J., Telling, J., Fagan, D., MacFarlane, J., Stibal, M., Barker, G., Bellas, C., Hodson, A., Tranter, M., Wadham, J., and Roberts, N. W.: Photophysiology and albedo-changing potential of the ice algal community on the surface of the Greenland ice sheet, ISME J., 6, 2302–2313, https://doi.org/10.1038/ismej.2012.107, 2012.