
the Creative Commons Attribution 4.0 License.
the Creative Commons Attribution 4.0 License.
 | 13 Nov 2026
Growing-season variability and environmental controls of CH4 and N2O fluxes across high-latitude terrestrial ecosystems
Johannes Niemi

Miska Luoto
Anna-Maria Virkkala
Johanna Lehtinen
Jenni Hultman
Rapid warming and accelerating ecological change across high-latitude (>66° N) terrestrial environments are reshaping greenhouse gas dynamics. However, spatiotemporal patterns and environmental drivers of CH4 and N2O fluxes in high-latitude ecosystems remain poorly understood.
In this study we describe the seasonal and spatial variation in CH4 and N2O fluxes across key subarctic and boreal environmental gradients. A secondary aim is to examine the environmental drivers underlying these flux patterns. We measured fluxes during the snow-free season of 2024 and 2025 in northern Finland, starting early June (spring snowmelt) and ending late September (first snowfall). We conducted 1272 chamber measurements at 144 locations spanning eight high-latitude land cover classes: bare tundra, dwarf-shrub tundra, deciduous forest, evergreen forest, fen, bog, permafrost bog and tundra wetland.
Bare tundra, dwarf-shrub tundra, deciduous forest and evergreen forest sites acted as net CH4 sinks (mean flux of −0.16 to −0.05 , depending on land cover class) and as both N2O sources and sinks (−0.69 to 1.69 ). Fen, bog, permafrost bog and tundra wetland sites were net CH4 sources (mean flux of 0.93 to 27.81 ) and net N2O sinks (−0.89 to −6.53 ). Highest mean CH4 fluxes occurred in fens (23.4 ) and permafrost bogs (27.8 ) which often coincided with substantial N2O sinks (mean flux of −6.53 in fens and −5.40 in permafrost bogs). Seasonal trends were present for CH4 but were land cover-dependent, with both sinks and sources typically peaking during July–August. Land cover class, soil temperature, and soil pH had the strongest effects on CH4 fluxes while variation in N2O was best explained by soil pH and land cover class. However, a significant portion of the variability in N2O remained unexplained.
These results demonstrate that strong spatial heterogeneity and pronounced seasonal dynamics during the snow-free period generate substantial variability in CH4 and N2O fluxes across high-latitude ecosystems. Our findings suggest that monthly measurements of insitu gas fluxes and soil conditions in combination with accurate land cover mapping are essential for modelling and upscaling of GHG fluxes. This is especially important in high-latitude regions, where rapid warming is altering both ecosystem distributions and soil conditions with significant consequences for current and future GHG budgets.
- Article
(7063 KB) - Full-text XML
- BibTeX
- EndNote


High-latitude (>66° N) ecosystems exhibit highly dynamic greenhouse gas (GHG) fluxes shaped by the interactions of soil, microbial, and vegetation processes (Whalen, 2005; Riutta et al., 2007; Olefeldt et al., 2013; Martins et al., 2017). Climate change can alter all these factors by reshaping abiotic conditions such as precipitation, temperature, and snow cover. Changing climate also drives biological shifts, including changes in microbial communities (Deslippe et al., 2012) and broader ecosystem transitions such as shrubification, paludification, and permafrost thaw (Myers-Smith et al., 2011; Biskaborn et al., 2019). Arctic regions store a major fraction of global soil carbon reserves (Batjes, 2016; Hugelius et al., 2020) and are warming faster than the global average (Rantanen et al., 2022), underscoring their importance in the global carbon cycle. However, the interplay of complex GHG processes and the heterogeneous landscape makes both measurements and modelling particularly challenging.
Soil carbon storage and GHG dynamics vary widely across high-latitude ecosystems (Hugelius et al., 2024). Peatlands (wetlands with peat soils), for example, function as major long-term carbon sinks due to ongoing peat accumulation, yet they are also the largest natural source of atmospheric methane (CH4) because of their persistently anoxic soils (Saunois et al., 2025; Kübert et al., 2026). Most high-latitude wetlands can be further categorized into bogs, permafrost bogs and fens based on their hydrology and permafrost extent (Olefeldt et al., 2021). We have additionally included a tundra wetland category as both their ecology and hydrology significantly differ from the other categories (see Sect. 2.3 for detailed land cover classifications). In addition to wetlands, we also studied dry tundra and forest soils which were further categorized into bare tundra, shrub tundra, evergreen forests and deciduous forests (see Sect. 2.3). In this study, dry tundra soils specifically refer to non-wetland upland mineral soils with no tree cover. Although dry tundra and forest ecosystems store less carbon per unit area than peatlands, their vast extent, up to 80 % of the boreal-Arctic area (Raynolds et al., 2019; Olefeldt et al., 2021), means they exert a major influence on high-latitude carbon cycling through CH4 uptake, biomass and soil carbon storage, and gross-primary production (GPP) (Virkkala et al., 2021; Voigt et al., 2023; Li et al., 2025; Jiang et al., 2025). In addition to CH4 dynamics, nitrous oxide (N2O) sources and sinks have been reported from high-latitude ecosystems, but their magnitudes, spatial patterns, and environmental drivers remain poorly understood (Chapuis-Lardy et al., 2007; Marushchak et al., 2011; Voigt et al., 2020). CH4 and N2O are the second and third most influential greenhouse gases after CO2. Over a 100-year time horizon, CH4 has a global warming potential (GWP100) that is 27–29 times greater than that of CO2, whereas N2O has a GWP100 of 273 (IPCC, 2023).
High latitude peatlands have a disproportionately strong effect on carbon dynamics due to their intense CH4 emissions and large soil carbon stocks and because of that, they are overrepresented in many flux databases (Kuhn et al., 2021; Virkkala et al., 2026). Yet, high-latitude landscapes are heterogenous with a mosaic composition of wetlands, forests and tundra of which tundra soils are especially underrepresented in literature. Furthermore, it is typical to focus on peak growing season fluxes (Olefeldt et al., 2013, Kuhn et al., 2021) as it makes measurements and modelling more straightforward. However, this ignores the strong seasonal dynamics of the environmental drivers in high-latitude ecosystems which control GHG fluxes (Rautakoski et al., 2024; Kübert et al., 2026). Multi-month measurements across ecosystems are therefore required to resolve the seasonal progression of GHG fluxes and their underlying controls, which can shift substantially across environmental gradients and between spring, summer peak productivity, and autumn transition.
This study aims to characterize the seasonal and spatial variability of CH4 and N2O fluxes across key subarctic and boreal land cover classes, focusing on representative forest, wetland, and tundra ecosystems. A secondary aim is to examine the key environmental drivers and their role in shaping these flux patterns. To capture ecosystem-level heterogeneity, we classify these biomes into eight land cover classes following the BAWLD dataset framework (Olefeldt et al., 2021; Kuhn et al., 2021): deciduous and evergreen forests, bare tundra, dwarf-shrub tundra, fens, bogs, permafrost bogs and tundra wetlands (see Sect. 2.3 for details). Specifically, we address three research questions: (i) How do CH4 and N2O fluxes differ among the land cover classes? (ii) How do these fluxes develop seasonally during the snow-free period (June–September)? (iii) How do various environmental variables explain the variance in GHG fluxes? The analysis is based on 1273 in situ chamber measurements collected at 144 locations spanning eight high-latitude land cover classes at two research sites in Northern Finland (Kilpisjärvi and Pallas). The measurements cover the full duration of growing seasons of years 2024 and 2025, from spring snowmelt to late autumn.
2.1 Location and area descriptions
The two study locations are in the Pallas-Yllästunturi national park in the Kittilä and Muonio municipalities in western Finnish Lapland, and the Kilpisjärvi region in the Enontekiö municipality, in northwestern Finnish Lapland. The Pallas study sites (67.9° N, 24.0° E, 250–570 m a.s.l.) are located at the edge of the northern-boreal and subarctic climatic zones with a long-term mean annual temperature of −1.0 °C and annual precipitation of 644 mm (Pirinen et al., 2012). It is characterized by a mosaic of northern boreal ecosystems consisting of mixed and coniferous forests (Picea abies, Pinus sylvestris, Betula pubescens), open fen wetlands and open tundra on the fells. The evergreen forest sites are only found in the Pallas area (Fig. 1, map 2) as the Kilpisjärvi sites are located above the coniferous forest limit. The Kilpisjärvi (Gilbbesjávri in Northern Sámi language) study sites are located in the subarctic climate zone (69.0° N, 20.8° E, 474–737 m a.s.l.) with a long-term mean annual temperature of −1.9 °C and annual precipitation of 487 mm (Pirinen et al., 2012). The Kilpisjärvi region lies at the ecotone between the boreal and tundra biomes and is characterized by dwarf-shrub dominated tundra highlands, Carex spp. dominated open fens and short stature mountain birch (Betula pubescens var pumila) forests at lower altitudes. The permafrost bog, tundra wetland, and deciduous forest sites occur only in the Kilpisjärvi research area (Fig. 1a and b). The Pallas area lies too far south and at too low an elevation to support permafrost bogs and extensive mountain birch forests, and comparable tundra wetlands are absent from the vicinity of the Pallas research area. The Pallas area is underlain by acidic Precambrian bedrock, resulting in low soil pH, whereas Kilpisjärvi is characterized by a geological mosaic of Paleozoic sedimentary rocks and acidic Precambrian bedrock (Simonen, 1990), yielding intermediate soil pH conditions. This geological contrast provides a robust framework for assessing the influence of pH on CH4 and N2O fluxes. Snowmelt and associated flooding and nutrient pulses typically occur in June, with rapidly increasing daylight hours progressing into a ∼2-month period of continuous daylight from late-May to late-July. Afterwards, a senescing period with occasional sub-zero temperatures occurs already during September. All measurement areas are relatively undisturbed with no ditching, recent logging or other major human influences.
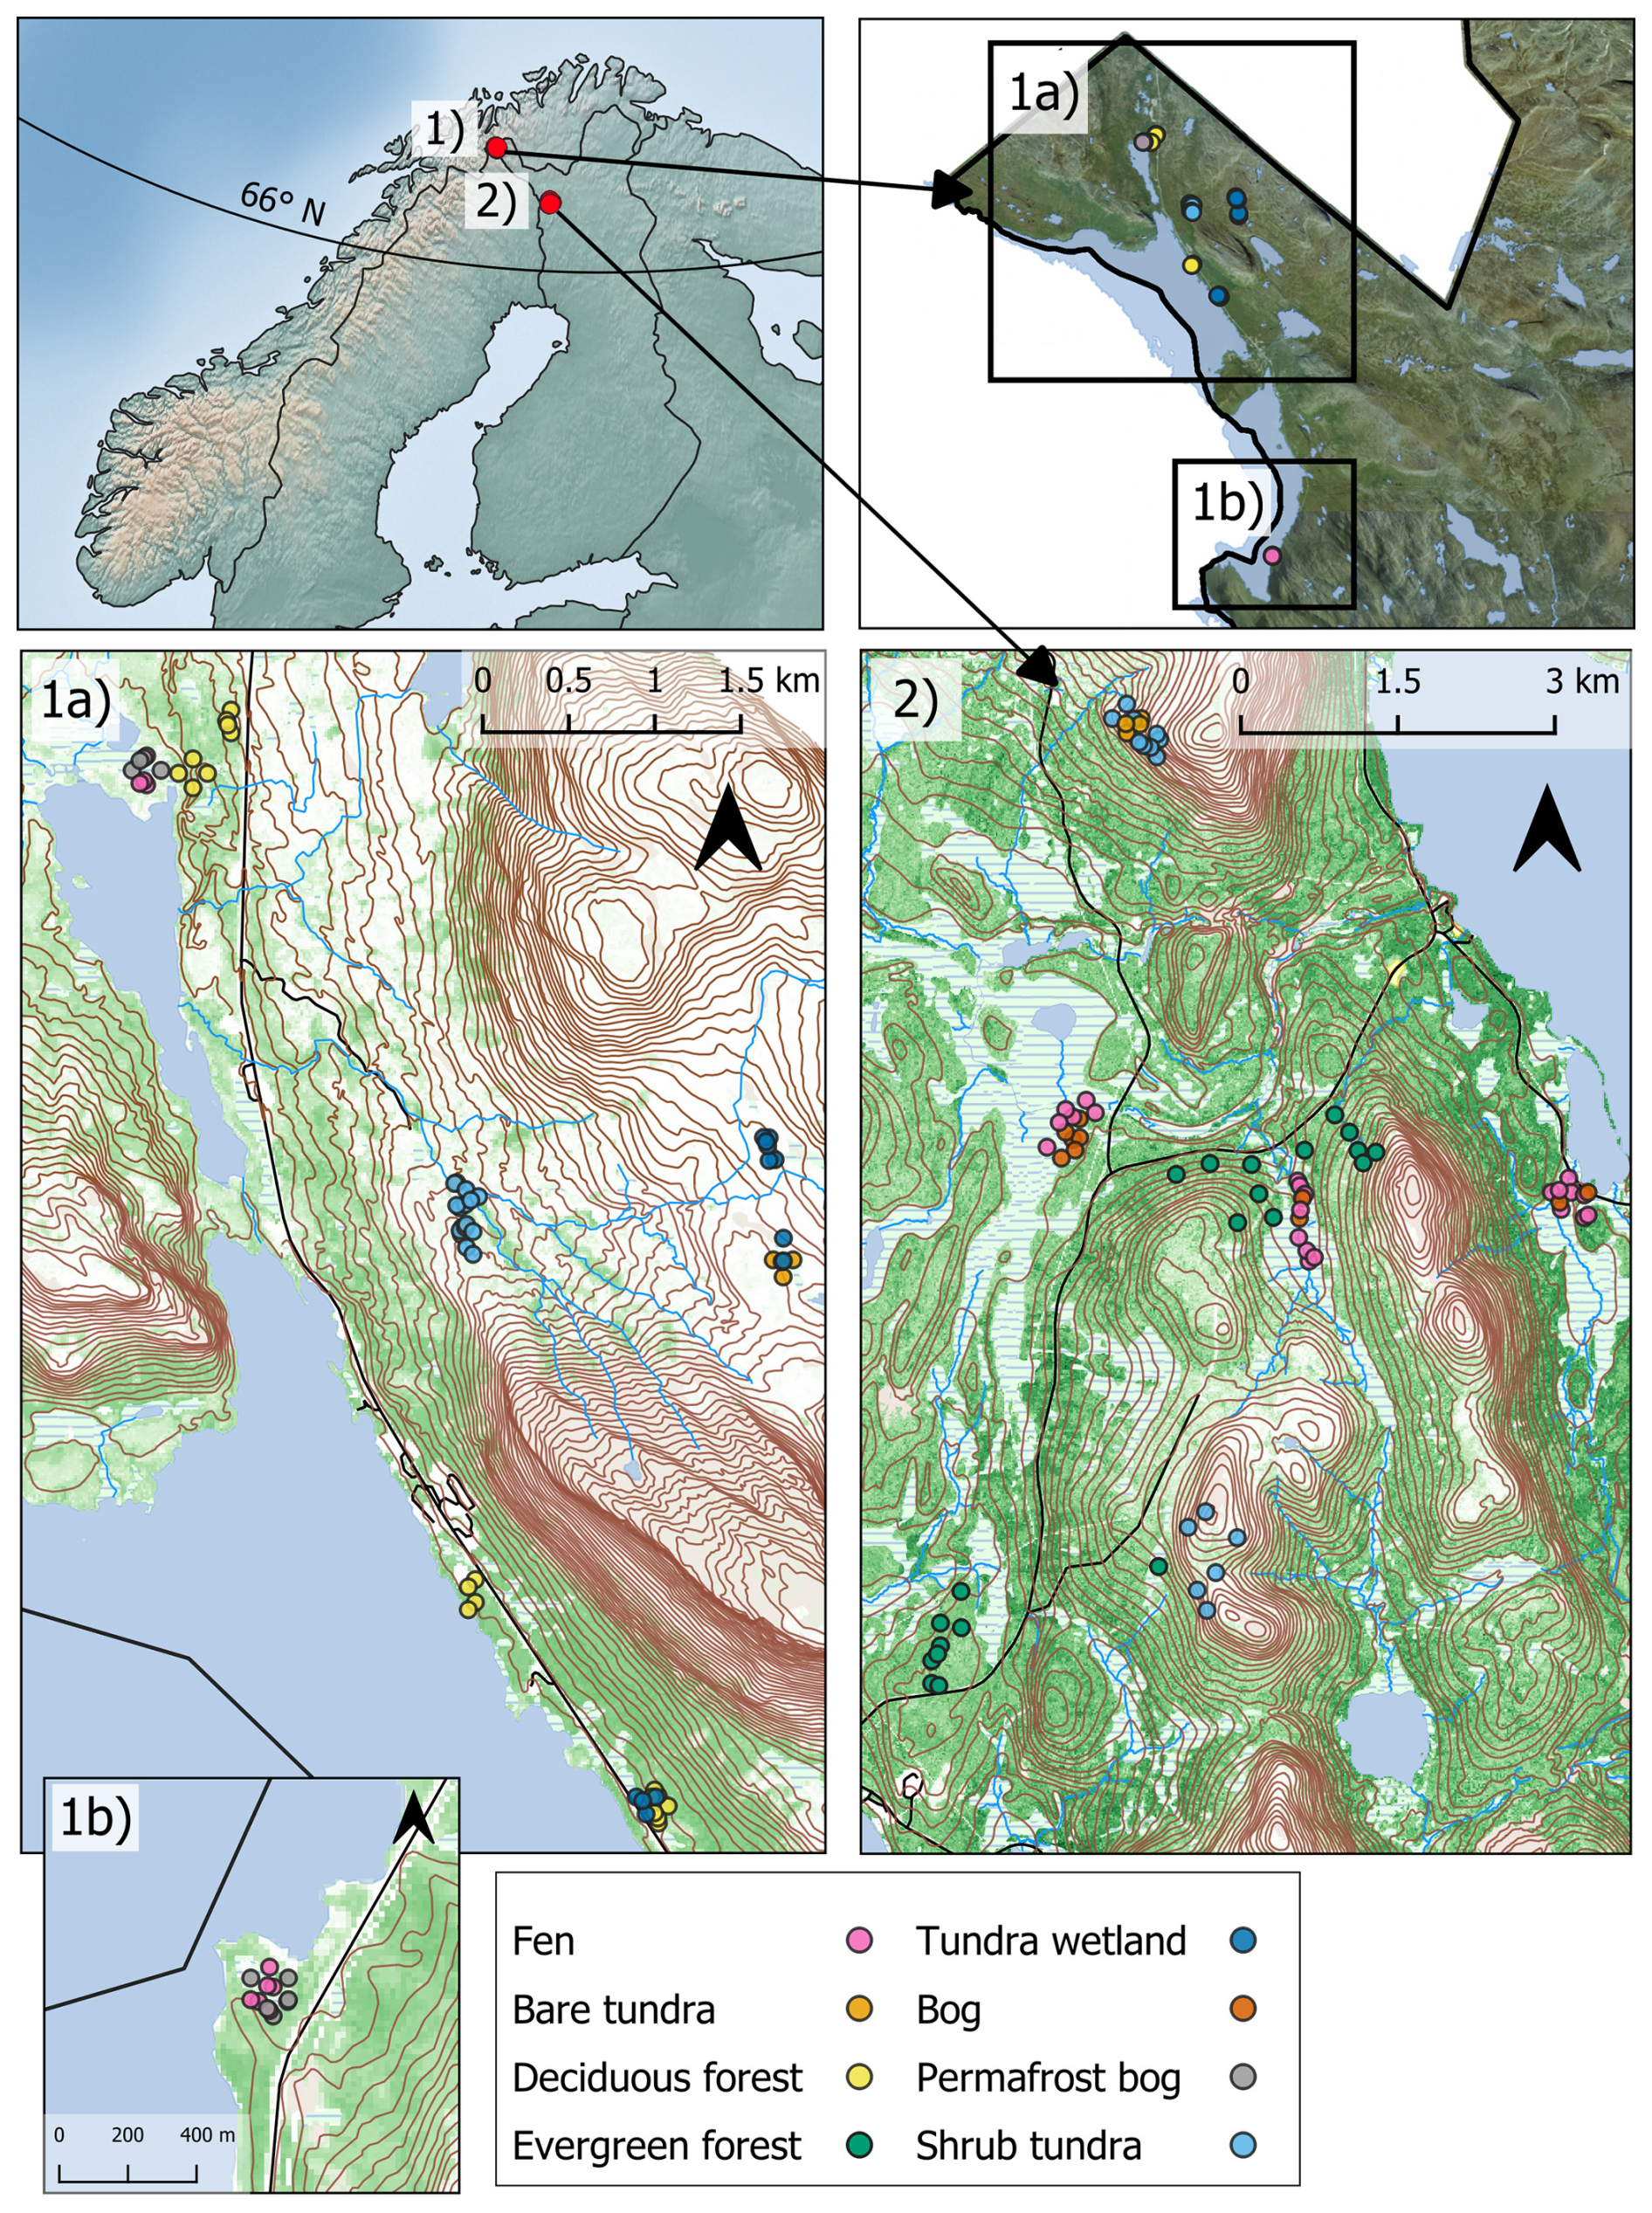
Figure 1Maps of the two research sites. Subarctic Kilpisjärvi site (1a and 1b) and boreal Pallas site (2). Colored dots indicate the measurement plots (n=144) and their eight different land cover classifications.
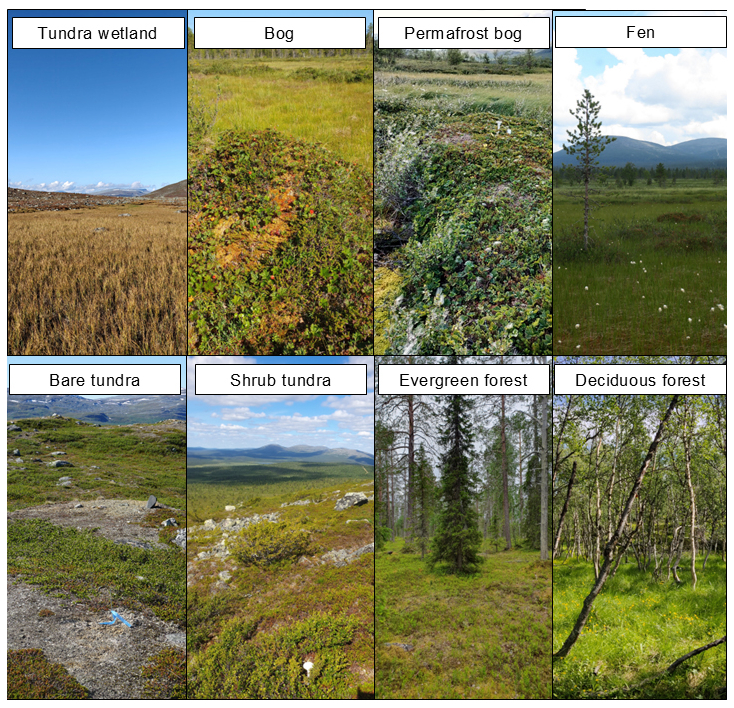
Figure 2Representative in situ photographs of the eight land-cover classes included in the study, illustrating the range of environments sampled across the research areas (Photos: Johannes Niemi, Saku Mäki-Ikola).
2.2 Field campaign
The measurement campaign was conducted in two parts (years 2024 and 2025). The first part took place between 9 June and 1 October (2024) and the second part between 3 June and 21 September (2025). A total of 144 measurement plots were repeatedly sampled once a month (June–July–August–September) each year. Additional repeated measurements were taken from roughly a third of the research plots. In total, we conducted 1273 chamber measurements (n=1273 for each GHG) while continuously measuring microclimate and green vegetation cover at each measurement plot. Total chamber measurements were distributed between land cover classes as follows: shrub tundra (n=266, 20.9 %), fen (n=248, 19.5 %), evergreen forest (n=186, 14.6 %), deciduous forest (n=180, 14.2 %), bare tundra (n=106, 8.3 %), tundra wetland (n=106, 8.3 %), bog (n=100, 7.9 %) and permafrost bog (n=80, 6.3 %).
2.3 Land cover classification and site descriptions
The measurement plots were equally distributed between the Pallas (boreal) and Kilpisjärvi (subarctic) regions with three main ecosystem types of dry tundra, forests and wetlands, which were further divided between eight different key land covers: bare tundra, shrub tundra, evergreen forest, deciduous forest, tundra wetland, bog, fen and permafrost bog (Fig. 2). These land cover categorizations are based on the BAWLD dataset (Olefeldt et al., 2021), with some minor changes to more accurately describe our research sites. Specifically, the differences to the BAWLD categorization: our tundra wetland sites are not permafrost affected, and we separated dry upland soils into bare tundra and shrub tundra as we expected them to have different GHG flux profiles due to the lack of vegetation cover and shallower organic layer thickness in bare tundra plots.
The following descriptions are specifically for our research sites and based on our in situ observations. Shrub tundra plots (n=28) are located above the tree line and typically have a fairly thin dry organic soil layer (mean organic layer thickness, OLT=5.0 cm). Vegetation is generally dominated by Betula nana, Empetrum nigrum and Vaccinium myrtillus, although vegetation can occasionally be more diverse in wind protected valleys and creeks. Bare tundra plots (n=11) lack vascular plants and typically result from repeating freeze-melt cycles (cryoturbation) and persistent winds at higher altitudes. These plots may occasionally support small amounts of lichen and mosses and have a thin OLT (mean OLT=3.2 cm).
Evergreen forest plots (n=21) are located at the northern edge of the boreal zone with a tree cover dominated by Picea abies or Pinus sylvestris but can also have some deciduous trees mixed in, i.e. Betula pubescens or Populus tremula. Field layer is dominated by dwarf-shrubs (e.g. Vaccinium myrtillus, Vaccinium vitis-ideae) and various graminoids (e.g. Avenella spp. and Poa spp.). Evergreen forests had the highest OLT of the dry land cover classes (mean OLT=9.82 cm). The deciduous forest plots (n=20) are primarily located at the edges of the forest limit, and the tree cover consists solely of short growing Betula pubescens. var. pumila (mountain birch). The field layer is mixed with various dwarf-shrubs, graminoids (Avenella spp.) and forbs (e.g. Cornus suecica, Viola palustris). Most deciduous forests occur on well-drained glaciofluvial eskers and therefore have shallow organic layers (mean OLT=2.7 cm).
Fen plots (n=31) are minerotrophic, wet and treeless wetlands with peat depths up to ∼4.4 m. Field layer is dominated by Carex spp. and Sphagnum spp. Bog plots (n=11) are all of the dry and “hummocky” (permafrost free) wetland forms, i.e. if a wetland as a whole would be considered a fen, it might still have elevated dry Sphagnum hummocks with bog-type shrub vegetation which have considerably different greenhouse gas profiles compared to the wetter fen-type areas. Permafrost bog plots (n=10) are similar to the previously mentioned bogs but with permafrost cores that are in various stages of degradation. The permafrost bog research sites include two different peatlands representing varying degrees of permafrost degradation: one with largely intact but degrading palsas, the other with only remnants of old permafrost left. Permafrost extent was confirmed using soil cores to distinguish permafrost bogs from bogs without permafrost. Lastly, tundra wetland plots (n=12) are Carex spp., Trichoforum spp. and moss dominated wetlands (note: generally, no Sphagnum spp.). The tundra wetland sites are situated on hillsides, with small creeks running through them. They have a shallow organic soil layer compared to the other wetland types (mean organic layer thickness, OLT=11.2 cm). The upper soil layer consists of a mixture of fluvial minerogenic and organic deposits, including mud, gyttja, litter, peat, and roots. They have variable seasonal hydrology, i.e. water table was typically above the soil surface during spring snowmelt and autumn rains but below the surface during summer. Despite the low summer water table, soil moisture remained high throughout the measurement campaigns.
2.4 Environmental variables
The field layer vegetation cover of each plot was estimated by image analysis with Canopeo (Patrignani and Ochsner, 2015). Canopeo measures the relative number of green pixels from a photo and converts them into percentages, i.e. it acts as a measurement for green vegetation cover (“vegetation cover”). A photo was taken of each measurement plot every time chamber measurements were conducted. The pictures covered roughly a 1 m2 square around the measurement plot and thus included vegetation from outside the chamber collar.
Microclimatic variables were measured with TOMST TMS-4 sensors (Wild et al., 2019), which are located 0.5–1 m from the chamber collar and measure continuously throughout the year. Loggers record microclimatic variables in 15 min intervals: soil temperature at a depth of −6 cm and soil moisture at depth of −14 cm. Each logger operated with a temperature resolution of 0.0625 °C and an accuracy of ±0.5 °C. For the soil temperature, the data quality control and processing procedures followed the approach outlined in Aalto et al. (2022). First the temperature time series were visually inspected to remove readings that clearly reflected sensor malfunction, such as abrupt shifts in soil moisture or temperature indicative of the logger being displaced. After the first screening of the data, the temperature sensors were then calibrated based on their individual response differences when stored under stable conditions (i.e. data logged while in storage indoors). Finally, any abnormal spikes in the data were filtered out, for example, a data point was flagged as erroneous if soil temperature change between consecutive time steps exceeded 5 °C or change in air temperature exceeded 10 °C.
For the soil moisture data, the quality control and preprocessing of the data followed the same outline as in Kemppinen et al. (2023). Similarly to the temperature time series, the raw soil moisture data was screened manually for clearly erroneous data where values were removed if the logger had been displaced, or the raw soil moisture value was <200, as it is outside the range of the sensor and usually indicates of poorly placed logger. The TOMST logger records raw soil moisture data based on electromagnetic pulses, producing time-domain transmission measurements (see Wild et al., 2019, for details). These were subsequently converted to volumetric water content (VWC, %) using the generic calibration function for unknown soils by Kopecký et al. (2021). The function for unknown soils was chosen, as it provided more realistic ranges of VWC values compared to soil-specific calibrations, however it does limit the maximum possible VWC to 60 %. This method has already been validated in Finland by Kemppinen et al. (2023), supporting its applicability to this research. After quality control and preprocessing, microclimate data was coupled with flux measurements by selecting the nearest 15 min logger reading corresponding to the flux measurement time. In cases where the closest time point contained erroneous or missing data, the next closest valid reading was used.
Both water table depth and soil moisture have been identified as key drivers for GHG fluxes (Moore and Dalva, 1993; Olefeldt et al., 2013; Rinne et al., 2018; Voigt et al., 2020; Virkkala et al., 2024). We chose to use soil moisture over water table depth for three reasons: (a) determining water table depth in mineral soils typically requires invasive methods that disturb soil structure and alter hydrological conditions (b) water table in dry tundra and forest sites is generally very deep, thus it has minimal impact on biogeochemistry occurring at the surface or at intermediate depths (c) we wanted model parameters that can be measured at all sites (i.e. both mineral soils and wetlands) for robust modelling across ecosystem gradients.
Soil samples for pH data were collected once during the measurement campaign from the organic layer underneath the vegetation (outside the chamber collars). The laboratory analysis was conducted by the Finnish Natural Resources Institute (LUKE) according to the ISO 10390 soil Quality-Determination of pH standards, in a suspension of soil in water (pH in H2O).
2.5 Chamber measurements and flux calculations
The gas measurements were conducted as closed opaque chamber measurements with a duration of 3 min, taken with two portable gas analyzers (LI-COR-LI7810 and LI-COR-LI7820) that measure gas concentrations in 1 s intervals. Gas fluxes for CH4 and N2O were both measured simultaneously from the same chamber.
The chamber had a built-in fan and a wireless Bluetooth temperature sensor (Ruuvi tag pro) for measuring chamber temperatures. The volume of the chamber was ∼7.85 L (cylindrical, 20 cm×25 cm) and was placed on top of a steel collar. As the collar height changed between measuring plots (depending on how soft and deep the soil was), the height was always measured separately for each gas measurement to get accurate chamber volumes. For wetlands, the collars were installed into the soil roughly 7–14 d before the measurement campaign started to avoid disturbances in the peat that could cause ebullition or other artefacts in the flux. For mineral soils, the collar was removed between measurements to minimize changes in microclimatic conditions such as sheltering from wind. If unusually high fluxes were measured, they were repeated multiple times in situ to make sure the emissions were not caused by any influence of the measurer (i.e. ebullition due to the pressure on surrounding soil). If the repeat measurement showed similar fluxes, then the initial measurement was used (assuming linear change of gas concentration).
Fluxes were calculated as shown in Eq. (1), based on a linear fit between starting gas concentration at the start of the measurement and at the end of the measurement, utilizing the ideal gas law
where is the slope (expressed as ppm s−1), V is chamber volume, M is molar mass, p is atmospheric pressure, R is the ideal gas constant, T is chamber temperature and A is chamber area. Output of the formula without conversions is . Fluxes were converted from s−1 to h−1 (multiply by seconds in an hour; 3600 s) and from micrograms to milligrams for CH4 (by dividing by 1000). Final units used for fluxes are mg for CH4 and for N2O.
Each chamber measurement was visually graphed to make sure the gas concentrations were changing linearly and to remove any possible measurement errors, such as anomalies at the start and end of the measurements that come from pressure changes or from handling the chamber (Pavelka et al., 2018). The same flux calculation method has been used in previous studies by Rissanen et al. (2023), Karjalainen et al. (2025) and Suominen et al. (2026).
Python script for flux calculations is also available: https://github.com/janivaltteri/djp-mcds/blob/main/djpmcds/mcds/fluxcalc.py (last access: 2 November 2026).
We followed Nickerson (2016) to calculate a minimum detectable flux (MDF) for chamber measurements which is an extended formula from Christiansen et al. (2015a) specifically designed for continuous high-resolution laser-based measurements. The calculation is based on the LI-COR sampling frequency (1 Hz) and measurement precision (0.6 ppb for CH4 and 0.4 ppb for N2O as reported by LI-COR), chamber volume, closure time and ideal gas law. For CH4, 1.18 % of measurements were under the MDF (i.e. not confidently distinguishable from zero) while 10.6 % were below the MDF for N2O.
Clear measurement errors (i.e. flat zero measurements that are sometimes caused by LI-COR malfunction) were removed, but all other measurements which had linear gas concentration change were kept in the data. Following quality control, 15 N2O measurements (0.12 % of all N2O measurements) and 9 CH4 measurements (0.01 % of all CH4 measurements) were excluded from the analyses. Non-linear fluxes are typically caused by the increasing concentration gradient at high gas concentrations, which slows down the gas diffusion rates from the soil to the chamber causing a log-curve (Pihlatie et al., 2013). In such cases, only the linear part of the measurement was used for the calculation to avoid underestimating fluxes. Chamber measurements that showed exponential concentration growth were typically repeated in situ until a linear trend was observed, as this kind of flux behavior is usually caused by influence of the measurer (Pavelka et al., 2018).
2.6 Statistical analysis and modelling
We used the lme4 package (Bates et al., 2015) in R (R: The R Project for Statistical Computing, 2026) to fit linear mixed-effects models examining the relationships between GHG fluxes and environmental variables. We used a joint model for both wetlands and dry land cover classes to investigate useful parameters for modelling across broad environmental gradients. The final model for CH4 consisted of four fixed effects, three two-way interactions terms and a random effect. As the main effects, we included soil temperature (continuous), soil moisture (continuous), pH (continuous) and land cover (categorical, 8 levels). Interaction terms were land cover paired with each of the other fixed variables. The land cover interaction term was used to give the model flexibility for the direction of the GHG flux response, e.g. increasing temperature can have both positive and a negative effect on GHG flux depending on the land cover class. Measurement point identification was used as a random effect (random intercept) to account for the repeated measurements design (e.g. pseudoreplication). Green vegetation cover (continuous) and measurement year (categorical, 2 levels) were also tested as fixed effects but were dropped due to worse model performance.
The final model for N2Oconsisted of five fixed effects, two two-way interactions and a random effect. As main effects we included soil temperature (continuous), pH (continuous), Green vegetation cover (continuous), year (categorical, 2 levels) and land cover (categorical, 8 levels). Interaction terms were land cover paired with pH and vegetation cover. Measurement point identification was used as a random effect (random intercept). Soil moisture, soil moisture-land cover interaction and soil temperature-land cover interaction were also tested as fixed effects but were dropped due to worse model performance.
Organic layer thickness (OLT) was considered as a potential explanatory variable but was not included in the final models as it was strongly correlated with land-cover class and soil moisture. Because these variables already captured much of the variation associated with OLT, its inclusion would have increased collinearity and model complexity without providing substantial additional explanatory power.
Model validation was done through Akaike information criterion (AIC) and model parameter effects sizes were described with partial eta-squared (η2p). The GHG flux data was skewed and included both negative and positive values and as such was normalized with a YeoJohnson-transformation (Yeo and Johnson, 2000) for CH4 and with arcsinh-transformation for N2O. Optimal data transformation options were investigated with the bestNormalize R-package (Peterson, 2021). Statistical differences between months and between land cover classes were tested with Aligned Rank Transformed Anova, (ART-Anova, Wobbrock et al., 2011) using the ARTool R-package (Kay et al., 2025). This allows testing for differences between groups (months or land cover class) while accounting for repeated measurements and uneven group sizes. Post-Hoc tests were done following the ART-C contrast testing procedure (Elkin et al., 2021) with Tukey's HSD using the art-contrasts R-package (Elkin et al., 2021). Differences between groups were considered statistically significant at p<0.05.
3.1 CH4 between land cover classes
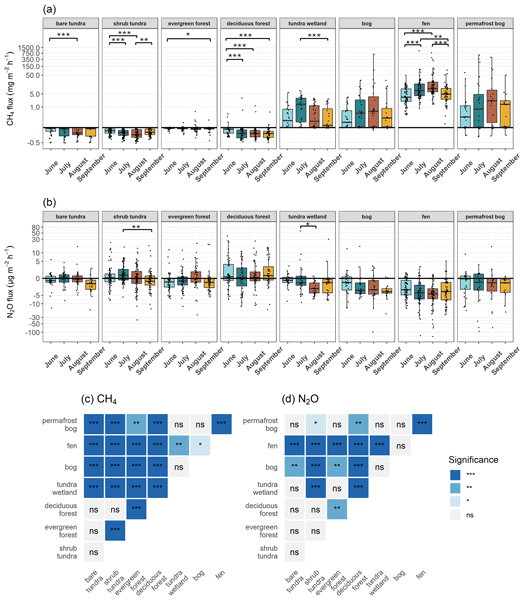
All dry land cover classes (shrub and bare tundra, deciduous and evergreen forest) were small net sinks (mean −0.12 ) for CH4 and conversely all wetland classes were net sources (mean 17.1 ) of CH4 (Table A1), fluxes across all measurements varied from −0.55 to 1008 (Table A1). Highest positive mean CH4 fluxes were measured from permafrost bogs (mean 27.8 ; range −0.24 to 602), followed by fens (23.4 ; 0.13 to 1008), bogs (10.1 ; −0.11 to 668) and tundra wetlands (0.93 ; −0.04 to 7.59). Largest negative mean CH4 fluxes (sinks) were measured from shrub tundra (−0.16 ; −0.55 to 0.001) followed by bare tundra (−0.13 ; −0.52 to 0.01), deciduous forests (−0.12 ; −0.50 to 3.02) and lastly evergreen forests (−0.045 ; −0.40 to 0.57). Although both deciduous and evergreen forest were net sinks, they also included some small positive fluxes which all came from locations in ecotones adjacent to wetlands or streams.Pairwise comparisons showed that 21 out of 28 land cover classes differed significantly in CH4 fluxes (Table A7).
3.2 CH4 temporal trends
Across all land cover types, both negative and positive fluxes were small in early June, increased to their highest values during July–August, and declined again in September. However, the magnitude of monthly differences was dependent on land cover type. Monthly mean fluxes can be found in Table A2 and statistical differences between months in Table A5. Wetland sites remained net sources throughout the measurement period, with positive fluxes persisting until the end of the growing season. (Fig. 3a, Table A2). No significant effect of measurement year on CH4 fluxes was detected. Within-plot variability across months was often high, but extreme values typically originated from the same few measurement locations. For example, one permafrost bog plot, across multiple months, produced repeated CH4 outliers of 50, 116, 366, and 602 , resulting in a within-plot range of over 500 .
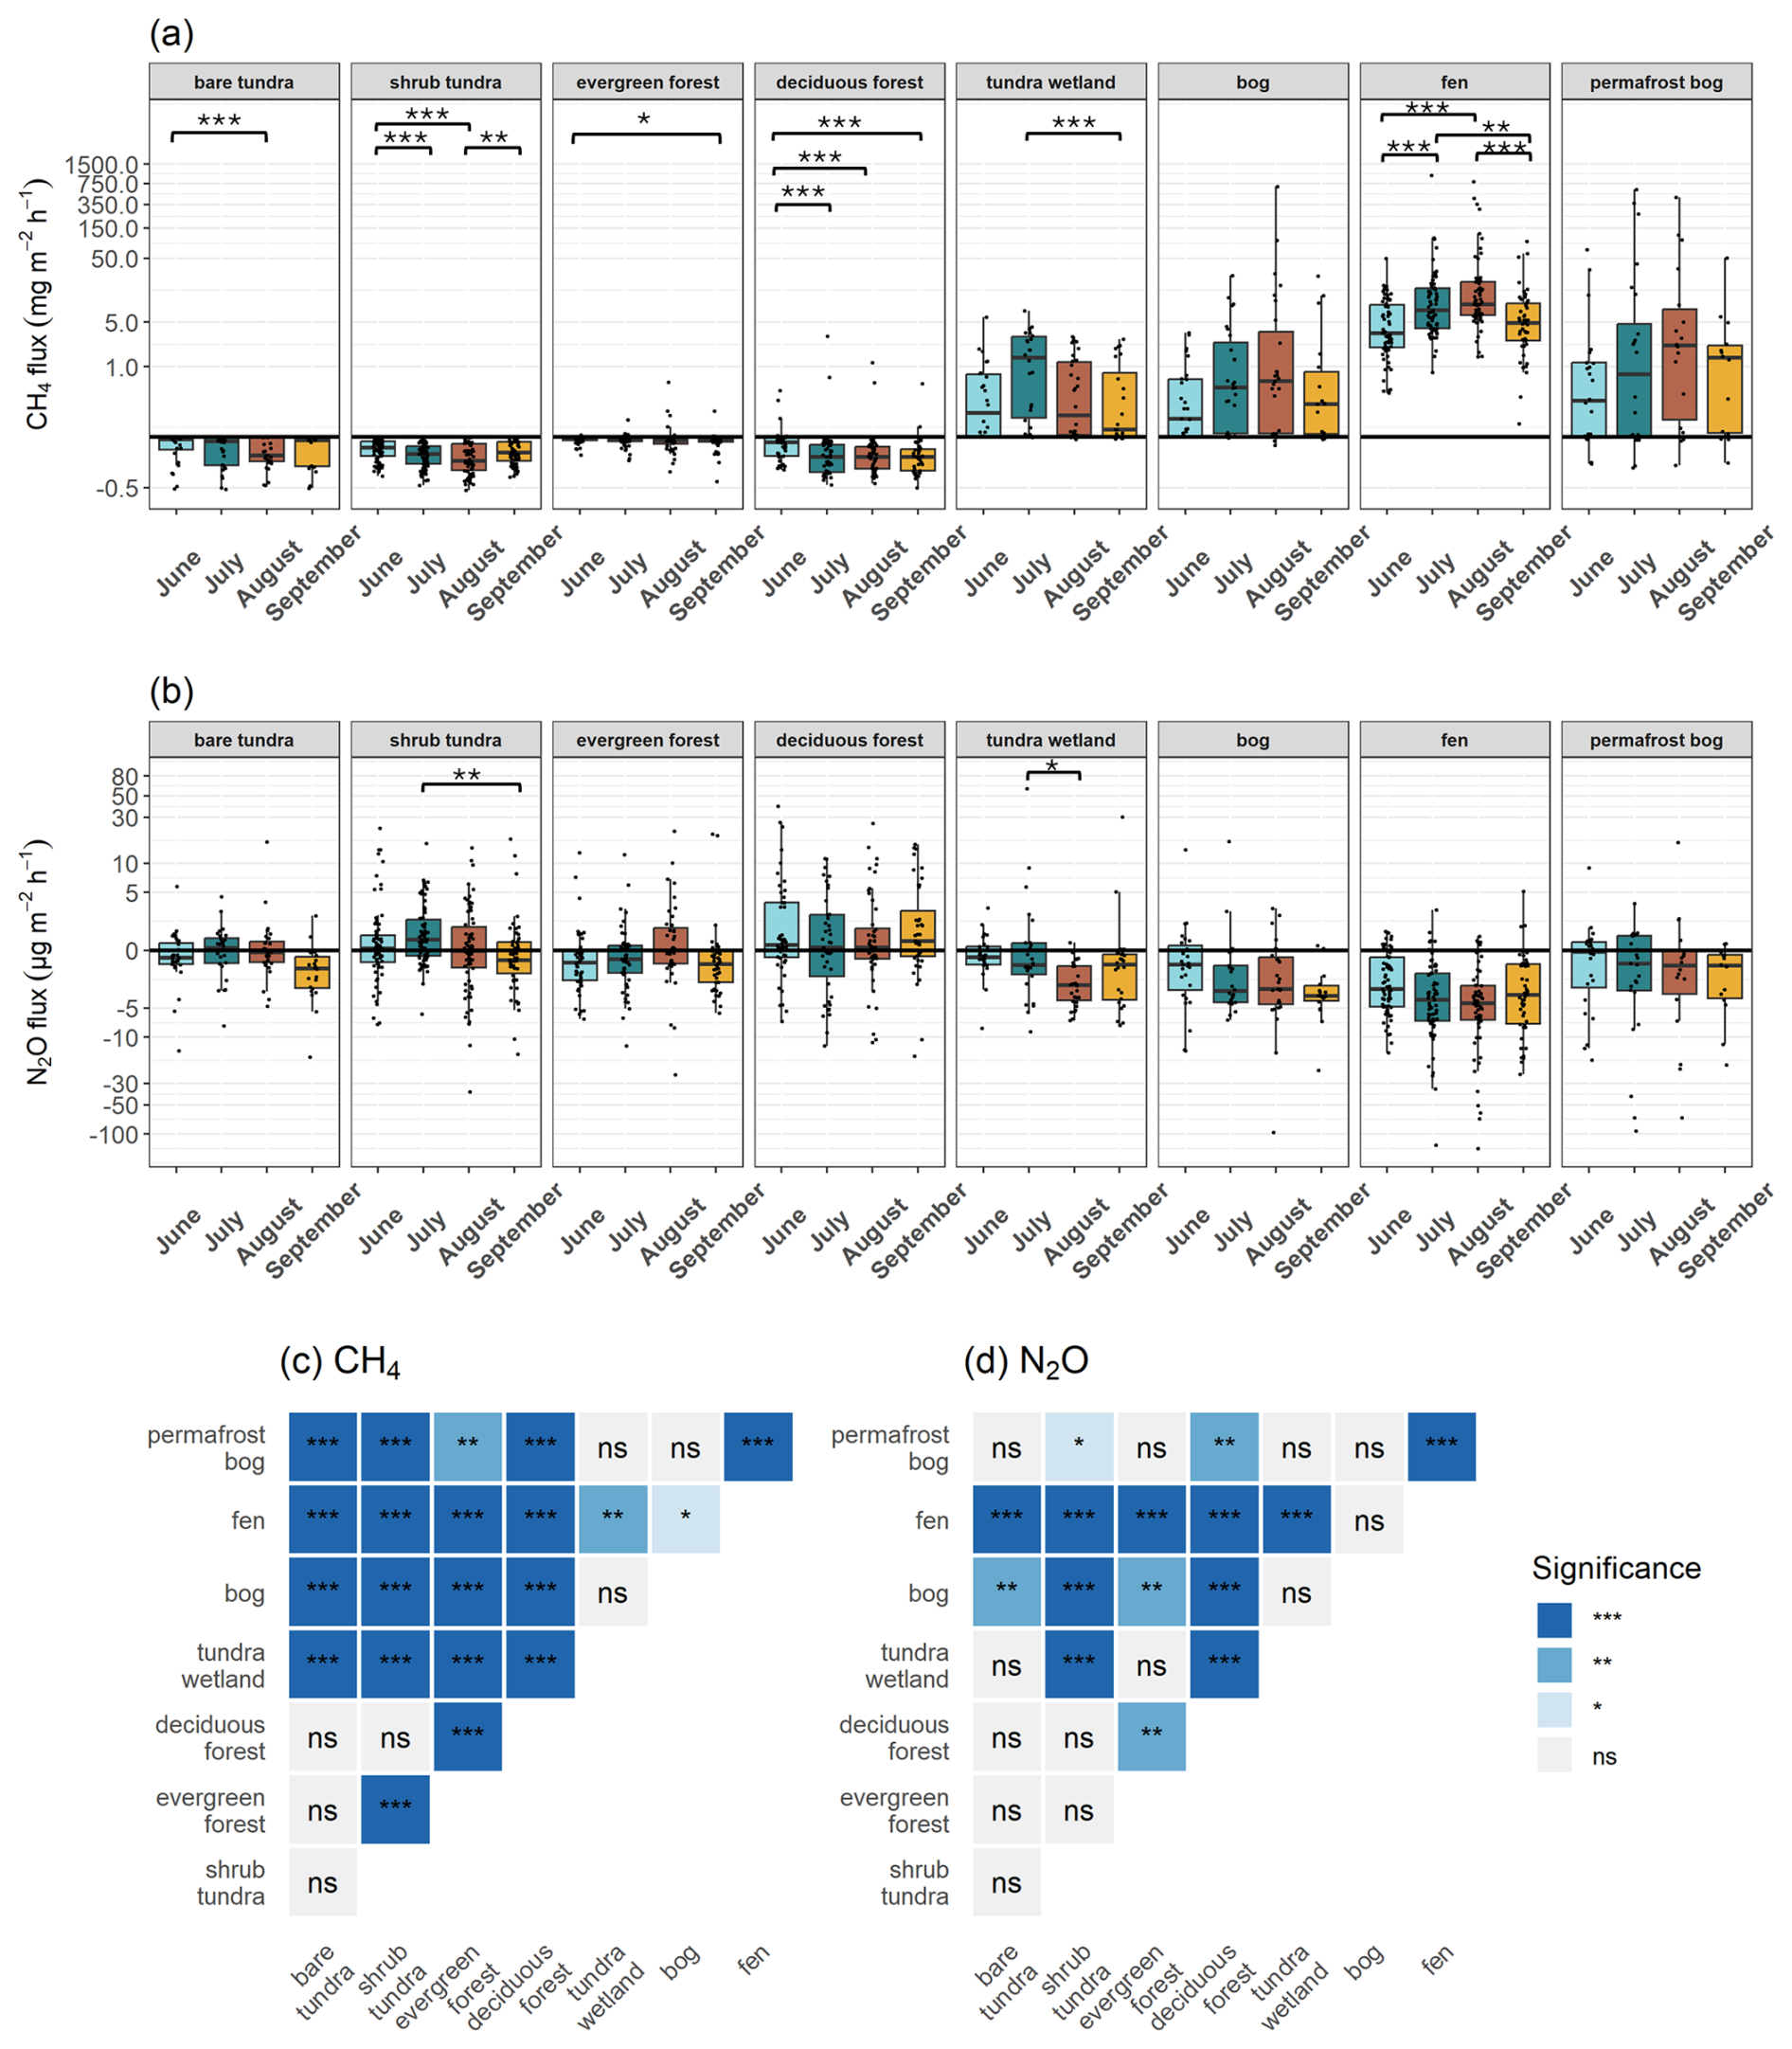
Figure 3Growing season variability of (a) CH4 and (b) N2O (both log10-transformed) with significant monthly differences in the eight land cover classes. Positive values are emissions and negative values are sinks. Boxplots have 25th and 75th quantiles, median (horizontal line), 1.5 IQR from the lower and higher quantiles (whiskers) and individual data points (black dots). In addition, significant differences between land cover classes for (c) CH4, and (b) N2O ( p<0.001, p<0.01, ∗ p<0.05).
3.3 N2O between land cover classes
N2O showed high variance within land cover classes, with fluxes ranging from −141 to 59.5 across all sites. Notably, all wetland types were on average, net sinks of N2O, although all land covers exhibited both positive and negative fluxes (Fig. 3b). Positive mean N2O fluxes were observed in deciduous forests (mean 1.70 ; range −15.6 to 39.2) and shrub tundra (0.44 ; −36.9 to 23.0). The strongest negative mean fluxes (net sinks) occurred in fens (−6.53 ; −142 to 5.13) and permafrost bogs (−5.40 ; −92.8 to 16.6). N2O sinks were also measured in bogs (−3.51 ), tundra wetlands (−0.89 ), bare tundra (−0.69 ), and evergreen forests (−0.52 ). Pairwise comparisons showed that 15 out of 28 land cover classes differed significantly in N2O fluxes (Table A8).
Mean CH4 and N2O fluxes were significantly inversely correlated (Spearman , p<0.001), with positive CH4 fluxes generally associated with strong negative N2O fluxes (sinks) (Fig. A2).
3.4 N2O Temporal trends
Unlike CH4, most land cover classes showed no significant trends between months for N2O (Table A6). However, there was a significant difference in N2O fluxes between years, where year 2025 had smaller positive N2O fluxes and larger negative fluxes (Fig. 7c for model results and Fig. A1 for observed yearly fluxes). Furthermore, within plot variability was often very high and some plots would measure both negative and positive fluxes in monthly repeated measurements.
3.5 Environmental variables
Soil temperature during the conducted chamber measurements varied between −0.02 and 22.18 °C (mean 10.23 °C). September was the coldest month (soil temperature) with the exceptions of evergreen forests, deciduous forests and permafrost bogs, where the coldest month was June. Mean soil temperatures peaked in July or August depending on the land cover (Fig. 4b), with the highest single measurements generally occurring during August. Soil moisture varied between 4.7 % and 60.7 % across all plots. Mean soil moisture was highest in fens (56.5 %), followed by tundra wetlands (55.4 %), bogs (40.8 %), permafrost bogs (34.2 %), evergreen forests (32.5 %), deciduous forests (31.9 %), shrub tundra (26.9 %) and bare tundra (25.2 %). Generally, soil moisture was highest in June due to snow melt waters and then steadily dropped towards August. Depending on the land cover, August or September was generally the driest month (Fig. 4a). Green vegetation cover ranged from 0.01 % to 85.6 %, with mean values highest in deciduous forest (37.5 %) and lowest in bare tundra (3.2 %); other land covers were between 12 %–25 %. Green vegetation cover peaked in July or August depending on the land cover while the lowest values were recorded in June and September (Fig. 4c). Soil pH was acidic across all plots except for a few locations with dolomite runoff. Mean pH was highest in tundra wetlands (5.53), likely reflecting the influence of dolomite runoff at these sites, followed by bare tundra (4.99), deciduous forests (5.07), fens (4.78), shrub tundra (4.49), bogs (4.22), evergreen forests (4.34) and permafrost bogs (4.12) (Fig. 4d).
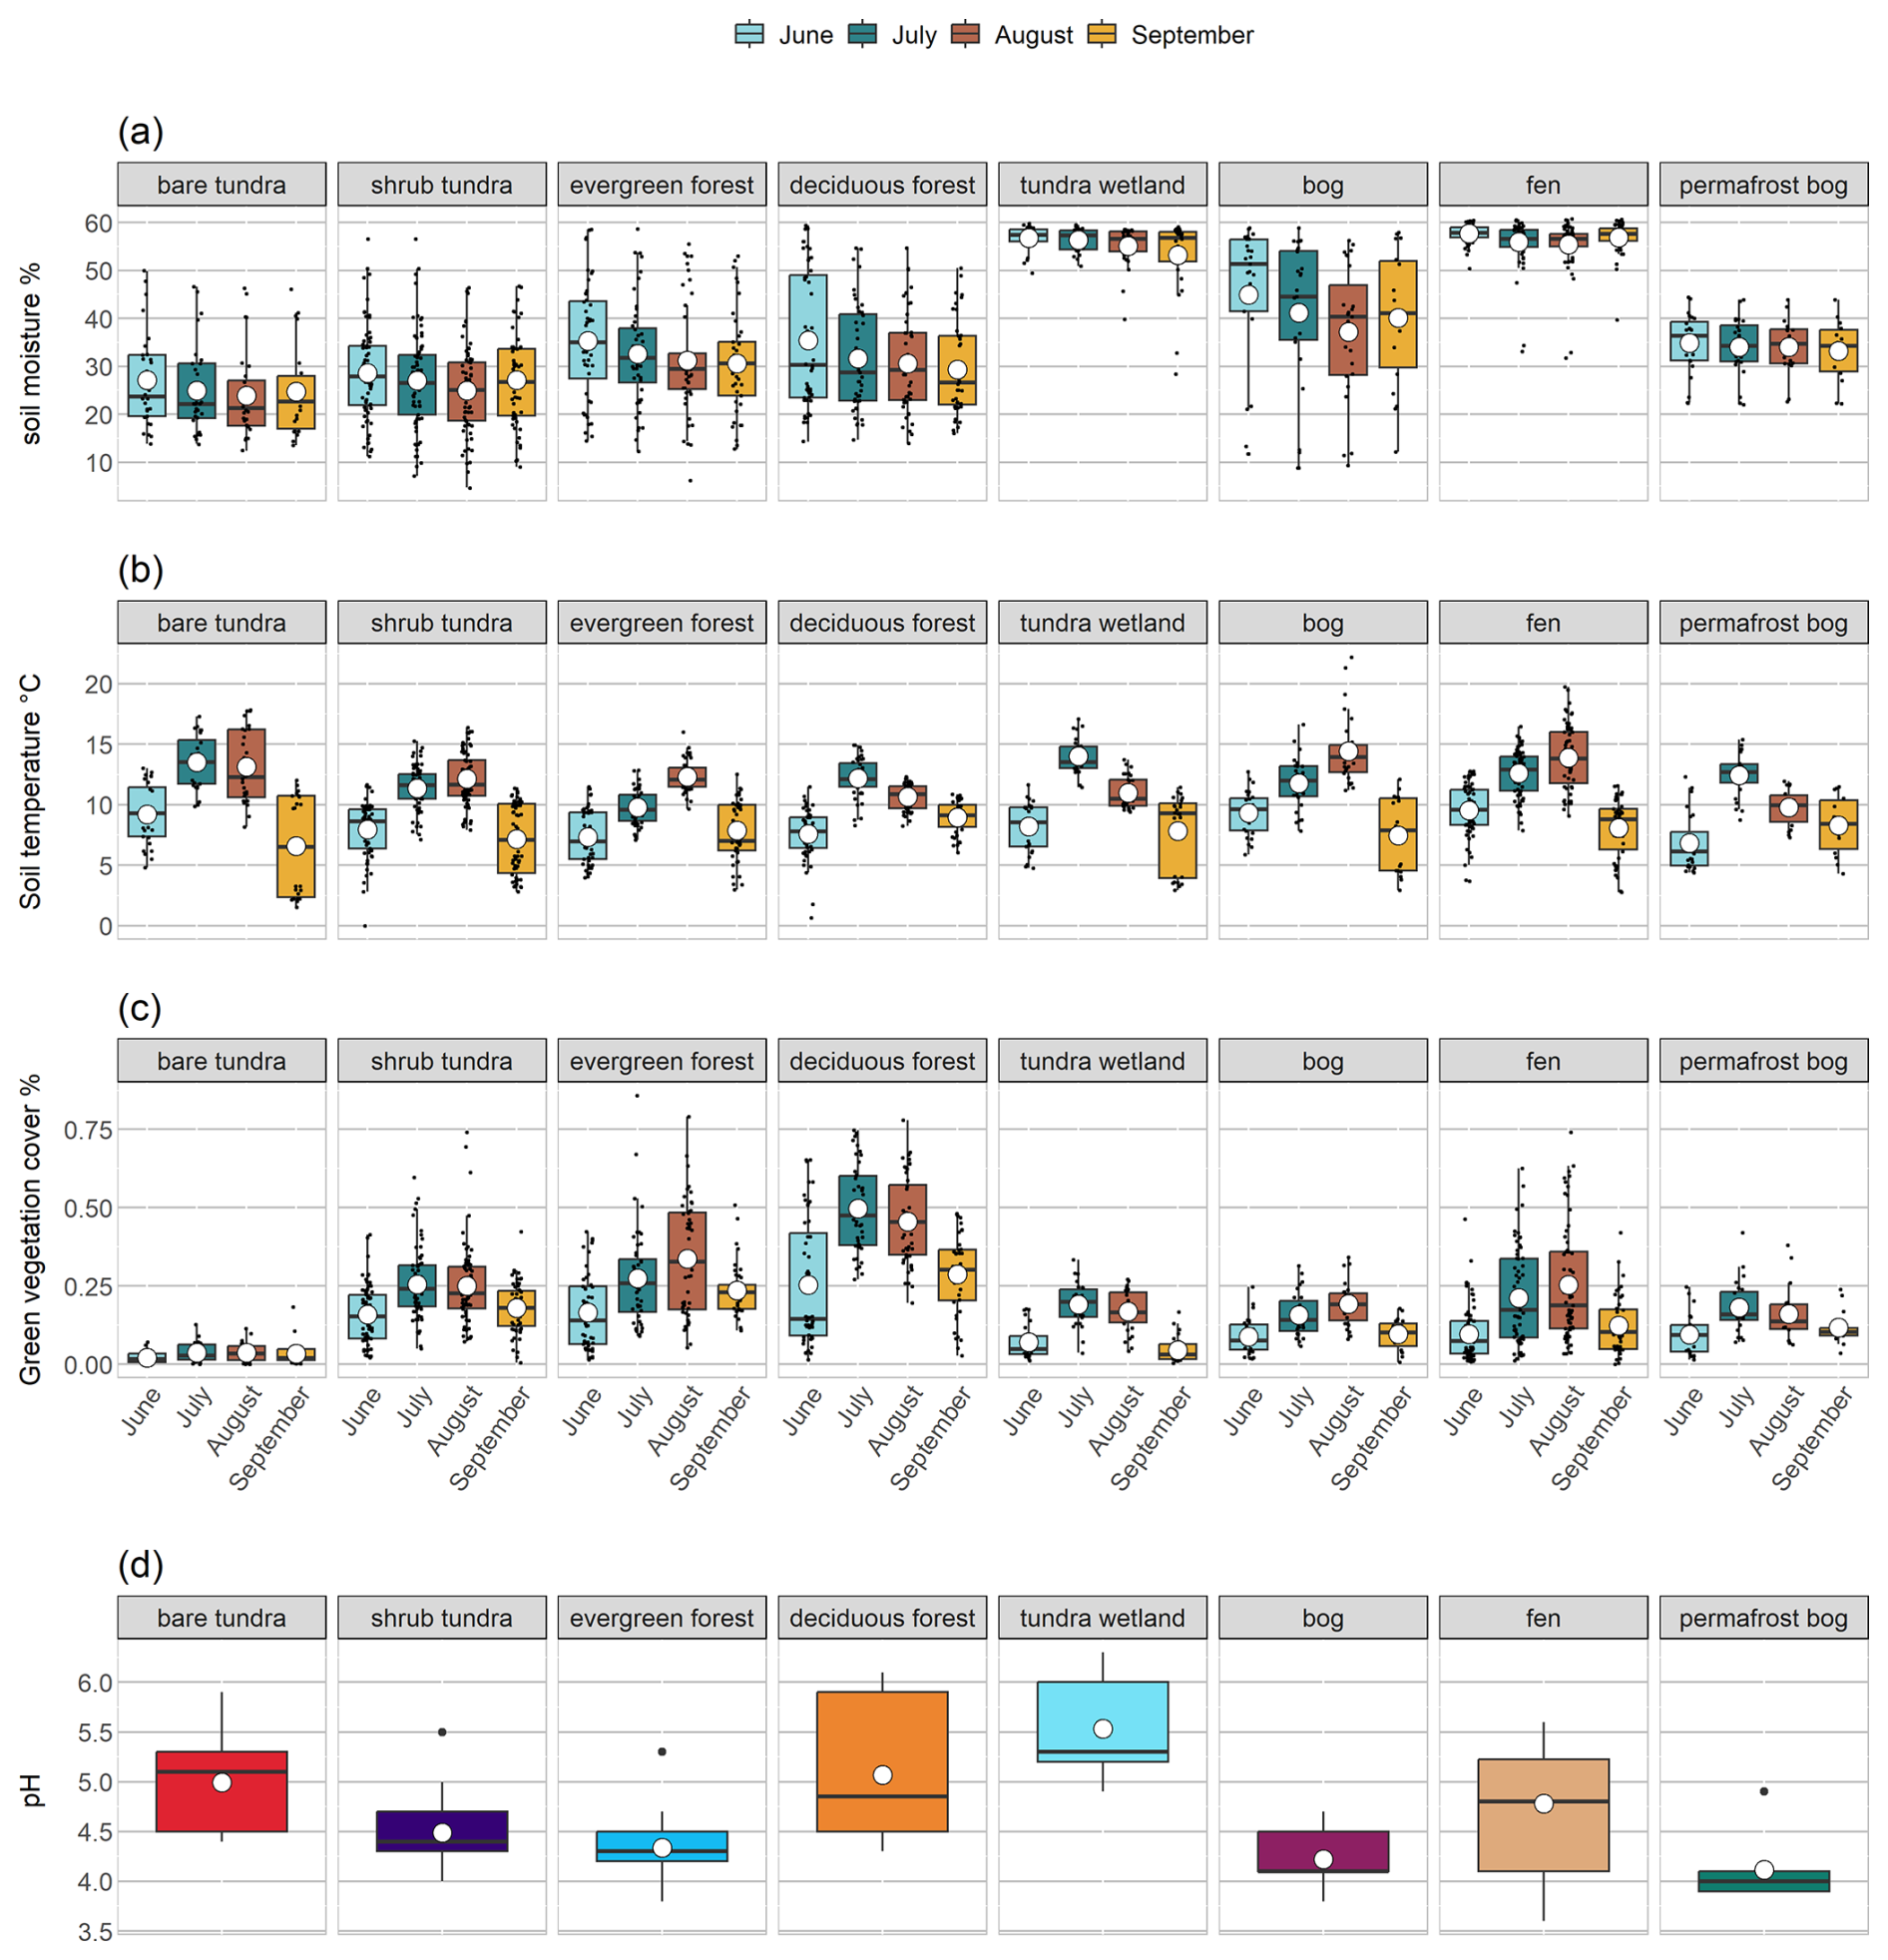
Figure 4Observed variation in soil and vegetation characteristics. Boxplots of (a) soil moisture, (b) soil temperature and (c) green vegetation cover between different land covers and months and (d) pH between land covers. Boxplots have 25th and 75th quantiles, median (horizontal line), mean (white dot), 1.5 IQR from the lower and higher quantiles (whiskers).
3.6 Multivariate models
3.6.1 CH4
The mixed-effects model for CH4 showed high explanatory power (R2 cond.=0.96, R2 marg. 0.81). Moisture, temperature and pH all influenced CH4 fluxes, however the direction of the response was dependent on the land cover (Figs. 5 and 6). Highest effect variables based on partial eta-squared (η2p) were soil temperature (interaction) and pH (interaction) (Fig. 5, final model). For land cover main effect, the CH4 fluxes were highest in fens, followed by bogs, permafrost bogs, tundra wetlands, evergreen forests, bare tundra, shrub tundra and deciduous forests (Table A3). All dry land cover classes modelled as net sinks (negative fluxes).
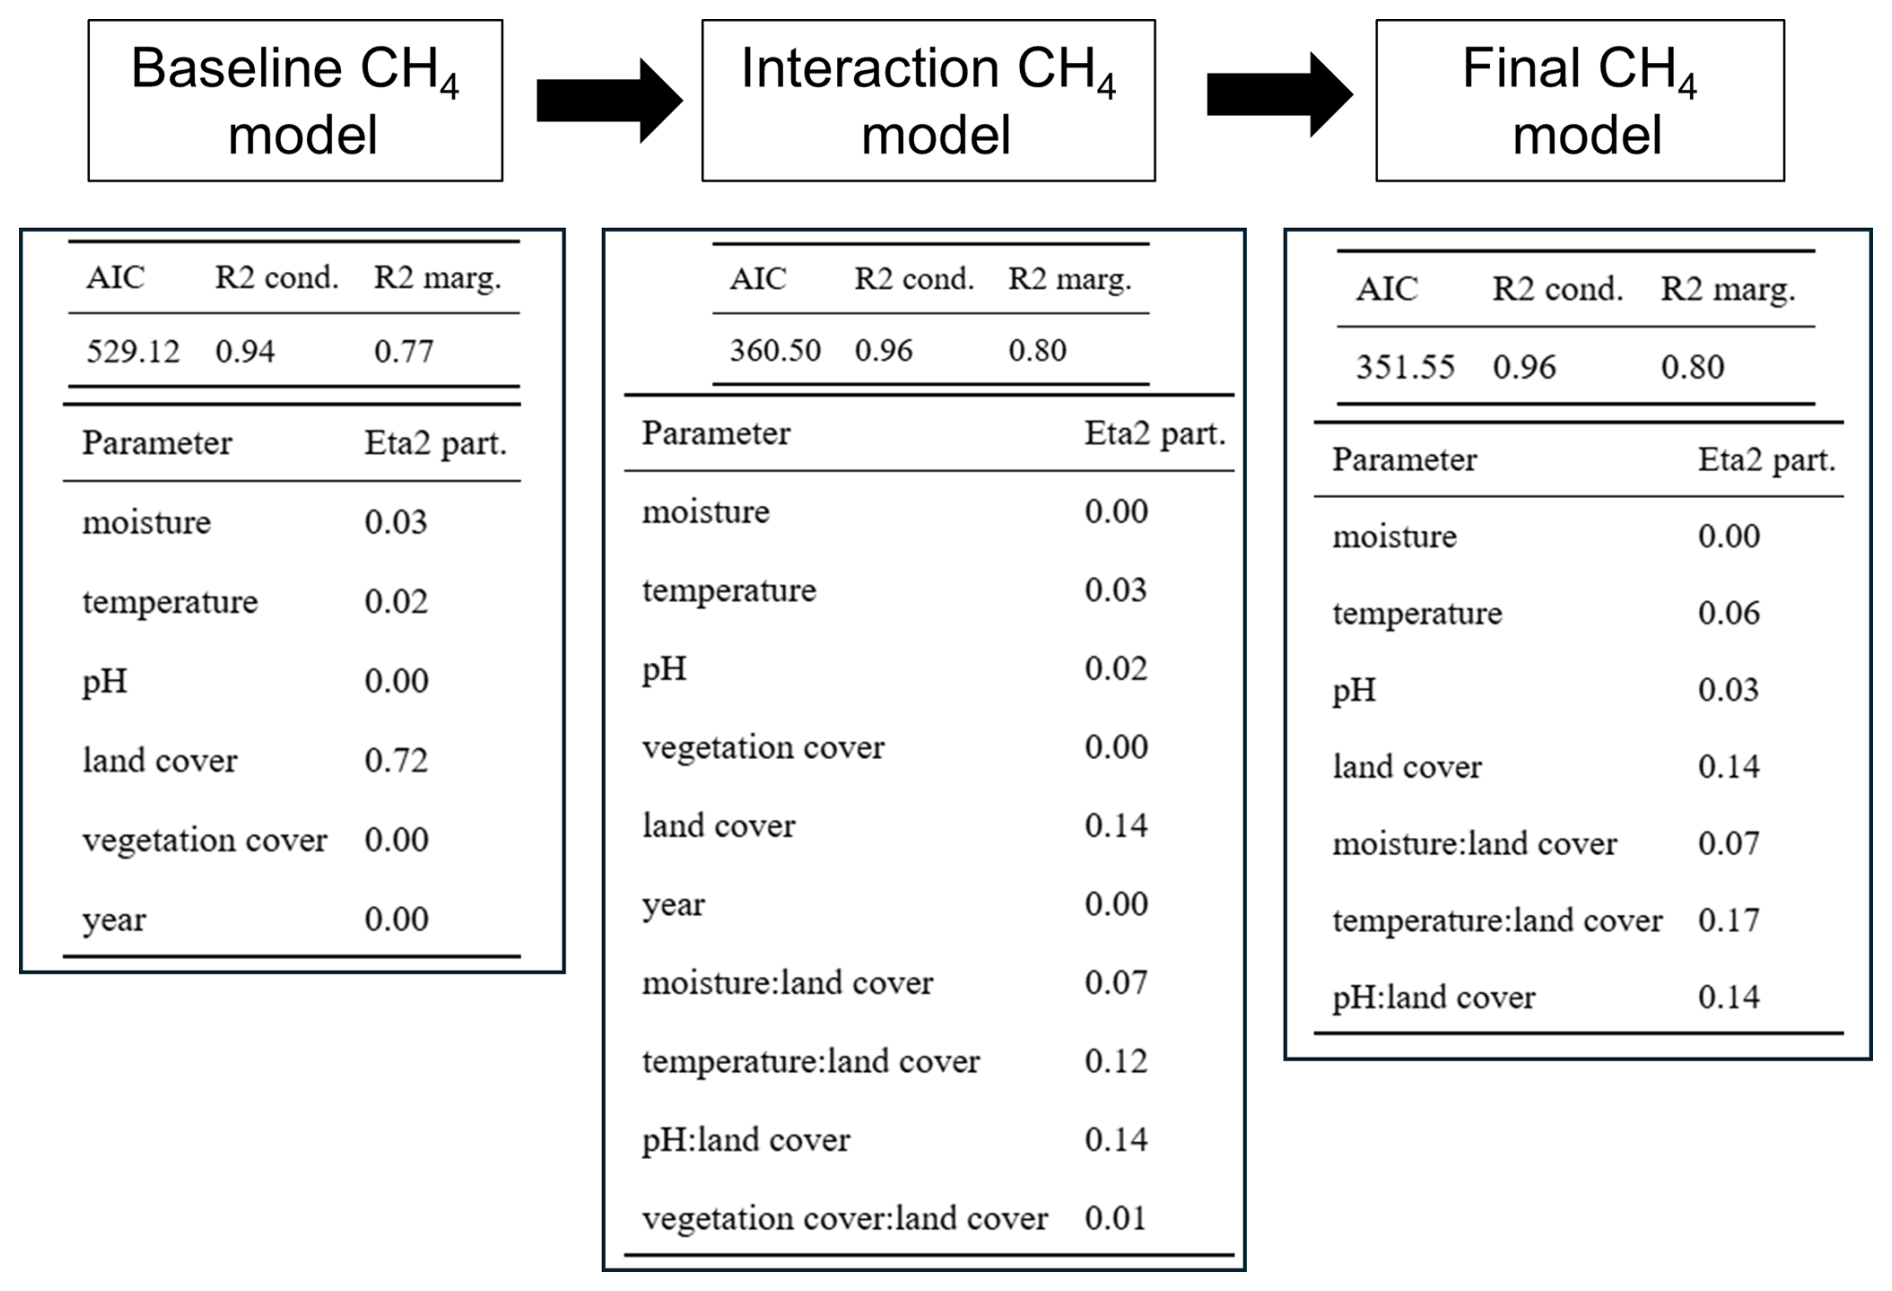
Figure 5Model performance indicators and effect sizes for the CH4 linear mixed-effects models. The baseline model, which included only main effects, showed lower explanatory power compared to the interaction model that incorporated interactions with land cover class. The final model was obtained after removing the least influential predictors based on AIC to achieve a more parsimonious model structure. Partial eta-squared (Eta2 part.) describes the effect size of each model parameter.
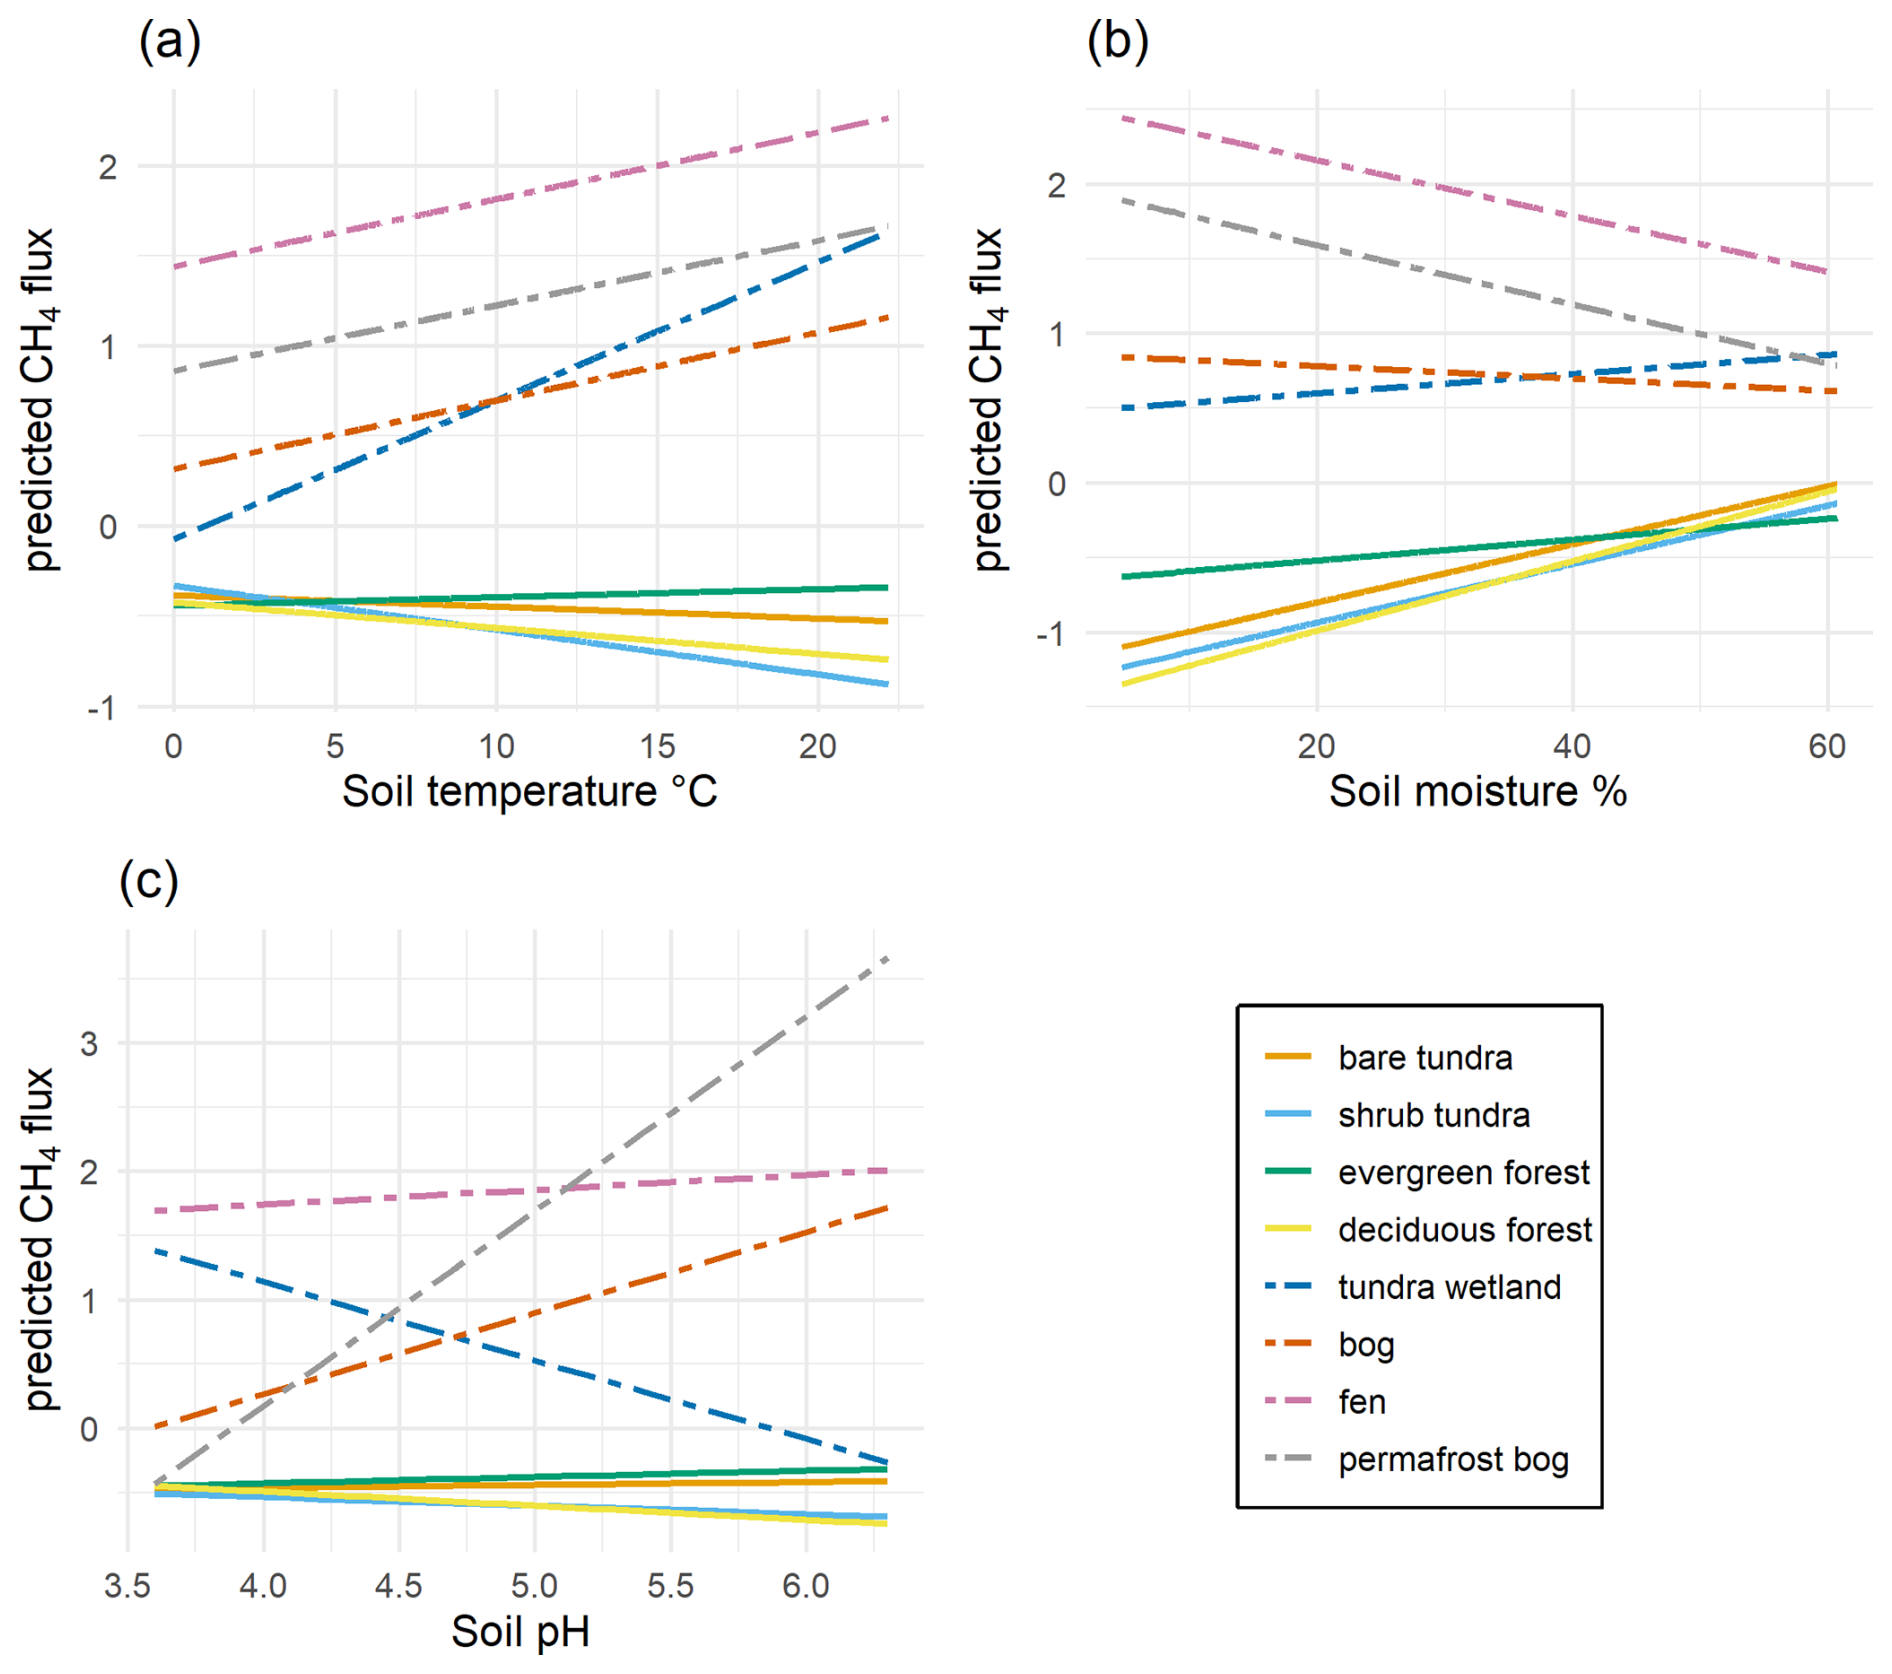
Figure 6Land cover specific modelled (linear mixed-effect model) responses of CH4 to (a) soil temperature, (b) soil moisture, (c) pH. All CH4 model variables included interaction terms, so no simple main effects are shown. Dashed lines represent wetlands. The figure includes only predicted (normalized) values for GHG fluxes.
3.6.2 N2O
The mixed-effects model for N2O showed modest explanatory power (R2 cond.=0.38, R2 marg.=0.30, Fig. 7). Modelled N2O fluxes were highest in deciduous forests, followed by shrub tundra, bare tundra, evergreen forests, tundra wetlands, bogs, fens and permafrost bogs (Fig. 8a). Based on η2p, land cover and its interaction with pH were the strongest predictors while both soil moisture and temperature had noticeably less effect (Fig. 7). Unlike CH4, years 2024 and 2025 also showed a noticeable difference for N2O with 2025 generally having smaller positive fluxes and larger sinks (Fig. 8, Table A7). In addition, vegetation cover had a small but significant effect on N2O fluxes depending on the land cover type (Figs. 7 and 8). The point identification random effect also had a weaker effect compared to the CH4 model.
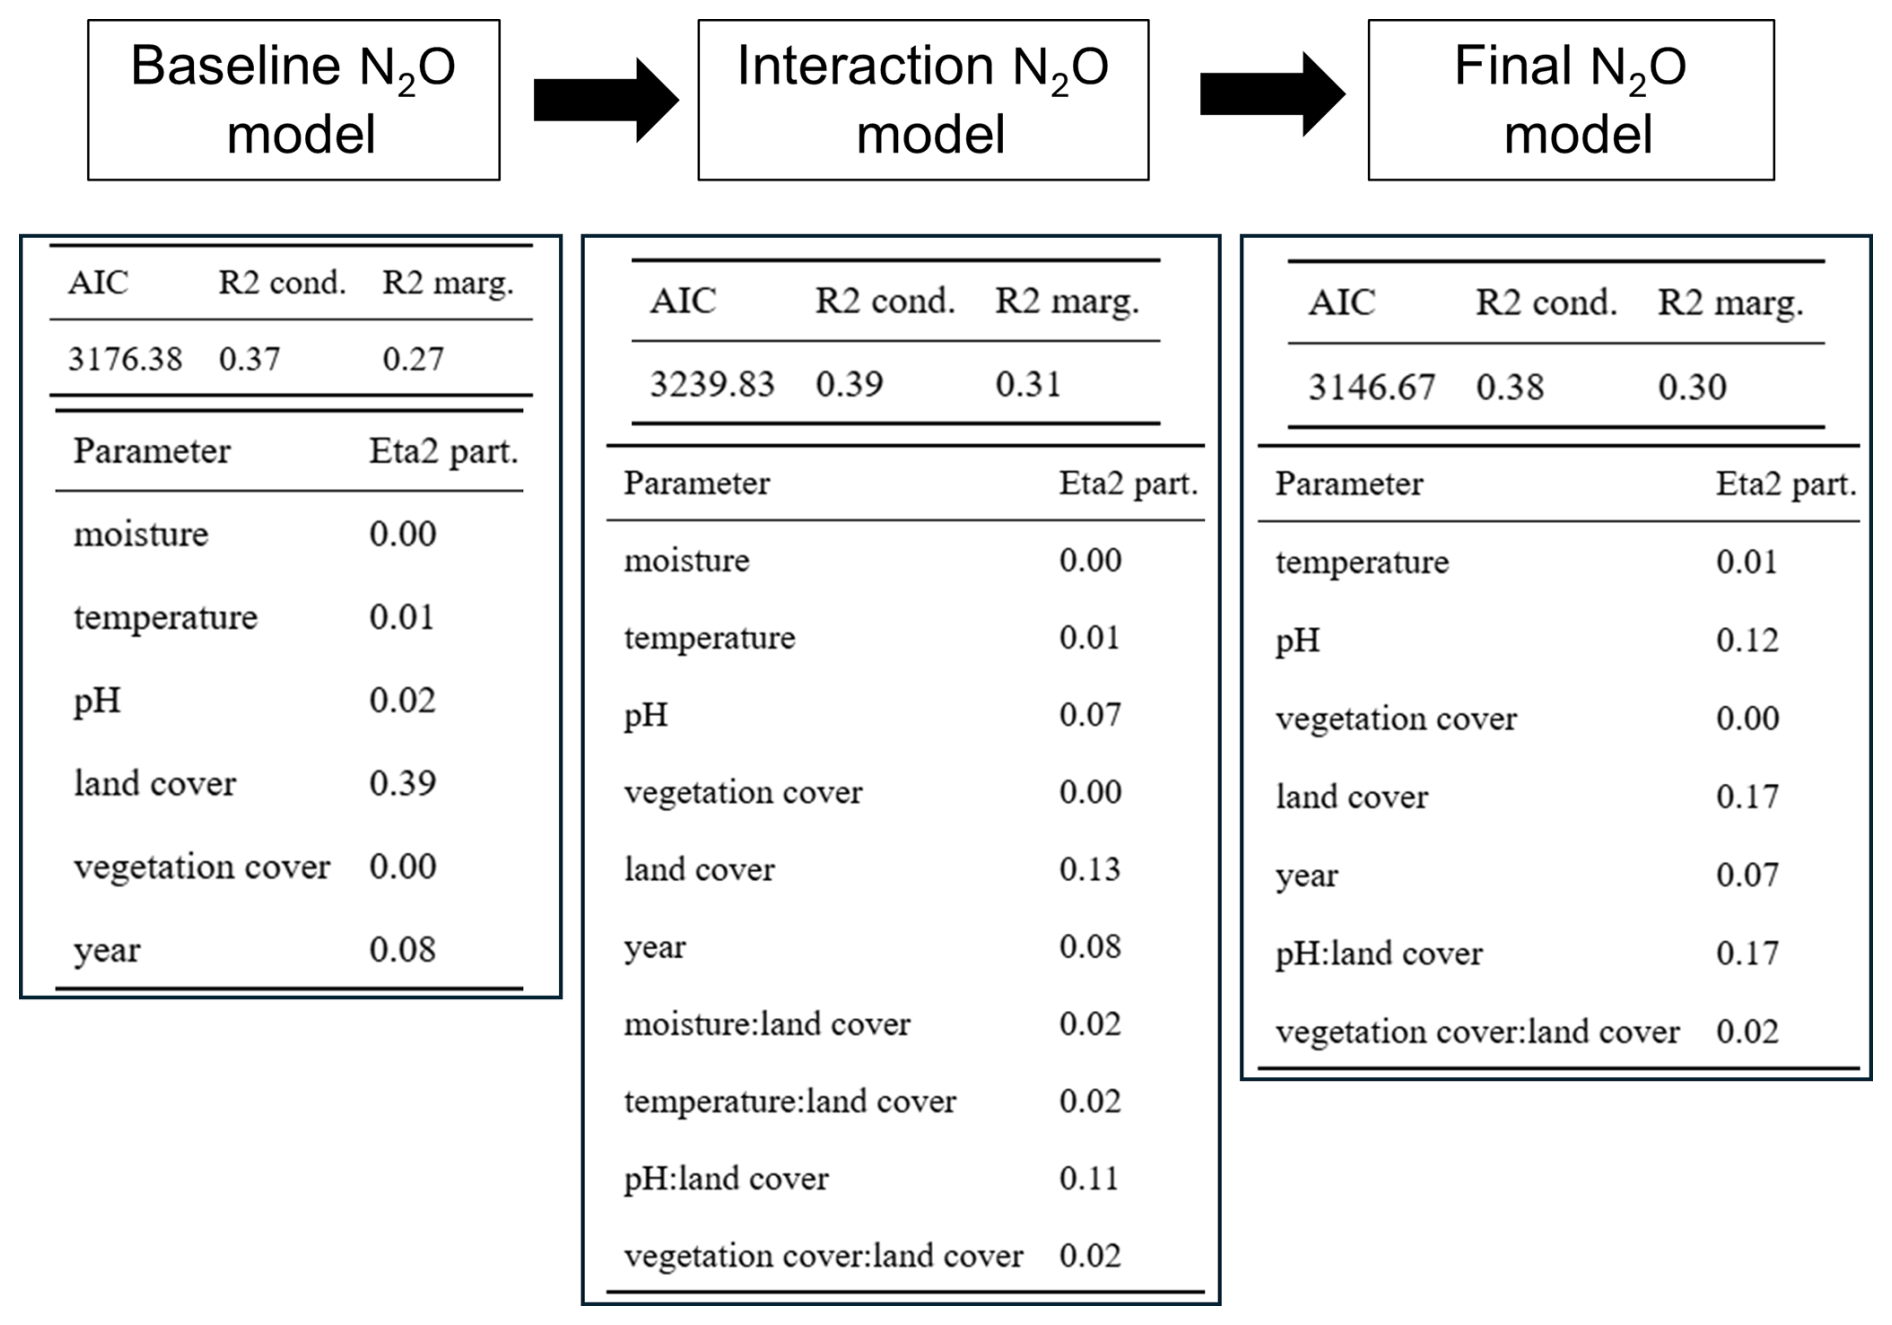
Figure 7Model performance indicators and effect sizes for the N2O linear mixed-effects models. The baseline model, which included only main effects, showed lower explanatory power compared to the interaction model that incorporated interactions with land cover class. The final model was obtained after removing the least influential predictors based on AIC to achieve a more parsimonious model structure. Partial eta-squared (Eta2 part.) describes the effect size of each model parameter.
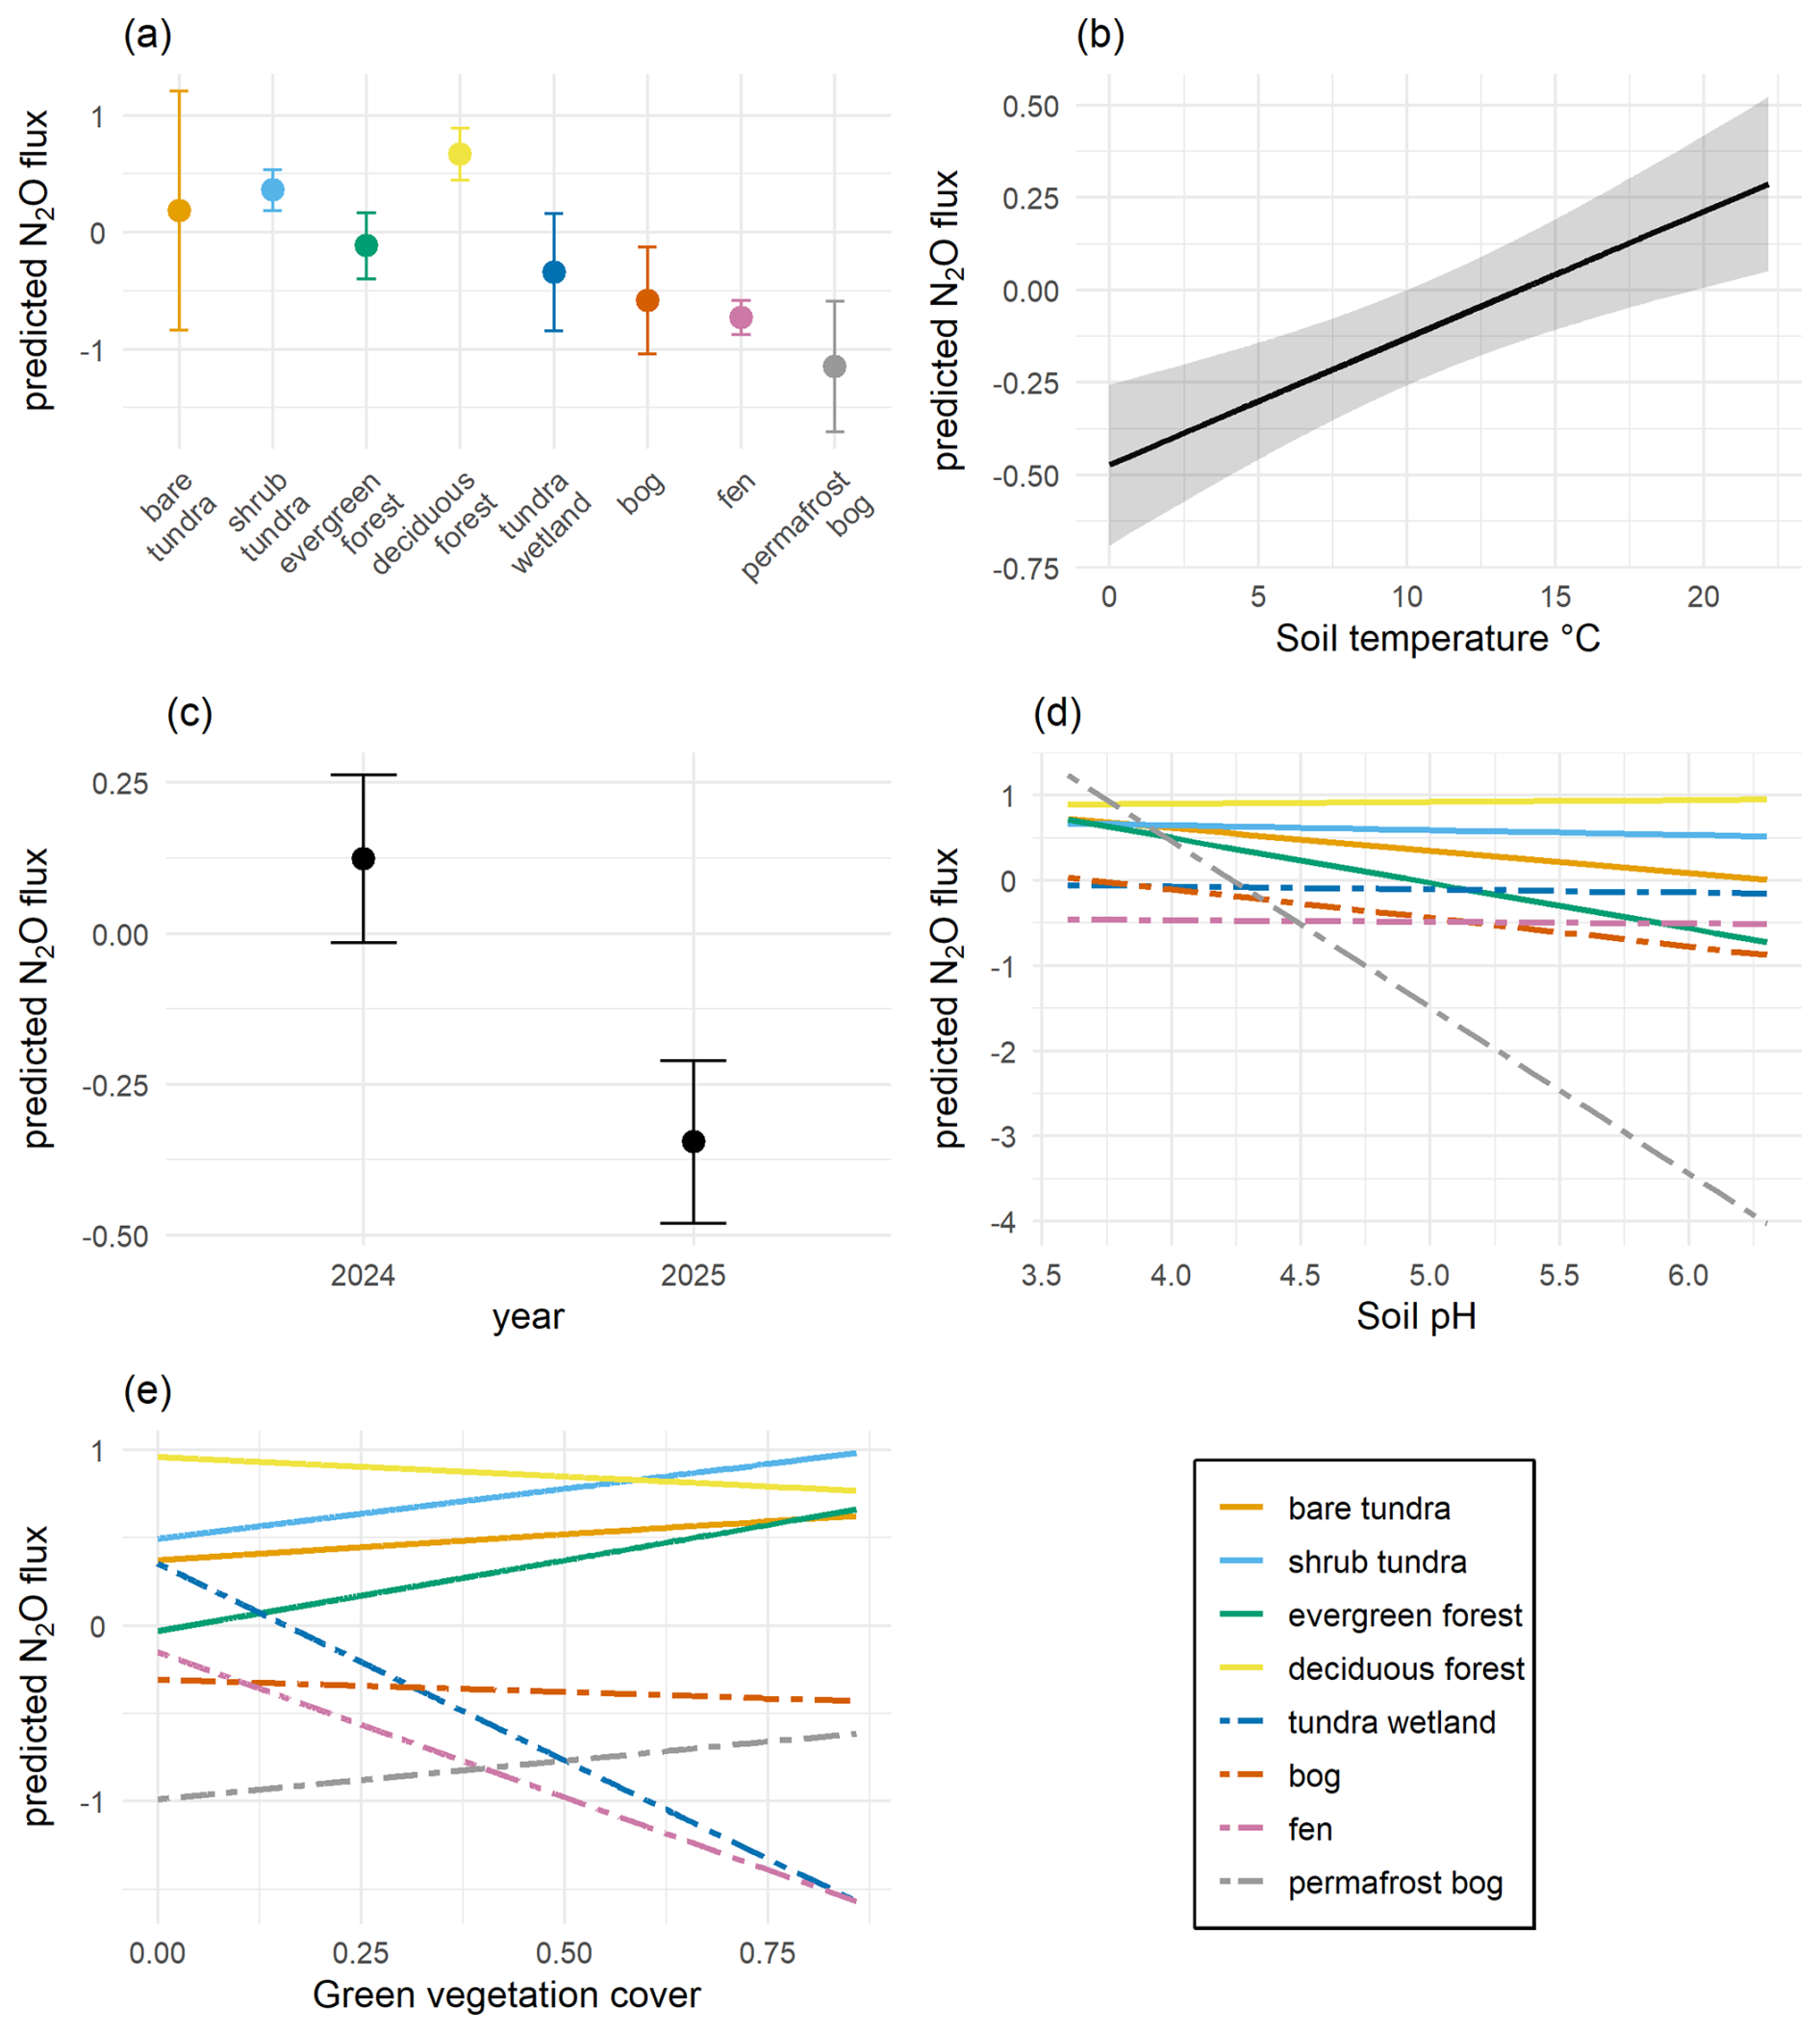
Figure 8Modelled (linear mixed-effects model) responses of N2O to (a) land cover, (b) soil temperature, (c) year, (d) pH-land cover interaction and (e) green vegetation cover-land cover interaction. Note differences in the scale of y axis between subfigures (use η2p for comparison of effect size between parameters). Dashed lines represent wetlands. The figure includes only predicted (normalized) values for GHG fluxes.
Our findings on the seasonal and spatial patterns of CH4 and N2O fluxes provide several insights into how environmental drivers shape gas exchange across high-latitude subarctic and boreal landscapes. Both GHGs showed strong variation among land-cover classes (research question i), with 21 of 28 pairwise comparisons being significant for CH4 (Table A7) and 15 of 28 for N2O fluxes (Table A8). The seasonal development of CH4 fluxes (research question ii) was strongly dependent on land-cover class, with significant differences between months observed mainly in fen, deciduous forest, and shrub tundra sites (Table A5). In contrast, N2O showed no clear seasonal trends (Table A6). Regarding environmental controls (research question iii), the strongest predictors of CH4 fluxes were soil temperature and pH, with a weaker effect of soil moisture. For N2O, pH was the strongest predictor, with weaker effects of year and green vegetation cover. For both GHGs, the direction and strength of these relationships often varied among land-cover classes. This suggests that the influence of environmental drivers is strongly context dependent and that the same change in environmental conditions can lead to contrasting flux responses across ecosystems. Consequently, broad-scale models based on uniform driver-response relationships may fail to capture important spatial variation in GHG exchange across subarctic and boreal landscapes.
4.1 GHG flux magnitudes
Dry land cover classes acted as net CH4 sinks (−0.16 to −0.05 , depending on land cover class) and as both N2O sources and sinks (−0.69 to 1.69 ). Wetlands were net CH4 sources (0.93 to 27.81 ) and net N2O sinks (−0.89 to −6.53 ), with fens and permafrost bogs having the highest CH4 fluxes and largest N2O sinks (see full descriptions of GHG magnitudes in Tables A1 and A2).
Overall, the wetland CH4 emissions were quite high but within maximum ranges reported in published literature (Turetsky et al., 2014; Tupek et al., 2015; Bao et al., 2021; Kuhn et al., 2021; Virkkala et al., 2026). Similar to our measurements, the ABCFlux CH4 database (Virkkala et al., 2026) also had peak fluxes in August. Our forest and tundra CH4 sinks were larger (more negative) than many previously reported values (Emmerton et al., 2014; Voigt et al., 2023; Virkkala et al., 2026), where some studies have even reported positive fluxes from upland tundra soils (Kuhn et al., 2021). Also, our mean net CH4 sinks peaked in August, whereas in the ABCFlux database CH4 sinks peaked in July (Virkkala et al., 2026). Our N2O sources were generally at the lower end of the reported ranges, while the N2O sinks were at the higher end (more negative) (Repo et al., 2009; Lohila et al., 2010; Marushchak et al., 2011; Tupek et al., 2015; Voigt et al., 2020; Virkkala et al., 2024; Triches et al., 2025).
4.2 Environmental drivers of CH4
We observed that CH4 emissions increased with higher soil moisture across most of the study sites. This pattern is consistent with the underlying microbial processes: methanogenesis occurs primarily in anaerobic soils (Le Mer and Roger, 2001; Lai, 2009), whereas methanotrophy dominates under aerobic conditions (Whalen, 2005; Lai, 2009). Soil oxygen content follows soil water content (Mainiero and Kazda, 2005) and as such soil moisture should have a direct causal effect on CH4 emissions. Our results show that in dry land cover classes, soil moisture was a good indicator for CH4. The few positive CH4 measurements in dry land cover classes (Fig. 3a) were always from ecotones close to wetlands or streams or because of spring snow melt waters saturating the soils for extended periods of time. Conversely, CH4 sinks in dry soils also grew stronger (more negative) with decreasing soil moisture. Notably, all mean and median fluxes for CH4 in dry land cover classes were negative. Christiansen et al. (2015b), Voigt et al. (2023) and Virkkala et al. (2024) reported similar findings, with soil moisture being one of the major drivers for CH4 sinks at high-latitude dry upland soils and Lohila et al. (2016) found that a prolonged wet autumn period changed a net CH4 sink forest into a net source for several months. Although the CH4 sinks are relatively small when compared to wetland emissions, dry tundra and boreal forest soils cover extensive areas of the northern hemisphere which leads to a globally significant CH4 sink (Jiang et al., 2025), and as previously mentioned (see Sect. 4.1), the sink magnitudes reported here are larger than in many previous studies. The soil CH4 sink is still poorly constrained in global CH4 budgets (Saunois et al., 2025) and should be considered in further studies.
In wetland environments, soil moisture has a more complex relationship to CH4. Often the wetland types with highest soil moisture (i.e. fens and marshes) are also the highest CH4 emitters (Kuhn et al., 2021), however within those wetland types, increased soil moisture does not necessarily increase CH4 flux (Knox et al., 2019). Our results show that, within the different fen sites, the wettest soils were not the largest emitters (Fig. 5b). Soil moisture also did not increase CH4 emissions in bogs or permafrost bogs. In permafrost bogs, intact permafrost bogs exhibited higher soil moisture but acted as substantially smaller CH4 sources compared to fully degraded ones. This suggests that additional factors, such as soil pH, vegetation, or active layer thickness, may play a more important role in regulating wetland CH4 fluxes. Similar results were reported by Turetsky et al. (2014) and Rinne et al. (2018), who found that CH4 fluxes were smaller in fully flooded wetland soils and that higher water-table levels alone did not predict higher fluxes in boreal fens. Our findings suggest that there is an upper threshold of soil moisture for methanogenesis in wetlands, beyond which further increases in soil moisture no longer increase CH4 fluxes. Reduced CH4 emissions at sites with extreme soil moisture are likely the result of differences in substrate availability (i.e. less labile organic material) and temperature regime (Strack et al., 2004).
Soil temperature and land cover interaction was the strongest predictor for CH4 fluxes (Fig. 5) and soil temperature has been identified as a key driver of CH4 fluxes in many previous studies (Turetsky et al., 2014; Knox et al., 2019; Kuhn et al., 2021; Kübert et al., 2026). Soil temperature directly affects both methanogenesis and methanotrophy as they are microbial processes and therefore causally linked to soil temperature through the temperature-dependence of microbial activity (Moore and Dalva, 1993; Biasi et al., 2005; Deslippe et al., 2012). This also indicates that rising temperatures can intensify CH4 dynamics in opposite directions where the net effect on emissions is dependent on the ecosystem's temperature sensitivity (Zhang et al., 2021). This effect can also be seen in our modelled CH4 flux responses (Fig. 6a), where wetland CH4 fluxes have a positive response to higher temperatures and dry land cover classes have a negative response, with higher temperatures leading to larger sinks (i.e. net-sink environments become stronger sinks and net-source environments emit more CH4). Additionally, warming can affect the amount of organic material available for decomposition through increased GPP as higher mean temperatures generally increase biomass which could further enhance CH4 fluxes (Knox et al., 2021). Thus, rising temperatures under climate change can strengthen both CH4 sinks and CH4 sources depending on land cover type, meaning that long-term changes in net CH4 emissions will depend largely on shifts in land cover and ecosystem distributions and their effects on soil conditions.
Soil pH had a strong but mixed influence on CH4 fluxes depending on land cover type (Figs. 5 and 6c). This response appeared to be related to the overall pH of these environments. Low-pH systems, such as permafrost bogs, bogs, and evergreen forests (Fig. 4d), showed a positive response to increasing pH, meaning higher CH4 fluxes. In contrast, higher-pH environments, such as tundra wetlands and deciduous forests, showed the opposite pattern, meaning smaller fluxes with increased pH. It is worth noting the overall pH range was between 3.6–6.3 and as such, most vegetation and soil biota, including microbes, are adapted to acidic conditions (Kip et al., 2011; Yao et al., 2023). At the lower end of that pH range, many plant species and microbes can exist at the far end of their acidity tolerance (Yao et al., 2023) and even small increases in pH could increase their overall activity. This may explain the strong response seen in bogs and permafrost bogs as pH increases. At the opposite end, some of the tundra wetland and deciduous forest sites are affected by dolomite runoff from the surrounding watershed which significantly increases the overall soil pH. At these sites a higher pH decreased the CH4 flux (Fig. 6c), which could indicate that methanogenesis is inhibited by higher pH while methanotrophs benefit from it. Conversely, it could also be a result of methanogenetic Archaea being more tolerant of acidic conditions than methanotrophs (Weslien et al., 2009). Other factors could also be of importance, specifically nutrient availability and vegetation are partly controlled by soil pH and directly affect CH4 dynamics. Nonetheless, pH can exert a strong effect on CH4 fluxes and should be considered in further studies.
4.3 Environmental drivers of N2O
Similarly to CH4 production and consumption, N2O dynamics are also governed by microbial processes and are therefore influenced by factors such as soil temperature, moisture, pH, and vegetation. N2O is mostly produced in the denitrification process where nitrates are reduced back into N2 (Butterbach-Bahl et al., 2013). Other possible, but less important pathways include nitrification and nitrate/nitrite reduction to ammonium (Butterbach-Bahl et al., 2013). Soil oxygen content has a causal link to N2O flux as nitrification generally only occurs in aerobic conditions and denitrification and reduction to ammonium mostly occur in anaerobic conditions (Shan et al., 2021). However, N2O showed a much weaker response to the environmental variables compared to CH4, and the explanatory power of the models was correspondingly smaller (Fig. 7). In addition, N2O showed a significant difference between measurement years which remained unexplained by the other factors, suggesting that some key explanatory variables were missing from the model. Year 2024, which had the higher mean N2O fluxes, was considerably warmer during the measurement period than 2025. Difference in growing season mean temperature for Pallas was 0.90 and 1.35 °C for Kilpisjärvi (Table 1). It is possible that these temperature differences contributed to the observed patterns. However, because soil temperature showed only a weak relationship with N2O fluxes, any such effect was likely indirect, for example through the influence of air temperature on vegetation. Previous studies have identified sources of N2O from many high-latitude environments such as unvegetated permafrost peat plateaus and palsas (Marushchak et al., 2011) and both vegetated and unvegetated permafrost tundra soils (Voigt et al., 2020) but also sinks from nutrient-poor permafrost peatlands (Triches et al., 2025) and grasslands and forests (Chapuis-Lardy et al., 2007). In our measurements, we found strong sinks from wetlands, while dry land cover classes had medians close to zero fluxes, however there was a noticeable amount of both negative and positive extreme values (Fig. 3b) and many land cover classes and single measurement plots exhibited both negative and positive fluxes. This type of flux behaviour is not uncommon (Lohila et al., 2010; Tupek et al., 2015) and highlights the spatiotemporally sporadic behaviour of N2O, where many plots have zero or small positive N2O emissions, yet a small number of plots can act as significant hotspots, both for sinks and sources (Marushchak et al., 2011; Triches et al., 2025).
Table 1Long-term (1991–2020) and study-period (2024–2025) mean temperatures and precipitation during the growing season (June–September). Data were obtained from the nearest weather stations (Kilpisjärvi Kyläkeskus and Muonio Kirkonkylä).

Soil temperature and moisture generally had modest effects on N2O fluxes and much of the variability was explained by pH and land cover (particularly wetlands). Our highest measured mean N2O fluxes came from deciduous (mountain birch) forests, which also had comparatively higher soil pH (Fig. 4d). Cryoturbation and the absence of vegetation have been occasionally reported as having an increasing effect on N2O fluxes, especially in permafrost soils (Repo et al., 2009; Marushchak et al., 2011; Voigt et al., 2020). However, we found no strong evidence for such an effect in our measurements from peat soils or tundra cryoturbation plots. Both bare tundra and permafrost bogs acted as small net sinks for N2O (Fig. 3b), and vegetation cover only had a small effect in the model results.
It is possible that low soil nitrogen availability is the primary reason for the small N2O fluxes, while also being a key missing variable in the model. Nitrate () and nitrite () are the preferred electron acceptors in denitrification, thus in the presence of excess soil nitrogen content, N2O would not be reduced and would likely result in larger positive fluxes. Furthermore, there is evidence of reliant pathways of methanotrophy that can produce N2O in low oxygen conditions such as wetlands (Kits et al., 2015).
4.4 N2O sinks
The largest N2O sinks were found in wetlands, specifically in fen plots (Fig. 3b). This may appear counterintuitive as denitrification, which is the main pathway for N2O production (Butterbach-Bahl et al., 2013), requires anoxic conditions which wetlands typically have. The reason is likely in the last step of the denitrification chain where N2O is reduced. In anoxic conditions with high ratios or low concentrations, the denitrification process is fully completed, N2O is produced but then reduced into N2 gas (Kolb and Horn, 2012; Brummell et al., 2012; Pessi et al., 2022). In these low-nitrate conditions, any excess N2O would be rapidly reduced, including atmospheric N2O, resulting in a net sink.
Other less studied pathways for N2O sinks and the inverse N2O and CH4 correlation involve anaerobic methane oxidation driven by denitrification (Valenzuela et al., 2020; Tan et al., 2025). It follows that in soils rich in CH4, such as wetlands, substantial methanotrophic activity would occur throughout the soil profile, provided that environmental conditions permit it (Whalen et al., 1990). However, chamber measurements only capture the net CH4 flux, so if net oxidation is smaller than net CH4 production, the oxidation would not be detected. Anerobic methane oxidation (AOM) is a well-known process in marine environments (Hinrichs and Boetius, 2003; Reeburgh, 2007), but less so in wetlands, yet there is growing evidence for its importance (Smemo and Yavitt, 2011; Cai et al., 2021; Cheng et al., 2021). In AOM, CH4 can be used as electron donor for reducing nitrite and N2O, which would act as an additional sink of N2O (Valenzuela et al., 2020; Cheng et al., 2021; Tan et al., 2025). However, the magnitude of these pathways in natural systems is unknown and somewhat hypothetical at this point and needs more research to be confirmed. Furthermore, the negative relationship between CH4 and N2O fluxes was restricted to wetland ecosystems (Fig. A2b). This suggests that the coupling between CH4 and N2O dynamics depends on environmental conditions and may be strongest under the wet and anaerobic conditions characteristic of wetlands. Regardless of the underlying mechanisms, based on our measurements, wetlands can act as notable N2O sinks in the right conditions.
The monthly repeated measurements and two-year design resulted in a robust overall dataset, even though some land cover classes, such as permafrost bogs, were represented by fewer plots. Generic environmental variables that can be measured from anywhere make the models easily applicable everywhere, but it also limits the number of usable explanatory variables. Modelling across diverse environments (i.e. not solely focusing on specific ecosystems such as wetlands) provides a valuable opportunity to capture a wide range of ecosystem behaviors, though it naturally results in more complex data structures. In particular, wetland GHG fluxes often show substantial variability, including occasional high fluxes far above median values (Kuhn et al., 2021; Saunois et al., 2025). These contrasts become pronounced when wetlands and non-wetland systems are analyzed together due to their inherently different flux magnitudes. Furthermore, capturing seasonal changes requires repeated measurements which limit the available statistical methods due to pseudoreplication. These complexities were effectively addressed in our statistical analyses through the use of robust and flexible approaches, including mixed multivariate models, appropriate data transformations, and non-parametric tests.
The multivariate and correlative nature of our models makes it challenging to directly disentangle causal pathways. Also, some variables, such as land cover, function as a composite descriptor of multiple co-varying environmental conditions rather than a direct mechanistic driver. Because land cover classes ultimately reflect underlying temperature, moisture, and other soil properties, these environmental factors are the more direct drivers of GHG fluxes than land cover per se.
Opaque (“dark”) chambers are used to reduce uncertainties caused by changes in chamber temperature or possible interactions between photosynthesis and GHG fluxes and are typically the default method for measuring CH4 and N2O fluxes (Livingston and Hutchinson, 2009; Pavelka et al., 2018; Clough et al., 2020). However, there is recent evidence of CH4 and N2O fluxes being affected by varying light conditions (Voigt et al., 2023; Triches et al., 2025). Thus, it is possible that GHG fluxes measured with transparent and opaque chambers are not directly comparable and the additional use of transparent chambers should be considered in future research.
Across all ecosystems, we found consistent contrasts in greenhouse gas dynamics, with tundra and forest sites acting as modest CH4 sinks and wetlands functioning as strong CH4 sources, whereas N2O flux patterns were more subtle. Most notably wetlands acted as consistent N2O sinks.
Land cover, pH, soil temperature and soil moisture were strong predictors of CH4 fluxes and explained most of the observed variance, whereas green vegetation cover had only a marginal effect. CH4 fluxes exhibited clear seasonal patterns, with the smallest sources and sinks occurring at the beginning and end of the growing season while peak fluxes were observed in July–August. These findings highlight the importance of longitudinal studies for accurately estimating annual CH4 budgets rather than relying solely on peak growing-season measurements but also demonstrates that CH4 fluxes can be modelled with relatively few key environmental variables.
In comparison to CH4, N2O exhibited relatively moderate responses to the measured environmental variables and considerably weaker seasonal patterns, emphasizing the inherent challenges in explaining N2O dynamics across heterogeneous ecosystems. In a multivariate context, land cover and soil pH emerged as the most influential factors shaping N2O flux variability, while the effects of soil temperature and moisture were negligible. The substantial proportion of unexplained variability in N2O fluxes indicates that key controlling factors were not fully captured, pointing to the importance of additional drivers, particularly those related to soil biogeochemistry and microbial nitrogen transformation pathways. Furthermore, the high variability of N2O emissions suggests a notable influence of spatiotemporal dynamics, underscoring the need for high resolution measurements to adequately characterize N2O behavior. These findings highlight the complexity of N2O dynamics and identify important avenues for future research to improve the understanding and modeling of N2O fluxes.
All in all, our results demonstrate that high-latitude GHG fluxes arise from interactions between broad land cover patterns and fine-scale environmental variability. From an applied perspective, our findings suggest that accurate land cover mapping and in situ measurements of soil conditions are essential for robust modelling and upscaling of GHG fluxes. Because land cover classes exhibit such different GHG dynamics due to the underlying soil and vegetation characteristics, improved classification greatly enhances predictive performance across heterogenous landscapes. This is especially important in high-latitude regions, where rapid warming is expected to alter both ecosystem distributions and soil conditions with significant implications for current and future GHG budgets.
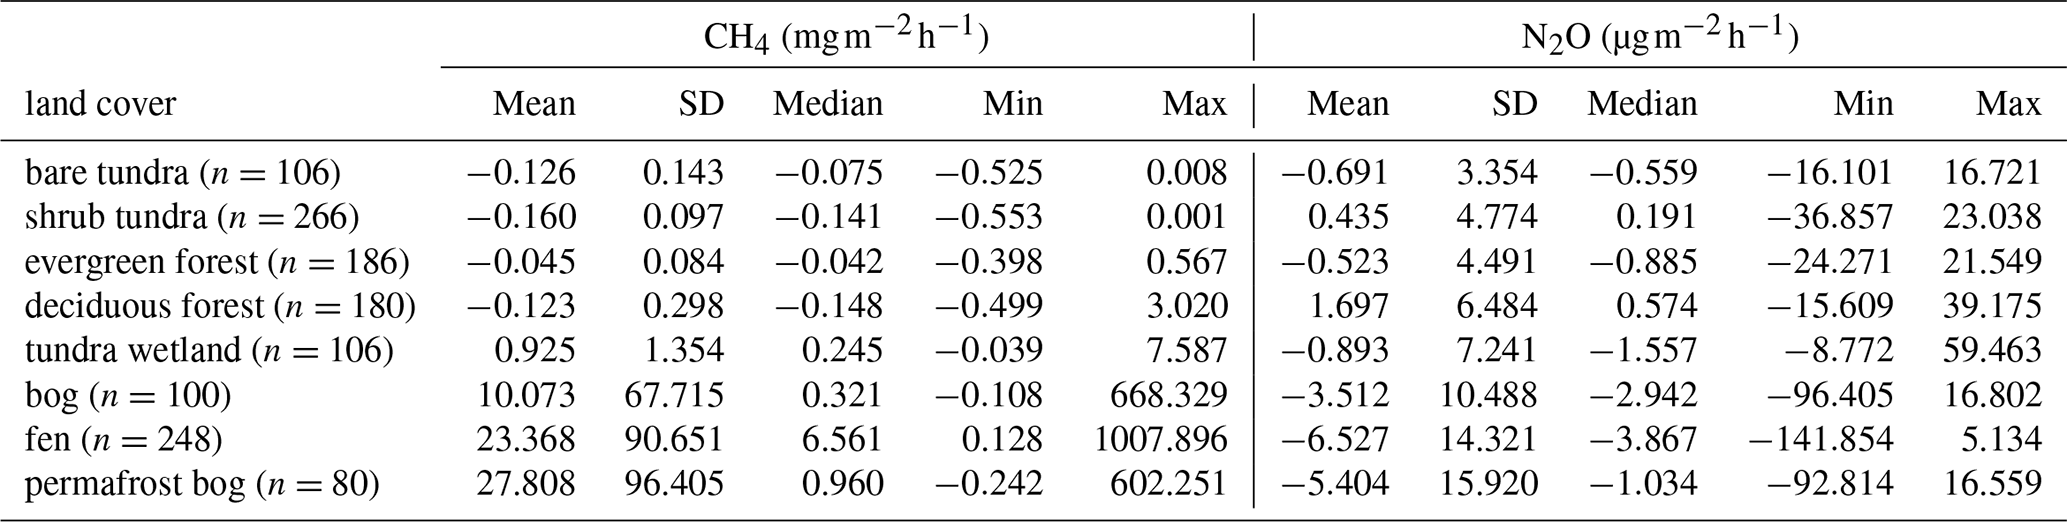
Table A2Monthly CH4 and N2O fluxes in different land cover classes.
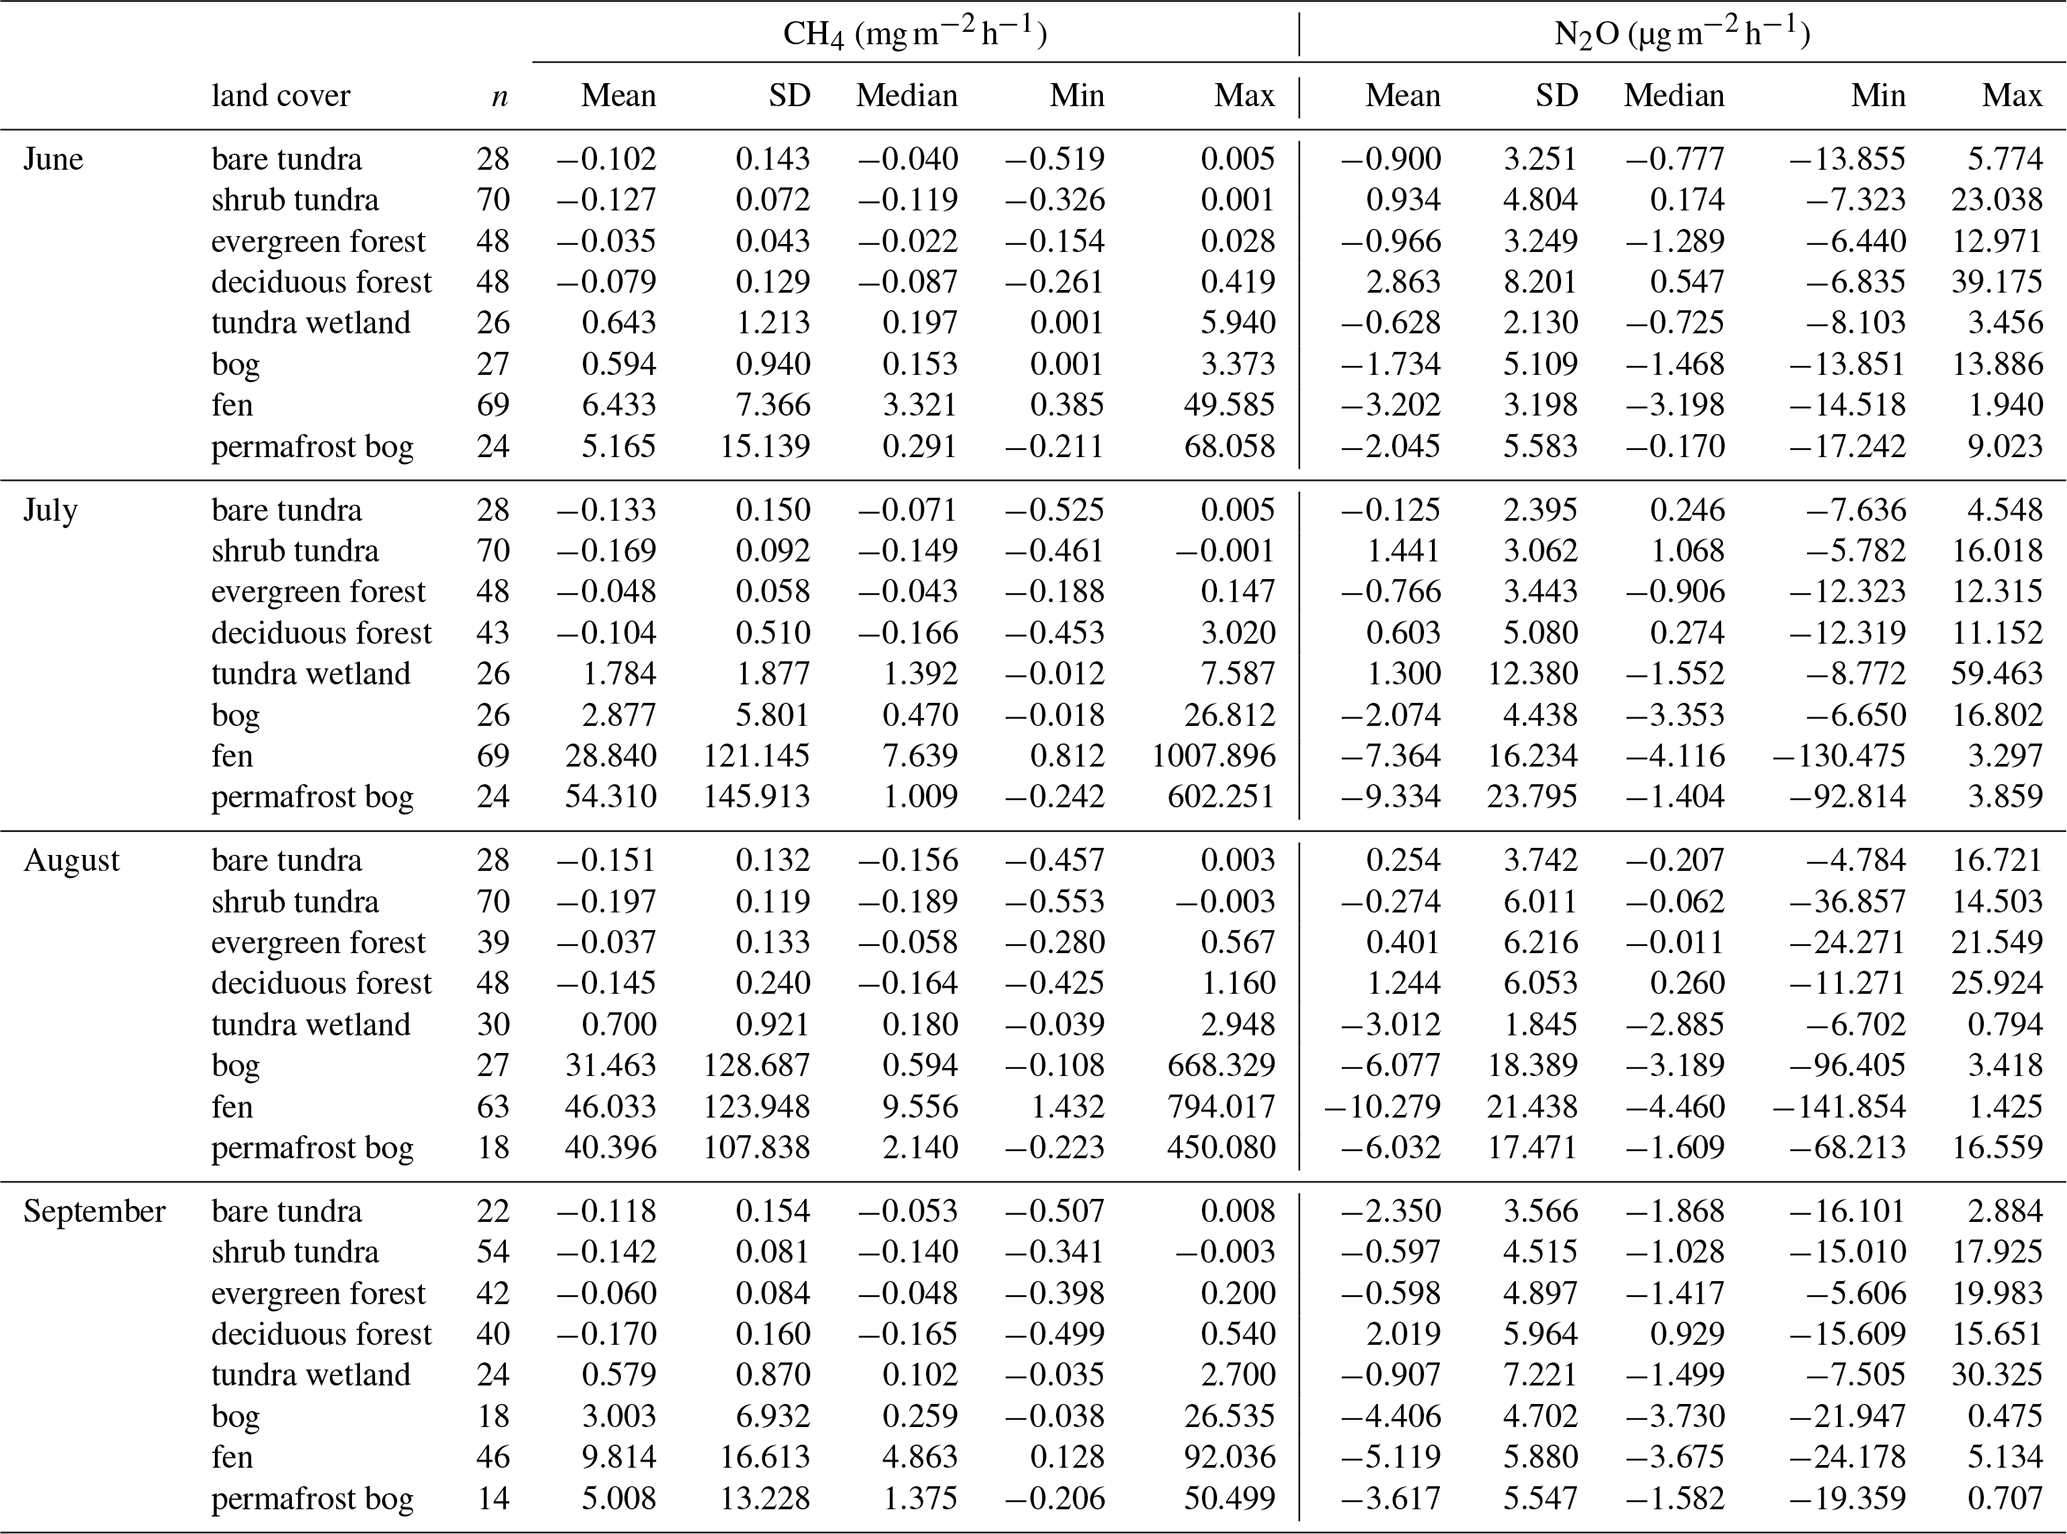
Table A3Linear mixed-effects model summary for CH4 flux. Model estimates are standardized.
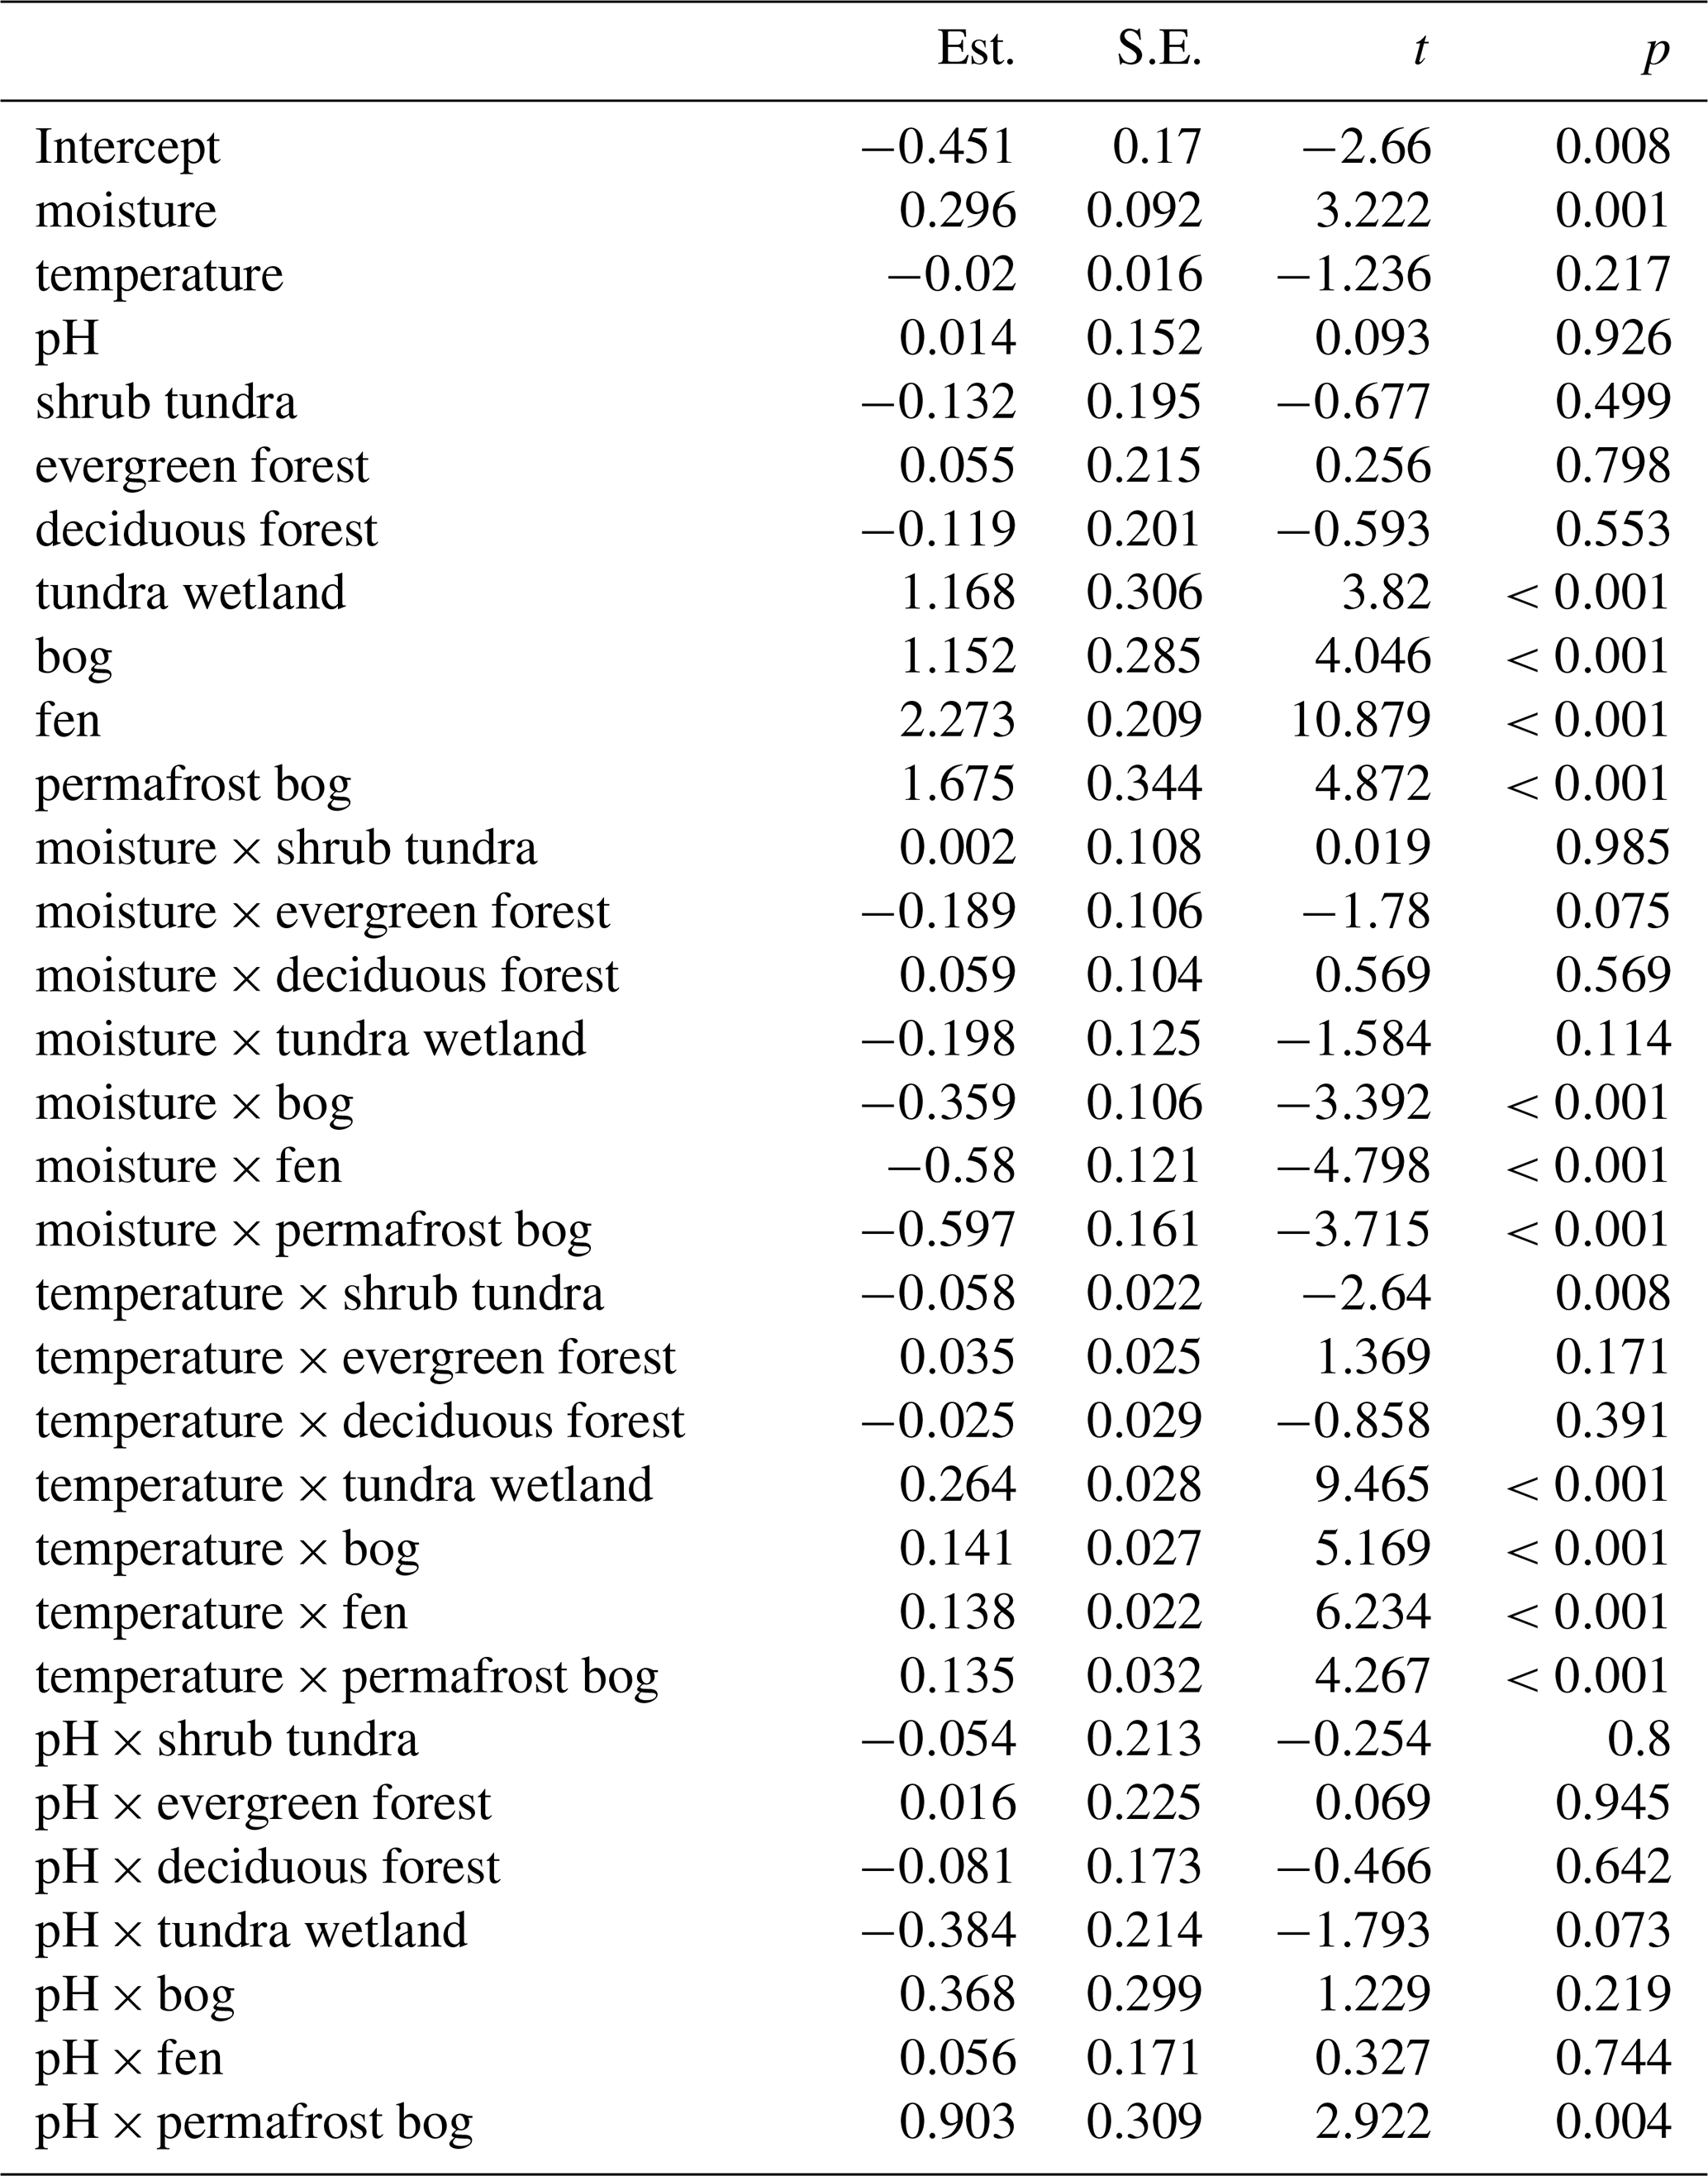
Table A4Linear mixed-effects model summary for N2O flux. Model estimates are standardized.
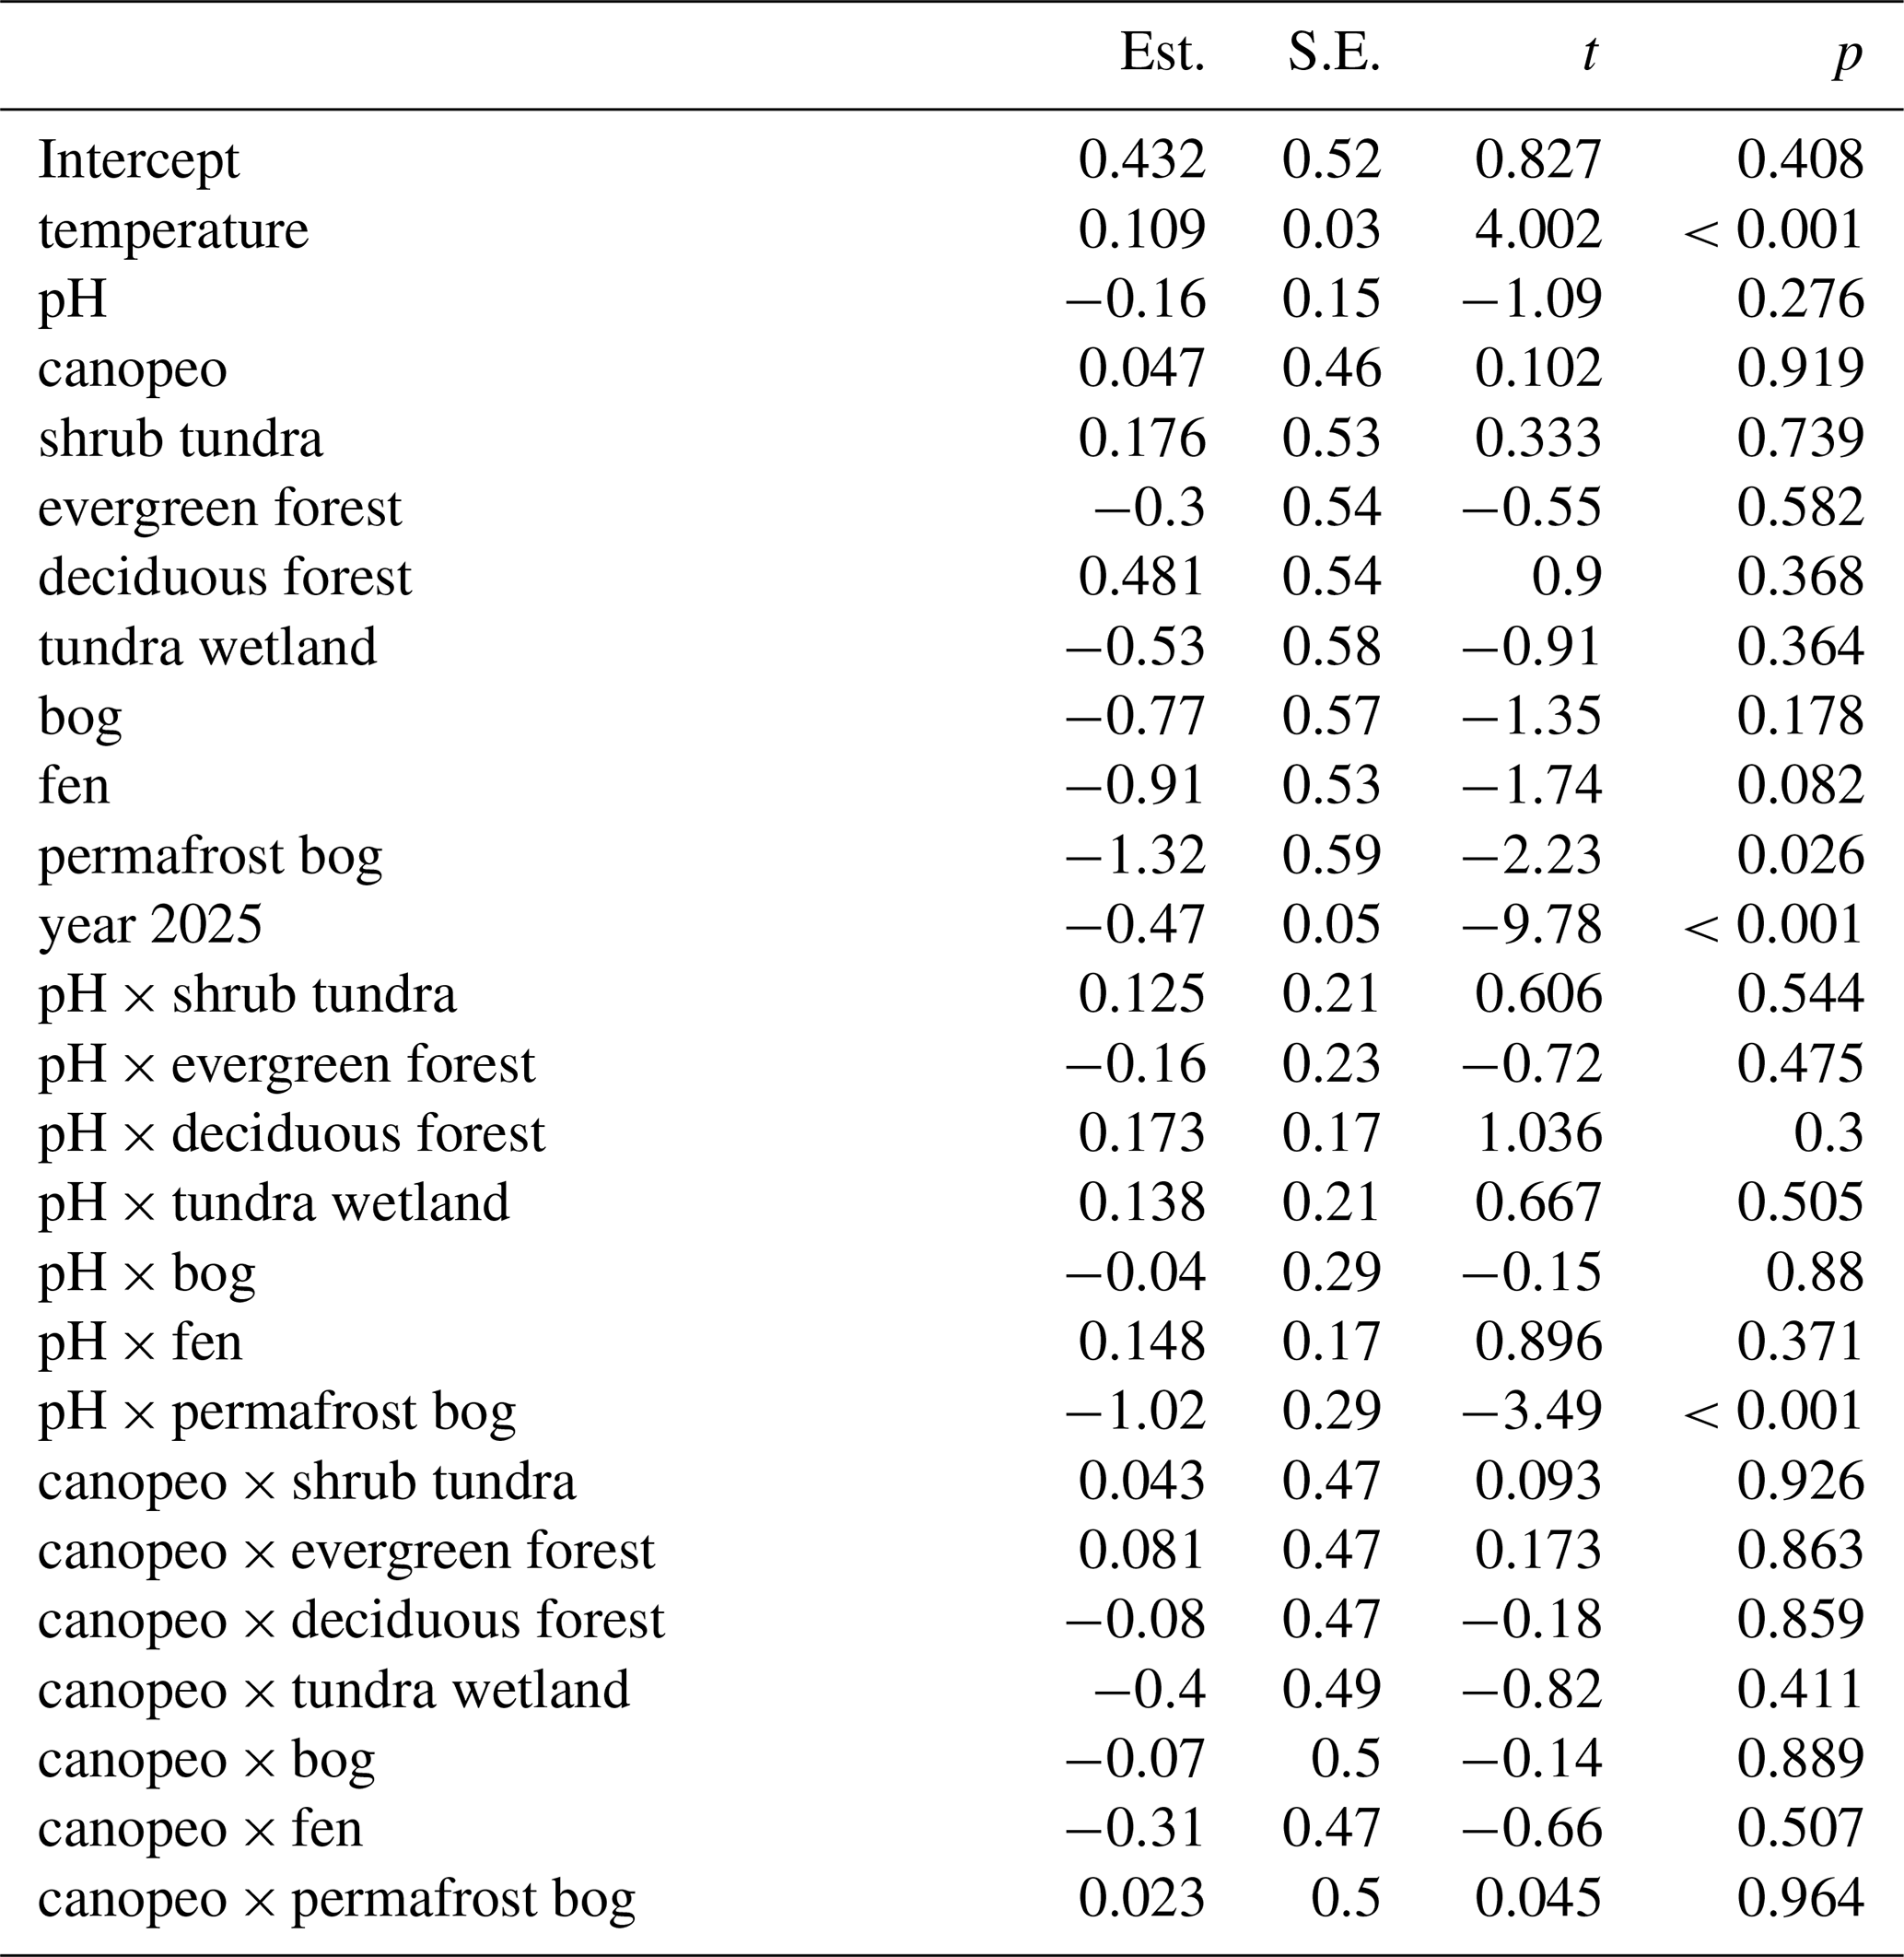
Table A5ART-ANOVA summary for monthly differences of CH4 flux in different land cover types. Significance intervals P<0.001 , P<0.01 , P<0.05 ∗.
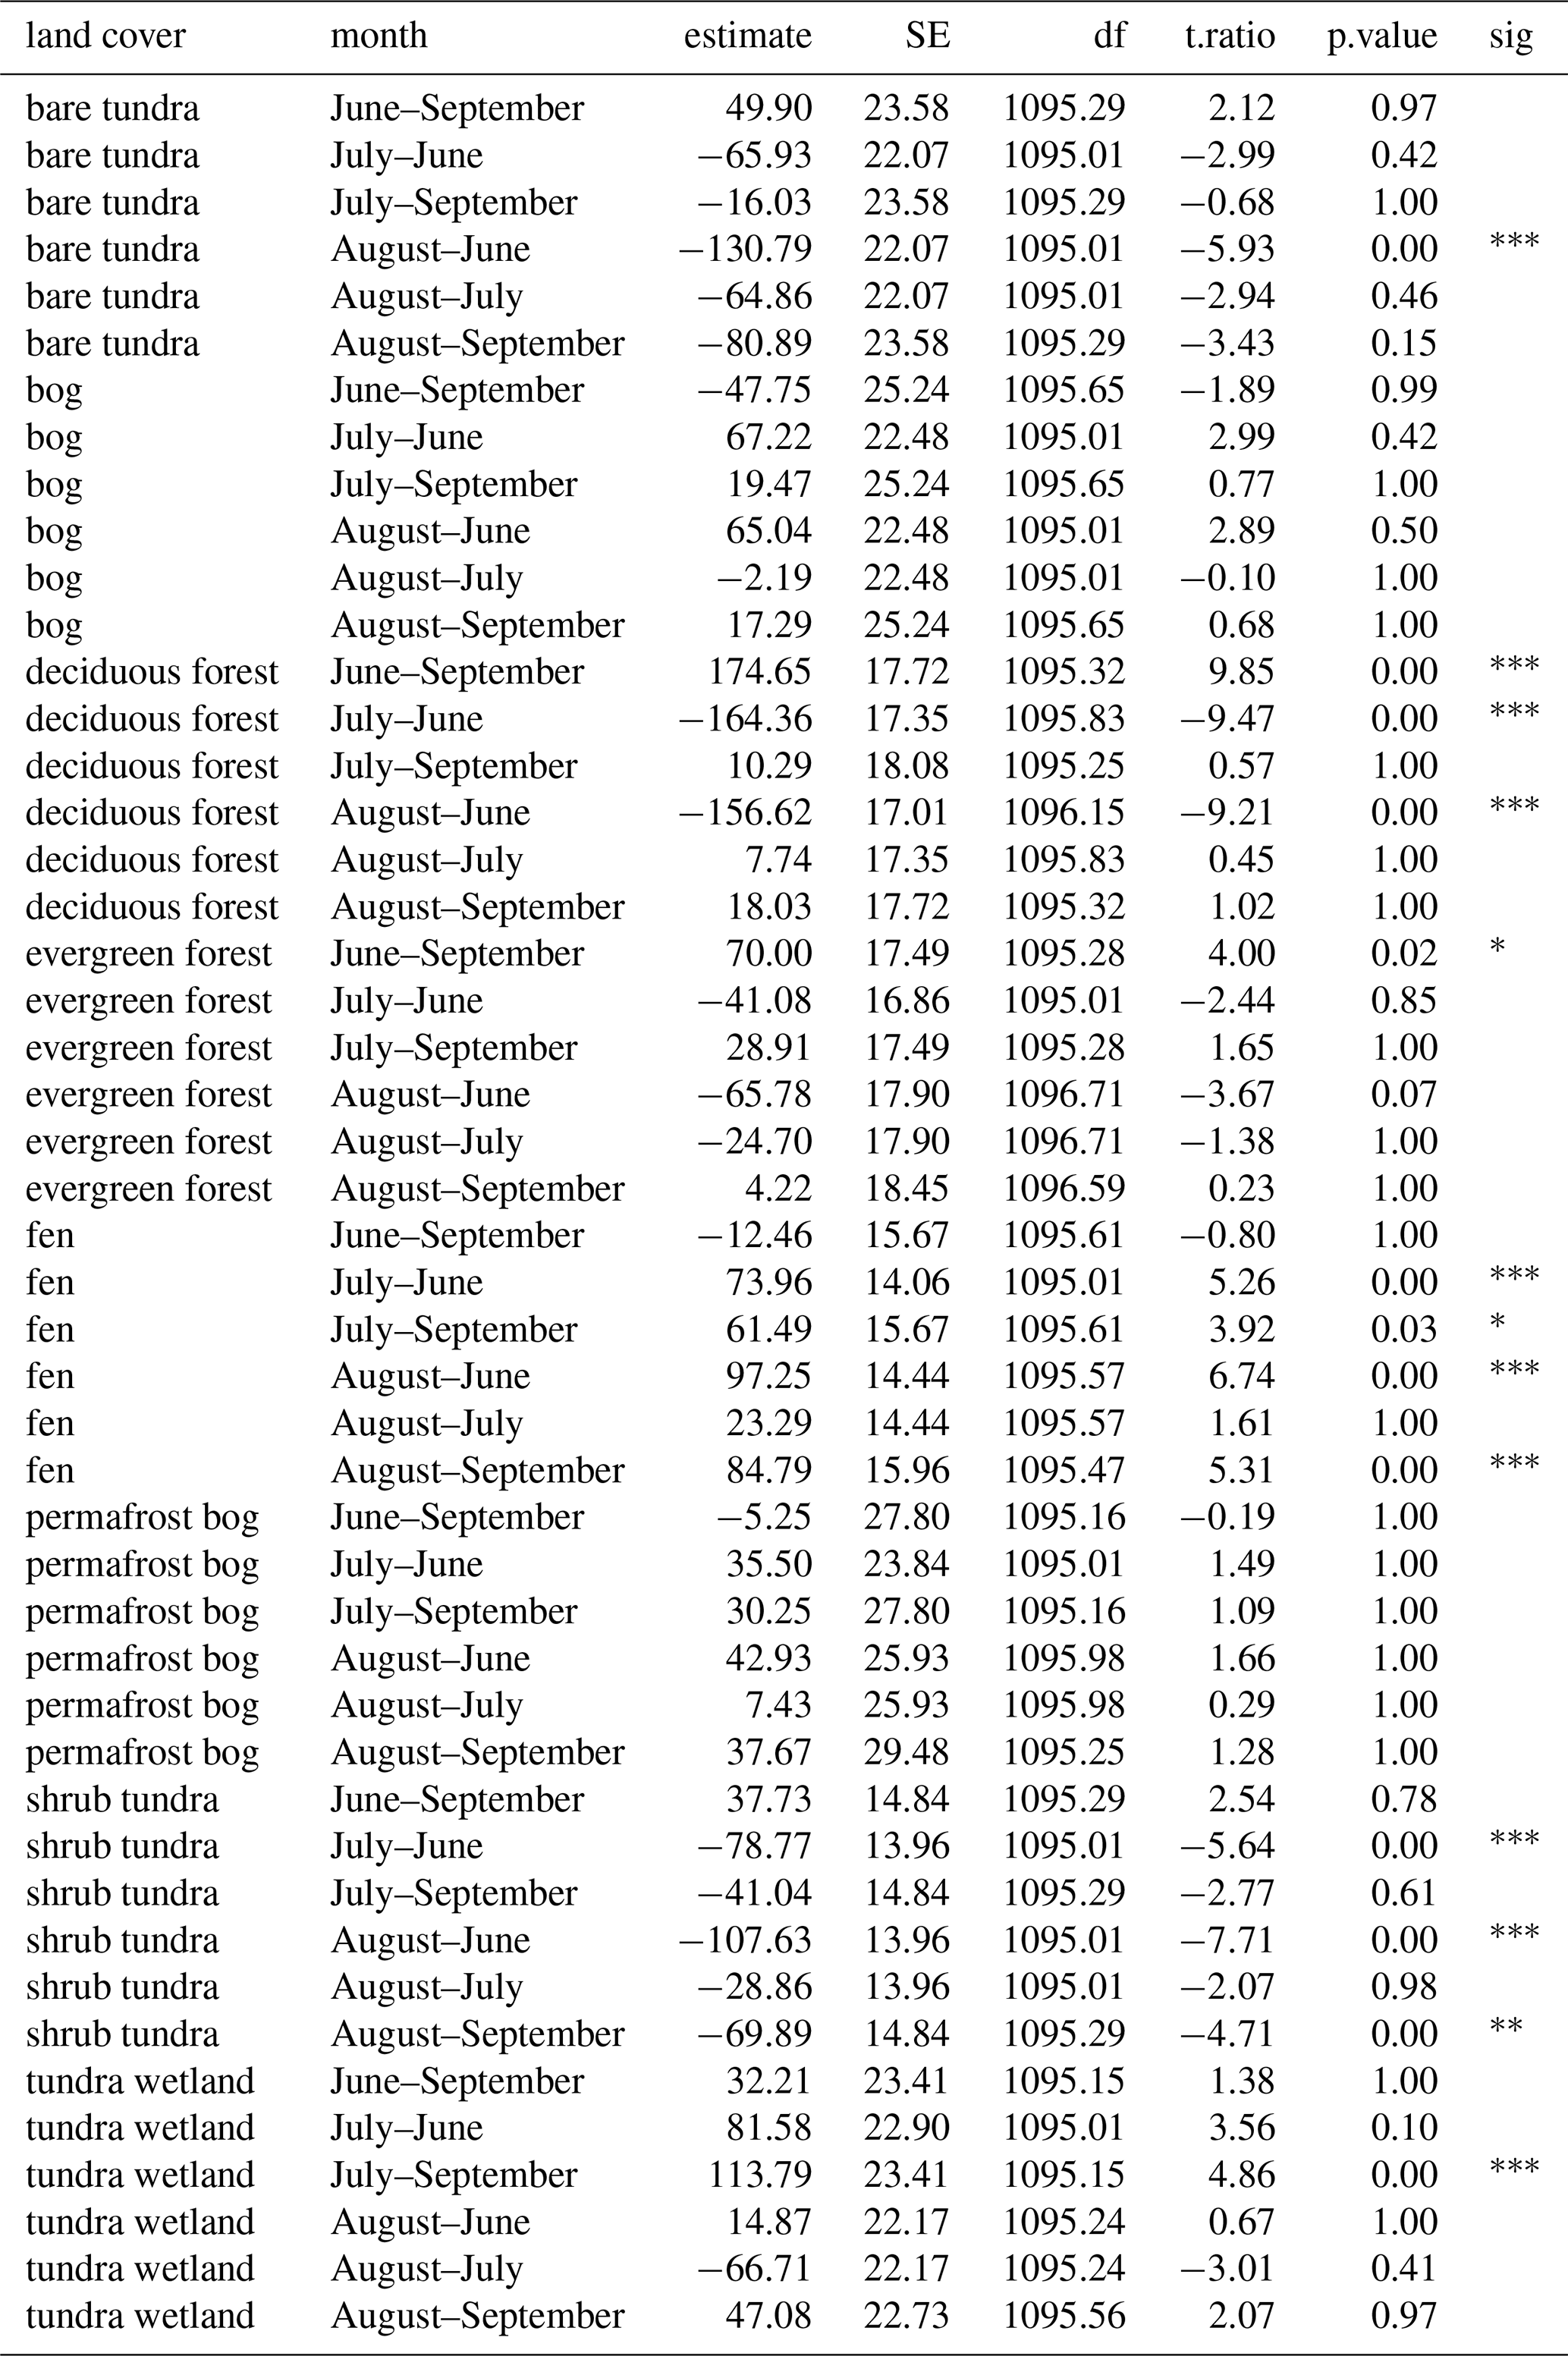
Table A6ART-ANOVA summary table for monthly differences of N2O flux in different land cover types. Significance intervals P<0.001 , P<0.01 , P<0.05 ∗.
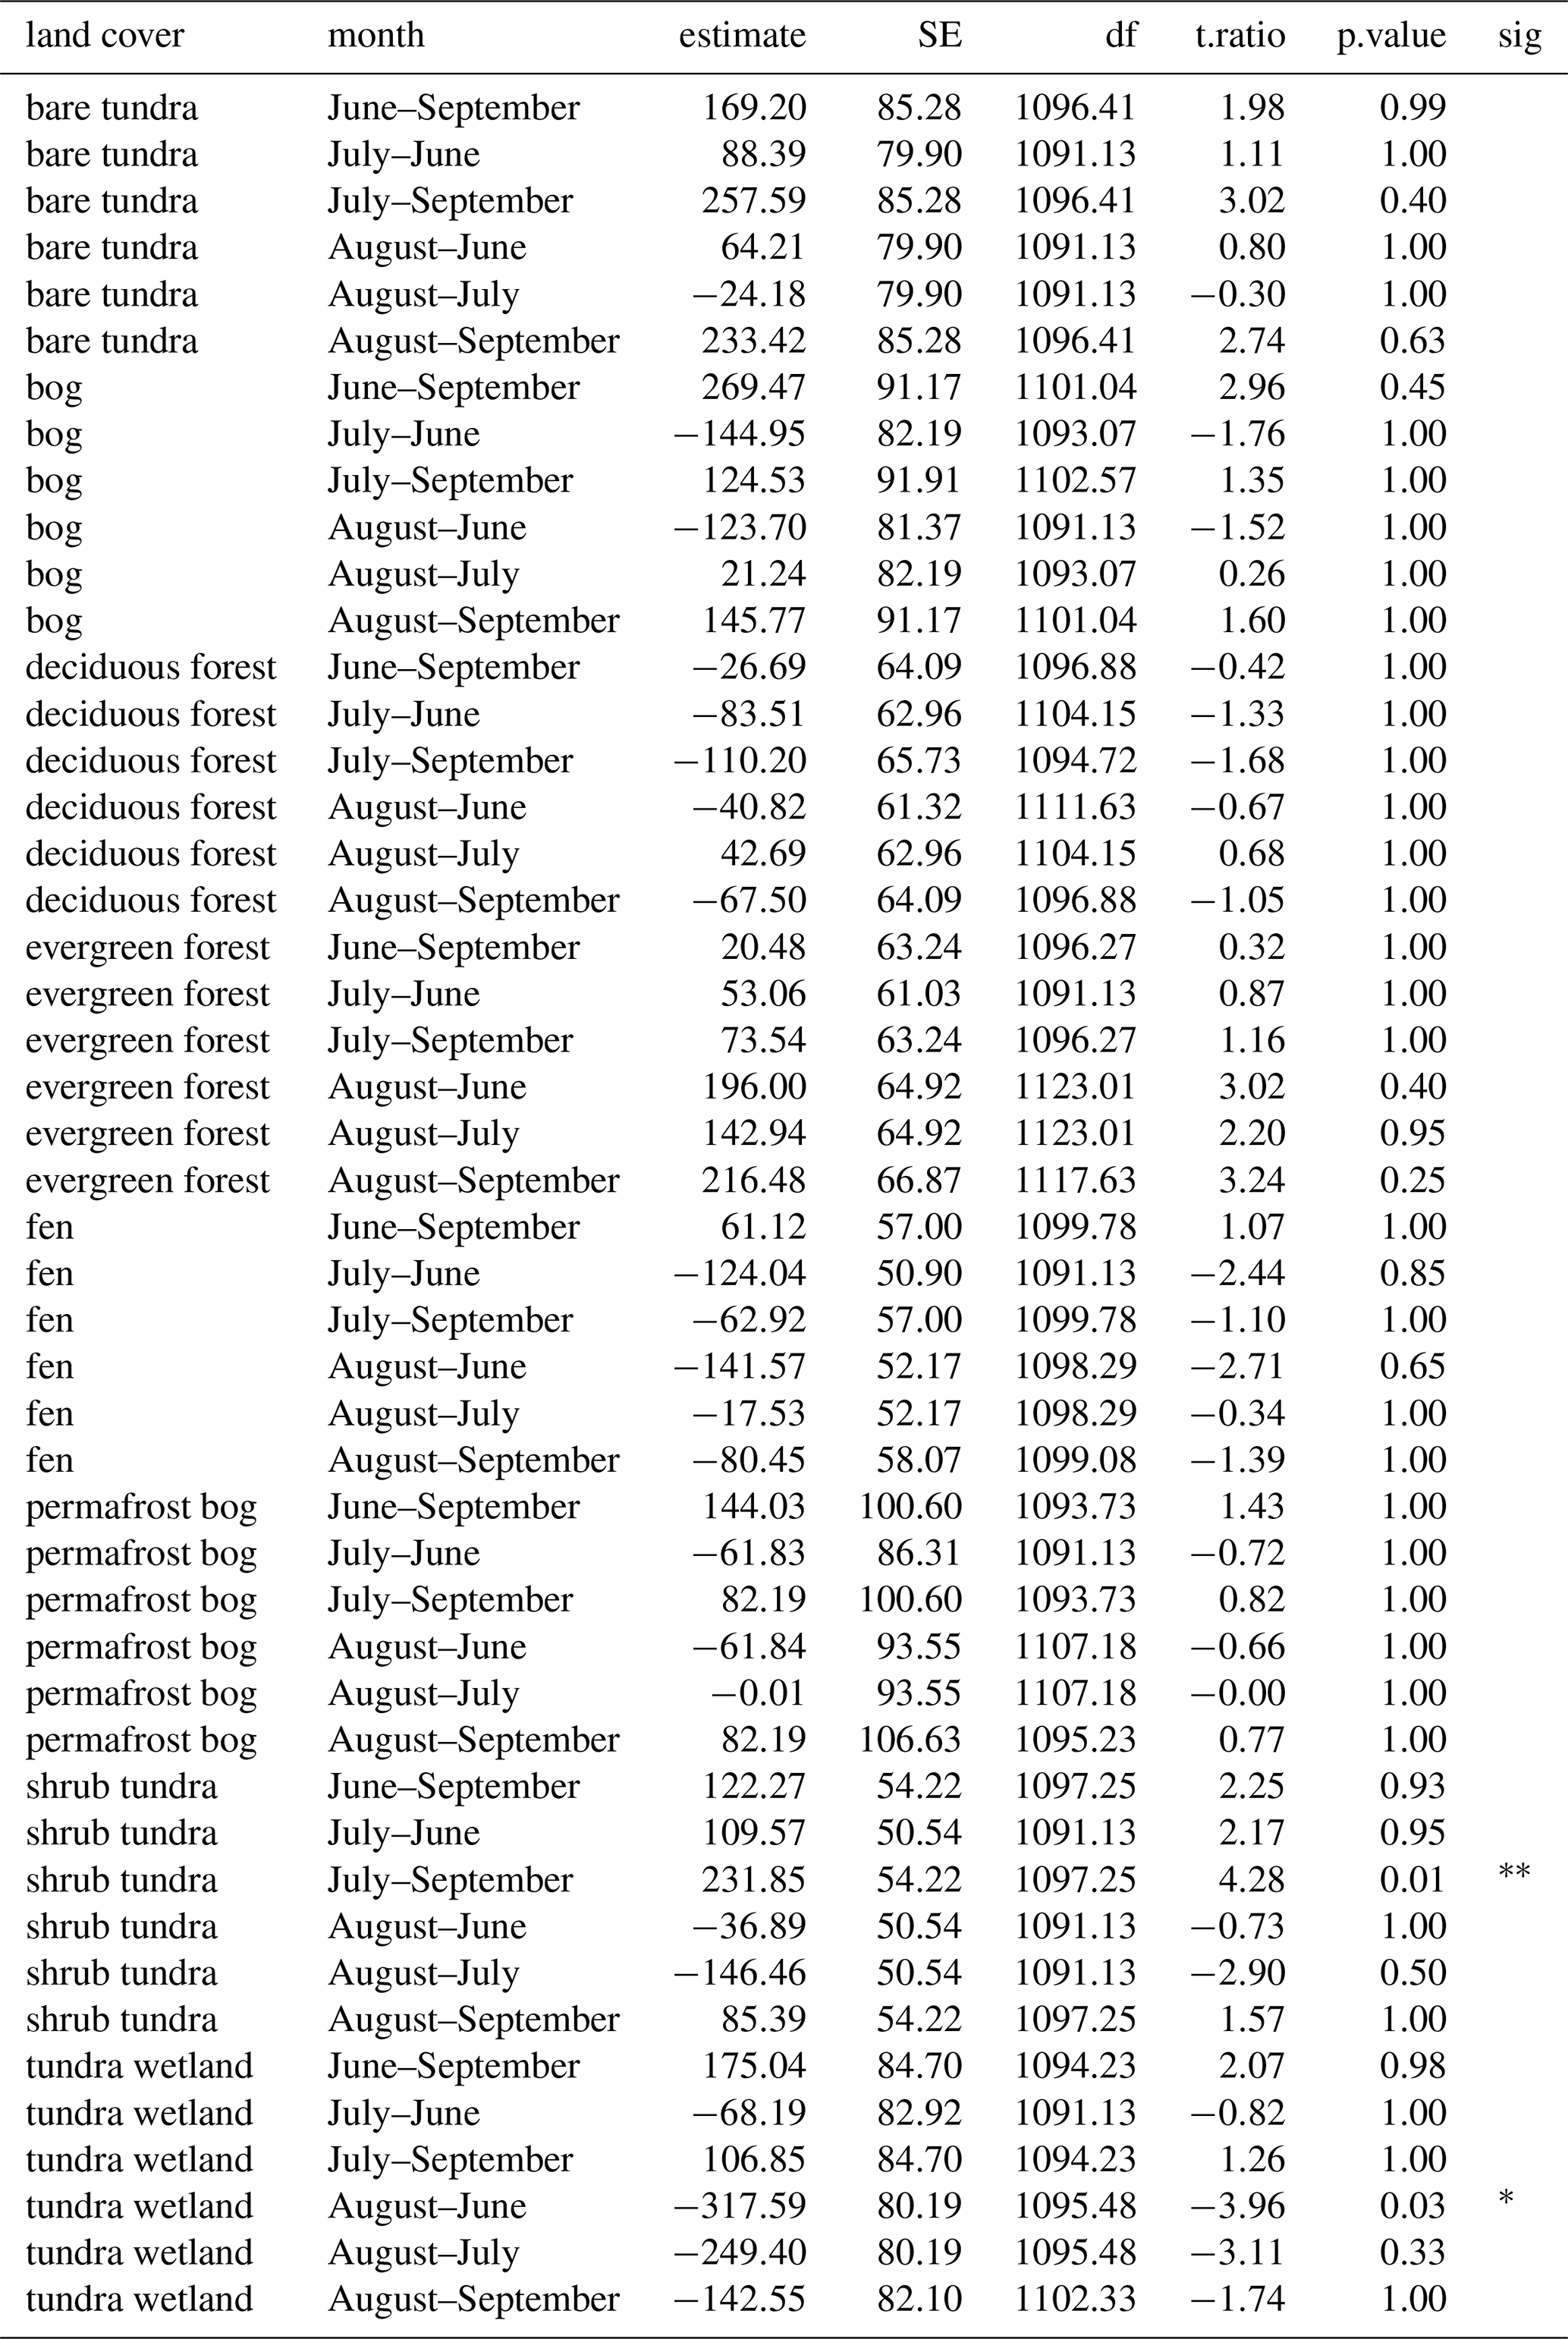
Table A7ART-ANOVA summary table for differences of CH4 flux between land cover classes. Significance intervals P<0.001 , P<0.01 , P<0.05 ∗.
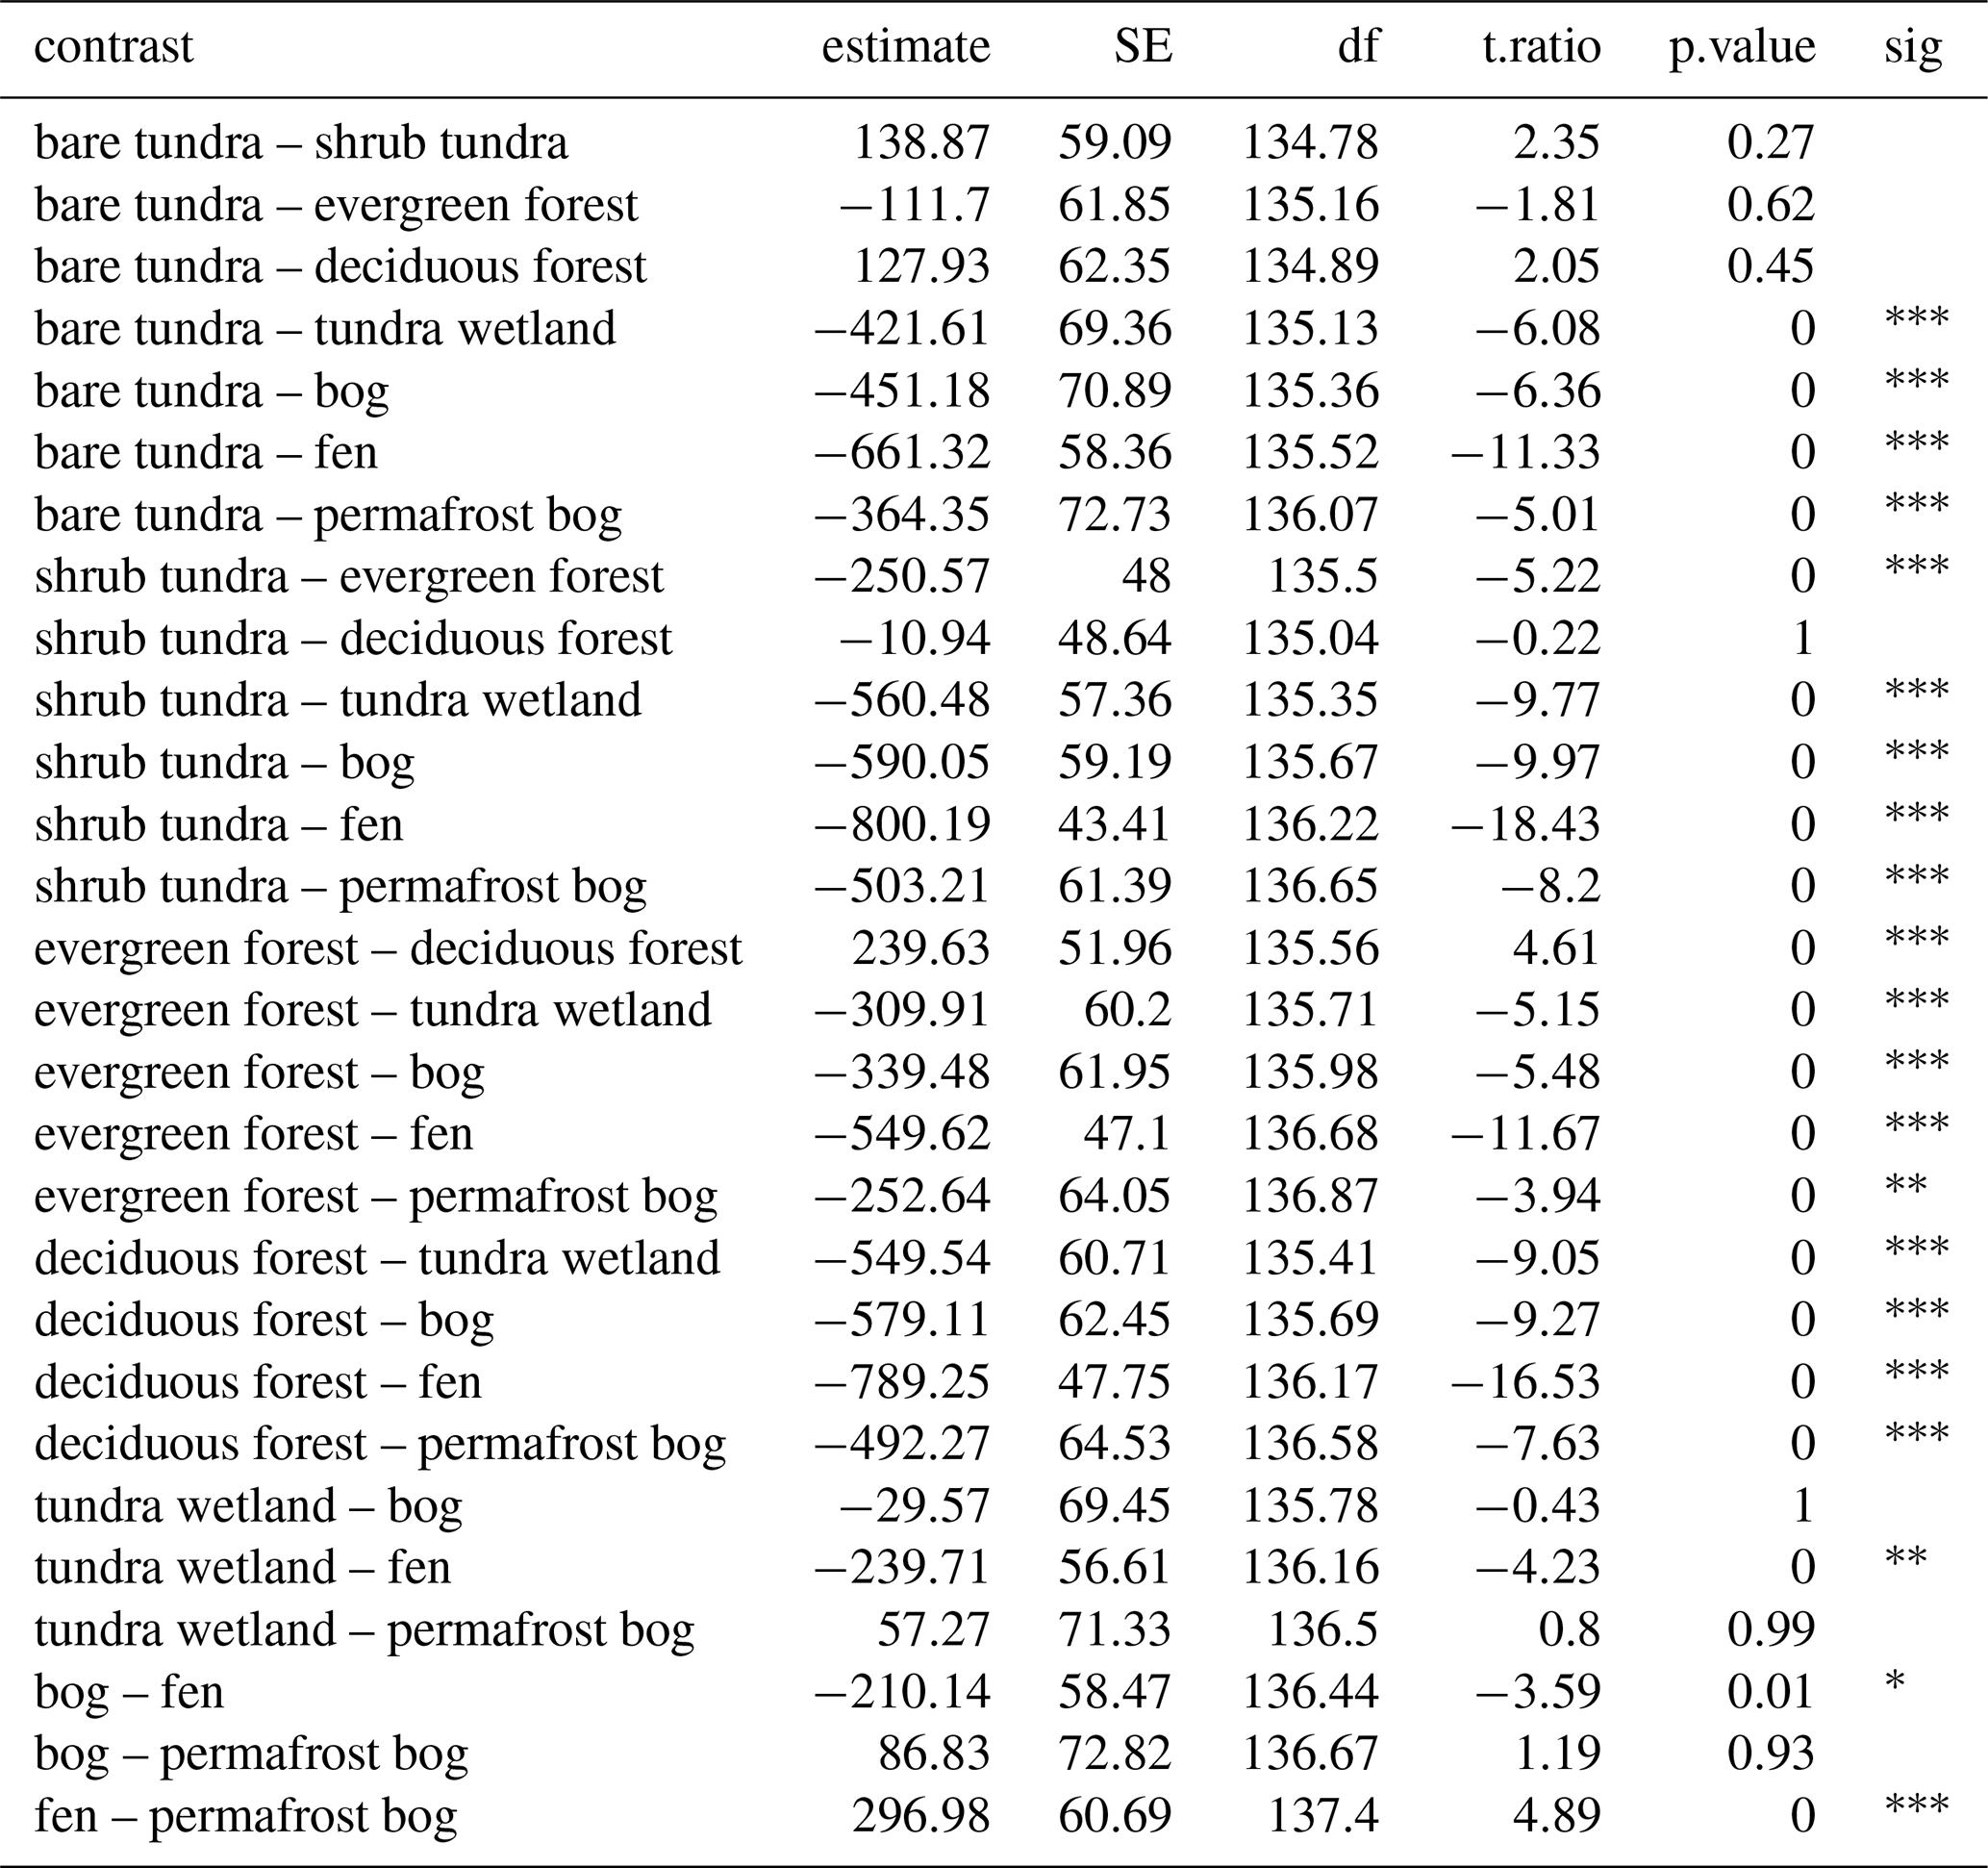
Table A8ART-ANOVA summary table for differences of N2O flux between land cover classes. Significance intervals P<0.001 , P<0.01 , P<0.05 ∗.
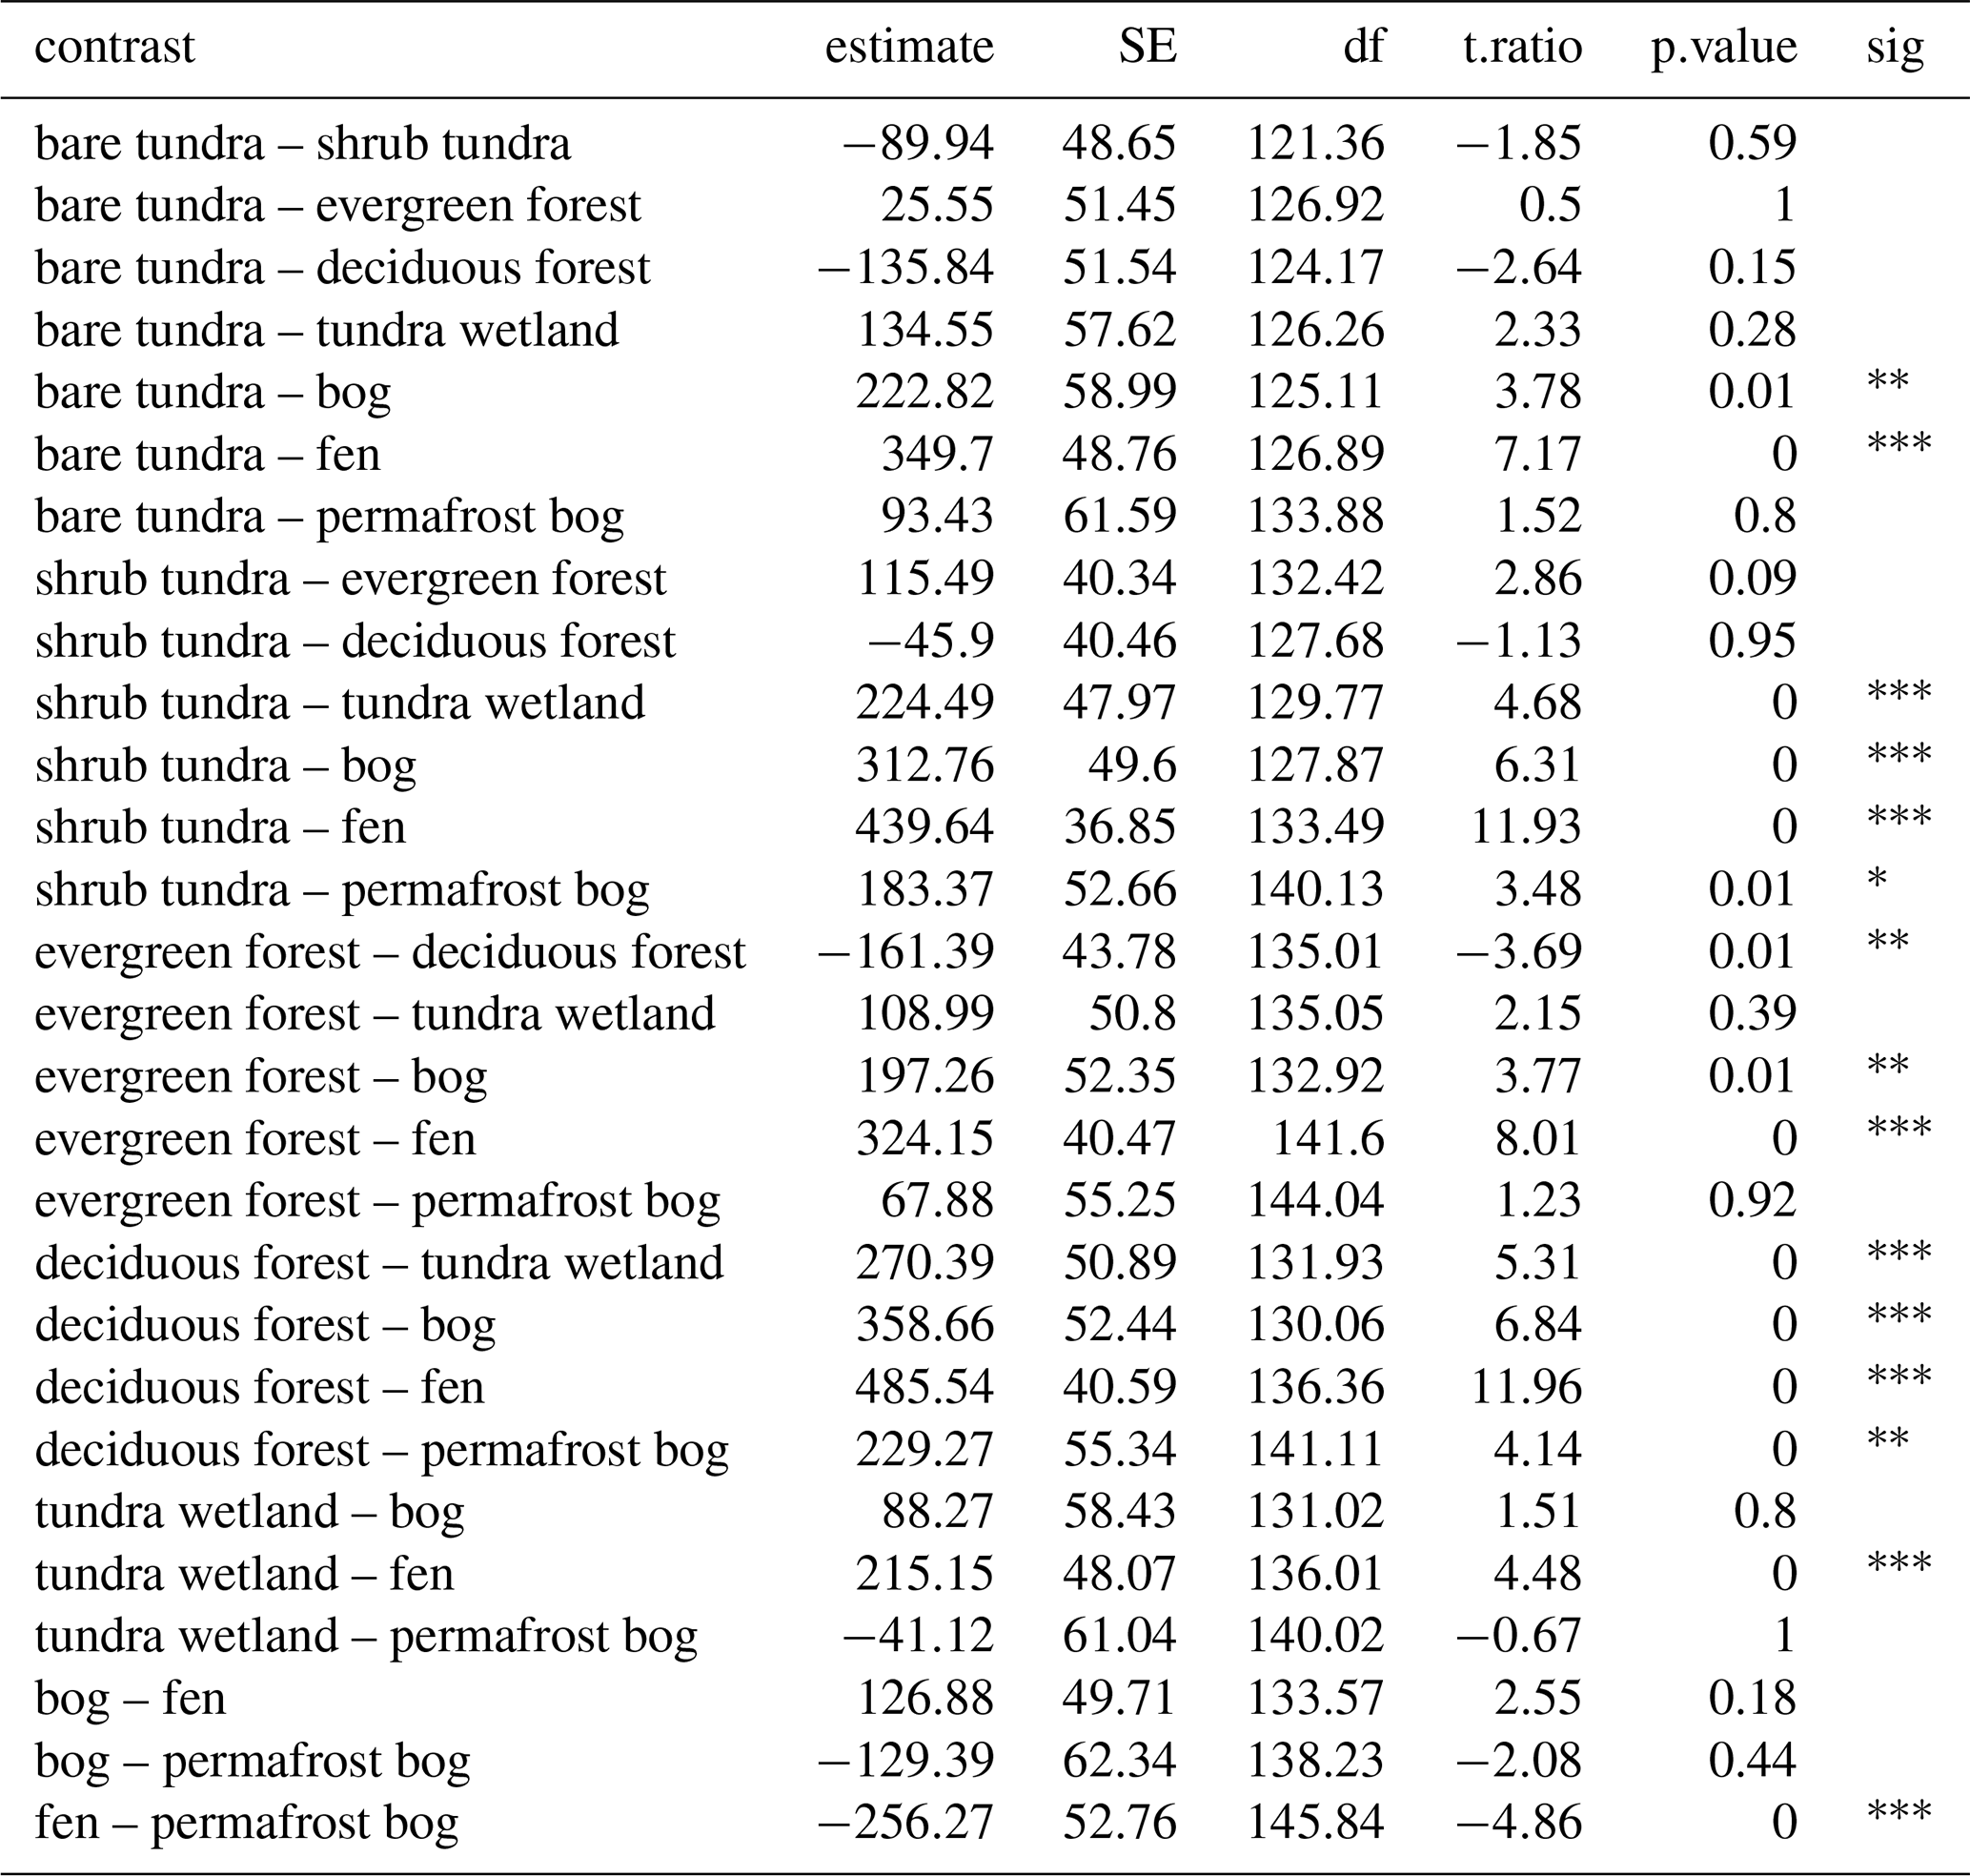
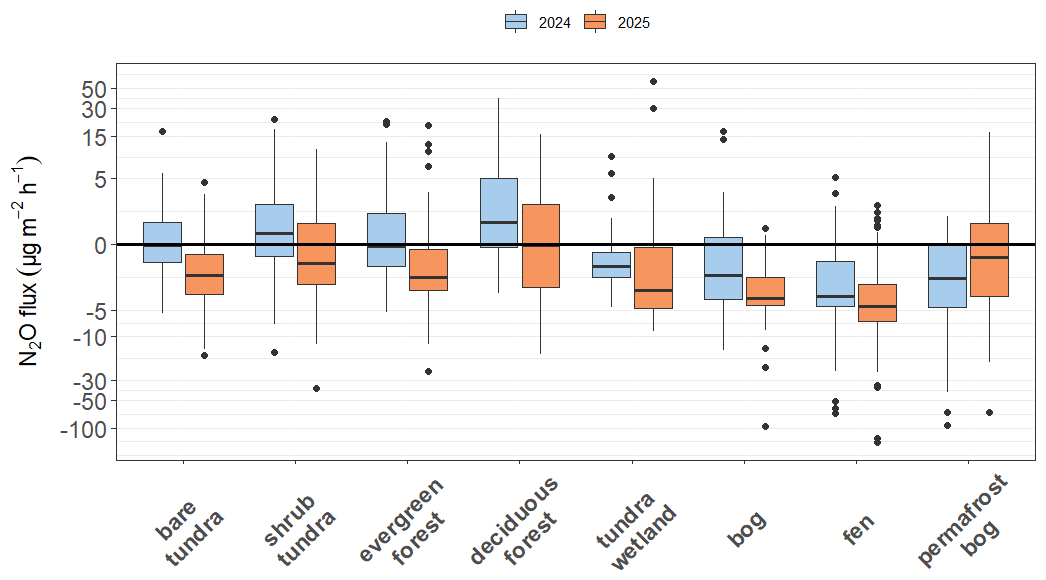
Figure A1Yearly differences in N2O fluxes between land cover classes. Colors indicate years, positive values are emissions and negative values are sinks. Note that permafrost bog category is not directly comparable between years due to additional plots being added in 2025. Boxplots have 25th and 75th quantiles, median (horizontal line), 1.5 IQR from the lower and higher quantiles (whiskers) and outliers (black dots). Y axis is log10 transformed.
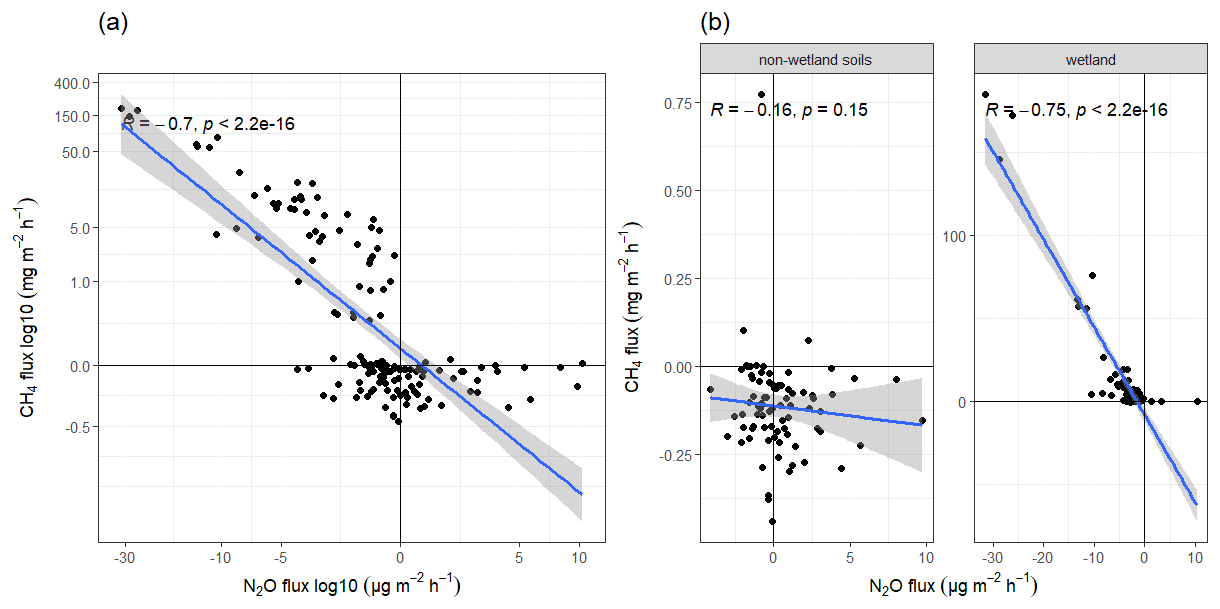
Figure A2(a) Scatterplot of mean CH4 flux (log10) and mean N2O flux (log10) with spearman correlation (b) Scatterplot of mean CH4 flux and mean N2O flux between non-wetland soils (shrub tundra, bare tundra, deciduous forest, evergreen forest) and wetland soils (bog, fen, tundra wetland, permafrost bog) with spearman correlation.
Data and R scripts used for the data visualizations and analysis can be provided by the corresponding authors upon request.
Conceptualization: ML, JH, JN, AMV; Methodology: ML, JN, JH, AMV; Formal analysis: JN; Investigation: JN, JL; Resources: JH, ML, AMV; Data curation: JN, JL; Writing – Original draft: JN; Writing – Review and Editing: JN, ML, JH, AMV, JL; Visualization: JN, JL; Supervision: ML, JH, AMV; Project administration: ML, JH, JN; Funding acquisition: JH, ML.
The contact author has declared that none of the authors has any competing interests.
Publisher's note: Copernicus Publications remains neutral with regard to jurisdictional claims made in the text, published maps, institutional affiliations, or any other geographical representation in this paper. The authors bear the ultimate responsibility for providing appropriate place names. Views expressed in the text are those of the authors and do not necessarily reflect the views of the publisher.
The authors want to acknowledge and thank field assistants Leo Mäklin, Sara Solastie, Anna Liljefors, Lotta Mattila, Lea Fewer, Katariina Karvinen for field work in 2024 and 2025 as well as Kilpisjärvi biological station for providing facilities for our field campaigns. We also acknowledge Metsähallitus for research permits.
The authors used OpenAI's ChatGPT (GPT-5) for minor language editing and readability improvements. Additionally, ChatGPT was used to help troubleshoot R code and resolve coding errors during the creation of figures.
This work was supported by Kone foundation (Uinuvat mikrobit to JH and ML) and Academy of Finland (project: 1342890 to ML, 354462 to JH and 371479 to AMV) and Nordenskiöld samfundet to JN and JL, Nesling foundation to JL, Waldermar von Freckell's stiftelse to AMV, Luke doctoral school travel funds to JN.
Open-access funding was provided by the Helsinki University Library.
This paper was edited by Estefanía Muñoz and reviewed by two anonymous referees.
Aalto, J., Tyystjärvi, V., Niittynen, P., Kemppinen, J., Rissanen, T., Gregow, H., and Luoto, M.: Microclimate temperature variations from boreal forests to the tundra, Agr. Forest Meteorol., 323, 109037, https://doi.org/10.1016/j.agrformet.2022.109037, 2022.
Bao, T., Jia, G., and Xu, X.: Wetland Heterogeneity Determines Methane Emissions: A Pan-Arctic Synthesis, Environ. Sci. Technol., 55, 10152–10163, https://doi.org/10.1021/acs.est.1c01616, 2021.
Bates, D., Mächler, M., Bolker, B., and Walker, S.: Fitting Linear Mixed-Effects Models Using lme4, J. Stat. Softw., 67, 1–48, https://doi.org/10.18637/jss.v067.i01, 2015.
Batjes, N. H.: Harmonized soil property values for broad-scale modelling (WISE30sec) with estimates of global soil carbon stocks, Geoderma, 269, 61–68, https://doi.org/10.1016/j.geoderma.2016.01.034, 2016.
Biasi, C., Rusalimova, O., Meyer, H., Kaiser, C., Wanek, W., Barsukov, P., Junger, H., and Richter, A.: Temperature-dependent shift from labile to recalcitrant carbon sources of arctic heterotrophs, Rapid Commun. Mass Sp., 19, 1401–1408, https://doi.org/10.1002/rcm.1911, 2005.
Biskaborn, B. K., Smith, S. L., Noetzli, J., Matthes, H., Vieira, G., Streletskiy, D. A., Schoeneich, P., Romanovsky, V. E., Lewkowicz, A. G., Abramov, A., Allard, M., Boike, J., Cable, W. L., Christiansen, H. H., Delaloye, R., Diekmann, B., Drozdov, D., Etzelmüller, B., Grosse, G., Guglielmin, M., Ingeman-Nielsen, T., Isaksen, K., Ishikawa, M., Johansson, M., Johannsson, H., Joo, A., Kaverin, D., Kholodov, A., Konstantinov, P., Kröger, T., Lambiel, C., Lanckman, J.-P., Luo, D., Malkova, G., Meiklejohn, I., Moskalenko, N., Oliva, M., Phillips, M., Ramos, M., Sannel, A. B. K., Sergeev, D., Seybold, C., Skryabin, P., Vasiliev, A., Wu, Q., Yoshikawa, K., Zheleznyak, M., and Lantuit, H.: Permafrost is warming at a global scale, Nat. Commun., 10, 264, https://doi.org/10.1038/s41467-018-08240-4, 2019.
Brummell, M. E., Farrell, R. E., and Siciliano, S. D.: Greenhouse gas soil production and surface fluxes at a high arctic polar oasis, Soil Biol. Biochem., 52, 1–12, https://doi.org/10.1016/j.soilbio.2012.03.019, 2012.
Butterbach-Bahl, K., Baggs, E. M., Dannenmann, M., Kiese, R., and Zechmeister-Boltenstern, S.: Nitrous oxide emissions from soils: how well do we understand the processes and their controls?, Philos. T. Roy. Soc. B, 368, 20130122, https://doi.org/10.1098/rstb.2013.0122, 2013.
Cai, C., Zhang, X., Wu, M., Liu, T., Lai, C.-Y., Frank, J., He, B., Marcellin, E., Guo, J., Hu, S., and Yuan, Z.: Roles and opportunities for microbial anaerobic oxidation of methane in natural and engineered systems, Energ. Environ. Sci., 14, 4803–4830, https://doi.org/10.1039/D1EE00708D, 2021.
Chapuis-Lardy, L., Wrage, N., Metay, A., Chotte, J.-L., and Bernoux, M.: Soils, a sink for N2O? A review, Global Change Biol., 13, 1–17, https://doi.org/10.1111/j.1365-2486.2006.01280.x, 2007.
Cheng, C., Zhang, J., He, Q., Wu, H., Chen, Y., Xie, H., and Pavlostathis, S. G.: Exploring simultaneous nitrous oxide and methane sink in wetland sediments under anoxic conditions, Water Res., 194, 116958, https://doi.org/10.1016/j.watres.2021.116958, 2021.
Christiansen, J. R., Outhwaite, J., and Smukler, S. M.: Comparison of CO2, CH4 and N2O soil-atmosphere exchange measured in static chambers with cavity ring-down spectroscopy and gas chromatography, Agr. Forest Meteorol., 211–212, 48–57, https://doi.org/10.1016/j.agrformet.2015.06.004, 2015a.
Christiansen, J. R., Romero, A. J. B., Jørgensen, N. O. G., Glaring, M. A., Jørgensen, C. J., Berg, L. K., and Elberling, B.: Methane fluxes and the functional groups of methanotrophs and methanogens in a young Arctic landscape on Disko Island, West Greenland, Biogeochemistry, 122, 15–33, https://doi.org/10.1007/s10533-014-0026-7, 2015b.
Clough, T. J., Rochette, P., Thomas, S. M., Pihlatie, M., Christiansen, J. R., and Thorman, R. E.: Global Research Alliance N2O chamber methodology guidelines: Design considerations, J. Environ. Qual., 49, 1081–1091, https://doi.org/10.1002/jeq2.20117, 2020.
Deslippe, J. R., Hartmann, M., Simard, S. W., and Mohn, W. W.: Long-term warming alters the composition of Arctic soil microbial communities, FEMS Microbiol. Ecol., 82, 303–315, https://doi.org/10.1111/j.1574-6941.2012.01350.x, 2012.
Elkin, L. A., Kay, M., Higgins, J. J., and Wobbrock, J. O.: An Aligned Rank Transform Procedure for Multifactor Contrast Tests, in: The 34th Annual ACM Symposium on User Interface Software and Technology, 754–768, https://doi.org/10.1145/3472749.3474784, 2021.
Emmerton, C. A., St. Louis, V. L., Lehnherr, I., Humphreys, E. R., Rydz, E., and Kosolofski, H. R.: The net exchange of methane with high Arctic landscapes during the summer growing season, Biogeosciences, 11, 3095–3106, https://doi.org/10.5194/bg-11-3095-2014, 2014.
Hinrichs, K.-U. and Boetius, A.: The Anaerobic Oxidation of Methane: New Insights in Microbial Ecology and Biogeochemistry, in: Ocean Margin Systems, edited by: Wefer, G., Billett, D., Hebbeln, D., Jørgensen, B. B., Schlüter, M., and van Weering, T. C. E., Springer, Berlin, Heidelberg, 457–477, https://doi.org/10.1007/978-3-662-05127-6_28, 2003.
Hugelius, G., Loisel, J., Chadburn, S., Jackson, R. B., Jones, M., MacDonald, G., Marushchak, M., Olefeldt, D., Packalen, M., Siewert, M. B., Treat, C., Turetsky, M., Voigt, C., and Yu, Z.: Large stocks of peatland carbon and nitrogen are vulnerable to permafrost thaw, P. Natl. Acad. Sci. USA, 117, 20438–20446, https://doi.org/10.1073/pnas.1916387117, 2020.
Hugelius, G., Ramage, J., Burke, E., Chatterjee, A., Smallman, T. L., Aalto, T., Bastos, A., Biasi, C., Canadell, J. G., Chandra, N., Chevallier, F., Ciais, P., Chang, J., Feng, L., Jones, M. W., Kleinen, T., Kuhn, M., Lauerwald, R., Liu, J., López-Blanco, E., Luijkx, I. T., Marushchak, M. E., Natali, S. M., Niwa, Y., Olefeldt, D., Palmer, P. I., Patra, P. K., Peters, W., Potter, S., Poulter, B., Rogers, B. M., Riley, W. J., Saunois, M., Schuur, E. A. G., Thompson, R. L., Treat, C., Tsuruta, A., Turetsky, M. R., Virkkala, A.-M., Voigt, C., Watts, J., Zhu, Q., and Zheng, B.: Permafrost Region Greenhouse Gas Budgets Suggest a Weak CO2 Sink and CH4 and N2O Sources, But Magnitudes Differ Between Top-Down and Bottom-Up Methods, Global Biogeochem. Cy., 38, e2023GB007969, https://doi.org/10.1029/2023GB007969, 2024.
Intergovernmental Panel On Climate Change (IPCC): Climate Change 2021 – The Physical Science Basis: Working Group I Contribution to the Sixth Assessment Report of the Intergovernmental Panel on Climate Change, 1st edn., Cambridge University Press, https://doi.org/10.1017/9781009157896, 2023.
Jiang, J., Yan, Z., Jian, J., Peng, S., Tian, H., Morris, K. A., Ellam, R. M., Christiansen, J. R., Chen, H., Dong, J., Li, S.-L., Fu, P., Guan, D., Yu, G., Liu, C.-Q., Ciais, P., and Bond-Lamberty, B.: Global Soil Methane Uptake Estimated by Scaling Up Local Measurements, Global Change Biol., 31, e70194, https://doi.org/10.1111/gcb.70194, 2025.
Karjalainen, S. K., Anttila, J., Maanavilja, L., Hamedianfar, A., and Laine, A. M.: Carbon dioxide and methane gas exchange following sphagnum moss harvesting in boreal peatland, J. Environ. Manage., 373, 123357, https://doi.org/10.1016/j.jenvman.2024.123357, 2025.
Kay, M., Elkin, L., Higgins, J. J., and Wobbrock, J. O.: mjskay/ARTool: ARTool 0.11.2, Zenodo, https://doi.org/10.5281/zenodo.594511, 2025.
Kemppinen, J., Niittynen, P., Rissanen, T., Tyystjärvi, V., Aalto, J., and Luoto, M.: Soil Moisture Variations From Boreal Forests to the Tundra, Water Resour. Res., 59, e2022WR032719, https://doi.org/10.1029/2022WR032719, 2023.
Kip, N., Ouyang, W., Van Winden, J., Raghoebarsing, A., Van Niftrik, L., Pol, A., Pan, Y., Bodrossy, L., Van Donselaar, E. G., Reichart, G.-J., Jetten, M. S. M., Sinninghe Damsté, J. S., and Op Den Camp, H. J. M.: Detection, Isolation, and Characterization of Acidophilic Methanotrophs from Sphagnum Mosses, Appl. Environ. Microb., 77, 5643–5654, https://doi.org/10.1128/AEM.05017-11, 2011.
Kits, K. D., Klotz, M. G., and Stein, L. Y.: Methane oxidation coupled to nitrate reduction under hypoxia by the Gammaproteobacterium Methylomonas denitrificans, sp. nov. type strain FJG1, Environ. Microbiol., 17, 3219–3232, https://doi.org/10.1111/1462-2920.12772, 2015.
Knox, S. H., Jackson, R. B., Poulter, B., McNicol, G., Fluet-Chouinard, E., Zhang, Z., Hugelius, G., Bousquet, P., Canadell, J. G., Saunois, M., Papale, D., Chu, H., Keenan, T. F., Baldocchi, D., Torn, M. S., Mammarella, I., Trotta, C., Aurela, M., Bohrer, G., Campbell, D. I., Cescatti, A., Chamberlain, S., Chen, J., Chen, W., Dengel, S., Desai, A. R., Euskirchen, E., Friborg, T., Gasbarra, D., Goded, I., Goeckede, M., Heimann, M., Helbig, M., Hirano, T., Hollinger, D. Y., Iwata, H., Kang, M., Klatt, J., Krauss, K. W., Kutzbach, L., Lohila, A., Mitra, B., Morin, T. H., Nilsson, M. B., Niu, S., Noormets, A., Oechel, W. C., Peichl, M., Peltola, O., Reba, M. L., Richardson, A. D., Runkle, B. R. K., Ryu, Y., Sachs, T., Schäfer, K. V. R., Schmid, H. P., Shurpali, N., Sonnentag, O., Tang, A. C. I., Ueyama, M., Vargas, R., Vesala, T., Ward, E. J., Windham-Myers, L., Wohlfahrt, G., and Zona, D.: FLUXNET-CH4 Synthesis Activity: Objectives, Observations, and Future Directions, B. Am. Meteorol. Soc., 100, 2607–2632, https://doi.org/10.1175/BAMS-D-18-0268.1, 2019.
Knox, S. H., Bansal, S., McNicol, G., Schafer, K., Sturtevant, C., Ueyama, M., Valach, A. C., Baldocchi, D., Delwiche, K., Desai, A. R., Euskirchen, E., Liu, J., Lohila, A., Malhotra, A., Melling, L., Riley, W., Runkle, B. R. K., Turner, J., Vargas, R., Zhu, Q., Alto, T., Fluet-Chouinard, E., Goeckede, M., Melton, J. R., Sonnentag, O., Vesala, T., Ward, E., Zhang, Z., Feron, S., Ouyang, Z., Alekseychik, P., Aurela, M., Bohrer, G., Campbell, D. I., Chen, J., Chu, H., Dalmagro, H. J., Goodrich, J. P., Gottschalk, P., Hirano, T., Iwata, H., Jurasinski, G., Kang, M., Koebsch, F., Mammarella, I., Nilsson, M. B., Ono, K., Peichl, M., Peltola, O., Ryu, Y., Sachs, T., Sakabe, A., Sparks, J. P., Tuittila, E.-S., Vourlitis, G. L., Wong, G. X., Windham-Myers, L., Poulter, B., and Jackson, R. B.: Identifying dominant environmental predictors of freshwater wetland methane fluxes across diurnal to seasonal time scales, Global Change Biol., 27, 3582–3604, https://doi.org/10.1111/gcb.15661, 2021.
Kolb, S. and Horn, M. A.: Microbial CH4 and N2O Consumption in Acidic Wetlands, Front. Microbiol., 3, https://doi.org/10.3389/fmicb.2012.00078, 2012.
Kopecký, M., Macek, M., and Wild, J.: Topographic Wetness Index calculation guidelines based on measured soil moisture and plant species composition, Sci. Total Environ., 757, 143785, https://doi.org/10.1016/j.scitotenv.2020.143785, 2021.
Kübert, A., Lohila, A., Vekuri, H., Hatakka, J., Laurila, T., Mäkelä, T., Rainne, J., Suopajärvi, S., Tuovinen, J.-P., and Aurela, M.: Summer temperatures largely control annual methane budgets of a northern Peatland, Agr. Forest Meteorol., 381, 111101, https://doi.org/10.1016/j.agrformet.2026.111101, 2026.
Kuhn, M. A., Varner, R. K., Bastviken, D., Crill, P., MacIntyre, S., Turetsky, M., Walter Anthony, K., McGuire, A. D., and Olefeldt, D.: BAWLD-CH4: a comprehensive dataset of methane fluxes from boreal and arctic ecosystems, Earth Syst. Sci. Data, 13, 5151–5189, https://doi.org/10.5194/essd-13-5151-2021, 2021.
Lai, D. Y. F.: Methane Dynamics in Northern Peatlands: A Review, Pedosphere, 19, 409–421, https://doi.org/10.1016/S1002-0160(09)00003-4, 2009.
Le Mer, J. and Roger, P.: Production, oxidation, emission and consumption of methane by soils: A review, Eur. J. Soil Biol., 37, 25–50, https://doi.org/10.1016/S1164-5563(01)01067-6, 2001.
Li, Z., Shang, Y., Wang, C., Wang, J., Liu, X., Li, F., Chen, G., Cheng, H., Zou, J., and Liu, S.: Generally Reduced Sink Capacity of Upland Soils for Atmospheric Methane Over the Past Three Decades (1993–2022), Global Change Biol., 31, e70248, https://doi.org/10.1111/gcb.70248, 2025.
Livingston, G. P. and Hutchinson, G. L.: Enclosure-based measurement of trace gas exchange: applications and sources of error, in: Biogenic trace gases: measuring emissions from soil and water, 14, ISBN 1444313819, 2009.
Lohila, A., Aurela, M., Hatakka, J., Pihlatie, M., Minkkinen, K., Penttilä, T., and Laurila, T.: Responses of N2O fluxes to temperature, water table and N deposition in a northern boreal fen, Eur. J. Soil Sci., 61, 651–661, https://doi.org/10.1111/j.1365-2389.2010.01265.x, 2010.
Lohila, A., Aalto, T., Aurela, M., Hatakka, J., Tuovinen, J.-P., Kilkki, J., Penttilä, T., Vuorenmaa, J., Hänninen, P., Sutinen, R., Viisanen, Y., and Laurila, T.: Large contribution of boreal upland forest soils to a catchment-scale CH4 balance in a wet year, Geophys. Res. Lett., 43, 2946–2953, https://doi.org/10.1002/2016GL067718, 2016.
Mainiero, R. and Kazda, M.: Effects of Carex rostrata on soil oxygen in relation to soil moisture, Plant Soil, 270, 311–320, https://doi.org/10.1007/s11104-004-1724-z, 2005.
Martins, C. S. C., Nazaries, L., Delgado-Baquerizo, M., Macdonald, C. A., Anderson, I. C., Hobbie, S. E., Venterea, R. T., Reich, P. B., and Singh, B. K.: Identifying environmental drivers of greenhouse gas emissions under warming and reduced rainfall in boreal–temperate forests, Funct. Ecol., 31, 2356–2368, https://doi.org/10.1111/1365-2435.12928, 2017.
Marushchak, M. E., Pitkämäki, A., Koponen, H., Biasi, C., Seppälä, M., and Martikainen, P. J.: Hot spots for nitrous oxide emissions found in different types of permafrost peatlands, Global Change Biol., 17, 2601–2614, https://doi.org/10.1111/j.1365-2486.2011.02442.x, 2011.
Moore, T. R. and Dalva, M.: The influence of temperature and water table position on carbon dioxide and methane emissions from laboratory columns of peatland soils, J. Soil Sci., 44, 651–664, https://doi.org/10.1111/j.1365-2389.1993.tb02330.x, 1993.
Myers-Smith, I. H., Forbes, B. C., Wilmking, M., Hallinger, M., Lantz, T., Blok, D., Tape, K. D., Macias-Fauria, M., Sass-Klaassen, U., Lévesque, E., Boudreau, S., Ropars, P., Hermanutz, L., Trant, A., Collier, L. S., Weijers, S., Rozema, J., Rayback, S. A., Schmidt, N. M., Schaepman-Strub, G., Wipf, S., Rixen, C., Ménard, C. B., Venn, S., Goetz, S., Andreu-Hayles, L., Elmendorf, S., Ravolainen, V., Welker, J., Grogan, P., Epstein, H. E., and Hik, D. S.: Shrub expansion in tundra ecosystems: dynamics, impacts and research priorities, Environ. Res. Lett., 6, 045509, https://doi.org/10.1088/1748-9326/6/4/045509, 2011.
Nickerson, N. R.: Evaluating gas emission measurements using Minimum Detectable Flux (MDF) (White Paper), Eosense Inc., https://doi.org/10.13140/RG.2.1.4149.2089, 2016.
Olefeldt, D., Turetsky, M. R., Crill, P. M., and McGuire, A. D.: Environmental and physical controls on northern terrestrial methane emissions across permafrost zones, Global Change Biol., 19, 589–603, https://doi.org/10.1111/gcb.12071, 2013.
Olefeldt, D., Hovemyr, M., Kuhn, M. A., Bastviken, D., Bohn, T. J., Connolly, J., Crill, P., Euskirchen, E. S., Finkelstein, S. A., Genet, H., Grosse, G., Harris, L. I., Heffernan, L., Helbig, M., Hugelius, G., Hutchins, R., Juutinen, S., Lara, M. J., Malhotra, A., Manies, K., McGuire, A. D., Natali, S. M., O'Donnell, J. A., Parmentier, F.-J. W., Räsänen, A., Schädel, C., Sonnentag, O., Strack, M., Tank, S. E., Treat, C., Varner, R. K., Virtanen, T., Warren, R. K., and Watts, J. D.: The Boreal–Arctic Wetland and Lake Dataset (BAWLD), Earth Syst. Sci. Data, 13, 5127–5149, https://doi.org/10.5194/essd-13-5127-2021, 2021.
Patrignani, A. and Ochsner, T. E.: Canopeo: A Powerful New Tool for Measuring Fractional Green Canopy Cover, Agron. J., 107, 2312–2320, https://doi.org/10.2134/agronj15.0150, 2015.
Pavelka, M., Acosta, M., Kiese, R., Altimir, N., Brümmer, C., Crill, P., Darenova, E., Fuß, R., Gielen, B., Graf, A., Klemedtsson, L., Lohila, A., Longdoz, B., Lindroth, A., Nilsson, M., Jiménez, S. M., Merbold, L., Montagnani, L., Peichl, M., Pihlatie, M., Pumpanen, J., Ortiz, P. S., Silvennoinen, H., Skiba, U., Vestin, P., Weslien, P., Janous, D., and Kutsch, W.: Standardisation of chamber technique for CO2, N2O and CH4 fluxes measurements from terrestrial ecosystems, Int. Agrophys., 32, 569–587, https://doi.org/10.1515/intag-2017-0045, 2018.
Pessi, I. S., Viitamäki, S., Virkkala, A.-M., Eronen-Rasimus, E., Delmont, T. O., Marushchak, M. E., Luoto, M., and Hultman, J.: In-depth characterization of denitrifier communities across different soil ecosystems in the tundra, Environmental Microbiome, 17, 30, https://doi.org/10.1186/s40793-022-00424-2, 2022.
Peterson, R. A.: Finding Optimal Normalizing Transformations via bestNormalize, R J., 13, 294–313, https://doi.org/10.32614/RJ-2021-041, 2021.
Pihlatie, M. K., Christiansen, J. R., Aaltonen, H., Korhonen, J. F. J., Nordbo, A., Rasilo, T., Benanti, G., Giebels, M., Helmy, M., Sheehy, J., Jones, S., Juszczak, R., Klefoth, R., Lobo-do-Vale, R., Rosa, A. P., Schreiber, P., Serça, D., Vicca, S., Wolf, B., and Pumpanen, J.: Comparison of static chambers to measure CH4 emissions from soils, Agr. Forest Meteorol., 171–172, 124–136, https://doi.org/10.1016/j.agrformet.2012.11.008, 2013.
Pirinen, P., Simola, H., Aalto, J., Kaukoranta, J. P., Karlsson, P., and Ruuhela, R.: Climatological statistics of Finland 1981–2010, Finnish Meteorological Institute Reports, 1, 1–96, 2012.
R: The R Project for Statistical Computing: https://www.r-project.org/, last access: 5 May 2026.
Rantanen, M., Karpechko, A. Y., Lipponen, A., Nordling, K., Hyvärinen, O., Ruosteenoja, K., Vihma, T., and Laaksonen, A.: The Arctic has warmed nearly four times faster than the globe since 1979, Commun. Earth Environ., 3, 1–10, https://doi.org/10.1038/s43247-022-00498-3, 2022.
Rautakoski, H., Korkiakoski, M., Mäkelä, J., Koskinen, M., Minkkinen, K., Aurela, M., Ojanen, P., and Lohila, A.: Exploring temporal and spatial variation of nitrous oxide flux using several years of peatland forest automatic chamber data, Biogeosciences, 21, 1867–1886, https://doi.org/10.5194/bg-21-1867-2024, 2024.
Raynolds, M. K., Walker, D. A., Balser, A., Bay, C., Campbell, M., Cherosov, M. M., Daniëls, F. J. A., Eidesen, P. B., Ermokhina, K. A., Frost, G. V., Jedrzejek, B., Jorgenson, M. T., Kennedy, B. E., Kholod, S. S., Lavrinenko, I. A., Lavrinenko, O. V., Magnússon, B., Matveyeva, N. V., Metúsalemsson, S., Nilsen, L., Olthof, I., Pospelov, I. N., Pospelova, E. B., Pouliot, D., Razzhivin, V., Schaepman-Strub, G., Šibík, J., Telyatnikov, M. Yu., and Troeva, E.: A raster version of the Circumpolar Arctic Vegetation Map (CAVM), Remote Sens. Environ., 232, 111297, https://doi.org/10.1016/j.rse.2019.111297, 2019.
Reeburgh, W. S.: Oceanic Methane Biogeochemistry, Chem. Rev., 107, 486–513, https://doi.org/10.1021/cr050362v, 2007.
Repo, M. E., Susiluoto, S., Lind, S. E., Jokinen, S., Elsakov, V., Biasi, C., Virtanen, T., and Martikainen, P. J.: Large N2O emissions from cryoturbated peat soil in tundra, Nat. Geosci., 2, 189–192, https://doi.org/10.1038/ngeo434, 2009.
Rinne, J., Tuittila, E.-S., Peltola, O., Li, X., Raivonen, M., Alekseychik, P., Haapanala, S., Pihlatie, M., Aurela, M., Mammarella, I., and Vesala, T.: Temporal Variation of Ecosystem Scale Methane Emission From a Boreal Fen in Relation to Temperature, Water Table Position, and Carbon Dioxide Fluxes, Global Biogeochem. Cy., 32, 1087–1106, https://doi.org/10.1029/2017GB005747, 2018.
Rissanen, A. J., Ojanen, P., Stenberg, L., Larmola, T., Anttila, J., Tuominen, S., Minkkinen, K., Koskinen, M., and Mäkipää, R.: Vegetation impacts ditch methane emissions from boreal forestry-drained peatlands – Moss-free ditches have an order-of-magnitude higher emissions than moss-covered ditches, Front. Environ. Sci., 11, https://doi.org/10.3389/fenvs.2023.1121969, 2023.
Riutta, T., Laine, J., Aurela, M., Rinne, J., Vesala, T., Laurila, T., Haapanala, S., Pihlatie, M., and Tuittila, E.-S.: Spatial variation in plant community functions regulates carbon gas dynamics in a boreal fen ecosystem, Tellus B, 59, 838–852, https://doi.org/10.1111/j.1600-0889.2007.00302.x, 2007.
Saunois, M., Martinez, A., Poulter, B., Zhang, Z., Raymond, P. A., Regnier, P., Canadell, J. G., Jackson, R. B., Patra, P. K., Bousquet, P., Ciais, P., Dlugokencky, E. J., Lan, X., Allen, G. H., Bastviken, D., Beerling, D. J., Belikov, D. A., Blake, D. R., Castaldi, S., Crippa, M., Deemer, B. R., Dennison, F., Etiope, G., Gedney, N., Höglund-Isaksson, L., Holgerson, M. A., Hopcroft, P. O., Hugelius, G., Ito, A., Jain, A. K., Janardanan, R., Johnson, M. S., Kleinen, T., Krummel, P. B., Lauerwald, R., Li, T., Liu, X., McDonald, K. C., Melton, J. R., Mühle, J., Müller, J., Murguia-Flores, F., Niwa, Y., Noce, S., Pan, S., Parker, R. J., Peng, C., Ramonet, M., Riley, W. J., Rocher-Ros, G., Rosentreter, J. A., Sasakawa, M., Segers, A., Smith, S. J., Stanley, E. H., Thanwerdas, J., Tian, H., Tsuruta, A., Tubiello, F. N., Weber, T. S., van der Werf, G. R., Worthy, D. E. J., Xi, Y., Yoshida, Y., Zhang, W., Zheng, B., Zhu, Q., Zhu, Q., and Zhuang, Q.: Global Methane Budget 2000–2020, Earth Syst. Sci. Data, 17, 1873–1958, https://doi.org/10.5194/essd-17-1873-2025, 2025.
Shan, J., Sanford, R. A., Chee-Sanford, J., Ooi, S. K., Löffler, F. E., Konstantinidis, K. T., and Yang, W. H.: Beyond denitrification: The role of microbial diversity in controlling nitrous oxide reduction and soil nitrous oxide emissions, Global Change Biol., 27, 2669–2683, https://doi.org/10.1111/gcb.15545, 2021.
Simonen, A.: Bedrock of Finland, in: Atlas of Finland, edited by: Alalammi, P., Part I, Sheets 23–26, Geology, 1–4, ISBN 9789514805202, 1990.
Smemo, K. A. and Yavitt, J. B.: Anaerobic oxidation of methane: an underappreciated aspect of methane cycling in peatland ecosystems?, Biogeosciences, 8, 779–793, https://doi.org/10.5194/bg-8-779-2011, 2011.
Strack, M., Waddington, J. M., and Tuittila, E.-S.: Effect of water table drawdown on northern peatland methane dynamics: Implications for climate change, Global Biogeochem. Cy., 18, https://doi.org/10.1029/2003GB002209, 2004.
Suominen, J., Li, Q., Lehtonen, A., and Mäkipää, R.: Short Term Effects of Soil Disturbance on Greenhouse Gas Fluxes on a Nutrient-Rich Peatland After Clearcutting, Soil Use Manage., 42, e70218, https://doi.org/10.1111/sum.70218, 2026.
Tan, X., Nie, W.-B., Lu, Y., Wang, X.-W., Dang, C.-C., Wang, X., Liu, L.-Y., Ren, N.-Q., Ni, B.-J., and Xie, G.-J.: Anaerobic methane oxidation drives simultaneous nitrite and nitrous oxide removal, Bioresource Technol., 423, 132247, https://doi.org/10.1016/j.biortech.2025.132247, 2025.
Triches, N., Bolek, A., Rovamo, M., Lamprecht, R., Hashmi, W., Yazbeck, T., Ivanova, K., Eves, N., Paul, D., Virkkala, A.-M., Vesala, T., Biasi, C., Marushchak, M., and Goeckede, M.: Between light and dark, source and sink: N2O dynamics in a subarctic, nutrient-poor permafrost peatland, Resarch Square [preprint], https://doi.org/10.21203/rs.3.rs-8204920/v1, 15 December 2025.
Tupek, B., Minkkinen, K., Pumpanen, J., Vesala, T., and Nikinmaa, E.: CH4 and N2O dynamics in the boreal forest–mire ecotone, Biogeosciences, 12, 281–297, https://doi.org/10.5194/bg-12-281-2015, 2015.
Turetsky, M. R., Kotowska, A., Bubier, J., Dise, N. B., Crill, P., Hornibrook, E. R. C., Minkkinen, K., Moore, T. R., Myers-Smith, I. H., Nykänen, H., Olefeldt, D., Rinne, J., Saarnio, S., Shurpali, N., Tuittila, E.-S., Waddington, J. M., White, J. R., Wickland, K. P., and Wilmking, M.: A synthesis of methane emissions from 71 northern, temperate, and subtropical wetlands, Global Change Biol., 20, 2183–2197, https://doi.org/10.1111/gcb.12580, 2014.
Valenzuela, E. I., Padilla-Loma, C., Gómez-Hernández, N., López-Lozano, N. E., Casas-Flores, S., and Cervantes, F. J.: Humic Substances Mediate Anaerobic Methane Oxidation Linked to Nitrous Oxide Reduction in Wetland Sediments, Front. Microbiol., 11, https://doi.org/10.3389/fmicb.2020.00587, 2020.
Virkkala, A.-M., Aalto, J., Rogers, B. M., Tagesson, T., Treat, C. C., Natali, S. M., Watts, J. D., Potter, S., Lehtonen, A., Mauritz, M., Schuur, E. A. G., Kochendorfer, J., Zona, D., Oechel, W., Kobayashi, H., Humphreys, E., Goeckede, M., Iwata, H., Lafleur, P. M., Euskirchen, E. S., Bokhorst, S., Marushchak, M., Martikainen, P. J., Elberling, B., Voigt, C., Biasi, C., Sonnentag, O., Parmentier, F.-J. W., Ueyama, M., Celis, G., St.Louis, V. L., Emmerton, C. A., Peichl, M., Chi, J., Järveoja, J., Nilsson, M. B., Oberbauer, S. F., Torn, M. S., Park, S.-J., Dolman, H., Mammarella, I., Chae, N., Poyatos, R., López-Blanco, E., Christensen, T. R., Kwon, M. J., Sachs, T., Holl, D., and Luoto, M.: Statistical upscaling of ecosystem CO2 fluxes across the terrestrial tundra and boreal domain: Regional patterns and uncertainties, Global Change Biol., 27, 4040–4059, https://doi.org/10.1111/gcb.15659, 2021.
Virkkala, A.-M., Niittynen, P., Kemppinen, J., Marushchak, M. E., Voigt, C., Hensgens, G., Kerttula, J., Happonen, K., Tyystjärvi, V., Biasi, C., Hultman, J., Rinne, J., and Luoto, M.: High-resolution spatial patterns and drivers of terrestrial ecosystem carbon dioxide, methane, and nitrous oxide fluxes in the tundra, Biogeosciences, 21, 335–355, https://doi.org/10.5194/bg-21-335-2024, 2024.
Virkkala, A.-M., Wargowsky, I., Vogt, J., Kuhn, M. A., Madaan, S., Windholz, T., Arndt, K. A., Rocher-Ros, G., Göckede, M., Olefeldt, D., Schuur, E. A. G., Bastviken, D., O'Keefe, R., Rogers, B. M., Watts, J. D., Kent, K., Aalstad, K., Aho, K., Ala-Könni, J., Alcock, H., Althuizen, I., Arp, C. D., Asanuma, J., Aurela, M., Balathandayuthabani, S., Attermeyer, K., Barr, A., Barret, M., Batkhishig, O., Biasi, C., Björkman, M. P., Black, A., Blanc-Betes, E., Bodmer, P., Boike, J., Bolek, A., Bouchard, F., Bussmann, I., Cabrol, L., Canfora, E., Carey, S., Castro-Morales, K., Chae, N., Christen, A., Christensen, T. R., Christiansen, C. T., Chu, H., Clark, G., Clayer, F., Crill, P., Cunada, C., Davidson, S. J., Dean, J. F., Dengel, S., Detto, M., Dieleman, C., Domine, F., Dyukarev, E., Edgar, C., Elberling, B., Emmerton, C. A., Euskirchen, E., Falvo, G., Friborg, T., Garneau, M., Giamberini, M., Glagolev, M. V., Gonzalez-Meler, M. A., Granath, G., Guðmundsson, J., Happonen, K., Harazono, Y., Harris, L., Hashemi, J., Hasson, N., Heerah, J., Heffernan, L., Helbig, M., Helgason, W., Heliasz, M., Henry, G., Hensgens, G., Hiyama, T., Holmes, B., Hock, M., Holl, D., Holst, J., Holst, T., Hould-Gosselin, G., Humphreys, E., Hung, J., Huotari, J., Ikawa, H., Ilyasov, D. V., Ishikawa, M., Iwahana, G., Iwata, H., Jackowicz-Korczynski, M. A., Jansen, J., Järveoja, J., Jassey, V. E. J., Jensen, R., Jentzsch, K., Jespersen, R. G., Johannesson, C.-F., Jones, C. P., Jonsson, A., Jung, J. Y., Juutinen, S., Kane, E., Karlsson, J., Karsanaev, S., Kasak, K., Kelly, J., Kempton, K., Klaus, M., Kling, G. W., Kljun, N., Knutson, J., Kobayashi, H., Kochendorfer, J., Kohonen, K.-M., Kolari, P., Korkiakoski, M., Korrensalo, A., Kortelainen, P., Koster, E., Koster, K., Kotani, A., Krishnan, P., Kurbatova, J., Kutzbach, L., Kwon, M. J., Kyzivat, E. D., Lagroix, J., Langhorst, T., Lapshina, E., Larmola, T., Larsen, K. S., Laurion, I., Ledman, J., Lee, H., Leffler, A. J., Lesack, L., Lindroth, A., Lipson, D., Lohila, A., López-Blanco, E., St. Louis, V. L., Lundin, E., Luoto, M., Machimura, T., Magnani, M., Malhotra, A., Maljanen, M., Mammarella, I., Männistö, E., Marchesini, L. B., Marsh, P., Martikainen, P. J., Marushchak, M. E., Mastepanov, M., Mavrovic, A., Maximov, T., Minions, C., Nadeau, D. F., Montemayor, M., Morishita, T., Murphy, P., Nicholls, E., Nilsson, M. B., Niyazova, A., Nordén, J., Noumonvi, K. D., Nykänen, H., Oechel, W., Ojala, A., Okadera, T., Pal, S., Panov, A. V., Papakyriakou, T., Papale, D., Park, S.-J., Parmentier, F.-J. W., Pastorello, G., Peacock, M., Peichl, M., Petrov, R., St. Pierre, K., Pirk, N., Plein, J., Preskienis, V., Prokushkin, A., Pumpanen, J., Rains, H. A., Rakos, N., Räsänen, A., Rautakoski, H., Rinnan, R., Rinne, J., Rocha, A., Roulet, N., Roy, A., Rutgersson, A., Sabrekov, A. F., Sachs, T., Sahlée, E., Salazar, A., Sawakuchi, H. O., Schulze, C., Seco, R., Sepulveda-Jauregui, A., Serikova, S., Serrone, A., Silvennoinen, H. M., Sjogersten, S., Skeeter, J., Snöälv, J., Sobek, S., Sonnentag, O., Stanley, E. H., Strack, M., Strom, L., Sullivan, P., Sullivan, R., Sytiuk, A., Tagesson, T., Taillardat, P., Talbot, J., Tank, S. E., Tenuta, M., Terenteva, I., Thalasso, F., Thiboult, A., Thorgeirsson, H., Garcia Tigreros, F., Torn, M., Townsend-Small, A., Treat, C., Tremblay, A., Trotta, C., Tuittila, E.-S., Turetsky, M., Ueyama, M., Umair, M., Vähä, A., van Delden, L., van Hardenbroek, M., Varlagin, A., Varner, R. K., Virtanen, T., Veretennikova, E., Vesala, T., Voigt, C., Vonk, J. E., Wagner, R., Walter Anthony, K., Wang, Q., Watanabe, M., Webb, H., Welker, J. M., Westergaard-Nielsen, A., Westermann, S., White, J. R., Wille, C., Williamson, S. N., Zolkos, S., Zona, D., and Natali, S. M.: ABCFlux v2: Arctic–boreal CO2 and CH4 monthly flux observations and ancillary information across terrestrial and freshwater ecosystems, Earth Syst. Sci. Data, 18, 6357–6409, https://doi.org/10.5194/essd-18-6357-2026, 2026.
Voigt, C., Marushchak, M. E., Abbott, B. W., Biasi, C., Elberling, B., Siciliano, S. D., Sonnentag, O., Stewart, K. J., Yang, Y., and Martikainen, P. J.: Nitrous oxide emissions from permafrost-affected soils, Nat. Rev. Earth Environ., 1, 420–434, https://doi.org/10.1038/s43017-020-0063-9, 2020.
Voigt, C., Virkkala, A.-M., Hould Gosselin, G., Bennett, K. A., Black, T. A., Detto, M., Chevrier-Dion, C., Guggenberger, G., Hashmi, W., Kohl, L., Kou, D., Marquis, C., Marsh, P., Marushchak, M. E., Nesic, Z., Nykänen, H., Saarela, T., Sauheitl, L., Walker, B., Weiss, N., Wilcox, E. J., and Sonnentag, O.: Arctic soil methane sink increases with drier conditions and higher ecosystem respiration, Nat. Clim. Change, 13, 1095–1104, https://doi.org/10.1038/s41558-023-01785-3, 2023.
Weslien, P., Klemedtsson, Å. K., Börjesson, G., and Klemedtsson, L.: Strong pH influence on N2O and CH4 fluxes from forested organic soils, Eur. J. Soil Sci., 60, 311–320, https://doi.org/10.1111/j.1365-2389.2009.01123.x, 2009.
Whalen, S. C.: Biogeochemistry of Methane Exchange between Natural Wetlands and the Atmosphere, Environ. Eng. Sci., 22, 73–94, https://doi.org/10.1089/ees.2005.22.73, 2005.
Whalen, S. C., Reeburgh, W. S., and Sandbeck, K. A.: Rapid Methane Oxidation in a Landfill Cover Soil, Appl. Environ. Microb., 56, 3405–3411, https://doi.org/10.1128/aem.56.11.3405-3411.1990, 1990.
Wild, J., Kopecký, M., Macek, M., Šanda, M., Jankovec, J., and Haase, T.: Climate at ecologically relevant scales: A new temperature and soil moisture logger for long-term microclimate measurement, Agr. Forest Meteorol., 268, 40–47, https://doi.org/10.1016/j.agrformet.2018.12.018, 2019.
Wobbrock, J. O., Findlater, L., Gergle, D., and Higgins, J. J.: The aligned rank transform for nonparametric factorial analyses using only anova procedures, in: Proceedings of the SIGCHI Conference on Human Factors in Computing Systems, 143–146, https://doi.org/10.1145/1978942.1978963, 2011.
Yao, X., Wang, J., and Hu, B.: How methanotrophs respond to pH: A review of ecophysiology, Front. Microbiol., 13, https://doi.org/10.3389/fmicb.2022.1034164, 2023.
Yeo, I. and Johnson, R. A.: A new family of power transformations to improve normality or symmetry, Biometrika, 87, 954–959, https://doi.org/10.1093/biomet/87.4.954, 2000.
Zhang, H., Tuittila, E.-S., Korrensalo, A., Laine, A. M., Uljas, S., Welti, N., Kerttula, J., Maljanen, M., Elliott, D., Vesala, T., and Lohila, A.: Methane production and oxidation potentials along a fen-bog gradient from southern boreal to subarctic peatlands in Finland, Global Change Biol., 27, 4449–4464, https://doi.org/10.1111/gcb.15740, 2021.