
the Creative Commons Attribution 4.0 License.
the Creative Commons Attribution 4.0 License.
 | 18 Nov 2026
Verification of coastal enhanced weathering by tracking the dissolution of alkaline minerals: theory and laboratory tests with olivine
Alexander Milde

Lennart T. Bach
Coastal Enhanced Weathering (CEW) is a marine Carbon Dioxide Removal (CDR) method that adds ground alkaline minerals to shallow regions of the ocean in order to increase seawater alkalinity, i.e. its capacity for storing atmospheric CO2 as bicarbonate. While CEW is promising with regard to cost and scalability, it is an uncontained, “open-system” style of CDR, and presents significant challenges to effective measurement, reporting, and verification (MRV) of the process. In particular, quantifying how much alkalinity is released from an added amount of mineral is challenging as the minerals dissolve and release alkalinity over wide spatial and long temporal scales. Such quantification is further complicated by the fact that dissolved alkalinity is rapidly diluted below detectable concentrations. Here, we propose an approach to quantify alkalinity formation that relies on solid sediment tracers to track mineral grains underwater and measure how much they have dissolved over time. In theory, the amount of dissolution at any given point in time is proportional to the amount of alkalinity released. Thus, the approach aims to overcome the near impossible detection of alkalinity accumulation in the dissolved phase by tracking the loss of alkaline material in the solid phase. We describe a test of the fundamental aspects of this method including the measurement of the mineral and tracer content of a sediment sample, and the extent to which those measurements correlate with changes in seawater chemistry. While the specific tracer used in this experiment proved unsuitable for this method, we found that olivine dissolution significantly increased alkalinity in seawater compared to control incubators. X-Ray Diffraction (XRD) was able to quantify the change in the olivine in the sediment (albeit with large relative errors) and automated particle counting methods were able to enumerate tracer particles when illuminated under UV-A light. These results are insufficient to fully substantiate this method, but rather serve as an illustration of, and proof-of-principle of, a new approach to measure alkalinity addition to the ocean resulting from CEW deployments. By publishing these findings as a LESSONS (Limitations, Errors, Surprises, Shortcomings, Opportunities for New Science) Report we aim to present and introduce a promising opportunity for new science that we hope will spur a thorough and robust investigation of this method in the broader research community.
- Article
(3468 KB) - Full-text XML
- BibTeX
- EndNote


Limiting global warming to below 2 °C requires significant and rapid reductions in greenhouse gas emissions as well as gigatonne-scale atmospheric carbon dioxide removal (CDR) (Rogelj et al., 2018; Shukla et al., 2022; van Vuuren et al., 2018). The oceans offer a unique opportunity for large scale CDR with one important marine method under consideration being Ocean Alkalinity Enhancement (OAE) (Hartmann et al., 2013; Oschlies et al., 2023; Renforth and Henderson, 2017). There are several ways to accomplish OAE, one of which is coastal enhanced weathering (CEW), i.e. the addition of ground alkaline minerals, such as forsterite rich olivine, to shallow regions of the ocean (Eisaman et al., 2023; Geerts et al., 2025; Schuiling and Krijgsman, 2006). As the alkaline mineral dissolves, protons are consumed, and this reduction in [H+] ions cause a shift in the speciation of the dissolved inorganic carbon (DIC) content of the seawater away from aqueous carbon dioxide (CO2) towards bicarbonate and carbonate ions (Renforth and Henderson, 2017). This shift enables atmospheric carbon dioxide to be absorbed into the water resulting in an increase in the DIC content of the seawater (Ho et al., 2023) for a currently estimated ∼100 000 years (Middelburg et al., 2020).
Investigations have shown that it is possible to use existing equipment and processes to mine, grind, and distribute suitable minerals in a way that renders the entire process strongly carbon negative (Foteinis et al., 2023; Renforth and Henderson, 2017). Moreover, techno-economic studies have shown that removal costs are likely low relative to other forms of durable CDR, and that the method has the potential to scale to multiple gigatons of removals per year (Beerling et al., 2020; Moosdorf et al., 2014; NASEM et al., 2022; Renforth, 2019; Schuiling and Krijgsman, 2006; Strefler et al., 2018).
However, the measurement, reporting, and verification (MRV) of alkalinity addition to the ocean is challenging for this uncontained, “open system”, style CDR approach and presents a significant barrier to the use of CEW at relevant scales (NASEM et al., 2022). Due to the dissolution kinetics of suitable minerals and practically achievable particle size distributions alkalinity release will likely happen on a timescale of months to years over a widespread and spatially evolving area of the seafloor in an operational deployment of CEW. While CEW field studies with olivine were able to detect elevated pore water alkalinity, corresponding alkalinity enhancement in the water column above are yet to be shown (Vesta, PBC, 2024). As described in (Ho et al., 2023), water sampling based methods of measuring the addition of alkalinity from a mineral deployment are unlikely to be successful given the speed at which the alkalinity perturbation created is diluted below the limit of detectability via mixing with the rest of the ocean and the operational difficulty in adequately constraining that addition rate over time (He and Tyka, 2023; Mu et al., 2023; Wang et al., 2023).
However, these water sampling approaches to measurement based MRV of this process consider the accumulation of alkalinity in the dissolved phase in the seawater (Ho et al., 2023). Here, we propose a different approach: rather than measuring the accumulation of dissolved alkalinity in seawater, we explore if alkalinity formation can be determined by measuring the loss of alkaline mineral mass on the seafloor. This loss of alkaline mineral would be used to infer the amount of alkalinity added to the seawater. A proportionality factor is used to convert the mass of mineral dissolved into an amount of alkalinity generated. If this proportionality factor used is the stoichiometric ratio of forsterite olivine to alkalinity, then this amount represents an initial release of alkalinity before taking alkalinity scavenging processes, such as secondary precipitation, into account. This framework could have the potential to be a tractable measurement approach as the mineral grains do not get dispersed or diluted as widely as the overlying waters and there is a much less, if any, natural background of either the mineral or tracer in the sampled sediments. Additionally, a single measurement represents a time integrated amount of mineral dissolved, rather than simply an instantaneous rate of dissolution, simplifying the potential operationalization of this technique.
The experiment presented herein aimed to evaluate the extent to which a change in water chemistry of an enclosed volume could be correlated with sediment-based measurements taken using techniques suitable for a field deployment of this measurement process. In this experiment we compared two groups of incubators, one containing quartz sand and a commercially available fluorescent tracer sediment, the other containing quartz, tracer, and olivine sediment. The commercially available tracer sediment used herein is an imperfect tracer in that it does not shrink identically to the mineral particles as they dissolve, however it allows fluorescence to be evaluated as a traceable characteristic. We measured the alkalinity evolution of the two sets of incubators and assessed the changes in both the tracer particle concentration and olivine concentration at the end of the incubation period. While olivine was used in this experiment, the technique is potentially applicable to many crystalline alkaline minerals considered for CEW or other forms of OAE.
2.1 Theoretical basis for tracing alkalinity enhancement in sediments
The ratio-based sediment tracing method is a mass balance approach to quantifying the time-integrated amount of dissolution of a mineral over a spatially evolving area of seafloor. Conceptually, this method is enabled by mixing tracer particles into the mineral sediment of interest before it is added to the ocean. Assuming the tracer particles have identical hydrodynamic properties (i.e. density and hydrodynamic diameter) to the mineral of interest over the time period in question, they should be transported and deposited identically to the mineral particles of interest. A perfect tracer will decrease in diameter at the same rate as the dissolving mineral particles do in order to maintain matching hydrodynamic properties, and therefore transport characteristics, to the mineral particles over the full dissolution period. As a result, in any given sediment sample, the ratio of tracer concentration to mineral concentration should stay constant over the area of dispersal, only changing if the mineral has dissolved along the way. Therefore, knowing the initial mineral to tracer ratio, as well as the measured concentrations of both tracer and mineral in a given sediment sample, allows a quantitative amount of mineral dissolution to be calculated.
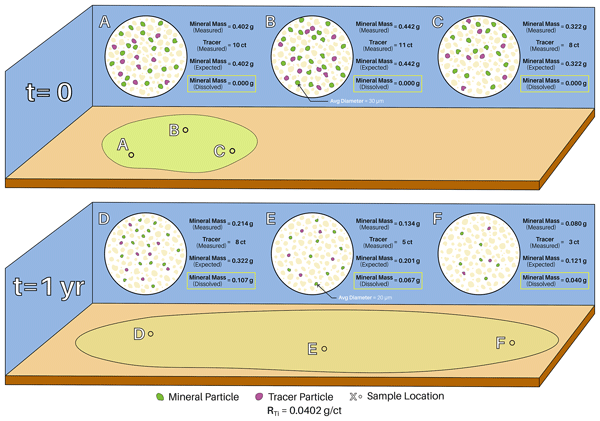
Figure 1 provides an illustration of method. The top panel is representative of the deployment site immediately after mineral and tracer addition; where the mineral and tracer have dispersed only due to drifting while settling to the bottom and no appreciable dissolution has occurred. The ratio of mass of mineral per sample to tracer particle count (RT) is unchanged from the initial ratio, which means the expected and measured mineral masses are equal. The lower panel is representative of the deployment site after one year, during which time the added sediment has been dispersed by bottom currents and some of the added mineral has dissolved. Since the tracer particles are transported identically to the mineral particles the ratio of tracer particle count to mineral particle count is the same, however, since the mineral particles are now smaller, the ratio of mass of mineral per sample to tracer particle count has changed. This means that the amount of mineral mass expected in the sample (predicted by the tracer concentration) is larger than the concentration actually measured. The difference between the two is equal to the mass of the mineral that has dissolved.

Figure 1Diagram illustrating the basic principle of the measurement technique, including an exemplified calculation. Note: For illustrative purposes this figure displays the ideal scenario where the tracer particles shrink identically to the mineral particles as they dissolve in order to maintain matching hydrodynamic properties over the full dissolution period rather than the scenario of this experiment where an imperfect non-shrinking tracer was used.
The tracer ratio is defined as:
where [Mineral] is the concentration of the mineral of interest in a sediment expressed as a mass per sample and [Tracer] is the concentration of tracer particles in a sediment expressed in units of counts per sample. To calculate the amount of mineral dissolved in a sediment sample, we take the difference of the expected mineral concentration and the measured mineral concentration as shown in the following equations:
where RTi is the initial ratio at the time of addition to the ocean and Mdissolved represents the mass of mineral dissolved in a given sample. From this we can calculate the mass of the mineral that has dissolved in the sample from only quantities measured in the sample as follows:
This logic relies on the assumption that there is no natural concentration of the mineral of interest present in the background sediment. This holds true for olivine in most locations (Wilson, 2004) and likely holds true for any other mineral of interest to CDR as the mineral will necessarily have an exceptionally fast dissolution rate on the geologic time scale and therefore would not survive long enough to be incorporated into ocean sediments. If the deployment area does contain trace amounts of the mineral of interest it would cause the technique to under report the amount of mineral dissolved, and therefore the amount of carbon ultimately removed from the atmosphere. In a commercial setting this is the preferable type of error as far as carbon crediting is concerned because it takes credit for less carbon being ultimately removed than was actually removed from the atmosphere.
Assuming that the sediment's dispersal area, Ad, is well sampled, integrating over the entire area, as shown below, yields the total mass of the mineral that has dissolved between the mineral's addition to the ocean and the time of sampling.
This calculated total mass of alkaline mineral dissolution can be converted to a quantitative estimate of alkalinity added to the ocean via an either theoretically or experimentally derived proportionality factor.
Where: malk is the amount of alkalinity released, Mtotal dissolved is the amount of mineral dissolved in the ocean, αalk is the factor describing the change in total alkalinity per unit of mineral dissolved. For olivine, this proportionality factor would theoretically be four times the forsterite percentage of the olivine as stoichiometrically four moles of alkalinity are released per mole of forsterite (Mg) olivine dissolved per Reaction (R1) (Fuhr et al., 2022; Montserrat et al., 2017; Rigopoulos et al., 2018).
The mineral olivine exists in nature as a solid solution of forsterite and fayalite, its magnesium and iron endmembers respectively. This distinction is important as the iron-rich olivine dissolution does not generate alkalinity (Griffioen, 2017). However, in practice, even this forsterite specific factor is unlikely to be exactly the theoretical value due to potential secondary phase formation (Fuhr et al., 2022; Rigopoulos et al., 2018).
In order to know the amount of alkalinity added to the water column, the value we are ultimately interested in, two values need to be accurately constrained. First, the amount of alkalinity initially released into the aqueous phase in pore waters via mineral dissolution, and second, the amount of that initial alkalinity release that escapes loss to alkalinity scavenging processes and makes it into the overlying water column. There are multiple mechanisms through which alkalinity can be lost from the pore waters, after initial addition, but before making it to the overlying water column (Geerts et al., 2025). Therefore, in an operational setting, experimentally deriving addition-site and olivine-source specific proportionality constants is likely a more robust approach than relying solely on the theoretical stoichiometric factor. Ultimately, the method proposed here enables obtaining a quantitative measurement-based estimate of the initial amount of alkalinity added to the ocean without relying on water sample analysis.
2.2 Incubator setup and experiment initiation
In this study we tested some crucial aspects of this alkalinity enhancement verification approach for CEW described in Sect. 2.1. This experiment utilized eight 11 L high density polyethylene buckets with lids as microcosms for seawater and sediment incubation. Each incubator had two 30 W electric heat belts wrapped around its base that were controlled by an Inkbird ITC308 digital temperature controller. The input thermocouple of the temperature controller was routed through the lid and suspended in the center of the seawater volume. The incubators were split into two groups, a control group (N=4) where quartz sand and tracer were incubated and a treatment group (N=4) where quartz sand, olivine-containing serpentinite, and tracer were incubated (preparation of solid-phase materials is described in Sect. 2.3).
The seawater used for this experiment was collected in Taroona (Hobart, Tasmania) and was passed through a 20 µm filter prior to use. Immediately prior to the start of the experiment a 120 L container was filled with seawater and bubbled with ambient air for approximately 30 min to equilibrate the seawater with the ambient atmosphere. This water was then tested for salinity using a SonTek CastAway-CTD and pHT using a Metrohm 914 pH meter and electrode following the procedure described in Sect. 2.4. Two water samples, one of 60 mL and one of 15 mL, were taken for later total alkalinity and dissolved silicate analysis respectively. The samples were taken and stored in accordance with the procedure described in Sect. 2.4. Immediately following sampling, each incubator was filled with 10.00 kg of seawater from the 120 L reservoir.
Once all the incubators were filled with seawater, the sediment mixtures were added to their respective incubator (see Sect. 2.3). In tests prior to the experiment, we noted that a fraction of the added mineral tends to float on the surface of the incubated seawater without being immersed. To avoid this effect, a small amount of water was taken from the incubator in question prior to the addition of the sediment mixture. The sediment was then mixed with the small amount of seawater to form a paste, which was then immediately added to the respective incubator. The majority of the sediment quickly settled out of suspension and formed an uneven layer ranging between approximately 0.1–3 mm thick on the bottom of the incubator. The remaining (small) particles remained suspended for longer before settling over the course of the experiment.
After sediment addition, the temperature-controlled heaters were then turned on and set to hold a temperature of 32.0 °C. The high temperature, representative of tropical regimes, was chosen to accelerate dissolution within the experimental timeframe. There was no mixing of the water in the incubators beyond any potential convective mixing induced by the heating belts. (Please note that the incubators were placed in a room with an ambient temperature around 20 °C.) The incubators were tightly sealed with lids, leaving approximately 5 cm of headspace between the water's surface and the lid. The experiment was run for a period of 41 d.
2.3 Sediment preparation
The experiment used ground rock containing the mineral olivine as its alkalinity source. This rock originated in Henan Province, China, likely from the Zhouan ultramafic intrusion (Wang et al., 2013). X-ray Diffraction analysis (method described in Sect. 2.6) reveals its composition to be that of a partially serpentinized ultramafic rock consisting of 57 % unaltered olivine and smaller percentages of serpentinite group minerals such as antigorite, lizardite, talc, as well as trace amounts of other accessory minerals. The elemental composition of the serpentinite, obtained through the SEM analysis, is shown in Table 1.
Table 1The weight percentage of each element contained in the serpentinite used in this experiment.

The ground rock was passed through a progression of sieves with mesh sizes between 250–38 µm. The fraction of material passing through all sieves (i.e. <38 µm) was saved and used as the alkaline feedstock for this experiment. The elemental composition of the serpentinite grains was determined through the use of a Hitachi SU-70 analytical field emission scanning electron microscope (SEM) and energy-dispersive spectrometer (Central Science Laboratory – CSL, University of Tasmania).
The tracer used in this study was manufactured in Scotland by Partrac, Ltd and consists of Silicon Carbide (SiC) substrate grains coated with a binding agent containing red fluorescent dye and para-magnetic inclusions. Silicon Carbide was chosen for the substrate because it has a nearly identical density to that of olivine (3.21 g cm−3), and is readily available as industrial abrasive. This experiment used pre-ground F320 grit SiC with a D50 (median grain diameter) of approximately 30 µm. While some effort was made to match the physical properties of the tracer particles to those of the mineral particles, the goal of this experiment was not to prove that we could create a tracer that exactly matched the olivine sediment, but rather to explore the suitability of different sediment analysis techniques in the context of this measurement framework. Given the controlled volume of this experiment, transport dynamics should not affect the results of the experiment.
The fluorescent dye emits light at approximately a 610 nm wavelength when exposed to UV-A illumination. Tracer sediment was taken directly from the provided batch of bulk material and not passed through any sieves prior to inclusion in the prepared sediment mixtures. Lab grade quartz (Sigma-Aldrich) with a particle size greater than 230 mesh (62 µm) was also used in the preparation of the sediment mixture for this experiment.
Large (44 g) batches of two types of sediment mixture were prepared. The control mixture consisted of 97.50 % quartz and 2.50 % tracer (by weight), and the sample mixture consisted of 50.00 % serpentinite, 47.50 % quartz, and 2.50 % tracer (by weight). These large batches were vigorously stirred and shaken until they appeared well mixed to a visual inspection. Four containers were each filled with 7500 g of the control mixture, and another four were filled with 7500 g of the olivine mixture. The amount of sediment added was chosen to accurately mimic realistic rock to water ratios that could be expected in an operational deployment as well as to limit the total alkalinity rise in the seawater over the course of the experiment in an effort to avoid calcium carbonate precipitation. All containers were covered with aluminum foil and stored for less than a day before being added to the incubators at the start of the experiment.
2.4 Seawater sampling and analysis
Over the course of the experiment, the incubators' lids were only removed for sampling to minimize evaporation and air-seawater CO2 exchange. Care was taken to shake the water that had condensed on the bottom of the lid back into the incubators whenever the lids were opened to minimize evaporative water loss and its associated alkalinity increase. The seawater was sampled periodically for pHT using a Metrohm 914 pH meter and a Metrohm Aquatrode Plus coupled glass and reference electrode with integrated PT1000 temperature sensor. Voltage and temperature readings were taken by gently stirring the electrode in the incubator's seawater and recording values when both the voltage and temperature readings had stabilized, typically after 3–5 min. Voltage readings were converted into pH units on the total scale (pHT) using a certified TRIS buffer solution provided by Andrew Dickson's laboratory at the Scripps Institute of Oceanography and following the procedure described in SOP6a by (Dickson et al., 2007). Calibration of the temperature vs voltage behavior of the electrode was accomplished by recording voltage values periodically as the TRIS buffer solution was warmed from 12 to 33 °C over approximately 45 min and then fitting an equation (R2=0.999) to the measured data points (Ferderer et al., 2022).
Samples for Total Alkalinity (TA) analysis were taken periodically during the incubation period with a higher frequency of measurements at the beginning of the experiment. For each measurement ∼60 mL of seawater was extracted from the incubator with a plastic syringe and filtered through a 0.2 µm nylon filter into a polyethylene (PE) bottle. The syringe, filter, and bottle were all pre-rinsed with sample. Different syringes were used for the C and S incubators. These sample bottles were stored in the dark at 7 °C for between 0–14 d before analysis. The TA of each sample was determined via open cell titration using a Metrohm 862 Compact Titrosampler coupled with an Aquatrode Plus with a PT1000 temperature sensor, following SOP3b in (Dickson et al., 2007). The accuracy of these measurements was established to be mostly within through replicate measurements of certified reference material provided by Prof. Andrew Dickson's laboratory at Scripps Institution of Oceanography.
Each time the seawater was sampled for TA, ∼15 mL was also filtered through the same 0.2 µm filter into a capped polystyrene tube that had been pre-rinsed with sample. These samples were frozen, stored at −20 °C, and analyzed for dissolved silicates (DSi) after the experiment's conclusion (Hansen and Koroleff, 1999). Aragonite saturation states were calculated using PyCO2sys (Humphreys et al., 2022) and the saturation index of sepiolite was estimated using PHREEQC (Parkhurst and Appelo, 1999). The PHREEQC calculations were run using measured pH (entered in units on the total scale), temperature, and DSi values along with seawater ion concentrations from Zeebe and Wolf-Gladrow (2001) linearly interpolated from standard salinity to the measured salinity of the incubators.
At the end of the experiment, on day 41, final pHT measurements and water samples were taken and the salinity of each incubator, including the two containing the excess seawater, was taken using the same SonTek CastAway-CTD.
2.5 Sediment recovery
Following the final water sampling, tubing was used to siphon the majority of the water from the incubator. As the dropping level of the water approached the sediment the incubator was tilted on its side and care was taken to not let any of the sediment escape into the tube. The sediment was then manually agitated and then the sludgy mixture was poured into a 250 mL plastic jar. Any sediment that was left in the incubator was then flushed into the jar with a rinsed syringe filled with the water that had just been siphoned from that incubator. The sediment in the seawater in the plastic jars was allowed to settle out of suspension (∼20 min) and the overlying seawater was removed with a rinsed syringe and new pipette. The jar was then filled with approximately 60 mL of deionized (18.2 MΩ) water and shaken. After the sediment had settled, the water was again removed in the same manner. This rinsing procedure was repeated before the samples were dried overnight in an oven at 60 °C. After drying the crust of sediment that had formed was broken up and stirred with a spatula until it was once again a homogeneous fine powder.
2.6 Sediment analysis
After drying, the sediment samples were analyzed for both olivine and tracer concentrations. The olivine concentration of each initial and final sediment sample was determined by powder X-Ray Diffraction (XRD). The desire to maintain applicability of the measurement method to operational deployment scales drove the selection of the analysis techniques used in this experiment. While there are potentially more precise methods available to measure the amount of forsterite in sediment, X-ray Diffraction (XRD) was used because it has the potential to take field based measurements and is inexpensive enough to be used at scale (Dhanjal et al., 2006; Sarrazin et al., 2005).
A representative portion of each sample was reduced to the optimum grain-size range (<10 µm) by grinding in an agate mortar for 2 min. Special effort was undertaken to minimize the preferred orientation of stratified structures from serpentine during sample loading. Continuous-scan X-ray powder-diffraction data were collected over a range 4–100°2Q with CoKa radiation on a Bruker D2 Phaser Bragg–Brentano diffractometer equipped with a Fe K-beta filter, divergence slit, incident- and diffracted-beam Soller slits of 2.5° and a LynxEye detector. The Co X-ray tube was operated at 30 kV and 10 mA. Mineral phases were identified using the International Centre for Diffraction Database PDF-2, and the Open COD database linked to DIFFRAC.EVA 5.2.05 software from Bruker. Identification of minor mineral phases in complex diffraction patterns was limited to phases having relatively distinct peak positions. Quantification was performed using Topas5 software based on Rietveld's method (Bruker AXS). The R-weighted pattern (Rwp), the least square criteria to estimate the calculated pattern fit to the experimental XRD pattern, yielded Rwp between 5–11, and the ratio between the calculated and the expected was less or equal to 4.2.
The tracer concentration of each sample was evaluated using its fluorescence signature and measured in units of counts per area after photographing single layers of sediment, illuminated with ultraviolet light (UV-A), through a microscope. Special sample holders were prepared by punching six ∼8 mm diameter holes in thin dark (non-luminescent) transfer paper rectangles cut to be the same width and slightly shorter than the glass slide. Doub le-sided tape was used to stick these paper rectangles to the glass slides creating six circles of exposed adhesive surrounded by paper on each. Sediment was then piled on top of each area of exposed adhesive and pressed firmly down with a spatula. The excess from each slide was then shaken and tapped off such that only a single, even, layer of sediment remained on each patch of adhesive. One slide was made for each incubated sediment sample. Three slides were made from each original, un-incubated, sediment batch. These slides were placed on the stage of a Nikon Eclipse Ci compound optical microscope and illuminated from above with UV-A light produced by a Weltool M2-BF Professional 2100 mW UV flashlight. Photos of each slide were taken by the microscope's integrated Nikon DS-Ri2 camera at 20× magnification. This setup yielded pictures that were 1608 pixels×1608 pixels and captured an area of 5.46 mm2. In total, 12 photos of each slide were taken producing 12 photos of each incubated sample and 36 photos of the unincubated sediment batch for analysis. An example of the UV-light image is shown in Fig. 5.
These photos were analyzed for tracer counts in the FIJI distribution of the ImageJ software (Schindelin et al., 2012). A color threshold value was established in each of the Red, Green, and Blue image channels. This threshold value combination was tweaked manually until a setting was found “by eye” that best captured particle outlines in a selected subset of all the pictures. This final RGB value combination was used to analyze all pictures. A pixel to µm conversion factor was determined by measuring the number of pixels per millimeter in a picture of a ruler with 0.5 mm graduations. An ImageJ Macro script was utilized to open each picture, apply the predetermined color threshold, and count all particles larger than a minimum particle size. This minimum particle size was set to be 5 µm corresponding with the lower limit of the tracer's diameter distribution. The script called the “analyze particles” function of ImageJ to count and determine each particle's characteristics in an image. The script outputs a total number and average size of the particles in each image. This individual image data was aggregated in a spreadsheet to produce sample level particle statistics.
3.1 Seawater
The total alkalinity increased until the end of the experiment (41 d) by in the four olivine treated incubators (S1–S4), and in the control incubators (C1–C4). The changes in all eight incubators were characterized by an initial relatively rapid increase that asymptotically approached a steady state rate of change that began ∼5 d into the experiment. In the control incubators the steady state rate of change was approximately zero whereas in the olivine treated incubators a linear regression (dashed black line Fig. 2a) shows it was (R2=0.954).

Figure 2Temporal variation measured in (a) total alkalinity, (b) dissolved silica, (c) pHT, and calculated for (d) the saturation state of aragonite. The C group samples contained 97.5 % quartz and 2.5 % tracer while the S group samples contained 50.0 % serpentinite, 47.5 % quartz, and 2.5 % tracer by weight.
pHT values were consistently higher in the olivine treated incubators than in the control incubators. All incubators exhibited a period of consistent, and relatively rapid, pH increase lasting until approximately day eight. Following day eight the pHT in the olivine containing incubators remained rather stable while the pHT of the control incubators steadily increased from approximately day 22 through the end of the experiment.
Dissolved silicate measurements were noisier and displayed less clear trends than the other variables, however the olivine treated incubators did generally show higher DSi levels than the control incubators. The DSi evolution followed roughly the same pattern in both the control and olivine containing incubators, with a relatively rapid increase in the beginning of the experiment, moderate increases for the bulk of the incubation time and a small dip in DSi levels near the end of the experiment. The initial jump in alkalinity observed in the control incubators, as well as the increases in Dsi and pH could be indicative of cross contamination of ultrafine olivine particles on measurement equipment, tracer coating dissolution, or quartz fines dissolution.
3.2 Sediment
The initial olivine-containing sediment sample had an olivine concentration of 26.1±0.6 %. Following incubation in the seawater, XRD analysis of samples (representative output shown in Fig. 4) from four replicate incubators S1–S4 had olivine concentrations of 24.5±0.6 % (Fig. 3).

Figure 3Olivine content of the sediment samples before and after 41 d of incubation in seawater (32 °C, pHT 7.9).
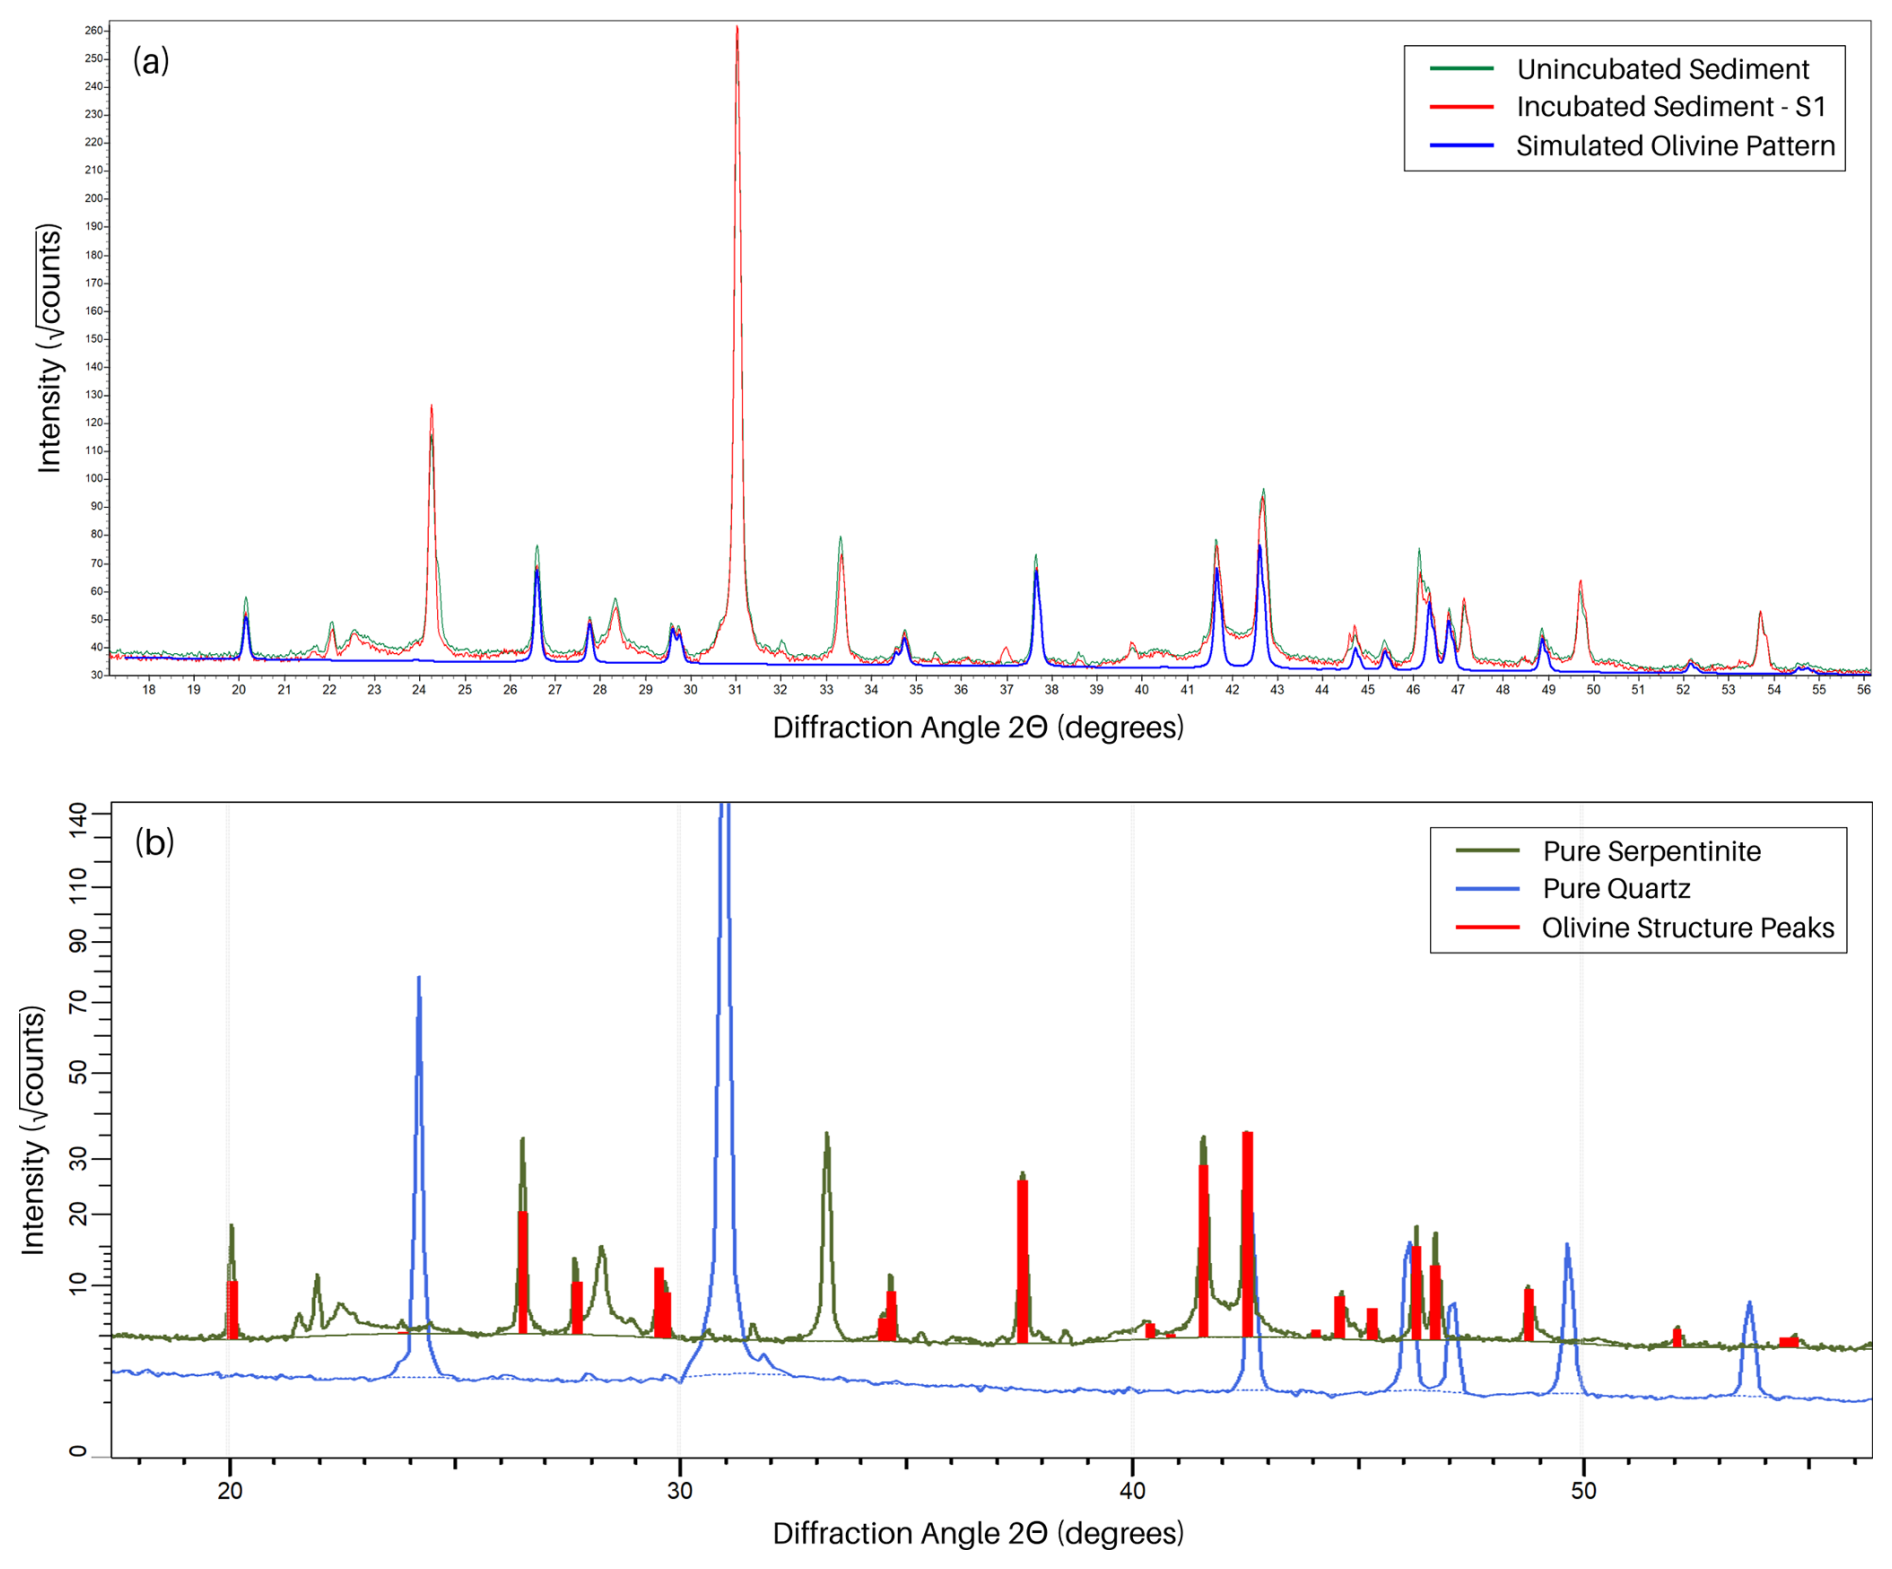
Figure 4(a) X-ray diffraction patterns of the initial mixture of serpentinite with quartz (green) and the same mixture after incubation in sea water (red). The blue line along the pattern represents the simulated pattern of forsterite. At each 2Θ angle corresponding a peak in the blue line (the simulated forsterite pattern) the difference in peak height between the green line and red line represents the reduction in olivine content of the sediment sample due to dissolution. (b) X-ray diffraction patterns of pure quartz (blue) and pure serpentinite (green). Vertical red sticks mark the peaks produced by olivine structure (forsterite (Mg,Fe)2SiO4, Mg>Fe) in serpentinite.

Figure 5Sediment samples illuminated under UV-A light with the particles outlined by the FIJI script used to enumerate the tracer concentrations. The sample pictured in (a) was taken from the initial batch of the control mixture and was not subjected to incubation in seawater while (b) was taken from incubator S1 after 41 d of incubation in seawater (32 °C, pHT 7.9).
The sediment tracer concentrations unexpectedly increased after the incubation period, and the average size of each tracer particle decreased (Fig. 6). For the initial samples, the average tracer counts were 47.4 and 32.8 particles per image for the C and S groups respectively. These counts increased to 164 and 156 particles per image after incubation in seawater and subsequent collection and sampling steps. Correspondingly, the average particle areas decreased after incubation, from 1860.6 to 1220.4 µm2 in the control incubators and from 1850.5 to 1413.6 µm2 in the treatment incubators. These changes can be explained by unexpected particle clumping in storage prior to the addition to the incubators and will be discussed in more detail in Sect. 4.1.
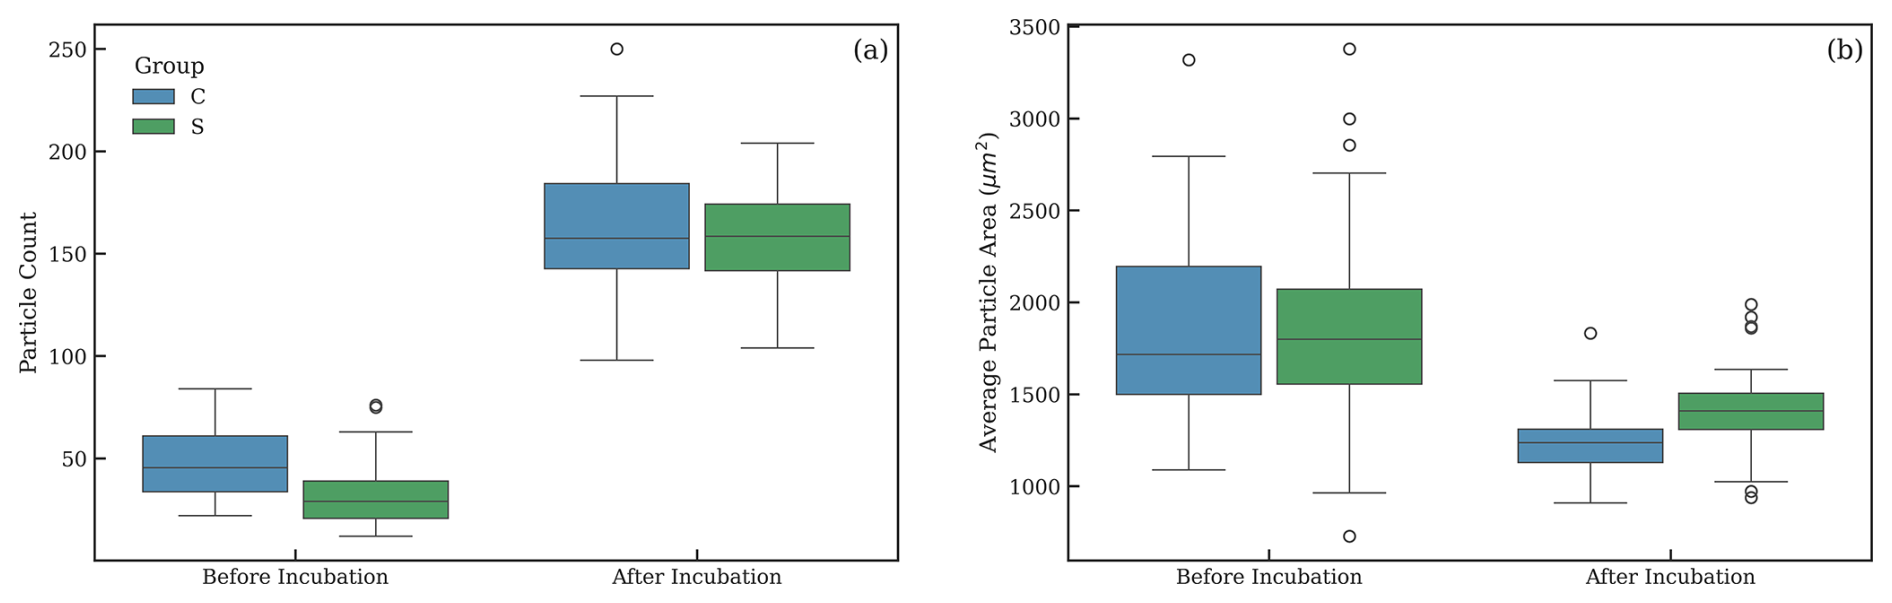
Figure 6Changes in (a) tracer particle count and (b) average tracer particle size after 41 d incubation in seawater (32 °C, pHT 7.9) for both the control and treated samples.
4.1 Sediment measurements
Our experiment showed that alkalinity increased over time in the incubators containing olivine. Conversely, X-ray diffraction measurements also showed a decrease in the amount of olivine present in the sediment following incubation. We detected changes of approximately 1.5 % in the samples' olivine content after being incubated in seawater for 41 d at 32 °C. Given that the samples were all the same mass and homogenized prior to the measurement this relative percentage difference is representative of absolute mass loss between measurements. In operation, dissolution is more likely to be measured after periods of months or years, rather than weeks. Under similar temperature and pH conditions as in our experiment (32 °C, pHT 7.9) we would expect dissolution on the order of 50 % after eight months based on a shrinking core model using the applicable dissolution rate and surface roughness factor from Rimstidt et al. (2012) with the temperature and pH conditions of the experiment (Montserrat et al., 2017).
In this experiment, we effectively measured the concentration of fluorescent tracer particles in a sample. The process of creating microscopy slides for tracer enumeration under UVA light is reproduceable and sufficiently efficient for further studies. Analysis of the pictures of the illuminated particles in ImageJ likewise is repeatable and suitably efficient for use in ongoing work. From this we conclude that using UV fluorescence as a traceable characteristic in tracer particles is effective and could be suitable for operational deployment of this dissolution quantification approach.
However, calculation of RT and its evolution during the experiment, did not lead to the expected outcome due to the unexpected behavior of the tracer particles. Theoretically, there should have been no change to the number or size of tracer particles per sample or the average tracer particle size during the experiment since neither the fluorescent coating nor the silicon carbide substrate is soluble in seawater. However, this predicted behavior was not observed. In both the control and olivine groups tracer counts increased substantially after being incubated in seawater. Correspondingly, tracer particle areas measured in the pictures shrunk considerably. More precisely, the upper size limit declined after incubation, while the lower size limit stayed roughly the same (compare the before incubation and after incubation tracer particle statistics in Fig. 6).
We posit that these trends can be explained if one assumes that the particles clumped together to form larger aggregate particles prior to their addition to the sediment mixture. The binding agent in the coating that contains the fluorescent pigment and magnetic inclusions is temperature sensitive and will soften at high temperatures. The tracer particles were manufactured in Scotland before being shipped to Australia where they spent some amount of time in storage in Brisbane in an area without climate control. This occurred between October–December, austral spring and summer, and it is almost certain that the tins of tracer were exposed to high temperatures in excess of 40 °C. This would have softened the coatings and could have led to individual particles fusing together to form clumps or aggregations after the tracer cooled. The tracer was taken directly from the shipment tins when preparing the sediment mixtures for the experiment. No sieving or other deagglomeration processes were performed. The unincubated samples were taken for analysis directly from this prepared sediment mixture. The portions of this mixture that were added to the incubators were subjected to handling and agitation from being added to the incubators, vigorous stirring and shaking during the sediment recovery process, and additional stirring to break up a crust formed during the drying process. This mechanical agitation likely would have broken up some of the clumped tracer particles before final samples were taken for analysis. This exposure to differing levels of mechanical agitation provides an explanation consistent with the observed particle count and size trends pre and post incubation in seawater.
Not considering the potential for tracer clumping and aggregation was clearly a process failure in the handling and use of the tracer particles. While this could potentially be remedied via material handling adjustments, the fact that the coating over insoluble substrate construction of these commercially available tracers does not allow this tracer to shrink along with the mineral of interest means that other tracer compositions should be explored in further investigations. That being said, scripted particle enumeration using fluorescence under UV light was effective in this experiment, and can serve as a building block for future work. Additionally, fluorescent tracers have been used successfully in many field deployments outside the context of MRV for coastal enhanced weathering (Kinsman and Xu, 2012; Pearson et al., 2021; Smith et al., 2003; Vila-Concejo et al., 2004).
4.2 Alkalinity addition prediction
Due to the issues with the tracer discussed above we were unable to demonstrate the process of using the measured tracer concentration to calculate the expected amount of alkalinity addition to the water. However, due to the closed volume of this experiment, we know that the expected amount of olivine in the sediment is equal to that of the initial samples since no dispersion of the sediment occurred. This enables us to calculate the expected amount of alkalinity produced based on the XRD measurements of dissolution and compare that to the increased amount of alkalinity that was measured in the dissolved phase (Fig. 2a).
The initial sediment samples were composed of 26.1±0.6 % olivine and the final samples (after the dissolution experiment in seawater) contained 24.5±0.6 %. Correspondingly the changes in the weight percentages of olivine in the sediment of each incubator were 1.6±1.2 %. Using the measured Mg:Fe ratio of the serpentinite rock as a proxy for the Mg content of the mineral olivine suggests that the olivine in the sample rock is composed of approximately 81 % forsterite. While there are other Mg bearing silicate minerals in the sample other than olivine, the vast majority are serpentinite group minerals, formed through the hydration of olivine, a process which should not alter the Mg:Fe ratio of the rock as a whole. This change in weight percentage of olivine, combined with the forsterite percentage of the olivine, corresponds to 634.9±474 µmol of forsterite dissolved. Using the theoretical alkalinity generation factor of four for forsterite (Mg2SiO4) dissolution (Köhler et al., 2010) and normalizing by the average amount of water in the incubators over the course of the experiment, we get of expected alkalinity addition by the olivine over the course of the experiment. This value of alkalinity increase, predicted by the sediment measurements, can be compared to the measured alkalinity enhancement of in the dissolved phase.
Despite being within the error range of the expected alkalinity increase, assuming an alkalinity generation factor of four, the measured amounts of alkalinity addition were much lower (53–192 µmol kg−1) than would be expected in each incubator. The XRD measurement error is likely responsible for some of this deviation. The relatively large error band on the XRD measurements is likely a result of the amount of dissolution being only two or three times greater in magnitude than size of the ± error of each individual measurement. This effect becomes less significant at the larger dissolution percentages that would be measured in a real-world deployment. In this experiment the average ± error of the predicted alkalinity addition is roughly 80 % of the value of the prediction, while in a scenario where there is a 50 % change in the concentration of olivine in the sample the ± error drops to only about 2.5 % of the value of the prediction.
Another potentially significant source of error here is the potential that an ultrafine fraction of the sediment was removed during sediment washing following the incubation period. This would be another mechanism by which forsterite was removed from the sediment, in addition to dissolution, and be consistent with the less than stoichiometric alkalinity increase observed given the decrease in the amount of forsterite measured by XRD. In retrospect, this seems likely to have happened to some extent, and experimental methods should be improved in further investigations. Additionally, there are several other sources of error that could have contributed. For example, the accuracy of the measure of our olivine's forsterite percentage is potentially significant. The SEM analysis was performed on grains of the serpentinite with no effort to isolate olivine. For the above analysis we made the assumption that the bulk Mg:Fe ratio is representative of the olivine's composition. Given that the mineral phases bearing Mg and Fe are all either olivine or hydrates of olivine, and that the hydration process does not alter the Mg:Fe molar ratio, this assumption is likely justified. The resulting forsterite molar content estimate of 81 % does fall within the published range of values for the Zhouan intrusion (this serpentinite's likely source) of between 80 %–85 % forsterite (Wang et al., 2013). However, we cannot be sure that Mg and Fe element concentrations of the various serpentinite phases were unaffected by the metamorphosis that this serpentinite has experienced.
Another source of uncertainty is the potential for the secondary precipitation of minerals, such as sepiolite or aragonite, to remove alkalinity from the seawater leading to less net alkalinity generation than would be expected for a given amount of olivine dissolution as was seen here. The Ωaragonite remained below 3.6 during the incubation indicating that calcium carbonate precipitation was unlikely to have occurred in the overlying water. Similarly, the calculated saturation index of sepiolite remained below −5 for the duration of the incubation indicating that it is unlikely to have occurred. However, since our incubators had very little water motion during the experiment, the saturation state of the pore water may have been higher than that of the bulk water. Additionally, particles can catalyze CaCO3 precipitation at even relatively mild levels of oversaturation (Moras et al., 2022; Mucci et al., 1989; Wurgaft et al., 2021), and other explorations on the subject have observed precipitation near these levels of aragonite over-saturation (Fuhr et al., 2022). However, since exploring secondary precipitation was not the primary goal of this experiment, the evidence remains under-explored with regards to potential precipitation and is a topic for more dedicated investigation.
4.3 Implications for real world applicability and future work
The results of this experiment are promising for this method's potential as an operational process for quantifying the alkalinity addition resulting from a mineral's dissolution in the ocean. Because this method relies on measurements of mineral dissolution, reliance on predicting the mineral's dissolution rate is eliminated, along with that prediction's uncertainty. Preliminary indications are that this method could possess sufficient resolution to meaningfully measure mineral dissolution, and corresponding alkalinity addition, in deployment scenarios.
However, there is a strong need for more testing and development. Most significantly, work is needed to understand how long the hydrodynamic properties of tracer particles can be matched to those of the mineral particles. As the mineral particles dissolve, their effective diameter decreases, changing their hydrodynamic properties while a tracer constructed with an insoluble substrate would not experience any change in diameter or hydrodynamic properties. As a result, it cannot be determined whether any measured reduction in mineral content of the sediment is due to dissolution or due to differential transport. The most generalized approach is one in which tracer particles decrease in size identically to the mineral particles while retaining their traceable characteristic (as depicted in Fig. 1). This would allow all measured reduction in mineral mass to be attributed to mineral dissolution. It is likely possible to manufacture such a tracer and is an area ripe for engineering research and development that future work will explore.
A critical unknown that can compromise the described approach is secondary mineral precipitation. Both calcium carbonate, in the form of aragonite, and clay, in the form of sepiolite, have been suggested as potential precipitates that would scavenge alkalinity from the system (Fuhr et al., 2022; Griffioen, 2017), leading to less net alkalinity generation than would be expected for a given amount of olivine dissolution absent secondary precipitation. The precipitation reactions for aragonite and sepiolite are below:
Aragonite:
Sepiolite:
Assuming that all of the alkalinity produced by dissolving one mole of forsterite precipitates out as aragonite, two moles of aragonite are produced and no alkalinity has been added to the system. However, there are still two moles of CO2 removed from the system per mole of forsterite. While this is less efficient than if the dissolved CO2 remains as alkalinity, it is still net CDR. One mole of clay precipitation in the form of sepiolite removes four moles of alkalinity from the system.
The approach described here can detect how much alkalinity is formed directly through dissolution but is insensitive to the loss of alkalinity through secondary precipitation that can occur thereafter. As such, MRV built on the approach described here must: (1) be able to show limited (or no) alkalinity loss, for example through rapid dilution of the generated alkalinity; (2) develop and employ complementary methodology that can trace alkalinity loss.
This study has outlined a new approach to the quantification of the amount of alkalinity released by the dissolution of uncontained mineral sediment on the ocean floor, a key step in the MRV process for CEW, an “open system” style deployment of mineral based OAE. This tracer-based approach has the potential to complement existing investigations into both water measurement and model-based MRV methods. We described the theoretical framework for this method and have investigated the necessary features and steps in a microcosm experiment.
Olivine dissolution in incubators increased alkalinity in seawater when compared to the control incubators. Sediment analysis was able to quantify the concentration of tracer particles in a sediment sample as well as that sample's olivine content. While fluorescence was a suitable traceable characteristic in this experiment, our work outlined several deficiencies with the specific tracer composition used. The measured change in the olivine content of the sediment after dissolution was able to predict the actual amount of alkalinity added to the overlying water within the error bounds of the process. However, the error bounds on the process were very large and require improvement by exploring the sources for uncertainty identified here. While this study used forsterite (Mg) olivine as an alkalinity source, this method is mineral agnostic and is applicable to any crystalline alkalinity source with limited natural presence in marine sediments such as magnesium hydroxide, basalt, lime, some carbonate minerals, or steel slags. Additionally, this tracer-based technique could potentially be used in on-land Enhanced Rock Weathering methods for quantifying feedstock dissolution.
Going forward, there is significant work to be done to develop this method and evaluate its potential usefulness in an operational CEW scenario. Development is needed in the tracer's design and manufacture, and investigation into quantifying the similarity of the tracer's transport characteristics to those of the mineral particles will be required. There is work to be done refining the process for taking the necessary sediment measurements, and evaluating their effectiveness when used in natural marine sediments. A complementary method for quantifying or bounding alkalinity loss due to secondary precipitation must be developed. Ultimately, a field trial will be necessary to test the effectiveness of this method in a real-world scenario. However, despite its limitations, this study will hopefully serve as a useful illustration of a new approach to measuring the alkalinity addition resulting from Coastal Enhanced Weathering deployments and serve as a starting point for future inquiries and exploration.
All data related to the analysis of the water and sediment samples is available at https://doi.org/10.5281/zenodo.18665602 (Milde and Bach, 2026).
AM conceptualized the experiment and developed the methodology with LTB. AM conducted the experiments, analyzed the data, and drafted the initial manuscript. LTB provided supervision and significant revisions to the manuscript.
AM discloses that Scaled Carbon, PBC intends to provide monitoring services for CEW in the future.
Publisher's note: Copernicus Publications remains neutral with regard to jurisdictional claims made in the text, published maps, institutional affiliations, or any other geographical representation in this paper. The authors bear the ultimate responsibility for providing appropriate place names. Views expressed in the text are those of the authors and do not necessarily reflect the views of the publisher.
We thank Norfaizny Hasweera for supporting sampling and analysis of carbonate chemistry and establishing experimental infrastructure. We thank Aaron Ferderer for his help with sample handling and titration. We also thank Elena Lounejeva and the Centre for Ore Deposit and Earth Sciences (CODES) at the University of Tasmania for the XRD analysis.
AM acknowledges funding from Brad Burnham and LTB acknowledges funding from the Australian Research Council through Future Fellowship (FT200100846) and the Carbon to Sea Initiative.
This paper was edited by Mathilde Hagens and reviewed by two anonymous referees.
Beerling, D. J., Kantzas, E. P., Lomas, M. R., Wade, P., Eufrasio, R. M., Renforth, P., Sarkar, B., Andrews, M. G., James, R. H., Pearce, C. R., Mercure, J.-F., Pollitt, H., Holden, P. B., Edwards, N. R., Khanna, M., Koh, L., Quegan, S., Pidgeon, N. F., Janssens, I. A., Hansen, J., and Banwart, S. A.: Potential for large-scale CO2 removal via enhanced rock weathering with croplands, Nature, 583, 242–248, https://doi.org/10.1038/s41586-020-2448-9, 2020.
Dhanjal, S. K., Young, L., and Storer, P.: Automatic control of cement quality using on-line XRD, in: IEEE Cement Industry Technical Conference, 2006, Conference Record, Phoenix, AZ, USA, https://doi.org/10.1109/citcon.2006.1635726, 289–305, 2006.
Dickson, A. G., Sabine, C. L., Christian, J. R., Bargeron, C. P., and North Pacific Marine Science Organization (Eds.): Guide to best practices for ocean CO2 measurements, North Pacific Marine Science Organization, Sidney, BC, 191 pp., https://doi.org/10.25607/OBP-1342, 2007.
Eisaman, M. D., Geilert, S., Renforth, P., Bastianini, L., Campbell, J., Dale, A. W., Foteinis, S., Grasse, P., Hawrot, O., Löscher, C. R., Rau, G. H., and Rønning, J.: Assessing the technical aspects of ocean-alkalinity-enhancement approaches, State Planet, 2-oae2023, 1–29, https://doi.org/10.5194/sp-2-oae2023-3-2023, 2023.
Ferderer, A., Chase, Z., Kennedy, F., Schulz, K. G., and Bach, L. T.: Assessing the influence of ocean alkalinity enhancement on a coastal phytoplankton community, Biogeosciences, 19, 5375–5399, https://doi.org/10.5194/bg-19-5375-2022, 2022.
Foteinis, S., Campbell, J. S., and Renforth, P.: Life cycle assessment of coastal enhanced weathering for carbon dioxide removal from air, Environ. Sci. Technol., 57, 6169–6178, https://doi.org/10.1021/acs.est.2c08633, 2023.
Fuhr, M., Geilert, S., Schmidt, M., Liebetrau, V., Vogt, C., Ledwig, B., and Wallmann, K.: Kinetics of olivine weathering in seawater: an experimental study, Frontiers in Climate, 4, 831587, https://doi.org/10.3389/fclim.2022.831587.
Geerts, L. J. J., Hylén, A., and Meysman, F. J. R.: Review and syntheses: Ocean alkalinity enhancement and carbon dioxide removal through marine enhanced rock weathering using olivine, Biogeosciences, 22, 355–384, https://doi.org/10.5194/bg-22-355-2025, 2025.
Griffioen, J.: Enhanced weathering of olivine in seawater: the efficiency as revealed by thermodynamic scenario analysis, Sci. Total Environ., 575, 536–544, https://doi.org/10.1016/j.scitotenv.2016.09.008, 2017.
Hansen, H. P. and Koroleff, F.: Determination of nutrients, in: Methods of Seawater Analysis, John Wiley and Sons, Ltd, https://doi.org/10.1002/9783527613984.ch10, 159–228, 1999.
Hartmann, J., West, A. J., Renforth, P., Köhler, P., De La Rocha, C. L., Wolf-Gladrow, D. A., Dürr, H. H., and Scheffran, J.: Enhanced chemical weathering as a geoengineering strategy to reduce atmospheric carbon dioxide, supply nutrients, and mitigate ocean acidification, Rev. Geophys., 51, 113–149, https://doi.org/10.1002/rog.20004, 2013.
He, J. and Tyka, M. D.: Limits and CO2 equilibration of near-coast alkalinity enhancement, Biogeosciences, 20, 27–43, https://doi.org/10.5194/bg-20-27-2023, 2023.
Ho, D. T., Bopp, L., Palter, J. B., Long, M. C., Boyd, P. W., Neukermans, G., and Bach, L. T.: Monitoring, reporting, and verification for ocean alkalinity enhancement, State Planet, 2-oae2023, 1–12, https://doi.org/10.5194/sp-2-oae2023-12-2023, 2023.
Humphreys, M. P., Lewis, E. R., Sharp, J. D., and Pierrot, D.: PyCO2SYS v1.8: marine carbonate system calculations in Python, Geosci. Model Dev., 15, 15–43, https://doi.org/10.5194/gmd-15-15-2022, 2022.
Kinsman, N. and Xu, J. P.: The fluorescent tracer experiment on Holiday Beach near Mugu Canyon, Southern California, Open-File Report, U.S. Geological Survey, https://doi.org/10.3133/ofr20121131, 2012.
Köhler, P., Hartmann, J., and Wolf-Gladrow, D. A.: Geoengineering potential of artificially enhanced silicate weathering of olivine, P. Natl. Acad. Sci. USA, 107, 20228–20233, https://doi.org/10.1073/pnas.1000545107, 2010.
Middelburg, J. J., Soetaert, K., and Hagens, M.: Ocean alkalinity, buffering and biogeochemical processes, Rev. Geophys., 58, e2019RG000681, https://doi.org/10.1029/2019RG000681, 2020.
Milde, A. and Bach, L.: Data for “Technical note: Verification of coastal enhanced weathering by tracking the dissolution of alkaline minerals: Theory and laboratory tests with olivine.”, Zenodo [data set], https://doi.org/10.5281/zenodo.18665602, 2026.
Montserrat, F., Renforth, P., Hartmann, J., Leermakers, M., Knops, P., and Meysman, F. J. R.: Olivine dissolution in seawater: implications for CO2 sequestration through enhanced weathering in coastal environments, Environ. Sci. Technol., 51, 3960–3972, https://doi.org/10.1021/acs.est.6b05942, 2017.
Moosdorf, N., Renforth, P., and Hartmann, J.: Carbon dioxide efficiency of terrestrial enhanced weathering, Environ. Sci. Technol., 48, 4809–4816, https://doi.org/10.1021/es4052022, 2014.
Moras, C. A., Bach, L. T., Cyronak, T., Joannes-Boyau, R., and Schulz, K. G.: Ocean alkalinity enhancement – avoiding runaway CaCO3 precipitation during quick and hydrated lime dissolution, Biogeosciences, 19, 3537–3557, https://doi.org/10.5194/bg-19-3537-2022, 2022.
Mu, L., Palter, J. B., and Wang, H.: Considerations for hypothetical carbon dioxide removal via alkalinity addition in the Amazon River watershed, Biogeosciences, 20, 1963–1977, https://doi.org/10.5194/bg-20-1963-2023, 2023.
Mucci, A., Canuel, R., and Zhong, S.: The solubility of calcite and aragonite in sulfate-free seawater and the seeded growth kinetics and composition of the precipitates at 25 °C, Chem. Geol., 74, 309–320, https://doi.org/10.1016/0009-2541(89)90040-5, 1989.
NASEM, Ocean Studies Board, Committee on A Research Strategy for Ocean-based Carbon Dioxide Removal and Sequestration, and Division on Earth and Life Studies: A Research Strategy for Ocean-based Carbon Dioxide Removal and Sequestration, National Academies Press, Washington, D.C., https://doi.org/10.17226/26278, 2022.
Oschlies, A., Bach, L. T., Rickaby, R. E. M., Satterfield, T., Webb, R., and Gattuso, J.-P.: Climate targets, carbon dioxide removal, and the potential role of ocean alkalinity enhancement, State Planet, 2-oae2023, 1–9, https://doi.org/10.5194/sp-2-oae2023-1-2023, 2023.
Parkhurst, D. L. and Appelo, C. A. J: User's guide to PHREEQC (Version 2): A computer program for speciation, batch-reaction, onedimensional transport, and inverse geochemical calculations, U.S. Geological Survey, https://doi.org/10.3133/wri994259, 1999.
Pearson, S. G., Van Prooijen, B. C., Poleykett, J., Wright, M., Black, K., and Wang, Z. B.: vilTracking fluorescent and ferrimagnetic sediment tracers on an energetic ebb-tidal delta to monitor grain size-selective dispersal, Ocean Coast. Manage., 212, 105835, https://doi.org/10.1016/j.ocecoaman.2021.105835, 2021.
Renforth, P.: The negative emission potential of alkaline materials, Nat. Commun., 10, 1401, https://doi.org/10.1038/s41467-019-09475-5, 2019.
Renforth, P. and Henderson, G.: Assessing ocean alkalinity for carbon sequestration, Rev. Geophys., 55, 636–674, https://doi.org/10.1002/2016RG000533, 2017.
Rigopoulos, I., Harrison, A. L., Delimitis, A., Ioannou, I., Efstathiou, A. M., Kyratsi, T., and Oelkers, E. H.: Carbon sequestration via enhanced weathering of peridotites and basalts in seawater, Appl. Geochem., 91, 197–207, https://doi.org/10.1016/j.apgeochem.2017.11.001, 2018.
Rimstidt, J. D., Brantley, S. L., and Olsen, A. A.: Systematic review of forsterite dissolution rate data, Geochim. Cosmochim. Ac., 99, 159–178, https://doi.org/10.1016/j.gca.2012.09.019, 2012.
Rogelj, J., Popp, A., Calvin, K. V., Luderer, G., Emmerling, J., Gernaat, D., Fujimori, S., Strefler, J., Hasegawa, T., Marangoni, G., Krey, V., Kriegler, E., Riahi, K., Van Vuuren, D. P., Doelman, J., Drouet, L., Edmonds, J., Fricko, O., Harmsen, M., Havlík, P., Humpenöder, F., Stehfest, E., and Tavoni, M.: Scenarios towards limiting global mean temperature increase below 1.5 °C, Nat. Clim. Change, 8, 325–332, https://doi.org/10.1038/s41558-018-0091-3, 2018.
Sarrazin, P., Blake, D., Feldman, S., Chipera, S., Vaniman, D., and Bish, D.: Field deployment of a portable X-ray diffraction/X-ray flourescence instrument on Mars analog terrain, Powder Diffr., 20, 128–133, https://doi.org/10.1154/1.1913719, 2005.
Schindelin, J., Arganda-Carreras, I., Frise, E., Kaynig, V., Longair, M., Pietzsch, T., Preibisch, S., Rueden, C., Saalfeld, S., Schmid, B., Tinevez, J.-Y., White, D. J., Hartenstein, V., Eliceiri, K., Tomancak, P., and Cardona, A.: Fiji: an open-source platform for biological-image analysis, Nat. Methods, 9, 676–682, https://doi.org/10.1038/nmeth.2019, 2012.
Schuiling, R. D. and Krijgsman, P.: Enhanced weathering: an effective and cheap tool to sequester CO2, Climatic Change, 74, 349–354, https://doi.org/10.1007/s10584-005-3485-y, 2006.
Shukla, P. R., Skea, J., and Slade, R.: Working Group III Contribution to the Sixth Assessment Report of the Intergovernmental Panel on Climate Change, Cambridge University Press, https://doi.org/10.1017/9781009157926, 2022.
Smith, S. J., Marsh, J., and Puckette, T: Analysis of Fluorescent Sediment Tracer for Evaluating Nearshore Placement of Dredged Material, in: Proceedings of the 18th World Dredging Congress (WODCON XVIII), Lake Buena Vista, Florida, USA, 27 May–1 June 2007, Western Dredging Association, 1345–1358, ISBN 978-1-63266-226-2, 2003.
Strefler, J., Amann, T., Bauer, N., Kriegler, E., and Hartmann, J.: Potential and costs of carbon dioxide removal by enhanced weathering of rocks, Environ. Res. Lett., 13, 034010, https://doi.org/10.1088/1748-9326/aaa9c4, 2018.
Vesta, PBC: VESTA ANNUAL MONITORING REPORT: Coastal Carbon Capture at North Sea Beach, https://drive.google.com/file/d/16LtjGbLMdHXQwGgIVOwE_9TrzRFPAJkb/view (last access: 15 November 2026), 2024.
van Vuuren, D. P., Stehfest, E., Gernaat, D. E. H. J., van den Berg, M., Bijl, D. L., de Boer, H. S., Daioglou, V., Doelman, J. C., Edelenbosch, O. Y., Harmsen, M., Hof, A. F., and van Sluisveld, M. A. E.: Alternative pathways to the 1.5 °C target reduce the need for negative emission technologies, Nat. Clim. Change, 8, 391–397, https://doi.org/10.1038/s41558-018-0119-8, 2018.
Vila-Concejo, A., Ferreira, Ò., Ciavola, P., Matias, A., and Dias, J. M. A.: Tracer studies on the updrift margin of a complex inlet system, Mar. Geol., 208, 43–72, https://doi.org/10.1016/j.margeo.2004.04.020, 2004.
Wang, H., Pilcher, D. J., Kearney, K. A., Cross, J. N., Shugart, O. M., Eisaman, M. D., and Carter, B. R.: Simulated impact of ocean alkalinity enhancement on atmospheric CO2 removal in the Bering Sea, Earths Future, 11, e2022EF002816, https://doi.org/10.1029/2022EF002816, 2023.
Wang, M., Wang, C. Y., and Sun, Y.: Mantle source, magma differentiation and sulfide saturation of the ∼637 Ma Zhouan mafic–ultramafic intrusion in the northern margin of the Yangtze Block, Central China, Precambrian Res., 228, 206–222, https://doi.org/10.1016/j.precamres.2013.01.015, 2013.
Wilson, M. J.: Weathering of the primary rock-forming minerals: processes, products and rates, Clay Miner., 39, 233–266, https://doi.org/10.1180/0009855043930133, 2004.
Wurgaft, E., Wang, Z. A., Churchill, J. H., Dellapenna, T., Song, S., Du, J., Ringham, M. C., Rivlin, T., and Lazar, B.: Particle triggered reactions as an important mechanism of alkalinity and inorganic carbon removal in river plumes, Geophys. Res. Lett., 48, e2021GL093178, https://doi.org/10.1029/2021GL093178, 2021.
Zeebe, R. E. and Wolf-Gladrow, D. A.: CO2 in seawater: equilibrium, kinetics, isotopes, Elsevier, Amsterdam , New York, 346 pp., https://doi.org/10.1016/S0422-9894(01)X8001-X, 2001.