the Creative Commons Attribution 4.0 License.
the Creative Commons Attribution 4.0 License.
 | 23 Feb 2018
Uncovering biological soil crusts: carbon content and structure of intact Arctic, Antarctic and alpine biological soil crusts
Laura Briegel-Williams
Anika Simon
Anne Thyssen
Burkhard Büdel
Arctic, Antarctic and alpine biological soil crusts (BSCs) are formed by adhesion of soil particles to exopolysaccharides (EPSs) excreted by cyanobacterial and green algal communities, the pioneers and main primary producers in these habitats. These BSCs provide and influence many ecosystem services such as soil erodibility, soil formation and nitrogen (N) and carbon (C) cycles. In cold environments degradation rates are low and BSCs continuously increase soil organic C; therefore, these soils are considered to be CO2 sinks. This work provides a novel, non-destructive and highly comparable method to investigate intact BSCs with a focus on cyanobacteria and green algae and their contribution to soil organic C. A new terminology arose, based on confocal laser scanning microscopy (CLSM) 2-D biomaps, dividing BSCs into a photosynthetic active layer (PAL) made of active photoautotrophic organisms and a photosynthetic inactive layer (PIL) harbouring remnants of cyanobacteria and green algae glued together by their remaining EPSs. By the application of CLSM image analysis (CLSM–IA) to 3-D biomaps, C coming from photosynthetic active organisms could be visualized as depth profiles with C peaks at 0.5 to 2 mm depth. Additionally, the CO2 sink character of these cold soil habitats dominated by BSCs could be highlighted, demonstrating that the first cubic centimetre of soil consists of between 7 and 17 % total organic carbon, identified by loss on ignition.
- Article
(2259 KB) - Full-text XML
- BibTeX
- EndNote


Antarctica, the Arctic and the Alps are dominated by a range of extreme environmental conditions which impose severe pressure on biological life, particularly for vegetation: they begin where trees no longer dominate the vegetation, usually have temperatures below 10 ∘C in the warmest month (Körner, 1998) and are characterized by snowfall, at least in winter. Permafrost, long periods of darkness, continuous irradiance, short growing seasons, stable snow cover and rocky sites with low nutrient supply represent other common challenges of these ecosystems (Bayard et al., 2005; Forman and Miller, 1984; Thomas et al., 2008a). Thus, vascular plant cover is sparse and decomposition rates and biodiversity are generally low. For example, only the grass Deschampsia antarctica and the Antarctic pearlwort Colobanthus quitensis as autochthonous flowering plants occur in Antarctica, distributed solely in a few suitable areas (Thomas et al., 2008b). Conglomerations of soil particles, cyanobacteria, bacteria, microalgae, microfungi, lichens and bryophytes create a skin known as biological soil crust (BSC) that dominate these ecosystems (Belnap et al., 2001; Williams et al., 2017). Cyanobacteria especially are important players within these intimate associations. They bind the subsurface and surface, because their secreted extracellular polysaccharides (EPSs) form a mechanical structure, surrounding the bacterial cells that together with the soil particles form a visible organic matrix on top and within the first few millimetres of soil (Mazor et al., 1996; Breen and Lévesque, 2008; Garcia-Pichel and Belnap, 1996; Garcia-Pichel et al., 2003). Additionally, the excretion of EPS stabilizes the soil against erosion (Belnap, 2003), and their ability to fix nitrogen (N) increases the N content of soils (Fay et al., 1968).
These frequently diverse cyanobacterial communities within a BSC can be categorized into three major groups based on functional traits (Weber et al., 2016) found in hot and cold deserts worldwide (Lacap-Bulger et al., 2017; Jungblut and Warwick, 2017; Belnap and Lange, 2001). (1) Filamentous cyanobacteria, such as Microcoleus or Leptolyngbya, stabilize soils due to the presence of extracellular matrix made of EPS. These cyanobacteria cause crust formation and are also the most abundant cyanobacteria species in BSCs (Johansen, 1993). Building filaments is an essential feature that enables cyanobacteria to colonize physically unstable environments, e.g. cryoturbated soils, and they act as successful pioneers in the bio-stabilization process against erosion (Garcia-Pichel and Wojciechowski, 2009). Remaining EPS retains these features over many years after the trichomes have either moved out of their sheath envelopes or died (Potts, 2001). (2) Cyanobacteria such as Chroococcidiopsis and Nostoc prefer to live in the BSC environment, enhancing the ecological role of BSCs, e.g. through their contribution to C and N cycling. (3) Some cyanobacteria like Phormidium or Chroococcus are known to occur only stochastically in BSCs and may originate from other habitats, such as an aquatic environment or through lichen symbiosis.
Regarding their extremophile character in areas limited by temperature and/or water availability, cyanobacteria and green algae play key roles as ecosystem engineers if other photoautotrophic clades are absent (Belnap, 2003). Therefore, a large proportion of important ecosystem services, such as erodibility (Belnap and Gillette, 1998; Bowker et al., 2008), soil formation (Mummey and Rillig, 2006), soil moisture (Belnap, 2006) and C and N cycling (Shively et al., 2001; Tiedje, 1994; Kowalchuk and Stephen, 2001), are influenced by cyanobacterial communities. Providing an initial structural foundation, they physically modify, maintain and create habitats for other organisms and accumulate biomass. Hence, they may form the nutritional basis for higher trophic levels, such as reindeer in the Arctic that feed on lichens, which are a part of the BSC communities (Cooper and Wookey, 2001; Elster et al., 1999).
Currently, these high-altitude and high-latitude ecosystems are experiencing the effects of human-induced environmental changes that are expected by many prospective predictions to be large in magnitude and have great impacts (Bálint et al., 2011). Biological soil crusts have recently been shown to be vulnerable to the potential impact of climate change as well as to shifting meteorological conditions since their activity and structure are strongly affected (Escolar et al., 2012; Kuske et al., 2012; Wertin et al., 2012; Lane et al., 2013; Maestre et al., 2013). Therefore, it is likely that an invasion of foreign species will alter the BSC composition during warming events in the Arctic and the Antarctic Peninsula (Pushkareva et al., 2016). In terms of climate change their microbiota is a focal point of scientific interest because in contrast to their local habitat function, they also provide atmospheric overall services by fixing and storing substantial amounts of C (Evans and Lange, 2001), whereby they can increase the total surface soil C by up to 300 % (reviewed in Belnap et al., 2003). Soil is the largest pool of C in general: it stores 3 times the amount of C accumulated in aboveground biomass and double the amount of carbon fluctuating in the atmosphere as CO2 (Schlesinger and Andrews, 2000). Biological soil crusts are considered a major source of soil organic C in for example, semiarid ecosystems (Evans and Lange, 2001; Housman et al., 2006), accumulating C as carbohydrates in EPS and as energy reserves for cells through their photosynthetic mechanisms (Bertocchi et al., 1990).
Most parts of the Earth are now 10 000 to 18 000 years removed from the last major glacial episode (Schlesinger, 1990), and lands once covered by continental glaciers are now accumulating soil organic C at a rate possibly between 0.075 and 0.18 Gt of C year−1 (Harden et al., 1992). Hence, these soils may be sinks for CO2 within the atmospheric CO2 balance (Amundson, 2001). The large carbon pools of the biosphere can lead to accelerated emissions of greenhouse gases into the atmosphere if destabilized through changes in climate and land use (Gruber et al., 2004). Taking into consideration that BSCs are valuable ecological indicators for abiotic factors, ecological health and climate change (Belnap et al., 2001; Pushkareva et al., 2016), these communities will certainly help improve predictions regarding future climate change (Pushkareva et al., 2016). Thus, it is necessary to improve our knowledge regarding complex BSC interactions. Fluorescence microscopy has been applied repeatedly to cryptogamic organisms since photoautotrophic organisms naturally emit autofluorescence (Schallenberg et al., 1989; Kuwae and Hosokawa, 1999; Solé et al., 2009; Raanan et al., 2016). The confocal laser scanning microscopy (CLSM) technique applied in this work gives novel insights into the complex architecture of BSCs, avoiding the need to either manipulate or stain the samples. Moreover, it allows for accurate and non-destructive optical investigation of BSC cross sections that generate high-resolution images, none of which are out of focus. By applying the CLSM image analysis (CLSM–IA) procedure developed by Solé et al., (2009), this highly comparable approach allows, for the first time, the calculation of C values and partitioning of patterns of green algae and cyanobacteria within intact BSCs. Additionally, these results were set in relation to organic C values obtained by loss on ignition to highlight the CO2 sink character of the first cubic centimetre of these cold soils dominated by BSCs.
2.1 Study sites
Hochtor (47∘50′ N and 12∘51′ E), near the Großglockner High Alpine Road, Hohe Tauern National Park in Austria, represents the alpine site. The elevation ranges from 2500 to 2600 m a.s.l. The climate is alpine with a mean air temperature ranging from −10 to −8 ∘C in January to 2 to 4 ∘C in July. On average, there are 250 frost days (minimum day temperature below 0 ∘C), 150–200 ice days (maximum day temperature below 0 ∘C) and 80 to 90 frost alternation days each year. Light conditions show strong fluctuations in photosynthetic active radiation (PAR), ranging from 600 to 1500 µmol m−2 s−1 (Büdel et al., 2014). Mean annual precipitation is between 1750 and 2000 mm, with more than 70 % falling as snow. Snow cover lasts for 270–300 days. Under these climatic conditions development of soil and the subsequent establishment of higher plants is extremely slow but high coverage of BSCs is recorded (Büdel et al., 2014). Cyanobacteria-dominated BSCs and lichens at Hochtor have been shown to undertake photosynthetic activity during 86 % of the snow-free growing season, from August to October (Raggio et al., 2017). They are assumed to be activated by fog, dew, and rainfall and after snowmelt (Colesie et al., 2016; Büdel et al., 2014).
The Arctic region is represented by two localities in Spitsbergen, Svalbard: Ny-Ålesund (78∘55′26.33 N, 11∘55′23.84 E) and Geopol (78∘56′58.38 N, 11∘28′35.64 E), with a polar tundra climate (Peel et al., 2007; Vogel et al., 2012). Ny-Ålesund is an international research platform on the Brøgger Peninsula at the coast of Kongsfjorden. Geopol lies roughly 8 km north-west of Ny-Ålesund and is a rocky site, dominated by skeletal soils and permafrost polygons. The temperature is low year-round with an annual average of −4.5 ∘C, the highest and lowest monthly temperatures range between 5.8 ∘C (July) and −12 ∘C (March; Maturilli et al., 2015). However, longer cold periods (−20 to −35 ∘C) are possible. High light conditions around 1200 µmol m−2 s−1 PAR are reached throughout the year (Barták et al., 2012). The annual precipitation averages 471 mm in both habitats with 70 % falling between October and May, when snow cover is usually complete (based on data from the Norwegian Meteorological Institute). The surface soil of the A horizon (0–5 cm) has a predominantly sandy texture. Svalbard has less than 10 % vegetation cover: current information includes ca. 170 vascular plants, ca. 350 bryophytes (Bengtsson, 1999) and ca. 600 lichen species (Elvebakk and Hertel, 1997), including intact BSC communities. The latter occupy more than 90 % of the soil surface in many areas (Williams et al., 2017). Regarding BSC activity in Spitsbergen the only available information is in respect to lichens, which have been shown to be solely active during ice- and snow-free periods, when they are activated by rainfall and snowmelt and therefore have low contributions to carbon fixation throughout the year (Uchida et al., 2006).
The Antarctic habitat lies around the Juan Carlos I base (62∘39′46.00 S, 60∘23′20.00 W), which is located in the South Bay of Livingston Island, Antarctica. Livingston Island belongs to the South Shetland archipelago in the Southern Ocean, which is situated near the Antarctic Peninsula. It ranges from 61 to 63∘S and from 54 to 63∘W. Mean annual temperatures are −2.8 ∘C with summer mean temperatures above freezing, and maximum mean temperature is 4.3 ∘C (Bañón et al., 2013). High light conditions around 1200 µmol m−2 s−1 PAR are reached throughout the year (Xiong and Day, 2001). Mean annual precipitation is 444.5 mm, with 75 % falling in summer and autumn (Bañón et al., 2013). The surface soil of the A horizon (0–5 cm) of the test sites was characterized as sandy loam as the dominating texture class. Numbers of lichen (110) and bryophyte (50) species were reported from the vicinity of Juan Carlos I base in Livingston by Sancho et al. (1999) in addition to a large proportion (43 %) of BSC coverage (Williams et al., 2017). Lichens assigned to BSC from Antarctica are known to show photosynthetic activity patterns after snowmelt and during fog, but only low rates of photosynthetic productivity and growth rates are expected throughout the year (Colesie et al., 2016).
2.2 Sample collection
Samples from Hochtor (Austria, alpine) were taken during the Soil Crust International Project (SCIN) in July 2012 (Büdel et al., 2014). Samples from Livingston Island (Antarctica) were collected during February 2015, and samples from Svalbard, Spitsbergen (Geopol and Ny-Ålesund, Arctic) were collected in August 2014 (Williams et al., 2017). Twenty samples were randomly selected from areas where BSC dominated (including bryophytes, lichens, cyanobacteria and green algae), a 9 cm Petri dish was pressed 1 cm into the BSC surface and excess soil was removed with the Petri dish lid. However, due to the heterogeneous nature of BSCs the thickness of the BSC itself varied from 1–2 mm (Geopol) up to 1 cm (Hochtor). Samples were left to air dry in the field immediately after collection for 2–3 days, until no condensation occurred. The dry and sealed crust samples were preserved at −20 ∘C until further processing. For this study the samples were slowly defrosted under air-tight conditions and used for investigation.
2.3 Sample preparation
Representative, intact, 1 cm thick parts of the BSC with soil substrate were completely embedded in a 0.9 % agarose pre-chilled solution in glass Petri dishes. Therefore, 12 h of cooling and hardening at room temperature in daylight was sufficient, and water available from the agarose matrix reactivated the BSC organisms. The block was cut with a razor blade to obtain cross sections of the intact, activated and fixed BSC.
2.4 CLSM and biomaps
Cross sections were examined with a CLSM (LSM 700, Carl Zeiss) equipped with diode lasers. Photomultiplier parameters were adjusted to achieve the maximum signal from the chlorophyll a and phycobiliproteins of present and active photoautotrophic organisms, while simultaneously keeping the noise signals generated by the soil particles and the agarose matrix to a minimum. Autofluorescence of green algae (chlorophyll a) and cyanobacteria (chlorophyll a and phycobiliproteins) were excited by beams of 555 and 639 nm wavelengths respectively. Using two laser beams made it possible to differentiate between green algae and cyanobacteria: superimposed images were generated by the outputs of two channels. Emitted wavelengths were collected using a band-pass filter 530/30 and cyanobacterial natural fluorescence with a 590 nm long pass filter. Z stacks were scanned through the BSCs with a 10× objective (n.a. 0.7 Achroplan, 8 bit colour depth). Stack series of the cross sections were taken along the depth of the sample, from the surface of the crust to where the pure soil without fluorescence signals started and the BSC structure ended. Each image frame per depth was chosen to contain a small overlap section to align the single images, showing the structure of the BSC. Each stack contained between 40 and 140 single images (512×512 pixel resolution), with three replicates per site and depth (6012 single images). Complete stacks were used to calculate C contents (3-D biomap); their maximum projection was converted into 2-D pictures to present the BSC structure and to obtain area patterns of green algae and cyanobacteria (2-D biomap) with the CLSM–IA procedure using ImageJ 1.47v software.
2.5 CLSM micrographs
Macroscopic cyanobacterial thalli and green algae mats were picked from the surface of BSC samples from Hochtor under a binocular stereoscope and transferred to a drop of water on an objective slide.
The CLSM micrographs were obtained as indicated above except a 63×objective was used and immersion oil and light microscopy was utilized in the same way.
2.6 CLSM–IA: partitioning estimation
Maximum projections of the 2-D biomaps were used to calculate the total area of the soil crust in square millimetres and to differentiate between areas (in percent) occupied by algae or cyanobacteria based on their specific autofluorescence traits with ImageJ 1.47v. Thallus structures and excreted EPS by cyanobacteria and green algae were also taken into consideration. This was possible because at least the periphery of the EPS reflected the fluorescence signal that was coming from the cells. Although they are considered BSC organisms, bryophytes and lichens were ignored because they grow right out of the soil in different developmental stages, shifting the relative thickness of the BSC.
2.7 CLSM–IA: carbon estimation
Image stacks of the 3-D biomaps were imported in their original image format (8 bit 512×512 TIFF image sequences) to ImageJ 1.47v and transformed into black and white binary images. Subsequently, a plug-in called Voxel Counter, created by Wayne Rasband and available online (http://rsb.info.nih.gov/ij/), was applied to ImageJ 1.47v software. This plug-in calculated the ratio of threshold voxels (the abbreviation for “volume element”) as cyanobacterial/green algae volumes to all voxels, which represented the total volume of sediment from each binary image in every single stack. The obtained biovolume percentage was multiplied by a conversion factor of 310 fg C µm−3 to convert it to biomass (Fry, 1990; Bloem et al., 1995), which has also been used previously for cyanobacteria (Solé et al., 2001, 2003, 2007, 2009). Biomass results were therefore expressed in carbon units (mg C cm−3) of sediment. CLSM–IA is very precise, given that the minimum biomass that it can detect corresponds to a voxel equivalent to mg C cm−3 of sediment (Solé et al., 2009). The obtained carbon value was based on the autofluorescence signal of only the living and active green algae and cyanobacteria (bryophytes and lichens < 200 µm on top of the crusts were included) and was therefore called active photosynthetic carbon (apC). Nevertheless, the EPS of cyanobacteria and green algae contained massive amounts of carbon was only considered as a minor proportion due to the missing fluorescence signal, and thus apC should be higher. The EPS and dead cells created a dense matrix together with the soil. This texture changed where the BSC structure ended and the pure soil started. This point could be estimated by the scale bar and was therefore indicated as the end of the depth profiles.
2.8 Total organic carbon
Total organic C content was determined by pre-heating four samples per site for 12 h at 105 ∘C to obtain dry weight and volume values before manually grinding and mass loss after ignition for 2 h at 550 ∘C (Black, 1965). Remaining material contained only inorganic C. Non-photosynthetic C (npC) values were calculated by subtracting active photosynthetic C (apC) from total organic C. The latter therefore contained dead cells, EPS and heterotrophic macrofauna and microfauna of the BSC that gave no fluorescence signals. All values were expressed in percentage and applied to the volume of 1 cm3 dry matter.
2.9 Statistical analysis
Statistics for loss on ignition data were completed by using Statistica software (version 9.1; StatSoft Inc. 2010). Those data were tested for normal distribution with a Shapiro–Wilk test. One-way ANOVA with a following Tukey post hoc test was used to look for differences between groups for normally distributed data.
3.1 Biomap structure and graphic scheme
Cyanobacteria dominated over green algae across all four sites, which was detected based on the different fluorescent features of the photoautotrophic organisms in the 2-D biomaps: chlorophyll a (red channel) of green algae was excited separately from the phycobilins (green channel) of cyanobacteria, (Fig. 1). The EPS showed a minor fluorescence signal at its periphery as an artefact of reflectance from the main cells (Fig. 1c and d, white arrow). Biological soil crusts from all four sites were densely packed with a variety of cyanobacteria and green algae, ranging from single coccoidal to filamentous organisms (Fig. 2e), of which Hochtor shows the highest morphological diversity. Macroscopic thalli-forming Nostoc species (Fig. 2a–e, white triangles) were found on top and within the BSC and their identity was confirmed by light microscopy.
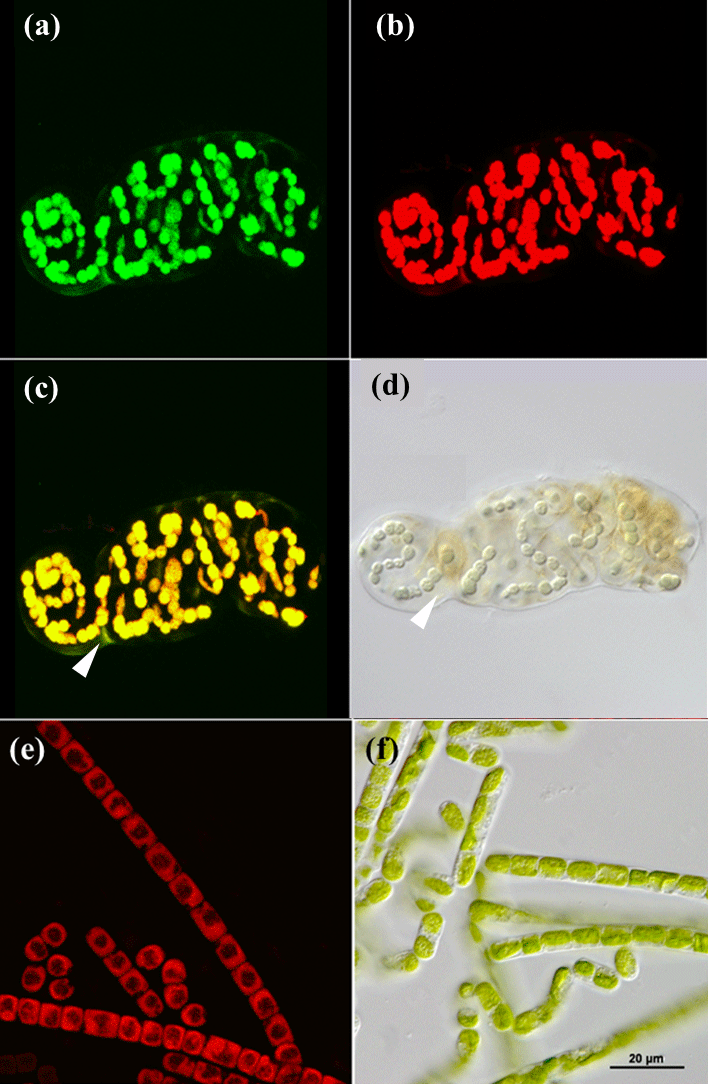
Figure 1CLSM and light microscopy micrographs of photoautotrophic organisms. Nostoc sp. (cyanobacterium) visualized with CLSM (a–c) and light microscopy (d) with white triangles indicating the EPS (c, d). Klebsormidium sp. (green algae) visualized with CLSM (e) and light microscopy (f). Green channel (a) represents fluorescence from phycobilins at 639 nm, red channel (b, e) from chlorophyll a at 555 nm and an overlap of both is shown in (c) for Nostoc sp.
Additionally, the BSC can vertically be divided into an upper photosynthetic active layer (PAL), where fluorescence signals from cells with active chlorophyll a and phycobilins accumulate, and a lower photosynthetic inactive layer (PIL) that represents inactive cells, glued together with stones through EPS (Fig. 3). This layer does not give a fluorescence signal but belongs to the crust itself. Both compartments can be removed from the soil as a single entity.
3.2 Active photosynthetic carbon (apC) depth profiles
The apC depth profiles (Fig. 4) reveal specific patterns for each of the four sites, with C peaks in the upper part of the crust in Livingston and Geopol samples and located between 1 and 2 mm in Hochtor and Ny-Ålesund samples. The highest values ranged between 25 and 40 mg C cm−3. Light grey backgrounds indicate the soil stratum made of active photosynthetic organisms (PAL), whereas the dark grey parts mark the layer (PIL), containing inactive cyanobacteria and green algae (limit set to < 5 mg C cm−3) according to the concept explained previously. Values at the deepest position show the mean thickness of each crust, with Hochtor having the thickest crust reaching almost 4 mm and Livingston showing the thinnest crust with a depth of 2.8 mm.
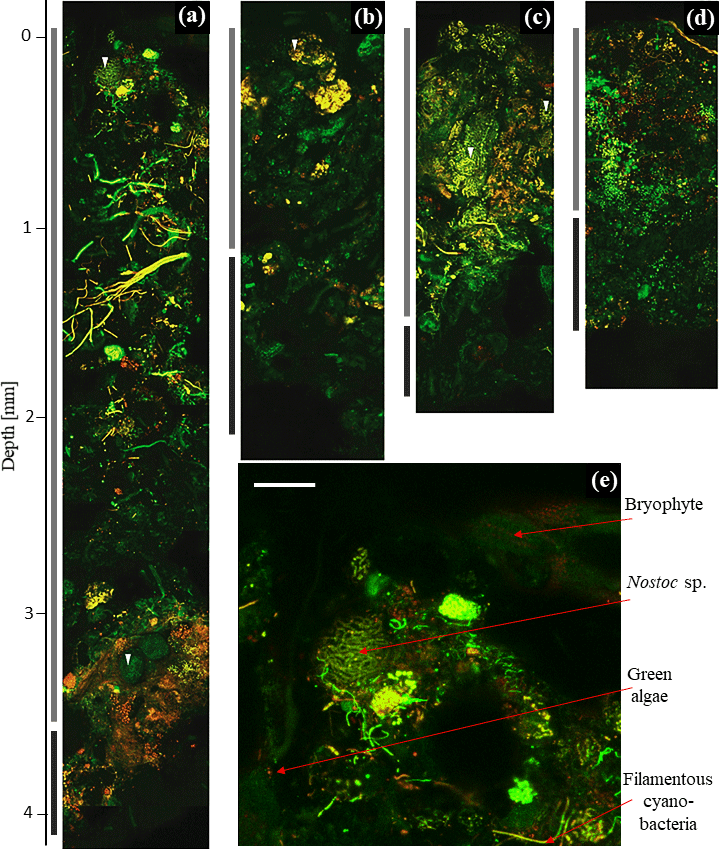
Figure 2Two-dimensional biomap. Overlap of green and red channel as maximum projection of depth profile images showing Hochtor (a), Livingston (b), Ny-Ålesund (c) and Geopol (d). PAL (light grey) and PIL (dark grey) indicate different strata as bars in comparison to their depth. The beginning of the fluorescence signals indicates the BSC surface (0 mm). The dark black background above this is the agarose matrix. A zoom-in of the top layer of Hochtor demonstrates bryophytes, cyanobacteria and green algae (e). White triangles indicate different Nostoc species. White scale bar indicates 100 µm.
3.3 Carbon and partitioning
The total organic carbon content of soils varies between 7 and 17 % (Fig. 5), with Hochtor and Geopol being significantly different to Ny-Ålesund (p ≤ 0.05). Based on CLSM–IA this total organic C can be divided into carbon evaluated from active photosynthetic organisms (apC), and non-photosynthetic carbon (npC). The latter includes dead organic material and remaining EPS. Only 1.5–3 % (4–11 %) of the total organic carbon is provided by active cyanobacteria, green algae and bryophytes as apC without EPS (npC).
Cyanobacteria with their EPS and thallus structure occupy between 7 (Livingston) and 23 % (Ny-Ålesund) of the total area of BSC that was visualized in the 2-D biomaps. In comparison, green algae contribute 0.5 to 2 % as a minor group (Fig. 5).
Non-fluorescing EPS as the main matrix of the BSC, together with stones, gravel, dead material and faunal elements, accounted for between 76 and 92 % of the BSC area, grouped as adhering material.
For the first time, CLSM was applied to visualize intact BSC, collected from the Arctic, Antarctica and the Alps. Together with carbon estimations we provide new insights into BSC structure. The crusts themselves show compartmentation with a PAL stratum, containing the active fraction of mainly cyanobacteria and a few green algae, and the PIL fraction with predominantly dead material. This is additionally reflected in the carbon contents and visualized in a graphic scheme (Fig. 3).
Embedding BSC in an agarose matrix allowed visualization of intact and active BSCs with CLSM. The biomaps provide insights into structural features of the different BSCs, such as spatial distribution patterns related to depth, community composition of morphological and taxonomic groups and discriminating between green algae and cyanobacteria.
The different crusts have several structural features in common: their crust layers are divided into a top layer characterized by high densities of active photoautotrophic organisms, which is therefore defined as PAL (0–2.5 mm) and a sublayer (2–4 mm) with a strongly decreased abundance of photoautotrophic organisms, named PIL. Both layers are part of the BSC and can be removed from the soil as a single entity because the EPS joins the microorganisms and sediment. In most of the investigated BSCs the different structures were found to be very pronounced between all sites; however, these structural differences have additionally been identified with this technique from crusts in other habitats (Michelle Szyja, personal communication, 2018). The layered structure is similar to what has been recently described for arid desert BSCs of Israel, where three layers were defined (Ranaan et al., 2016): a top crust layer about 1–2 mm thick composed of small packed particles and most of the organic material (Drahorad et al., 2013), followed by a vesicle layer of approximately 0.3–0.7 mm thickness filled with trapped air and a sub-crust layer made of dead material, EPS and soil particles. The formation of a vesicle layer is possibly prevented at the cold sites of this study because of the freeze–thaw dynamics and continuous water runoff during the active season, transporting and shifting small particles that fill potential air vesicles.
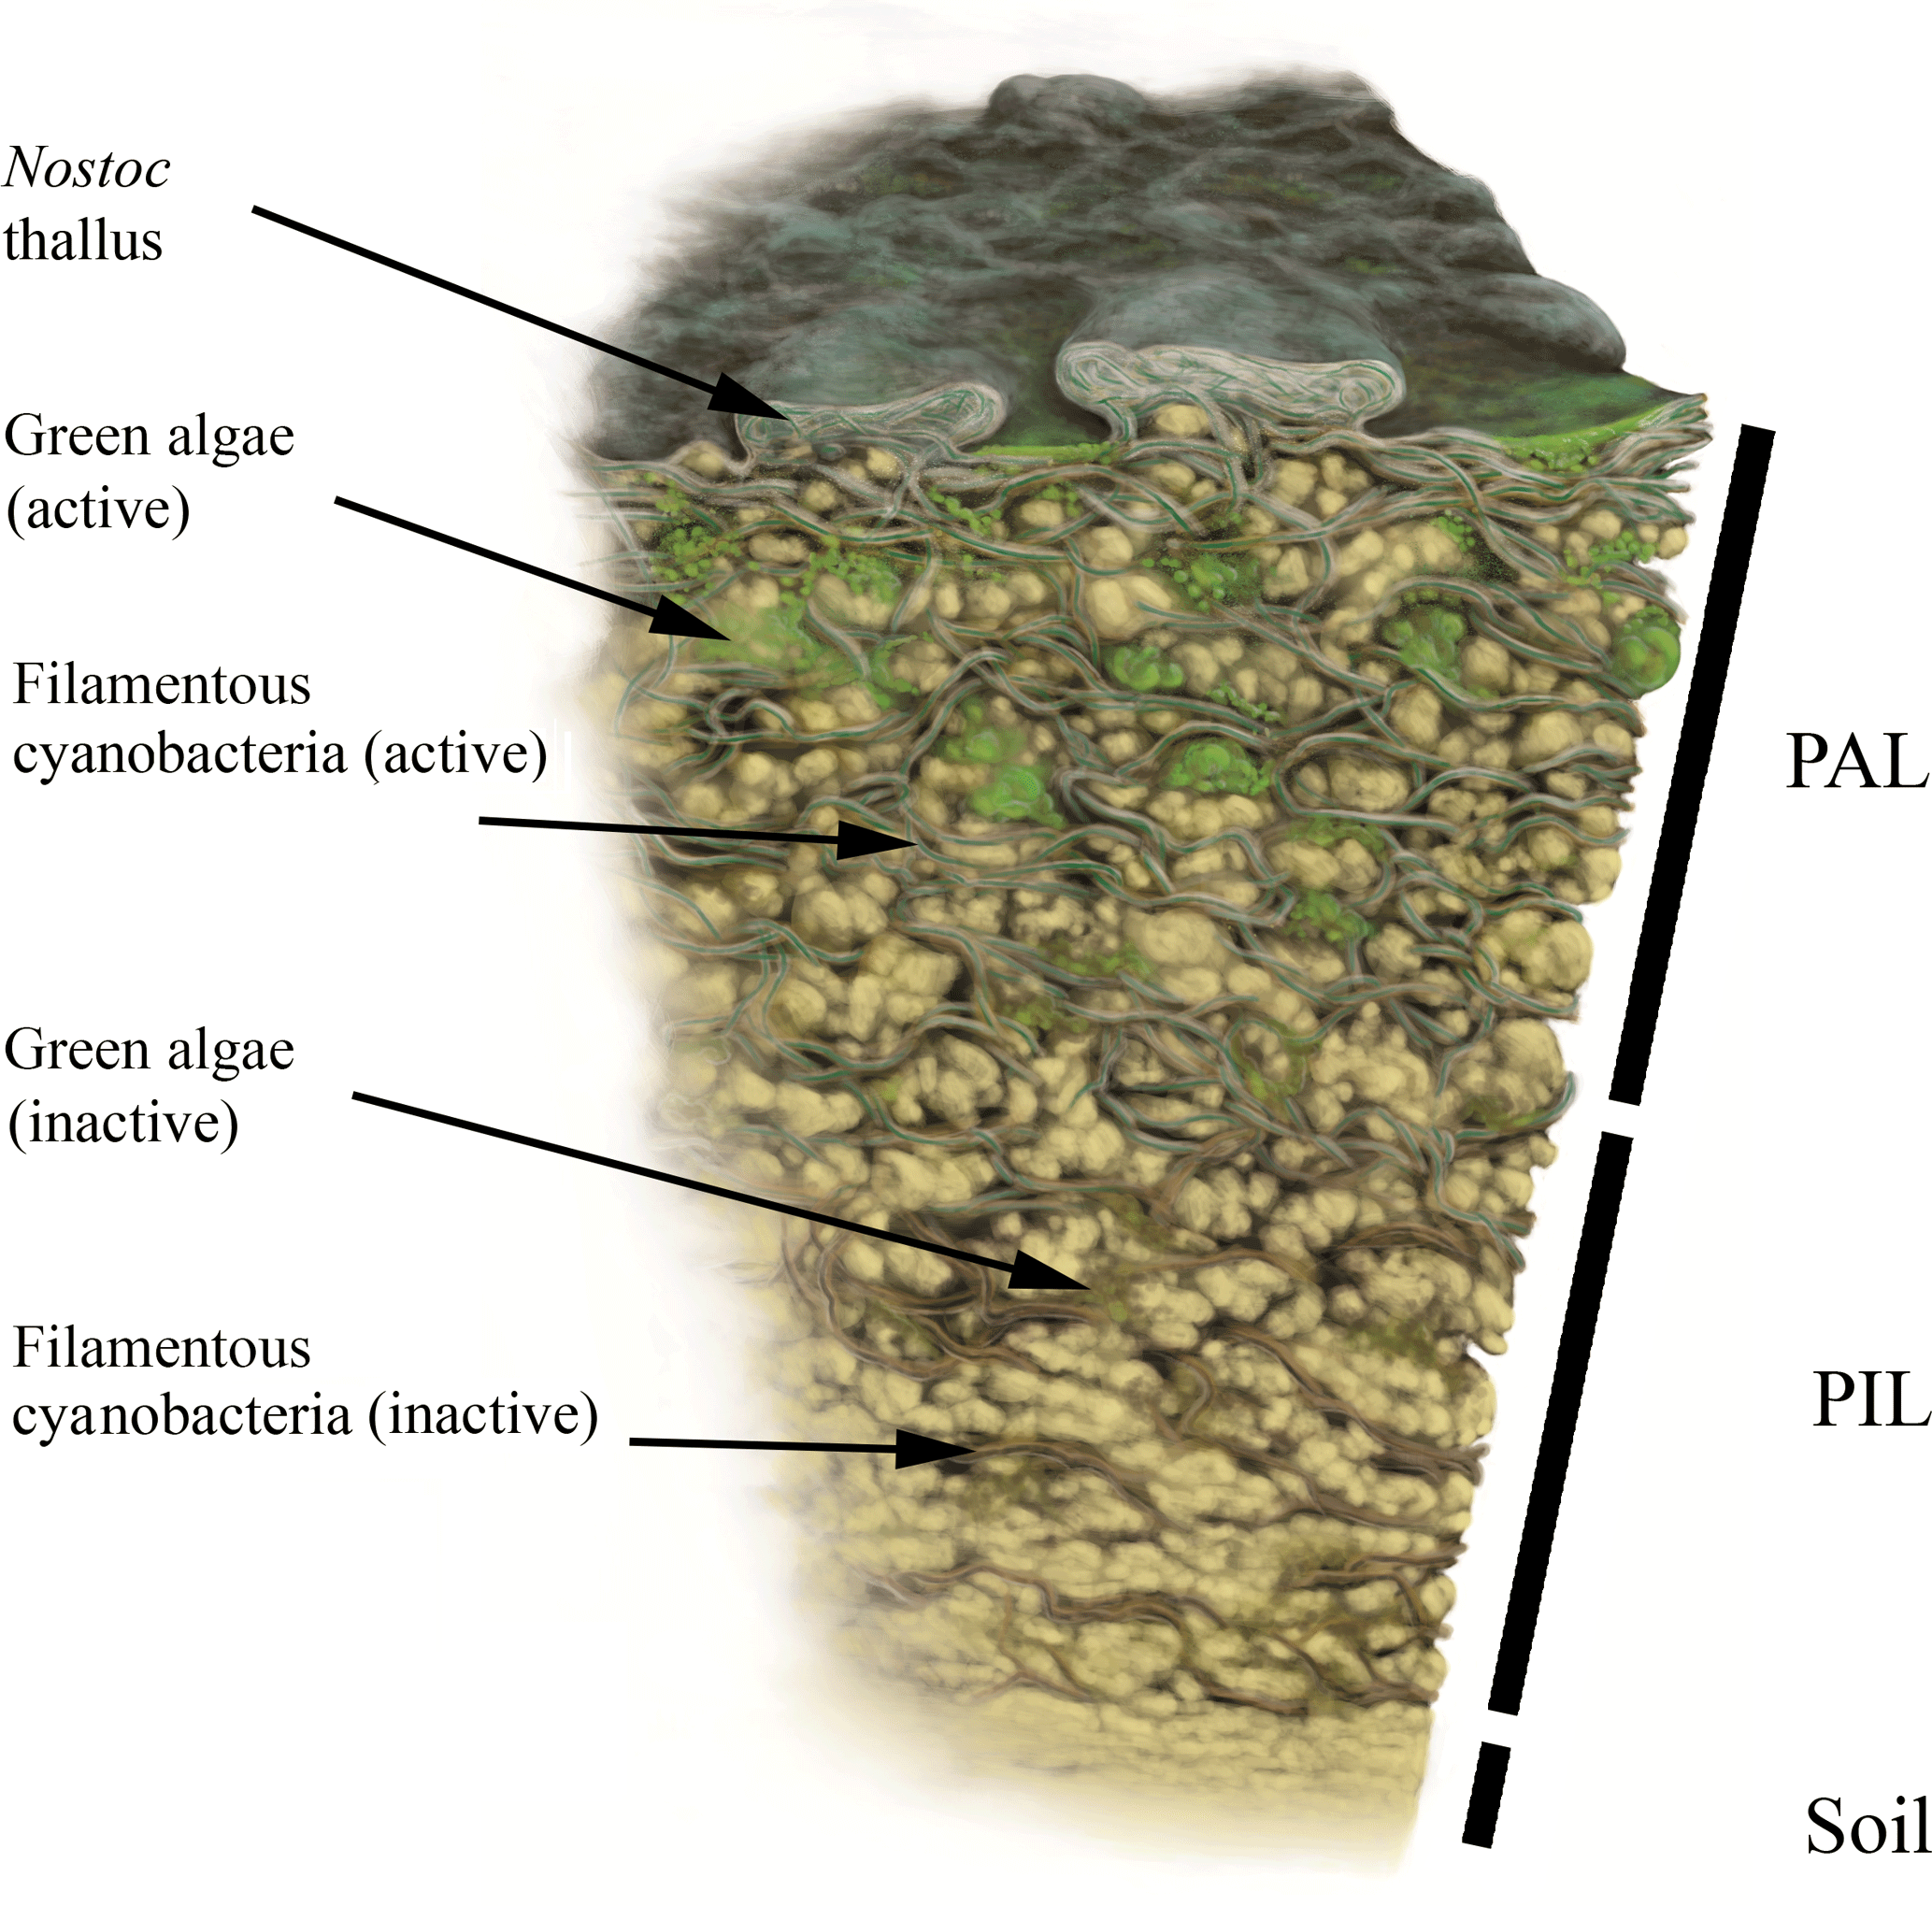
Figure 3Biomap scheme. Simplified illustration of a vertical BSC cross section with photosynthetic active cyanobacteria and green algae in the PAL (photosynthetic active layer) stratum as well as both fractions in their dead or inactive forms within the PIL (photosynthetic inactive layer) stratum. Illustration by Frederik Spindler.
Additionally, eukaryotic green algae represent only a minority in terms of occupied space at all sites. In general, it is known that there are no eukaryotic algae exclusively found in BSCs (Büdel et al., 2016). Green algae are rarely the dominant crust-forming organisms and they occur in low abundance or may be present in dormant resting stages, which are hard to detect and identify. This is supported by other studies that detected, at least from Hochtor, only a minor proportion of green algae (Büdel et al., 2014; Peer et al., 2013).
Furthermore, cyanobacteria constitute the dominant photoautotrophic spatial unit at all sites, probably due to their thallus structures being composed of EPS and their cell densities. Interestingly, Büdel et al. (2014) showed by Illumina sequencing that within the microbiome of BSC from Hochtor, cyanobacteria contributed only 1.6 % to the total bacterial diversity, whereas we show that cyanobacteria occupy 20 % of space within the crust. This shows that the role of cyanobacteria within microbiome studies that are based only on DNA proportions might be underestimated.
Differences among the crusts based on CLSM 2-D biomaps were reflected in their thicknesses and the morphological groups that could be identified. The alpine site Hochtor, for example, harbours the thickest crust that is known throughout available literature with a thickness that exceeds 4 mm. Light regime could be a responsible factor, because all four sites share similar daylight times with PAR exceeding 1200 µmol m−2 s−1 (Colesie et al., 2016; Xiong et al., 2001; Barták et al., 2012), but with the strongest fluctuations at Hochtor (Büdel et al., 2014). The appearance of photoautotrophic organisms up to these depths may be possible due to a diverse community composition of organisms with different adaptations regarding light regime. This idea supports previous studies that state high rates of photosynthetic activity at least during the snow-free growing season for BSC of Hochtor (Raggio et al., 2017; Büdel et al., 2014). Species such as those of Nostoc have been found to occupy mainly soil surface positions (Fig. 2, white triangles), where they must invest in UV and desiccation protection, for example through pigment and EPS production. A different strategy is avoidance, which requires vertical migration down from the soil surface (Garcia-Pichel and Pringault, 2001). This is therefore only available to relatively large, mobile organisms such as the filamentous cyanobacteria Microcoleus. In deeper layers of the soil, light is attenuated due to high densities of mineral and biogenic particles and shorter wavelengths penetrate less deeply than longer wavelengths, which provides a redundancy for pigment synthesis as UV protection (Belnap et al., 2004). The establishment of a highly diverse cyanobacterial community with representatives of both strategies would therefore lead to an increase in activity, and consequently the thickness of PAL. Additionally, activity recovery of BSCs after seasonal changes may be accelerated by a vivid crust. For example, this may be the case in Hochtor, where BSC is composed of various cyanobacterial species with different ecological niches. However, the community composition of these habitats needs to be addressed by further molecular and taxonomic studies in order to investigate these ideas.

Figure 4Active photosynthetic carbon (apC) depth profiles. Carbon values calculated from 3-D biomaps with CLSM–IA are plotted against soil depth from surface to where the crust ends with standard deviation. PAL (photosynthetic active layer) is indicated in light grey, describing the soil stratus that contains active photoautotrophic organisms. PIL (photosynthetic inactive layer) is shown in dark grey, marking the soil stratum with inactive photoautotrophic cyanobacteria and green algae. The value representing the deepest point describes the thickness of each biocrust.
The main functional BSC groups such as cyanobacterial crust, green algae crust, cyanolichen, chlorolichen and bryophyte crusts of Ny-Ålesund, Geopol and Livingston Island have already been shown to be distinct, which is for the most part linked to their geographic distribution and the differences between deeper and more skeletal soils (Williams et al., 2017). Carbon contents along the depth of the BSC obtained by CLSM 3-D biomaps represent a summary of microclimatic conditions of the different habitats, their successional stage and structural features, which therefore support these results. Highest C contents of approximately 40 mg C cm−3 are reached at depths between 0.5 and 2 mm, except for Livingston, where bryophytes dominate the BSC at the soil surface, leading to C peaks placed directly at the top. As described previously (Williams et al., 2017), Livingston Island shows a different developmental vegetation stage where cyanobacteria and green algae have been replaced by bryophyte cushions and especially chlorolichens, situated on the crust surface that represent the climax community. Also, at Geopol the C peak is close to the surface and combined with the thickest PIL, probably linked to the disturbance regime of cryoturbation. During polygon formation and especially freeze–thaw interactions, gravel and particles of different sizes are moved, affecting the cyanobacteria and green algae that are glued to them by their EPS (Cannone and Guglielmin, 2010). The BSC structure may not be destroyed but is probably shifted so that organisms from the top that are immobile are moved to deeper positions, losing their favoured photosynthetic light regime position and possibly dying off. Dead cells and EPS can remain to some extent (Tamaru et al., 2005) but their maintenance as well as the amount of new grown BSC on top of the old structures is limited by the ongoing processes of cryoturbation, a common occurrence in polar and alpine sites worldwide.
Northern circumpolar soils are estimated to cover approximately 18 782 × 103 km2 and contain about 191 Pg of organic carbon in the 0–30 cm depth stratum (Tarnocai et al., 2009). Organic carbon stored in permafrost regions is one of the least understood and potentially most significant carbon–climate feedbacks due to the size of the carbon pools and the intensity of climate forcing at high latitudes (Schuur et al., 2008). Around Ny-Ålesund, Spitsbergen, approximately 90 % of the soil surface is covered by BSCs (Williams et al., 2017), whereby the first cubic centimetre of soil contains almost 18 % organic C, highlighting the sink character of these cold ecosystems. This becomes even more impressive when compared to soil organic C contents of other BSC-dominated habitats like the Andes with 4–8 % (Pérez, 1997) or 1 % of the Kalahari (Mager, 2010).
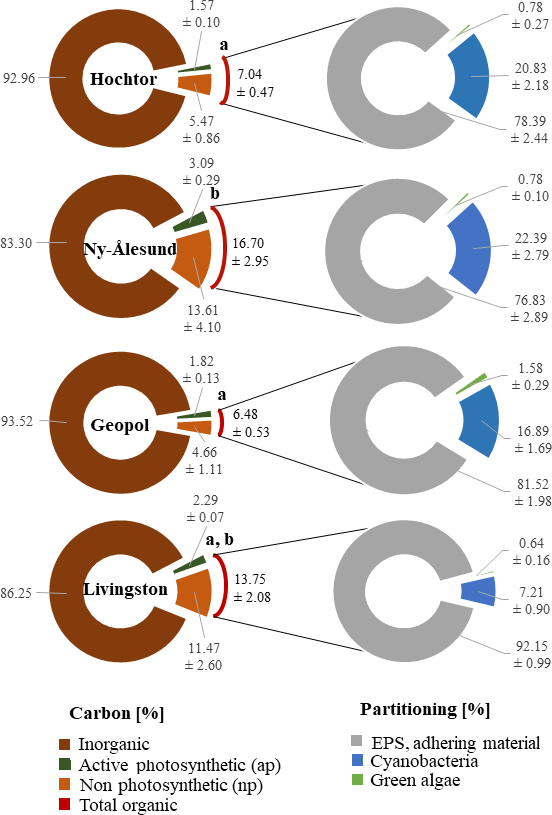
Figure 5Carbon and BSC group partitioning. Carbon content determined by loss on ignition and CLSM–IA of the 3-D biomaps is combined in percent and applied to the volume of 1 cm3 (left circle). Total organic C obtained by loss on ignition from Hochtor and Geopol differ significantly from Ny-Ålesund (p ≤ 0.05). Lower-case letters mark statistically significant differences. Area partitioning of cyanobacteria, green algae and adhering material within the BSC is expressed in percentage and is applied to the total area of the 2-D biomaps (right circle). Values are the mean ± standard deviation.
Nevertheless, the contribution of C from active photosynthetic organisms (apC) to the total C seems to be in a low range (2–3 %), which is probably linked to the methodological drawback of CLSM in terms of C determination, ignoring the EPS which is made of carbohydrates. Through their photosynthetic activity, cyanobacteria increase the C content within the BSC in the form of carbohydrates; this acts as an energy source that can be readily utilized by other soil organisms (Bertocchi et al., 1990). Mager (2010), for example, demonstrated that carbohydrates from the EPS made up to 75 % of the total organic C within the BSC in the Kalahari, which in comparison is determined here by the loss on ignition as total organic C. Despite the fact that CLSM ignores the EPS of unstained cyanobacteria and green algae to some extent, which lowers the proportion of C this technique can determine, it can give highly comparable insights into BSC structures that have not been addressed by any other technique known so far.
In conclusion, CLSM is a suitable and highly comparable method to obtain 2-D biomaps, which show the intact and undisturbed photoautotrophic community of BSCs in order to examine structural and clade specific features. The newly defined terminology and determination of PAL and PIL of BSCs as visual entities and C depth profiles will be helpful for investigating and comparing successional stages and changes in BSCs of different sites and treatments. In addition, it is likely that BSCs contribute significantly to the global carbon flux of soils at cold sites, highlighting their role as CO2 sinks. For these reasons it is vital to address the cyanobacterial community composition of the Arctic, Antarctica and the Alps with further studies before climate-change-induced species alterations take place.
Data are not deposited yet because this is part of ongoing research.
The authors declare that they have no conflict of interest.
This article is part of the special issue “Biological soil crusts and their role in biogeochemical processes and cycling”. It is a result of the BIOCRUST3 conference, Moab, USA, 26 to 30 September 2016.
The authors thank the crew at the AWIPEV base in Ny-Ålesund and those at Juan Carlos I in Livingston for assistance in the field work and
technical equipment. The Spanish Antarctic committee also provided essential
aid in travel to and from Livingston. Financing and logistical support of
the research in Ny-Ålesund and Livingston was kindly provided by the
German Research Council in the framework of the Priority Programme
“Antarctic Research” 1158 (DFG, KA899/23-1, BE1779/18-1, BU 666/17-1). We
also want to thank Harald Kelm and his team for guidance during total
organic C determinations by loss on ignition.
Edited by: Anita Antoninka
Reviewed by: two anonymous referees
Amundson, R.: The carbon budget in soils, Annu. Rev. Earth Pl. Sc., 29, 535–562, 2001.
Bálint, M., Domisch, S., Engelhardt, C. H. M., Haase, P., Lehrian, S., Sauer, J., Theissinger, K., Pauls, S. U., and Nowak, C.: Cryptic biodiversity loss linked to global climate change, Nat. Clim. Change, 1, 313–318, 2011.
Bañón, M., Justel, A., Velázquez, D., and Quesada, A.: Regional weather survey on Byers Peninsula, Livingston Island, South Shetland Islands, Antarctica, Antarct. Sci., 25, 146–156, 2013.
Barták, M., Váczi, P., and Hájek, J.: Photosynthetic activity in three vascular species of Spitsbergen vegetation during summer season in response to microclimate, Pol. Polar Res., 33, 443–462, 2012.
Bayard, D., Stähli, M., Parriaux, A., and Flühler, H.: The influence of seasonally frozen soil on the snowmelt runoff at two Alpine sites in southern Switzerland, J. Hydrol., 309, 66–84, 2005.
Belnap, J.: The world at your feet: desert biological soil crusts, Front. Ecol. Environ., 1, 181–189, 2003.
Belnap, J.: The potential roles of biological soil crusts in dryland hydrologic cycles, Hydrol. Process., 20, 3159–3178, 2006.
Belnap, J. and Gillette, D. A.: Vulnerability of desert biological soil crusts to wind erosion: the influences of crust development, soil texture, and disturbance, J. Arid Environ., 39, 133–142, 1998.
Belnap, J. and Lange, O. L.: Structure and functioning of biological soil crusts: a synthesis, in: Biological soil crusts: structure, function, and management, Springer, Berlin, Germany, 471–479, 2001.
Belnap, J., Büdel, B., and Lange, O. L.: Biological soil crusts: characteristics and distribution, in: Biological soil crusts: structure, function, and management, Springer, Berlin, Germany, 3–30, 2001.
Belnap, J., Phillips, S. L., and Miller, M. E.: Response of desert biological soil crusts to alterations in precipitation frequency, Oecologia, 141, 306–316, 2004.
Bengtsson, S.-A.: Terrestrisk liv på Svalbard. Beskrivelse av mljöfoholdene og ökologiske forutsetninger, Norsk Polarinstitutt, Meddelelser, 150, 21–31, 1999.
Bertocchi, C., Navarini, L., Cesàro, A., and Anastasio, M.: Polysaccharides from cyanobacteria, Carbohyd. Polym., 12, 127–153, 1990.
Black, C. A.: Methods Of Soil Analysis Part1 and 2, American Society Of Agronomy, Inc., USA, 1965.
Bloem, J., Veninga, M., and Shepherd, J.: Fully automatic determination of soil bacterium numbers, cell volumes, and frequencies of dividing cells by confocal laser scanning microscopy and image analysis, Appl. Environ. Microb., 61, 926–936, 1995.
Bowker, M. A., Miller, M. E., Belnap, J., Sisk, T. D., and Johnson, N. C.: Prioritizing conservation effort through the use of biological soil crusts as ecosystem function indicators in an arid region, Conserv. Biol., 22, 1533–1543, 2008.
Breen, K. and Lévesque, E.: The influence of biological soil crusts on soil characteristics along a High Arctic glacier foreland, Nunavut, Canada, Arct, Antarct. Alp. Res., 40, 287–297, 2008.
Büdel, B., Colesie, C., Green, T. A., Grube, M., Suau, R. L., Loewen-Schneider, K., Maier, S., Peer, T., Pintado, A., Raggio, J., Ruprecht, U., Sancho, L. G., Schroeter, B., Türk, R., Weber, B., Wedin, M., Westberg, M., Williams, L., and Zheng, L.: Improved appreciation of the functioning and importance of biological soil crusts in Europe: the Soil Crust International Project (SCIN), Biodivers. Conserv., 23, 1639–1658, 2014.
Büdel, B., Dulić, T., Darienko, T., Rybalka, N., and Friedl, T.: Cyanobacteria and Algae of Biological Soil Crusts, in: Biological soil crusts: An Organizing Principle in Drylands, edited by: Weber, B., Büdel, B., and Belnap, J., Ecol. Stud., 226, Springer International Publishing, Switzerland, 55–80, 2016.
Cannone, N. and Guglielmin, M.: Relationships between periglacial features and vegetation development in Victoria Land, continental Antarctica, Antarct. Sci., 22, 703–713, 2010.
Colesie, C., Green, T. A., Raggio, J., and Büdel, B.: Summer activity patterns of Antarctic and high alpine lichen-dominated biological soil crusts–Similar but different?, Arct. Antarct. Alp. Res., 48, 449–460, 2016.
Cooper, E. J., Smith, F. M., and Wookey, P. A.: Increased rainfall ameliorates the negative effect of trampling on the growth of High Arctic forage lichens, Symbiosis, 31, 153–171, 2001.
de los Ríos, A., Ascaso, C., Wierzchos, J., Fernández-Valiente, E., and Quesada, A.: Microstructural characterization of cyanobacterial mats from the McMurdo Ice Shelf, Antarctica, Appl. Environ. Microb., 70, 569–580, 2004.
Drahorad, S., Felix-Henningsen, P., Eckhardt, K.-U., and Leinweber, P.: Spatial carbon and nitrogen distribution and organic matter characteristics of biological soil crusts in the Negev desert (Israel) along a rainfall gradient, J. Arid Environ., 94, 18–26, 2013.
Elster, J., Lukesová, A., Svoboda, J., Kopecky, J., and Kanda, H.: Diversity and abundance of soil algae in the polar desert, Sverdrup Pass, central Ellesmere Island, Polar Rec., 35, 231–254, 1999.
Elvebakk, A. and Hertel, H.: A catalogue of Svalbard lichens, in: A catalogue of Svalbard plants, fungi, algae, and cyanobacteria, edited by: Elvebakk, A. and Prestrud, P., Norsk Polarinstitutt Skrifter, Oslo, 271–359, 1997.
Escolar, C., Martínez, I., Bowker, M. A., and Maestre, F. T.: Warming reduces the growth and diversity of biological soil crusts in a semi-arid environment: implications for ecosystem structure and functioning, Philos. T. R. Soc. B., 367, 3087–3099, 2012.
Evans, R. D. and Lange, O. L.: Biological soil crusts and ecosystem nitrogen and carbon dynamics, in: Biological soil crusts: structure, function, and management, Springer, Berlin, Germany, 263–279, 2001.
Fay, P., Stewart, W. D. P., Walsby, A. E., and Fogg, G. E.: Is the heterocyst the site of nitrogen fixation in blue-green algae?, Nature, 220, 810–812, 1968.
Forman, S. L. and Miller, G. H.: Time-dependent soil morphologies and pedogenic processes on raised beaches, Bröggerhalvöya, Spitsbergen, Svalbard Archipelago, Arctic Alpine Res., 381–394, 1984.
Fry, J. C.: 2 Direct Methods and Biomass Estimation, Method. Microbiol., 22, 41–85, 1990.
Garcia-Pichel, F. and Belnap, J.: Microenvironments and microscale productivity of cyanobacterial desert crusts, J. Phycol., 32, 774–782, 1996.
Garcia-Pichel, F. and Pringault, O.: Microbiology: Cyanobacteria track water in desert soils, Nature, 413, p. 380, 2001.
Garcia-Pichel, F. and Wojciechowski, M. F.: The evolution of a capacity to build supra-cellular ropes enabled filamentous cyanobacteria to colonize highly erodible substrates, Plos One, 4, e7801, https://doi.org/10.1371/journal.pone.0007801, 2009.
Garcia-Pichel, F., Belnap, J., Neuer, S., and Schanz, F.: Estimates of global cyanobacterial biomass and its distribution, Algological Studies, 109, 213–227, 2003.
Gruber, N., Friedlingstein, P., Field, C. B., Valentini, R., Heimann, M., Richey, J. E., Lankao, P. R., Schulze, E. D., and Chen, C. T. A.: The vulnerability of the carbon cycle in the 21st century: An assessment of carbon-climate-human interactions, Scope-Scientific committee on problems of the environment international council of scientific unions, 62, 45–76, 2004.
Harden, S. L., Demaster, D. J., and Nittrouer, C. A.: Developing sediment geochronologies for high-latitude continental shelf deposits: a radiochemical approach, Mar. Geol., 103, 69–97, 1992.
Housman, D. C., Powers, H. H., Collins, A. D., and Belnap, J.: Carbon and nitrogen fixation differ between successional stages of biological soil crusts in the Colorado Plateau and Chihuahuan Desert, J. Arid Environ., 66, 620–634, 2006.
ImageJ Application: https://imagej.nih.gov/ij/, last access: 14 September 2017.
Johansen, J. R.: Cryptogamic crusts of semiarid and arid lands of North America, J. Phycol., 29, 140–147, 1993.
Jungblut, A. D. and Warwick, F. V.: Cyanobacteria in Polar and Alpine Ecosystems, Psychrophiles: From Biodiversity to Biotechnology, Springer, Cham, Switzerland, 181–206, 2017.
Körner, C.: Worldwide positions of alpine treelines and their causes, The impacts of climate variability on forests, Springer, Berlin, Heidelberg, 221–229, 1998.
Kowalchuk, G. A. and Stephen, J. R.: Ammonia-oxidizing bacteria: a model for molecular microbial ecology, Annu. Rev. Microbiol., 55, 485–529, 2001.
Kuske, C. R., Yeager, C. M., Johnson, S., Ticknor, L. O., and Belnap, J.: Response and resilience of soil biocrust bacterial communities to chronic physical disturbance in arid shrublands, Isme J., 6, 886–897, 2012.
Kuwae, T. and Hosokawa, Y.: Determination of abundance and biovolume of bacteria in sediments by dual staining with 4′, 6-diamidino-2-phenylindole and acridine orange: relationship to dispersion treatment and sediment characteristics, Appl. Environ. Microb., 65, 3407–3412, 1999.
Lacap-Bugler, D. C., Lee, K. K., Archer, S., Gillman, L. N., Lau, M. C., Leuzinger, S., and de los Rios-Murillo, A.: Global diversity of desert hypolithic cyanobacteria, Front. Microbiol., 8, p. 867, 2017.
Lane, Richard W., Menon, M., McQuaid, J. B., Adams, D. G., Thomas, A. D., Hoon S. R., and Dougill, A. J.: Laboratory analysis of the effects of elevated atmospheric carbon dioxide on respiration in biological soil crusts, J. Arid Environ., 98, 52–59, 2013.
Maestre, F. T., Escolar, C., Guevara, M. L., Quero, J. L., Lázaro, R., Delgado-Baquerizo, M., Ochoa, V., Berdugo, M., Gozalo, B., and Gallardo, A.: Changes in biocrust cover drive carbon cycle responses to climate change in drylands, Glob. Change Biol., 19, 3835–3847, 2013.
Mager, D. M.: Carbohydrates in cyanobacterial soil crusts as a source of carbon in the southwest Kalahari, Botswana, Soil Biol. Biochem., 42, 313–318, 2010.
Maturilli, M., Herber, A., and König-Langlo, G.: Surface radiation climatology for Ny-Ålesund, Svalbard (78.9 N), basic observations for trend detection, Theor. Appl. Climatol., 120, 331–339, 2015.
Mazor, G., Kidron, G. J., Vonshak, A., and Abeliovich, A.: The role of cyanobacterial exopolysaccharides in structuring desert microbial crusts, Fems. Microbiol. Ecol., 21, 121–130, 1996.
Mummey, D. L. and Rillig, M. C.: The invasive plant species Centaurea maculosa alters arbuscular mycorrhizal fungal communities in the field, Plant Soil, 288, 81–90, 2006.
Peel, M. C., Finlayson, B. L., and McMahon, T. A.: Updated world map of the Köppen-Geiger climate classification, Hydrol. Earth Syst. Sci., 11, 1633–1644, https://doi.org/10.5194/hess-11-1633-2007, 2007.
Peer, T., Zheng, L., and Büdel, B.: Soil Crust InterNational (SCIN)–Understanding and valuing biological soil protection of disturbed and open land surfaces, 5th Symposium Conference Volume for Research in Protected Areas, 571–575, 10 to 12 June 2013, Mittersill, 2013.
Pérez, F. L.: Microbiotic crusts in the high equatorial Andes, and their influence on paramo soils, Catena, 31, 173–198, 1997.
Potts, M.: Desiccation tolerance: a simple process?, Trends Microbiol., 9, 553–559, 2001.
Pushkareva, E., Johansen, J. R., and Elster, J.: A review of the ecology, ecophysiology and biodiversity of microalgae in Arctic soil crusts, Polar Biol., 39, 2227–2240, 2016.
Raanan, H., Felde, V. J. M. N. L., Peth, S., Drahorad, S., Ionescu, D., Eshkol, G., Treves, H., Felix-Henningsen, P., Berkowicz, S. M., Keren, N., Horn, R., Hagemann, M., and Kaplan, A.: Three-dimensional structure and cyanobacterial activity within a desert biological soil crust, Environ. Microbiol., 18, 372–383, 2016.
Raggio, J., Green, T. A., Sancho, L. G., Pintado, A., Colesie, C., Weber, B., and Büdel, B.: Metabolic activity duration can be effectively predicted from macroclimatic data for biological soil crust habitats across Europe, Geoderma, 306, 10–17, 2017.
Schallenberg, M., Kalff, J., and Rasmussen, J. B.: Solutions to problems in enumerating sediment bacteria by direct counts, Appl. Environ. Microb., 55, 1214–1219, 1989.
Schlesinger, W. H.: Evidence from chronosequence studies for a low carbon-storage potential of soils, Nature, 348, 232–234, 1990.
Schlesinger, W. H. and Andrews, J. A.: Soil respiration and the global carbon cycle, Biogeochemistry, 48, 7–20, 2000.
Schuur, E. A., Bockheim, J., Canadell, J. G., Euskirchen, E., Field, C. B., Goryachkin, S. V., Hageman, S., Kuhry, P., Lafleur, P. M., Mazhitova, H. L. G., Nelson, F. E., Rinke, A., Romanovsky, V. E., Shiklomanov, N., Rarnocai, C., Venevsky, S., Vogel, J. G., and Zimov, S. A.: Vulnerability of permafrost carbon to climate change: Implications for the global carbon cycle, Bioscience, 58, 701–714, 2008.
Shively, J. M., English, R. S., Baker, S. H., and Cannon, G. C.: Carbon cycling: the prokaryotic contribution, Curr. Opin. Microbiol., 4, 301–306, 2001.
Solé, A., Gaju, N., Méndez-Álvarez, S., and Esteve, I.: Confocal laser scanning microscopy as a tool to determine cyanobacteria biomass in microbial mats, J. Microsc.-Oxford, 204, 258–262, 2001.
Solé, A., Gaju, N., and Esteve, I.: The biomass dynamics of cyanobacteria in an annual cycle determined by confocal laser scanning microscopy, Scanning, 25, 1–7, 2003.
Solé, A., Mas, J., and Esteve, I.: A new method based on image analysis for determining cyanobacterial biomass by CLSM in stratified benthic sediments, Ultramicroscopy, 107, 669–673, 2007.
Solé, A., Diestra, E., and Esteve, I.: Confocal laser scanning microscopy image analysis for cyanobacterial biomass determined at microscale level in different microbial mats, Microb. Ecol, 57, 649–656, 2009.
Tamaru, Y., Takani, Y., Yoshida, T., and Sakamoto, T.: Crucial role of extracellular polysaccharides in desiccation and freezing tolerance in the terrestrial cyanobacterium Nostoc commune, Appl. Environ. Microb., 71, 7327–7333, 2005.
Tarnocai, C., Canadell, J. G., Schuur, E. A. G., Kuhry, P., Mazhitova, G., and Zimov, S.: Soil organic carbon pools in the northern circumpolar permafrost region, Global Biogeochem. Cy., 23, https://doi.org/10.1029/2008GB003327, 2009.
Thomas, D. N., Fogg, T., and Convey, P.: Introduction to the polar regions, in: The biology of polar regions, 1–27, Oxford University Press, 2008a.
Thomas, D. N., Fogg, T., and Convey, P.: Periglacial and terrestrial habitats in polar regions, in: The biology of polar regions, 53–100, Oxford University Press, 2008b.
Tiedje, J. M.: Denitrifiers, Methods of Soil Analysis: Part 2-Microbiological and Biochemical Properties, Agronomy Monograph, 9(2), Madison, Wisconsin, USA, 245–267, 1994.
Uchida, M., Nakatsubo, T., Kanda, H., and Koizumi, H.: Estimation of the annual primary production of the lichen Cetrariella delisei in a glacier foreland in the High Arctic, Ny-Ålesund, Svalbard, Polar Res., 25, 39–49, 2006.
Vogel, S., Eckerstorfer, M., and Christiansen, H. H.: Cornice dynamics and meteorological control at Gruvefjellet, Central Svalbard, The Cryosphere, 6, 157–171, https://doi.org/10.5194/tc-6-157-2012, 2012.
Weber, B., Büdel, B., and Belnap, J. (Eds.): Biological soil crusts: an organizing principle in drylands, 226, Springer, 2016.
Wertin, T. M., Phillips, S. L., Reed, S. C., and Belnap, J.: Elevated CO2 did not mitigate the effect of a short-term drought on biological soil crusts, Biol. Fert. Soils, 48, 797–805, 2012.
Williams, L., Borchhardt, N., Colesie, C., Baum, C., Komsic-Buchmann, K., Rippin, M., Becker, B., Karsten, U., and Büdel, B.: Biological soil crusts of Arctic Svalbard and of Livingston Island, Antarctica, Polar Biol., 40, 399–411, 2017.
Xiong, F. S. and Day, T. A.: Effect of solar ultraviolet-B radiation during springtime ozone depletion on photosynthesis and biomass production of Antarctic vascular plants, Plant Physiol., 125, 738–751, 2001.