the Creative Commons Attribution 4.0 License.
the Creative Commons Attribution 4.0 License.
 | 21 Jun 2018
What fraction of the Pacific and Indian oceans' deep water is formed in the Southern Ocean?
Wally Broecker
In this contribution we explore constraints on the fractions of deep water present in the Indian and Pacific oceans which originated in the northern Atlantic and in the Southern Ocean. Based on we show that if ventilated Antarctic shelf waters characterize the Southern contribution, then the proportions could be close to 50–50. If instead a Southern Ocean bottom water value is used, the Southern contribution is increased to 75 %. While this larger estimate may best characterize the volume of water entering the Indo-Pacific from the Southern Ocean, it contains a significant portion of entrained northern water. We also note that ventilation may be highly tracer dependent: for instance Southern Ocean waters may contribute only 35 % of the deep radiocarbon budget, even if their volumetric contribution is 75 %. In our estimation, the most promising approaches involve using CFC-11 to constrain the amount of deep water formed in the Southern Ocean. Finally, we highlight the broad utility of as a tracer of deep water masses, including descending plumes of Antarctic Bottom Water and large-scale patterns of deep ocean mixing, and as a tracer of the efficiency of the biological pump.
- Article
(8321 KB) - Full-text XML
- BibTeX
- EndNote


In 1987, Klaus Hasselmann was invited to Lamont-Doherty to present three lectures on climate. The first two dealt with what he referred to as PIPS and POPS, but they did not particularly pique my interest. However, the third one hit the mark. In it Klaus laid out the distribution of properties generated by Ernst Maier-Reimer's ocean circulation model (Maier-Reimer and Hasselmann, 1987). I was particularly interested in its ability to reproduce the distribution of natural radiocarbon in the ocean. But the plots he showed were at first glance incomprehensible. It turned out that rather than presenting differences from the 14C to C ratio in atmospheric CO2, they were referenced to that in mean ocean water. After the lecture, I offered to come to Hamburg to help Maier-Reimer switch to a mode of presentation understandable to those conversant with the 14C measurements. And so it was that I spent three weeks with Ernst probing not only the 14C to C distribution produced by his model but also that of O2 and SiO2. For me it was a fantastic learning experience. Not only did Ernst have an amazing mind but he had a knack for teaching by tweaking his model. Thus began a lasting collaboration and friendship.
This led to an interest in determining the contributions of NADW and AABW to the ventilation of the deep Pacific and Indian oceans. As the ratio of O2 utilization to PO4 release during respiration appears to be nearly constant throughout the ocean's interior (Takahashi et al., 1985; Anderson and Sarmiento, 1994), Broecker and colleagues (Broecker et al., 1985a, 1998) proposed a conservative property :
As only differences between values are of importance, the choice of the constant 1.95 is arbitrary. Hence zero would have been more convenient. Other choices for the O2 consumption to PO4 remineralization ratio are also possible (Hupe and Karstensen, 2000) but have little impact on our global-scale calculations, so we stick with the formulation of Broecker et al. (1998) above.
The attraction of as a water mass tracer is that although the deep waters formed in the northern Atlantic range widely in temperature, all the contributors have values close to 0.7 (Fig. 1). Further, the deep waters (i.e., > 2000 m) in the deep Pacific and Indian oceans have values close to 1.4. Hence, if the for deep waters formed in the Southern Ocean were known, the relative amounts of deep water produced in the two key source regions could be established.
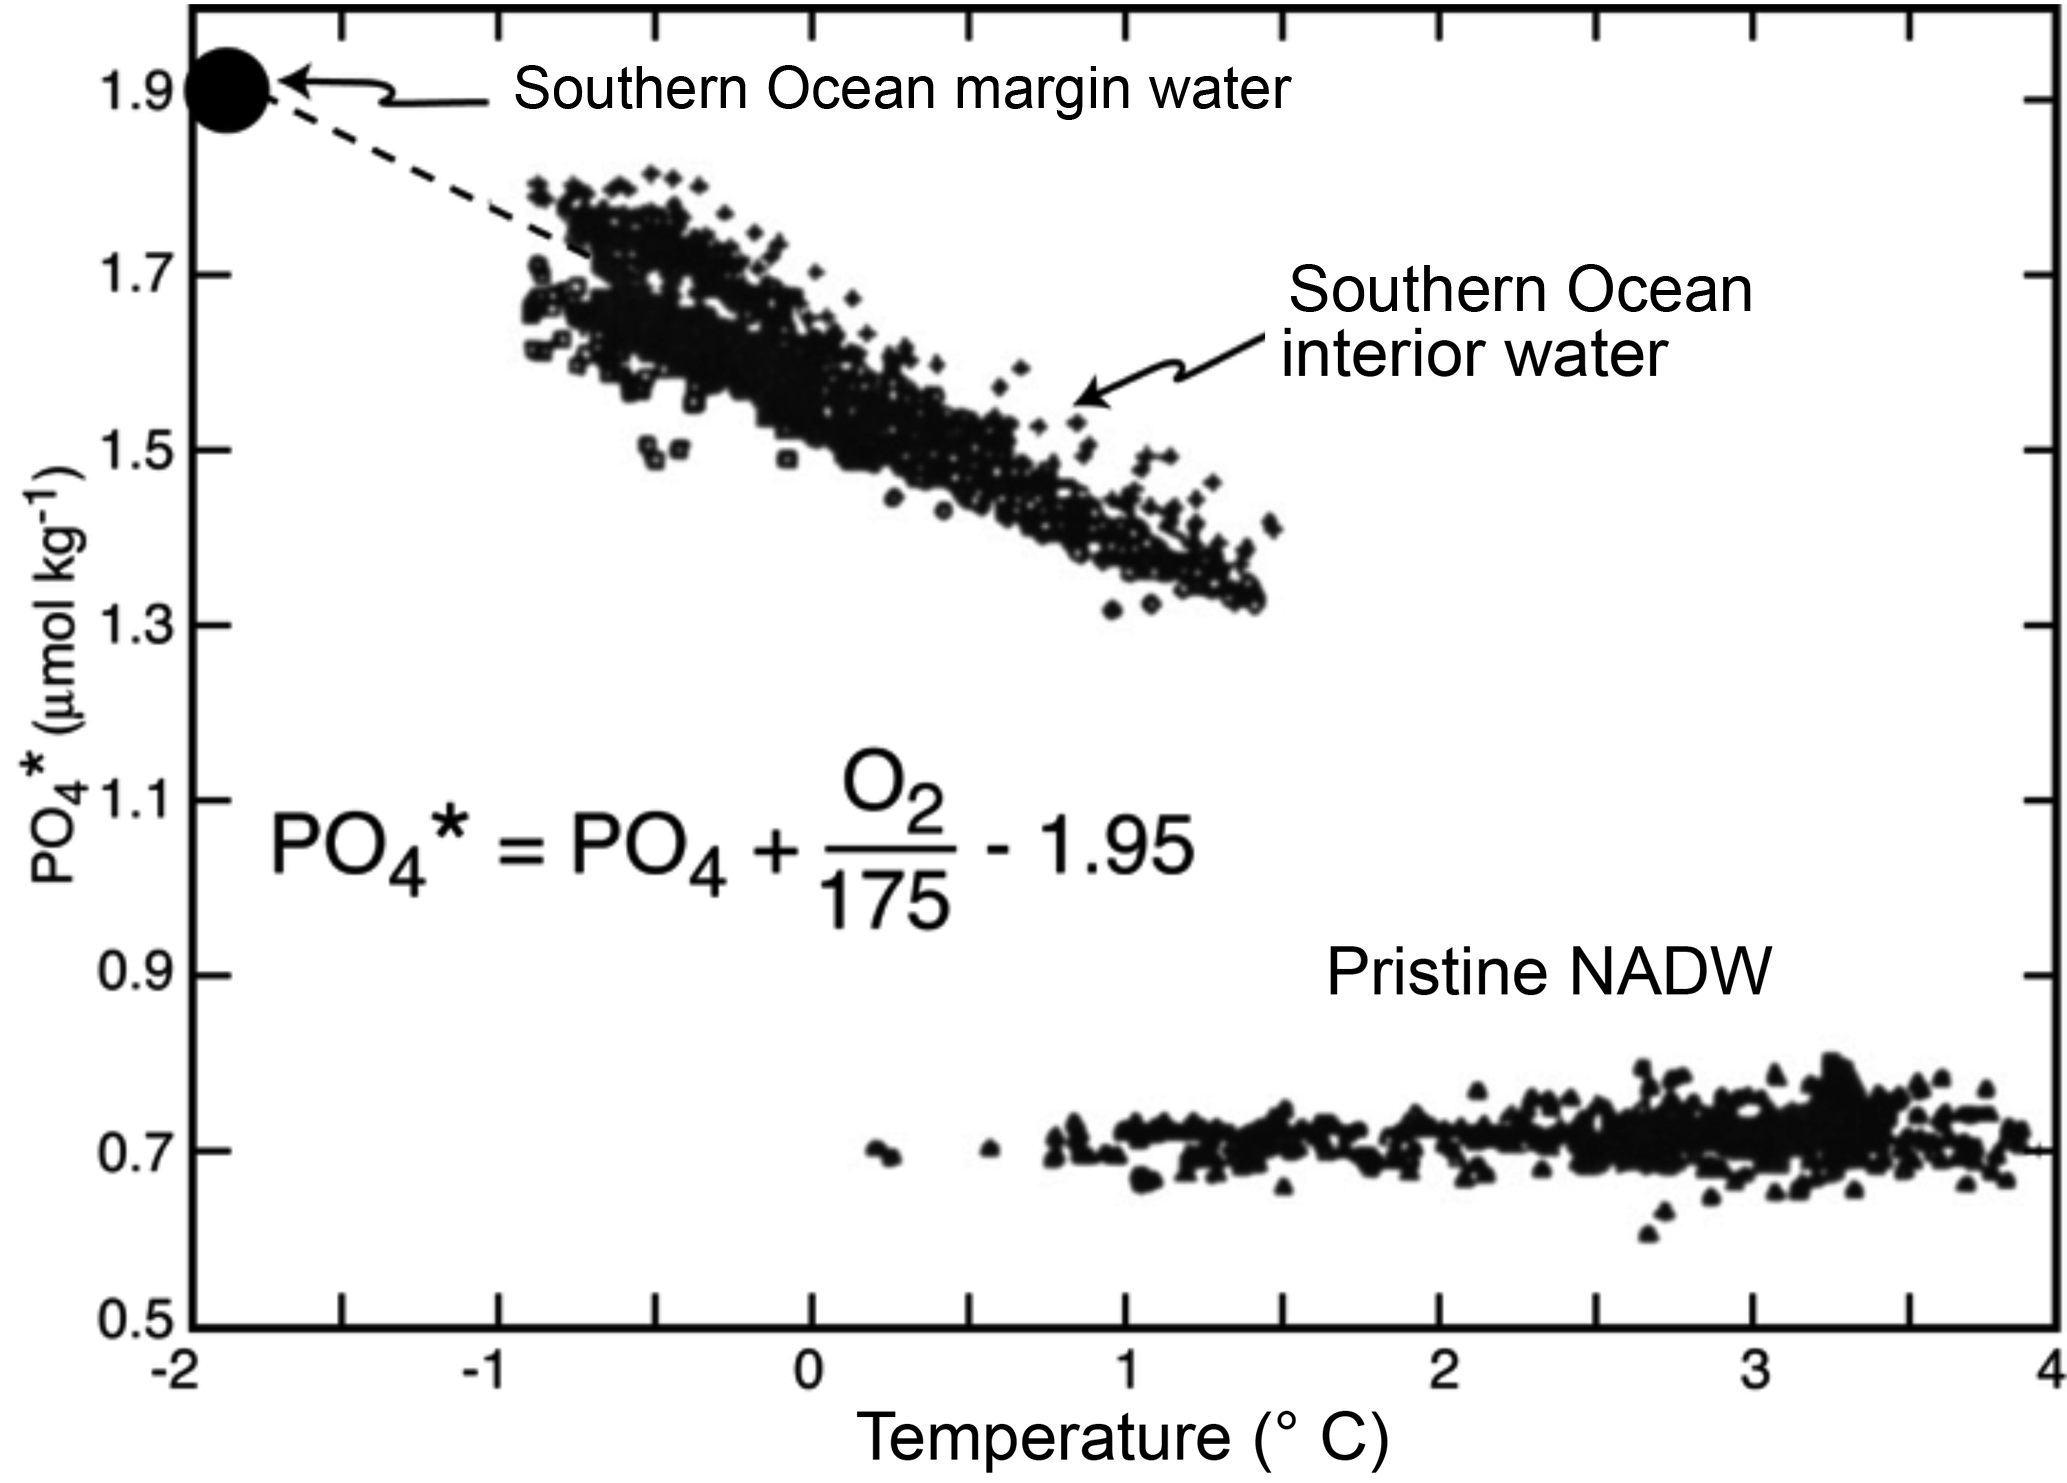
Figure 1Plots of versus potential temperature for water formed in the northern Atlantic and in the Southern Ocean (based on measurements made as part of the GEOSECS expeditions). Note that all contributors of NADW have values within the measurement error of 0.75 µmol kg−1. The Southern Ocean was originally obtained by extrapolating the observed – temperature trend to sea water's freezing point (Table 1). As shown in Figs. 3 and 4, this extrapolated value is consistent with values observed close to the Antarctic margin in the Weddell Sea.
Based on , Broecker et al. (1998) concluded that the deep Pacific and Indian oceans received about half of their water from the northern Atlantic and half from the Southern Ocean. However, Johnson (2008), Gebbie and Huybers (2010), DeVries and Primeau (2011), and Khatiwala et al. (2012), using more complex inversions of multiple tracers and model–data synthesis, concluded that only about one-quarter of this water came from the northern Atlantic.
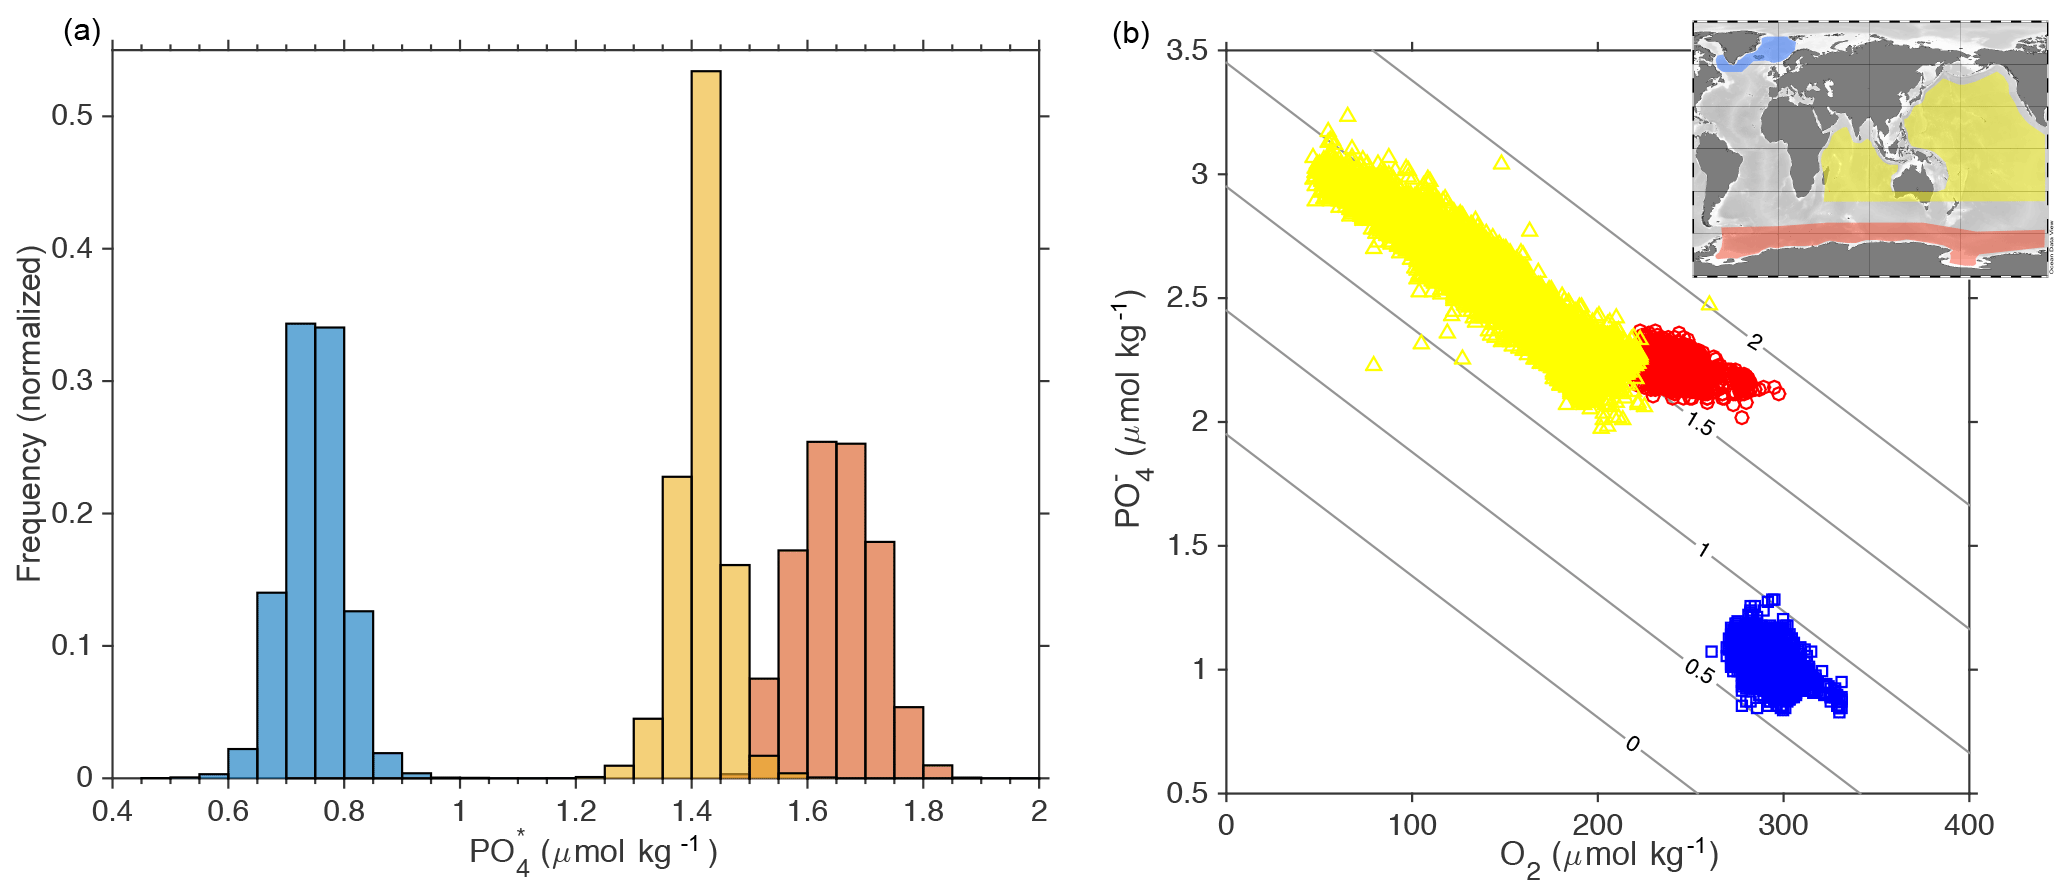
Figure 2End member values for deep North Atlantic waters (blue) and deep Southern Ocean waters (red), along with deep Indo-Pacific waters (yellow). Data are from GLODAPv2 (Key et al., 2015; Olsen et al., 2016) and taken from the regions shown in the inset map. North Atlantic data are > 1500 m and have CFC-11 > 0.5 pmol kg−1; Southern Ocean data are > 1500 m, have CFC-11 > 0.5 pmol kg−1, and neutral density > 28.3 kg m−3 (see Fig. 4); Indo-Pacific data are > 2000 m. Normalized histograms of are shown for each region in panel (a), and the corresponding O2 and PO4 concentrations in (b), contoured with .
Here we attempt to resolve this discrepancy by re-examining the -based approach. We show that much of the mismatch may be resolved by consideration of what “counts” as southern-sourced water. Crucial to this discussion is the extent to which deep waters acquire their tracer signatures by ventilation in the surface ocean or by entrainment during descent. Our discussion is focussed on the volumetric contribution of northern and southern water masses to the deep Indo-Pacific, rather than water fluxes. Flux information – for tracers or for parcels of water – must be informed by estimates of residence time or formation rates, and we briefly discuss the potential of radiocarbon and chlorofluorocarbons (CFCs) to provide such information.
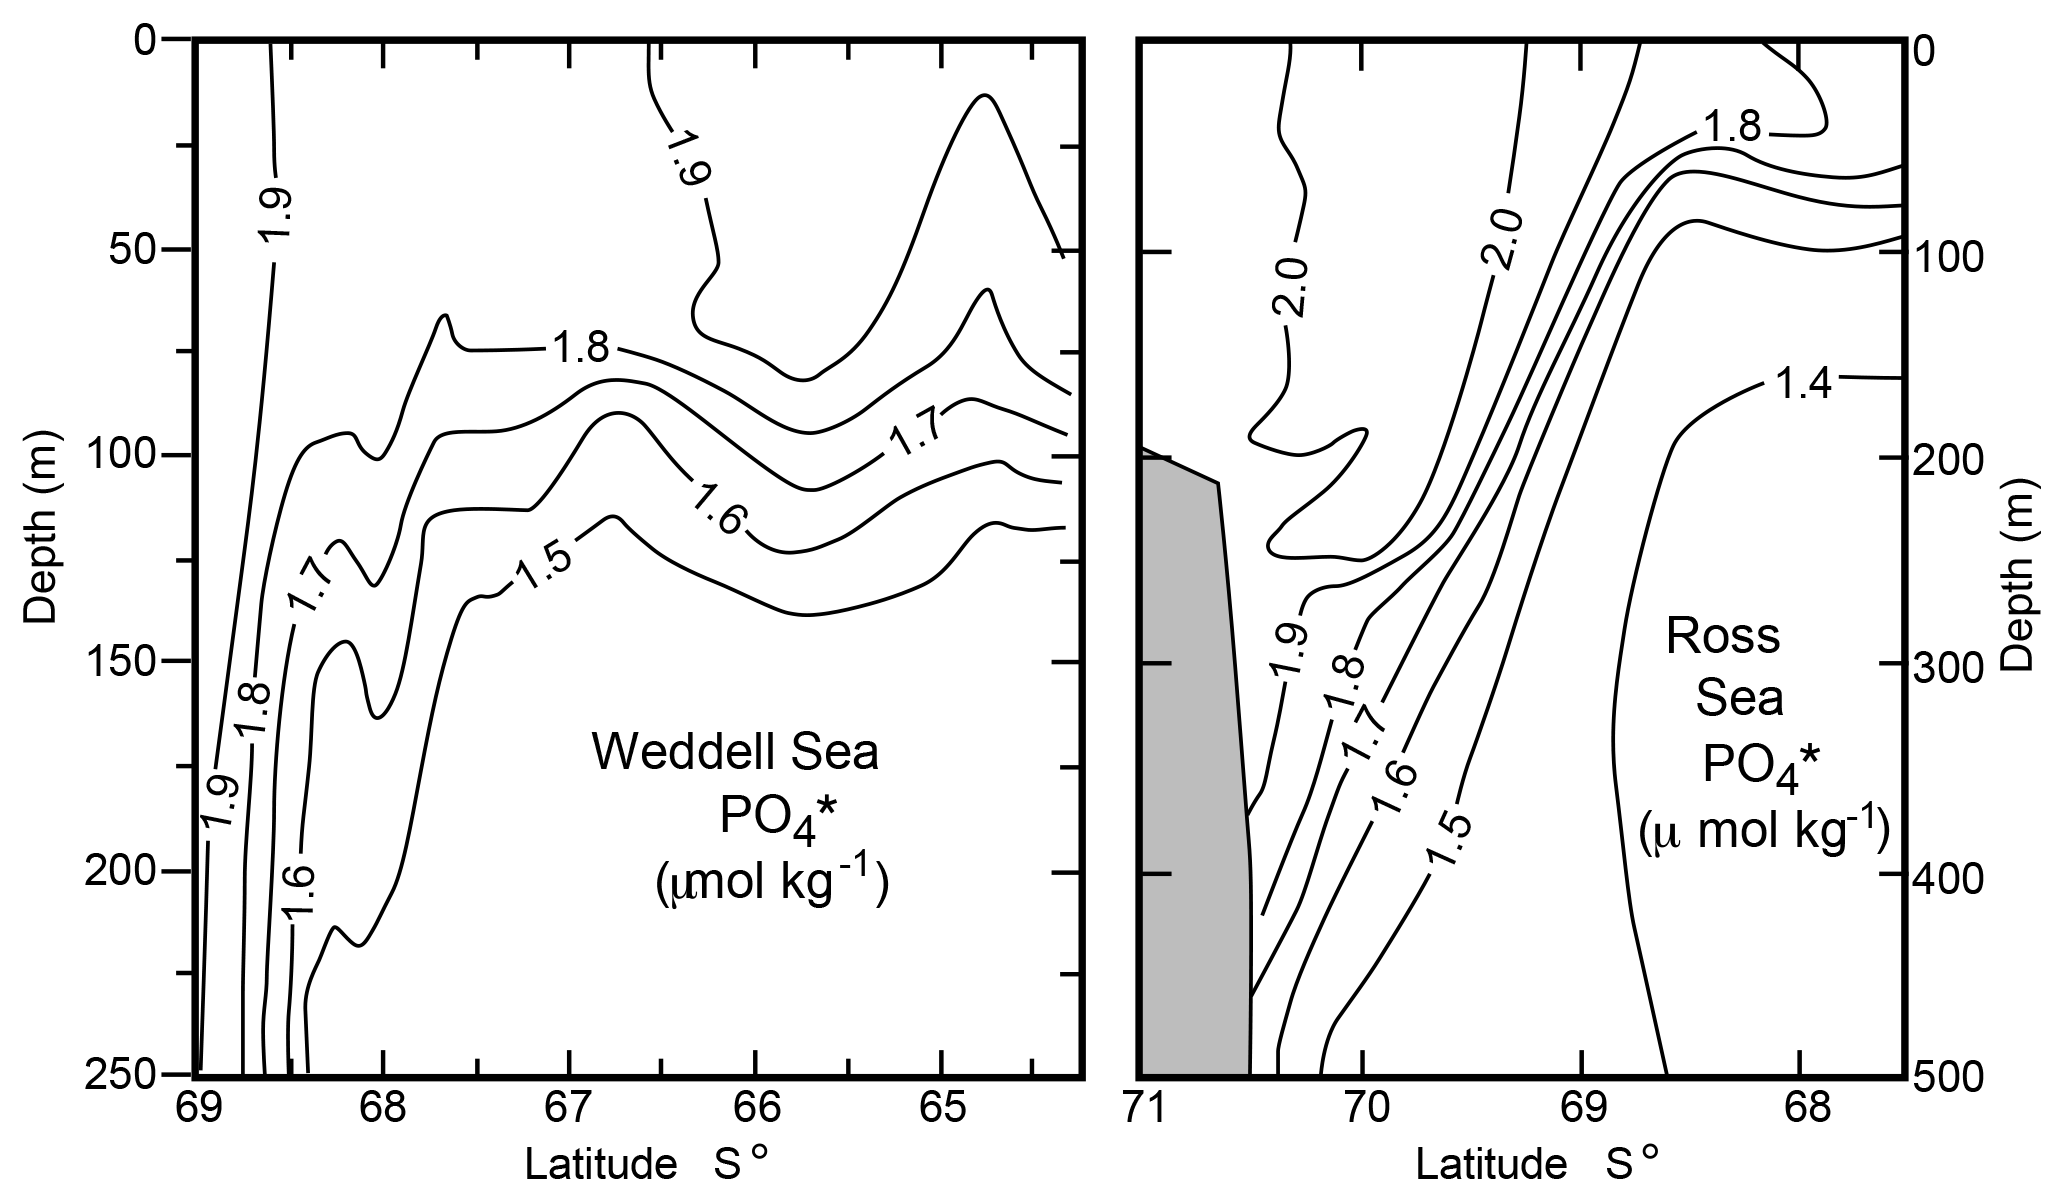
Figure 3 sections extending out from the Antarctic continent for the Weddell and Ross Seas. As can be seen, water with a value close to 1.95 is descending in a narrow margin-hugging plume.
Based on the GLODAPv2 dataset (Key et al., 2015; Olsen et al., 2016) we have re-examined deep ocean distributions. The mean value for deep (> 2000 m) Indo-Pacific waters (Fig. 2) is 1.42 ± 0.04 (1 SD). We select waters below 2000 m as all determinations (Johnson, 2008; Gebbie and Huybers, 2010; Khatiwala et al., 2012) suggest that these depths are predominantly a two-component mixture of deep North Atlantic and Southern Ocean waters. To help identify recently ventilated dense waters we also examined CFC-11 and neutral density. The mean value for deep (> 1500 m) recently ventilated (CFC-11 > 0.5 pmol kg−1) waters in the North Atlantic (Fig. 2) is 0.74 ± 0.05. These Indo-Pacific and Atlantic end members are within error of the values of Broecker et al. (1998) (1.39 and 0.73 respectively) and are relatively insensitive to choice of geographical boundaries, depth, CFC, and density limits.
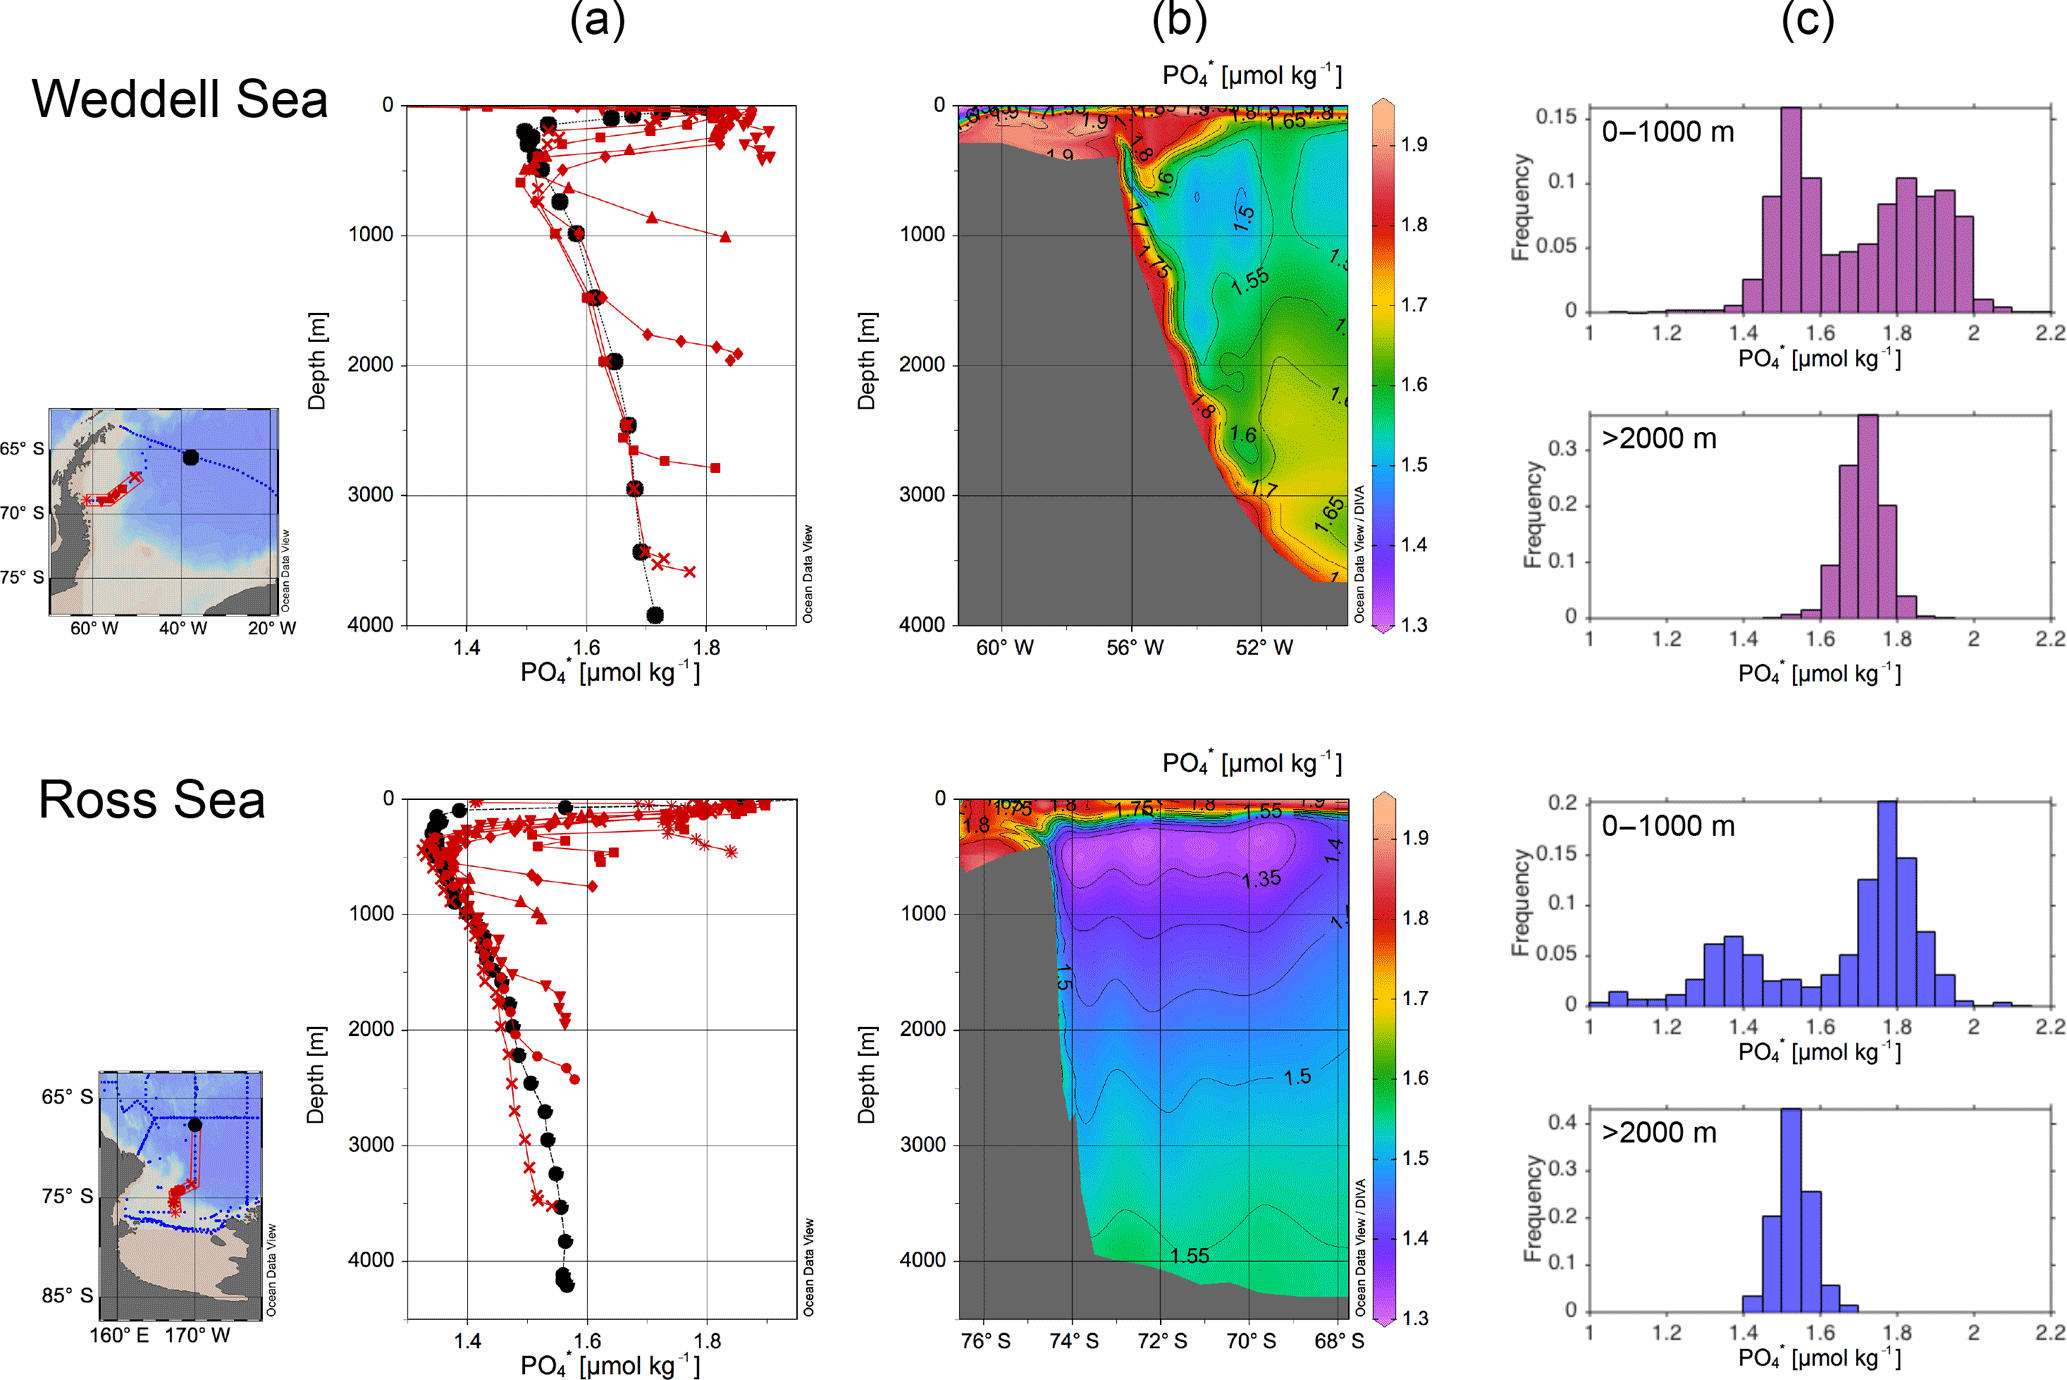
Figure 4 data in the Weddell and Ross Seas from the GLODAPv2 database. Sections in (b) show high values on the shelves that descend the continental margin in a narrow plume (Warren, 1981). This is also picked out by selected depth profiles along these sections in (a), with the black dots showing a profile further out from the shelf edge. Entrainment of low- waters in the subsurface reduces southern deep water , from 1.95 on the shelf to ∼ 1.65 at depth. This can also be seen in the histograms in (c) (encompassing larger areas than those shown in the maps and sections), which show two distinct populations in the top 1000 m, which mix to give the more homogenous values at depth. Note that Weddell Sea waters have higher than Ross Sea waters, likely due to less influence of low- NADW and higher local deep water formation rates, elevating throughout this more enclosed basin. Data are from GLODAPv2 (Key et al., 2015; Olsen et al., 2016) with profiles, maps, and sections plotted in ODV (Schlitzer, 2015), with sections contoured using isopycnic gridding.
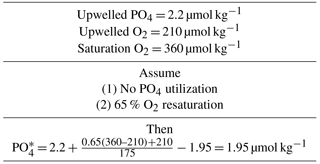
Determining the end member of Southern Ocean deep waters is less straightforward. Broecker et al. (1998) use a value of 1.95. This value was obtained both by extrapolating the –Θ relationship to the freezing point of sea water (Fig. 1) and from direct observations of sinking surface waters in the Weddell and Ross Seas (Fig. 3). The 1.95 value is achieved if water upwelling in the Southern Ocean is cooled to the freezing point, has about 65 % of its O2 deficiency replenished, and loses little of its PO4 to sinking organics (see Table 1).
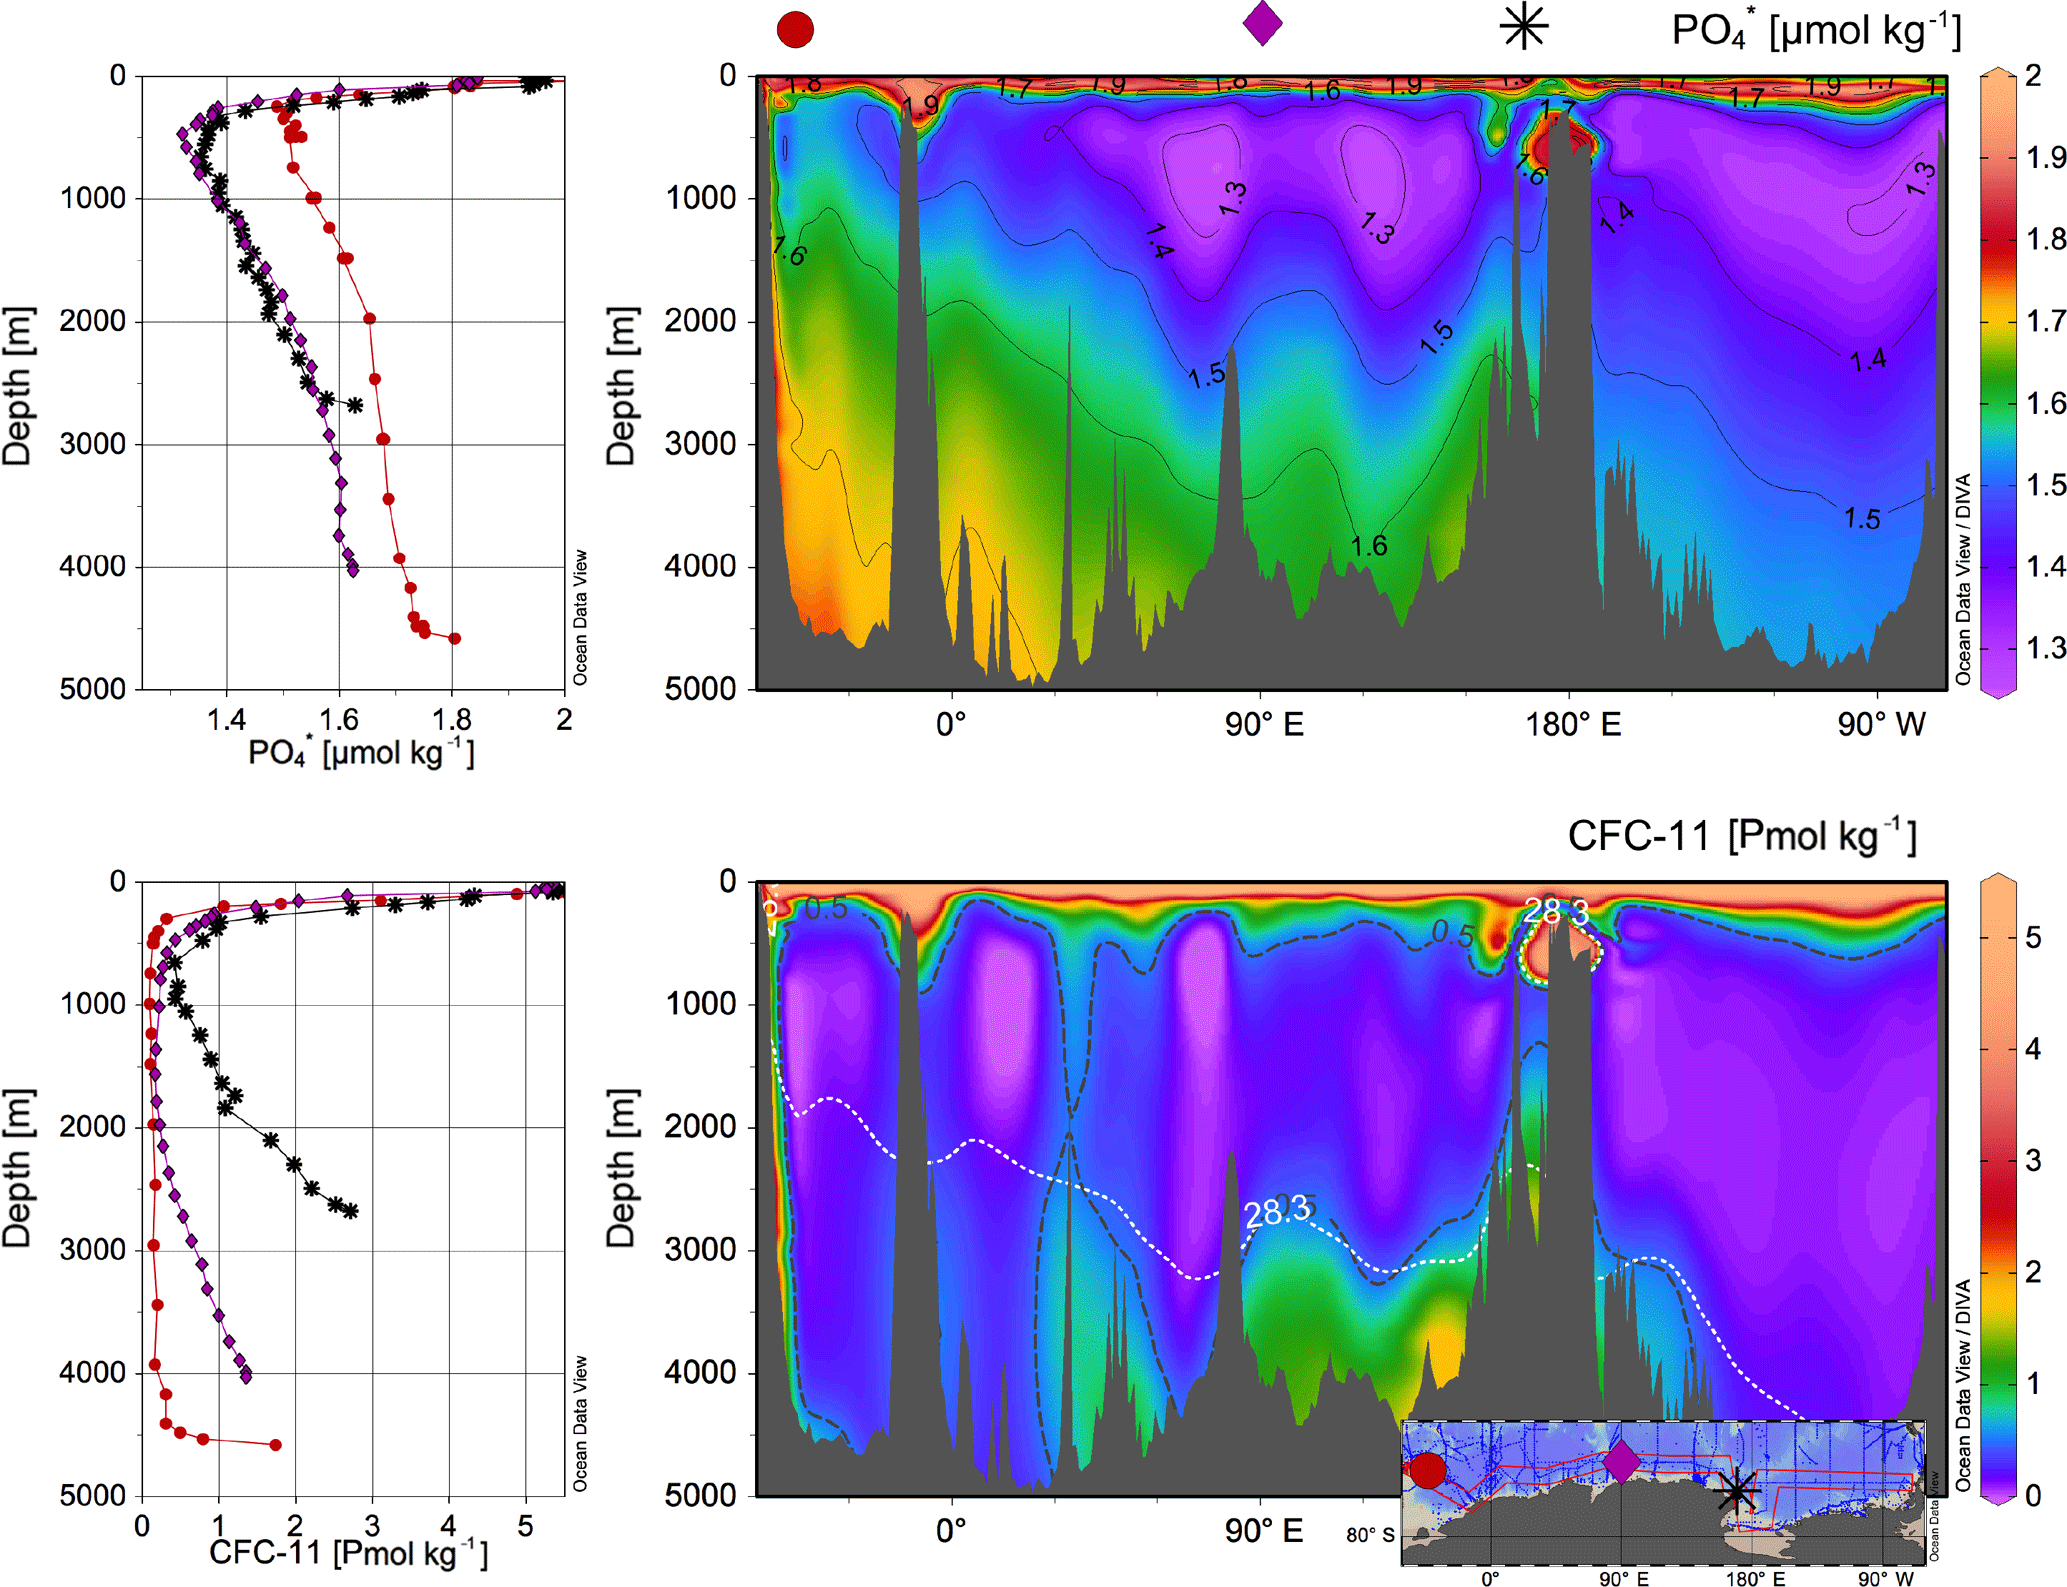
Figure 5Circum-Antarctic sections of and CFC-11 through the southern portion of the Southern Ocean. The locations of the profiles in the left-hand panel are illustrated with symbols and shown in the inset map: the red circles are from the Weddell Sea, the purple diamonds from the Antarctic margin in the Indian sector, and the black stars from the northern margin of the Ross Sea. In the CFC section the black dashed line indicates CFC-11 concentrations > 0.5 pmol kg−1 and the white dotted line indicates neutral densities > 28.3 kg m−3; these criteria, along with depth > 1500 m, are used to define the alternative deep Southern Ocean end member. Data are from GLODAPv2 (Key et al., 2015; Olsen et al., 2016) with profiles, maps, and sections plotted in ODV (Schlitzer, 2015), with sections contoured using isopycnic gridding.
However, while values of 1.95 characterize well-ventilated Antarctic shelf waters, these entrain up to 3 times their volume in circumpolar deep water as they cascade down the continental slope (Carmack and Foster, 1975; Orsi et al., 1999); indeed beautifully highlights this process (Fig. 4). As a result, by the time Antarctic bottom water enters the Antarctic Circumpolar Current (ACC) it has much lower : Weddell Sea bottom waters have of ∼ 1.8, and deep Ross Sea waters ∼ 1.6 (Figs. 3 and 4). This basinal difference may be attributed to less input of NADW-influenced circumpolar deep water and higher local ventilation rates in the Weddell Sea, elevating in this more enclosed basin. The average circumpolar for recently ventilated (CFC-11 > 0.5 pmol kg−1) waters that have made it off the Antarctic shelf (> 1500 m) and have neutral density higher than any North Atlantic waters (> 28.3 kg m−3) is 1.64 ± 0.07 (1 SD; Figs. 4 and 5).
Repeating the mass balance calculation of Broecker et al. (1998) with the Southern Ocean bottom water value of 1.64 suggests that the deep Indo-Pacific is filled by 75 % southern-sourced water and 25 % NADW, with an uncertainty of ±9 % (1 SD). This is within error of the values obtained by Johnson (2008), Gebbie and Huybers (2010), and Khatiwala et al. (2012). However if we use the well-ventilated shelf water value of 1.95, the north–south balance is closer to 50–50 (Broecker et al., 1998). This illustrates that while the volume of what are typically considered southern deep waters in the Indo-Pacific may substantially outweigh that of NADW, much of this water is entrained in the subsurface and does not reflect full Southern Ocean ventilation. Note that while sinking waters in the North Atlantic also entrain surrounding waters on descent, these are of recent northern origin. Entrainment in the North Atlantic thus does not substantially influence the signature of NADW nor the inference that this water is fully ventilated in the North Atlantic.
Differences in the extent to which the Southern Ocean end member is locally ventilated may thus explain much of the difference between the north–south balance obtained by Broecker et al. (1998) versus Johnson (2008), Gebbie and Huybers (2010), and Khatiwala et al. (2012). Johnson (2008) uses bottom water end member values for AABW, so it is unsurprising that our estimates using a Southern Ocean bottom water value are similar to his. Gebbie and Huybers (2010) and Khatiwala et al. (2012) use surface mixed layer conditions south of the ACC (Orsi et al., 1995), taken from gridded climatologies (WOA: Conkright et al., 1994; WOCE: Gouretski and Koltermann, 2004). As discussed by Gebbie and Huybers (2010), gridded data struggle to capture shelf features and dense overflow waters, and may thus miss some of the end member values characteristic of the ventilated Southern Ocean interior (Warren, 1981). More crucially, high adiabatic upwelling rates (Toggweiler and Samuels, 1995; Marshall and Speer, 2012) and deep mixed layers (Gordon and Huber 1990; Dong et al., 2008) may also lead to inclusion of upwelled northern waters in these Southern end members, despite little property modification in the Southern Ocean surface. These issues may explain why the southern proportions of Gebbie and Huybers (2010) and Khatiwala et al. (2012) are larger than those using the ventilated end member (as in Broecker et al., 1998) and lie close to our estimates using bottom water values.
Note that we do not wish to imply that Antarctic shelf water is necessarily the most appropriate or only component to characterize ventilated Southern Ocean waters. As pointed out by Johnson (2008), shelf waters may have too unique a set of tracer properties to usefully capture the range of Southern Ocean water mass characteristics mixed into the deep Indo-Pacific. Furthermore while a 50–50 mixture between NADW and Antarctic shelf waters can produce the signature of deep Indo-Pacific waters, it gives too high a salinity, so more southern-sourced water is required. Processes besides shelf water formation may also help ventilate deep southern-sourced waters, such as deep winter mixing in the open Southern Ocean (Gordon and Huber, 1990; Dong et al., 2008) and exchange along steeply dipping isopycnals in the Antarctic Circumpolar Current (Abernathy and Ferreira, 2015).
The key issue that we aim to bring awareness to is discussion of what “counts” as ventilated Southern water. Implicit in the Gebbie and Huybers (2010) and Khatiwala et al. (2012) studies is that any waters reaching the Southern Ocean mixed layer may be considered Southern Ocean waters. However, these waters may experience little equilibration with Antarctic surface conditions, including cooling, gas exchange, and nutrient use, depending on their transit time through the Southern Ocean surface and the relaxation time of the tracer of interest. Therefore while they may count in the inventory of water volume entering the deep Indo-Pacific from the Southern Ocean (Talley, 2013; Marshall and Speer, 2012; Lumpkin and Speer, 2007), they may only partially reflect the exchanges of heat and CO2 key to the Southern Ocean's role in climate (Stocker and Johnsen, 2003; Marinov et al., 2006; Barker et al., 2009; Sigman et al., 2010; Ferrari et al., 2014).
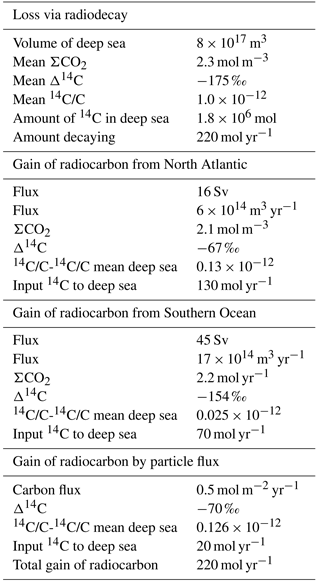
The difference between Southern Ocean water mass volume and tracer ventilation is particularly pronounced in the deep radiocarbon budget. Of the 220 mol yr−1 of 14C undergoing radiodecay in the deep sea, about 20 mol yr−1 is resupplied by particle rain. As NADW supplies about 130 mol 14C yr−1, this leaves about 70 mol 14C yr−1 to be supplied from the Southern Ocean (see Table 2). Ventilation of radiocarbon is thus dominated by the North Atlantic, even if the Southern Ocean contributes greater volume. This is due to 14C's long equilibration time and the limited exchange time between Southern Ocean surface waters and the atmosphere. Waters upwelled into the Southern Ocean surface thus do not reach equilibrium for 14C and radiocarbon gradients between surface and deep waters are very small (Broecker et al., 1985b). This, along with the presence of 14C produced by H-bomb testing, also introduces large uncertainty into any attempt to use radiocarbon to quantify the contribution of Southern Ocean waters to the deep Indo-Pacific. The importance of northern versus southern ventilation may thus depend on the tracer and process of interest.
Further insights into Southern Ocean ventilation may be obtained using CFC data, which also offer the potential to constrain flux information. As with 14C, the degree of surface water saturation (Schlosser et al., 1991) must be carefully considered if the input flux of CFC tracer is to be converted to a ventilation flux for southern ocean water volume (England, 1995). However CFCs have the advantages over 14C of a much larger surface to deep gradient and faster and less complicated equilibration. CFC-based estimates of the flux of ventilated Southern Ocean water give values of ∼ 15 Sv (Orsi et al., 2002; Schlitzer, 2007). This is similar to values for net production of NADW (Broecker et al., 1998; Ganachaud and Wunsch, 2000; Smethie and Fine, 2001), so it appears to support roughly equal ventilation of the deep ocean by the northern Atlantic and the Southern Ocean (Broecker et al., 1998; Peacock et al., 2000; Orsi et al., 2001). However this does not rule out a much higher water flux from the south (Sloyan and Rintoul, 2001; Lumpkin and Speer, 2007; Talley, 2013) – just not full equilibrium with Southern Ocean surface conditions. Furthermore some of the ∼ 16 Sv of NADW may be lost to mixing or entrainment into Antarctic Intermediate or Bottom Waters (Primeau and Holzer, 2006), so the ventilation flux into the deep Indo-Pacific is likely still weighted towards the South. We also note that if diffusion down isopycnals in the open Southern Ocean is an important contributor to regional ventilation (Abernathy and Ferreira, 2015), this may not be as easily picked up as the CFC signal in shelf waters (Fig. 5). The reason is that low CFC-11 concentrations in a large volume may match high CFC-11 concentrations in a small volume. Finally, even if the fluxes of northern and southern-sourced waters into the deep Indo-Pacific are similar, it is possible for southern-sourced waters to form a larger volumetric contribution if they have a longer residence time (Johnson, 2008), which is quite plausible given their injection onto deeper density surfaces.
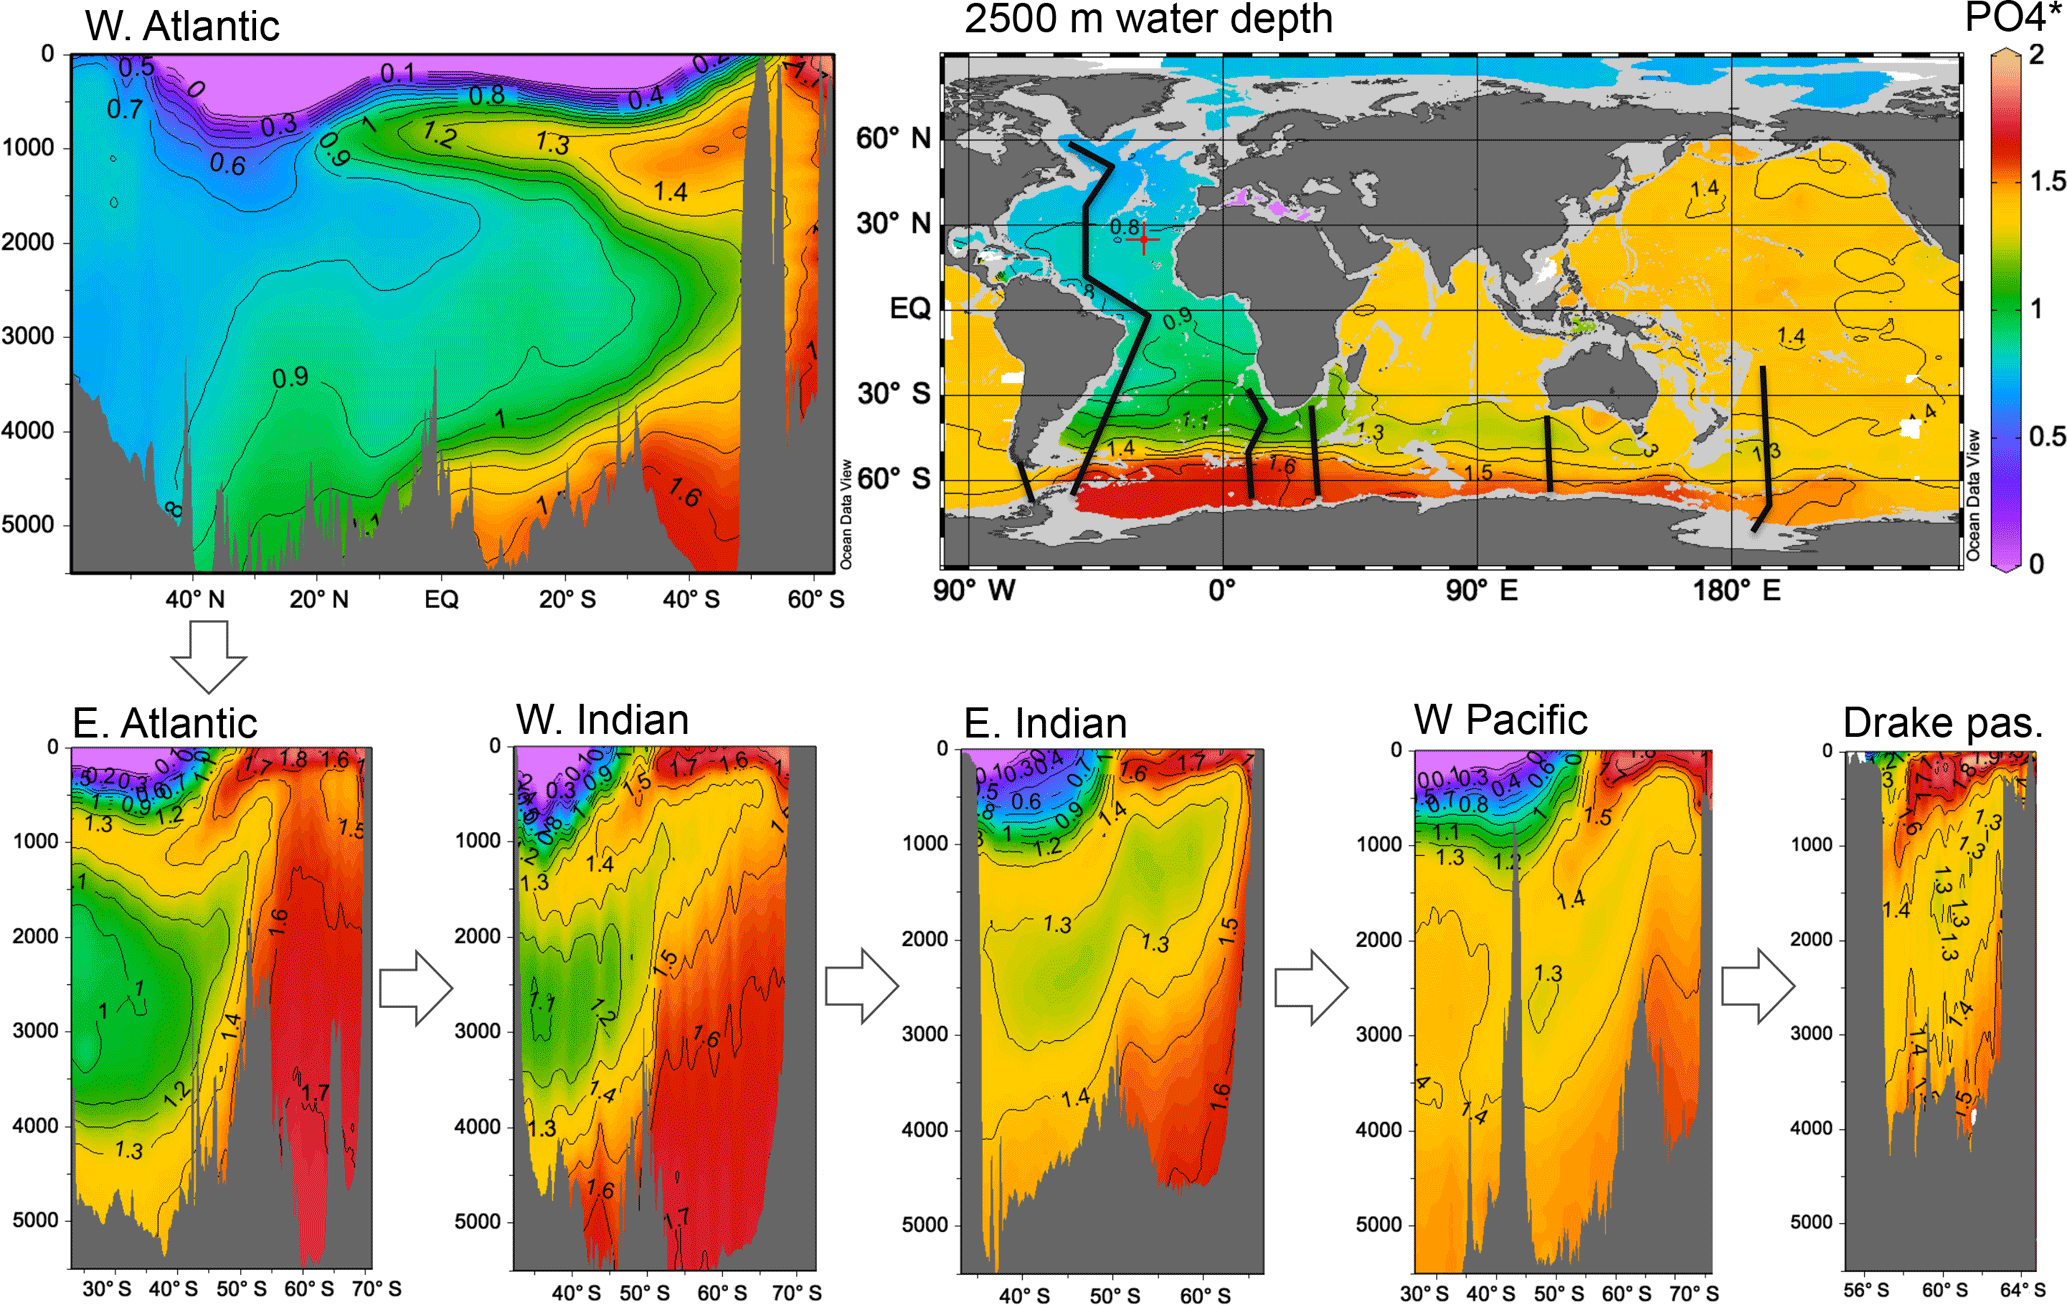
Figure 6 sections for the western Atlantic and for a series of quadrants of the Southern Ocean. Low- waters entering the Southern Ocean from the Atlantic and the high- waters generated in the Southern Ocean are blended in the Antarctic Circumpolar Current, forming circumpolar deep water. However a high at the seafloor and low at ∼ 2000 m continue to trace the influence of AABW and NADW respectively. Data are from GLODAPv2 (Key et al., 2015; Olsen et al., 2016) with profiles, maps, and sections plotted in ODV (Schlitzer, 2015), with sections contoured using isopycnic gridding.
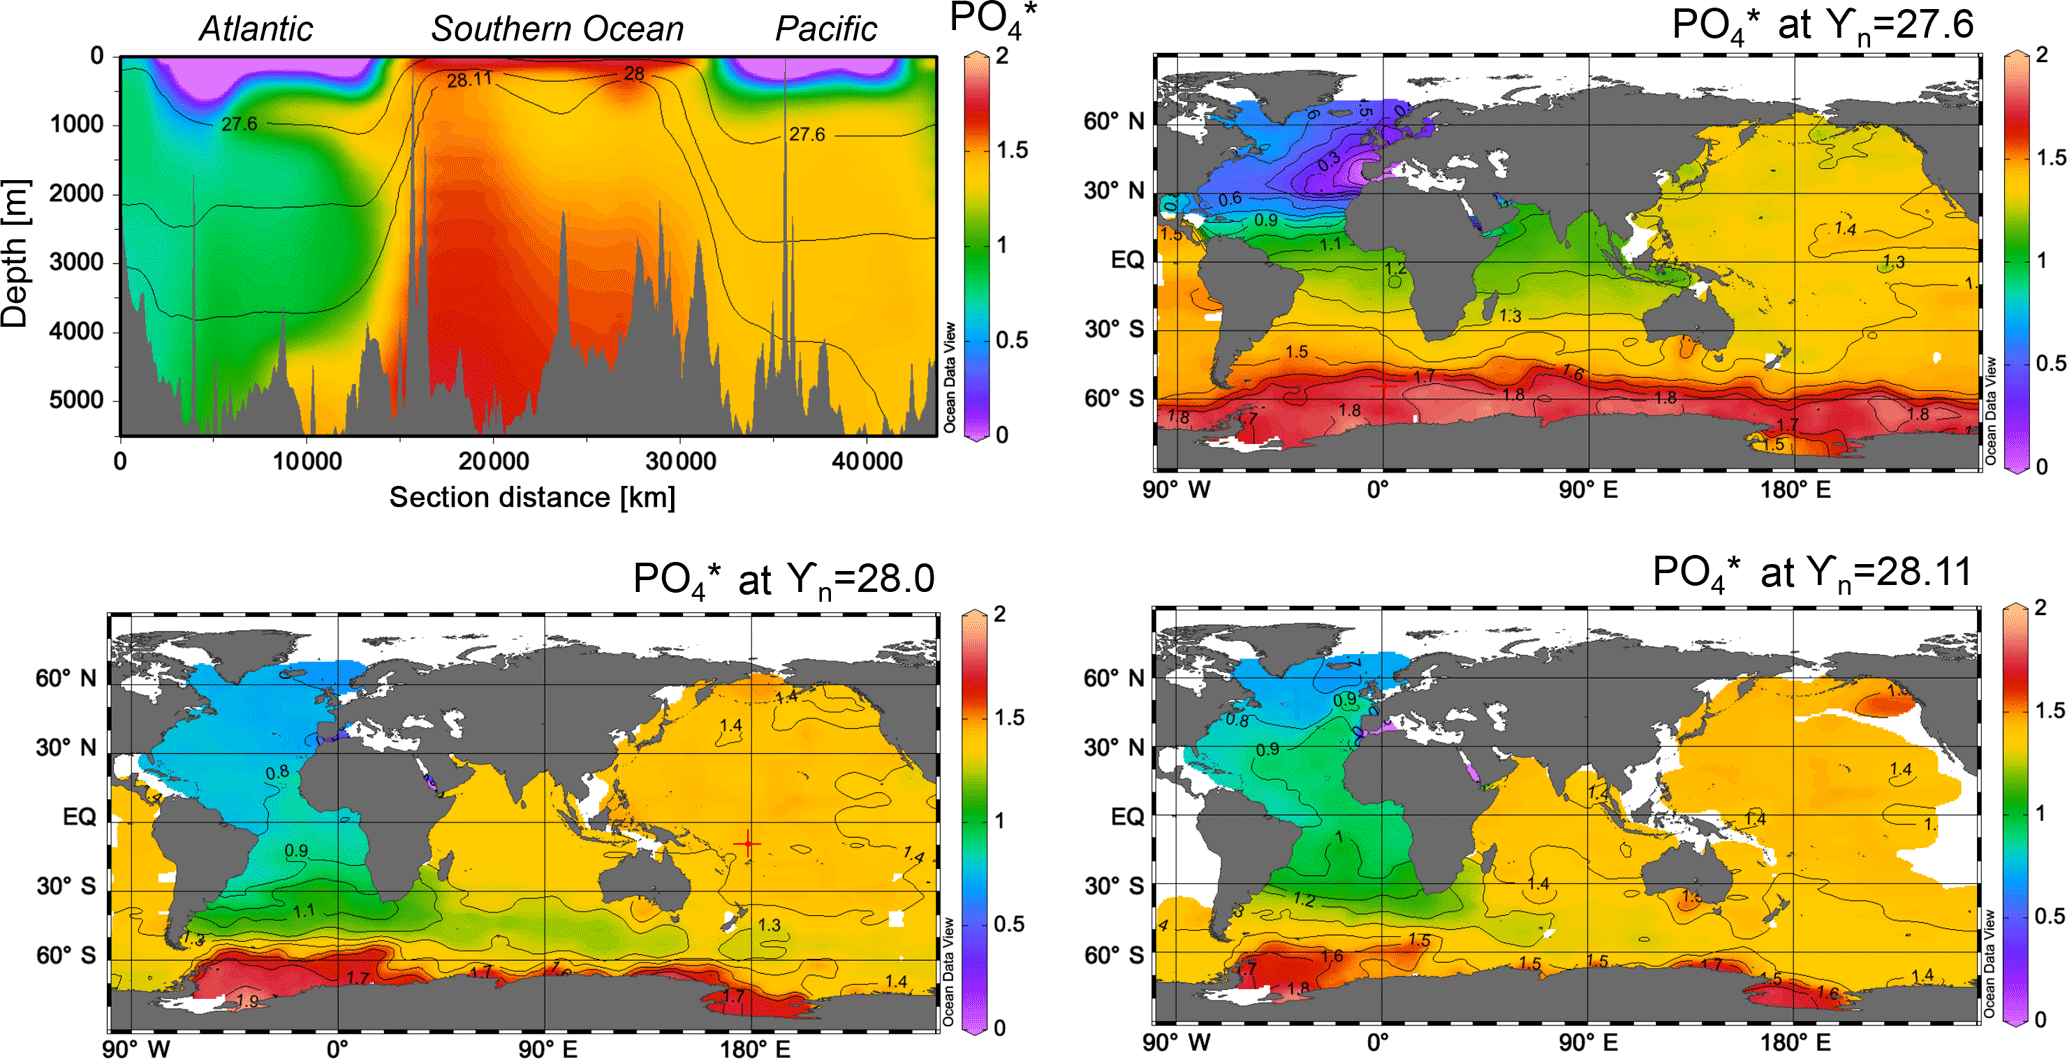
Figure 7 on a section through the Atlantic, Southern, and Pacific oceans and on the 27.6, 28.0, and 28.11 isopycnal horizons. The depths of these horizons are shown in the section. Mixing of low from the north and high from the south takes place along shared isopycnals, and also diapycnally in the Southern Ocean mixed layer and over rough bottom topography. Data are from GLODAPv2 (Key et al., 2015; Olsen et al., 2016) with profiles, maps, and sections plotted in ODV (Schlitzer, 2015).
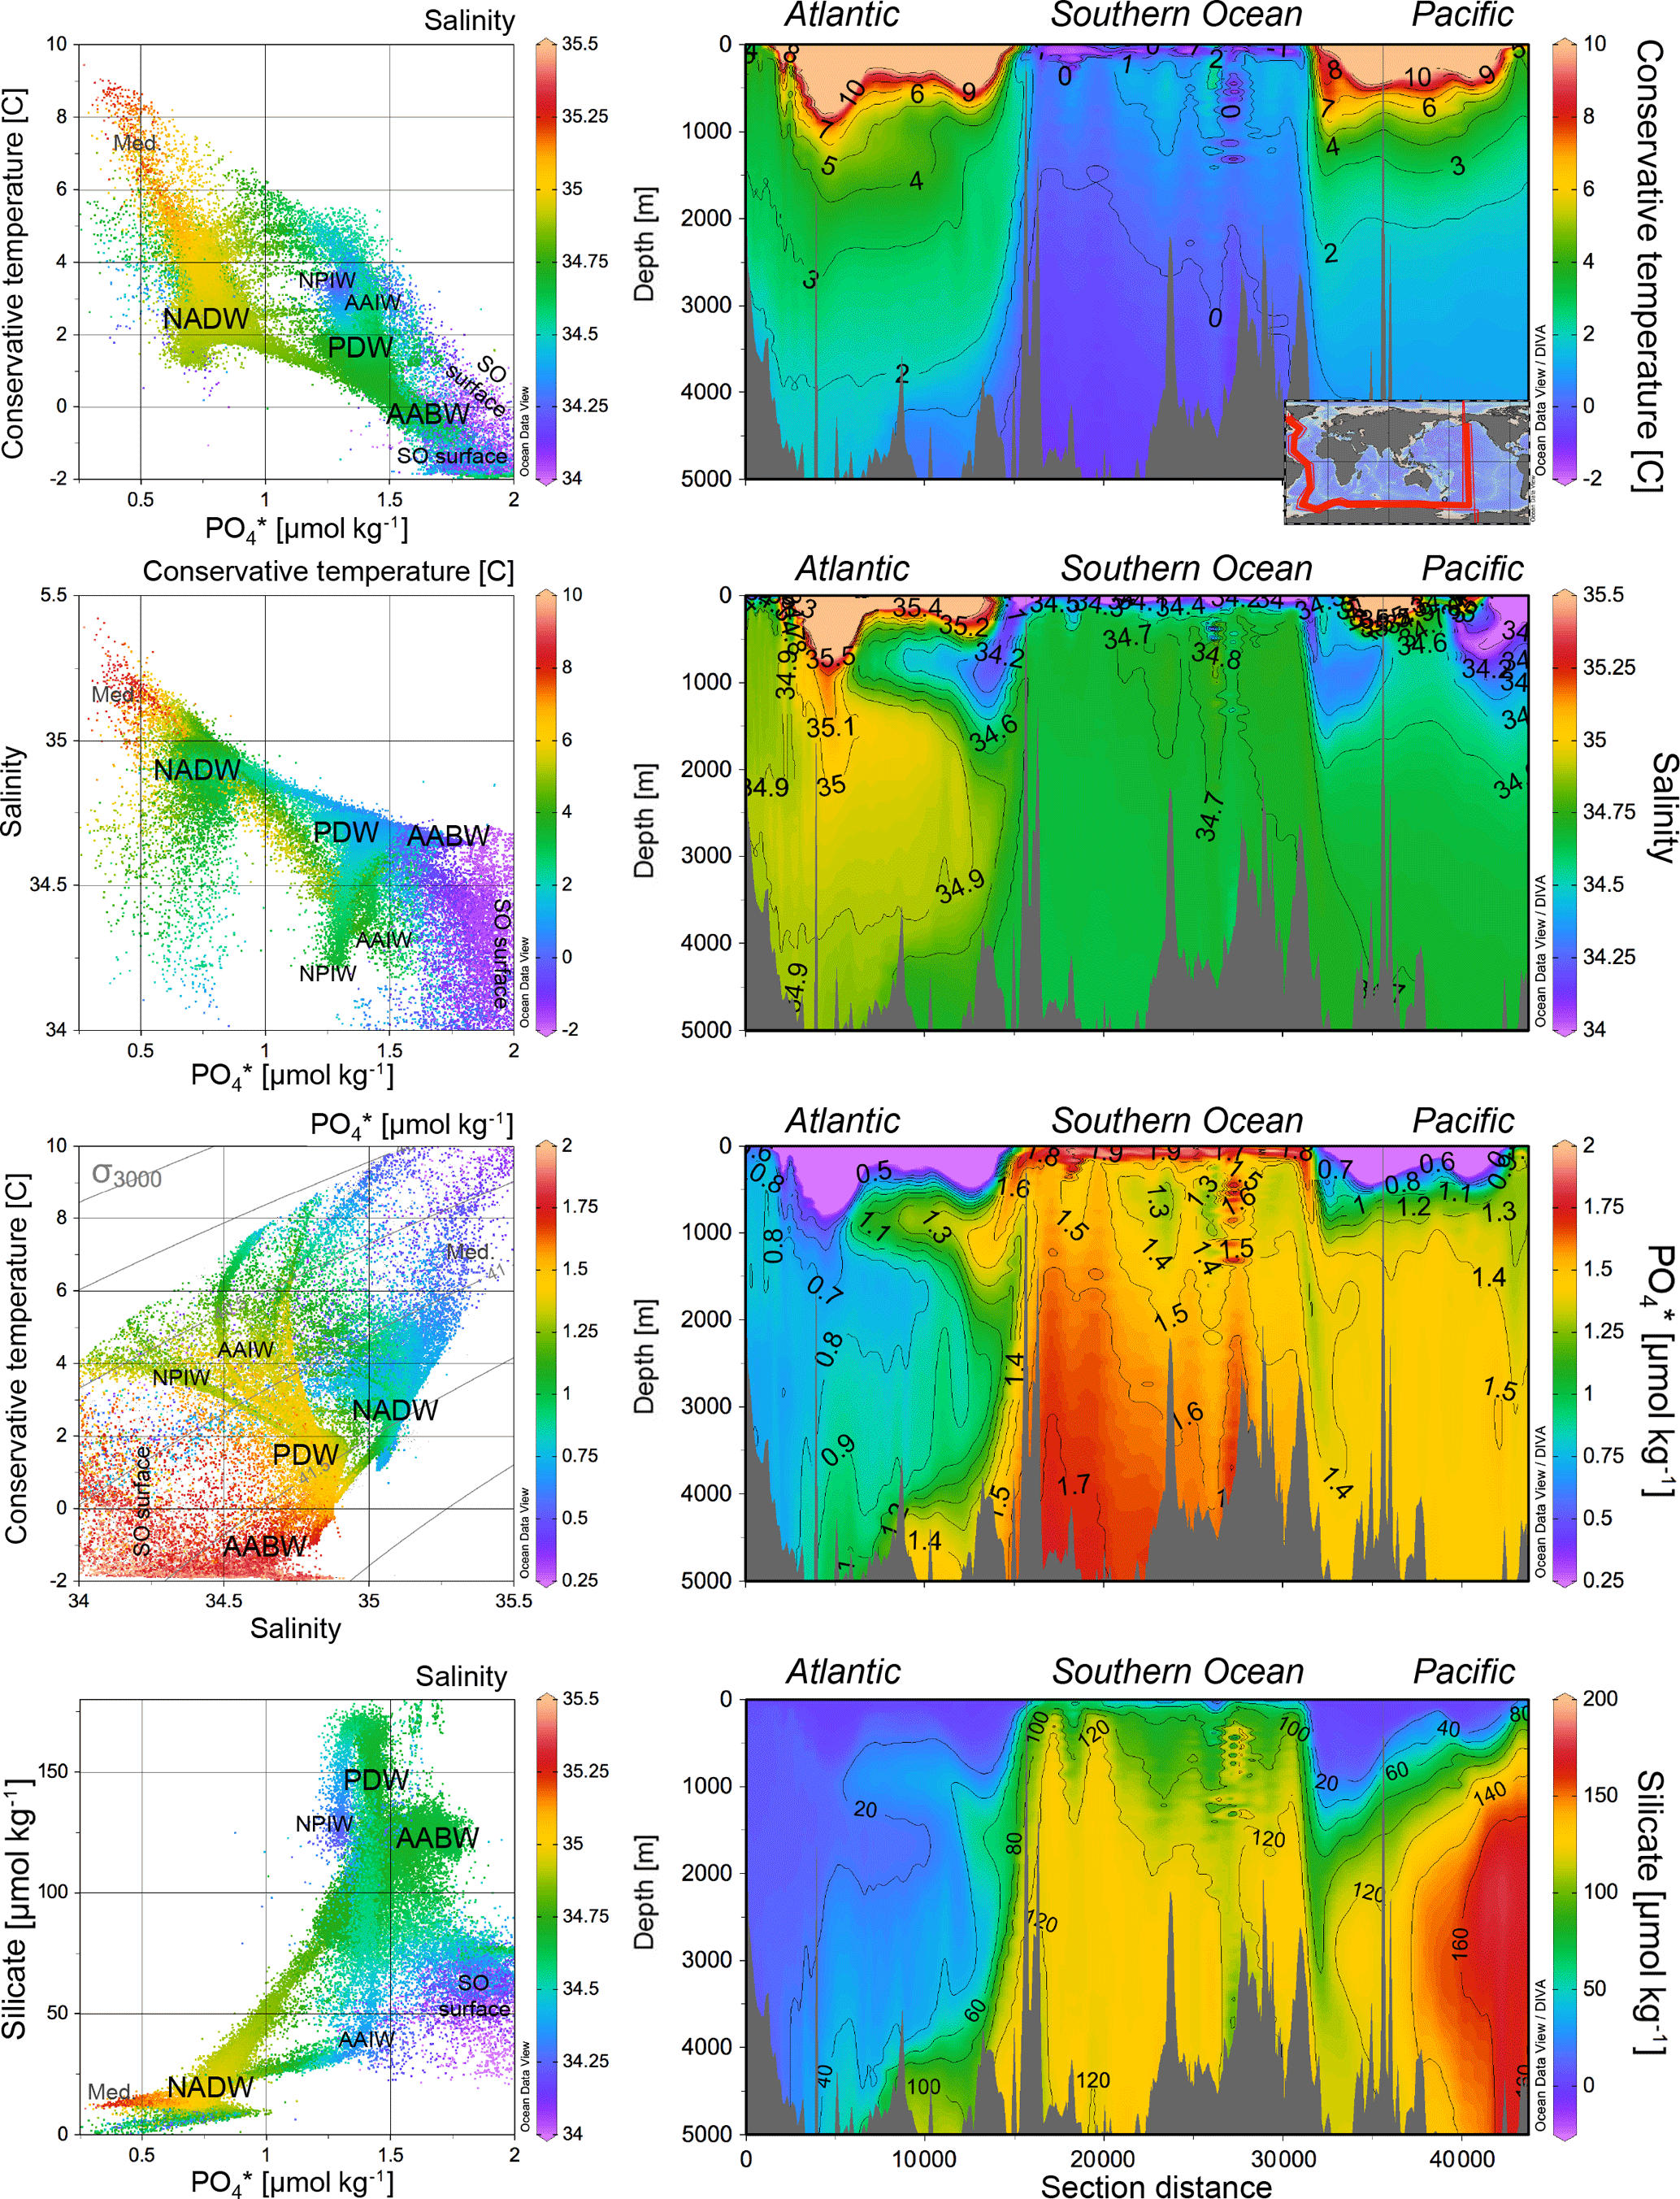
Figure 8A global hydrographic section for potential temperature, salinity, , and silicate. Cross plots show all the data in this section with neutral density greater than 27.2 kg m−3; the colours of the dots refer to the scale shown to the right of the cross plots. Data are from GLODAPv2 (Key et al., 2015; Olsen et al., 2016) with profiles, maps, and sections plotted in ODV (Schlitzer, 2015), with sections contoured using isopycnic gridding.
The large dynamic range of in the deep ocean makes it an effective tracer of the large scale circulation and mixing processes that make up the global overturning circulation. Its utility is highlighted by the sections, surfaces, and tracer–tracer plots in Figs. 6–8, supplementary Figs. A1–A6 in Appendix A, and the SOCCOM data product (Verdy and Mazloff, 2017). As can be seen, low- water from the North Atlantic mixes with high- water formed in the Southern Ocean. This mixing occurs along shared isopycnals in the ACC (Fig. 7; Abernathy and Ferreira, 2015), over rough seafloor topography (Naveira-Garabato et al., 2004; Roemmich et al., 2009), and in the deep surface mixed layer of the Southern Ocean (Gordon and Huber 1990; Dong et al., 2008). These mixing patterns are also well illustrated on cross plots of with salinity and potential temperature (Figs. 8 and A1–A3). NADW is identifiable as a salinity and maximum sandwiched between fresher and higher- southern waters above and below. Mixing between these northern and southern waters is well illustrated by the linear trends in the –salinity plot (Fig. 8). By the time circumpolar deep waters reach the Drake Passage, they have been somewhat homogenized, though a minimum at mid-depths remains, tracing the persistent influence of North Atlantic waters (Fig. 6).
Other features of interest that are well highlighted by include the input of very low- deep water from the Mediterranean Sea into mid-depths of the North Atlantic (Figs. 7 and A4); the penetration of relatively high- water with a strong southern influence into the deep NE Atlantic (Figs. 7, A1, A6); and the formation of mid-depth circumpolar deep waters represented by a maxima, slightly underlying the salinity minimum of Antarctic Intermediate Water (AAIW). Intermediate waters themselves are less readily identified by , forming in frontal regions with large nutrient gradients (Talley, 1993, 1996; Sarmiento et al., 2004) and are better traced by salinity (Figs. 8, A1–A3). Pacific deep waters returning through the Drake Passage are also hard to identify using , falling in the middle of a mixing gradient between northern and southern waters (Fig. 7), and are better identified by their low oxygen and high silicate (Figs. A3, A5, A6).
Alongside its use as a water mass tracer, may also provide complementary information on the carbon cycle. High- waters, such as those found in the Southern Ocean, are subducted with high preformed phosphate and high oxygen; this indicates inefficient operation of the biological carbon pump and extensive ocean–atmosphere gas exchange, allowing net loss of CO2 from the ocean to the atmosphere. is close in formulation to preformed phosphate (Ito and Follows, 2005) but differs in not accounting for changes in oxygen uptake as a function of temperature and salinity, as well as making no assumption of initial oxygen saturation. Nonetheless, the ease with which can be calculated makes it a useful qualitative measure of the carbon cycle in the surface ocean, complementing its more quantitative use as a conservative water mass tracer at depth.
The use of to constrain the northern and southern contributions to the waters in the deep Indian and Pacific oceans is highly dependent on the Southern Ocean end member value. Using end members characterizing ventilated Antarctic shelf waters versus Southern Ocean deep waters brackets the southern contribution to between 50 and 75 % respectively. There is value to both of these estimates: 75–25 may best characterize the ratio of deep Southern Ocean to North Atlantic water volume, while 50–50 may better represent the ratio of well-ventilated waters. In other words a large volume of the ocean's water experiences some degree of exposure to the Southern Ocean surface, but the volume of that taking on a more completely ventilated Southern Ocean signal is much smaller.
The data used in this paper are from GLODAPv2 (Key et al., 2015; Olsen et al., 2016), as formatted for use in Ocean Data View and publicly available at https://odv.awi.de/data/ocean/ (last access: 13 June 2018) and were largely analysed using the publicly available Ocean Data View software (Schlitzer, 2015).
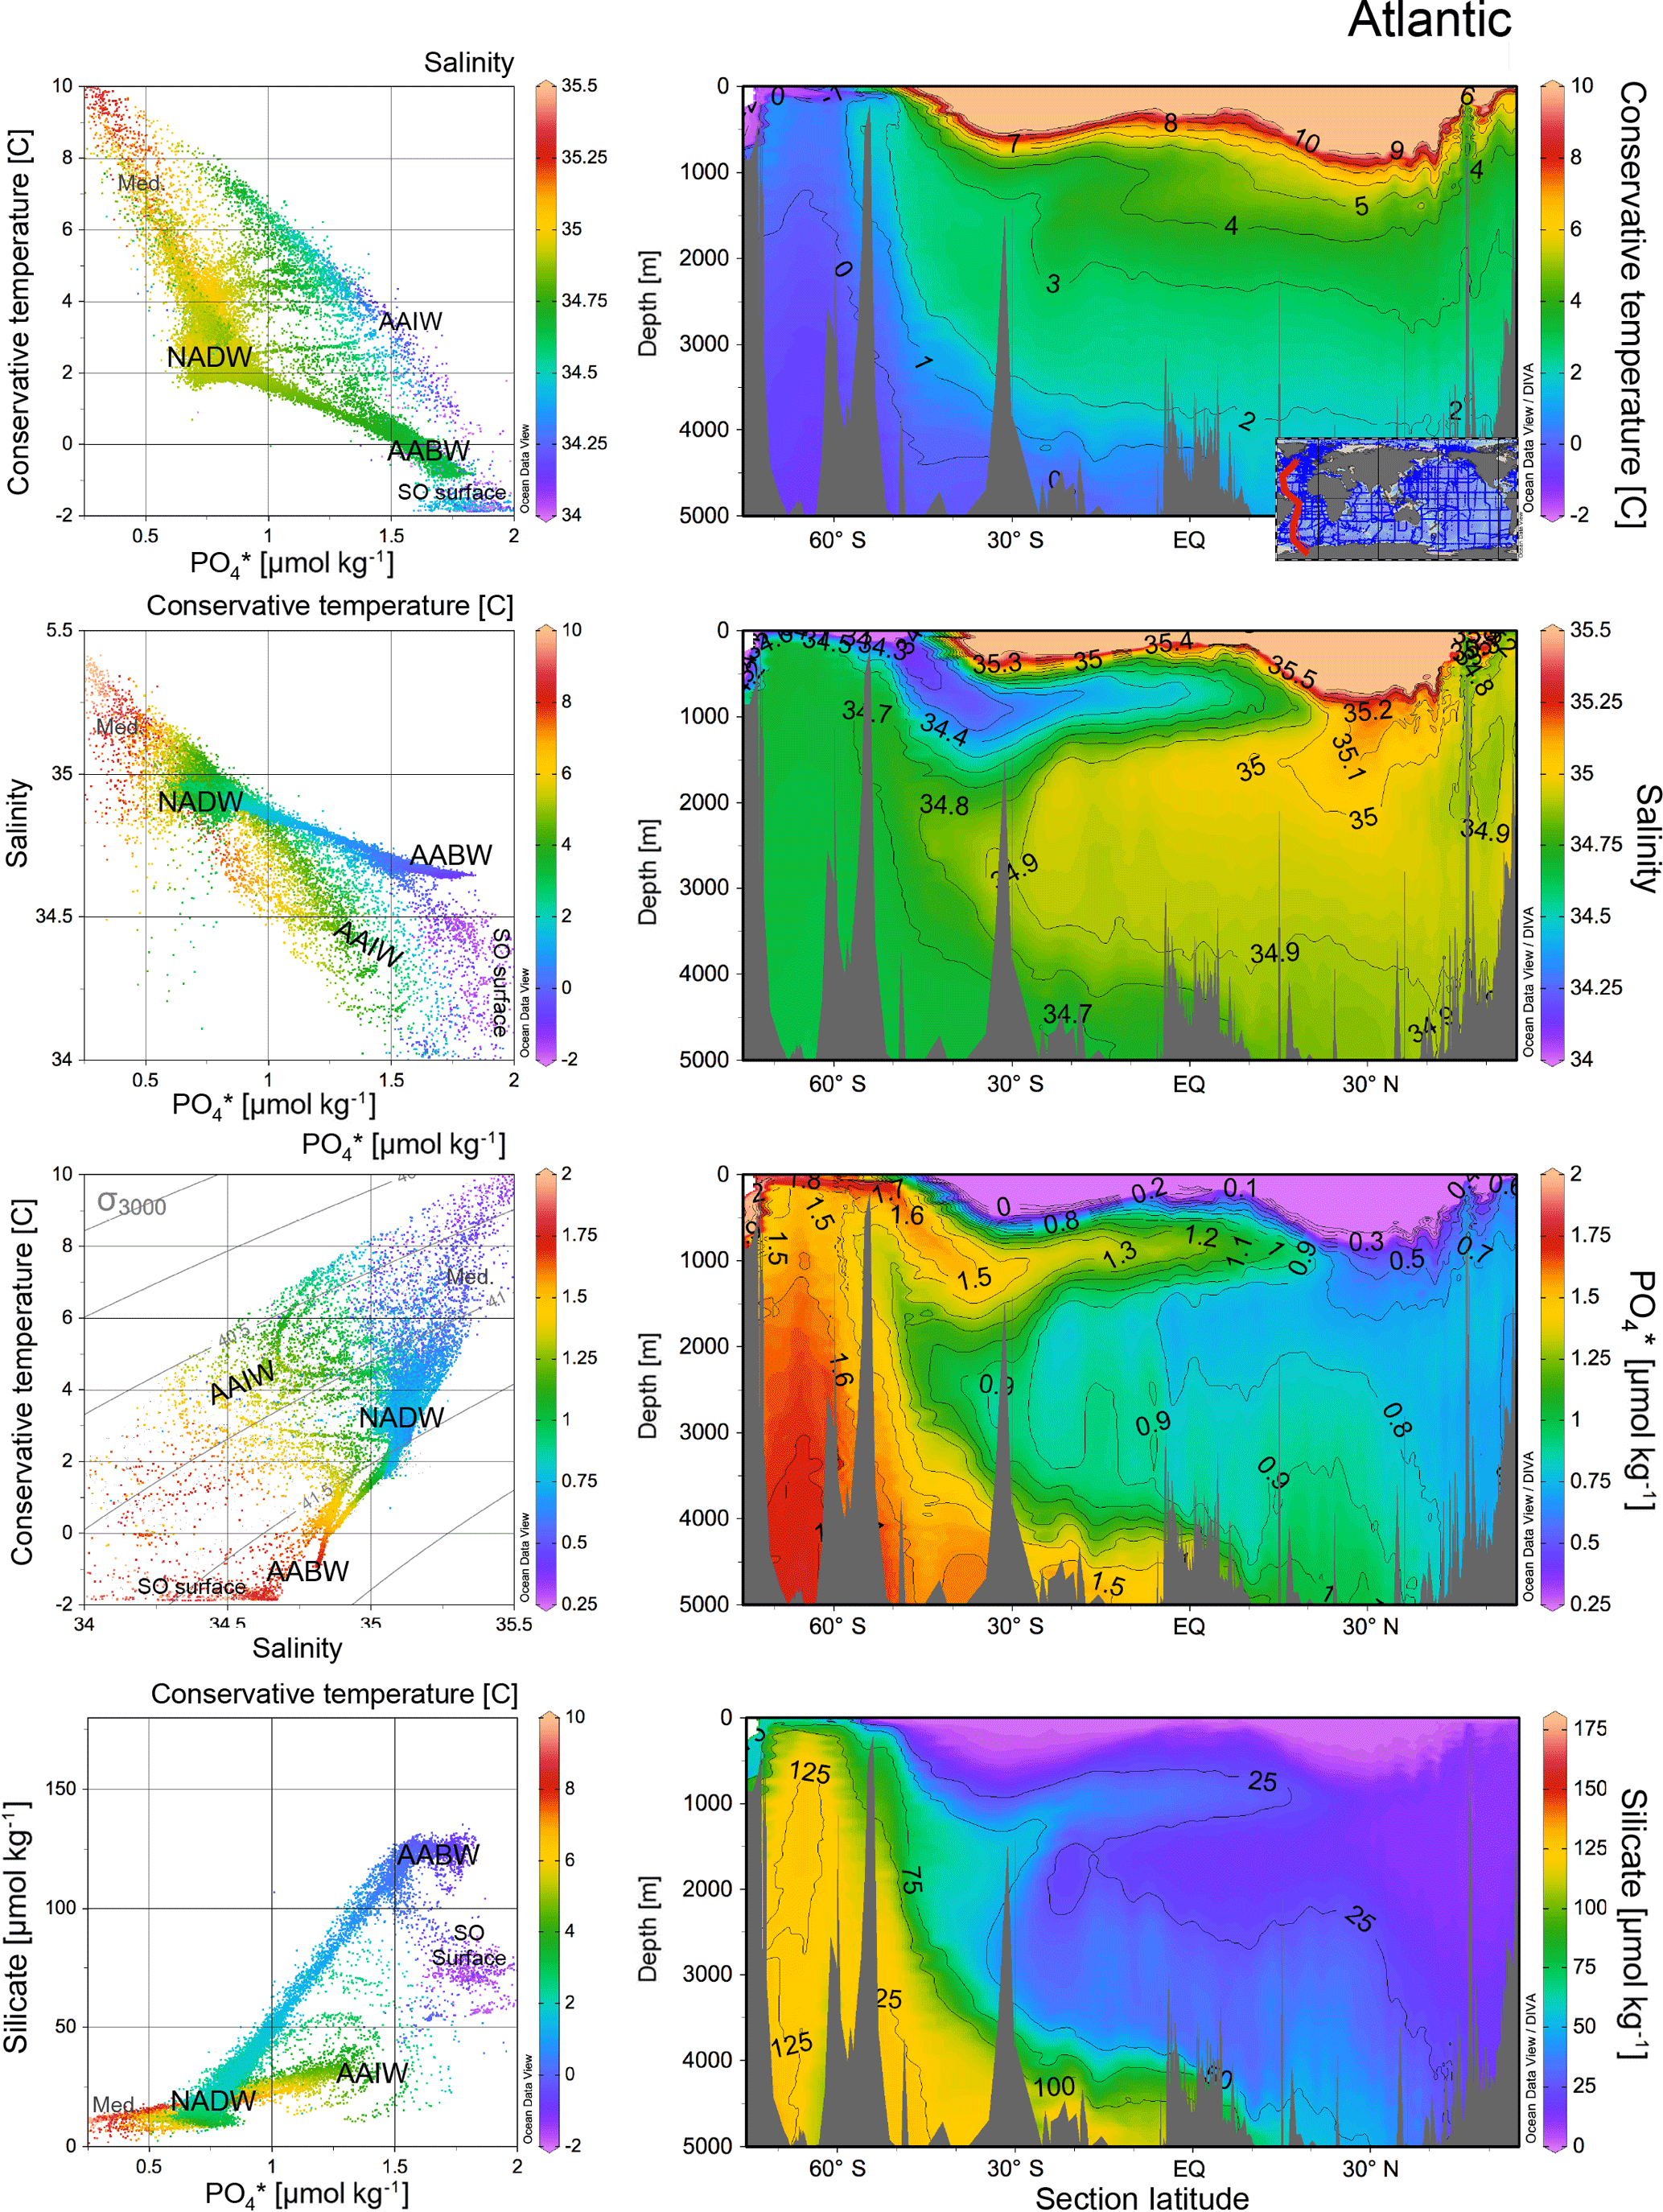
Figure A1Atlantic hydrographic section for potential temperature, salinity, , and silicate. Cross plots show all the data in this section with neutral density greater than 27.2 kg m−3; the colours of the dots refer to the scale shown to the right of the cross plots. Data are from GLODAPv2 (Key et al., 2015; Olsen et al., 2016) with profiles, maps, and sections plotted in ODV (Schlitzer, 2015), with sections contoured using isopycnic gridding.
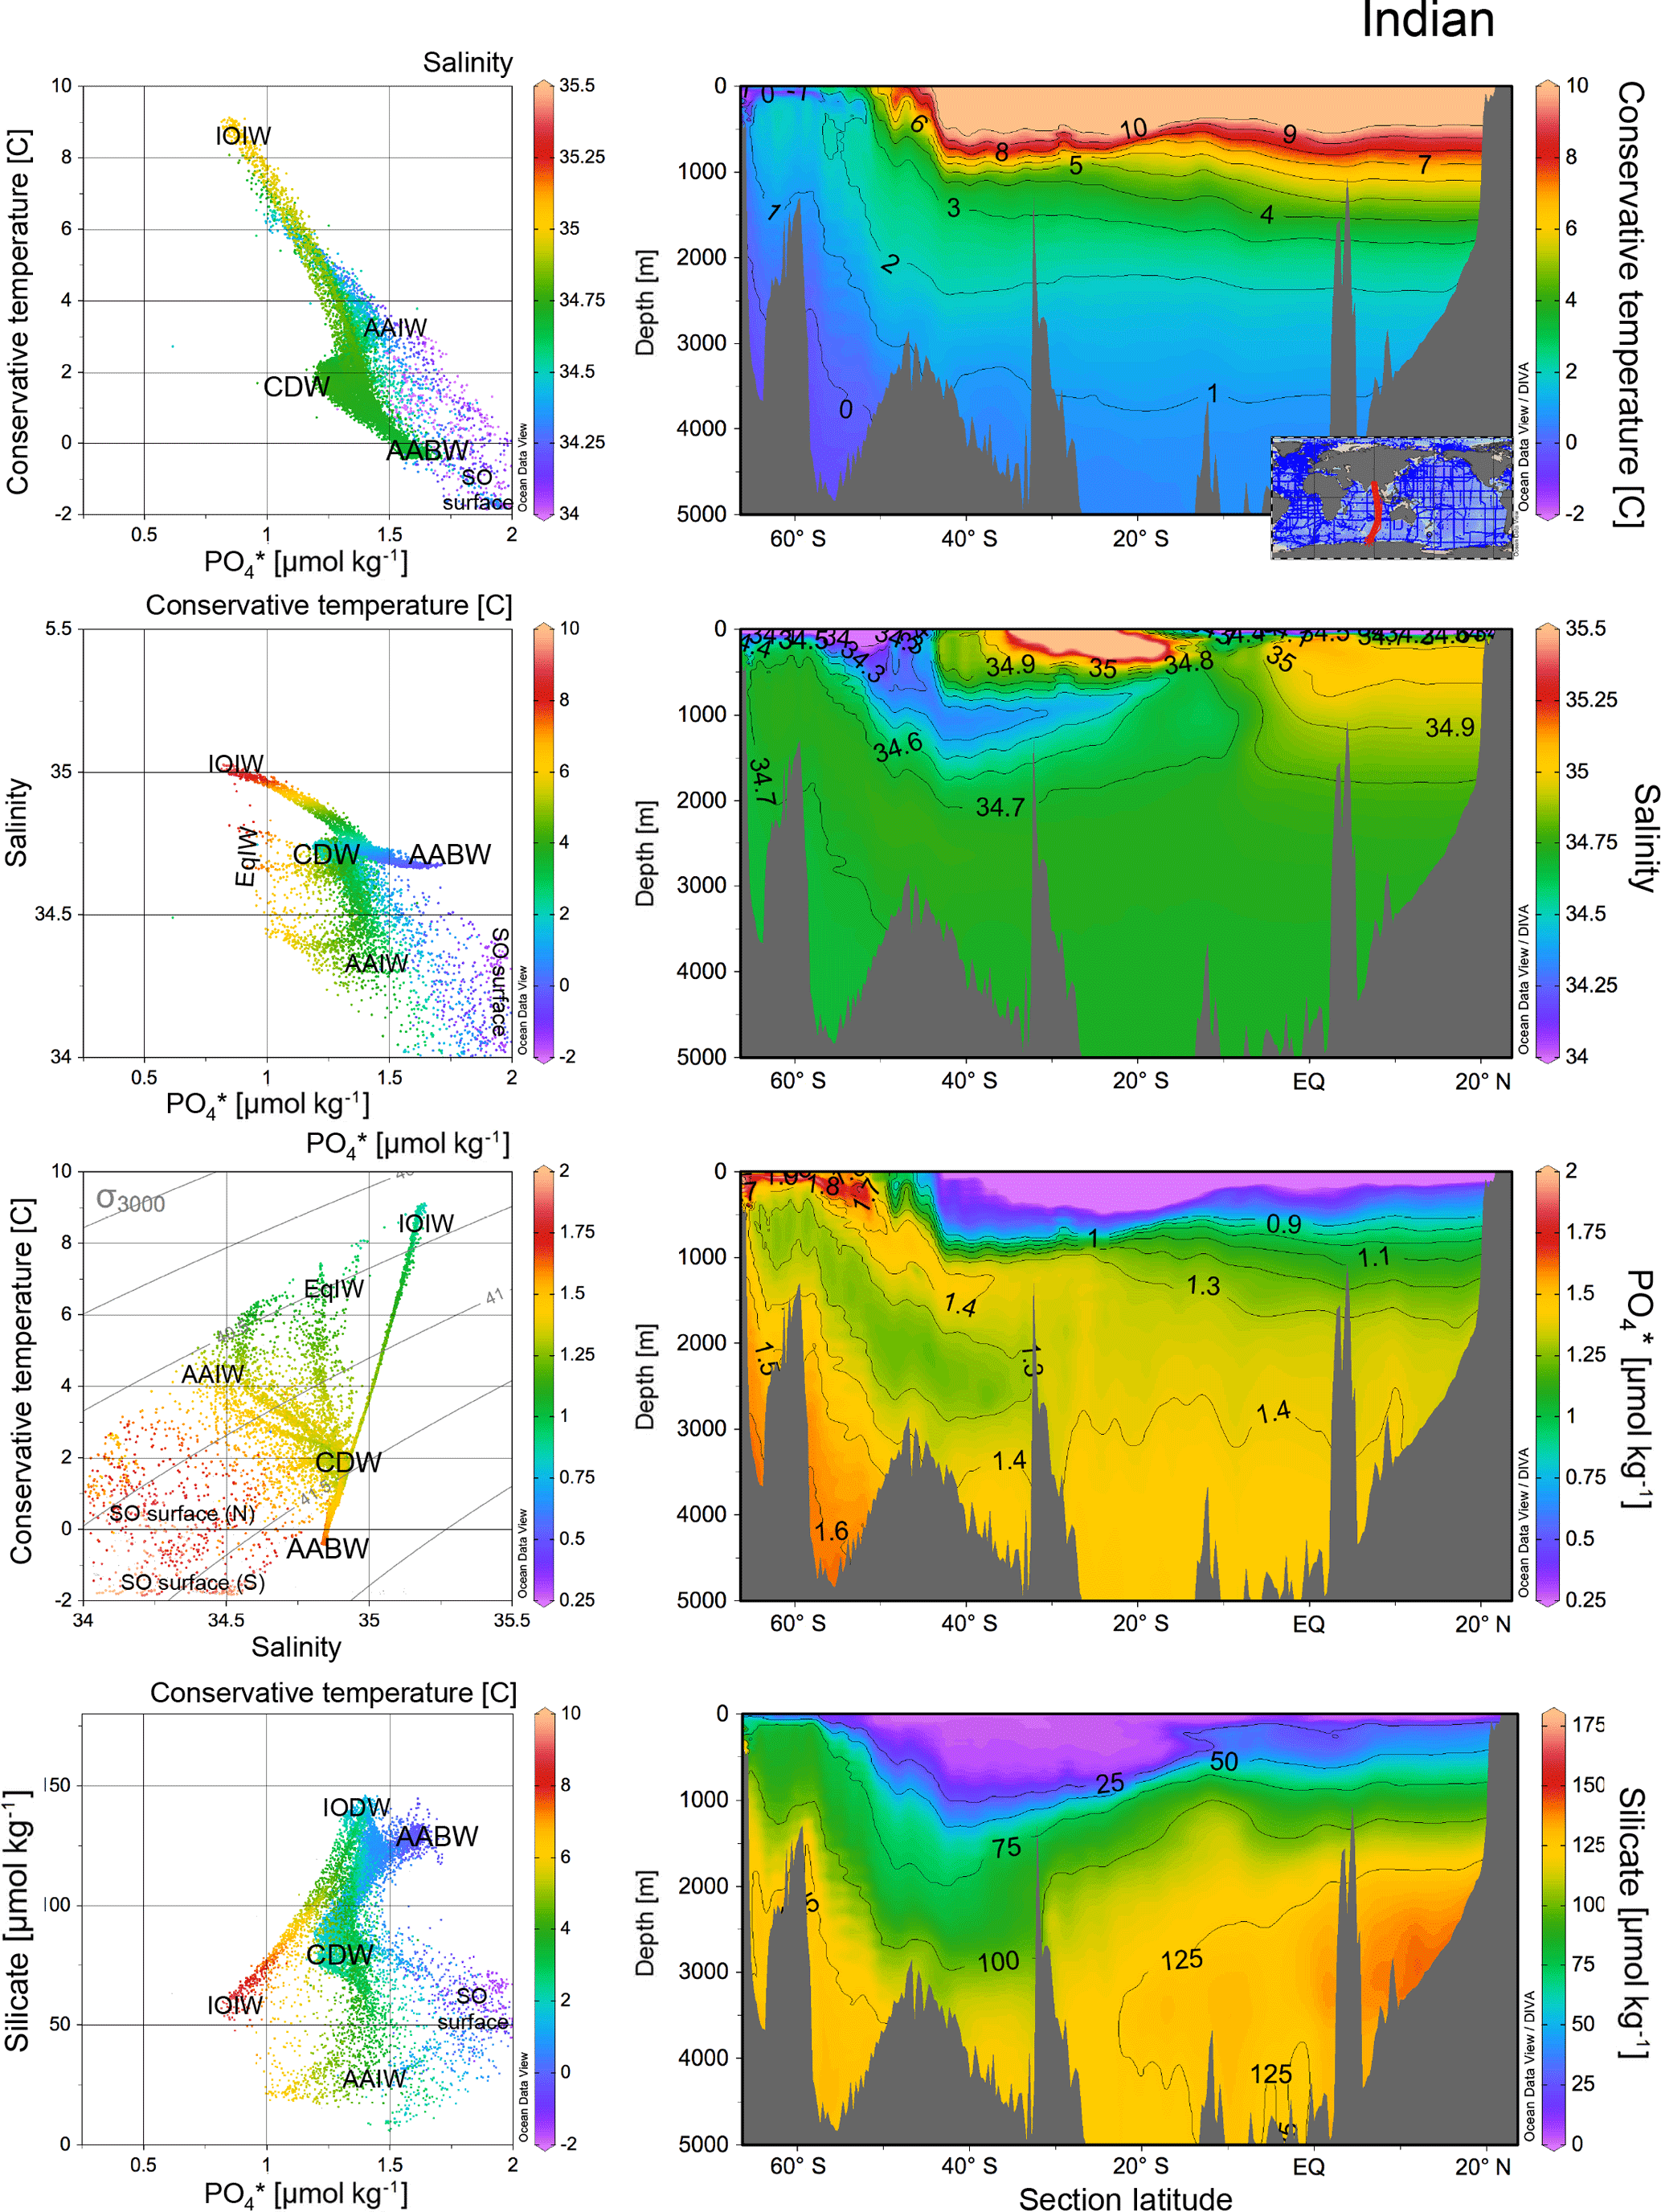
Figure A2Indian Ocean hydrographic section for potential temperature, salinity, , and silicate. Cross plots show all the data in this section with neutral density greater than 27.2 kg m−3; the colours of the dots refer to the scale shown to the right of the cross plots. Data are from GLODAPv2 (Key et al., 2015; Olsen et al., 2016) with profiles, maps, and sections plotted in ODV (Schlitzer, 2015), with sections contoured using isopycnic gridding.
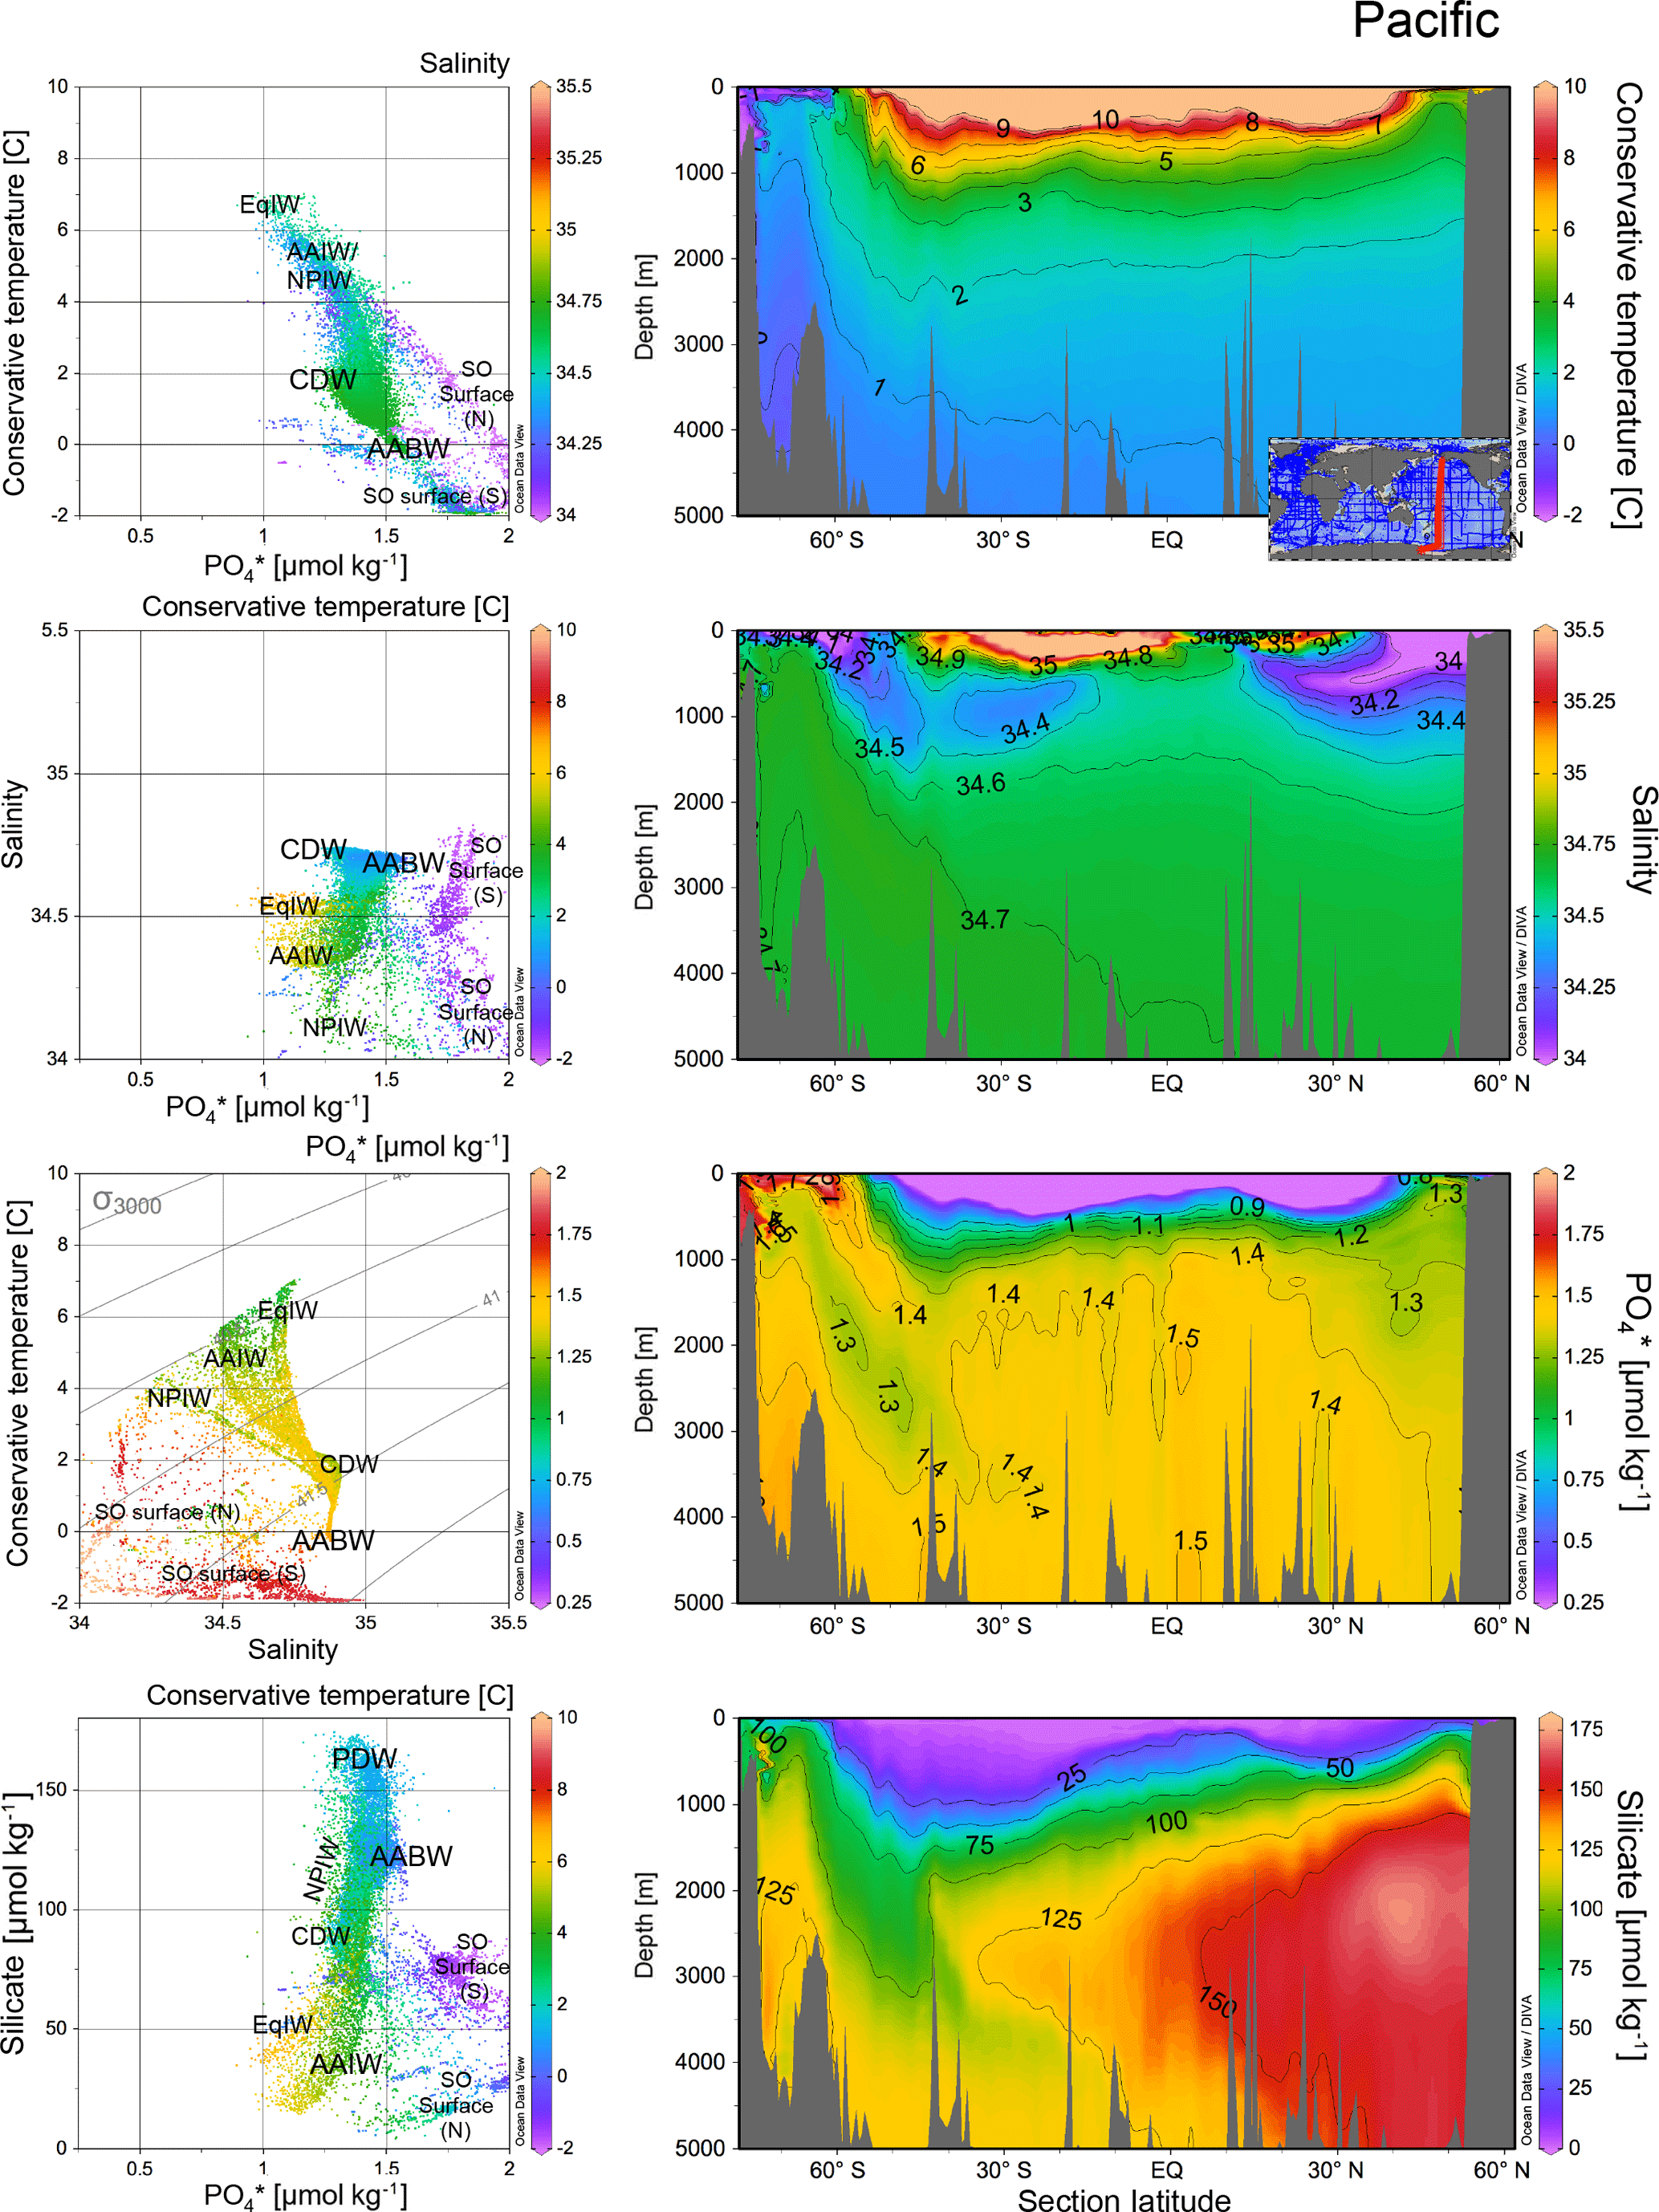
Figure A3Pacific hydrographic section for potential temperature, salinity, , and silicate. Cross plots show all the data in this section with neutral density greater than 27.2 kg m−3; the colours of the dots refer to the scale shown to the right of the cross plots. Data are from GLODAPv2 (Key et al., 2015; Olsen et al., 2016) with profiles, maps, and sections plotted in ODV (Schlitzer, 2015), with sections contoured using isopycnic gridding.
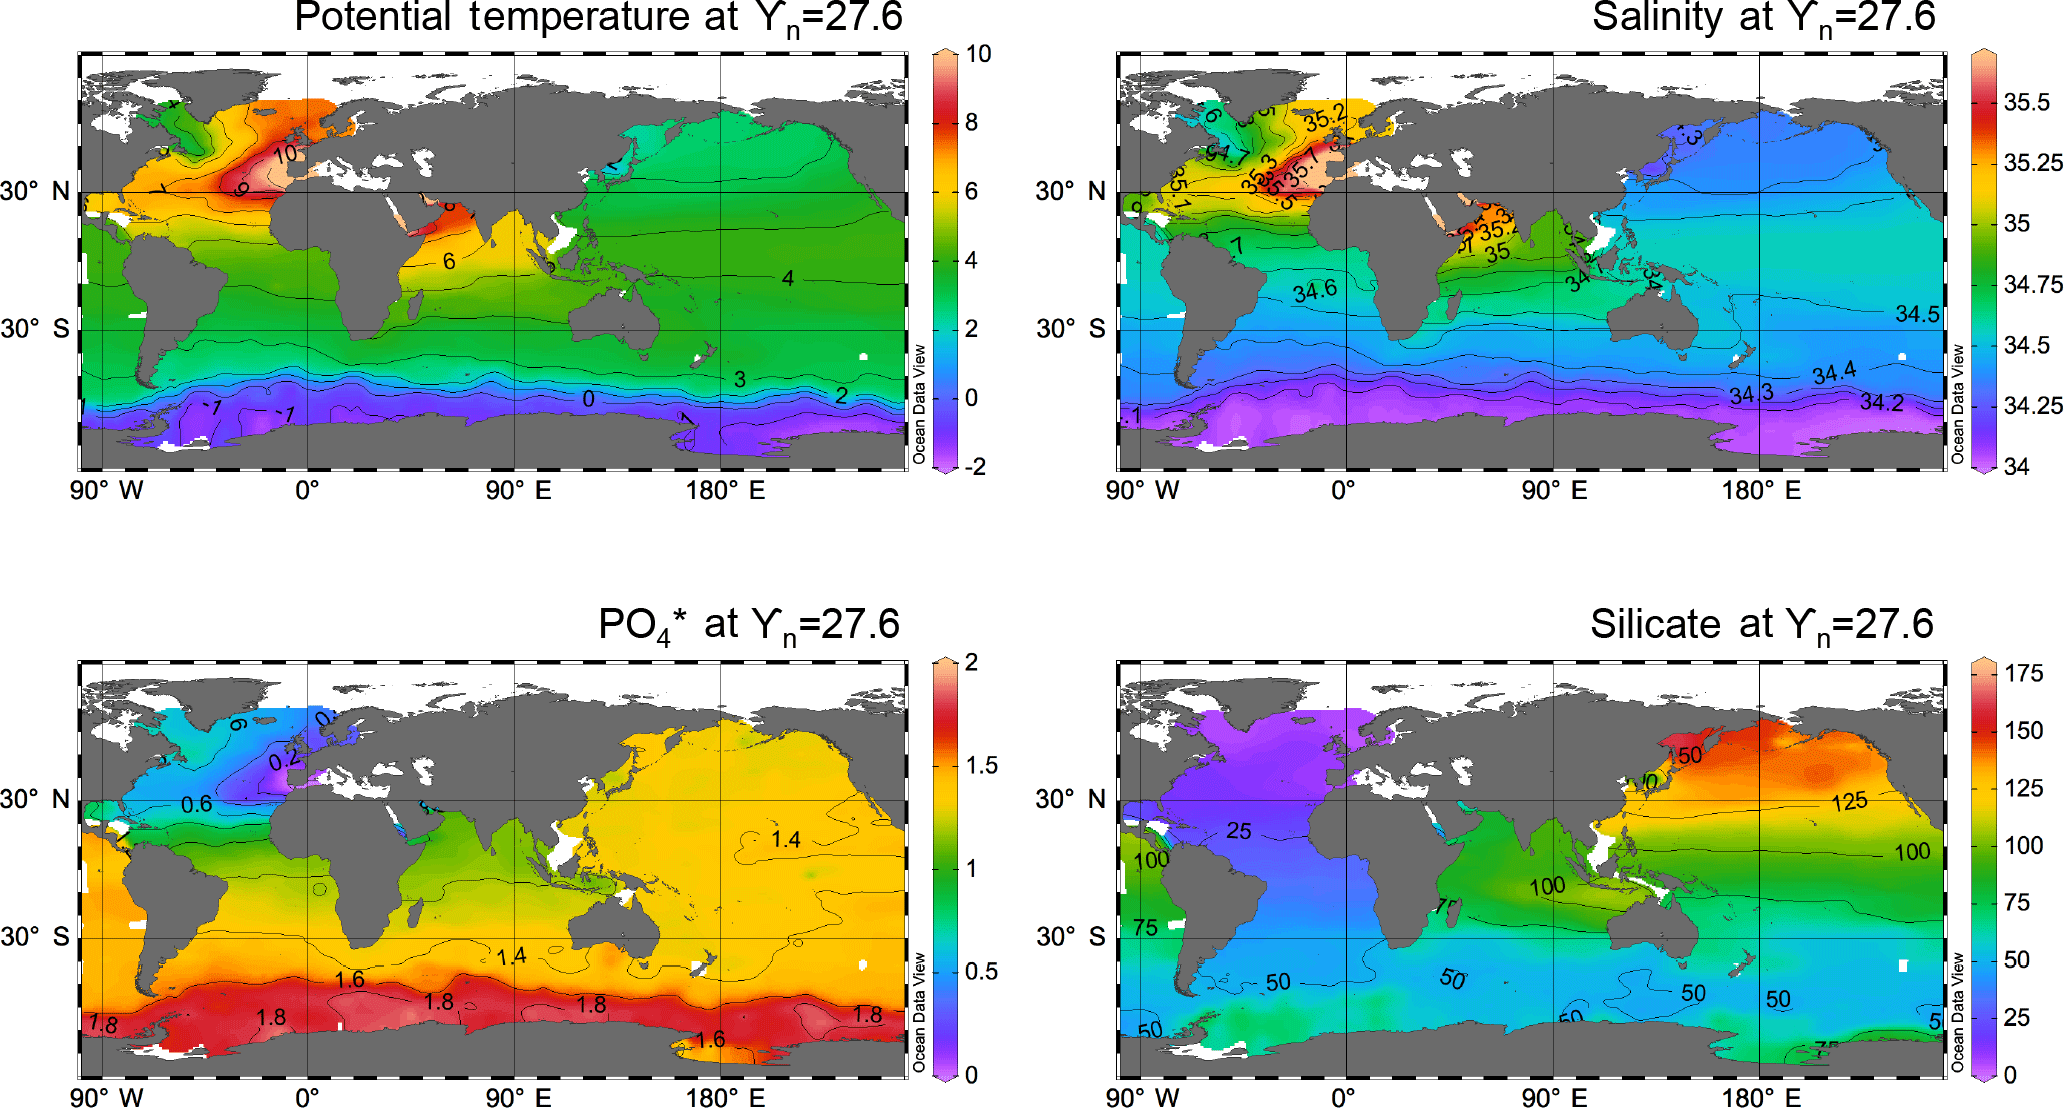
Figure A4Potential temperature, salinity, , and silicate on the 27.6 isopycnal horizon. The depth of this horizon is shown in Fig. 8 and averages ∼ 1000 m in the basins and is in the mixed layer in the Southern Ocean. Data are from GLODAPv2 (Key et al., 2015; Olsen et al., 2016) with profiles, maps, and sections plotted in ODV (Schlitzer, 2015).
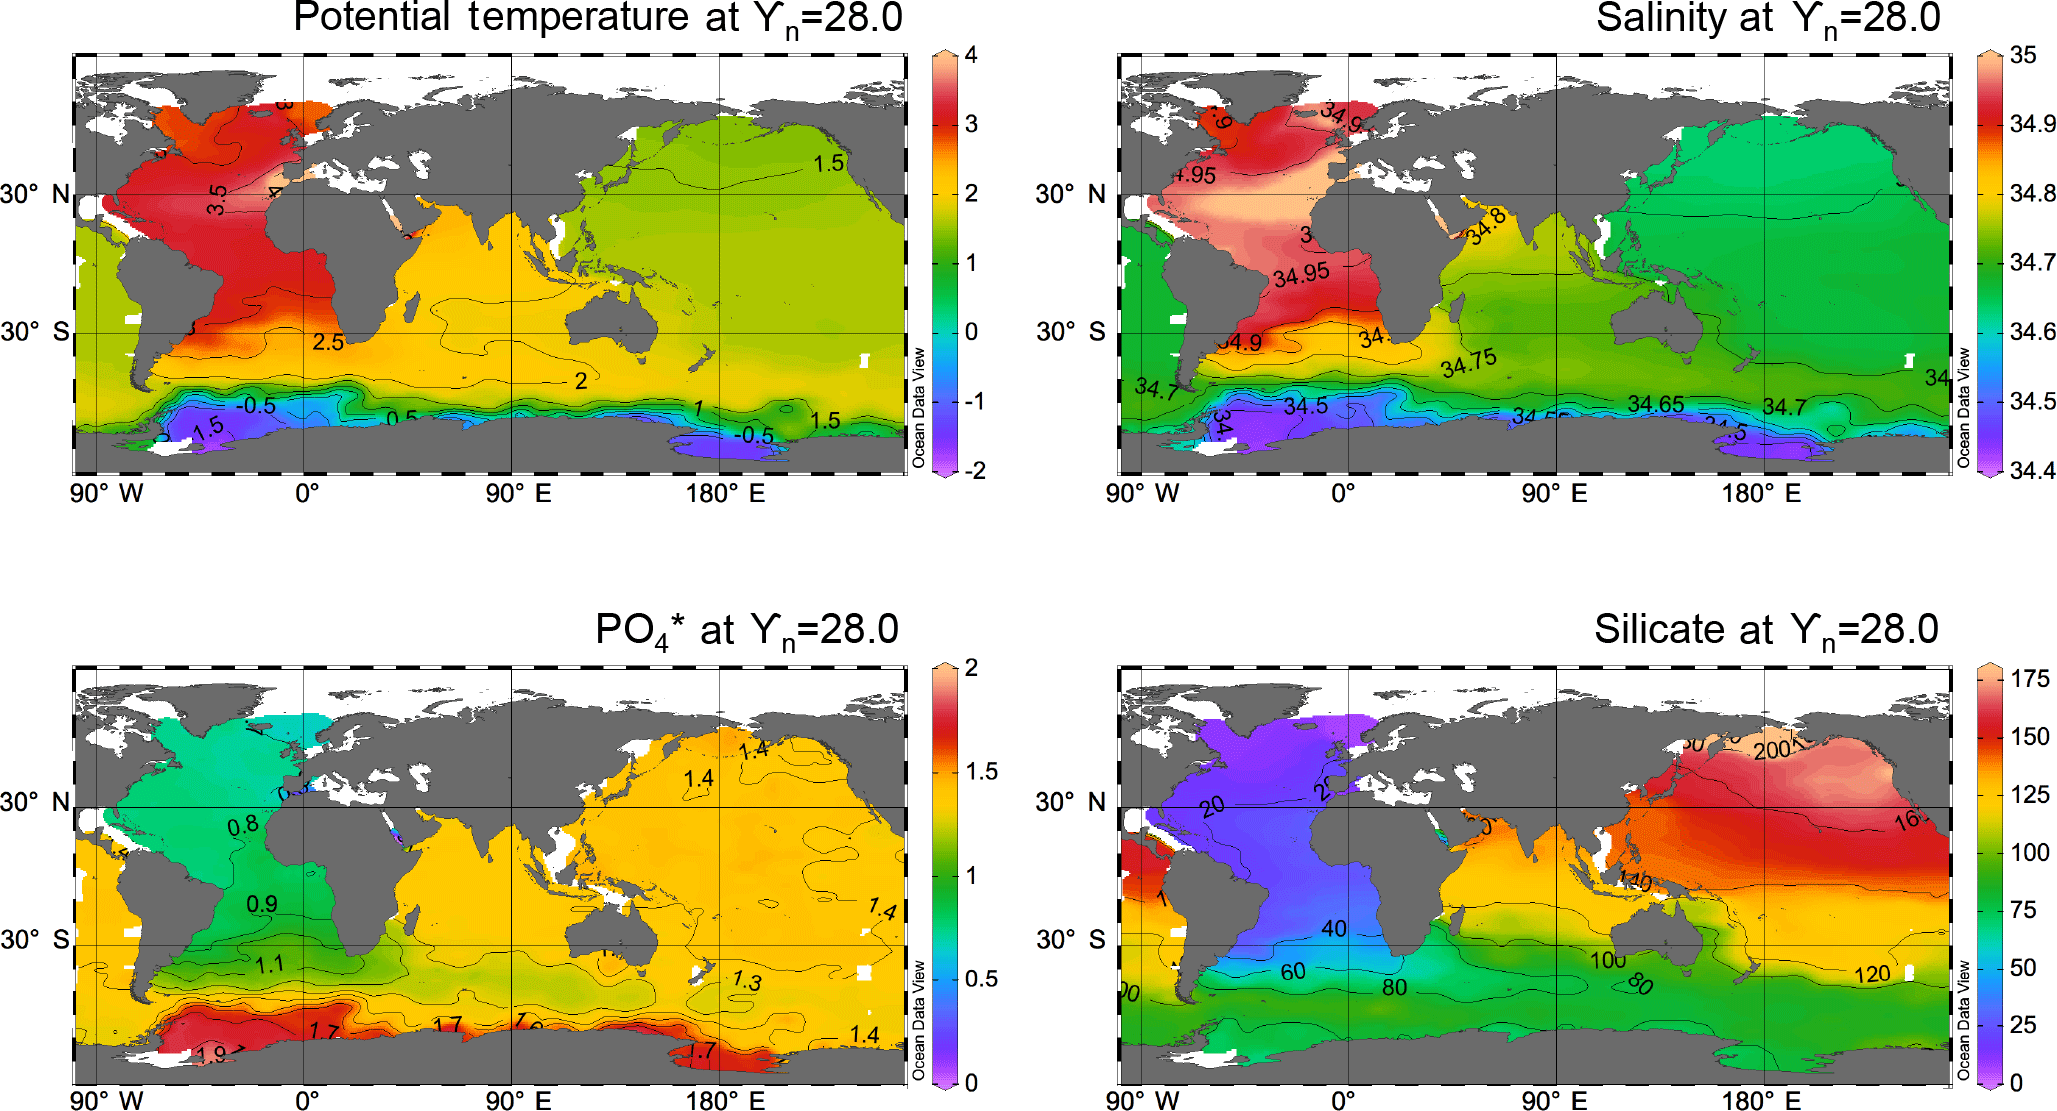
Figure A5Potential temperature, salinity, , and silicate on the 28.0 isopycnal horizon. The depth of this horizon is shown in Fig. 8 and averages ∼ 2500 m in the basins and ∼ 250 m in the mixed layer in the Southern Ocean. Data are from GLODAPv2 (Key et al., 2015; Olsen et al., 2016) with profiles, maps, and sections plotted in ODV (Schlitzer, 2015).
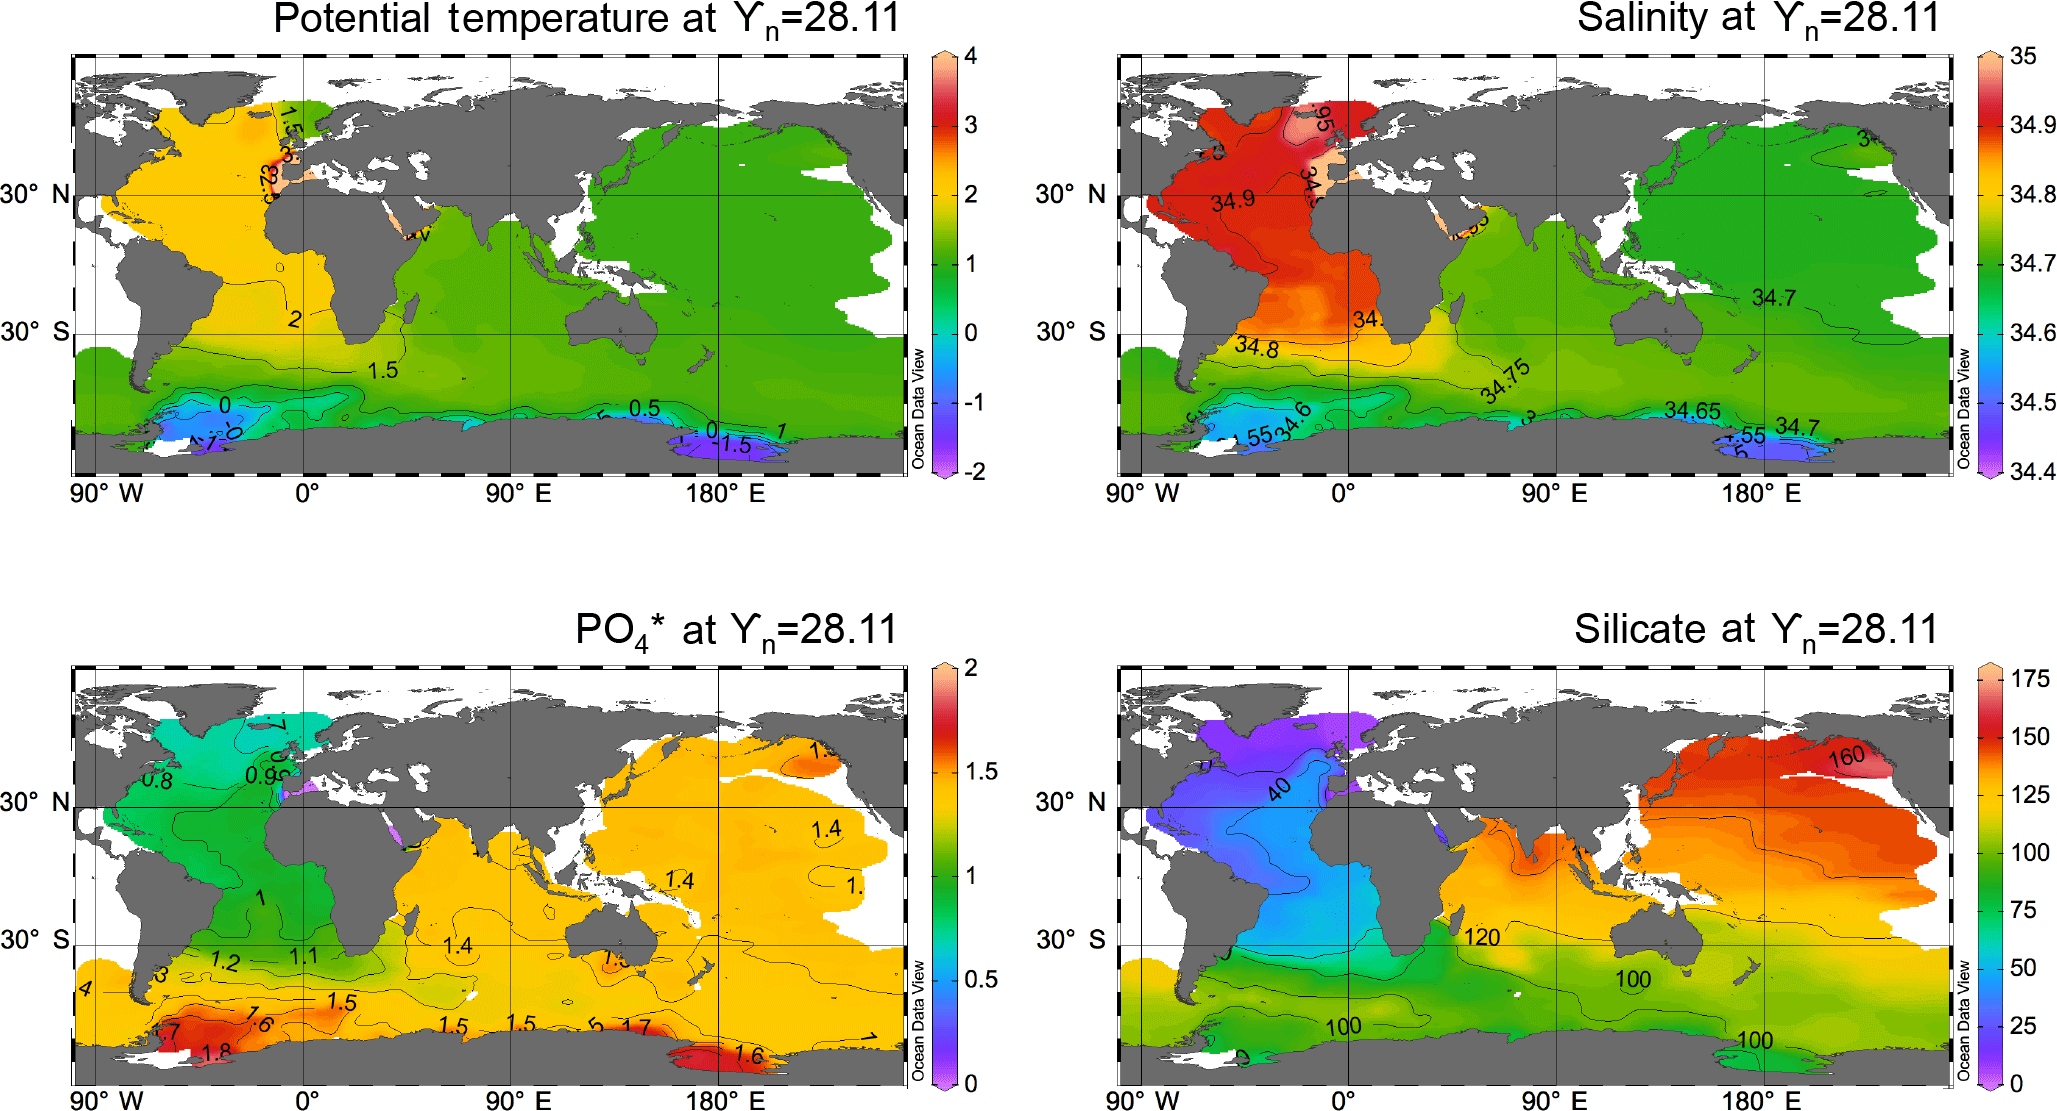
Figure A6Potential temperature, salinity, , and silicate on the 28.3 isopycnal horizon. The depth of this horizon is shown in Fig. 8 and averages ∼ 4000 m in the basins and ∼ 400 m in the mixed layer in the Southern Ocean. Data are from GLODAPv2 (Key et al., 2015; Olsen et al., 2016) with profiles, maps, and sections plotted in ODV (Schlitzer, 2015).
The authors declare that they have no conflict of interest.
This article is part of the special issue “Progress in quantifying ocean biogeochemistry – in honour of Ernst Maier-Reimer”. It is not associated with a conference.
We thank Jake Gebbie and Jean Lynch-Steiglitz for their thoughtful reviews,
and Jake Gebbie, Greg Johnson, and Jess Adkins for helpful discussions, all
of which substantially improved this paper. We also thank Matthew Mazloff for
making available as part of the B-SOSE product
(http://sose.ucsd.edu/BSOSE_iter105_solution.html, last access:
13 June 2018). Wally Broecker acknowledges funding from the Comer Science and
Education Foundation. James W. B. Rae acknowledges funding from NERC standard
grants NE/N003861/1 and NE/N011716/1, and support from the School of Earth
and Environmental Sciences at the University of St Andrews during
Wally Broecker's visit, which sparked the discussions that led to this
paper.
Edited by: Christoph
Heinze
Reviewed by: Geoffrey Gebbie and Jean Lynch-Stieglitz
Abernathey, R. and Ferreira, D.: Southern Ocean isopycnal mixing and ventilation changes driven by winds, Geophys. Res. Lett., 42, 10357–10365, https://doi.org/10.1002/2015GL066238, 2015.
Anderson, L. A. and Sarmiento, J. L.: Redfield ratios of remineralization determined by nutrient data analysis, Global Biogeochem. Cy., 8, 65–80, 1994.
Barker, S., Diz, P., Vautravers, M. J., Pike, J., Knorr, G., Hall, I. R., and Broecker, W. S.: Interhemispheric Atlantic seesaw response during the last deglaciation, Nature, 457, 1097–1102, 2009.
Broecker, W. S., Takahashi, T., and Takahashi, T.: Sources and flow patterns of deep-ocean waters as deduced from potential temperature, salinity, and initial phosphate concentration, J. Geophys. Res.-Oceans, 90, 6925–6939, 1985a.
Broecker, W. S., Peng, T. H., Ostlund, G., and Stuiver, M.: The distribution of bomb radiocarbon in the ocean, J. Geophys. Res.-Oceans, 90, 6953–6970, 1985b.
Broecker, W. S., Peacock, S. L., Walker, S., Weiss, R., Fahrbach, E., Schröder, M., Mikolajewicz, U., Heinze, C., Key, R., Peng, T. H., and Rubin, S.: How much deep water is formed in the Southern Ocean?, J. Geophys. Res.-Oceans, 103, 15833–15843, 1998.
Carmack, E. C. and Foster, T. D.: On the flow of water out of the Weddell Sea, in: Deep Sea Research and Oceanographic Abstracts, Vol. 22, 711–724, Elsevier, 1975.
Conkright, M. E., Boyer, T. P., and Levitus, S.: World Ocean Atlas: 1994 Nutrients (Vol. 1), DIANE Publishing, 1994.
DeVries, T. and Primeau, F.: Dynamically and observationally constrained estimates of water-mass distributions and ages in the global ocean, J. Phys. Oceanogr., 41, 2381–2401, 2011.
Dong, S., Sprintall, J., Gille, S. T., and Talley, L.: Southern Ocean mixed-layer depth from Argo float profiles, J. Geophys. Res.-Oceans, 113, 2008.
England, M. H.: Using chlorofluorocarbons to assess ocean climate models, Geophys. Res. Lett., 22, 3051–3054, 1995.
Ferrari, R., Jansen, M. F., Adkins, J. F., Burke, A., Stewart, A. L., and Thompson, A. F.: Antarctic sea ice control on ocean circulation in present and glacial climates, P. Natl. Acad. Sci. USA, 111, 8753–8758, 2014.
Ganachaud, A. and Wunsch, C.: Improved estimates of global ocean circulation, heat transport and mixing from hydrographic data, Nature, 408, 453–457, 2000.
Gebbie, G. and Huybers, P.: Total matrix intercomparison: A method for determining the geometry of water-mass pathways, J. Phys. Oceanogr., 40, 1710–1728, 2010.
Gordon, A. L. and Huber, B. A.: Southern Ocean winter mixed layer, J. Geophys. Res.-Oceans, 95, 11655–11672, 1990.
Gouretski, V. and Koltermann, K. P.: WOCE global hydrographic climatology, Berichte des BSH, 35, 1–52, 2004.
Hupe, A. and Karstensen, J.: Redfield stoichiometry in Arabian Sea subsurface waters, Global Biogeochem. Cy., 14, 357–372, 2000.
Ito, T. and Follows, M. J.: Preformed phosphate, soft tissue pump and atmospheric CO2, J. Mar. Res., 63, 813–839, 2005.
Johnson, G. C.: Quantifying Antarctic bottom water and North Atlantic deep water volumes, J. Geophys. Res.-Oceans, 113, C05027, https://doi.org/10.1029/2007JC004477, 2008.
Key, R. M., Olsen, A., van Heuven, S., Lauvset, S. K., Velo, A., Lin, X., Schirnick, C., Kozyr, A., Tanhua, T., Hoppema, M., and Jutterström, S.: Global Ocean Data Analysis Project, Version 2 (GLODAPv2), https://doi.org/10.3334/CDIAC/OTG.NDP093_GLODAPv2, 2015.
Khatiwala, S., Primeau, F., and Holzer, M.: Ventilation of the deep ocean constrained with tracer observations and implications for radiocarbon estimates of ideal mean age, Earth Planet. Sc. Lett., 325–326, 116–125, 2012.
Lumpkin, R. and Speer, K.: Global ocean meridional overturning, J. Phys. Oceanogr., 37, 2550–2562, 2007.
Maier-Reimer, E. and Hasselmann, K.: Transport and storage of CO2 in the ocean – an inorganic ocean-circulation carbon cycle model, Clim. Dynam., 2, 63–90, 1987.
Marinov, I., Gnanadesikan, A., Toggweiler, J. R., and Sarmiento, J. L.: The southern ocean biogeochemical divide, Nature, 441, 964–967, 2006.
Marshall, J. and Speer, K.: Closure of the meridional overturning circulation through Southern Ocean upwelling, Nat. Geosci., 5, 171–180, 2012.
Naveira-Garabato, A. C. N., Polzin, K. L., King, B. A., Heywood, K. J., and Visbeck, M.: Widespread intense turbulent mixing in the Southern Ocean, Science, 303, 210–213, 2004.
Olsen, A., Key, R. M., van Heuven, S., Lauvset, S. K., Velo, A., Lin, X., Schirnick, C., Kozyr, A., Tanhua, T., Hoppema, M., Jutterström, S., Steinfeldt, R., Jeansson, E., Ishii, M., Pérez, F. F., and Suzuki, T.: The Global Ocean Data Analysis Project version 2 (GLODAPv2) – an internally consistent data product for the world ocean, Earth Syst. Sci. Data, 8, 297–323, https://doi.org/10.5194/essd-8-297-2016, 2016.
Orsi, A. H., Whitworth III, T., and Nowlin Jr., W. D.: On the meridional extent and fronts of the Antarctic Circumpolar Current, Deep-Sea Res. Pt. I, 42, 641–673, 1995.
Orsi, A. H., Johnson, G. C., and Bullister, J. L.: Circulation, mixing, and production of Antarctic Bottom Water, Prog. Oceanogr., 43, 55–109, 1999.
Orsi, A. H., Jacobs, S. S., Gordon, A. L., and Visbeck, M.: Cooling and ventilating the abyssal ocean, Geophys. Res. Lett., 28, 2923–2926, 2001.
Orsi, A. H., Smethie, W. M., and Bullister, J. L.: On the total input of Antarctic waters to the deep ocean: A preliminary estimate from chlorofluorocarbon measurements, J. Geophys. Res.-Oceans, 107, 31-1–31-14, https://doi.org/10.1029/2001JC000976, 2002.
Peacock, S., Visbeck, M., and Broecker, W.: Deep Water Formation Rates Inferred from Global Tracer Distributions: An Inverse Approach, in: Inverse Methods in Global Biogeochemical Cycles, edited by: Kasibhatla, P., Heimann, M., Rayner, P., Mahowald, N., Prinn, R. G., and Hartley, D. E., https://doi.org/10.1029/GM114p0185, 2013.
Primeau, F. and Holzer, M.: The ocean's memory of the atmosphere: Residence-time and ventilation-rate distributions of water masses, J. Phys. Oceanogr., 36, 1439–1456, 2006.
Roemmich, D., Johnson, G. C., Riser, S., Davis, R., Gilson, J., Owens, W. B., Garzoli, S. L., Schmid, C., and Ignaszewski, M.: The Argo Program: Observing the global ocean with profiling floats, Oceanography, 22, 34–43, 2009.
Sarmiento, J. Á., Gruber, N., Brzezinski, M. A., and Dunne, J. P.: High-latitude controls of thermocline nutrients and low latitude biological productivity, Nature, 427, 56–60, 2004.
Schlitzer, R.: Assimilation of radiocarbon and chlorofluorocarbon data to constrain deep and bottom water transports in the world ocean, J. Phys. Oceanogr., 37, 259–276, 2007.
Schlitzer, R.: Ocean Data View, available at: http://odv.awi.de (last access: 13 June 2018), 2015.
Schlosser, P., Bonisch, G., Rhein, M., and Bayer, R.: Reduction of Deepwater Formation in the Greenland Sea during the 1980's. Evidence from Tracer Data, Science, 251, p. 1054, 1991.
Sigman, D. M., Hain, M. P., and Haug, G. H.: The polar ocean and glacial cycles in atmospheric CO2 concentration, Nature, 466, 47–55, 2010.
Sloyan, B. M. and Rintoul, S. R.: The Southern Ocean limb of the global deep overturning circulation, J. Phys. Oceanogr., 31, 143–173, 2001.
Smethie, W. M. and Fine, R. A.: Rates of North Atlantic Deep Water formation calculated from chlorofluorocarbon inventories, Deep-Sea Res. Pt. I, 48, 189–215, 2001.
Stocker, T. F. and Johnsen, S. J.: A minimum thermodynamic model for the bipolar seesaw, Paleoceanography, 18, 1087, https://doi.org/10.1029/2003PA000920, 2003.
Takahashi, T., Broecker, W. S., and Langer, S.: Redfield ratio based on chemical data from isopycnal surfaces, J. Geophys. Res.-Oceans, 90, 6907–6924, 1985.
Talley, L. D.: Distribution and formation of North Pacific intermediate water, J. Phys. Oceanogr., 23, 517–537, 1993.
Talley, L. D.: Antarctic intermediate water in the South Atlantic, The South Atlantic: Present and Past Circulation, 219–238, https://doi.org/10.1007/978-3-642-80353-6_11, 1996.
Talley, L. D.: Closure of the global overturning circulation through the Indian, Pacific, and Southern Oceans: Schematics and transports, Oceanography, 26, 80–97, 2013.
Toggweiler, J. R. and Samuels, B.: Effect of Drake Passage on the global thermohaline circulation, Deep-Sea Res. Pt. I, 42, 477–500, 1995.
Verdy, A. and Mazloff, M.: A data assimilating model for estimating Southern Ocean biogeochemistry, J. Geophys. Res.-Oceans., 122, 6968–6988, https://doi.org/10.1002/2016JC012650, 2017.
Warren, B. A.: Deep circulation of the World Ocean. Evolution of Physical Oceanography: Scientific Surveys in Honor of Henry Stommel, edited by: Warren, B. A. and Wunsch, C., MIT Press, 6–41, 1981.