the Creative Commons Attribution 4.0 License.
the Creative Commons Attribution 4.0 License.
 | 27 Jun 2018
Estimation of isotope variation of N2O during denitrification by Pseudomonas aureofaciens and Pseudomonas chlororaphis: implications for N2O source apportionment
Joshua A. Haslun
Nathaniel E. Ostrom
Eric L. Hegg
Peggy H. Ostrom
Soil microbial processes, stimulated by agricultural fertilization, account for 90 % of anthropogenic nitrous oxide (N2O), the leading source of ozone depletion and a potent greenhouse gas. Efforts to reduce N2O flux commonly focus on reducing fertilization rates. Management of microbial processes responsible for N2O production may also be used to reduce N2O emissions, but this requires knowledge of the prevailing process. To this end, stable isotopes of N2O have been applied to differentiate N2O produced by nitrification and denitrification. To better understand the factors contributing to isotopic variation during denitrification, we characterized the δ15N, δ18O and site preference (SP; the intramolecular distribution of 15N in N2O) of N2O produced during reduction by Pseudomonas chlororaphis subsp. aureofaciens and P. c. subsp. chlororaphis. The terminal product of denitrification for these two species is N2O because they lack the gene nitrous oxide reductase, which is responsible for the reduction of N2O to N2. In addition to species, treatments included electron donor (citrate and succinate) and electron donor concentration (0.01, 0.1, 1 and 10 mM) as factors. In contrast to the expectation of a Rayleigh model, all treatments exhibited curvilinear behaviour between δ15N or δ18O and the extent of the reaction. The curvilinear behaviour indicates that the fractionation factor changed over the course of the reaction, something that is not unexpected for a multi-step process such as denitrification. Using the derivative of the equation, we estimated that the net isotope effects (η) vary by as much as 100 ‰ over the course of a single reaction, presenting challenges for using δ15N and δ18O as apportionment tools. In contrast, SP for denitrification was not affected by the extent of the reaction, the electron donor source or concentration, although the mean SP of N2O produced by each species differed. Therefore, SP remains a robust indicator of the origin of N2O. To improve apportionment estimates with SP, future studies could evaluate other factors that contribute to the variation in SP.
- Article
(1587 KB) - Full-text XML
-
Supplement
(1025 KB) - BibTeX
- EndNote


Agricultural production of food and energy has required a 10-fold increase (i.e. from 10 to 100 TGN yr−1) in the application of synthetic fertilizer since 1950 (Robertson and Vitousek, 2009). Moreover, to maximize crop yields, nitrogen (N) is often applied at rates in excess of a crop's yield response, the average maximum crop yield as a function of fertilizer application rate. This results in a residual N pool (Sebilo et al., 2013). While some of the excess N may be incorporated into the soil, much of it is either transported out of the system via runoff as or (Zhou and Butterbach-Bahl, 2014), volatilized as NH3 (Pan et al., 2016) or converted to N2 and/or nitrous oxide (N2O) via oxidative and reductive microbial processes (Schreiber et al., 2012; Venterea et al., 2012) such as nitrification and denitrification, respectively. Stimulated by agricultural practices, these microbial processes account for 90 % of anthropogenic N2O (Denman, 2007; Reay et al., 2012). Losses of N from soils in the form of N2O are of particular concern because this greenhouse gas contributes to stratospheric ozone depletion (Portmann et al., 2012; Ramanathan et al., 1985; Ravishankara et al., 2009) and has a 100-year global warming potential that is approximately 300 times that of CO2 (IPCC, 2014). Moreover, the relationship between N application rate and N2O emissions from agricultural soils is non-linear (McSwiney and Robertson, 2005; Shcherbak et al., 2014), with N2O emissions dramatically increasing with moderate increases in fertilization. To mitigate the N2O flux without compromising crop yield, several systems have been developed that include the maximum return to nitrogen system (Nafziger et al., 2004) and the variable rate nitrogen application system (Scharf et al., 2011). These strategies provide recommendations of fertilization rates that minimize reductions in crop yield while simultaneously decreasing the amount of residual N available for N2O production, thereby lowering the soil N2O flux. The identification of how to manage the microbial processes contributing to N2O flux from agricultural systems would be an additional mechanism to mitigate atmospheric N2O additions (Paustian et al., 2016; Reay et al., 2012; Venterea et al., 2012). Because nitrification and denitrification require aerobic and anaerobic conditions, respectively, strategies directed at controlling soil oxygen saturation could become part of a management strategy (Kravchenko et al., 2017). This, however, requires identification of the relative importance of nitrification and denitrification to the N2O flux spatially and temporally across different agricultural landscapes.
The stable isotope ratios of δ15N and δ18O have been used to apportion N2O flux between nitrification and denitrification (Davidson and Keller, 2000; Park et al., 2011; Yamagishi et al., 2007). Apportionment approaches require that the isotope values of N2O differ between the two production processes and remain constant throughout the course of a reaction (Jinuntuya-Nortman et al., 2008; Ostrom and Ostrom, 2017). However, shifts or fractionation in the isotope values of N2O produced during either nitrification or denitrification can compromise source apportionment (Barford et al., 1999; Perez et al., 2000; Sutka et al., 2008; Yoshida, 1988), and reduction of N2O by denitrification may further alter isotope values (Jinuntuya-Nortman et al., 2008). Nevertheless, δ15N and δ18O can still be a useful tool if environmental conditions constrain processes, such as anoxic conditions prohibiting nitrification.
Site preference (SP), the difference in 15N abundance between the central N (δ15Nα) and terminal N (δ15Nβ) of N2O, offers an alternative tool for apportionment of N2O production (Yoshida and Toyoda, 2000). The large difference in SP of N2O produced from nitrification and denitrification (ca. 30 ‰) paired with the observations that SP is constant during N2O production, and is independent of the isotopic composition of the nitrogen substrates of nitrification and denitrification, has prompted the use of SP for N2O source apportionment (Sutka et al., 2006; Toyoda et al., 2005). However, SP is not without variation (Toyoda et al., 2017). In addition to the production pathway, numerous factors could theoretically control the degree of variation in SP including differences in bacterial species, the specific enzyme involved in its production (Yang et al., 2014), and, for denitrification, the carbon source. The accuracy of apportionment estimates using isotope values, including SP, will be improved by understanding sources of variation.
This study investigated the effect of the carbon source (electron donor) and carbon source concentration on δ15N and δ18O of N2O produced by two denitrifier species in vitro, as well the effect of these factors on SP values of N2O. We conducted our study with Pseudomonas chlororaphis subsp. chlororaphis and P. chlororaphis subsp. aureofaciens because they are highly related denitrifiers that lack N2O reductase but encode different types of nitrite reductase (NIR).
2.1 Organisms and culture conditions
Cultures of Pseudomonas chlororaphis subsp. chlororaphis (ATCC 43928; P. chlororaphis) and Pseudomonas chlororaphis subsp. aureofaciens (ATCC 13985; P. aureofaciens) were cryogenically stored (−80 ∘C) in tryptic soy broth (TSB; Caisson Labs, Smithfield, UT) and sterile glycerol 1:1 (v∕v). Stock cultures were re-established in 5 mL TSB amended with sodium nitrate (NaNO3, 10 mM; Sigma-Aldrich, St. Louis, MO) under aerobic conditions at a constant temperature with continuous agitation (18 h, 25 ∘C). Individual colonies were obtained from re-established stock cultures by the streak-plate technique on tryptic soy agar (TSA; Caisson Labs, Smithfield, UT) amended with NaNO3 (10 mM). Tryptic soy agar plates of stock cultures were sealed with parafilm and incubated (aerobic, 25 ∘C). The plates were stored at 4 ∘C for up to 2 weeks prior to establishment in liquid media for denitrification experiments.
2.2 Preparation of cultures for denitrification experiments
Starter cultures of each species were established in 5 mL TSB amended with NaNO3 (10 mM) with one colony from stored stock culture plates (Thermo Fisher Scientific, Waltham, MA). Cultures were then grown aerobically with agitation (25 ∘C, 18 h) to the late exponential phase (the optical density at 600 nm (OD600) was 0.3). Optical density was determined with a Spectronic 20 spectrophotometer (Bausch and Lomb, Rochester, NY). Two 160 mL sterile serum bottles containing 50 mL of carbon minimal media (CMM) (Anderson et al., 1993) amended with 10 mM NaNO3 and 10 mM sodium succinate (Sigma-Aldrich, St. Louis, MO) were each inoculated with 200 µL of the aerobic culture. The bottles were stoppered (Geomicrobial Technologies, Inc.) and crimp-sealed, and the headspace was sparged with ultra-high purity (UHP) N2 for 15 min. Cultures were incubated (25 ∘C, 18 h) with agitation. Following 18 h, the cells were transferred to 50 mL conical Falcon™ tubes (Corning, Corning, NY) and centrifuged (3000 × g, 30 min, 25 ∘C) to pellet the cells. The supernatant was decanted and the cells dispersed in CMM lacking a carbon or nitrogen source (OD600=0.2). The cells were aliquoted (2 mL) into sterile 35 mL serum bottles, which were then stoppered (Geomicrobial Technologies, Inc.) and crimp-sealed. An anaerobic environment was created by sparging the cells with UHP N2 for 20 min. Sparging was accomplished by inserting one sterile stainless-steel needle (no. 20 Thomas Scientific, Swedesboro, NJ, USA) carrying N2 through the stopper into the media while a second sterile stainless-steel needle was inserted through the stopper and into the headspace to allow gas to exit. Following sparging, the bottles were allowed to reach atmospheric pressure, and reactions were then initiated by injecting 20 µL of the carbon source (anaerobic) to reach a final concentration of 0.01, 0.1, 1 or 10 mM. Treatments with citrate and succinate concentrations of 1 and 10 mM were conducted for both bacterial taxa. Treatments of citrate and succinate at 0.1 mM were only conducted for P. chlororaphis. Treatments with a carbon source concentration of 0.01 mM were only conducted with succinate but were done so for both taxa. The addition of the carbon source was followed by adding 26 µL of 0.1 M NaNO3 (anaerobic) to reach a final concentration of 1.3 mM. The δ15N and δ18O of the source was 5.4 and 24.5 ‰, respectively.
2.3 Isotope analysis and modelling isotope behaviour
Each treatment consisted of four denitrification cultures. Headspace samples were obtained from each culture with a gas-tight syringe (Hamilton; Reno, NV). For one of the four cultures, a 100 µL headspace sample was obtained every 15 min for analysis of N2O concentration. Headspace N2O concentration of this culture was determined with a Shimadzu Greenhouse Gas Analyzer gas chromatograph equipped with an electron capture detector (ECD) (model GC-2014, Shimadzu Scientific Instruments; Columbio, MD, USA). For details regarding this method see Yang et al. (2014). These data were used to determine when the N2O concentration was sufficient for isotope analysis and to estimate the volume of headspace required for isotope analysis over the course of the reaction. Headspace sampling of the remaining three cultures was initiated when the N2O concentration determined by ECD was above ca. 0.4 ppm. Headspace samples between 200 and 500 µL of each of the three cultures were injected into 60 mL serum bottles (one per culture) that had been sparged with UHP N2 for 15 min, and stored for isotope analysis. Each bottle contained between 5 and 15 nmols of N2O for isotopic analysis. Samples were analysed on an IsoPrime100 stable isotope ratio mass spectrometer (IRMS) interfaced to a TraceGas inlet system (Elementar; Mt. Laurel, NJ) (Sutka et al., 2003). The inlet system used He as the carrier gas and removed both water and CO2 with separate magnesium perchlorate (Costech; Valencia, CA, USA) and CO2 absorbent traps (Carbosorb, 8–14 mesh, Costech; Valencia, CA, USA), respectively, prior to concentrating N2O within a cryofocusing trap. Chromatographic separation of N2O was achieved with a Porplot Q column prior to isotopic analysis. Mass overlap and related corrections followed the protocol outlined in Toyoda and Yoshida (2000). Our internal laboratory pure N2O tank standard (MSU Tank B) was isotopically characterized by analysis relative to the USGS51 and USGS52 reference materials (https://isotopes.usgs.gov/lab/referencematerials.html; last access: 13 June 2018). Following the guidelines proposed by Coplen (2011) we report here the isotope values of the reference materials as well as our internal laboratory standard. The δ15N, δ18O, δ15Nα, δ15Nβ and SP values of USGS51 and USGS52 are 1.3, 41.2, 0.5, 2.2 and −1.7 ‰ and 0.4, 40.6, 13.5, −12.6 and 26.2 ‰, respectively. The δ15N, δ18O, δ15Nα, δ15Nβ and SP values of reference MSU Tank C are −0.9, 0.7, −2.6, 39.6 and 3.4 ‰, respectively. The δ15N, δ18O, δ15Nα, δ15Nβ and SP values of the isotope standard MSU Tank B are −0.5, 11.13, −12.2, 40.8 and 23.3 ‰, respectively. All nitrogen isotope values are reported with respect to the international air N2 standard and with respect to VSMOW for δ18O. The mean precision of replicate N2O standards were 0.1 ± 0.1, 0.3 ± 0.2, 0.3 ± 0.2, 0.2 ± 0.1 and 0.6 ± 0.3 ‰ composition for δ15N, δ15Nα, δ15Nβ, δ18O and SP, respectively.
The δ15N and δ18O values are reported as
where R is the ratio of the trace to the abundant isotope of N or O, and air and VSMOW are the standards for N and O, respectively. Site preference is defined as
where δ15Nα and δ15Nβ are the isotope values at the central and peripheral N atom of the linear N2O molecule, respectively. The changes in δ15N, δ18O and SP of N2O during the course of the reaction were investigated using the Rayleigh equation by plotting each isotope value vs. [], where f is the fraction of substrate remaining (Mariotti et al., 1981). According to convention (Mariotti et al., 1981), the magnitude of the isotopic fractionation factor (α) for a single unidirectional reaction is defined by the rate constants of the light (k1) and heavy (k2) isotopically substituted compounds:
Further, the isotopic enrichment factor, ε, is defined as
and can be estimated from the slope of the linear relationship described by the Rayleigh model:
where δ15Np is the isotope value of the accumulated product, δ15Nso is the isotope value of the initial substrate, ε is the fractionation factor and f is the fraction of substrate remaining (Mariotti et al., 1981). The fraction of substrate remaining was determined by dividing twice the amount of N2O produced by the total amount of nitrate added, and then subtracting this quantity from 1. Generalized additive modelling of the relationship between the isotope value of N2O and [] indicated asymptotic curvilinear behaviour. Therefore, we performed non-linear least squares regression starting with a three-parameter exponential function of the form
Model reduction and selection were performed following the methods of Baty et al. (2015). A non-linear model fit was also compared to a linear model fit. Models with the lowest residual standard error, fewest iterations to convergence (< 10), lowest parameter confidence intervals and lowest collinearity of variables were deemed to have the best fit. The goodness of fit for each model was also assessed visually from residual plots. Model residuals that displayed patterns were also deemed poor. This process produced an exponential function with the generalized form
where y is the isotope value of the accumulated product, x is [] and a and b are coefficients estimated by the model. Values of a affect the y intercept, with larger values contributing to increased prediction of the final isotope value of the reaction. Values of b affect the rate of change of the isotope values particularly at the beginning of the reaction. Larger values of b result in a more gradual rate of change, whereas lower values of b increase the initial slope. The starting values supplied to the function were a=7 and b=5 for δ15N and a=75 and b=10 for δ18O. These starting values were selected because they are greater than the expected coefficients, which aids in model convergence (Baty et al., 2015). The derivative of Eq. (7),
can be used to predict the slope at any extent of the reaction. The term net isotope effect (η) has been used to describe isotopic discrimination, the change in isotope value, observed during a multi-step reaction (Jinuntuya-Nortman et al., 2008). Therefore, η is equivalent to y′ in Eq. (8).
We used kernel density estimation to illustrate the density distribution (DD) of η across the extent of the reaction observed. Kernel density estimation is a non-parametric method of determining the probability density function of a random continuous variable. Probability density functions were determined with a Gaussian smoothing kernel from 50 equally spaced estimates of η, spanning the complete extent of the reaction (i.e. f=0 to 1). The bandwidth was set to 1 for each density estimate.
Modelling was performed with R statistical software (R Team, 2013), and all figures were produced with ggplot2 (Wickham, 2009, 2011).
2.4 Statistical analysis of SP data
We used a linear model to determine if SP changed as a function of []. Significant relationships were not observed and therefore the effect of taxa, carbon source and carbon source concentration on mean SP was examined with the analysis of variance (ANOVA). Tukey's honest significant difference (HSD) test was used to identify significant differences between and among groups. Normality of the data was assessed with Q–Q plots and the Shapiro–Wilk test.
Statistical analyses were performed with R statistical software (R Team, 2013), and all figures were produced with ggplot2 within that software platform (Wickham, 2009, 2011).
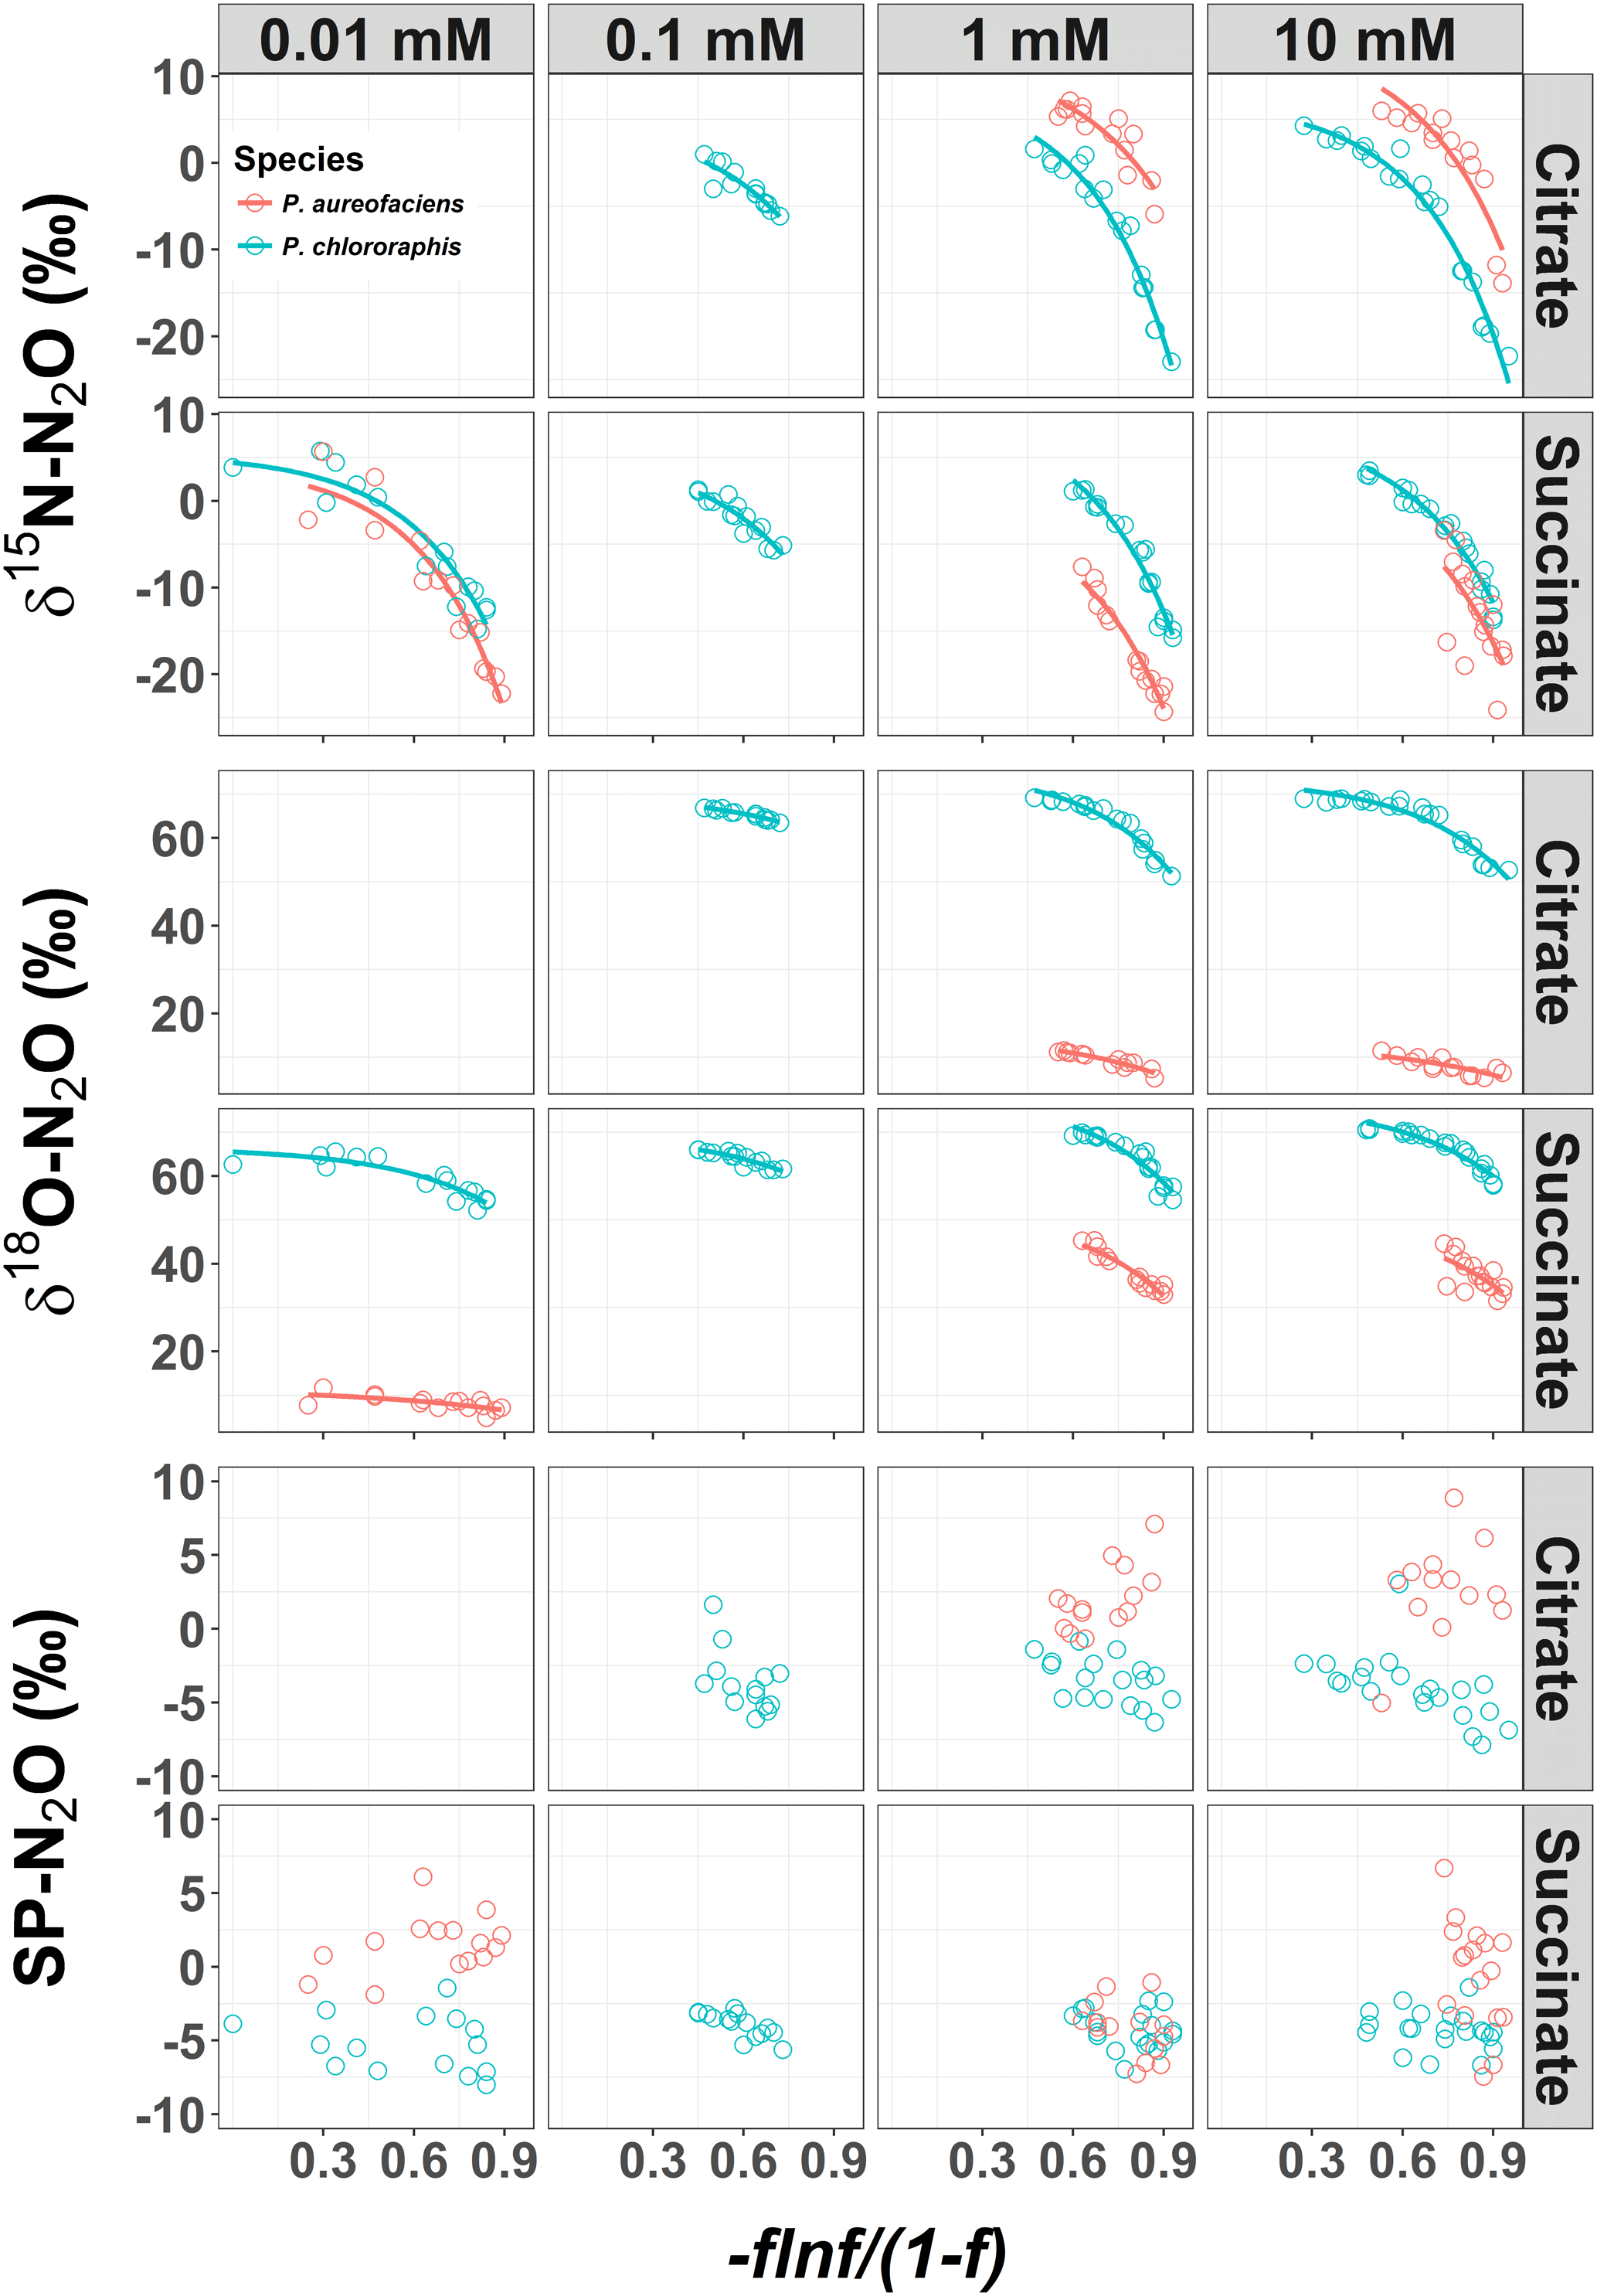
Figure 1δ15N, δ18O and site preference (SP) of N2O produced during denitrification of by Pseudomonas chlororaphis subsp. aureofaciens and Pseudomonas chlororaphis subsp. chlororaphis with different electron donor sources and concentrations. A larger value of [)], where f is the fraction of substrate remaining, represents earlier points in the reaction. The curved relationships are of the form , where y is the isotope value, x is [)] and a and b are the estimated coefficients that affect the y intercept and curvilinear shape, respectively.
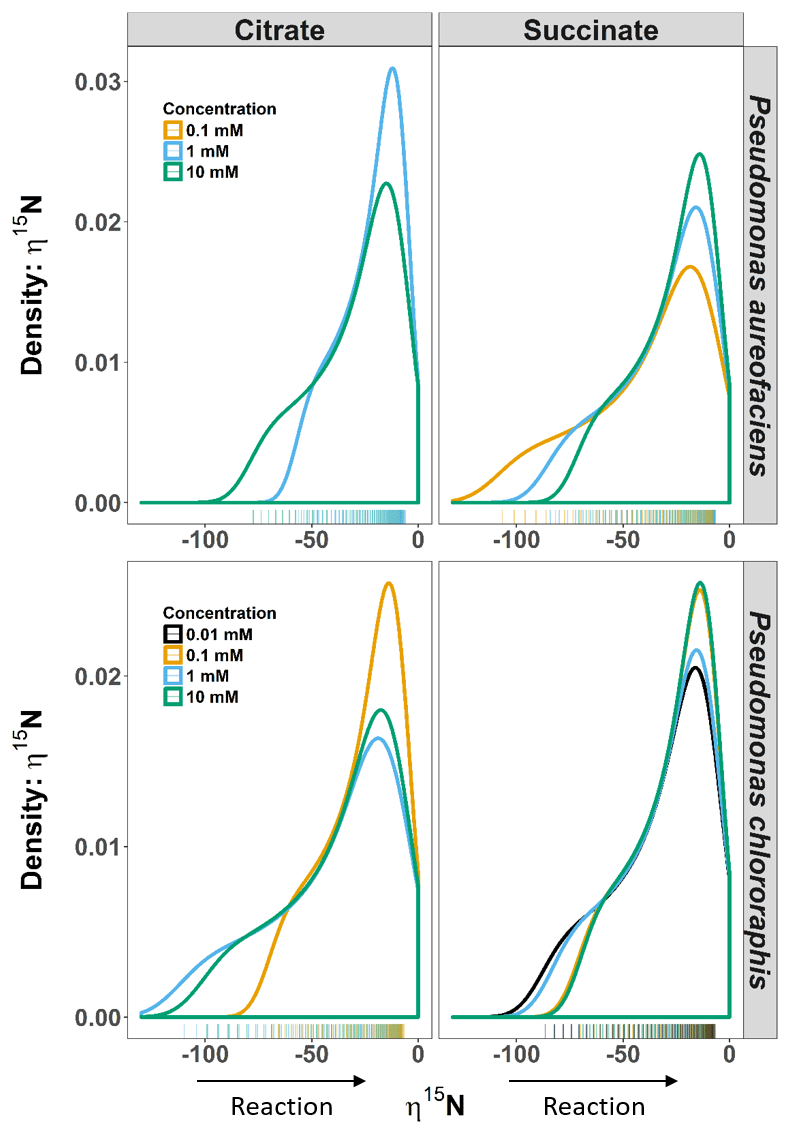
Figure 2Density distributions (DDs) of δ15N net isotope effects (η) derived from the derivative of the exponential function (Eq. 4) describing the relationship between δ15N and [] for Pseudomonas aureofaciens (orange) and Pseudomonas chlororaphis (blue). Estimates of η were produced over the entire extent of the reaction (i.e. f=0 to 1). The left panel displays the DDs for citrate treatments and the right panel displays the DDs for succinate treatments. Positive values of η were not observed during reactions. Tally marks at the base of each panel indicate the actual distribution of calculated values.
3.1 Effect of carbon source and concentration on δ15N–N2O
The δ15N of N2O produced by the two denitrifier taxa in our study produced a non-linear relationship, with the fraction of substrate remaining expressed in the Rayleigh model as [] (Fig. 1). The derivative, Eq. (5), of the exponential equation for the curvilinear relationship between the isotope value and [] Eq. (4), indicated that η15N changed over the course of the reaction (Fig. 1, Supplement Table S1). Estimates of η15N during denitrification of to N2O by P. aureofaciens ranged from −77.5 to −18.4 ‰ and −106.2 to −11.4 ‰ for citrate and succinate, respectively, while values ranged from −119 to −9.2 ‰ and −82.1 to −5.1 ‰ for citrate and succinate, respectively, during denitrification by P. chlororaphis (Fig. 2, Table S1). Density distributions of η15N for all treatments show that the majority of values are of lower magnitude, and values between −50 and −10 ‰ were most probable. High magnitude values for η occurred at the beginning of reactions, where values of [] are high (i.e. closer to 1).
3.2 Effect of carbon source and concentration on δ18O–N2O
The δ18O of N2O produced by the two taxa displayed a non-linear relationship with [] (Fig. 1), and much like δ15N, an exponential model Eq. (4) was the most parsimonious fit. The exponential equations determined for each treatment along with the derivatives are presented in the Supplement (Table S2). Similar to the variation in η15N, the most rapid changes in η18O occurred early in the extent of the reactions (i.e. larger values of []). Estimates of η18O determined following denitrification of by P. aureofaciens ranged from −22.2 to −9.8 ‰ and −77.0 to −3.1 ‰ for citrate and succinate, respectively, while the reduction of to N2O by P. chlororaphis produced η18O values that ranged from −75.4 to −7.5 ‰ and −67.8 to −4.0 ‰ for citrate and succinate, respectively. Density distributions of η18O indicated that treatments with narrow observed f ranges were not strictly associated with narrow DDs (Figs. 1 and 3). For instance, the observed f range for P. aureofaciens reduction with 0.01 mM succinate was nearly 0.6, while the range in η18O was less than −10 ‰. The rate of change of the function's slope is controlled by parameter b in Eq. (4). Therefore, lower estimates of parameter b produce narrow ranges of η18O, such as that observed for P. aureofaciens reactions with a succinate concentration of 0.01 mM.
3.3 Site preference as a function of carbon source and concentration
Site preference did not change as a function of the extent of the reaction, and across all treatments SP ranged from −7.0 to 6.0 ‰ (Fig. 1). Denitrification by P. aureofaciens produced a mean SP of 0 ‰ (SD of 3.3 ‰); however negative SPs observed at 1 mM succinate (mean of −4.2 ‰, SD of 1.8 ‰) contributed greatly to this value (Fig. 4). Denitrification of by P. chlororaphis produced mean SP values that were similar among all carbon source treatments – −3.7 (SD of 2.2 ‰) and −4.2 ‰ (SD of 1.2 ‰) for citrate and succinate, respectively.
The analysis of variance identified a significant difference in SP values among the treatments examined for each species (ANOVA, p < 0.001). In four of the treatments, the average SP of P. chlororaphis denitrification was lower than that of P. aureofaciens. This resulted in a difference of 4.1 ‰ between the average SP of P. chlororaphis and P. aureofaciens. In addition to taxa, the carbon source (i.e. succinate or citrate) also contributed somewhat to differences in SP between treatments (ANOVA; p < 0.01), with growth on succinate producing SP values 0.9 ‰ lower than those produced with citrate as the carbon source. Interestingly, the concentration of the carbon source had no discernible effect on SP under our reaction conditions. Therefore, the variation in SP was largely dependent on taxa (Fig. 4).
This study investigated the effect of the denitrifier species, the carbon source (electron donor) and the electron donor concentration on δ15N, δ18O and SP isotope values of N2O produced during denitrification in pure cultures. We observed isotopic discrimination against 15N and 18O but no change in SP during the reduction of to N2O by P. aureofaciens or P. chlororaphis, and these observations held, regardless of carbon source and electron donor concentration.
In contrast to the expectation of the Rayleigh model, the reduction of to N2O by P. aureofaciens and P. chlororaphis displayed a non-linear exponential relationship between δ15N vs. [] and δ18O vs. []. This curvilinear isotopic behaviour was evident for denitrification metabolizing both carbon substrates (citrate or succinate) and at all substrate concentrations (Fig. 2, Table S1). The non-linear behaviour indicates that the fractionation factor, ε, is not constant, a phenomenon not unexpected for multi-step reactions in which more than one enzymatic step and diffusion of products and/or substrates into and out of the cell can result in variation in isotopic discrimination (Granger et al., 2008; Sutka et al., 2008). Because the fractionation factor varies during multi-step reactions, it is best considered a net isotope effect (η) (Jinuntuya-Nortman et al., 2008). The reduction of to N2O during denitrification involves three enzymes and multiple opportunities for diffusion, all cases where isotope discrimination can occur (Fig. 5). Similar to other studies, our previous work on denitrification estimated η from a Rayleigh model (Barford et al., 1999; Lewicka-Szczebak et al., 2014; Sutka et al., 2006; Toyoda et al., 2005; Yano et al., 2014). However, the Rayleigh model assumes a unidirectional single-step reaction with linear behaviour, assumptions that are clearly not valid for N2O production from nitrate during denitrification. Thus, here we developed estimates of η from the derivative of the exponential relationship between the isotope value of the accumulated product, N2O, and the extent of the reaction []. This allowed us to quantify changes in η over the course of the denitrification reaction.
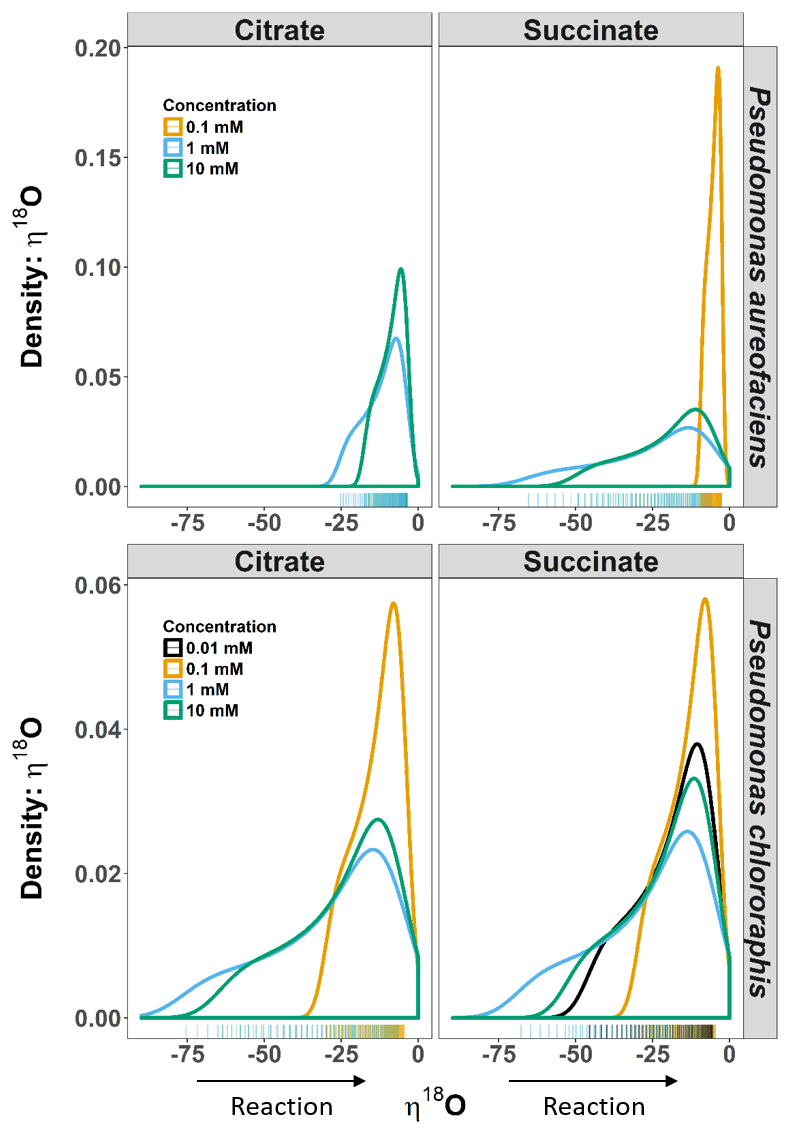
Figure 3Density distributions (DDs) of δ18O net isotope effects (η) estimated from the derivative of an exponential function describing the relationship between δ18O and [] for Pseudomonas aureofaciens (orange) and Pseudomonas chlororaphis (blue). The estimates of η are extrapolated to include the complete extent of the reaction. The left panel displays the DDs for citrate treatments and the right panel displays DDs for succinate treatments. Positive values of η were not observed during reactions. Tally marks at the base of each panel indicate the actual distribution of calculated values.
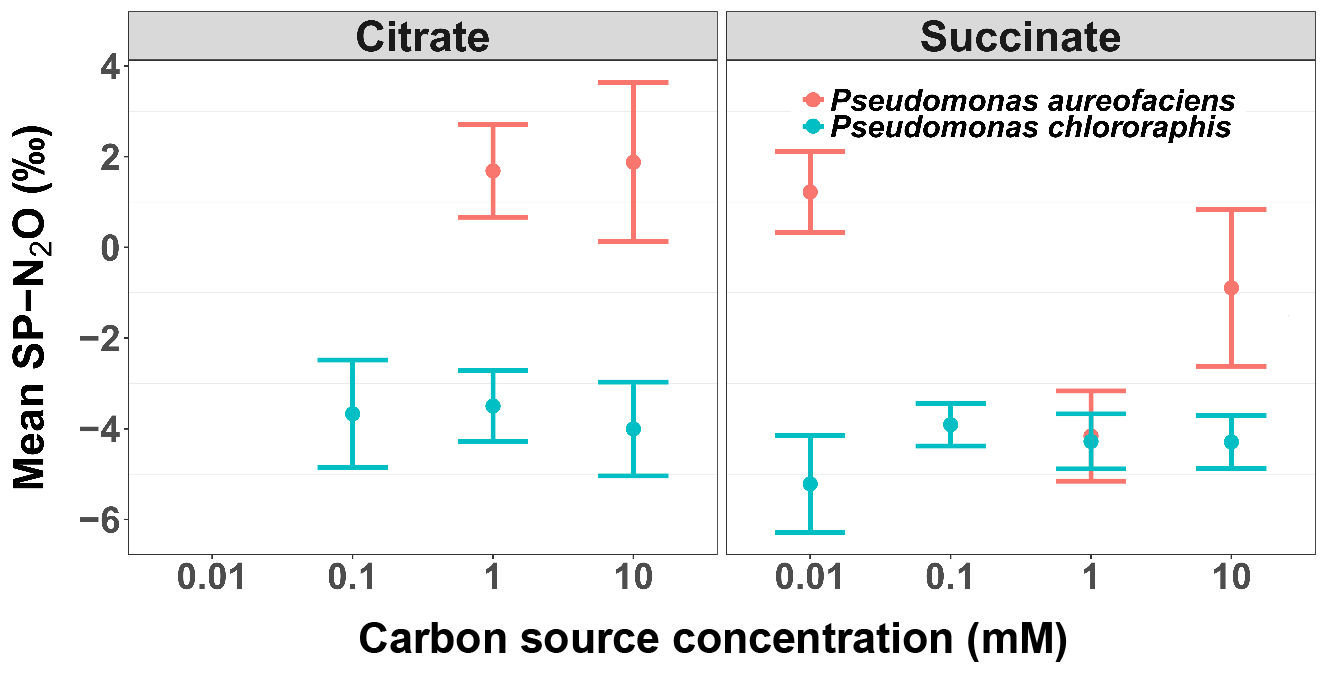
Figure 4The mean site preference (SP) of N2O produced during the reduction of by Pseudomonas aureofaciens (orange) and Pseudomonas chlororaphis (blue) with different concentrations of electron donors: citrate and succinate. Error bars indicate 1 SD.
For our entire data set, η15N and η18O varied by as much as ca. 100 ‰ within a single experiment (Figs. 2, 3). Note, however, that during N2O production, both δ18O and η18O can be influenced by oxygen exchange between water and nitrogen oxides (Kool et al., 2009, 2011). These oxygen exchange effects are difficult to quantify, making interpretation of η18O data difficult. Additionally, visual inspection of the covariation between δ18O and δ15N indicated similar trends among treatments and species, and the observed kinetic isotope effect for δ18O suggests that there is little exchange with H2O in the reaction vessels (Fig. 1). Thus, we limit our discussion of fractionation to η15N. Values of η15N previously reported for reduction of to N2O in pure cultures (−43 to −9 ‰) fall within the range we observed (Sutka et al., 2006, 2008; Toyoda et al., 2005). However, some of our values are much greater in magnitude than those previously reported (e.g. −119 ‰). Values of such magnitude occurred near the onset of the reaction (i.e. high values of []), most notably when no more than 10 % of the had been reduced. The occurrence of high magnitude η values near the beginning of the reaction is likely related to the relative importance of diffusion and enzymatic fractionation in controlling η. Fractionation associated with enzymes is often much larger than that associated with diffusion, and enzymatic fractionation is fully expressed when diffusion does not limit substrate supply to the enzyme (Jinuntuya-Nortman et al., 2008; Ostrom and Ostrom, 2012). Thus, the largest η is expected at the beginning of the reaction, consistent with what we observed. Large magnitude values for η can be easily missed if the isotope value of the accumulated product is used to estimate η. Without knowledge of the production rate, it can be difficult to know when there is sufficient product for isotopic measurement. By characterizing production rates before initiating experiments to estimate η, we were able to capture isotope values for N2O close to the onset of the reaction.

Figure 5A schematic representation of the multi-step reduction of nitrate to nitrous oxide during denitrification specific to Pseudomonas aureofaciens and Pseudomonas chlororaphis, which lack the enzyme nitrous oxide reductase. The enzymes responsible for the reduction of nitrogen species appear in boxes with rounded corners and are indicated by three letter sequences: nitrate reductase (NAR), nitrite reductase (NIR) and nitric oxide reductase (NOR). A nitrate/nitrite transporter protein is presented as a hexagon. The position of the enzymes with respect to the periplasm, membrane or cytoplasm identifies the location of the enzymes in the cell. Vertical dashed arrows indicate diffusion of various nitrogen species into and out of the cell, and curved dashed arrows represent transport across the membrane. Solid arrows represent enzyme-catalyzed reduction steps.
There are important reasons why published discrimination factors might be less negative and therefore of lower magnitude than ours. Prior estimates were derived from a single slope from a Rayleigh model and, therefore, do not produce estimates of η over the course of the reaction. Importantly, they may not characterize the large fractionation occurring at the onset of a reaction. Even so, our highly negative values for η might, initially, seem remarkable. Considering variation in η in the context of a multi-step model provides insight into how these values might arise, particularly in the early stages of a culture when the substrate concentration is high. The reduction of to N2O includes three enzymatic steps in which substantive fractionation may occur (Fig. 5). As a consequence, we would expect the products of each successive reaction to become progressively depleted in the heavy isotope, assuming normal ε. If, for example, the ε for each of the three steps was −40 ‰, then reduction of nitrate with a δ15N of 0 ‰ could yield N2O of −120 ‰. Thus, denitrification has the potential to produce N2O that is greatly depleted in 15N, resulting in highly negative values for η. As the reaction proceeds, each enzyme is likely to be limited by the supply of substrate from diffusion. This has a tendency to reduce the expression of fractionation, and η is therefore reduced to less negative values.
Probability density distributions indicate that markedly low η values associated with one endpoint of the range in η are not common (Fig. 3). They also illustrate the range in η that would be expected for the reaction, and their shape emphasizes important changes in η during the course of a reaction. For example, several of the distributions show a marked change in slope on the left side of the distribution (e.g. 10 mM citrate η15N, both species) that is a consequence of a significant change in slope along the curve of δ15N vs. [] (Figs. 1, 3). While we cannot ascribe a specific event to this change, future studies aimed at investigating specific enzymes may provide a better understanding of the behaviour of η during denitrification. Perhaps most importantly, these distributions emphasize that assessments of net isotope effects for multi-step reactions will not be complete without consideration of isotopic behaviour over a wide extent of the reaction and the development of models that describe isotope behaviour that does not fit a linear Rayleigh model.
In contrast to the results we observed for δ15N and δ18O, isotopic discrimination was not evident for SP, regardless of treatment (Fig. 2). Instead, SP was constant during the course of the reaction. This finding is consistent with pure culture studies of nitrification and denitrification across multiple species (Frame and Casciotti, 2010; Sutka et al., 2003, 2006; Toyoda et al., 2005). The differences we observed in SP between species, however, is likely to relate to the factors that control SP. Unlike the case for bulk isotopes, SP is determined during a single reaction, the reduction of NO to N2O (Toyoda et al., 2005). Thus, as N2O reduction does not occur in P. aureofaciens or P. chlororaphis, SP is only influenced by nitric oxide reductase (NOR) activity and diffusion of NO or N2O into or out of the cell. As SP is the difference between the δ15N value of two N atoms that rely on the same NO substrate, SP is not dependent upon the isotopic composition of the initial substrate (Toyoda et al., 2005; Sutka et al., 2006). The observation that SP remained constant during bacterial denitrification, even though the extent of the reaction varied, (e.g. Sutka et al., 2006) suggests that the expressed fractionation for the α and β N atoms during NO reduction was the same. If so, then one hypothesis is that f can vary markedly and SP will be constant. However, during production of N2O by the pure fungal cytochrome P450 NOR enzyme, distinct fractionation factors for the α and β N atoms were observed and it was proposed that observations of constant SP values during production by fungi were the result of f, or the internal pool size of NO, being held relatively constant during cellular metabolism (Yang et al., 2014). We observed a minor but significant different in SP between two species of Pseudomonas sp. during N2O production that is consistent with a difference in the internal pool size of NO within the cell. The abundance of NO within the cell will depend on its production, reduction and losses due to diffusion into or out of the cell, all of which could vary between species. We do not know, for example, the degree to which the rate of NO production intrinsically differs between the cd1-type NIR of P. chlororaphis and copper-containing NIR of P. aureofaciens or how gene expression may alter these rates. We posit that small differences in SP between and even within species in our study and others may relate to the size of the NO pool available to NOR.
Nitrous oxide is the third most abundant greenhouse gas in the atmosphere and is the greatest source of stratospheric ozone depletion (Ravishankara et al., 2009). Moreover, efforts to balance the N2O budget have been challenged by the episodic nature of the N2O flux (Nishimura et al., 2005) and, historically, identifying the pathway of N2O production has been enigmatic (Schreiber et al., 2012). Here we emphasize that within our toolbox, SP remains a robust indicator of N2O derived from denitrification, regardless of carbon source or concentration, and we identify that a component of the variation in SP can be ascribed to species differences. Our ability to understand factors that control variation in SP is important for the refining of estimates of the relative importance of N2O production pathways, something that is necessary for the mitigation of fluxes of this important greenhouse gas from aquatic and terrestrial environments.
The isotope data used for the paper are included in Fig. 1 and Figs. S1 and S2 in the Supplement. For questions regarding the data described herein, please contact Peggy H. Ostrom.
The supplement related to this article is available online at: https://doi.org/10.5194/bg-15-3873-2018-supplement.
The authors declare that they have no conflict of interest.
This work was funded by the DOE Great Lakes Bioenergy Research Center (DOE
BER Office of Science DE-FC02-07ER64494) and by the National Science
Foundation's (NSF) Earth Sciences Instrumentation and Facilities Program
(grant no. 1456430). We would like to thank Hasand Gandhi from Michigan State
University for his insight and direction during isotope analyses.
Edited by: Xinming Wang
Reviewed by: two anonymous referees
Anderson, I. C., Poth, M., Homstead, J., and Burdige, D.: A comparison of NO and N2O production by the autotrophic nitrifier Nitrosomonas europaea and the heterotrophic nitrifier Alcaligenes faecalis, Appl. Environ. Microbiol., 59, 3525–3533, 1993.
Barford, C. C., Montoya, J. P., and Altabet, M. A.: Steady-State Nitrogen Isotope Effects of N2 and N2O Production in Paracoccus denitrificans, Appl. Environ. Microbiol., 65, 989–994, 1999.
Baty, F., Ritz, C., Charles, S., Brutsche, M., Flandrois, J.-P., and Delignette-Muller, M.-L.: A Toolbox for Nonlinear Regression in R?: The Package nlstools, J. Stat. Softw., 66, 1–21, https://doi.org/10.18637/jss.v066.i05, 2015.
Coplen, T. B.: Guidelines and recommended terms for expression of stable-isotope-ratio and gas-ratio measurement results, Rapid Commun. Mass Sp., 25, 2538–2560, https://doi.org/10.1002/rcm.5129, 2011.
Davidson, E. A. and Keller, M.: Isotopic variability of N2O emissions from tropical forest soils, Global Biogeochem. Cy., 14, 525–535, 2000.
Denman, K. L.: Climate Change 2007 – The Physical Science Basis: Working Group I Contribution to the Fourth Assessment Report of the IPCC, Cambridge Univ. Press, 499–587, available from: http://www.amazon.com/Climate-Change-2007-Contribution-Assessment/dp/0521880092 (last access: 13 June 2018), 2007.
Frame, C. H. and Casciotti, K. L.: Biogeochemical controls and isotopic signatures of nitrous oxide production by a marine ammonia-oxidizing bacterium, Biogeosciences, 7, 2695–2709, https://doi.org/10.5194/bg-7-2695-2010, 2010.
Granger, J., Sigman, D. M., Lehmann, M. F., and Tortell, P. D.: Nitrogen and oxygen isotope fractionation during dissimilatory nitrate reduction by denitrifying bacteria, Limnol. Oceanogr., 53, 2533–2545, https://doi.org/10.4319/lo.2008.53.6.2533, 2008.
IPCC: Climate Change 2014: Synthesis Report, Contribution of Working Groups I, II and III to the Fifth Assessment Report of the Intergovernmental Panel on Climate Change, IPCC, Geneva, Switzerland, 151 pp., available at: https://www.ipcc.ch/pdf/assessment-report/ar5/syr/SYR_AR5_FINAL_full_wcover.pdf (last acces: 13 June 2018), 2014.
Jinuntuya-Nortman, M., Sutka, R. L., Ostrom, P. H., Gandhi, H., and Ostrom, N. E.: Isotopologue fractionation during microbial reduction of N2O within soil mesocosms as a function of water-filled pore space, Soil Biol. Biochem., 40, 2273–2280, https://doi.org/10.1016/j.soilbio.2008.05.016, 2008.
Kool, D. M., Müller, C., Wrage, N., Oenema, O., and Van Groenigen, J. W.: Oxygen exchange between nitrogen oxides and H2O can occur during nitrifier pathways, Soil Biol. Biochem., 41, 1632–1641, https://doi.org/10.1016/j.soilbio.2009.05.002, 2009.
Kool, D. M., Wrage, N., Oenema, O., Van Kessel, C., and Van Groenigen, J. W.: Oxygen exchange with water alters the oxygen isotopic signature of nitrate in soil ecosystems, Soil Biol. Biochem., 43, 1180–1185, https://doi.org/10.1016/j.soilbio.2011.02.006, 2011.
Kravchenko, A. N., Toosi, E. R., Guber, A. K., Ostrom, N. E., Yu, J., Azeem, K., Rivers, M. L., and Robertson, G. P.: Hotspots of soil N2O emission enhanced through water absorption by plant residue, Nat. Geosci., 10, 496–500, https://doi.org/10.1038/ngeo2963, 2017.
Lewicka-Szczebak, D., Well, R., Köster, J. R., Fuß, R., Senbayram, M., Dittert, K., and Flessa, H.: Experimental determinations of isotopic fractionation factors associated with N2O production and reduction during denitrification in soils, Geochim. Cosmochim. Ac., 134, 55–73, https://doi.org/10.1016/j.gca.2014.03.010, 2014.
Mariotti, A., Germon, J. C., Hubert, P., Kaiser, P., Letolle, R., Tardieux, A., and Tardieux, P.: Experimental determination of nitrogen kinetic isotope fractionation: Some principles; illustration for the denitrification and nitrification processes, Plant Soil, 62, 413–430, https://doi.org/10.1007/BF02374138, 1981.
McSwiney, C. P. and Robertson, G. P.: Nonlinear response of N2O flux to incremental fertilizer addition in a continuous maize (Zea mays L.) cropping system, Glob. Change Biol., 11, 1712–1719, https://doi.org/10.1111/j.1365-2486.2005.01040.x, 2005.
Nafziger, E. D., Sawyer, J. E., and Hoeft, R. G.: Formulating N Recommendations for Corn in the Corn Belt Using Recent Data, Proc. North Cent. Extension-Industry Soil Fertil. Conf., 20, 5–11, available from: http://www.agronext.iastate.edu/soilfertility/info/nrecNCEISFC-04.pdf (last access: 13 June 2018), 2004.
Nishimura, S., Sawamoto, T., Akiyama, T., Sudo, S., Cheng, W., and Yagi, K.: Continuous, automated nitrous oxide measurements from paddy soils converted to upland crops, Soil Sci. Soc. Am. J., 69, 1977–1986, https://doi.org/10.2136/sssaj2005.0035, 2005.
Ostrom, N. E. and Ostrom, P. H.: Handbook of Environmental Isotope Geochemistry, edited by: Baskaran, M., Springer-Verlag, Heidelberg, 453–476, 2012.
Ostrom, N. E. and Ostrom, P. H.: Mining the isotopic complexity of nitrous oxide: a review of challenges and opportunities, Biogeochemistry, 132, 359–372, https://doi.org/10.1007/s10533-017-0301-5, 2017.
Pan, B., Lam, S. K., Mosier, A., Luo, Y., and Chen, D.: Ammonia volatilization from synthetic fertilizers and its mitigation strategies: A global synthesis, Agr. Ecosyst. Environ., 232, 283–289, https://doi.org/10.1016/j.agee.2016.08.019, 2016.
Park, S., Pérez, T., Boering, K. A., Trumbore, S. E., Gil, J., Marquina, S., and Tyler, S. C.: Can N2O stable isotopes and isotopomers be useful tools to characterize sources and microbial pathways of N2O production and consumption in tropical soils?, Global Biogeochem. Cy., 25, 1–16, https://doi.org/10.1029/2009GB003615, 2011.
Paustian, K., Lehmann, J., Ogle, S., Reay, D., Robertson, G. P., and Smith, P.: Climate-smart soils, Nature, 532, 49–57, https://doi.org/10.1038/nature17174, 2016.
Perez, T., Trumbore, S. E., Tyler, S. C., Davidson, E. A., Keller, M., and de Camargo, P. B.: Isotopic variability of N2O emissions from tropical forest soils, Global Biogeochem. Cy., 14, 525–535, 2000.
Portmann, R. W., Daniel, J. S., and Ravishankara, A. R.: Stratospheric ozone depletion due to nitrous oxide: influences of other gases, Philos. Trans. R. Soc. B, 367, 1256–1264, https://doi.org/10.1098/rstb.2011.0377, 2012.
R Team: R Development Core Team, R: A language and environment for statistical computing,R Foundation for Statistical Computing, Vienna, Austria, https://www.R-project.org/, 2013.
Ramanathan, V., Cicerone, R. J., Singh, H. B., and Kiehl, J. T.: Trace gas trends and their potential role in climate change, J. Geophys. Res., 90, 5547–5566, https://doi.org/10.1029/JD090iD03p05547., 1985.
Ravishankara, A. R., Daniel, J. S., and Portmann, R. W.: Nitrous oxide (N2O): the dominant ozone-depleting substance emitted in the 21st century, Science, 326, 123–125, https://doi.org/10.1126/science.1176985, 2009.
Reay, D. S., Davidson, E. A., Smith, K. A., Smith, P., Melillo, J. M., Dentener, F., and Crutzen, P. J.: Global agriculture and nitrous oxide emissions, Nature Climate Change, 2, 410–416, https://doi.org/10.1038/nclimate1458, 2012.
Robertson, G. P. and Vitousek, P. M.: Nitrogen in Agriculture: Balancing the Cost of an Essential Resource, Annu. Rev. Env. Resour., 34, 97–125, https://doi.org/10.1146/annurev.environ.032108.105046, 2009.
Scharf, P. C., Shannon, D. K., Palm, H. L., Sudduth, K. A., Drummond, S. T., Kitchen, N. R., Mueller, L. J., Hubbard, V. C., and Oliveira, L. F.: Sensor-based nitrogen applications out-performed producer-chosen rates for corn in on-farm demonstrations, Agron. J., 103, 1683–1691, https://doi.org/10.2134/agronj2011.0164, 2011.
Schreiber, F., Wunderlin, P., Udert, K. M., and Wells, G. F.: Nitric oxide and nitrous oxide turnover in natural and engineered microbial communities: Biological pathways, chemical reactions, and novel technologies, Front. Microbiol., 3, 1–24, https://doi.org/10.3389/fmicb.2012.00372, 2012.
Sebilo, M., Mayer, B., Nicolardot, B., Pinay, G., and Mariotti, A.: Long-term fate of nitrate fertilizer in agricultural soils, P. Natl. Acad. Sci. USA, 110, 18185–18189, https://doi.org/10.1073/pnas.1305372110, 2013.
Shcherbak, I., Millar, N., and Robertson, G. P.: Global metaanalysis of the nonlinear response of soil nitrous oxide (N2O) emissions to fertilizer nitrogen, P. Natl. Acad. Sci. USA, 111, 9199–9204, https://doi.org/10.1073/pnas.1322434111, 2014.
Sutka, R. L., Ostrom, N. E., Ostrom, P. H., Gandhi, H., and Breznak, J. A.: Nitrogen isotopomer site preference of N2O produced by Nitrosomonas europaea and Methylococcus capsulatus bath, Rapid Commun. Mass Sp., 17, 738–745, https://doi.org/10.1002/rcm.968, 2003.
Sutka, R. L., Ostrom, N. E., Ostrom, P. H., Breznak, J. A., Pitt, A. J., Li, F., and Gandhi, H.: Distinguishing Nitrous Oxide Production from Nitrification and Denitrification on the Basis of Isotopomer Abundances, Appl. Environ. Microbiol., 72, 638–644, https://doi.org/10.1128/AEM.72.1.638-644.2006, 2006.
Sutka, R. L., Adams, G. C., Ostrom, N. E., and Ostrom, P. H.: Isotopologue fractionation during N2O production by fungal denitrification, Rapid Commun. Mass Sp., 22, 3989–3996, https://doi.org/10.1002/rcm.3820, 2008.
Toyoda, S., Mutobe, H., Yamagishi, H., Yoshida, N., and Tanji, Y.: Fractionation of N2O isotopomers during production by denitrifier, Soil Biol. Biochem., 37, 1535–1545, https://doi.org/10.1016/j.soilbio.2005.01.009, 2005.
Toyoda, S., Yoshida, N., and Koba, K.: Isotopocule analysis of biologically produced nitrous oxide in various environments, Mass Spectrom. Rev., 36, 135–160, https://doi.org/10.1002/mas.21459, 2017.
Venterea, R. T., Halvorson, A. D., Kitchen, N., Liebig, M. A., Cavigelli, M. A., Del Grosso, S. J., Motavalli, P. P., Nelson, K. A., Spokas, K. A., Singh, B. P., Stewart, C. E., Ranaivoson, A., Strock, J., and Collins, H.: Challenges and opportunities for mitigating nitrous oxide emissions from fertilized cropping systems, Front. Ecol. Environ., 10, 562–570, https://doi.org/10.1890/120062, 2012.
Wickham, H.: ggplot2, available from: http://books.google.com/books?id=rhRqtQAACAAJ&dq=intitle:ggplot2+inauthor:wickham&ie=ISO-8859-1&source=gbs_gdata (last access: 14 June 2018), 2009.
Wickham, H.: ggplot2, Wiley Interdiscip, Rev. Comput. Stat., 3, 180–185, https://doi.org/10.1002/wics.147, 2011.
Yamagishi, H., Westley, M. B., Popp, B. N., Toyoda, S., Yoshida, N., Watanabe, S., Koba, K., and Yamanaka, Y.: Role of nitrification and denitrification on the nitrous oxide cycle in the eastern tropical North Pacific and Gulf of California, J. Geophys. Res.-Biogeo., 112, 1–15, https://doi.org/10.1029/2006JG000227, 2007.
Yang, H., Gandhi, H., Ostrom, N. E., and Hegg, E. L.: Isotopic Fractionation by a Fungal P450 Nitric Oxide Reductase during the Production of N2O, Environ. Sci. Technol., 48, 10707–10715, https://doi.org/10.1021/es501912d, 2014.
Yano, M., Toyoda, S., Tokida, T., and Hayashi, K.: Soil Biology & Biochemistry Isotopomer analysis of production, consumption and soil-to- atmosphere emission processes of N2O at the beginning of paddy fi eld irrigation, Soil Biol. Biochem., 70, 66–78, https://doi.org/10.1016/j.soilbio.2013.11.026, 2014.
Yoshida, N.: 15N-depleted N2O as a product of nitrification, Nature, 335, 528–529, https://doi.org/10.1038/335528a0, 1988.
Yoshida, N. and Toyoda, S.: Constraining the atmospheric N2O budget from intramolecular site preference in N2O isotopomers, Nature, 405, 330–334, https://doi.org/10.1038/35012558, 2000.
Zhou, M. and Butterbach-Bahl, K.: Assessment of nitrate leaching loss on a yield-scaled basis from maize and wheat cropping systems, Plant Soil, 374, 977–991, https://doi.org/10.1007/s11104-013-1876-9, 2014.