the Creative Commons Attribution 4.0 License.
the Creative Commons Attribution 4.0 License.
 | 21 Sep 2018
Increase of dissolved inorganic carbon and decrease in pH in near-surface waters in the Mediterranean Sea during the past two decades
Liliane Merlivat
Jacqueline Boutin
David Antoine
Laurence Beaumont
Melek Golbol
Vincenzo Vellucci
Two 3-year time series of hourly measurements of the fugacity of CO2 (fCO2) in the upper 10 m of the surface layer of the northwestern Mediterranean Sea have been recorded by CARIOCA sensors almost two decades apart, in 1995–1997 and 2013–2015. By combining them with the alkalinity derived from measured temperature and salinity, we calculate changes in pH and dissolved inorganic carbon (DIC). DIC increased in surface seawater by ∼25 µmol kg−1 and fCO2 by 40 µatm, whereas seawater pH decreased by ∼0.04 (0.0022 yr−1). The DIC increase is about 15 % larger than expected from the equilibrium with atmospheric CO2. This could result from natural variability, e.g. the increase between the two periods in the frequency and intensity of winter convection events. Likewise, it could be the signature of the contribution of the Atlantic Ocean as a source of anthropogenic carbon to the Mediterranean Sea through the Strait of Gibraltar. We then estimate that the part of DIC accumulated over the last 18 years represents ∼30 % of the total inventory of anthropogenic carbon in the Mediterranean Sea.
- Article
(895 KB) - Full-text XML
- Companion paper
- BibTeX
- EndNote


The concentration of atmospheric carbon dioxide (CO2) has been increasing rapidly over the 20th century. As a result, the concentration of dissolved inorganic carbon (DIC) in the near surface ocean increases, which drives a decrease in pH in order to maintain a chemical equilibrium. These changes have complex direct and indirect impacts on marine organisms and ecosystems (Gattuso and Hansson, 2011). Empirical methods to estimate the anthropogenic CO2 penetration in the ocean since the industrial revolution have improved over the past few decades (Chen and Millero, 1979; Gruber et al., 1996; Sabine et al., 2008; Touratier and Goyet, 2004, 2009; Woosley et al., 2016). As the concentration of anthropogenic carbon, Cant, cannot be distinguished from the natural background of DIC through total DIC measurements, these methods are based on the analysis of different chemical properties of the water column. Direct estimates of the anthropogenic CO2 absorption in the sea surface layers are difficult due to the large natural variability driven by physical and biological phenomena. Bates et al. (2014) have extracted the trend from the large variability based on the analysis of a long time series (monthly or seasonal sampling). For the global surface ocean, Lauvset et al. (2015) have used the Surface Ocean CO2 Atlas (SOCAT) database (Bakker et al., 2014) combined with an interpolation method. Estimates of anthropogenic storage in the Mediterranean Sea differ by about a factor of 2 (Huertas et al., 2009; Touratier and Goyet, 2009). In addition to the anthropogenic signal, oceanic DIC can also be the signature of a strong inter-annual variability. In the North Atlantic, for instance, McKinley et al. (2011) have shown that the long-term trend emerges only after more than 25 years because of natural variability.
A high-frequency sampling of the seawater carbon chemistry at the air-water interface over extended periods of time is useful in assessing the trends and variability of DIC. In this paper we analyse two 3-year time series of hourly fugacity of CO2, (fCO2), measured with autonomous CARIOCA sensors (Copin-Montégut et al., 2004; Merlivat and Brault, 1995) in 1995–1997 and 2013–2015 at two nearby locations in the northwestern Mediterranean Sea (Fig. 1). Using measured fCO2, temperature (T) and salinity (S), we derive the other variables of the carbonate system (pH and DIC). The experimental setting is first described, and the recent data obtained over the 2013–2015 period are presented. Combined with the 1995–1997 measurements previously published (Hood and Merlivat, 2001), we estimate the decrease in pH and the increase in DIC. The results are discussed with respect to the contributions of the exchange with atmospheric CO2, the possible impact of vertical mixing and recent estimates of the transport of anthropogenic carbon from the Atlantic Ocean over a 18-year period.
2.1 The BOUSSOLE and DYFAMED sites
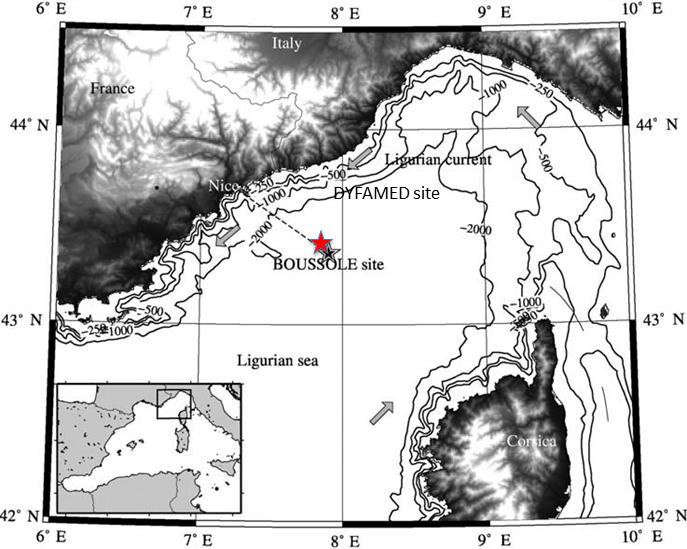
Figure 1The area of the northwestern Mediterranean Sea showing the southern coast of France, the Island of Corsica, the main current branches (gray arrows), the location of the DYFAMED site (43∘25′ N, 7∘52′ E, red star) (http://doi.org/10.17882/43749, last access: 14 September 2018) and the BOUSSOLE buoy (43∘22′ N, 7∘54′ E, black star) in the Ligurian Sea.
Data collection was carried out at the BOUSSOLE site (43∘22′ N, 7∘54′ E) in 2013–2015 (Antoine et al., 2006, 2008) and at the DYFAMED site (43∘25′ N, 7∘52′ E) in 1995–1997 (Marty et al., 2002). These sites are 3 nautical miles apart, both located in the Ligurian Sea, one of the basins of the northwestern Mediterranean Sea (Fig. 1). The water depth is ∼2400 m. The prevailing ocean currents are usually weak (< 20 cm s−1), because these sites are in the central area of the cyclonic circulation that characterises the Ligurian Sea. The two sites surrounded by the permanent geostrophic Ligurian frontal jet flow are protected from coastal inputs (Antoine et al., 2008; Heimbürger et al., 2013; Millot, 1999). Monthly cruises are carried out at the same location.
2.2 Analytical methods
At DYFAMED, fCO2 measurements at 2 m were provided by an anchored floating buoy fitted with a CARIOCA sensor. At BOUSSOLE, measurements were carried out from a mooring normally dedicated to radiometry and optical measurements where two CARIOCA sensors were attached. Both monitored fCO2 hourly at the 3 and 10 m depths (although only one of the two depths was equipped with a functional sensor at some periods); S and T were monitored at the same two depths using a Seabird SBE 37-SM MicroCat instrument. The CARIOCA sensors were adapted to work under pressure in the water column. They were swapped about every 6 months, with serviced and calibrated instruments replacing those which were previously deployed. The accuracy of CARIOCA fCO2 measurements by the spectrophotometric method based on the optical absorbance of a solution thymol blue diluted in seawater is estimated at 2 µatm during both periods. Hood and Merlivat (2001) have reported agreement between the fCO2 measured by CARIOCA buoys, similar to the one deployed at DYFAMED, with ship-based measurements during a number of field programs and with an accuracy of 2 µatm and a precision of 5 µatm.
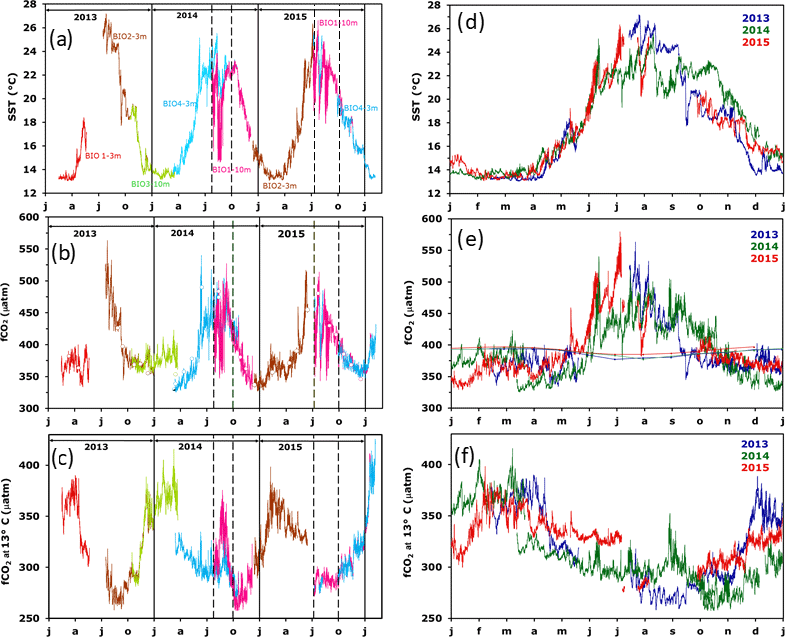
Figure 2Inter-annual variability of CARIOCA data on the BOUSSOLE mooring; left column represents a function of time and right column a function of months for a given year (blue for 2013, green for 2014 and red for 2015). (a, d) T, (b, e) fCO2 and (c, f) fCO2@13 ∘C. In (a–c), the dotted lines indicate the period affected by stratification and internal waves (26 July to 1 October 2014 and 8 July to 1 October 2015). In (b), the open circles correspond to fCO2 data derived from DIC and alkalinity measurements of samples taken at 5 and 10 m. In (e), the thin lines indicate fCO2atm. Note that the colour code on (d–f) is different from (a–c).
At Boussole, newly designed fCO2 sensors have been calibrated using in situ seawater samples taken at 5 and 10 m depths during the monthly servicing cruises to the mooring. The total alkalinity (Alk) and DIC of the samples were determined by potentiometric titration using a closed cell according to the method developed by (Edmond, 1970). Certified reference materials (CRMs) supplied by A. G. Dickson (Scripps Institution of Oceanography, San Diego, USA) were used for calibration (Dickson et al., 2007). The accuracy is estimated at 3 µmol kg−1 for both DIC and Alk. fCO2 is calculated using the dissociation constants of Mehrbach refitted by Dickson and Millero (Dickson and Millero, 1987; Mehrbach et al., 1973) and as recommended by Álvarez et al. (2014) for the Mediterranean Sea. Uncertainty in fCO2 derived from an individual sample is expected to be on the order of 5 µatm (Millero, 2007). About eight samples have been used to calibrate each CARIOCA sensor so that the uncertainty of the absolute calibration of each fCO2 CARIOCA sensor is estimated at 1.8 µatm. In addition, we observe that the standard deviation of the difference between the CARIOCA fCO2 and fCO2 computed with the monthly discrete samples (Fig. 2b) is equal to 4.4 µatm, consistent with the expected precision on CARIOCA fCO2 of 5 µatm. Alk and S of the 56 samples taken at BOUSSOLE are linearly correlated according the following relationship;
The standard deviation of the Alk data around the regression line is equal to 4.4 µmol kg−1 (r2=0.89).
3.1 The BOUSSOLE mooring (2013–2015) time series
Temperature and fCO2 were measured from February 2013 to February 2016. All seasons were well represented, with missing data only in May–July 2013. For some periods, simultaneous measurements were made at the 3 and 10 m depths (Fig. 2a–c).
The range of temperature (Fig. 2a) extends from 13 ∘C in winter up to 27 ∘C in summer, followed by progressive cooling in fall. The coldest temperature, 13 ∘C, results from the winter vertical mixing with the deeper Levantine Intermediate Water (LIW) marked by extremes in temperature and salinity (Copin-Montégut and Bégovic, 2002). Temperature provides the main control of the seasonality of fCO2, from 350 µatm to more than 550 µatm in summer 2013 (Fig. 2b). The fugacity of CO2 in seawater is a function of temperature, DIC, alkalinity, salinity and dissolved nutrients. In the oligotrophic surface waters of the Mediterranean Sea, the effect of nutrients may be neglected. Temperature and DIC have the strongest influences. By normalising fCO2 to a constant temperature, the temperature effect can be removed and changes in fCO2 resulting from changes in DIC can be more easily identified. Figure 2c shows the variability of fCO2 normalised to the constant temperature of 13 ∘C, (fCO2@13) using the equation of Takahashi et al. (1993). The underlying processes that govern the seasonal variability of fCO2@13 are successive winter mixing, biological activity (organic matter formation and remineralisation) and the deepening of mixed layer in fall (Bégovic and Copin-Montegut, 2002; Hood and Merlivat, 2001). Biological processes account for the decline in fCO2@13 observed from March–April to late summer; the ensuing increase in surface fCO2@13 is associated with the deepening of the mixed layer in the fall or convection in winter, as the vertical distribution of fCO2@13 at DYFAMED shows a maximum in the 50–150 m layer. Where a large remineralisation of organic matter occurs, the productive layer is mostly between 0 and 40 m (Copin-Montégut and Bégovic, 2002). The contribution of air–sea exchange is not significant (Bégovic and Copin-Montegut, 2002). Over the period 2013–2015, the air–sea CO2 flux from the atmosphere to the ocean surface is equal to −0.45 mol m−2 yr−1.
During summer 2014, large differences between measurements at 3 and 10 m were observed (Fig. 2a–c between dashed lines). A detailed analysis of the temporal variability during that period underscores the role of inertial waves at the frequency of 17.4 h that create the observed differences between the 2 depths of observations, with the deeper waters being colder and enriched in fCO2@13. Temperature and fCO2@13 variability is dominated by inertial waves. In particular, from 15 to 26 August 2014, the difference in T between the two depths is as large as 7.6 (5.1 ∘C on average). fCO2 decreases on average by 32.7 µatm, corresponding to an increase in fCO2@13 equal to 42.8 µatm.
The 2013–2015 seasonal and inter-annual variability of T, fCO2 and fCO2@13 is illustrated in Fig. 2–f. The larger inter-annual changes in temperature (Fig. 2d) are observed during summer, both at 3 and 10 m depth, while over February and March, a constant value of 13 ∘C is observed as the result of vertical mixing with the LIW. A very large inter-annual variability of fCO2@13 is observed for T < 14 ∘C (Fig. 2f). This is associated with the winter mixing at the mooring site, which is highly variable from year to year. Winter mixed-layer depth (MLD) varies between 50 and 160 m, at the top of the LIW over the 2013–2015 period (Coppola et al., 2016). The variable depth of the winter vertical mixing causes the difference in fCO2@13, as fCO2 increases with depth (Copin-Montégut and Bégovic, 2002). The deepening of the MLD is driven by episodic and intense mixing processes characterised by a succession of events lasting several days, which are related to atmospheric forcing (Antoine et al., 2008) and lead to increase in fCO2@13. Figure 2e illustrates the solubility control of the variability of fCO2, as fCO2 increases when T increases. Another cause of the inter-annual variability of fCO2 for T∼14 ∘C is the timing of the spring increase in biological activity, which differs by a month between years. For instance, the increase happened at the beginning of April in 2013, when T∼15–16 ∘C and by mid March in 2014, when T∼14 ∘C. Another cause is the deepening of the mixed layer due to the fall cooling, which varies by a month between years.
3.2 Decadal changes in hydrography
3.2.1 Sea surface temperature changes
Monthly mean values of temperature have been computed for the two 3-year periods, 1995–1997 and 2013–2015. In 1995–1997, fCO2 and T at 2 m were measured with CARIOCA sensors installed on a buoy at DYFAMED (Hood and Merlivat, 2001). The mean annual temperature of hourly CARIOCA data is equal to 18.21 ∘C. For 2013–2015, temperature measurements made on the BOUSSOLE mooring at 3 and 10 m have been used. For the April to September time interval, there are only data at the 3 m depth. In addition, temperature data measured half hourly at 0.7 m at a nearby meteorological buoy (43∘23′ N, 7∘50′ E) (https://doi.org/10.6096/hymex.azurbuoy.thermosalinograph.20100308, last access: 19 September 2018; Rolland and Bouin, 2010) have been used (Fig. 3d). Mean annual temperatures are equal to 18.29 and 17.97 ∘C, respectively, based on the meteorological buoy and the BOUSSOLE mooring data. The two sets of data differ essentially during July and August, with the temperatures at 3 m colder than those at 0.7 m, which indicates a thermal gradient between the two depths during summer. Therefore, for 2013–2015, we select the mean annual value computed with the meteorological buoy, 18.29 ∘C, as a better representation of the sea surface. This value is close to 18.21 ∘C computed for 1995–1997. Thus, no significant change in SST is found between the 2 decades, with a mean value equal to 18.25 ∘C.
3.2.2 Sea surface salinity changes
The mean value of salinity and the standard error of the mean computed from 56 samples taken at BOUSSOLE in 2013–2015 are respectively 38.19 and 0.02. In 1998–1999, ship measurements of surface salinity were made during monthly cruises at the DYFAMED site (Copin-Montégut et al., 2004). The mean salinity and the standard error of the mean of this set of 19 data are respectively 38.21 and 0.03. Thus, there is no significant salinity change between the two decades.

Figure 3(a) fCO2@13 as a function of temperature for hourly data in 2013, 2014 and 2015.The yellow dots indicate mean fCO2@13. (b) is similar to (a) but represents all hourly data in 1995–1997 (black) and in 2013–2015 (red). (c) is similar to (b) but represents average values per 1 ∘C interval (standard deviation as dotted line). The difference between the two periods is also displayed by the dashed blue curve (scale on the right axis; the mean difference over all SST is represented by the horizontal blue line). (d) Mean monthly sea surface temperature for 1993–1995 (black curve for CARIOCA sensors), 2013–2015 (green for CARIOCA sensors) and 2013–2015 (red for meteorological buoy). Corresponding mean annual values are indicated by dotted lines.
3.3 Decadal changes in fCO2@13
3.3.1 Time series of fCO2@13 in 1995–1997 and 2013–2015
The two time series of high-frequency data were analysed in order to quantify the change in fCO2@13 2 decades apart at the sea surface. To account for the inter-annual seasonal variability as well as irregular sampling, we performed an analysis of the change in fCO2@13 as a function of SST (Fig. 3a and b). For the 2013–2015 data set, we excluded summer data measured at 10 m depth as they were not representative of the surface mixed layer due to a strong stratification. Much larger fCO2@13 values are observed at low temperatures than at high temperatures, the decrease being similar and strongly nonlinear for the two studied periods. As described in Sect. 3.1, large values at low temperatures result from mixing with enriched deep waters during winter, and low values for 26–28 ∘C temperatures occur at the end of summer after the biological drawdown of carbon. An increase in fCO2@13 between the two periods is evident across the range of temperatures.
3.3.2 Trend analysis and statistics
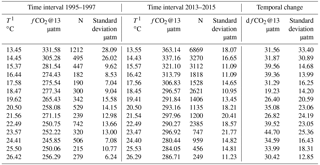
To quantify the change in fCO2@13 between the two data sets, we proceed as follows: data are binned by 1 ∘C temperature intervals, thereby removing any potential seasonal weighting, especially towards the 13–14 ∘C winter months temperature. The measurements made in this temperature interval represent about 25 % of the total number of data for both periods. For each of the fourteen 1 ∘C steps, the mean and standard deviation of hourly fCO2@13 measurements are reported in Table 1 and in Fig. 3c. The mean temperature within each of the 1∘ steps differ for the two periods, as the distribution of individual measurements are not identical.
For both data sets, a monotonic relationship between fCO2@13 and T is observed with correlation coefficients respectively equal to −0.861 and −0.857. The difference in fCO2@13 between the two periods, dfCO2@13, is derived in each temperature step, seen in the difference between column 2 and 6 of Table 1. The variability of this difference is estimated as the quadratic mean of the standard deviation in each time series. Both values are reported in Table 1, column 9 and 10 and in Fig. 3c. The distribution of each dfCO2@13 values around the mean over all SST of dfCO2@13 seems random and indicates no trend of dependency with SST (Fig. 3c). This suggests that the processes that control the seasonal variation of fCO2@13 at the sea surface have not changed over the last two decades.
Table 1Distribution of temperature, fCO2@13, and increase dfCO2@13 data binned by 1 ∘C temperature interval for the two periods 1995–1997 and 2013–2015.
We have estimated the uncertainties in the estimates of the difference dfCO2@13 with two methods. Firstly, the arithmetic mean of dfCO2@13 is equal to 33.17 µatm, with a standard deviation (SD) and standard error (SE), respectively equal to 6.29 µatm and 1.68 µatm. A 95 % confidence interval is thereby achieved within 1.96 SE, i.e. 3.29 µatm. A second approach consists of computing a weighted average of the mean of dfCO2@13. In this case, mean weighted value of dfCO2@13 over the whole range of temperatures is estimated, the weights being equal to the variance of dfCO2@13 in each temperature step. The value of dfCO2@13 is equal to 32.70 µatm. The weighted SD, and the associated SE, of the 14 data points are respectively equal to 4.85 and 1.30 µatm. A 95 % confidence interval is achieved within 2.54 µatm. The difference between the two mean dfCO2@13 estimates is 0.47 µatm, well below SE. In the following, we have chosen the former method.
3.4 Changes of seawater carbonate chemistry in surface waters
We estimated the DIC and pH changes related to the increase in fCO2@13 measured at the sea surface 18 years apart, assuming a mean salinity equal to 38.2, a mean alkalinity equal to 2562.3 µmol kg−1 following Eq. (1) and a mean in situ temperature (T) equal to 18.25 ∘C. The dissociation constants of Mehrbach refitted by Dickson and Millero (Dickson and Millero, 1987; Mehrbach et al., 1973) were used. pH is calculated on the seawater scale. The uncertainty of dfCO2@13, 3.3 µatm, has been propagated to compute the combined uncertainty in dDIC and dpHSWS. The uncertainties in the equilibrium constants are neglected in this propagation of uncertainties. Likewise, an implicit assumption is that there is no systematic error on DIC and pHSWS derived from fCO2@13 between the two time periods; in particular, mean temperature and salinity remain the same (Sect. 3.2). This is further discussed in Sect. 4.1. We compute an increase in DIC and dDIC equal to 25.2±2.7 µmol kg−1 (1.40±0.15 µmol kg−1 yr−1) and a decrease in pHSWS and dpHSWS equal to pHSWS ( pHSWS yr−1) (Table 2).
Table 2Seasonally detrended long-term and annual trends of seawater carbonate chemistry and atmospheric composition.
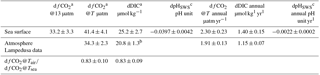
T, mean annual temperature equal to 18.25 ∘C; a change from 1995–1997 to 2013–2015; b dDICant; c dpHSWS computed at T.
3.5 Changes in atmospheric and seawater fCO2
The increase in atmospheric fCO2 from 1995–1997 to 2013–2015 was computed from the monthly atmospheric xCO2 concentrations measured at the Lampedusa Island station (Italy) (35∘31′ N, 12∘37′ E) (http://ds.data.jma.go.jp/gmd/wdcgg/, last access: 14 September 2018) (see Eq. 3 in Hood and Merlivat, 2001). Considering a mean annual in situ temperature equal to 18.25 ∘C and an atmospheric pressure of 1 atm, we derived a mean atmospheric fCO2 equal to 355.3±0.8 µatm for 1995–1997 and 389.6±0.9 µatm for 2013–2015, which is an increase of 34.3±2.3 µatm (95 % confidence interval) (Table 2). At this temperature, the change in fCO2 at the sea surface is 41.4±4.1 µatm. Thus the contribution of the increase in atmospheric CO2 is responsible for 84 %±5 % of the increase in fCO2 measured in the surface waters. With the same salinity and alkalinity as previously, the measurement of the corresponding change in surface DIC, assuming air–sea equilibrium, would be 20.8±1.3 µmol kg−1 (Table 2).
4.1 Time change in surface alkalinity
High-frequency measurements of fCO2 and temperature over two periods of 3 years that are 2 decades apart have allowed the computation of an increase in DIC equal to 25.1±2.3 µmol kg−1 assuming no change in alkalinity. In the range of salinity of the BOUSSOLE samples, 37.9 to 38.5, the alkalinity values computed with Eq. (1) are larger than those predicted by the relationship established for the DYFAMED site, with a mean difference equal to 10±2 µmol kg−1 (Copin-Montégut and Bégovic, 2002). In both cases alkalinity measurements were made with a potentiometric method using the certified reference material supplied by A. G. Dickson for calibration. It is difficult to identify the cause for a possible change in alkalinity between the two periods that are 18 years apart, while no salinity change has been observed. At a coastal site 50 km away from DYFAMED, Kapsenberg et al. (2017) have measured an increase in alkalinity unrelated to salinity over the period from 2007 to 2015. They attribute it to changes in freshwater inputs from land. However, based on data from Coppola et al. (2016), alkalinity in the upper 50 m at DYFAMED did not change significantly from 2007 to 2014 (3.204 µmol kg−1, P=0.0794, r2=0.08). Thus, we cannot conclude whether the difference observed at DYFAMED and BOUSSOLE between the two periods is real or an artifact of measurement techniques. As a sensitivity test, we compute the expected changes in DIC and pH from 1995–1997 to 2013–2015 for a mean alkalinity increase in 10 µmol kg−1. We obtain annual changes of dDIC µmol kg−1 yr−1 and dpH pH unit yr−1, which are well below errors estimated in Sect. 3.4. Hence, such a change in alkalinity does not significantly affect the increase in DIC and the decrease in pH shown in Table 2.
4.2 Drivers of the temporal change in DIC in surface waters
The increase in sea surface DIC from 1995–1997 to 2013–2015 is 25.2±2.7 µmol kg−1 (Table 2), whereas the expected contribution due to ocean uptake of anthropogenic CO2 is 20.8±1.3 µmol kg−1. In order to interpret the difference between these two values, we examine potential changes that may result from the inter-annual variability in local physical and biological processes or anthropogenic carbon invasion from lateral advection of Atlantic waters.
4.2.1 Natural variability
Time series of the mixed layer depth (MLD) show a strong variability in winter at inter-annual scale. During the two periods, 1995–1997 and 2013–2015, the winter MLD never exceeded 220 m, whereas values over 300 m were observed in 1999 and especially in February and March 2006, with values close to 2000 m (Coppola et al., 2016; Pasqueron de Fommervault et al., 2015). These episodes of strong and deep vertical mixing must have entrained DIC-rich LIW in the surface waters. This entrainment could be causing an increase in DIC between the 1995–1997 and 2013–2015 periods. Monthly surface samples collected at the Dyfamed time series station between 1998 and 2013 indicate an increasing DIC trend of 1.35 µmol kg−1 yr−1. This value is uncertain (r2=0.05) because of the large seasonal variability displayed in the monthly samples (Gemayel et al., 2015). Nevertheless, this value is closer to the trend we calculated between the two periods, 1993–1995 and 2013–2015 (1.40 µmol kg−1 yr−1) than to the trend inferred from the atmospheric increase (1.15 µmol kg−1 yr−1). In the DYFAMED time series, we find no evidence that the strong increase in MLD observed during winters 1999 and especially 2006 resulted in a further increase in DIC.
The monthly cruises of the Dyfamed time-series study have also been analysed in order to investigate the hydrological changes and some biological consequences over the period 1995–2007 (Marty and Chiavérini, 2010). These authors show that extreme convective mixing events such as those recorded in 1999 and 2006 are responsible for large increases in nutrient content in surface layers and conclude that biological productivity is increasing, especially during the 2003–2006 period, which could lead to a larger consumption of carbon, i.e. a decrease in DIC.
4.2.2 Anthropogenic carbon exchange through the Strait of Gibraltar.
The concentration of oceanic anthropogenic carbon (Cant) is not a directly measurable quantity. To estimate it, several empirical methods have been developed. Flecha et al. (2012) computed the anthropogenic carbon inventory in the Gulf of Cadiz. They used observations made during a cruise in October 2008 throughout the oceanic area covered by the Gulf of Cadiz and the Strait of Gibraltar to estimate Cant with three methods, which are ΔC* (Gruber et al., 1996), TrOCA (Touratier and Goyet, 2004; Touratier et al., 2007) and φC (Vázquez-Rodríguez et al., 2009). In the three cases, their results indicate a net import of Cant from the Atlantic towards the Mediterranean through Gibraltar.
Schneider et al. (2010), using the transit-time distribution method applied to a data set from a Mediterranean cruise in 2001, estimated a net anthropogenic carbon flux across the Strait of Gibraltar into the Mediterranean Sea of 3.5 Tg C yr−1. Over the whole period from 1850 to 2001, this contribution of Cant represents almost 10 % of the total Cant inventory of the Mediterranean Sea. Accordingly, about 90 % must have been taken directly from an equilibrium with atmospheric CO2. Based on a high-resolution regional model, Palmiéri et al. (2015) computed the anthropogenic carbon storage in the Mediterranean basin. They concluded that 75 % of the total storage of Cant in the whole basin comes from the atmosphere and 25 % from net transport from the Atlantic through the Strait of Gibraltar. The findings of these two studies support our estimated change in DIC of (17±10) % in addition to the direct contribution of air–sea exchange suggesting that it could result from the anthropogenic carbon input from the Atlantic Ocean towards the Mediterranean basin.
Huertas et al. (2009) and Schneider et al. (2010) report DICant surface concentrations respectively equal to 65–70 µmol kg−1 at the Strait of Gibraltar in the years 2005–2007 and close to 65 µmol kg−1 in the western basin in 2001. We extrapolate these figures to the year 2014, assuming a mean increased rate of DIC equal to 1.4 µmol kg−1 yr−1 as previously computed (Table 2). Taking into account the increase in DICant equal to 25.2 µmol kg−1 between 1995–1997 and 2013–2015, we estimate that the contribution of the change in DICant over the last 18 years represents ∼30 % of the total change since the beginning of the industrial period (t>∼1800).
4.3 Long-term trends in surface DIC and pH
The annual changes in DIC and pHSWS calculated between 1995–1997 and 2013–2015 are respectively equal to 1.40±0.15 µmol kg−1 and . At the DYFAMED site, at 10 m, Marcellin Yao et al. (2016) studied the time variability of pH over 1995–2011 based on measurements of T, S, Alk and DIC sampled approximately once a month. They computed a mean annual decrease in pH, , which is not significantly different from our estimate. For the global surface ocean, Lauvset et al. (2015) have reported a mean rate of decrease in pH, for 1991–2011. This value is also within the limits of uncertainty of the pH change computed in our study.
Bates et al. (2014) examined changes in surface seawater CO2-carbonate chemistry at the locations of seven ocean CO2 time series that have been gathering sustained observations from 15 to 30 years with monthly or seasonal sampling. Six stations are located in the Atlantic and Pacific oceans in a latitudinal band between 10 and 68∘ N. The range of increasing and decreasing annual trends of DIC and pH extends from 0.93±0.24 to 1.89±0.45 µmol kg−1 yr−1 and to , respectively. The Revelle factor of surfaces waters vary from 9–10 in low latitudes to 12–15 in the subpolar time series sites, with higher Revelle factor values reflecting a reduced capacity to absorb atmospheric CO2. The data show that the increase in DIC is not only controlled by the buffer capacity of the water but also by the compounding effects of changes in physical factors like the strengthening of winter mixing or larger air–sea uptake (Olafson et al., 2010).
The increase in DIC computed at DYFAMED is in the upper range of values reported in the other time series. A low Revelle factor of close to 10 characterises the Mediterranean Sea because of its warm and high-alkalinity waters. Moreover, as the result of a relatively short deep-water renewal time estimated to be 20–40 years in the western basin (Schneider et al., 2010), the waters of the Mediterranean Sea have a relatively high capacity to absorb anthropogenic CO2 from the atmosphere and transport it to deep water.
The calculated decrease in pH in the surface water at DYFAMED and in the global ocean are quite similar, despite the higher alkalinity of the Mediterranean Sea. Thermodynamic equilibrium calculations have highlighted the alkalinity's effect on the anthropogenic acidification of the Mediterranean Sea (Palmiéri et al., 2015). Their results show that, notwithstanding a higher total alkalinity, the average anthropogenic change in the surface pH of the Mediterranean Sea does not differ significantly from that of the average of global oceans.
High-frequency ocean fCO2 measurements made by CARIOCA sensors have been used to calculate trends in fCO2, DIC and pH over a period of two decades, notwithstanding the short-time and natural seasonal variability of these properties at the sea surface. We have estimated a large change in sea-surface carbonate chemistry, an increase in DIC and a decrease in pH. The computed increase in DIC is larger than the change expected from a chemical equilibrium with atmospheric CO2.This could be the result of the strong inter-annual variability of the winter mixing observed between the two periods of 1993–1995 and 2013–2015. Likewise, our results support modelling work and analysis of vertical profiles measurements that suggest that the Atlantic Ocean contributes a substantial amount of anthropogenic carbon to the Mediterranean basin, (17±10) %, which lies between the estimates of 10 % (Schneider et al., 2010) and 25 % (Palmiéri et al., 2015).
The time series data from Dyfamed (1995–1997) are available in the SOCAT v3 database (Bakker et al., 2016). The Boussole data (2013–2015) are available in the SEANOE database (Merlivat and Boutin, 2018).
The authors declare that they have no conflict of interest.
Seawater samples were analysed for DIC and Alk by the SNAPO-CO2 at
LOCEAN in Paris. The CO2Sys toolbox of Pierrot et al. (2006)
has been used for the calculations of DIC and pH. The adaptation of CARIOCA
sensors to high pressure has been supported by the BIO-optics and CARbon
EXperiment (BIOCAREX) project, funded by the Agence Nationale de la
Recherche (ANR, Paris). We are grateful for the helpful comments from Gilles
Reverdin and the reviewers of the manuscript. Many thanks to Laurent Coppola,
who kindly provided additional MLD data at Dyfamed.
Edited by: Jack Middelburg
Reviewed by: two anonymous referees
Álvarez, M., Sanleón-Bartolomé, H., Tanhua, T., Mintrop, L., Luchetta, A., Cantoni, C., Schroeder, K., and Civitarese, G.: The CO2 system in the Mediterranean Sea: a basin wide perspective, Ocean Sci., 10, 69–92, https://doi.org/10.5194/os-10-69-2014, 2014.
Antoine, D., Chami, M., Claustre, H., d'Ortenzio, F., Morel, A., Bécu, G., Gentili, B., Louis, F., Ras, J., Roussier, E., Scott, A.J., Tailliez, D., Hooker, S. B., Guevel, P., Desté, J.-F., Dempsey, C., and Adams, D.: BOUSSOLE: A joint CNRS-INSU, ESA, CNES, and NASA ocean color calibration and validation activity, NASA Tech. Memo. 2006-214147, 2006.
Antoine, D., d'Ortenzio, F., Hooker, S. B., Bécu, G., Gentili, B., Tailliez, D., and Scott, A. J.: Assessment of uncertainty in the ocean reflectance determined by three satellite ocean color sensors (MERIS, SeaWiFS and MODIS-A) at an offshore site in the Mediterranean Sea (BOUSSOLE project), J. Geophys. Res., 113, https://doi.org/10.1029/2007JC004472, 2008.
Bakker, D. C. E., Pfeil, B., Smith, K., Hankin, S., Olsen, A., Alin, S. R., Cosca, C., Harasawa, S., Kozyr, A., Nojiri, Y., O'Brien, K. M., Schuster, U., Telszewski, M., Tilbrook, B., Wada, C., Akl, J., Barbero, L., Bates, N. R., Boutin, J., Bozec, Y., Cai, W.-J., Castle, R. D., Chavez, F. P., Chen, L., Chierici, M., Currie, K., de Baar, H. J. W., Evans, W., Feely, R. A., Fransson, A., Gao, Z., Hales, B., Hardman-Mountford, N. J., Hoppema, M., Huang, W.-J., Hunt, C. W., Huss, B., Ichikawa, T., Johannessen, T., Jones, E. M., Jones, S. D., Jutterström, S., Kitidis, V., Körtzinger, A., Landschützer, P., Lauvset, S. K., Lefèvre, N., Manke, A. B., Mathis, J. T., Merlivat, L., Metzl, N., Murata, A., Newberger, T., Omar, A. M., Ono, T., Park, G.-H., Paterson, K., Pierrot, D., Ríos, A. F., Sabine, C. L., Saito, S., Salisbury, J., Sarma, V. V. S. S., Schlitzer, R., Sieger, R., Skjelvan, I., Steinhoff, T., Sullivan, K. F., Sun, H., Sutton, A. J., Suzuki, T., Sweeney, C., Takahashi, T., Tjiputra, J., Tsurushima, N., van Heuven, S. M. A. C., Vandemark, D., Vlahos, P., Wallace, D. W. R., Wanninkhof, R., and Watson, A. J.: An update to the Surface Ocean CO2 Atlas (SOCAT version 2), Earth Syst. Sci. Data, 6, 69–90, https://doi.org/10.5194/essd-6-69-2014, 2014.
Bakker, D. C. E., Pfeil, B., Landa, C. S., Metzl, N., O'Brien, K. M., Olsen, A., Smith, K., Cosca, C., Harasawa, S., Jones, S. D., Nakaoka, S.-I., Nojiri, Y., Schuster, U., Steinhoff, T., Sweeney, C., Takahashi, T., Tilbrook, B., Wada, C., Wanninkhof, R., Alin, S. R., Balestrini, C. F., Barbero, L., Bates, N. R., Bianchi, A. A., Bonou, F., Boutin, J., Bozec, Y., Burger, E. F., Cai, W.-J., Castle, R. D., Chen, L., Chierici, M., Currie, K., Evans, W., Featherstone, C., Feely, R. A., Fransson, A., Goyet, C., Greenwood, N., Gregor, L., Hankin, S., Hardman-Mountford, N. J., Harlay, J., Hauck, J., Hoppema, M., Humphreys, M. P., Hunt, C. W., Huss, B., Ibánhez, J. S. P., Johannessen, T., Keeling, R., Kitidis, V., Körtzinger, A., Kozyr, A., Krasakopoulou, E., Kuwata, A., Landschützer, P., Lauvset, S. K., Lefèvre, N., Lo Monaco, C., Manke, A., Mathis, J. T., Merlivat, L., Millero, F. J., Monteiro, P. M. S., Munro, D. R., Murata, A., Newberger, T., Omar, A. M., Ono, T., Paterson, K., Pearce, D., Pierrot, D., Robbins, L. L., Saito, S., Salisbury, J., Schlitzer, R., Schneider, B., Schweitzer, R., Sieger, R., Skjelvan, I., Sullivan, K. F., Sutherland, S. C., Sutton, A. J., Tadokoro, K., Telszewski, M., Tuma, M., van Heuven, S. M. A. C., Vandemark, D., Ward, B., Watson, A. J., and Xu, S.: A multi-decade record of high-quality fCO2 data in version 3 of the Surface Ocean CO2 Atlas (SOCAT), Earth Syst. Sci. Data, 8, 383–413, https://doi.org/10.5194/essd-8-383-2016, 2016.
Bates, N., Astor, Y., Church, M., Currie, K., Dore, J., Gonaález-Dávila, M., Lorenzoni, L., Muller-Karger, F., Olafsson, J., and Santa-Casiano, M.: A Time-Series View of Changing Ocean Chemistry Due to Ocean Uptake of Anthropogenic CO2 and Ocean Acidification, Oceanography, 27, 126–141, 2014.
Bégovic, M. and Copin-Montegut, C.: Processes controlling annual variations in the partial pressure of fCO2 in surface waters of the central northwestern Mediterranean sea (Dyfamed site), Deep-Sea Res. Pt. II, 49, 2031–2047, 2002.
Chen, G. T. and Millero, F. J.: Gradual increase of oceanic CO2, Nature, 277, 205–206, 1979.
Copin-Montegut, C. and Bégovic, M.: Distributions of carbonate properties and oxygen along the water column (0–2000 m) in the central part of the NW Mediterranean Sea (Dyfamed site): influence of winter vertical mixing on air–sea CO2 and O2 exchanges, Deep-Sea Res. Pt. II 49, 2049–2066, 2002.
Copin-Montégut, C., Bégovic, M., and Merlivat, L.: Variability of the partial pressure of CO2 on diel to annual time scales in the Northwestern Mediterranean Sea, Mar. Chem., 85, 169–189, 2004.
Coppola, L., Diamond Riquier, E., and Carval, T.: Dyfamed observatory data, SEANOE, https://doi.org/10.17882/43749, 2016.
Dickson, A. G. and Millero, F. J.: A comparison of the equilibrium constants for the dissociation of carbonic acid in seawater media, Deep-Sea Res., 34, 1733–1743, 1987.
Dickson, A. G., Sabine, C. L., and Christian, J. R. (Eds.): Guide to Best Practices for Ocean CO2 Measurements, PICES Special Publication 3, 191 pp., 2007.
Edmond, J. M.: High precision determination of titration alkalinity and total carbon dioxide content of seawater by potentiometric titration, Deep-Sea Res., 17, 737–750, 1970.
Flecha, S., Pérez, F. F., Navarro, G., Ruiz, J., Olivé, I., Rodríguez-Gálvez, S., Costas, E., and Huertas, I. E.: Anthropogenic carbon inventory in the Gulf of Cádiz, J. Marine Syst., 92, 67–75, 2012.
Gattuso, J.-P. and Hansson, L.: Ocean Acidification, Oxford University Press, Oxford, UK, 352 pp., 2011.
Gemayel, E., Hassoun, A. E. R., Benallal, M. A., Goyet, C., Rivaro, P., Abboud-Abi Saab, M., Krasakopoulou, E., Touratier, F., and Ziveri, P.: Climatological variations of total alkalinity and total dissolved inorganic carbon in the Mediterranean Sea surface waters, Earth Syst. Dynam., 6, 789–800, https://doi.org/10.5194/esd-6-789-2015, 2015.
Gruber, N., Sarmiento, J. L., and Stocker, T. F.: An improved method for detecting anthropogenic CO2 in the oceans, Global Biogeochem. Cy., 10, 809–837, 1996.
Heimbürger, L.-E., Lavigne, H., Migon, C., D'Ortenzio, F., Estournel, C., Coppola, L., and Miquel, J.-C.: Temporal variability of vertical export flux at the DYFAMED time-series station (Northwestern Mediterranean Sea), Progr. Oceanogr., 119, 59–67, 2013.
Hood, E. M. and Merlivat, L.: Annual and interannual variations of fCO2 in the northwestern Mediterranean Sea: Results from hourly measurements made by CARIOCA buoys, 1995–1997, J. Mar. Res., 59, 113–131, 2001.
Huertas, I. E., Ríos, A. F., García-Lafuente, J., Makaoui, A., Rodríguez-Gálvez, S., Sánchez-Román, A., Orbi, A., Ruíz, J., and Pérez, F. F.: Anthropogenic and natural CO2 exchange through the Strait of Gibraltar, Biogeosciences, 6, 647–662, https://doi.org/10.5194/bg-6-647-2009, 2009.
Kapsenberg, L., Alliouane, S., Gazeau, F., Mousseau, L., and Gattuso, J.-P.: Coastal ocean acidification and increasing total alkalinity in the northwestern Mediterranean Sea, Ocean Sci., 13, 411–426, https://doi.org/10.5194/os-13-411-2017, 2017.
Lauvset, S. K., Gruber, N., Landschützer, P., Olsen, A., and Tjiputra, J.: Trends and drivers in global surface ocean pH over the past 3 decades, Biogeosciences, 12, 1285–1298, https://doi.org/10.5194/bg-12-1285-2015, 2015.
Marcellin Yao, K., Marcou, O., Goyet, C., Guglielmi, V., Touratier, F., and Savy, J.-P.: Time variability of the north-western Mediterranean Sea pH over 1995–2011, Mar. Environ. Res., 116, 51–60, 2016.
Marty, J. C. and Chiavérini, J.: Hydrological changes in the Ligurian Sea (NW Mediterranean, DYFAMED site) during 1995–2007 and biogeochemical consequences, Biogeosciences, 7, 2117–2128, https://doi.org/10.5194/bg-7-2117-2010, 2010.
Marty, J. C., Chiaverini, J., Pizay, M., D., and Avril, B.: Seasonal and interannual dynamics of nutrients and phytoplankton pigments in the western Mediterranean Sea at the DYFAMED time-series station (1991–1999), Deep-Sea Res. Pt. II, 49, 1965–1985, 2002.
McKinley, G. A., Fay, A. R., Takahashi, T., and Metzl, N.: Convergence of atmospheric and North Atlantic carbon dioxide trends on multidecadal timescales, Nat. Geosci., 4, 606–610, 2011.
Mehrbach, C., Culberson, C. H., Hawley, J. E., and Pytkowicx, R. M.: Measurement of the apparent dissociation constants of carbonic acid in seawater at atmospheric pressure, Limnol. Oceanogr., 18, 897–907, 1973.
Merlivat, L. and Boutin, J.: Mediterranean Sea surface CO2 partial pressure and temperature data, SEANOE, https://doi.org/10.17882/56709, 2018.
Merlivat, L. and Brault, P.: CARIOCA BUOY, Carbon Dioxide Monitor, Sea Technol., 23–30, 1995.
Millero, F. J.: The marine inorganic carbon cycle, Chem. Rev., 107, 308–341, 2007.
Millot, C.: Circulation in the Western Mediterranean Sea, J. Marine Syst., 20, 423–442, 1999.
Olafsson, J., Olafsdottir, S. R., Benoit-Cattin, A., and Takahashi, T.: The Irminger Sea and the Iceland Sea time series measurements of sea water carbon and nutrient chemistry 1983–2008, Earth Syst. Sci. Data, 2, 99–104, https://doi.org/10.5194/essd-2-99-2010, 2010.
Palmiéri, J., Orr, J. C., Dutay, J.-C., Béranger, K., Schneider, A., Beuvier, J., and Somot, S.: Simulated anthropogenic CO2 storage and acidification of the Mediterranean Sea, Biogeosciences, 12, 781–802, https://doi.org/10.5194/bg-12-781-2015, 2015.
Pasqueron de Fommervault, O., Migon, C., D'Ortenzio, F., Ribera d'Alcalà, M., and Coppola, L.: Temporal variability of nutrient concentrations in the northwestern Mediterranean sea (DYFAMED time-series station), Deep-Sea Res. Pt. I, 100, 1–12, 2015.
Pierrot, D. E. L. and Wallace, D. W. R.: MS Excel Program Developed for CO2 System Calculations, ORNL/CDIAC-105a, Carbon Dioxide Information Analysis Center, Oak Ridge National Laboratory, U.S. Department of Energy, Oak Ridge, Tennessee, https://doi.org/10.3334/CDIAC/otg.CO2SYS_XLS_CDIAC105a, 2006.
Rolland, J. and Bouin, M. N.: Thermosalinograph, azur buoy [data set], CMM/CNRM (Météo-France), https://doi.org/10.6096/hymex.azurbuoy.thermosalinograph.20100308 (last access: 19 September 2018), 2010.
Sabine, C. L., Feely, R. A., Millero, F. J., Dickson, A. G., Langdon, C., Mecking, S., and Greeley, D.: Decadal changes in Pacific carbon, J. Geophys. Res., 113, C07021, https://doi.org/10.1029/2007JC004577, 2008.
Schneider, A., Tanhua, T., Körtzinger, A., and Wallace, D. W. R.: High anthropogenic carbon content in the eastern Mediterranean, J. Geophys. Res., 115, C12050, https://doi.org/10.1029/2010JC006171, 2010.
Takahashi, T., Olafson, J., Goddard, J. G., Chipman, D. W., and Sutherland, G.: Seasonal variations of CO2 and nutrients in the high-latitude surface oceans:a comparative study, Global Biogeochem. Cy., 7, 843–878, 1993.
Touratier, F. and Goyet, C.: Applying the new TrOCA approach to assess the distribution of anthropogenic CO2 in the Atlantic Ocean, J. Marine Syst., 46, 181–197, 2004.
Touratier, F. and Goyet, C.: Decadal evolution of anthropogenic CO2 in the northwestern Mediterranean Sea from the mid-1990s to the mid-2000s, Deep-Sea Res. Pt. I, 56, 1708–1716, 2009.
Touratier, F., Azouzi, L., and Goyet, C.: CFC-11, 14C and 3H tracers as a means to assess anthropogenic CO2 concentrations in the ocean, Tellus B, 59, 318–325, 2007.
Vázquez-Rodríguez, M., Padin, X. A., Ríos, A. F., Bellerby, R. G. J., and Pérez, F. F.: An upgraded carbon-based method to estimate the anthropogenic fraction of dissolved CO2 in the Atlantic Ocean, Biogeosciences Discuss., 6, 4527–4571, https://doi.org/10.5194/bgd-6-4527-2009, 2009.
Woosley, R. J., Millero, F. J., and Wanninkhof, R.: Rapid anthropogenic changes in CO2 and pH in the Atlantic Ocean: 2003–2014, Global Biogeochem. Cy., 30, 70–90, 2016.