the Creative Commons Attribution 4.0 License.
the Creative Commons Attribution 4.0 License.
 | 15 Nov 2018
Reviews and syntheses: 210Pb-derived sediment and carbon accumulation rates in vegetated coastal ecosystems – setting the record straight
Pere Masqué
Jordi Garcia-Orellana
Oscar Serrano
Inés Mazarrasa
Núria Marbà
Catherine E. Lovelock
Paul S. Lavery
Carlos M. Duarte
Vegetated coastal ecosystems, including tidal marshes, mangroves and seagrass meadows, are being increasingly assessed in terms of their potential for carbon dioxide sequestration worldwide. However, there is a paucity of studies that have effectively estimated the accumulation rates of sediment organic carbon (Corg), also termed blue carbon, beyond the mere quantification of Corg stocks. Here, we discuss the use of the 210Pb dating technique to determine the rate of Corg accumulation in these habitats. We review the most widely used 210Pb dating models to assess their limitations in these ecosystems, often composed of heterogeneous sediments with varying inputs of organic material, that are disturbed by natural and anthropogenic processes resulting in sediment mixing and changes in sedimentation rates or erosion. Through a range of simulations, we consider the most relevant processes that impact the 210Pb records in vegetated coastal ecosystems and evaluate how anomalies in 210Pb specific activity profiles affect sediment and Corg accumulation rates. Our results show that the discrepancy in sediment and derived Corg accumulation rates between anomalous and ideal 210Pb profiles is within 20 % if the process causing such anomalies is well understood. While these discrepancies might be acceptable for the determination of mean sediment and Corg accumulation rates over the last century, they may not always provide a reliable geochronology or historical reconstruction. Reliable estimates of Corg accumulation rates might be difficult at sites with slow sedimentation, intense mixing and/or that are affected by multiple sedimentary processes. Additional tracers or geochemical, ecological or historical data need to be used to validate the 210Pb-derived results. The framework provided in this study can be instrumental in reducing the uncertainties associated with estimates of Corg accumulation rates in vegetated coastal sediments.
- Article
(6903 KB) - Full-text XML
-
Supplement
(459 KB) - BibTeX
- EndNote


Recognition of the globally significant role of vegetated coastal habitats, including tidal marsh, mangrove and seagrass, as sinks of carbon dioxide (CO2) (Duarte et al., 2013) has generated interest in the potential to mitigate CO2 emissions through the management of these ecosystems, an approach termed the “blue carbon” strategy (Duarte et al., 2013; Mcleod et al., 2011; Nellemann et al., 2009). However, efforts to include vegetated coastal ecosystems in existing carbon mitigation strategies have met with an important limitation: there is a paucity of estimates of Corg sequestration rates, particularly in seagrass habitats (Johannessen and Macdonald, 2016, 2018; Macreadie et al., 2018).
Two interrelated measurements of importance to the rate of Corg sequestration are the sediment Corg content and the sediment accumulation rate. To date, most research has focused on the first term, which provides information about the Corg stock sequestered in sediments (Howard et al., 2014; Pendleton et al., 2012). However, Corg stocks alone cannot be used to fully assess the Corg storage capacity or to establish comparisons among sites. Measurements of Corg accumulation rates (CARs) address the question of how much Corg is sequestered in a specified time period and quantify the ongoing sink capacity. In general, CAR is obtained in one of two ways: by measuring the concentration of Corg in sediments and ascribing dates to either the entire profile of interest or to specific intervals; or by estimating sediment accumulation rates. Determination of mean CAR is partially dependent on the timescale of interest and the dating methods used. 210Pb has been shown to be an ideal tracer for dating aquatic sediments deposited during the last ca. 100 years, providing a time frame compatible with management actions (Marland et al., 2001) and enabling the determination of CAR and its changes with time due to natural or human impacts. Due to the relatively long integration period (decades to a century), mean 210Pb-derived CAR estimates are not affected by interannual variability, hence allowing for the assessment of shifts in Corg accumulation from the “baseline” condition (such as the Corg that naturally cycles through an ecosystem; Howard et al., 2017). Although several review papers have elaborated the applications of 210Pb as a tracer in lacustrine and marine environments (Appleby, 2001; Baskaran et al., 2014; Du et al., 2012; Kirchner and Ehlers, 1998; Mabit et al., 2014; Sanchez-Cabeza and Ruiz-Fernández, 2012; Smith, 2001), little attention has been paid to the potential limitations of the 210Pb dating method in vegetated coastal sediments. Experience shows that vegetated coastal environments often prove to be more challenging than lake or marine sediments (Saderne et al., 2018).
Table 1Common values of the main parameters for vegetated coastal sediments (seagrass, mangrove and tidal marshes): average dry bulk density (DBD), range of sedimentation rates (mean values are provided in brackets) and organic matter (OM) content, median organic carbon (Corg) contents, and decay rate of buried Corg (from aboveground biomass to refractory sediment Corg).
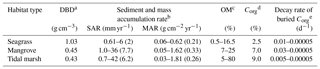
a Seagrass (Fourqurean et al., 2012); mangrove (Donato et al., 2011) and tidal marsh (Craft, 2007; Hatton et al., 1983). b Seagrass (Duarte et al., 2013), mangroves (Breithaupt et al., 2012) and tidal marsh (Ouyang and Lee, 2014). c Seagrass (Koch, 2001); mangrove (Breithaupt et al., 2012); tidal marsh (Cochran et al., 1998; Ember et al., 1987). d Seagrass (Fourqurean et al., 2012); mangrove (Breithaupt et al., 2012); tidal marsh (Chmura et al., 2003). e Seagrass, mangrove and tidal marsh (Lovelock et al., 2017b).
Vegetated coastal ecosystems may act as closed systems in which sediment accumulation is mainly associated with the buildup of autochthonous organic and inorganic material (McKee, 2011). In this situation, 210Pb is deposited primarily from atmospheric fallout at steady state, with no postdepositional mobility except for physical or biological mixing of the sediments (e.g., Alongi et al., 2004; Cochran et al., 1998; Marbà et al., 2015). In some cases, however, the process responsible for incorporating 210Pb into the sediments might be more complex. Vegetated coastal ecosystems may receive both autochthonous and allochthonous sediments from the upstream catchment, coastal erosion, from the offshore zone during storm events (Turner et al., 2007) or in response to land use change (Mabit et al., 2014; Ruiz-Fernández and Hillaire-Marcel, 2009). Their sediments might be reworked through the action of fauna (bioturbation), tides, currents and waves as well as through boat anchoring, dredging or fishing activities (e.g., Mazarrasa et al., 2017; Sanders et al., 2014; Serrano et al., 2016a; Smoak et al., 2013). Effects associated with climate change, such as sea level rise and extreme climatic events, may also have an impact on rates of production and decomposition of organic matter (OM) and on sediment and Corg accumulation (Alongi et al., 2008; Arias-Ortiz et al., 2018; Mudd et al., 2010). In such instances, sediment redistribution processes and complex accretion dynamics may violate some of the assumptions of the 210Pb dating models, producing erratic 210Pb specific activity profiles that are difficult to interpret.
Sediments of vegetated coastal ecosystems are known to be heterogeneous, consisting of coarse-grained deposits or bedrock covered by fine-grained sediments that settled as vegetation established (McGlathery et al., 2012; Olff et al., 1997). The percentage of living (e.g., roots) and recently formed organic material is greatest in the upper 10 cm and may be affected by varying inputs of detrital sediment within vegetated coastal ecosystems and by its relative rate of decomposition. While tidal marsh and mangrove sediments have relatively high organic matter content (on average 25 %) (Breithaupt et al., 2012; Cochran et al., 1998), mineral deposits account for the majority (>85 %) of the accumulated substrate in seagrass sediments (Koch, 2001; Mazarrasa et al., 2015) (Table 1). 210Pb has a strong affinity for fine sediments (Chanton et al., 1983; Cundy and Croudace, 1995; He and Walling, 1996a) and organic matter (Wan et al., 2005), and thus any changes in these parameters due to sediment redistribution processes or to natural heterogeneity may also result in unique types of 210Pb specific activity profiles in sediment cores of vegetated coastal ecosystems, adding complexity to the determination of sediment model age and sedimentation rates.
Here, we present how the processes of mixing and changes in the sedimentation rate, erosion, grain size heterogeneity and OM decay impact the depth distribution of 210Pb in vegetated coastal sediments. We compare sediment and Corg accumulation rates derived from disturbed and ideal 210Pb profiles and assess the discrepancy between them. Through a set of simulations based on examples from the literature and using various 210Pb dating models, we assess the limitations that apply to the determination of last-century Corg accumulation rates in such ecosystems. Finally, we provide guidance on complementary analyses to accompany the 210Pb dating technique that can improve sediment and derived Corg accumulation rate estimates.
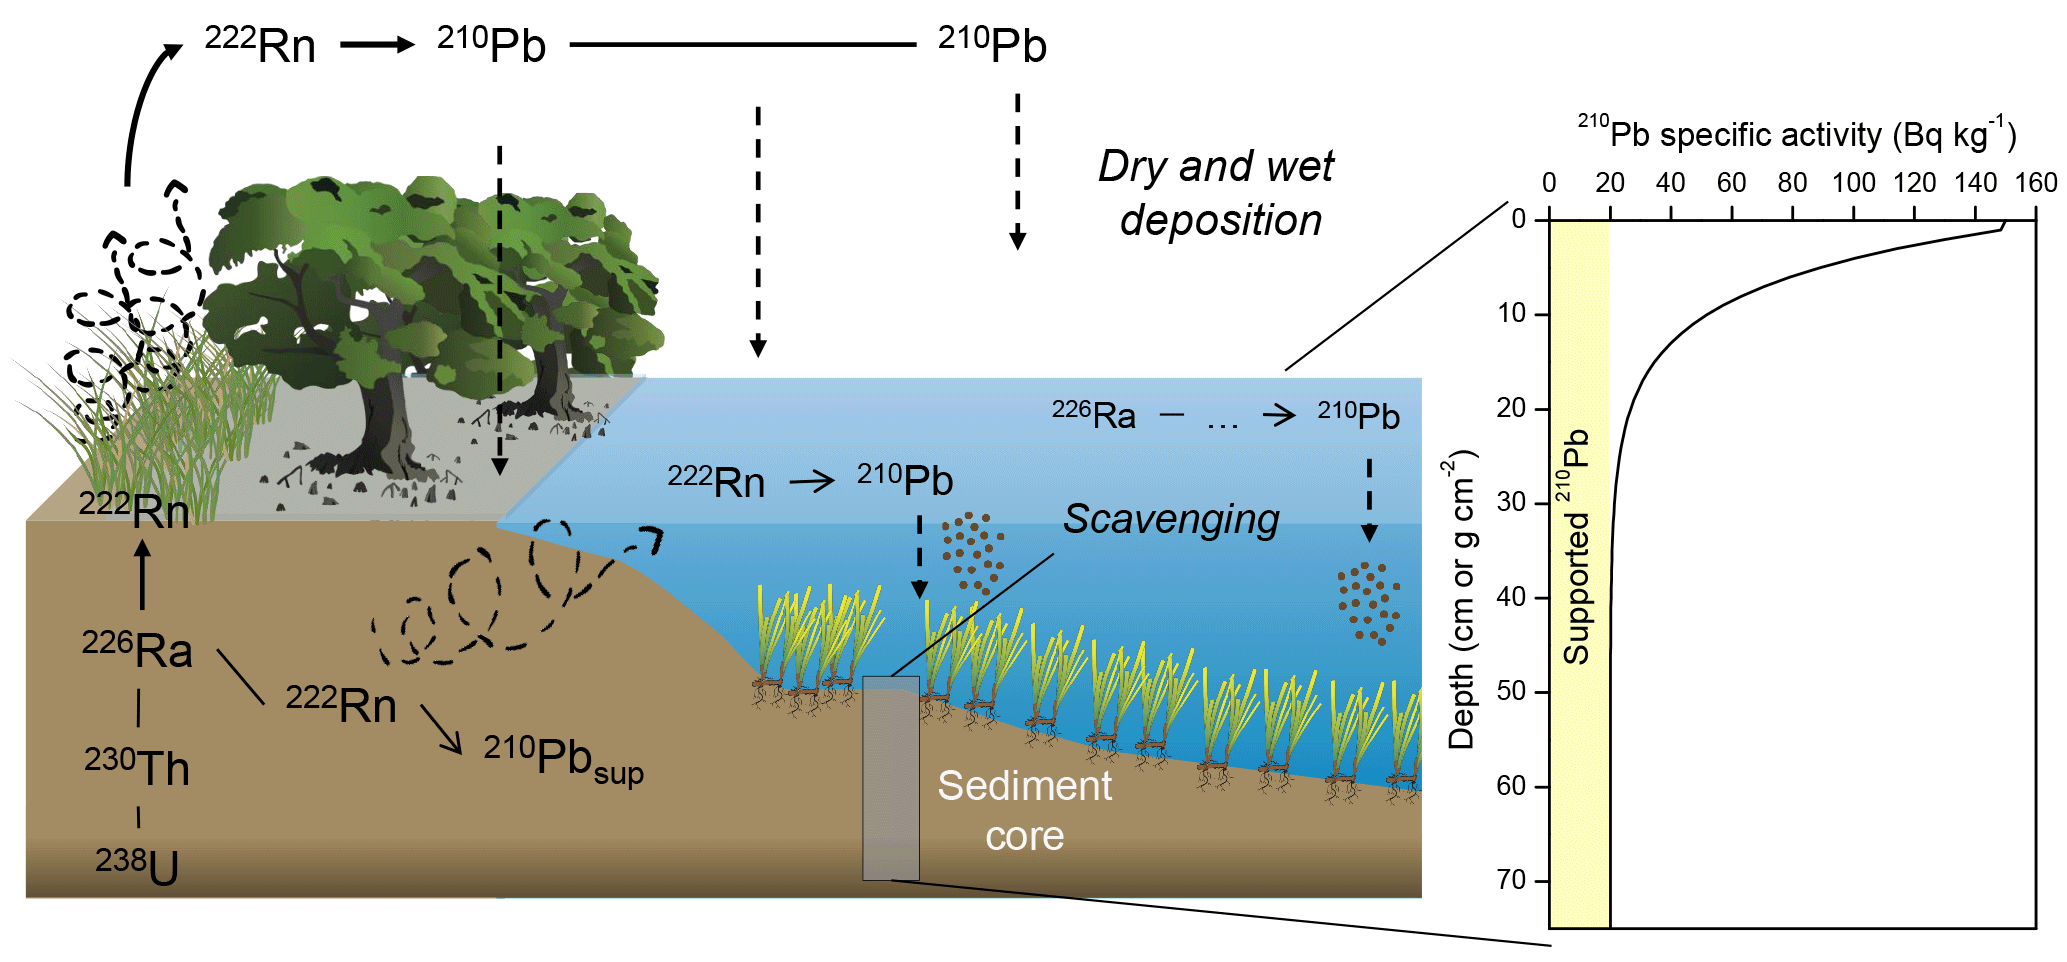
Figure 1210Pb cycle and idealized 210Pb specific activity profile in sediments. Images of vegetated coastal habitats: Tracey Saxby, Integration and Application Network, University of Maryland Center for Environmental Science (http://ian.umces.edu/imagelibrary/, last access: 6 September 2018).
Table 2Summary of the main 210Pb-based models for sediment dating (adapted from Mabit et al., 2014).
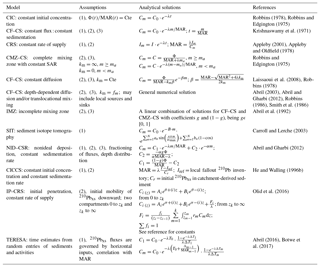
(1) Non-postdepositional redistribution; (2) constant
210Pbxs fluxes at the SWI; (3) constant MAR. Cm:
210Pbxs activity concentration in sediments at mass depth m.
I: total inventory of 210Pbxs. Im: excess inventory
accumulated below depth m; km: effective mixing coefficient
(Dρ2); ma: mass thickness of top sediment zone.
Φ: Flux of
210Pbxs onto the sediment; g: fraction of 210Pbxs
flux distributed within a certain mass depth. Fi: additional supply of
210Pbxs to layer i.
1.1 210Pb dating models
210Pb is a naturally occurring radionuclide with a half-life of 22.3 years. Particles that sink and accumulate in the bottom of aquatic systems scavenge the 210Pb present in the water column due to the decay of 222Rn in (1) the atmosphere and ulterior dry and wet deposition and (2) in the water. This is known as “excess 210Pb” (210Pbxs) and is added to the “supported 210Pb” (210Pbsup), which is continuously produced by the in situ decay of 226Ra in bottom sediments. The accumulation of sediments over time ideally generates a decreasing distribution of 210Pb specific activity as a function of depth (or cumulative mass in g cm−2) governed by the decay of the 210Pbxs, as illustrated in Fig. 1. The 210Pb dating models are based on the interpretation of the 210Pbxs rate of decline in a sediment profile. Under ideal conditions, 210Pb can accurately date sediments back to about seven half-lives, i.e., about 150 years (the “dating horizon”), whereby the measurement uncertainty becomes too large to detect any 210Pbxs. However, chronologies reaching back that far might be rarely achievable in vegetated coastal sediments as these contain relatively low concentrations of 210Pb. The basis of the distribution of 210Pbxs in sediments can then be described as (Koide et al., 1972)
where ρ is sediment bulk density (g cm−3), C is the specific activity of 210Pbxs (Bq g−1), z is depth below the sediment–water interface (cm), Db is the sediment mixing rate (cm2 yr−1), r is the sedimentation rate (cm yr−1), λ is the 210Pb decay constant (yr−1) and t is time (years). Commonly, depth (z) is represented as cumulative mass (m) to correct for compaction. Cumulative mass (g cm−2) results from the multiplication of z and ρ, and sedimentation rates are expressed as mass accumulation rates (MAR) in g cm−2 yr−1, which can be described as , where v and q are the accretion and compaction velocities, respectively (Abril, 2003) (Eq. 2).
where km is an effective mixing coefficient (g2 cm−4 yr−1).
The 210Pb technique was first applied by Koide et al. (1972) to date marine sediments. Since then, a family of dating models has been used to interpret the 210Pbxs depth distribution in marine and freshwater sediment cores, increasing in variety and complexity and involving a large diversity of postdepositional redistribution processes (Table 2). However, there are three models that are most widely used and described here: the constant flux–constant sedimentation (CF–CS) model (Krishnaswamy et al., 1971), the constant rate of supply (CRS) model (Appleby and Oldfield, 1978) and the constant initial concentration (CIC) model (Robbins, 1978). Although these three models each have specific assumptions, they share the following: (1) the deposition of 210Pbxs is at steady state, (2) there is no postdepositional mobility of 210Pb and (3) the deposition of 210Pbxs is ideal; i.e., new radioactive inputs are deposited above the previously existing material. In the simplest of the cases, the CF–CS model assumes constant 210Pbxs depositional flux (Φ) and MAR. In this case the 210Pb specific activity at the surface (C0: Bq kg−1) is constant and decreases exponentially with cumulative mass. The depth of burial m is related to the elapsed time since burial through the rate of sedimentation (MAR) (Table 2). If there is mixing at the surface of the core, the mean MAR can be calculated from the 210Pbxs specific activity profile below the surface mixed layer (SML). If the specific activity of 210Pbxs declines in sections, showing two or more exponentially decaying segments, then a mean MAR can be derived for each segment (Goldberg et al., 1977). In this way the model is to some degree able to cope with temporal variations in mass accumulation rates.
Variations in the accumulation rate may occur in response to natural processes or anthropogenic influences. Under these conditions, the CRS or CIC models could be suitable. The CRS model assumes a constant flux of 210Pb (Φ) to the sediments over time. The initial specific activity is variable and inversely related to MAR (higher MAR leads to lower 210Pbxs specific activity and vice versa). The dating is based on the comparison of 210Pbxs inventories (Im; Bq m−2) below a given depth (integration of 210Pbxs specific activity as a function of the cumulative mass) with the overall 210Pbxs inventory in the sediment core (I) (Table 2). The accurate determination of the 210Pbxs inventories is of critical importance and required for the application of the CRS model (Appleby, 2001).
The CIC model could be a better choice at locations where sediment focusing is a major factor, where event deposit layers are present, or if significant hydrologic changes have occurred or there are hiatuses in the sediment record caused by erosion events (Appleby, 2008). The CIC model assumes that the initial 210Pbxs specific activity at the sediment–water interface is constant with time irrespective of the sedimentation rate so that the 210Pbxs flux covaries with MAR. This model permits an estimation of the age (t) at any depth at which 210Pb has been measured if the initial specific activity is known (Table 2). However, the CIC model requires a monotonic decrease in 210Pbxs specific activity down-core for age reversals to be avoided, which is rare in most vegetated coastal sediments. In that event, the calculation of mean accumulation rates alone using the CF–CS model would be a more reasonable approach, as it might be too ambitious to calculate a detailed stepwise chronology based on an often limited number of data points decreasing monotonically.
While the CIC and CF–CS models have typically been used in the marine environment, the CRS model is the most preferred in lake sediments and it is becoming widely applied in estuarine environments and vegetated coastal ecosystems (Andersen, 2017; Breithaupt et al., 2014). Some of the reasons could be that it suffers less from problems associated with non-monotonic features in the 210Pb record and is relatively insensitive to mixing (Appleby et al., 1983; Appleby and Oldfield, 1992; Oldfield et al., 1978). The selection and use of a particular model should be based on the nature of the 210Pbxs specific activity and MAR. For further details on the main aspects relevant to the application of 210Pb dating models in lake or estuarine environments we recommend two detailed and comprehensive book chapters by Appleby (2001) and Andersen (2017). Here, we focus specifically on analysis of the 210Pb dating of sediments in vegetated coastal ecosystems.
We performed a literature review of studies on sediment accumulation in vegetated coastal ecosystems in the Web of Science™ (http://webofknowledge.com, last access: 23 August 2018) with the following keywords: mangrove sediment; salt marsh, saltmarsh or tidal marsh sediment; seagrass sediment AND (Boolean operator) 210Pb, Pb-210 or lead-210. The search produced 86, 223 and 27 results, respectively, all of them using one or more of the three models described above, probably due to their simplicity, with some exceptions such as Klubi et al. (2017) that additionally uses the TERESA model (Table 2). From the literature review, we identified the most common sedimentary processes that result in anomalous types of 210Pbxs specific activity profiles with depth. These could be summarized in five main processes: mixing, increasing sedimentation, erosion, changes in sediment grain size and decay of organic matter (OM). Then, we simulated the target processes on initial undisturbed seagrass, mangrove and tidal marsh sediments to determine the potential discrepancies in MAR between ideal and anomalous 210Pbxs profiles and analyze the limitations of the 210Pb dating technique to derive CAR in these ecosystems. Throughout this work, we refer to “deviation” in MAR or CAR as the difference between the value computed and the value estimated from the ideal 210Pbxs profile.
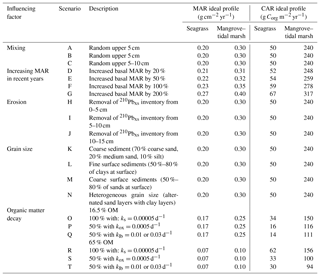
Table 3Summary description of the numerical simulations conducted to test for the effects of sedimentary processes on 210Pbxs specific activity profiles in seagrass and mangrove–tidal marsh sediments. MAR and CAR results derived from simulated profiles were compared with MAR and CAR estimates derived from the ideal 210Pbxs profiles reported here; ks is the decay rate of the refractory sediment organic matter (OM) under anoxic conditions and kox is that in oxic conditions; klb is the decay constant of the labile OM derived from seagrass and mangrove–tidal marsh ecosystems (0.01 and 0.03 yr−1, respectively).
2.1 Numerical simulations
All simulations started from an ideal 210Pbxs profile, complying with all assumptions, that was then manipulated to reflect the potential effect of each process. The ideal 210Pbxs profile was modeled considering the following: (1) a constant flux of 210Pbxs (Φ) of 120 Bq m−2 yr−1, i.e., the average global atmospheric flux reported by Preiss et al. (1996); (2) a MAR of 0.2 g cm−2 yr−1 and dry bulk density (DBD) of 1.03 g cm−3 to represent seagrass sediments; and (3) a MAR of 0.3 g cm−2 yr−1 and DBD of 0.4 g cm−3 to represent mangrove–tidal marsh sediments based on the typical values representative of these ecosystems (Duarte et al. 2013) (Table 1). Simulated surface activity per unit area of 210Pbxs (I0; in Bq m−2) in ideal profiles was estimated through Eq. (3). Then Eq. (4) was applied to estimate 210Pbxs activities per unit area along the ideal profile (Table S1 in the Supplement).
Activities of 210Pbxs per unit area (Im) were then converted to activities per unit mass, Cm in Bq kg−1, by dividing Im by the cumulative mass (m) and converting grams to kilograms at each layer. Ideal profiles were then altered to simulate the following processes or scenarios: mixing (surface and deep mixing), increasing sedimentation (by 20 %, 50 %, 100 % and 200 %), erosion (recent and past), changes in sediment grain size (coarse and heterogeneous) and OM decay (under anoxic and oxic conditions and with labile OM contribution in sediments containing 16.5 % and 65 % OM) (Table 3; refer to Appendix A for a detailed description of the methodology used to conduct each simulation).
The CF–CS and CRS dating models were applied to the simulated 210Pbxs profiles to determine the average MAR for the last century (Table 2). The CIC model was excluded from the simulations presented in this study because in erratic 210Pbxs profiles (1) the CRS model would lead to more reasonable approaches when the flux of 210Pbxs is constant and (2) when that is not the case (e.g., simulations of erosion or heterogeneous grain size), the determination of mean accumulation rates alone by the CF–CS model would be a more reasonable approach. The models were applied in accordance with the simulated process. For instance, MAR was determined below the surface mixed layer in mixing simulations using the CF–CS model and piecewise in those with a change in average MAR (Appendix A). However, the models were also applied considering that (1) 210Pbxs profiles of mixing simulations were generated by increasing MAR and vice versa, and (2) erosion was not a factor in simulated scenarios H to J. This was done to test the potential disagreement in MAR and CAR relative to the ideal profile if the incorrect process was assumed and dating models were applied. Once the dating model was established, the Corg accumulation rate (CAR) was estimated through Eq. (5) assuming average sediment Corg contents of 2.5 % in seagrass and 8 % in mangrove–tidal marsh in both ideal and simulated sediment profiles. Under ideal conditions, CARs were 50 and 240 g Corg m−2 yr−1 in seagrass and mangrove–tidal marsh sediments, respectively. While this overall model structure was used in all simulated scenarios, MAR and CAR rates under ideal conditions varied from those reported above in increasing MAR and OM decay simulations to represent real increases in accumulation, changes in OM content and associated losses of sediment mass with depth (Table 3).
where (% Corgi⋅mi) is the mass per unit area of Corg at layer i (g Corg m−2), mt is the cumulative mass over the period (t) (g m−2) and MARt is the mass accumulation rate of the period of interest (n−t) (g m−2 yr−1). When CAR is examined over the last 100 years, mt is the cumulative mass down to the 210Pbxs horizon (i.e., the depth at which 210Pbxs activity approaches zero) and MARt is the mean mass accumulation rate.
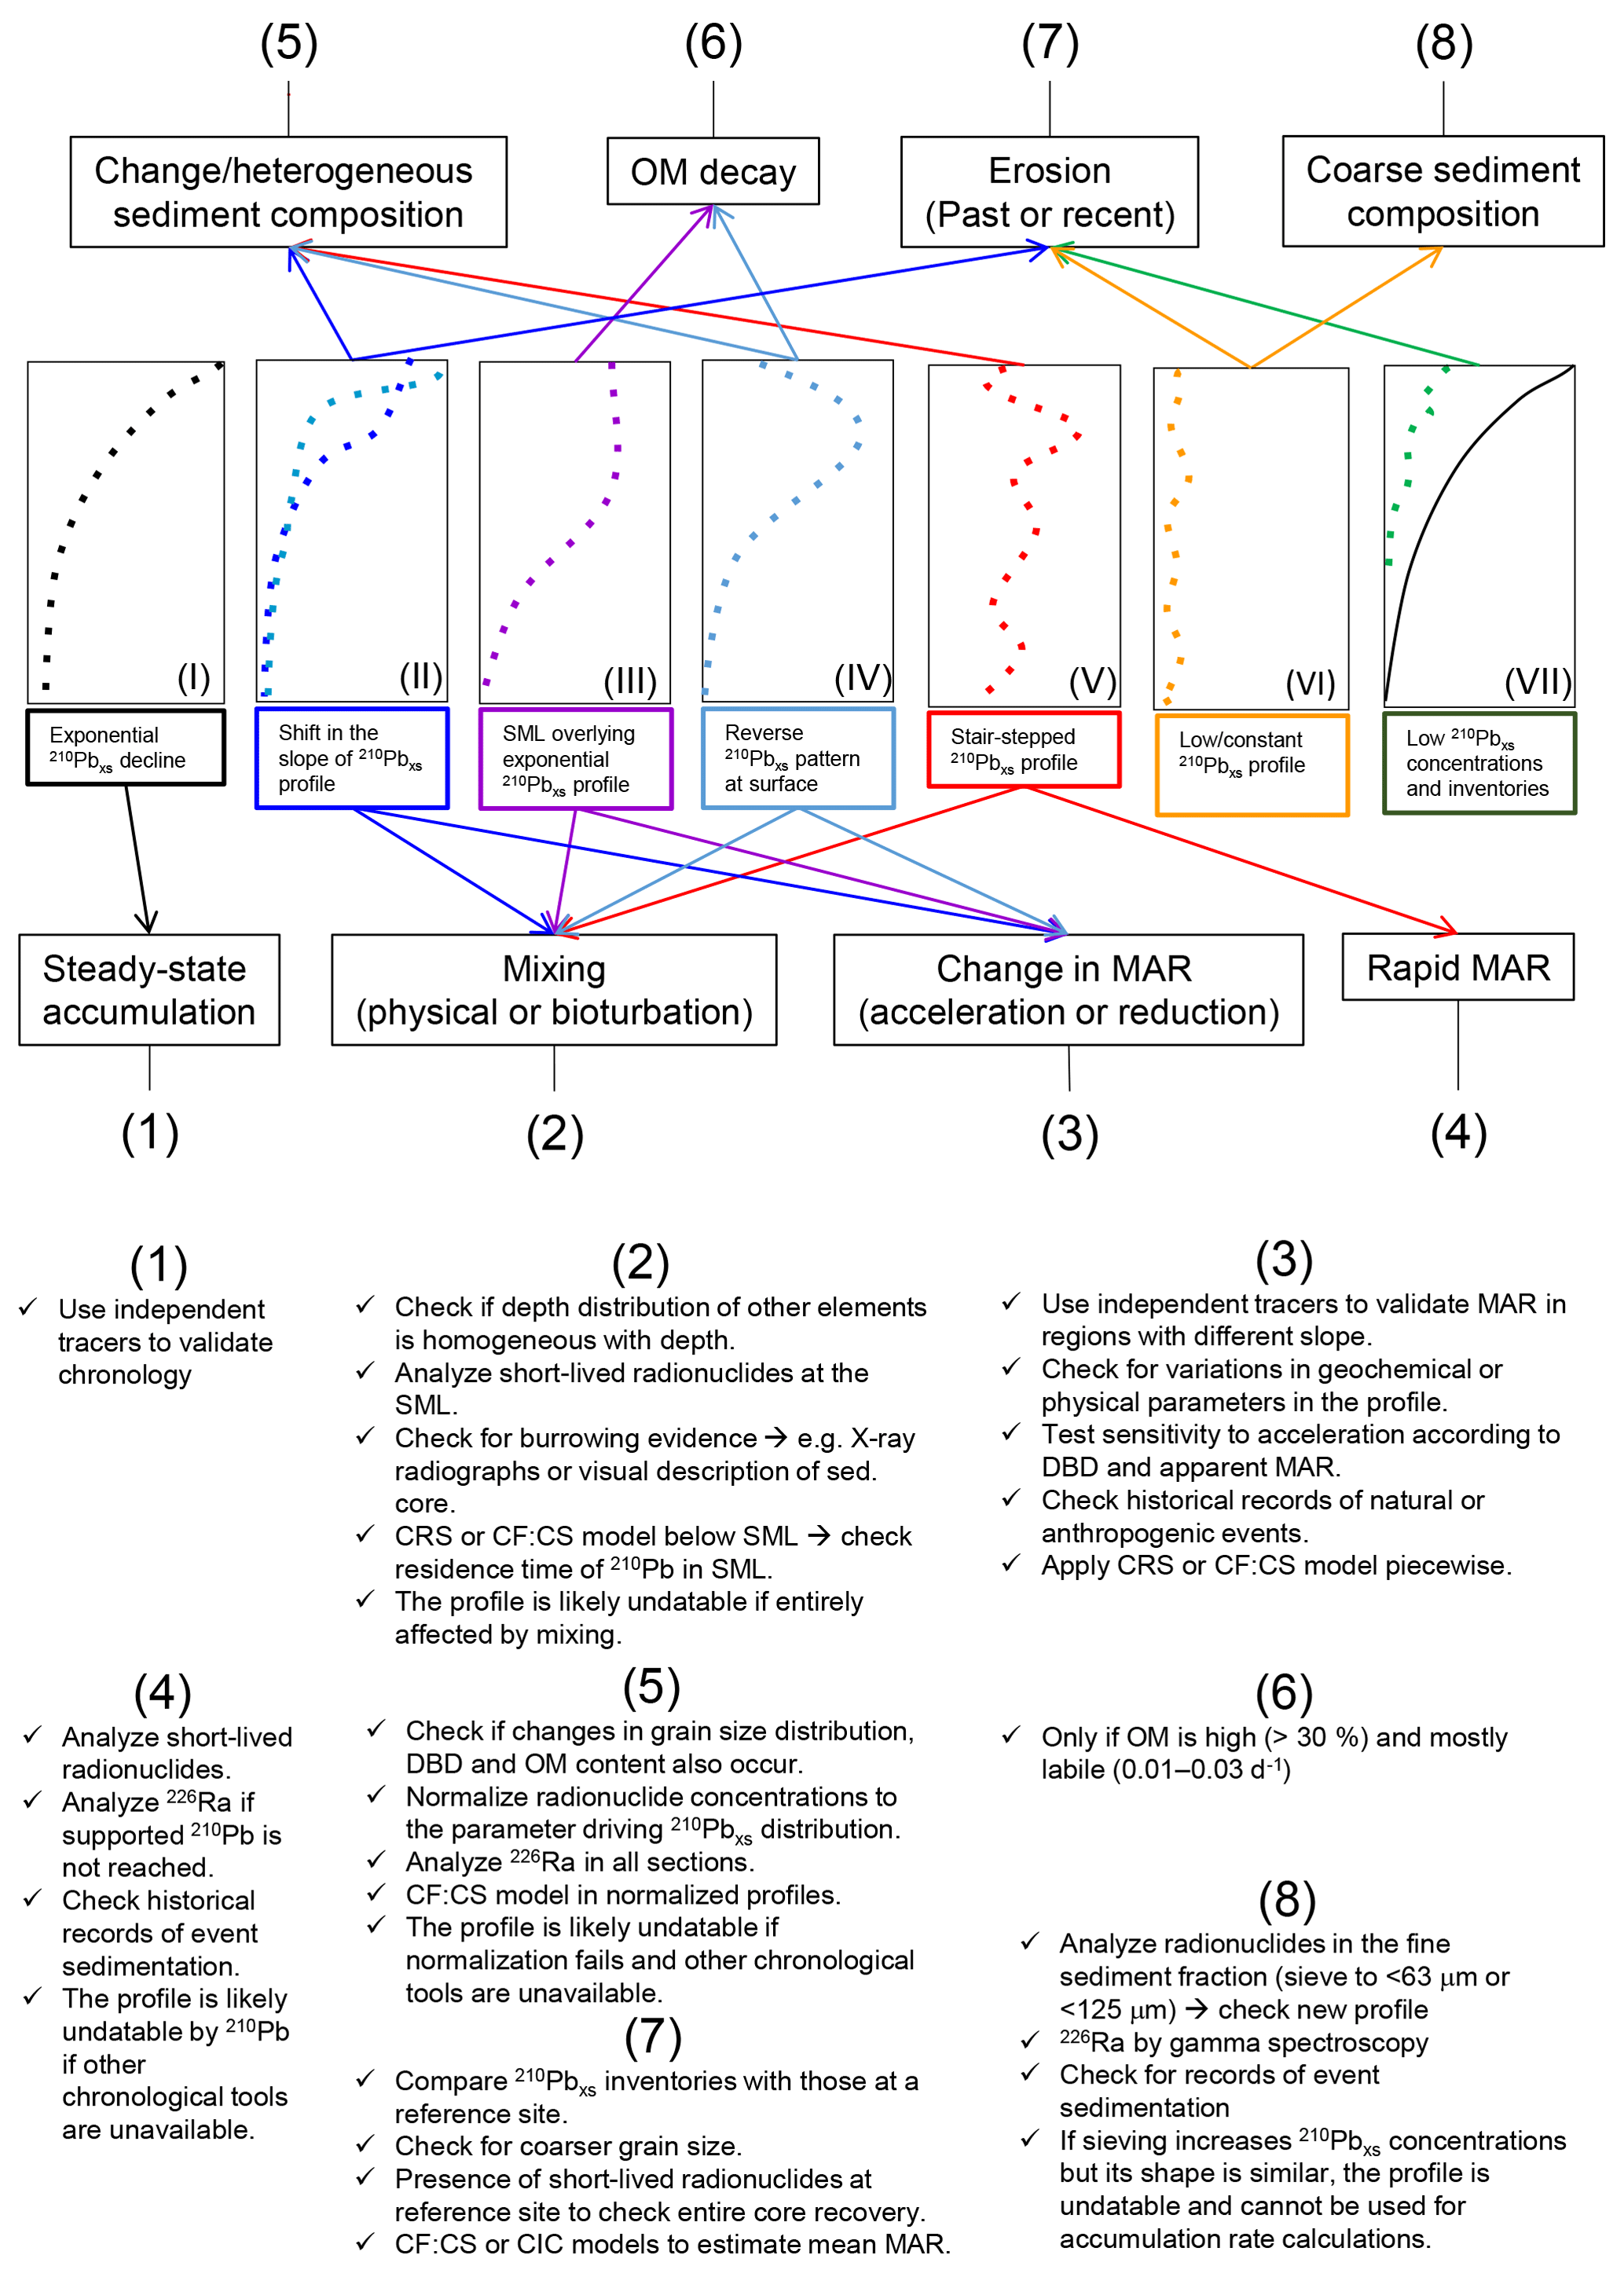
Figure 2Diagnostic features for seven distinct types of 210Pbxs profiles in vegetated coastal sediments (based on the literature and results from simulations in this study) and recommended actions to interpret each profile type and the sedimentary processes most likely involved. Characteristics of each profile type are explained in Sect. 3.1. The solid line in type VII represents the 210Pbxs specific activity profile at a reference undisturbed site.
3.1 Types of 210Pbxs specific activity profiles
Seven distinct types of 210Pbxs specific activity profiles can be identified in vegetated coastal sediments based on examples from the literature (Fig. 2). Type I is produced by constant sediment accumulation in steady-state conditions (i.e., “ideal” profiles). The other six types of 210Pbxs profiles summarize the most common disturbances encountered in vegetated coastal sediments that are related to the presence of mixing (physical or bioturbation), increasing MAR, erosion or alteration by intrinsic features of sediments such as heterogeneous grain size distribution and decay of OM.
Type II (dark blue profile) illustrates a moderate decrease in the slope of 210Pbxs specific activities in the upper part of the sediment core, which is often attributed to higher MAR (Cearreta et al., 2002; Haslett et al., 2003; Swales and Bentley, 2015), but can also be related to a mixing process (Gardner et al., 1987).
Type III, showing constant 210Pbxs specific activities along the upper part of the core overlaying an exponential decaying trend, is usually interpreted as the outcome of mixing as a result of bioturbation or sediment resuspension, redeposition, and reworking (Jankowska et al., 2016; Sanders et al., 2010a; Serrano et al., 2016a; Sharma et al., 1987; Smoak and Patchineelam, 1999). This profile type has also been related to rapid accumulation of homogeneous sediment or to recent increases in MAR (Walsh and Nittrouer, 2004).
Type IV profiles show a reverse 210Pbxs pattern at the surface and have been attributed to a variety of factors. Similar to type III, this profile type can be caused by mixing processes in vegetated coastal ecosystems (Sanders et al., 2010b; Serrano et al., 2016a; Yeager et al., 2012) or by the deposition of allochthonous older material (Johannessen and Macdonald, 2018). It could also be produced by an acceleration of the sedimentation rate, as interpreted by Greiner et al. (2013), Smoak et al. (2013) and Bellucci et al. (2007) in seagrass, mangrove and tidal marsh, respectively, or by the decay of OM, as modeled by Chen and Twilley (1999) and Mudd et al. (2009) and observed by Church et al. (1981) in tidal marsh sediments containing >30 % OM in top layers. Additionally, type IV profiles could also be explained by nonideal deposition (i.e., a fraction of the new 210Pbxs input onto the sediment is not retained at the surface but penetrates to deeper layers), a process reported in peatlands and in sediments with very high porosities (>90 %) at the sediment–water interface (Abril and Gharbi, 2012; Olid et al., 2016).
Type V profiles show scattered 210Pbxs specific activities, which might reflect the periodic occurrence of processes that can cause type III or IV profiles and are often interpreted as evidence of repetitive reworking in the overall mixed sediment column (Alongi et al., 2001; Serrano et al., 2016a; Smoak and Patchineelam, 1999). However, this profile form has also been explained by the deposition of 210Pbxs outpacing its decay (λ=0.03111 yr−1) (Alongi et al., 2005) or by a heterogeneous grain size sediment distribution with depth (Chanton et al., 1983; Kirchner and Ehlers, 1998; Sanders et al., 2010a), which could indicate varying 210Pbxs fluxes due to flood events, major land use changes or changes in vegetation cover (Appleby, 2001; Marbà et al., 2015).
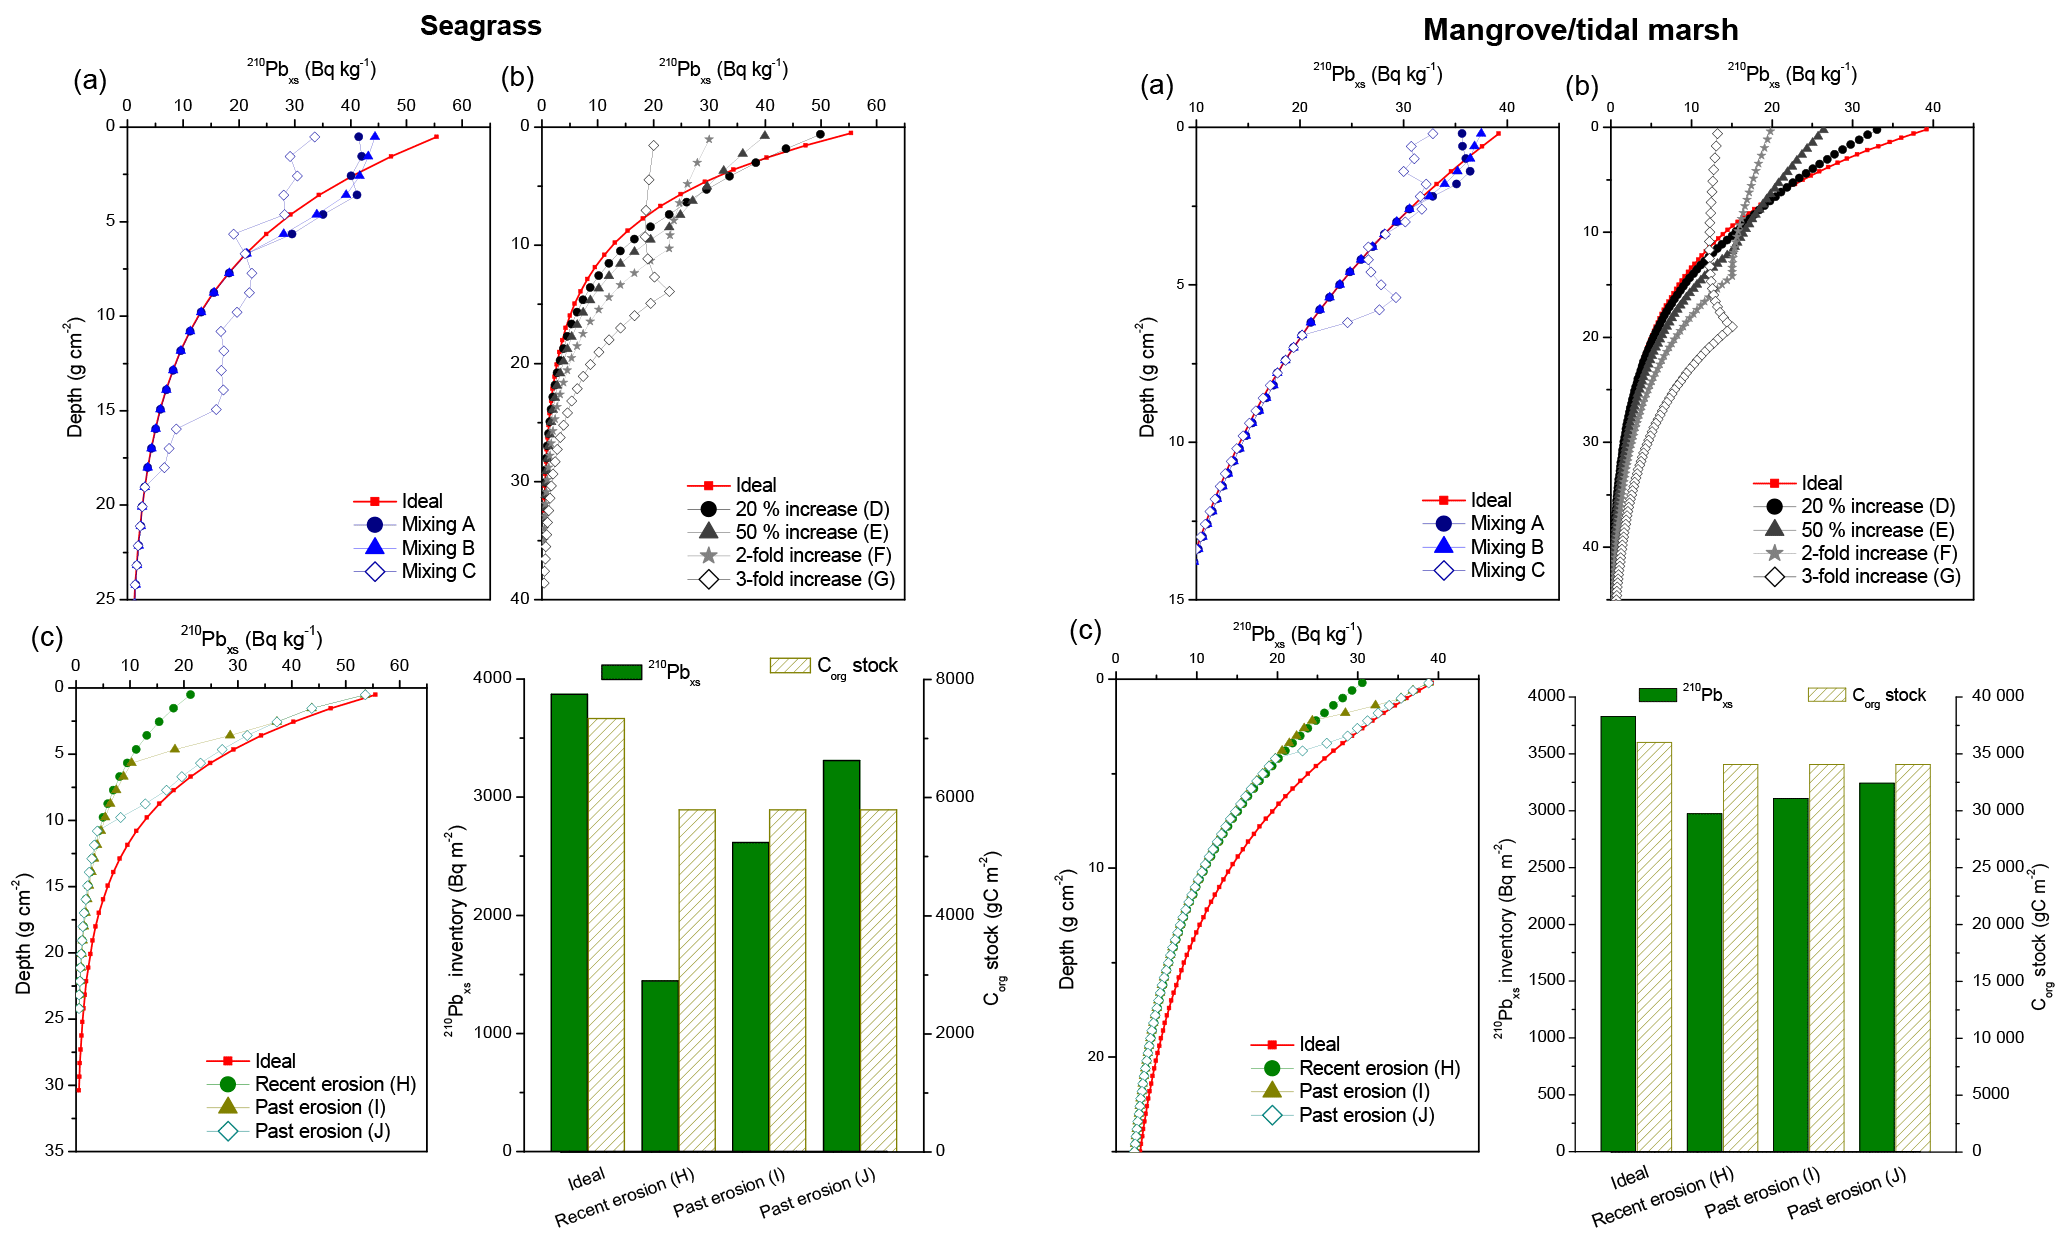
Figure 3Simulated 210Pbxs specific activity profiles of mixing (a), increase in sedimentation rates (b) and erosion processes (c) in vegetated coastal sediments. Several dry bulk density (DBD) and mass accumulation rates (MARs) are used to represent the effects of these processes in seagrass sediments (left panels: DBD 1.03 g cm−3; MAR = 0.2 g cm−2 yr−1; Corg=2.5 %) and in mangroves and tidal marsh sediments (right panels: DBD: 0.4 g cm−3; MAR = 0.3 g cm−2 yr−1; Corg=8 %). Bar charts illustrate the deficits in 210Pbxs inventories and Corg stocks after erosion events. See Appendix A for a detailed description of each scenario.
Types VI and VII represent low 210Pbxs activities with depth, apparently showing low, negligible modern net accumulation of sediments. Such profiles are usually related to an abundance of coarse sediments or to erosion processes, as shown in tidal marsh sediments (Ravens et al., 2009) and bare sediments that were previously vegetated with seagrass in Greiner et al. (2013), Marbà et al. (2015) and Serrano et al. (2016a).
These examples identified from the literature reveal that various sedimentary processes might produce similar types of 210Pbxs specific activity profiles. Any particular 210Pbxs profile can accommodate a range of mathematical modeling approaches (see below), which leads to the development of differing chronologies and MAR estimates. Hence, the identification of the process driving accumulation and causing variation in the 210Pbxs record aids in the determination of the Corg accumulation rates.

Figure 4Simulated 210Pbxs specific activity profiles resulting from changes in sediment composition and organic matter decay. Coarse homogeneous grain size (a) and heterogeneous grain size with depth (b); triangles and dots represent a 210Pbxs profile in sediments consisting of fine grains (<63 µm) or sands (>125 µm) at surface layers, respectively. (c, d) Organic matter decay from a starting level of 16.5 % and 65 %, respectively (considering different scenarios described in Appendix A), in seagrass (left panels: DBD 1.03 g cm−3; MAR = 0.2 g cm−2 yr−1) and mangrove–tidal marsh sediments (right panels: DBD: 0.4 g cm−3; MAR = 0.3 g cm−2 yr−1).
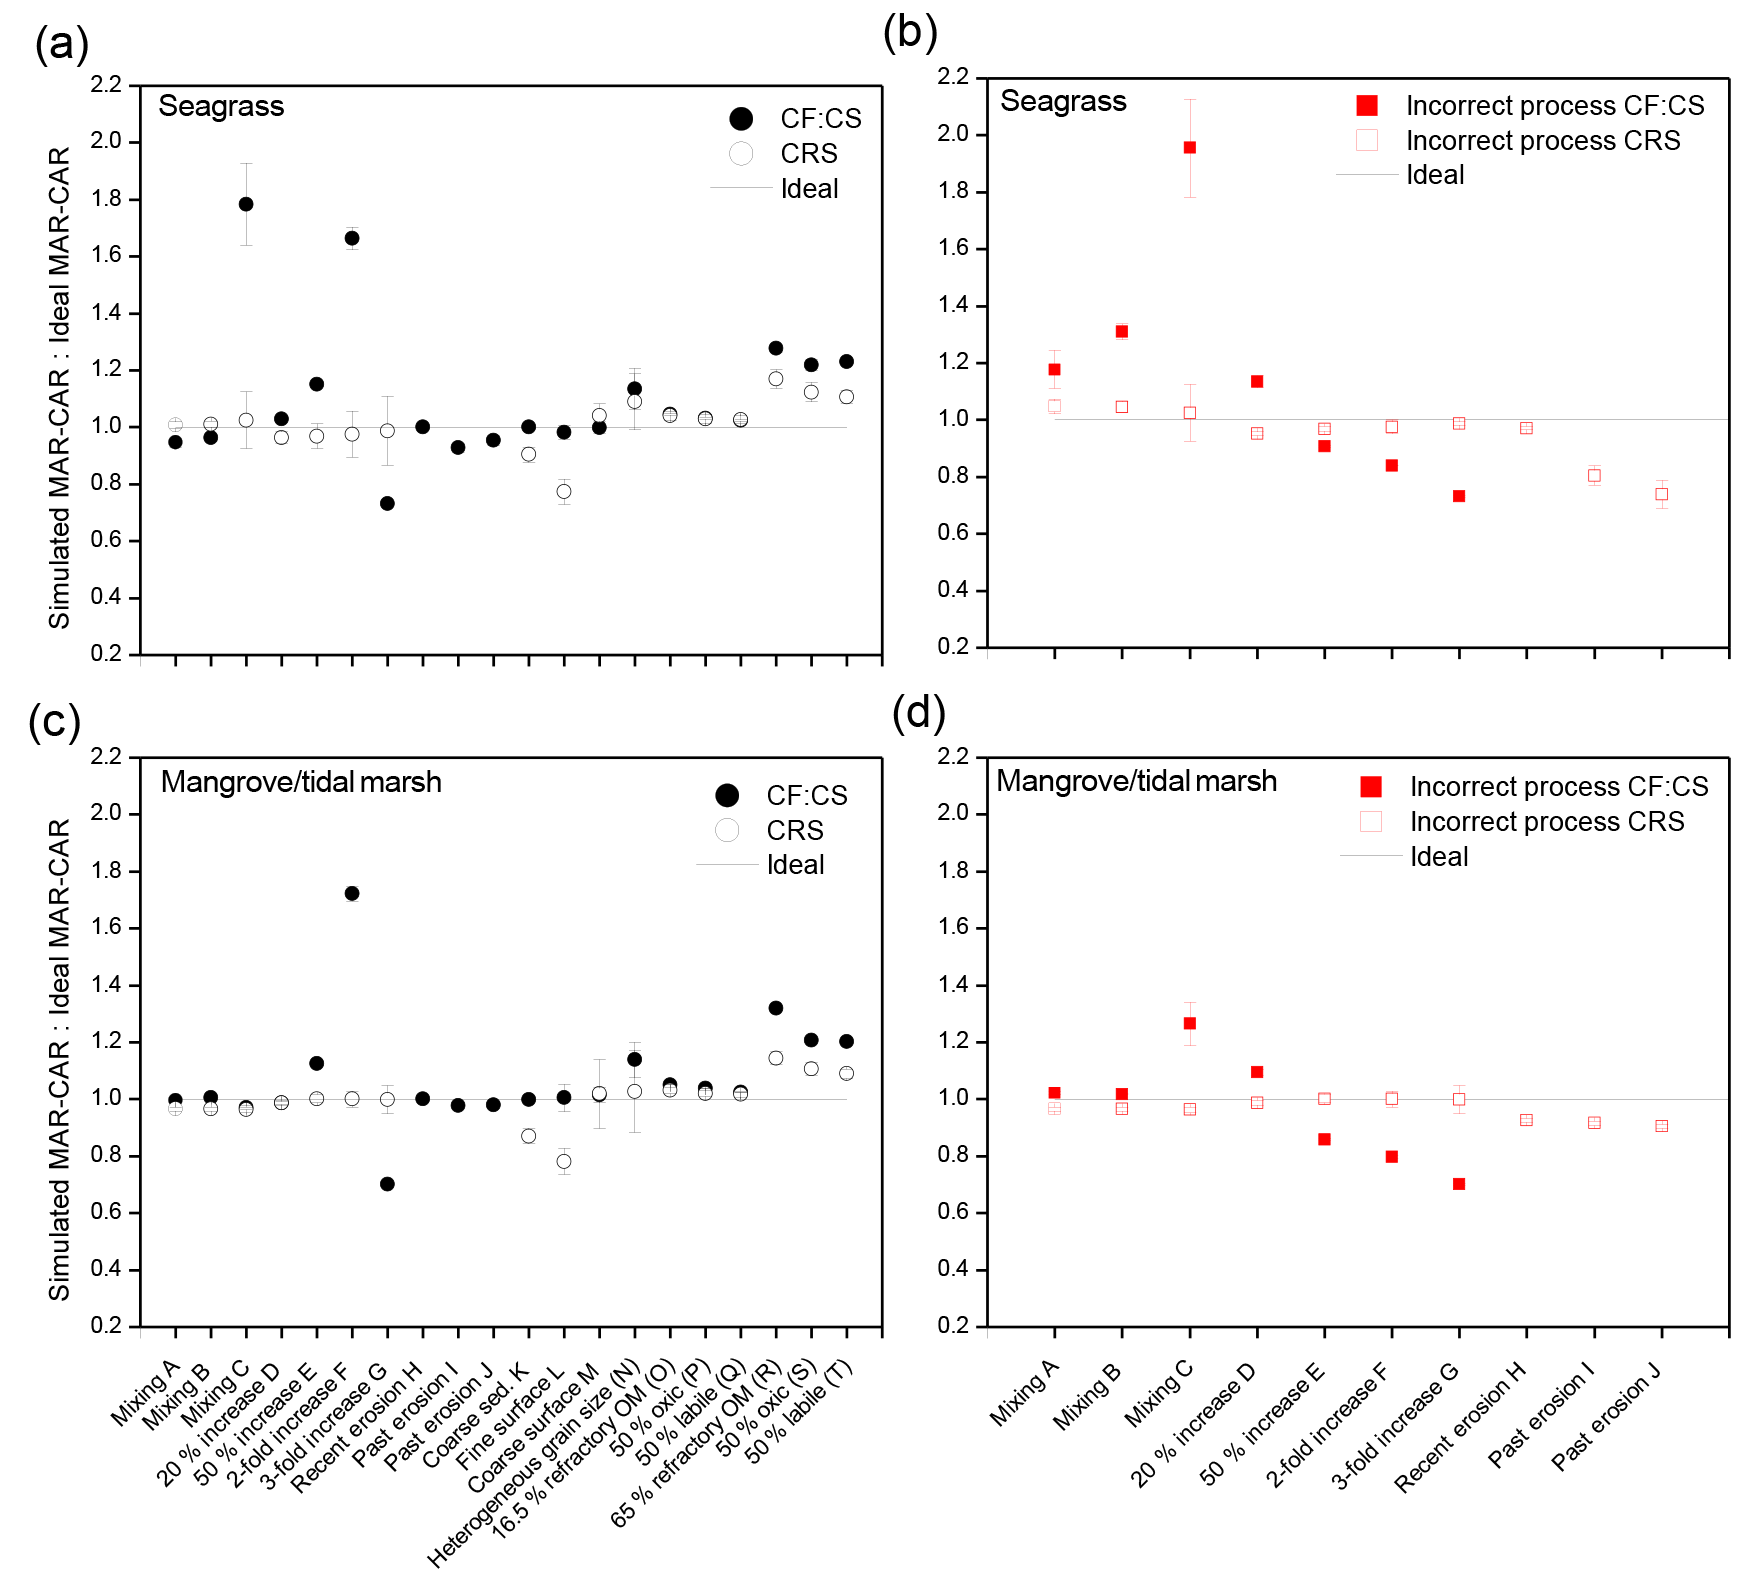
Figure 5Ratio of average 100-year Corg accumulation rates (CAR) between simulated and ideal 210Pb profiles produced by various sedimentary processes in seagrass (a, b) and mangrove–tidal marsh habitats (c, b). (a, c) The correct process is assumed and models are applied. (b, d) An incorrect process is assumed and models are applied accordingly. Error bars represent the result of error propagation. Uncertainties for mean MAR were derived from SE of the regression and SE of the mean using the CF–CS and CRS models, respectively. Ratios of simulated to ideal sedimentation rates (MARs) are equal to those for CAR, determined from multiplying MAR by the fraction of Corg in sediments (Eq. 5), which was considered constant between ideal and simulated profiles. In simulations of increasing sedimentation and organic matter decay, new MAR and CAR were estimated for ideal 210Pb profiles to represent real changes in accumulation, organic matter decay and associated changes in sediment mass with depth.
3.2 Simulated sediment and Corg accumulation rates (MAR and CAR)
We ran simulations for sedimentary processes (mixing, enhanced sedimentation, erosion) and heterogeneous sediment composition with depth (grain size distribution and OM decay). Results of the modeled 210Pbxs profiles are summarized in Figs. 3 and 4 and Tables S1–S7. We estimated mean 100-year MAR and CAR for the simulated profiles by applying the CF–CS and CRS models, and results were compared with those from their respective ideal non-disturbed 210Pbxs profiles. The estimated deviations in accumulation rates from those expected under ideal conditions are shown in Fig. 5 for seagrass and mangrove–tidal marsh ecosystems. These deviations are driven by variations in MAR caused by anomalies in 210Pb profiles as the Corg fraction was considered to be the same in both ideal and disturbed sediment profiles.
3.2.1 Mixing
Simulations of surface mixing (A and B in Fig. 3a) yielded 210Pbxs profiles similar to types II and III (Fig. 2), while deep mixing (scenario C) led to stepwise 210Pbxs profile forms similar to type V. Calculated MAR and CAR deviated between 4 % and 80 % from the ideal value in seagrass sediments, while such deviation was negligible (≤7 %) in mangrove–tidal marsh sediments due to the smaller proportion (5 %–10 %) of the 210Pbxs profile affected by mixing (Fig. 5a and c). In both cases, higher deviations from the expected rates were associated with deep mixing and with the use of the CF–CS model since this model interprets any divergence from the ideal exponential decrease in the 210Pbxs activity with depth to reflect random variation. In contrast, the CRS model is based on the 210Pbxs inventory (I) that is unaffected by vertical mixing.
Profiles of mixing in sediments could be equally explained by an increase in the sedimentation rate in recent years. If the incorrect process was assumed and dating models were applied accordingly, mean MAR and CAR were largely overestimated in seagrass sediments, by 20 %, 30 % and 95 %, using the CF–CS model in surface (scenario A, B) and deep mixing simulations, respectively (Fig. 5b). In mangrove–tidal marsh sediments, overestimation in mean MAR and CAR was substantial (30 %) when deep mixing was considered to be caused by an increase in MAR (Fig. 5d). A process mismatch between mixing and increased sedimentation in recent years did not cause large deviations (between 2 % and 5 %) in MAR and CAR derived by the CRS model. The CRS model outputs are similar if mixing or changes in accumulation rates are present, albeit ages within the mixed layer cannot be reported if mixing occurs.
3.2.2 Increasing sedimentation rates
Simulated increases in MAR from 20 % to 200 % (scenarios D to G, Fig. 3b) resulted in similar profile forms to those simulated with surface mixing. Increases in MAR were modeled over the last 30 years, a period over which more than a 100 % increase (2-fold) was needed to produce a reversal of 210Pbxs specific activities with depth under this simulation (type IV profiles). The influence of a change in MAR was better captured with the CRS model. The CF–CS model, in contrast, failed to account for rapid and large increases in MAR. Deviations from the ideal value ranged from 0 % to 15 % in scenarios D and E (20 % to 50 % increase in MAR) and were up to 60 % for a 100% increase in MAR (scenario F). Calculated MAR in scenario G (200% increase in MAR) was underestimated by a 30%, as piecewise dating is not applicable in profiles with constant or reversed activities of 210Pbxs with depth. In such situations, additional tracers or time markers are required to estimate MAR and CAR in the layer of constant 210Pbxs activities (see Sect. 4.2). Deviations from the expected value ranged from 0 % to 4 % when using the CRS model (Fig. 5a and c). Results were similar for both ecosystem types. If the recent increase in MAR was interpreted as mixing, the mean MAR and CAR were underestimated by between 10 % and 30 % in both habitat types using the CF–CS model (Fig. 5b and d). In contrast, the deviation from the ideal value was ≤5 % if the CRS model was applied.
3.2.3 Erosion
We ran three simulations (H, I and J) to represent recent (H) and past erosion events (I and J) (Fig. 3c). Simulations of erosion yielded lower 210Pbxs specific activities than those of the ideal reference profile (type VII, Fig. 2), and 210Pbxs dating horizons were found at shallower depths in these simulations (Fig. 3c). Consequently, 210Pbxs inventories (I) in eroded profiles were lower than expected (reference ideal profile Iref: 3900 Bq m−2). Inventories of simulated seagrass sediments had a deficit of 2400 Bq m−2 (60 %), 1250 Bq m−2 (30 %) and 600 Bq m−2 (15 %) in erosion scenarios H, I and J, respectively, while these deficits were of 900 Bq m−2 (22 %), 700 Bq m−2 (19 %) and 600 Bq m−2 (15 %) in mangrove–tidal marsh sediments. Because seagrass ecosystems have lower sedimentation rates, a greater proportion of the 210Pbxs inventory was found in the top 10 cm of the sediment column and thus missing because of erosion. Simulations of past erosion events, which can be identified deeper in the profile, produced breaks in the slope of the 210Pbxs profiles similar to those of type II (Fig. 2). Simulated erosion scenarios did not result in a large impact in the CF–CS-derived MAR and CAR estimates under the conditions of this simulation (Fig. 5). Derived MAR and CAR were underestimated by 7 % and 2 % in seagrass and mangrove habitats, respectively. The CRS model cannot be applied to eroded 210Pbxs profiles unless the missing inventory is known and the total (I) and depth-specific (Im) 210Pbxs inventories can be corrected. Assuming erosion was not a factor, the application of the CRS model to our simulated profiles underestimated MAR and CAR by up to 25% in seagrass and by 10 % in mangrove–tidal marsh sediments (Fig. 5b and d). Therefore, we caution against the use of the CRS model in profiles that show 210Pbxs inventories that are lower than those expected via atmospheric 210Pbxs deposition or relative to nearby undisturbed sites (Fig. 3c). The magnitude of erosion is better estimated by the deficit in inventories of 210Pbxs, rather than by sedimentation rates. The comparison between sediment records can provide information about the degree of erosion (see Sect. 4.3). In our simulations, the Corg stocks over the last 100 years were 20 % and 5 % lower in seagrass and in mangrove–tidal marsh sediments, respectively, compared to the corresponding ideal non-eroded profile. Part of this is likely related to the fact that the concentration of Corg is not changed, which in reality may actually change since fine sediments, in which Corg is more efficiently adsorbed, are more easily eroded and OM is remineralized when exposed to oxic conditions during resuspension (Burdige, 2007; Lovelock et al., 2017a) (see simulations in Sect. 3.2.4 and 3.2.5). Consequently, losses of sediment Corg could be significantly larger, as shown in some recent studies (Macreadie et al., 2013, 2015; Marbà et al., 2015; Serrano et al., 2016a).
3.2.4 Sediment grain size distribution
Coarse sediments are often unsuitable for 210Pb dating as they may lead to very low 210Pbxs specific activities. We simulated 210Pbxs profiles in a sediment consisting of 70 % coarse sand (scenario K, Fig. 4a). This led to diluted 210Pbxs specific activities with depth similar to those produced by erosion processes. In contrast to erosion simulations, coarse but homogeneous grain size distribution with depth did not have any impact on MAR and CAR estimated by the CF–CS model, since the dilution effect did not cause any anomaly in the slope of the 210Pbxs profile. However, the CRS model underestimated the sedimentation rate by 10 % in both habitats (Fig. 5). The reduction of 210Pbxs specific activities may cause the limits of detection of 210Pbxs (0.35 Bq kg−1 in our simulations) to be reached at shallower depths than in the ideal profile. In this simulation, the limits of detection were 4 and 6 cm shallower in seagrass and in mangrove–tidal marsh sediments, respectively (Table S5a and b in the Supplement). This was conducive to the overestimation of the sediment age at bottom layers by the CRS model and underestimated mean MAR due to the omission of a higher fraction of the integrated 210Pbxs activity per unit area from Im and I at depths greater than those at which the limit of detection was reached (MacKenzie et al., 2011). This effect is known as the “old date error” of the CRS model and can be corrected as described in Binford (1990) and Appleby (2001). Because we have assumed the same Corg content in ideal as in simulated profiles, CAR estimates vary similarly to MAR. However, Corg content would likely covary with grain size, and we therefore expect lower Corg content with coarser sediments (Dahl et al., 2016; Sanders et al., 2012).
Simulations of varying grain size distribution with depth (scenarios L, M and N) led to stepwise 210Pbxs profile forms (Fig. 4b). A sharp increase in 210Pbxs specific activities in surface layers can be produced by the presence of finer sediments in which 210Pb is preferentially associated (scenario L). As a result, sedimentation rates were 2 % to 20 % lower than those estimated for the ideal profile in both habitat types using the CF–CS and the CRS models, respectively (Fig. 5). The CRS model assumes that 210Pbxs specific activities are inversely related to the sedimentation rate, and thus higher 210Pbxs activities led to lower accumulation rates.
When coarser sediments dominated at the surface layers (scenario M), the simulated profiles obtained were similar to those with mixing and accelerated sediment accumulation in recent years (types II, III and IV). The dilution of 210Pb specific activities caused by the deposition of coarse sediments in surface layers was interpreted by the CRS model as an increase in the sedimentation rate; however, this effect was compensated for in part by the old date error. With coarser sediments at surface layers, the CF–CS model applied piecewise overestimated average MAR and CAR by only 1 % in both habitat types, while the CRS model resulted in a 5 % overestimation (Fig. 5). If changes in grain size are considered throughout the entire 210Pbxs profile (scenario N), the deviations in accumulation rates were up to 10 % using both models in both habitat types. Indeed, the deposition of coarse sediments may indicate exceptional increases in sedimentation in the case of storm surge deposits or pulsed sediment deliveries. In these cases, the CF–CS model could be applied if the event layer can be identified and can be subtracted to produce a corrected depth profile from which to determine the CF–CS-derived ages and mean mass accumulation rate. However, the presence of coarse sediments is often related to a reduction in the deposition of fine particles or to the transport and erosion of these in high-energy environments, leading to a variation in the 210Pbxs flux onto the sediment surface that is considered constant through time by the two dating models. Where heterogeneous sediment layers are present, some corrections, such as the normalization of 210Pbxs specific activities, are required before the application of any of the 210Pb dating models to obtain more accurate estimates of MAR and CAR (see Sect. 4.4).
3.2.5 Organic matter decay
Two different scenarios with low and high sediment organic matter (OM) content (16.5 % and 65 %, respectively) were modeled in relation to OM decay. In both scenarios simulated MAR and CAR were overestimated relative to those derived from ideal profiles. Variation in OM decay (from a starting level of 16.5 %) only slightly affected 210Pbxs specific activity profiles (Fig. 4c), causing a small overestimation of MAR and CAR of between 2 % and 5 % in both habitats and by both models under any of the rates of decay considered in this simulation (0.00005, 0.0005 and 0.01−0.03 d−1) (Fig. 5a and c). OM decay in very rich organic sediments (65 % OM) caused increased 210Pbxs specific activities at surface (scenarios R and T) and subsurface sediments in which the decay of OM is greater, leading to a reversal of the 210Pbxs profile in simulated scenario S. Derived CARs were 20 %–30 % higher as estimated by the CF–CS model and 10 %–20 % using the CRS model in both habitat types (Fig. 5a and c).
Mass accumulation in vegetated coastal ecosystems is the result of the balance between material accretion (detritus and sediment) from autochthonous and allochthonous sources, decomposition, and erosion (e.g., Mateo et al., 1997). Assuming there is no erosion, the estimates of MAR and CAR by means of 210Pb are the net result of mass accumulation with time and hence integrate both the burial and decomposition of organic matter over a centennial timescale. Because mean CAR rates are based on the Corg presently available and not the amount originally deposited, their determination will be dependent on the timescale over which they are calculated.
3.2.6 General remarks
Among the various ecosystems considered here, average last 100-year MAR and CAR derived from the CF–CS and the CRS models were less vulnerable to anomalies in mangrove–tidal marsh compared to seagrass sediments. Higher sedimentation rates lead to deeper 210Pbxs dating horizons and thus the fraction of the 210Pb profile affected by anomalies was lower in mangrove–tidal marsh than in seagrass sediments. Anomalies caused by deep mixing or 2- to 3-fold acceleration in sedimentation had larger effects on the CF–CS-derived accumulation rates, while alterations caused by heterogeneous grain size composition or underestimation of 210Pbxs inventories primarily affected the CRS model results (Fig. 5). Care must be taken in these cases since the discrepancy in mean MAR relative to the ideal value could range between 20 % and 80 %. Our simulations showed that the decay of OM results in an overestimation of the accumulation rate, which was most severe in very rich organic sediments regardless of the model used (>50 % OM). However, this effect could reasonably be ignored in most cases since vegetated coastal ecosystems rarely contain OM concentrations >25 % (Table 1), for which the deviation in computed MAR was below 10 %. Overall, simulations showed that the variability in MAR and hence CAR due to sedimentary processes and differences in sediment composition was moderately low when appropriate dating models were applied and interpreted. Deviations in the determination of MAR and CAR, generally within 20 %, confirmed that the 210Pb dating technique is secure (Fig. 5). However, failure to account for the correct process affecting 210Pb specific activity profiles could lead to deviations in mean MAR and CAR exceeding 20 % (Fig. 5c, d).
MAR and CAR were most overestimated, from 20 % to 95 % in simulations with low accumulation rates, when acceleration was interpreted in mixed 210Pbxs profiles and the CF–CS model was applied piecewise. Deep mixing confounded with an increase in MAR generated the largest overestimation of mean CAR in both habitat types. In contrast, if mixing was assumed in 210Pbxs profiles showing a recent increase in MAR, mean accumulation rates were underestimated by up to 30 % using the CF–CS model below the surface mixed layer. Indeed, the CRS model was less sensitive to anomalies in 210Pbxs profiles; however, its application requires accurate determination of the 210Pbxs inventory at each depth (Im) and in the entire record (I), which can be problematic, for instance, when all samples along a sediment core have not been analyzed or when sediment erosion has occurred at the core location. When the total 210Pbxs inventory is underestimated, be it through erosion, poor detection limits or insufficient core length, this generates erroneous dates and underestimation of average MAR and CAR. Underestimation of accumulation rates will depend largely on the proportion of the missing fraction of the 210Pbxs inventory from Im and I. In our simulations, MAR and CAR were underestimated by 10 % to 25 %. While uncertainties within 20 % might be acceptable for the determination of mean MAR and CAR over a centennial timescale, they may not allow for the determination of a detailed geochronology, historical reconstruction, or ascertained rates of change and fluxes at specific times. In that event additional tracers or geochemical, ecological and historical data need to be used to validate the 210Pb-derived results and reduce uncertainties caused by anomalies in 210Pbxs profiles in vegetated coastal sediments.
Retrieving reliable CAR depends on the correct determination of MAR and the diagnosis of the intervening sedimentary process. However, similarities in simulation outcomes and variations associated with anomalies in 210Pbxs profiles point to the need for additional sources of evidence to discriminate between alternative processes and constrain 210Pb-derived estimates. 137Cs or other independent radioactive tracers can be used to corroborate 210Pb geochronologies. However, in its absence, geochemical information combined with knowledge of events related to land use and/or environmental changes (e.g., by means of aerial photographic evidence; Swales et al., 2015) can also be used as a tool to validate 210Pb geochronologies and interpret 210Pbxs profiles. In Fig. 2 we have summarized the steps to characterize 210Pb profiles and the sedimentary processes most likely involved and suggest several techniques to complement the 210Pb dating method to obtain reliable MAR and CAR.
Prior to analysis, researchers can have control over some factors, such as coring, sampling or sample handling, that can create artifacts in 210Pb profiles and therefore contribute to dating error. Guidelines for core sampling for the analysis of 210Pb and other radionuclides have been described in detail, for example in Brenner and Kenney (2013) and in the technical report IAEA-TECDOC-1360 (2003). Some knowledge of the expected sedimentation rate is useful to decide how to section a sediment core for 210Pb measurements, as is knowledge of the length that a core must have to reach the depth of the 210Pbxs horizon. Low sedimentation rates (∼1–2 mm yr−1) and/or coarse sediments may imply that the 210Pb-datable part of sediment cores is limited to the very top centimeters. In such situations, fine sectioning intervals (0.5 cm) would be required. Longer cores (of about 100 cm) should be collected if high sedimentation rates are expected (several mm yr−1) so that the entire 210Pbxs inventory is captured and the CRS model can be applied. These can be sliced at thicker intervals without compromising the temporal resolution of the 210Pb record. If the order of magnitude of the sedimentation rate is not known a priori, it is best to choose fine sampling intervals (e.g, at 0.5 cm along the upper 20 cm, at 1 cm from 20 to 50 cm, and at 2 cm below 50 cm) to ensure sufficient resolution.
After collection, a visual description (e.g., color, sediment texture, presence of roots, organisms or layers) of the sediments and measurement of parameters such as water content, OM and grain size are relatively low-cost actions that provide information to interpret 210Pb distribution and the pattern of accumulation. Indeed, the type of sediment (e.g., fine vs. coarse, rich in carbonates, homogeneous or with organic debris embedded) is a factor that should be considered (IAEA-TECDOC-1360, 2003). Coarse particles or coarse-grained carbonates for which 210Pbxs is less preferentially adsorbed (Wan et al., 2005) may hinder the detection of any 210Pbxs in vegetated coastal sediments. In such situations, the analysis of 210Pb in the smaller sediment fraction (i.e., <63 µm or <125 µm) is recommended to concentrate 210Pb and reduce the dilution effect caused by coarse fractions. However, the application of the CRS model would then be limited to those cases in which the 210Pbxs is contained entirely in the sieved sediment fraction. Sieving combined with 210Pb dating has been applied to mangrove sediments from arid regions where 210Pbxs flux is low (Almahasheer et al., 2017) and to carbonate-rich seagrass sediments in Florida Bay (Holmes et al., 2001). Similarly, large organic material such as roots and leaves should be removed from the sediment samples prior to 210Pb analyses as these may contribute to the dilution of the 210Pbxs specific activity.
The analytical methods for 210Pb measurements can also be chosen depending upon the amount of sample available and its expected specific activity. While the indirect determination of 210Pb through alpha spectrometry of its granddaughter 210Po requires a small amount of sample (150–300 mg) and will provide a significantly better limit of detection (<1 Bq kg−1), the direct determination of 210Pb by gamma spectrometry can simultaneously provide data for supported 210Pb (226Ra) and relevant radionuclides, such as 137Cs, 228Th, 7Be and 40K, to validate the 210Pb geochronologies. For a detailed description of the analytical methods and their advantages and disadvantages, see Corbett and Walsh (2015) and Goldstein and Stirling (2003).
4.1 General validation of 210Pb models
4.1.1 Artificial radionuclides
Independent validation of the chronology is essential to ensure a high level of confidence in the results (Smith, 2001). Varved sediments used to validate chronologies in lakes do not occur in vegetated coastal sedimentary sequences, and thus transient signals such 137Cs or 239+240Pu become the most commonly used option to validate 210Pb chronologies (Lynch et al., 1989; Sanders et al., 2010a). 137Cs and 239+240Pu were released to the environment through the testing of high-yield thermonuclear weapons in the 1950s to 1960s and can be used as chronometers in sediments either by assuming that the peak in activity corresponds to the fallout peak in 1963 or 1965 in the Northern and Southern Hemisphere, respectively, and/or that the depth of its first detection corresponds to the onset of fallout in the mid-1950s (Ribeiro Guevara and Arribére, 2002; Stupar et al., 2014). In addition, 137Cs can also display a peak of elevated activity in sediment cores from Europe, corresponding to the emissions caused by the Chernobyl accident in 1986, which can also help to validate 210Pb chronologies (Callaway et al., 1996).
However, the use of 137Cs might have some limitations in vegetated coastal sediments. Two-thirds of the 137Cs activity released due to the tests in the atmosphere decayed after 6 decades, rendering the identification of peaks and their correspondence to the mid-1950s and 1960s depths more difficult to determine. In addition, the detection of 137Cs is more difficult in sediment cores from habitats located in the Southern Hemisphere and near the Equator. The low 137Cs bomb-test fallout and Chernobyl inputs in these regions (Kelley et al., 1999; Ruiz-Fernández and Hillaire-Marcel, 2009), the greater solubility of 137Cs in seawater (Kd=102 to 103, Bruland, 1983), and the presence of sands and carbonates, particularly in seagrass sediments (Koch, 2001), are conditions that do not favor the adsorption of 137Cs (He and Walling, 1996a) and may lead to its mobility (Davis et al., 1984). This effect could be intensified in the intertidal zone, which is not permanently submerged due to periodic changes in the water table. High contents of OM can also affect the distribution of 137Cs in sediments as it is preferentially accumulated in leaf litter and may be absorbed by living roots (Olid et al., 2008; Staunton et al., 2002). In addition, decomposition of the organic phase in organic-rich sediments may cause the mobility of this radionuclide (Davis et al., 1984). These factors together may compromise the use of 137Cs to validate 210Pb geochronologies in vegetated coastal ecosystems. In contrast, Pu isotopes (239Pu half-life = 24 100 years and 240Pu half-life = 6500 years), although they are also dependent on the distribution of bomb-test fallout, would appear to offer several advantages over 137Cs in these environments, since 239+240Pu is relatively immobile under both freshwater and saltwater conditions (Crusius and Anderson, 1995). For instance, Sanders et al. (2016) determined sedimentation rates and 239+240Pu penetration depths to study nutrient and CAR in intertidal mangrove mudflats of Moreton Bay, Australia. Nevertheless, because of the limitations in validating older 210Pb dates near the base of the core and the low inventories of bomb-test fallout in sediments of Southern Hemisphere latitudes, alternative tracers might need to be used.
4.1.2 Geochemical information on sediments
Besides the irregular shape of 210Pbxs profiles, the absence of a secondary radioactive tracer to validate 210Pb results can make interpretation even more complicated. However, geochemical information in sediments can provide the potential for an additional temporal frame and can also help to explain sedimentary processes that could be misinterpreted (e.g., mixing, increasing MAR, higher primary productivity or reduction of sediment supply). Analyses of additional proxies (pollen, diatom, nutrient concentrations, stable isotopes or trace metal records; López-Merino et al., 2017) that are based on well-described historical events at the study sites (e.g., pollution, crops and land clearance) could be used in the absence of secondary radioactive tracers to corroborate 210Pb-derived dates and accumulation rates. For instance, stable Pb isotopes or total Pb concentrations in sediments are related to the history of the use of leaded gasoline in the area and can be used to identify age marks corresponding to peaks in its use or changes in lead sourcing. An example can be found in seagrass sediment cores from Florida Bay, USA (Holmes et al., 2001), and in Gehrels et al. (2005) that combines a marsh elevation reconstruction with a precise chronology derived from pollen analysis, stable isotopes (206Pb, 207Pb), 210Pb and artificial radionuclides (137Cs, 241Am). Additionally, profiles of trace and heavy metals and of carbon δ13C and nitrogen δ15N isotopic composition of OM provide information about environmental changes for which historical information may be well known, i.e., human settlement, onset of tourism industry, temporal evolution of cropland areas or histories of variation in plant communities (Garcia-Orellana et al., 2011; Mazarrasa et al., 2017; Ruiz-Fernández and Hillaire-Marcel, 2009; Serrano et al., 2016b).
4.2 Mixing or rapid sedimentation
The methods described above for the general validation of 210Pb models can also serve to discriminate between mixing or increasing MAR in recent years. 137Cs and 239+240Pu can also be used as tracers of bioturbation (Crusius et al., 2004) or acceleration of MAR during the past 50 years (Appleby, 1998; Cearreta et al., 2002; Lynch et al., 1989; Sharma et al., 1987). For instance, a demonstration of acceleration versus fast mixing could be supported when it is possible to find the distinct 137Cs or 239+240Pu peaks in the same zone where 210Pbxs activities are constant (Appleby, 2001). Changes along the profiles of geochemical elements consistent with shifts in 210Pbxs specific activities can often be associated with changes in sedimentation or erosion processes. For instance, instantaneous depositional event layers can be identified in the sedimentary record as isolated minima of 210Pbxs specific activities (Jaeger and Nittrouer, 2006; Smoak et al., 2013), but also as variations in grain size composition, OM, water content or dry bulk density (Smoak et al., 2013; Walsh and Nittrouer, 2004) (Sect. B1). Changes in sediment mineralogy can be discerned trough X-ray radiographs, X-ray fluorescence and CAT scans (described below), but also through other radionuclides, like 226Ra and 40K, the profiles of which can be measured together with those of 210Pb through gamma spectrometry. In particular, 40K is also part of the mineral matrix and is often used as a surrogate for the lithogenic sediment fraction (Garcia-Orellana et al., 2006; Peterson, 2009; Xu et al., 2015).
4.2.1 Geophysical analyses
Prior to core sectioning and subsampling, nondestructive geophysical analyses such as X-ray radiographs, X-ray fluorescence (XRF), CAT scans (computerized axial tomography) or magnetic susceptibility can be conducted to identify changes in the composition of sediments with depth and in MAR or provide evidence of mixing. For instance, using X-ray radiographs many features and physical sedimentary structures may be visible (Sun et al., 2017) and, if preserved, could support the interpretation of a rapid increase in sedimentation (Walsh and Nittrouer, 2004). Pulsed sediment deliveries or erosion could be identified by discontinuous physical stratification, and sediment mixing by the presence of active burrows or the absence of sedimentary stratification (Chanton et al., 1983).
4.2.2 Short-lived radionuclides (234Th, 228Th, 7Be)
Radionuclides such as 234Th, 7Be and 228Th with properties such as particle reactivity and relatively short half-lives (24.1 days, 53.3 days and 1.9 years, respectively) are suitable to quantify sedimentation processes at scales from several months (234Th and 7Be) to a decade (228Th). Excess 234Th and 7Be are sensitive indicators of mixing in the zone of constant, scattered or reversed 210Pbxs specific activity profiles and are the most widely used (types II, III and IV, Fig. 2) (Cochran and Masqué, 2005; Sommerfield and Nittrouer, 1999). Demonstrating the presence of any of these short-lived radionuclides can give confidence that there is little material missing from the top of the sediment record and no recent erosion, which is essential for the application of the CRS model. An example is documented by Smoak and Patchineelam (1999) for a 210Pbxs profile affected by bioturbation in a mangrove ecosystem in Brazil (Sect. B2).
Recent increases in MAR could be estimated in vegetated coastal ecosystems from the slope of the best-fit line of the plot of excess 228Th against cumulative mass, as Alongi et al. (2005) showed in a mangrove ecosystem in Jiulongjiang Estuary, China (Sect. B3). However, the use of 228Th to derive recent increases in sedimentation is restricted to habitats with high accumulation rates (i.e., >4 mm yr−1) with the last 10 years found in the upper centimeters. Its application is also limited due to the often very low excess activities in coastal waters and the constraint that sediments must contain a significant lithogenic-to-detrital fraction. In general, the use of short-lived radionuclides might be indicated to assess the magnitude of mixing or recent erosion in vegetated coastal sediments.
Mixing, either due to bioturbation or hydrodynamic energy, is the most common process affecting vegetated coastal sediment records. Although the presence of vegetation and anoxic sediments tends to reduce the depth of sediment mixing (Duarte et al., 2013), the mixed layer can extend to depths of 10–15 cm in marine sediments (Boudreau, 1994). If surface mixing occurs, valid estimates of sedimentation rates (within 5 % variability as shown in Sect. 3.2.1) can still be obtained using the dating models described above; however, this is only possible in sediments for which 210Pbxs is buried below the mixed layer prior to decay; i.e., the residence time of sediments in the mixed layer must be shorter than the effective dating timescale (∼100 years) (Crusius et al., 2004). In the example from Smoak and Patchineelam (1999) (Sect. B2) in which mixing extends to a depth of 11 cm, the sedimentation rate had to be higher than 1.1 mm yr−1 in order for 210Pb to be a useful chronometer (residence time in the mixed layer is 110 mm to 1.1 mm yr−1 = 100 years, which is within the effective dating timescale of 210Pb).
4.2.3 Maximum penetration depth of 210Pbxs
A chronology cannot be estimated if mixing affects the whole or the vast majority of the sediment record, such as in the deep mixing simulation in seagrass sediments in this work. However, information such as the total historical inventory of elements, like nutrients accumulated at a site, and the maximum conservative sedimentation rate can still be estimated. The penetration–depth method (Goodbred and Kuehl, 1998; Jaeger et al., 2009) uses the maximum penetration depth of 210Pbxs (depth of disappearance) as a marker horizon for sediments that are ∼100 years old. Low surface 210Pbxs specific activities can greatly restrict the age of the 210Pb dating horizon; therefore, this is an issue that should be considered when establishing the age of the 210Pbxs horizon. For surficial specific activities less than ∼100 Bq kg−1 this could be as few as three to four 210Pb half-lives, i.e., 65–90 years. By locating the dating horizon independently of the alteration of sedimentary processes and of assumptions of the CF–CS or CRS models, an upper estimate of the average MAR can be derived. Note that by using this method, the rates of change or fluxes cannot be estimated and these types of 210Pbxs profiles may be of little use in establishing chrono-stratigraphies since they are unlikely to have good records of other environmental parameters.
4.3 Erosion: 210Pbxs inventories (I)
Assessing the extent of erosion requires the comparison of the 210Pbxs inventories between reference, i.e., undisturbed locations (Iref), and eroded sites (I). Because 210Pbxs is particle reactive, once deposited in sediments, its subsequent lateral redistribution is primarily controlled by resuspension and transport processes, and thus a deficit in 210Pbxs inventories relative to undisturbed sediments may indicate loss or mobilization of sediment particles. This approach has been used in terrestrial soils (Martz and Jong, 1991; Walling et al., 2003) and more recently to assess erosion of seagrass sediments (Greiner et al., 2013; Marbà et al., 2015; Serrano et al., 2016a) (Sect. B4). Because the 210Pbxs inventories at a reference undisturbed location may be spatially variable, we recommend the use of a reference inventory value based on several cores (i.e., mean ± 2 SE). The consistency of the resulting reference inventory value can then be assessed by comparing it with the 210Pbxs inventory measured in a nearby undisturbed soil characterized by minimal slope or with that expected from the local atmospheric flux of 210Pbxs (Φ). See Preiss et al. (1996) for global and regional ranges of atmospheric fluxes. The expected inventory (Iref) can then be derived as , where λ is the decay constant of 210Pb (0.03111 yr−1).
4.4 Heterogeneous sediment composition
4.4.1 Normalization of 210Pbxs specific activity
Dating models assume rapid and nondiscriminatory removal of radionuclides from the water column regardless of major changes in grain size or OM content along a sediment record. Radionuclide adsorption onto sediments is strongly governed by the binding capacity of the settling particles (Cremers et al., 1988; Loring, 1991), and thus its scavenging is increased by fine-grained texture (He and Walling, 1996a) and OM particles (Yeager and Santschi, 2003). Variations in the influx of these particles into vegetated coastal sediments may proportionally affect the influx of particle-bound 210Pbxs (as long as it is still available), thus violating the assumption of constant flux of the CRS and CF–CS models and leading to subsections and irregularities in 210Pbxs profiles. Constant or reversed patterns in 210Pbxs activity profiles, which could be easily mistaken for reworked deposition, could be caused, for instance, by vertical fluctuations of grain size due to seasonal variations in sediment discharge or reoccurring tidal currents. Sediment studies often attempt to minimize these effects by normalizing radionuclide specific activities to granulometric or geochemical parameters that reduce the influence of preferential adsorption by fine sediments and OM (Álvarez-Iglesias et al., 2007; Loring, 1991; Wan et al., 2005), allowing researchers to obtain 210Pbxs profiles showing an exponential decreasing trend with depth (Kirchner and Ehlers, 1998; Sun et al., 2017). Radiometric applications in coastal sediments have traditionally opted for grain size normalizers such as the <4, <63 µm fraction or Al content (Álvarez-Iglesias et al., 2007; Sanders et al., 2010b; Sun et al., 2017; Walsh and Nittrouer, 2004), while in dynamic, sandy-rich coastal systems where the mud fraction is small, normalization by OM content has been shown to also be effective (Van Eaton et al., 2010). Equation (6) can be used to normalize 210Pbxs specific activities (210Pbxs-NORM in Bq kg−1) by grain size fractions, OM content or other geochemical parameters that control the variation of the input of 210Pbxs.
where 210Pbxs-MEAS is the measured specific activity of the bulk sample at depth m, and (NPAVG∕NPm) is the ratio between the core average normalizing parameter and its content at depth m. For instance, multiplication by this ratio corrects measured 210Pb activities for variations in OM with respect to an average core value.
4.4.2 226Ra specific activity profiles
210Pbxs specific activity is determined by subtracting supported 210Pb, assuming it is in equilibrium with 226Ra, from total 210Pb specific activity. This is straightforward when gamma spectrometry is employed since the total 210Pb and 210Pbsup (i.e., 226Ra) can be quantified simultaneously. On some occasions, particularly when 210Pb is determined by alpha spectrometry, 226Ra is not measured, and supported 210Pb is most often determined from the region of constant and low 210Pb specific activities at depth or, alternatively, from a number of determinations of 226Ra via gamma spectrometry or liquid scintillation counting (LSC) along the core. This method assumes that 226Ra and 210Pbsup are constant throughout the sediment core (Binford, 1990). However, this might not be always the case, especially in heterogeneous profiles consisting of a variety of sediment types (Aalto and Nittrouer, 2012; Armentano and Woodwell, 1975; Boyd and Sommerfield, 2016) or in records containing episodes of rapid sedimentation (Chanton et al., 1983). In addition, equilibrium of 210Pbsup with 226Ra might be compromised in surface sediments for which 222Rn is deficient (Appleby, 2001). Although variations in 226Ra specific activities with depth are small in most cases, accurate determination of 226Ra might be crucial in sediments with low total 210Pb (e.g., due to the presence of coarse sediments), for which slight variations in the 210Pbsup fraction may result in significant errors in the estimation of 210Pbxs and derived accumulation rates (Diemer et al., 2011). Therefore, we recommend measuring 226Ra specific activity profiles or, at least, using depth-specific 226Ra values at several depths along a sediment profile to estimate 210Pbxs.
The 210Pb dating technique provides crucial information for the study of carbon sequestration in vegetated coastal sediments and can also provide accurate geochronologies for the reconstruction of environmental processes. However, 210Pb-based geochronologies may be difficult to conduct in mangrove, tidal marsh and seagrass ecosystems where unaltered sedimentary records are rare.
Shallow vegetated coastal sediments are often affected by a number of processes such as mixing and bioturbation, accelerated sedimentation, or erosion and might be composed of heterogeneous sediments. These factors may lead to anomalies in the 210Pbxs specific activity profiles and thus produce erroneous geochronologies and biased mean last-century MAR and CAR. Discrepancies in mean MAR and CAR between irregular and ideal 210Pb profiles simulated in this study are within 20 % if the intervening sedimentary process is well diagnosed. Otherwise, these deviations may range between 20 % and 100 %, with higher errors associated with the application of (1) the CF–CS model in records showing intense mixing or large increases in MAR and (2) the CRS model in incomplete 210Pbxs sediment profiles. Additional tracers or geochemical, ecological or historical data can be used to identify the process causing anomalies in 210Pbxs profiles and reduce uncertainties in derived accumulation rates. Using the procedures in Sect. 4, researchers have been able to obtain reliable chronologies and CAR in vegetated coastal sediments. Special caution, however, should be applied for sites at which sediments might be altered by multiple processes (leading to profile types V or VI shown in this study) and when other chronological tools or time markers are not available (e.g., 137Cs). Sites that have slow accumulation rates and/or intense mixing may not be datable and derived CAR estimates may be largely overestimated. Mistakes would include assigning discrete ages in mixed sediments or extrapolating an age–depth model for a core that should be considered undatable to depths down the core or to nearby sites. While attention should be paid to the limitations of 210Pb-derived results in vegetated coastal ecosystems, the guidelines provided here should help interpret complex 210Pb profiles obtained from vegetated coastal sediments and develop a strategy to strengthen the evaluation of MAR and CAR.
Data to replicate the dating models and formulas used to conduct the simulations in this article can be found in the Supplement, Tables S1–S7.
A1 Mixing
To simulate surface mixing (scenarios A and B), we estimated the accumulated 210Pbxs activity per unit area over the top 5 cm of the ideal 210Pbxs profile (I5 cm: 2126 Bq m−2 in seagrass and 723 Bq m−2 in mangrove–tidal marsh sediments) (Table S1a and b in the Supplement). We split this inventory within the upper 5 cm using a random function, the outputs of which fell within the standard deviation (±SD) of the mean of the 210Pbxs activities in the upper 5 cm (±107 Bq m−2 in seagrass; ±9 Bq m−2 in mangrove–tidal marsh sediments). To simulate deep mixing (scenario C), we followed the same methodology but we randomly split the 210Pbxs inventory within the upper 15 cm, which is a depth reported as deep mixing in seagrass (Serrano et al., 2016a), mangroves and tidal marshes (Nittrouer et al., 1979; Smoak and Patchineelam, 1999) and is characteristic for marine sediments globally (Boudreau, 1994). We ran the simulation several times until we obtained three scenarios (A, B, C) of mixing encompassing a range of surface mixed layers (SMLs) (Table S2a and b). Mixing A (km: ∞ g2 cm−4 yr−1) consisted of constant 210Pbxs specific activities with depth in surface layers; mixing B (km: 20–23 g2 cm−4 yr−1) was characterized by a decrease in the slope of 210Pbxs in top layers; and mixing C represented deep mixing from the sediment surface down to 15 cm (km: 6–25 g2 cm−4 yr−1). 210Pbxs activities per unit area (A) were converted to 210Pbxs specific activities (C) in Bq kg−1, which we averaged every two layers to represent smooth transitions. Sedimentation and derived CAR were estimated from the modeled profiles using the CF–CS and the CRS models. The CF–CS model was applied below the depth of the visually apparent SML (3 cm) in scenarios A and B to avoid overestimation of MAR. The CF–CS model was applied to the entire profile in deep mixing scenario C in seagrass sediments and below the apparent mixed layer (13 cm) in mangrove sediments. Deep mixing affected 10 % of the entire 210Pbxs profile of mangrove–tidal marsh sediments and 45 % of seagrass sediments. To account for the deviations in mean MAR and CAR associated with a process mismatch (i.e., as if considering the actual mixing to be caused by an increase in MAR), we applied the CF–CS model piecewise (scenarios B and C) and to the entire profile (scenario A). In the case of the CRS model, ages were determined at each layer and average centennial MAR was estimated by dividing the mass of sediment accumulated (g cm−2) down to 100-year depth by its age (i.e., 100 years) in all cases.
A2 Increasing sedimentation
We simulated an enhancement of MAR that could result, for instance, from increased sediment runoff due to coastal development by increasing the basal MAR (0.2 and 0.3 g cm−2 yr−1 in seagrass and mangrove–tidal marsh, respectively) by different magnitudes (20 %, 50 %, 100 % and 200 %). Increases in MAR were simulated over the top 6 cm and 23 cm of the idealized 210Pbxs specific activity profiles, which represent the last 30 years of accumulation in seagrass and mangrove–tidal marsh sediments, respectively. Last-century mass accumulation rates expected for ideal profiles were estimated by dividing the accumulated mass down to a 100-year depth (derived from gradual increases in MAR) by its age (Table S3a and b). 210Pbxs specific activities (Cm) as a result of increased MAR were estimated through Eq. (A1) for each layer. Simulations of increasing MAR generated four profiles per habitat type (scenarios D, E, F and G) (Fig. 3b). Average MAR and CAR were estimated from the modeled profiles using the CF–CS and CRS models. The CF–CS model was applied piecewise in scenarios D, E and F and below the layer of constant 210Pbxs in scenario G.
where λ is the decay constant of 210Pb (0.0311 yr−1) and Im is the 210Pbxs inventory accumulated at layer m. The value 10 allows for the unit conversion to Bq kg−1.
We also estimated mean MAR and CAR assuming that the process causing scenarios D, E, F and G was mixing. For this, we applied the CF–CS model below the surface mixed layer (6 and 23 cm in seagrass and mangrove–tidal marsh sediments, respectively). The shift in the slope of the 210Pbxs profile in scenario D in seagrass sediments was minimal, and hence we applied the CF–CS model to the entire 210Pbxs profile, as this would likely be the method applied by most researchers in a real case. The CRS model was run similarly if mixing or changes in accumulation rates are expected, ages were determined at each layer and average centennial MAR was estimated by dividing the mass of sediment accumulated (g cm−2) down to 100-year depth by its age (i.e., 100 years). If mixing is expected, ages within the mixed layer cannot be reported.
A3 Erosion
Erosion in vegetated coastal sediments can occur due to high-energy events (Short and Wyllie-Echeverria, 1996), vegetation loss and subsequent destabilization of sediments (Marbà et al., 2015) or mechanical disturbances (e.g., Serrano et al., 2016c). We ran three simulations to represent recent (H) and past erosion events (I and J) (Fig. 3c). We started with an ideal 210Pbxs profile with a total initial 210Pbxs inventory of 3900 Bq m−2. To simulate erosion, we removed the 210Pbxs inventory accumulated in the top 0–5 cm (H), middle 5–10 cm (I) and 10–15 cm sections (J) in sediments from both habitat types (mangrove–tidal marsh and seagrass). The resulting 210Pbxs activity per unit area (Bq m−2) was converted to 210Pbxs specific activities (Bq kg−1) by dividing by the corresponding mass depth (g cm−2) at each section after correcting the latter for the loss of sediment layers (Table S4a and b). 210Pb specific activities were averaged every two layers to simulate smooth transitions rather than a sharp discontinuity after an erosion event. We estimated the resulting average MAR and CAR using the CF–CS model (applied piecewise in erosion scenarios I and J). The CRS model should not be applied in simulated erosion scenarios since the overall core inventories (I) are incomplete. However, we ran the CRS model to test the errors associated with its application in eroded sediments assuming that erosion is not a factor.
A4 Changes in sediment grain size
We simulated various 210Pbxs profiles with changes in sediment grain size distribution using the approach described by He and Walling (1996), in which the specific surface area of particles exerts a primary control on the 210Pbxs adsorbed:
where C is 210Pbxs specific activity (mBq g−1), Ssp is the specific surface area of the sediment particles (m2 g−1) and μ is a constant scaling factor depending upon the initial 210Pbxs activity per unit area (mBq m−2). The 210Pbxs specific activity in bulk sediments can also be represented by Eq. (A2), replacing Ssp by the mean specific surface area Smean (m2 g−1) of the bulk sample. In this work, we estimated μ at each layer of an ideal 210Pbxs profile in seagrass and mangrove–tidal marsh sediments if Ssp throughout the core is 0.07 m2 g−1, corresponding to a mean particle size of 63 µm. The surface area can be estimated as (Jury and Horton, 2004)
where ρ is the density of the sediment particles and r is the mean radius of sediment particles, which are considered spherical.
We estimated the weighted-mean specific surface area of a very coarse sediment composed of 70 % coarse sand (500–1000 µm), 20 % medium sand (250–500 µm) and 10 % silt (4–63 µm) (Smean=0.0153 m2 g−1) through Eq. (A3) (size scale: Wentworth, 1922). The bulk density (ρ) of sediment fractions was considered: 1.03 g cm−3 for silt, 1.6 g cm−3 for medium sand and 1.8 g cm−3 for coarse sand. First, we simulated 210Pbxs profiles as a function of the specific surface area by applying Eq. (A2) to an ideal 210Pbxs specific activity profile (scenario K) (Table S5a and b). Second, we simulated a shift to sandy and clayey sediments in surface layers, which could result after the restoration or loss of vegetated coastal ecosystems. The percentages of sands and clay along the core were changed using a random function (from 60±20 % in surface to 15±5 % in bottom layers; scenarios L and M) (Table S6a and b). The shift was simulated at the same age depth (30 years before collection) in all scenarios and habitat types. Finally, we simulated a heterogeneous grain size distribution along the entire sediment profile intercalating sand and clay layers randomly with depth (scenario N) (Table S6a and b). The mass depth term was corrected in each case for changes in grain size, which lead to variations in DBD with depth. The bulk density (ρ) of sediment fractions was considered: 0.4 g cm−3 for clays and 1.6 g cm−3 for medium sands. In addition, the value of μ was readjusted at each sediment depth of the ideal profile to represent non-monotonic variations in cumulative dry mass. 210Pbxs specific activity profiles were estimated as a function of the specific surface area that was estimated at each layer according to the various proportions of clay and sand. The average MAR was estimated using the CF–CS and CRS models. The CF–CS model was applied piecewise in simulated scenarios L and M.
A5 Organic matter decay
210Pbxs in vegetated coastal sediments is deposited in association with mineral particles but also with organic particulates (Krishnaswamy et al., 1971; Yeager and Santschi, 2003). Once buried, sediment organic matter (OM) content usually decays with sediment depth and aging due to remineralization of labile fractions, leading to an enrichment of 210Pbxs specific activities. We simulated the resultant 210Pbxs profiles derived from this process in two sediments with different OM contents (16.5 % and 65 %). The first value (16.5 % OM) is within the usual range of tidal marsh–mangrove and in the high range for seagrass sediments (Fourqurean et al., 2012) (Table 1). The second value (65 % OM) represents an extreme scenario based on existing studies in seagrass and mangrove ecosystems (Callaway et al., 1997; Serrano et al., 2012). The simulations were run under three OM decay constants assuming the following: (1) the whole pool of OM is refractory under anoxic conditions, decaying at a rate of 0.00005 d−1 in seagrass and in mangrove–tidal marsh sediments (Lovelock et al., 2017); (2) 50 % of the refractory pool is exposed to oxic conditions, decaying at a rate of 0.0005 d−1 in mangrove–tidal marsh sediments; and (3) 50 % of the OM pool is labile and decaying fast, although exposed to anoxic conditions, at 0.01 and 0.03 d−1 in seagrass and mangrove–tidal marsh sediments, respectively (Lovelock et al., 2017).
The 210Pb enrichment factor (η) can be determined for a given time after deposition as
where χs is the mineral fraction of sediments, χorg is the organic fraction of sediments at time 0, korg is the decay constant of the OM in sediments and t is time and can be estimated as m∕MAR. As time (t) increases the exponential term tends to zero, and hence the OM stored in the sediment reaches a constant value at which it is no longer decomposed. We assume that the remineralized OM leaves the sediment as CO2, but in fact a fraction (f) would transform to mineral matter as . In our simulations f=0 was assumed.
Then, the 210Pbxs specific activity of a sample of age t with initial specific activity C0 is
and the total mass accumulated with depth (M) above a layer of age t is
MAR was estimated using the CF–CS and CRS models. The CF–CS model was applied below the 210Pbxs reversed profile in scenario S. CAR was estimated through Eq. (5). Organic matter (%OM) in mangrove–tidal marsh sediments was transformed to %Corg using Eq. (A7) (Kauffman and Donato, 2012). In seagrass sediments we applied the relationship reported by Fourqurean et al. (2012) (Eq. A8) (Table S7a and b).
For this simulation new MAR and CAR were estimated as derived from ideal 210Pb profiles to represent changes in organic matter content due to decay and associated losses of sediment mass with depth. This resulted in lower ideal MAR in seagrass and mangrove–tidal marsh sediments (seagrass: 0.17 and 0.07 g cm−2 yr−1; mangrove–tidal marsh: 0.25 and 0.10 g cm−2 yr−1 in OM decay simulations starting at 16.5 % and 65 % OM, respectively) (Tables 3 and S7).
B1 Case study of a sedimentation event
Hurricanes and cyclones can lead to the sudden delivery of large amounts of sediments and nutrients to mangroves and tidal marshes, which in turn can result in enhanced production (Castañeda-Moya et al., 2010; Lovelock et al., 2011). Smoak et al. (2013) obtained a 210Pbxs specific activity profile consistent with a large pulse of sediment delivered to fringing mangroves in the Everglades, Florida (Fig. B1). The specific activity of 210Pbxs was vastly different (several times lower) in sediments accumulated during the event. The sediment accumulation rate estimated by the CRS model for the upper part of the sediment record was 6 times that of background levels, resulting in a doubled accretion rate due to the high bulk density of the delivered sediments (Castañeda-Moya et al., 2010). Corg concentrations in the abruptly accumulated sediments were lower (5 %) than those of the sediments beneath the event layer (20 %–25 %). In fact, event deposits could consist of coarse sediments (for instance, sand and shell sediment layers deposited during storm events characteristic of offshore environments; Swindles et al., 2018), but also of fine sediments that could present lower 210Pbxs specific activity compared to surrounding layers (e.g., siltation events due to clearing of the catchment area; Cambridge et al., 2002; Serrano et al., 2016d). Indeed, if the initial 210Pbxs specific activity (C0) is known, the CIC model could be useful to constrain dating when it is difficult to precisely define the thickness of such deposits. Otherwise the CF–CS model could be applied if the event layer is identified (e.g., using XRF, 226Ra or granulometry) and can be subtracted to produce a corrected depth profile from which to determine derived CF–CS ages and mean mass accumulation rates.
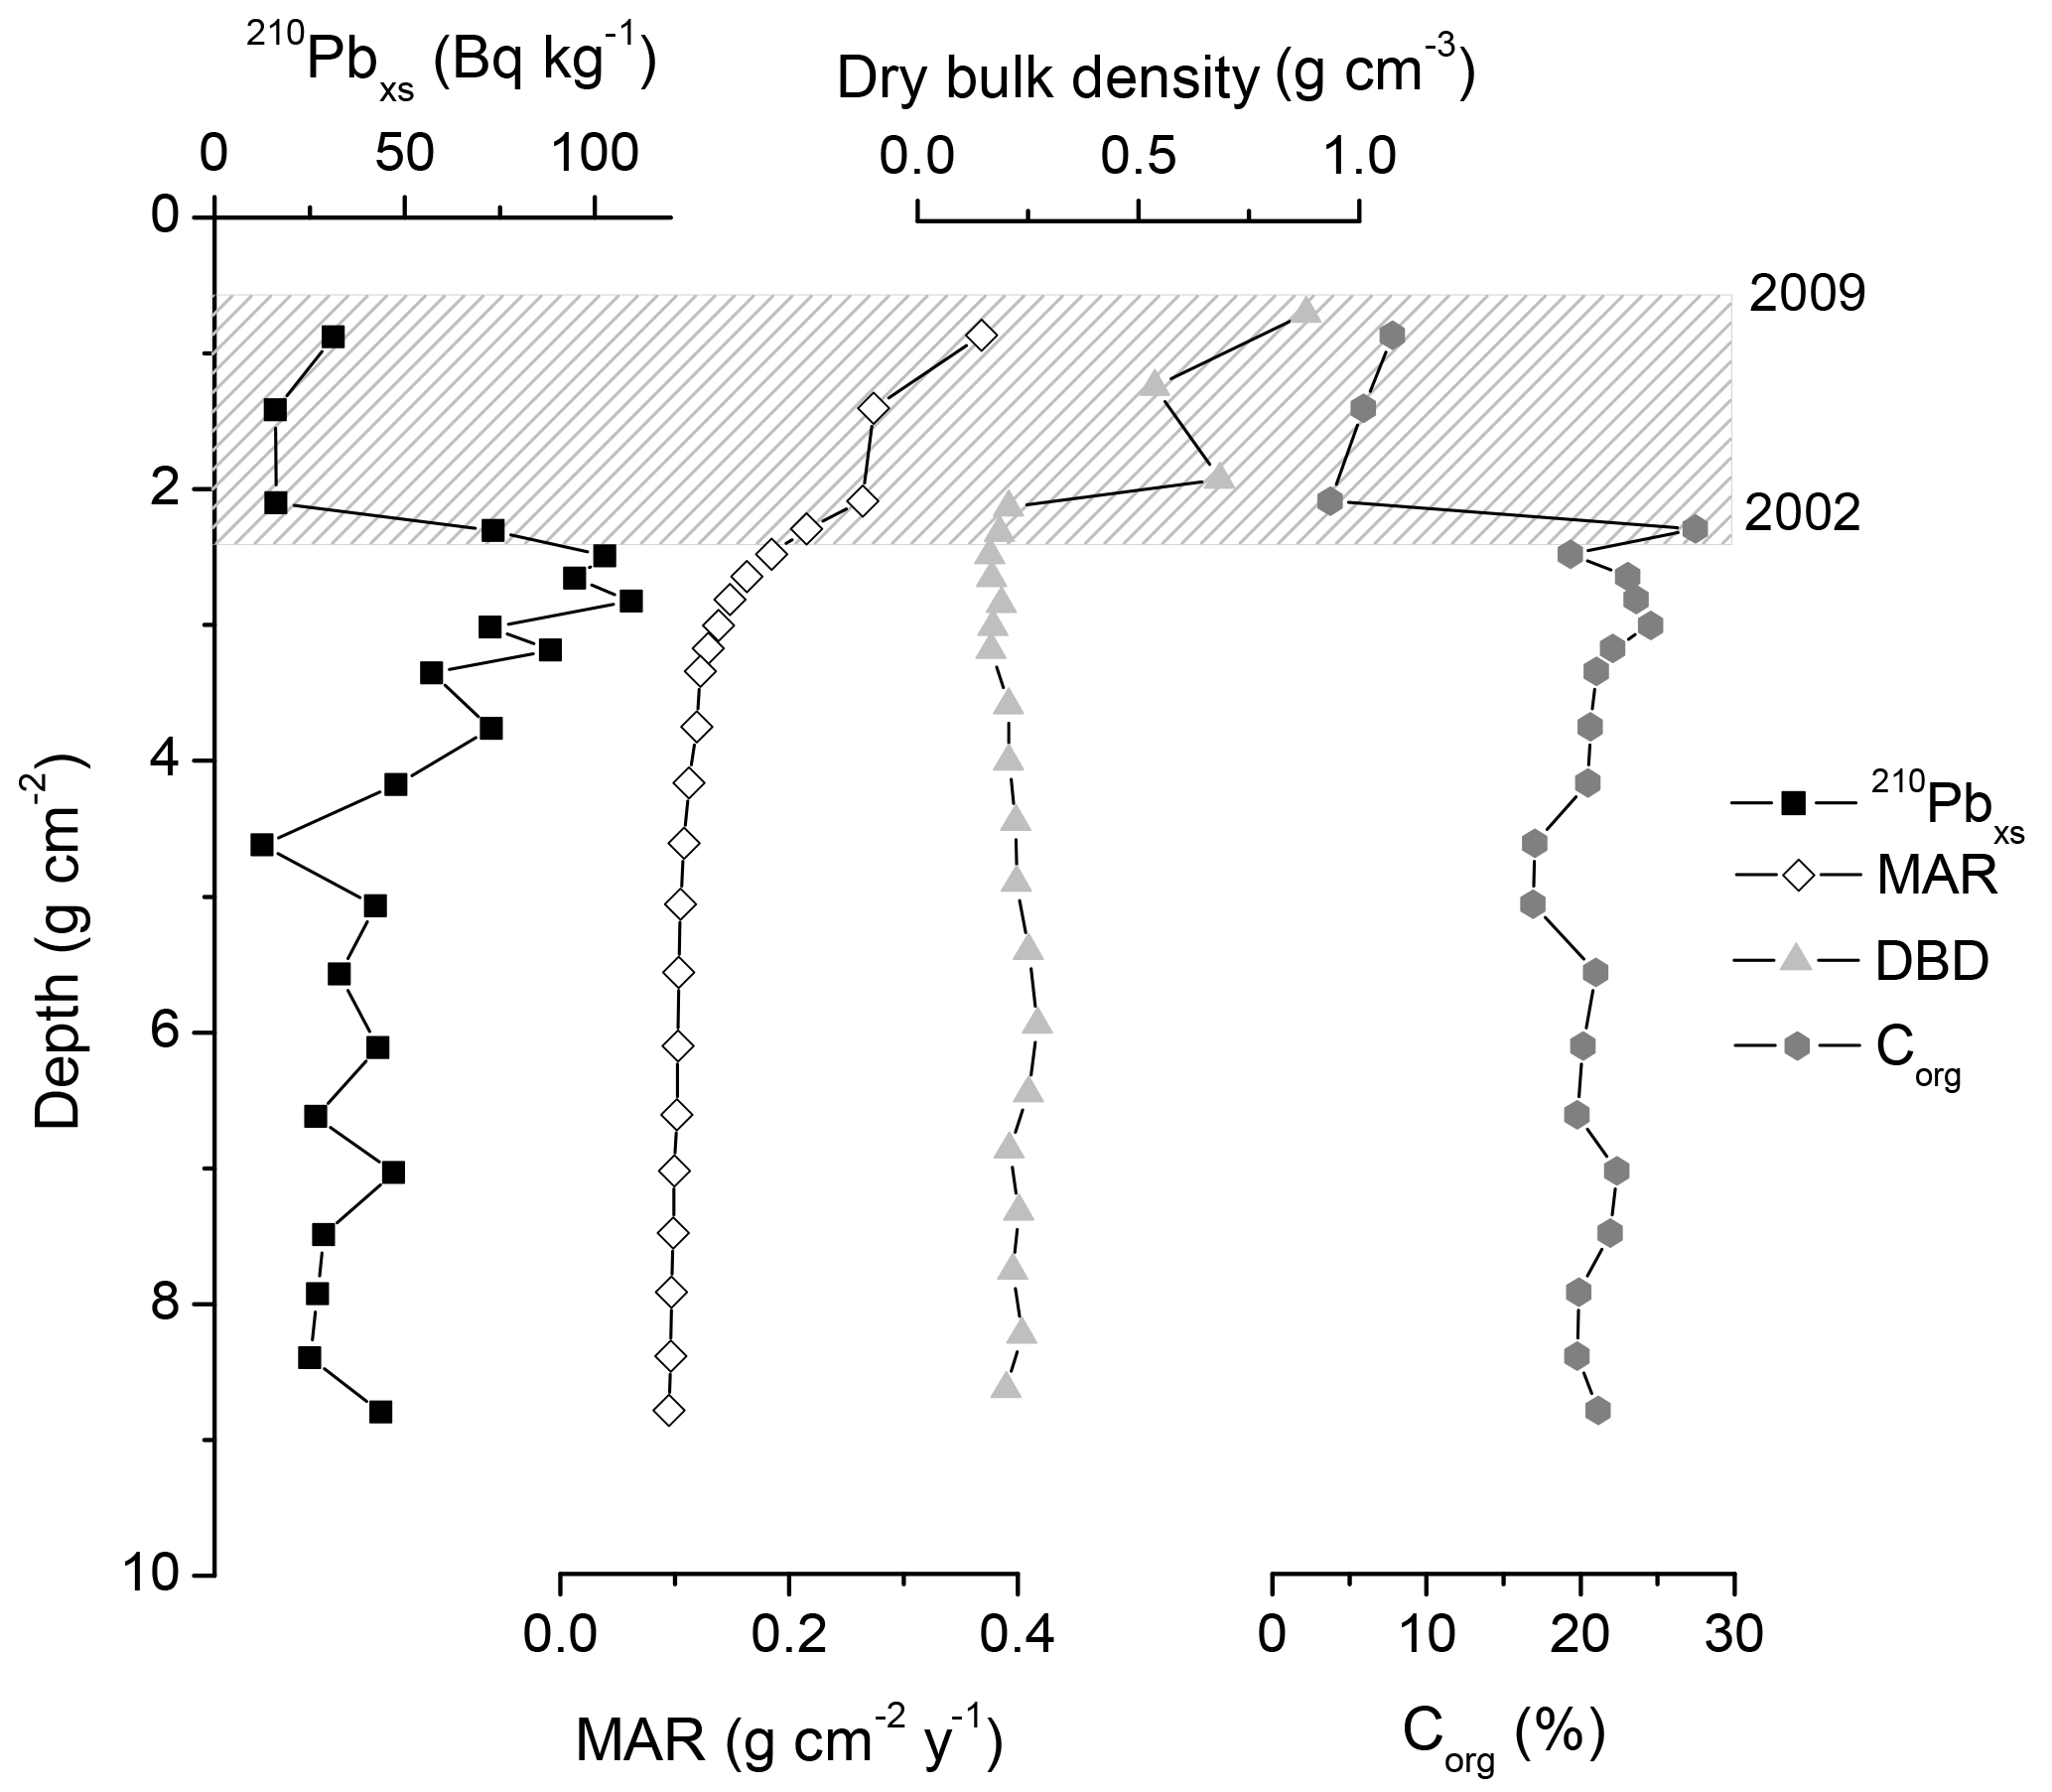
Figure B1210Pbxs, mass sedimentation rates (MAR), dry bulk density and Corg content in a mangrove sediment core at the Everglades, Florida. The gridded area represents the period 2002–2009, when Hurricane Wilma (2005) delivered a large pulse of sediment (Adapted from Smoak et al., 2013).
B2 Case study of mixing
An example of bioturbation processes is documented by Smoak and Patchineelam (1999) in which they showed a mixed 210Pbxs profile down to 11 cm of depth in a mangrove ecosystem in Brazil evidenced from the 210Pb, 234Th and 7Be specific activity profiles (Fig. B2). The 210Pbxs activities decreased exponentially below the surface mixed layer, resulting in an estimated accumulation rate of 1.8 mm yr−1. In the upper layers the 210Pbxs followed a complex pattern, with alternate relative maxima and minima, which could be representative of varying conditions of fluxes and sediment accumulation rates, the presence of coarse sediments, or physical or biological mixing. However, 7Be penetrated down to 4 cm of depth and excess 234Th was detected only in the surface layer. Sediments that are buried for a period of more than 6 months will have undetectable 7Be, and hence its presence at 4 cm of depth indicated that the activity of benthic communities had remobilized it downwards to a much greater degree than sedimentation.
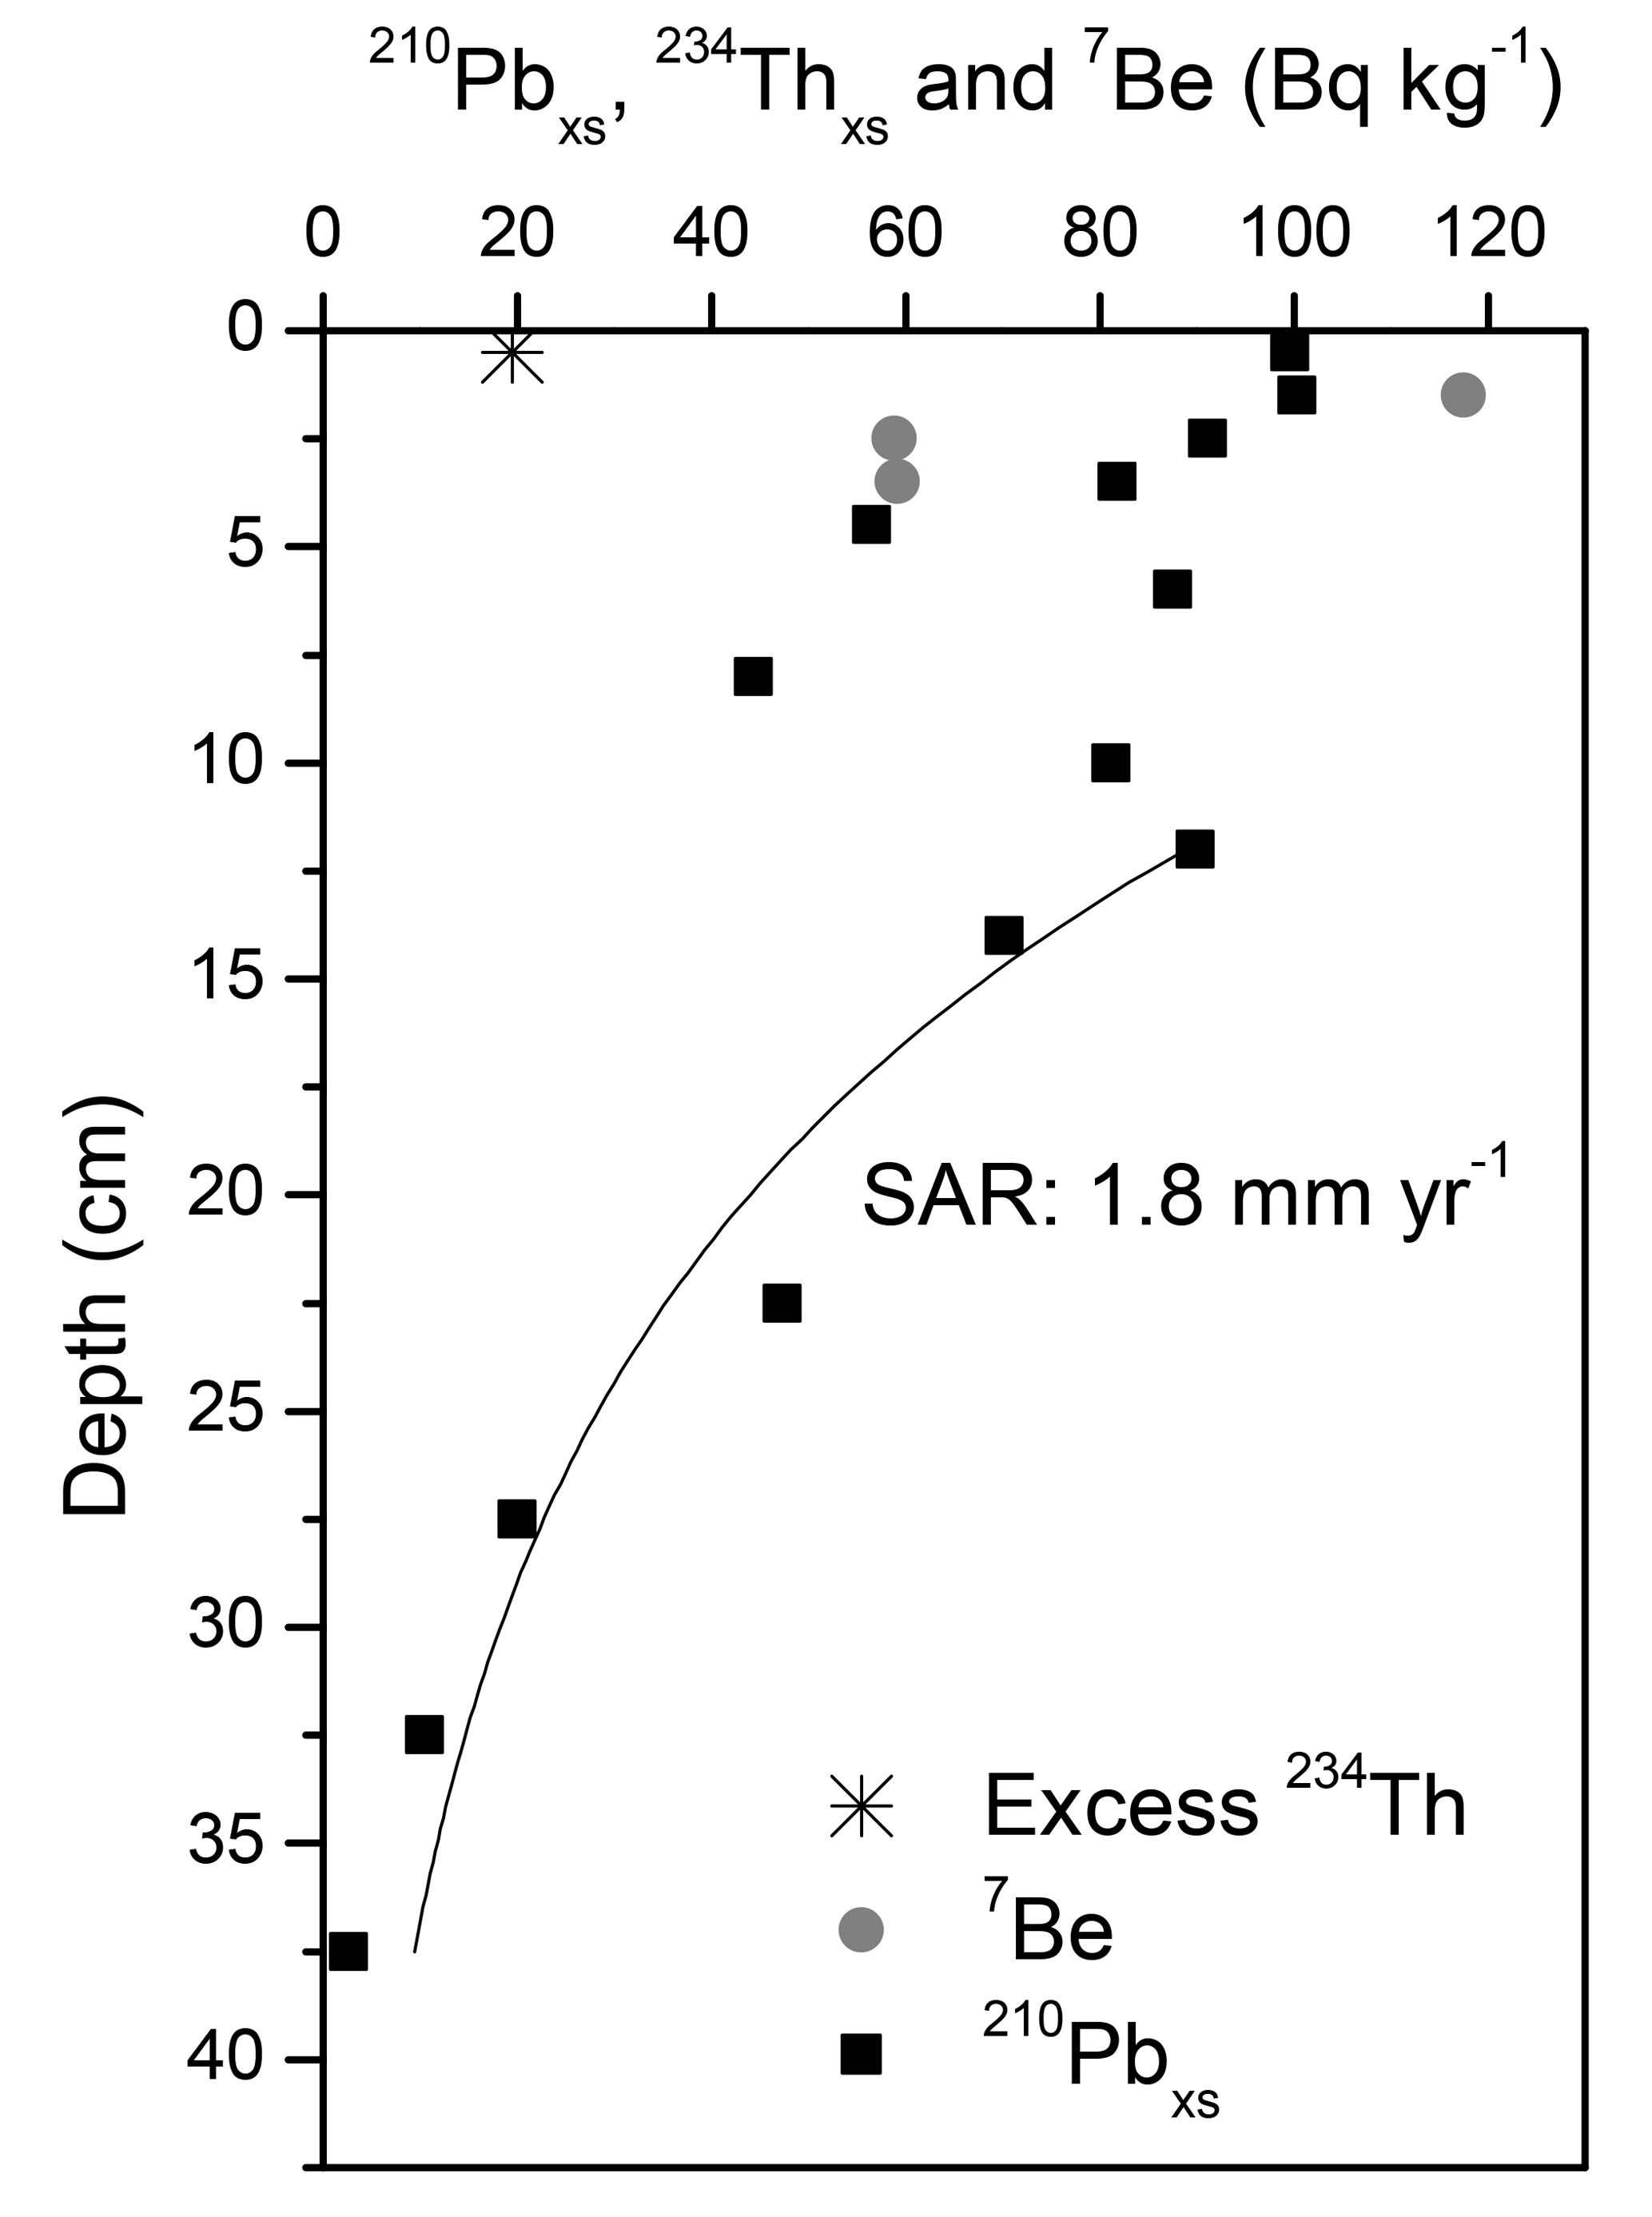
Figure B2210Pbxs specific activity profile affected by bioturbation. Short-lived 7Be and excess 234Th specific activity profiles are indicators of mixing in the zone of constant 210Pbxs (0–5 cm) (Adapted from Smoak and Patchineelam, 1999).
B3 Case study of rapid sedimentation rates
Alongi et al. (2005) studied the rates of sediment accumulation at three mangrove forests spanning the intertidal zone along the south coastline of the heavily urbanized Jiulongjiang Estuary (China). Mass accumulation rates (MARs) were rapid and one of the 210Pbxs specific activity profiles showed scattered concentrations with depth. This could be related to either a very high MAR during the last decades or an intense mixing down-core. However, the excess 228Th specific activity profile, determined from the difference between the total 228Th and 228Ra activities in the sediment, showed a clearly decaying trend down to 15 cm (Fig. B3). The exponential decay curve fitted to the excess 228Th profile yielded an accumulation rate of 10 cm yr−1, which was consistent with the 210Pb specific activity profile. Therefore, the evidence provided by excess 228Th indicated that a very high MAR was the most plausible process responsible for the sediment record.
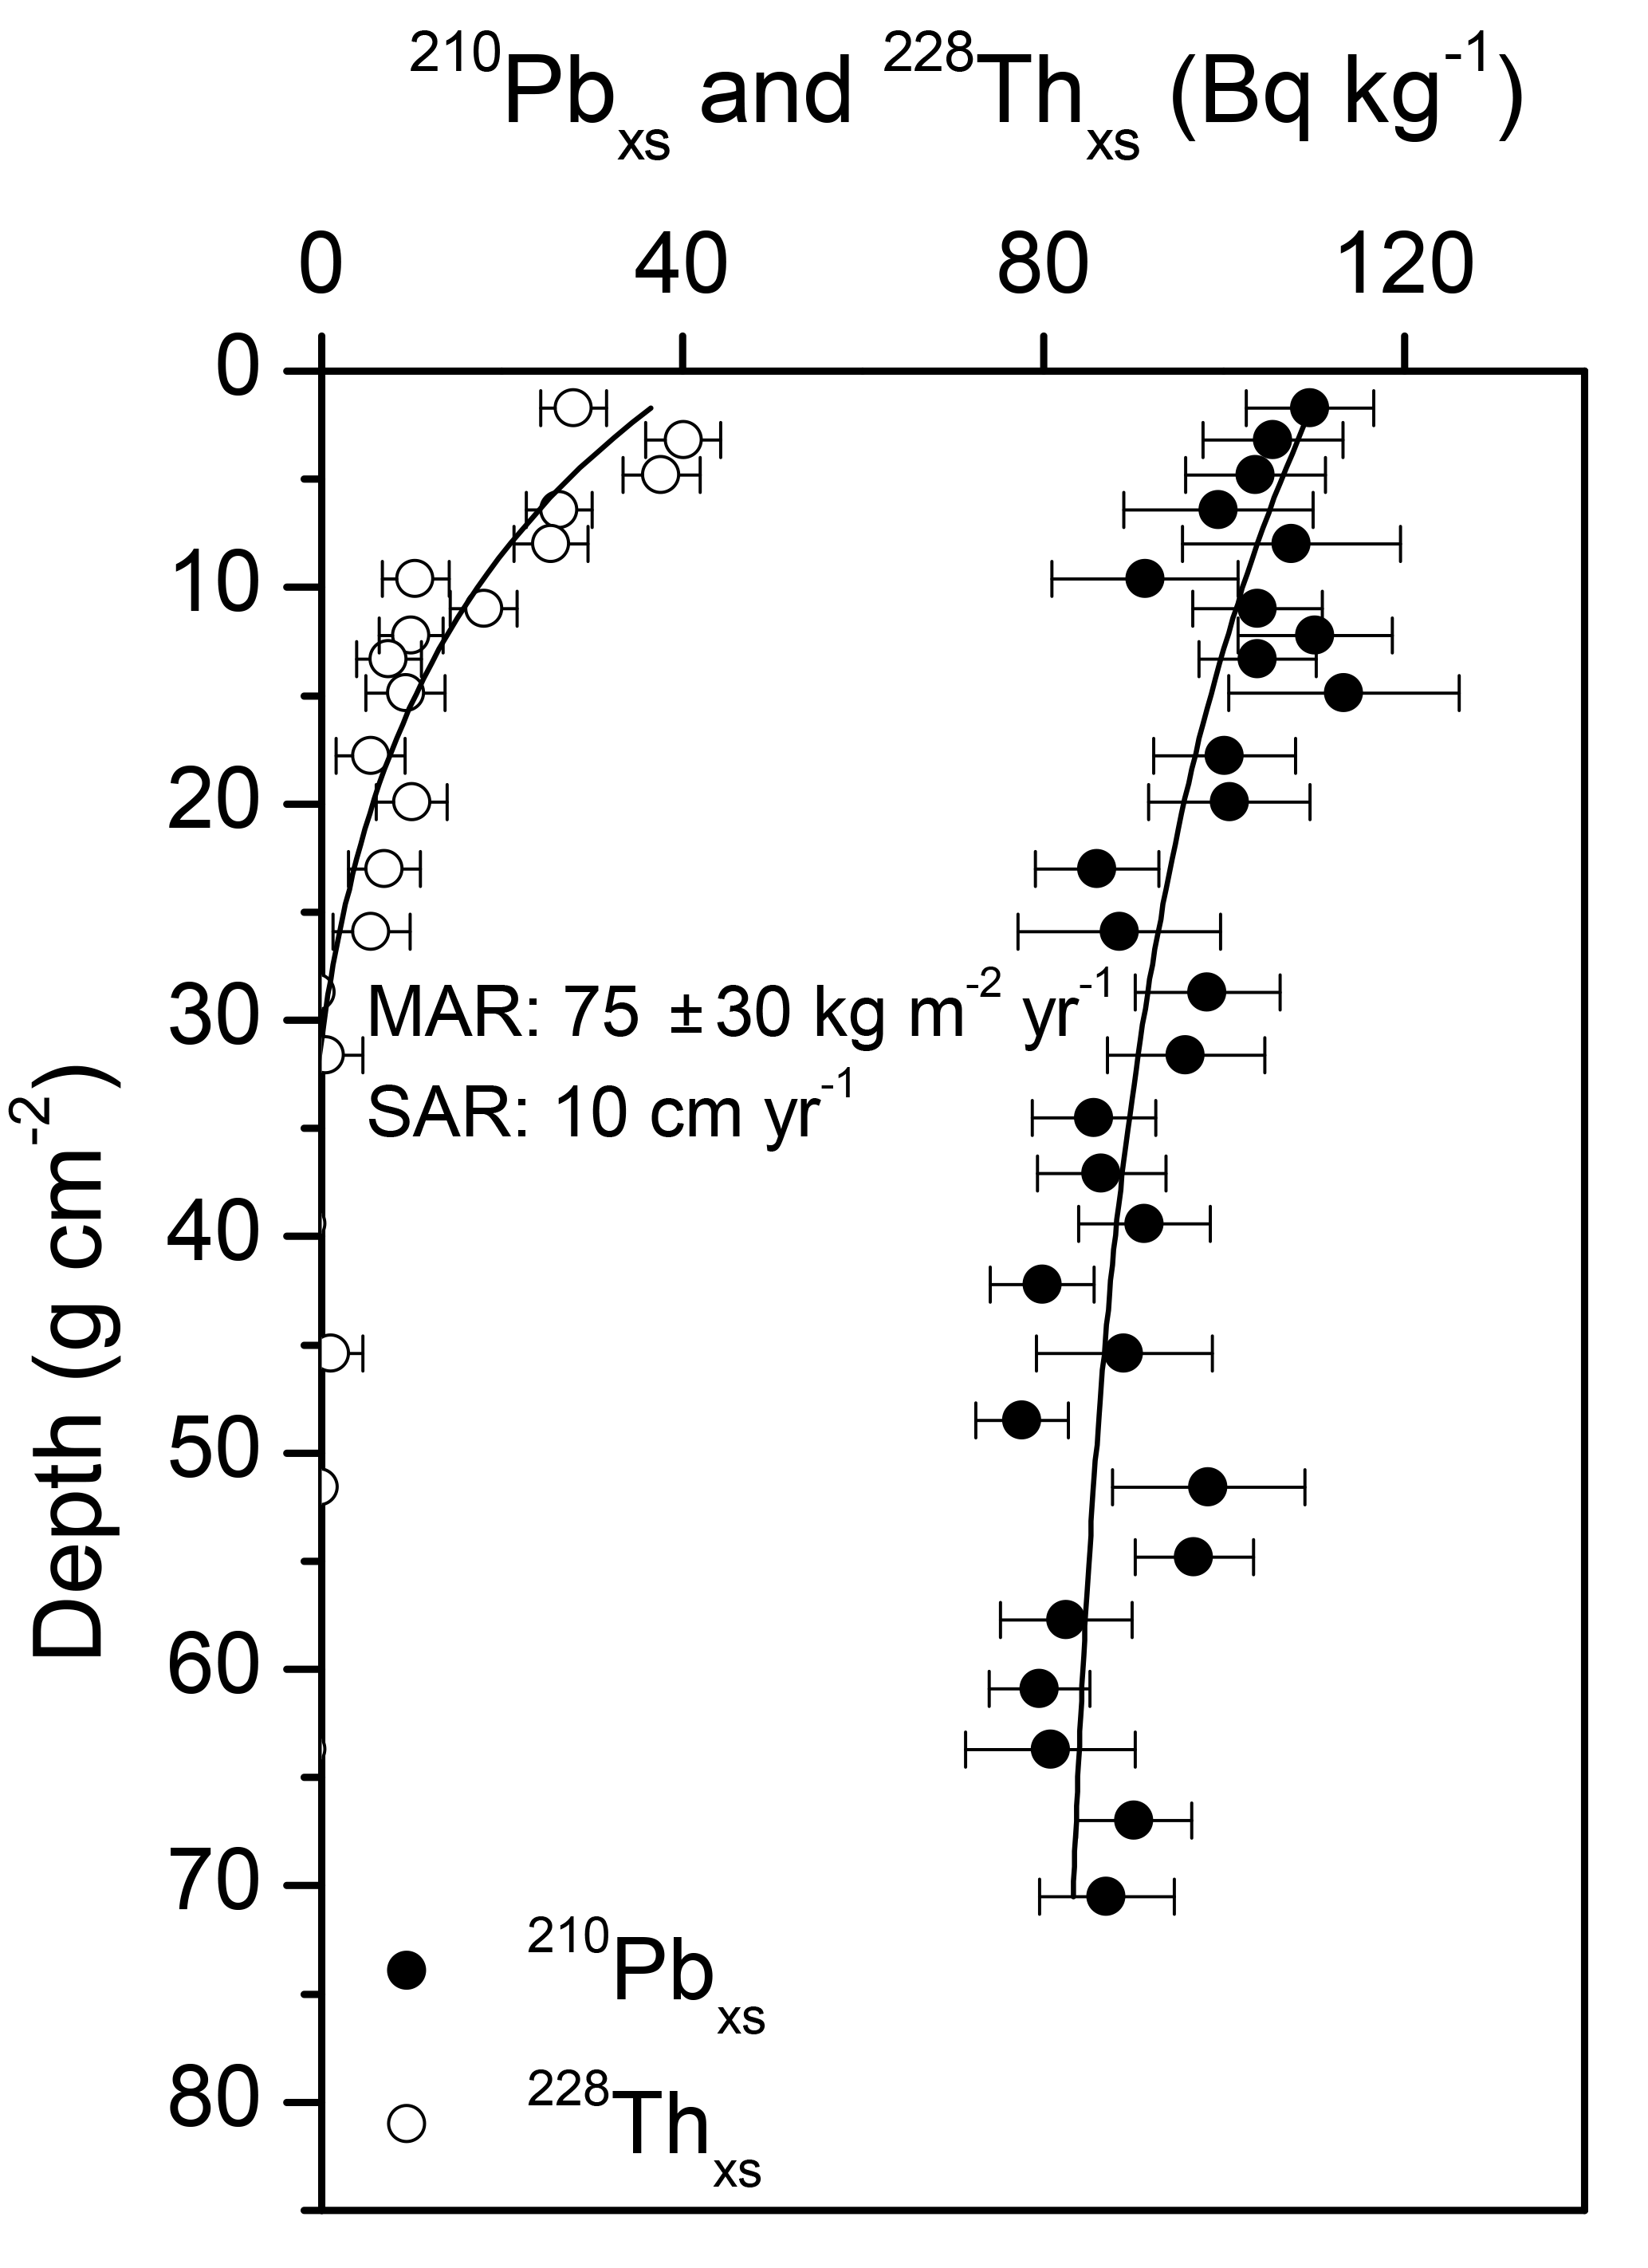
Figure B3Vertical specific activity profiles of excess 210Pb and 228Th in core 3564 from Alongi et al. (2005), produced by a rapid mass accumulation rate.
B4 Case study of erosion
Incomplete inventories of 210Pbxs indicative of erosion can be illustrated by the measured 210Pb specific activity profiles in sediments from Oyster Harbor (Albany, Western Australia), some of which have been devoid of seagrass vegetation since the 1980s due to eutrophication (Marbà et al., 2015). The measured 210Pbxs specific activities in unvegetated sediments were relatively low, and the horizon of 210Pbxs was detected at a shallower sediment depth than in neighboring sediments, in which seagrass meadows persisted (Fig. B4). The inventory of 210Pbxs in the unvegetated sediment exhibited a deficit of 722 Bq m−2 compared to that in the vegetated site. This deficit results not only from the lack of accumulation of 210Pbxs while sediments were unvegetated (30 years; atmospheric flux of 25 Bq m−2 yr−1), but also from the subsequent sediment erosion. These results, combined with Corg analyses, showed that unvegetated sediments had an average deficit in accumulated Corg stocks of 2.3 kg Corg m−2 compared to vegetated sediments over the last ca. 100 years. This deficit has been produced due to seagrass loss in the 1980s but is equivalent to a loss of approximately 90 years of Corg accumulation.
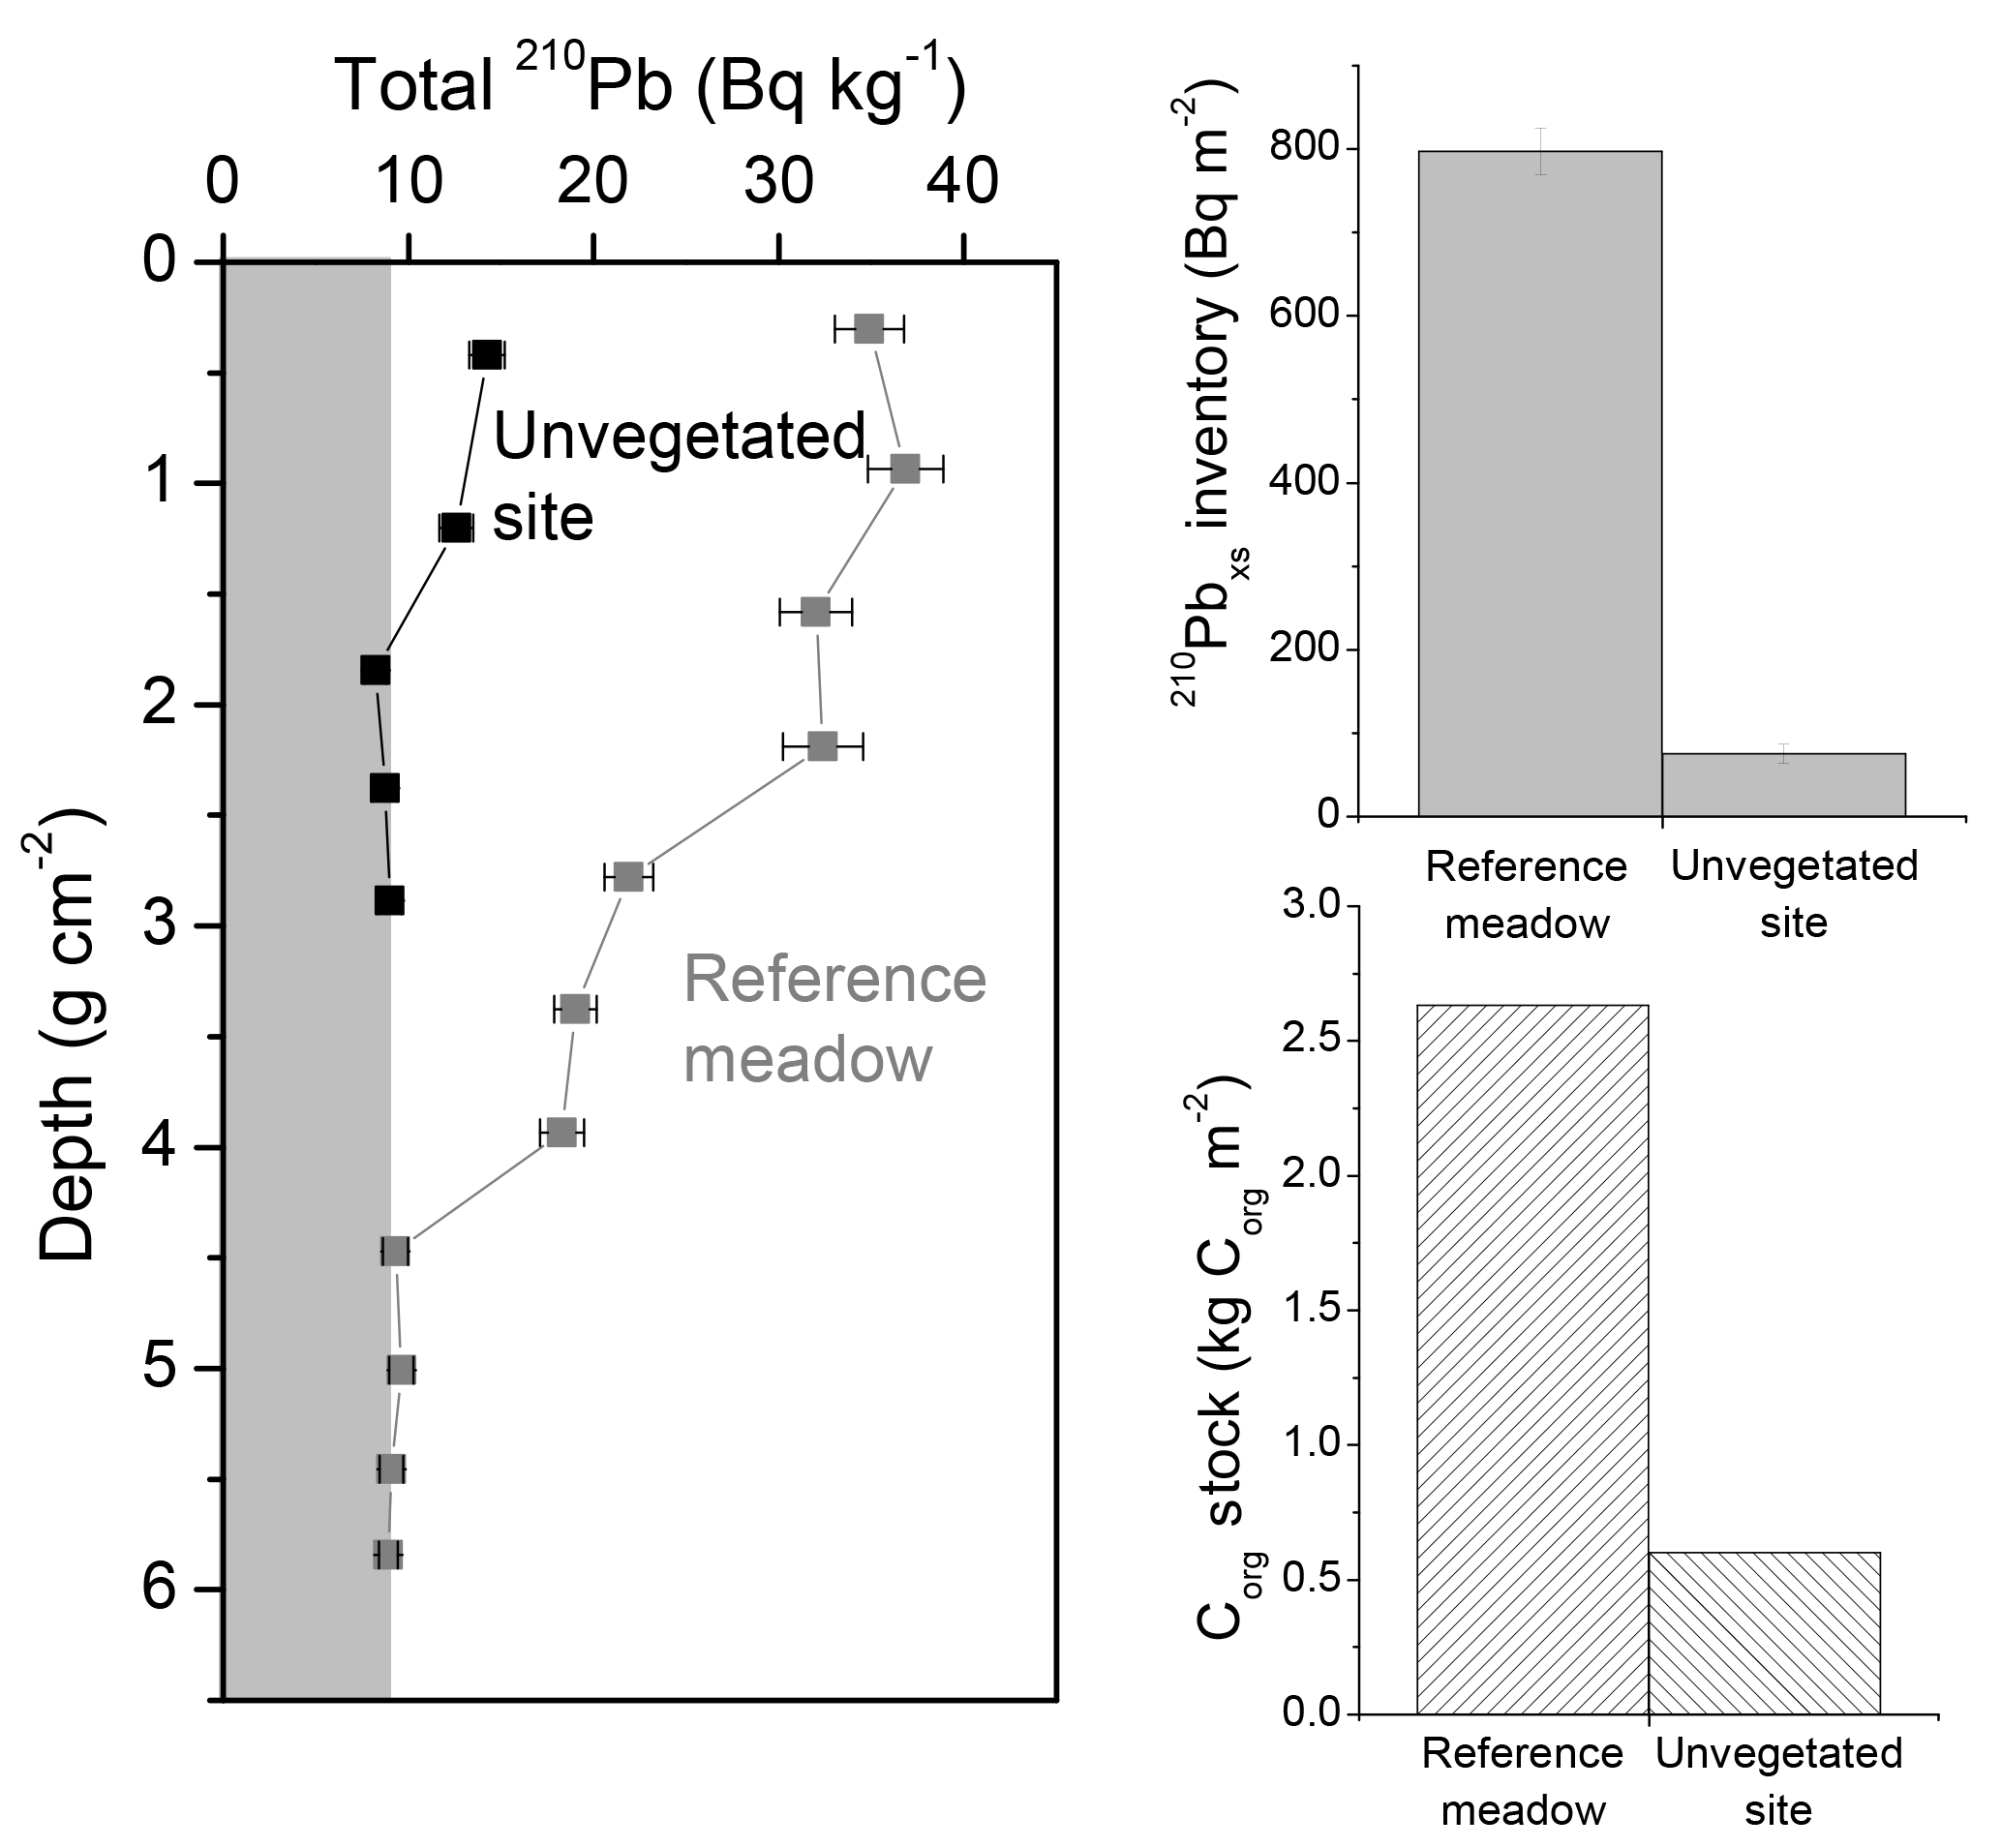
Figure B4Comparison of 210Pb specific activity profiles and inventories of 210Pbxs and organic carbon (Corg) between a vegetated and unvegetated site. The grey area indicates supported 210Pb specific activity (Adapted from Marbà et al., 2015).
The supplement related to this article is available online at: https://doi.org/10.5194/bg-15-6791-2018-supplement.
All authors contributed to the design and data acquisition and/or interpretation. In addition, AAO analyzed the data and wrote the draft of the paper. All authors provided critical review of the paper and approved its final version.
The authors declare that they have no conflict of interest.
This work was funded by the CSIRO Flagship Marine & Coastal Carbon
Biogeochemical Cluster (Coastal Carbon Cluster), the Spanish Ministry of
Economy and Competitiveness (projects EstresX CTM2012-32603, MedShift
CGL2015-71809-P), the Generalitat de Catalunya (MERS 2017 SGR – 1588), the
Australian Research Council LIEF Project (LE170100219), the Edith Cowan
University Faculty Research Grant Scheme and the King Abdullah University of
Science and Technology (KAUST) through baseline funding to Carlos M. Duarte.
This work contributes to the ICTA Unit of Excellence (MinECo, MDM2015-0552).
Ariane Arias-Ortiz was funded by a PhD fellowship from Obra Social “la
Caixa”. Oscar Serrano was supported by an ARC DECRA (DE170101524).
Inés Mazarrasa was funded by a postdoctoral grant
(Juan de la Cierva-Formación) from the Spanish Ministry of Economy,
Industry and Competitiveness. We thank Sabine Schmidt and three anonymous
reviewers whose comments helped improve and clarify this
paper.
Edited by: Manmohan
Sarin
Reviewed by: Sabine Schmidt and three anonymous referees
Aalto, R. and Nittrouer, C.: 210Pb geochronology of flood events in large tropical river systems, Philos. T. R. Soc. A, 370, 2040–2074, https://doi.org/10.1098/rsta.2011.0607, 2012.
Abril, J. M.: A new theoretical treatment of compaction and the advective-diffusive processes in sediments: a reviewed basis for radiometric dating models, J. Paleolimnol., 30, 363–370, 2003.
Abril, J. M.: A 210Pb-based chronological model for recent sediments with random entries of mass and activities: Model development, J. Environ. Radioact., 151, 64–74, https://doi.org/10.1016/j.jenvrad.2015.09.018, 2016.
Abril, J. M. and Gharbi, F.: Radiometric dating of recent sediments: Beyond the boundary conditions, J. Paleolimnol., 48, 449–460, https://doi.org/10.1007/s10933-012-9622-5, 2012.
Abril, J. M., García-León, M., García-Tenorio, R., Sánchez, C. I., and El-Daoushy, F.: Dating of marine sediments by an incomplete mixing model, J. Environ. Radioactiv., 15, 135–151, https://doi.org/10.1016/0265-931X(91)90048-K, 1992.
Almahasheer, H., Serrano, O., Duarte, C. M., Arias-Ortiz, A., Masque, P., and Irigoien, X.: Low Carbon sink capacity of Red Sea mangroves, Sci. Rep.-UK, 7, 9700, https://doi.org/10.1038/s41598-017-10424-9, 2017.
Alongi, D. M., Wattayakorn, G., Pfitzner, J., Tirendi, F., Zagorskis, I., Brunskill, G., Davidson, A., and Clough, B.: Organic carbon accumulation and metabolic pathways in sediments of mangrove forests in southern Thailand, Mar. Geol., 179, 85–103, https://doi.org/10.1016/S0025-3227(01)00195-5, 2001.
Alongi, D. M., Sasekumar, A., Chong, V. C., Pfitzner, J., Trott, L. A., Tirendi, F., Dixon, P., and Brunskill, G. J.: Sediment accumulation and organic material flux in a managed mangrove ecosystem: Estimates of land-ocean-atmosphere exchange in peninsular Malaysia, Mar. Geol., 208, 383–402, https://doi.org/10.1016/j.margeo.2004.04.016, 2004.
Alongi, D. M., Pfitzner, J., Trott, L. A., Tirendi, F., Dixon, P., and Klumpp, D. W.: Rapid sediment accumulation and microbial mineralization in forests of the mangrove Kandelia candel in the Jiulongjiang Estuary, China, Estuar. Coast. Shelf S., 63, 605–618, https://doi.org/10.1016/j.ecss.2005.01.004, 2005.
Alongi, D. M., Trott, L. A., Rachmansyah, Tirendi, F., McKinnon, A. D., and Undu, M. C.: Growth and development of mangrove forests overlying smothered coral reefs, Sulawesi and Sumatra, Indonesia, Mar. Ecol.-Prog. Ser., 370, 97–109, https://doi.org/10.3354/meps07661, 2008.
Álvarez-Iglesias, P., Quintana, B., Rubio, B., and Pérez-Arlucea, M.: Sedimentation rates and trace metal input history in intertidal sediments from San Simón Bay (Ría de Vigo, NW Spain) derived from 210Pb and 137Cs chronology, J. Environ. Radioactiv., 98, 229–250, https://doi.org/10.1016/j.jenvrad.2007.05.001, 2007.
Andersen, T. J.: Some Practical Considerations Regarding the Application of 210Pb and 137Cs Dating to Estuarine Sediments, in: Applications of Paleoenvironmental Techniques in Estuarine Studies, edited by: Weckström, K., Saunders, K., Gell, P., and Skilbeck, C., 121–140, Springer, Dordrecht, 2017.
Appleby, P. G.: Dating recent sediments by 210Pb: problems and solutions, in: Proceedings of a seminar, STUK, Helsinki, 2, 7–24, 1998.
Appleby, P. G.: Chronostratigraphic Techniques in Recent Sediments, in: Tracking Environmental Change Using Lake Sediments, 1, 171–203, Springer, the Netherlands, 2001.
Appleby, P. G.: Three decades of dating recent sediments by fallout radionuclides: a review, Holocene, 18, 83–93, https://doi.org/10.1177/0959683607085598, 2008.
Appleby, P. G. and Oldfield, F.: The calculation of lead-210 dates assuming a constant rate of supply of unsupported 210Pb to the sediment, CATENA, 5, 1–8, https://doi.org/10.1016/S0341-8162(78)80002-2, 1978.
Appleby, P. G. and Oldfield, F.: Applications of lead-210 to sedimentation studies, in: Uranium-series disequilibrium: applications to earth, marine, and environmental sciences, edited by: Ivanovich, M. and Harman, R., Clarendon Press, Oxford, 1992.
Appleby, P. G., Oldfield, F., and Physics, T.: The assessment of 210Pb data from sites with varying sediment accumulation rates, Hydrobiologia, 103, 29–35, https://doi.org/10.1007/BF00028424, 1983.
Arias-Ortiz, A., Serrano, O., Masqué, P., Lavery, P. S., Mueller, U., Kendrick, G. A., Rozaimi, M., Esteban, A., Fourqurean, J. W., Marbà, N., Mateo, M. A., Murray, K., Rule, M. J., and Duarte, C. M.: A marine heatwave drives massive losses from the world's largest seagrass carbon stocks, Nat. Clim. Change, 8, 338–344, https://doi.org/10.1038/s41558-018-0096-y, 2018.
Armentano, T. V. and Woodwell, G. M.: Sedimentation rates in a Long Island marsh determined by 210Pb dating, Limnol. Oceanogr., 20, 452–456, https://doi.org/10.4319/lo.1975.20.3.0452, 1975.
Baskaran, M., Nix, J., Kuyper, C., and Karunakara, N.: Problems with the dating of sediment core using excess 210Pb in a freshwater system impacted by large scale watershed changes, J. Environ. Radioactiv., 138, 355–363, https://doi.org/10.1016/j.jenvrad.2014.07.006, 2014.
Bellucci, L. G., Frignani, M., Cochran, J. K., Albertazzi, S., Zaggia, L., Cecconi, G., and Hopkins, H.: 210Pb and 137Cs as chronometers for salt marsh accretion in the Venice Lagoon – links to flooding frequency and climate change, J. Environ. Radioactiv., 97, 85–102, https://doi.org/10.1016/j.jenvrad.2007.03.005, 2007.
Brenner, M. and Kenney, W. F.: Dating Wetland Sediment Cores, in: Methods in Biogeochemistry of Wetlands, edited by: DeLaune, R. D., Reddy, K. R., Richardson, C. J., and Megonigal, J. P., 879–900, Soil Science Society of America, Madison, 2013.
Binford, M. W.: Calculation and uncertainty analysis of 210Pb dates for PIRLA project lake sediment cores, J. Paleolimnol., 3, 253–267, 1990.
Botwe, B. O., Abril, J. M., Schirone, A., Barsanti, M., Delbono, I., Delfanti, R., Nyarko, E., and Lens, P. N. L.: Settling fluxes and sediment accumulation rates by the combined use of sediment traps and sediment cores in Tema Harbour (Ghana), Sci. Total Environ., 609, 1114–1125, https://doi.org/10.1016/j.scitotenv.2017.07.139, 2017.
Boudreau, B. P.: Is burial velocity a master parameter for bioturbation?, Geochim. Cosmochim. Ac., 58, 1243–1249, https://doi.org/10.1016/0016-7037(94)90378-6, 1994.
Boyd, B. M. and Sommerfield, C. K.: Marsh accretion and sediment accumulation in a managed tidal wetland complex of Delaware Bay, Ecol. Eng., 92, 37–46, https://doi.org/10.1016/j.ecoleng.2016.03.045, 2016.
Breithaupt, J. L., Smoak, J. M., Smith, T. J., Sanders, C. J., and Hoare, A.: Organic carbon burial rates in mangrove sediments: Strengthening the global budget, Global Biogeochem. Cy., 26, GB3011, https://doi.org/10.1029/2012GB004375, 2012.
Breithaupt, J. L., Smoak, J. M., Smith, T. J., and Sanders, C. J.: Temporal variability of carbon and nutrient burial, sediment accretion, and mass accumulation over the past century in a carbonate platform mangrove forest of the Florida Everglades, J. Geophys. Res.-Biogeo., 119, 2032–2048, https://doi.org/10.1002/2014JG002715, 2014.
Bruland, K.: Trace elements in seawater, in: Chemical oceanography, Vol. 1, edited by: Riley, J. P. and Skirrow, G., London Academic Press, London, 415–496, 1983.
Burdige, D. J.: Preservation of Organic Matter in Marine Sediments: Controls, Mechanisms, and an Imbalance in Sediment Organic Carbon Budgets, Chem. Rev., 107, 467–485, https://doi.org/10.1021/CR050347Q, 2007.
Callaway, J. C., DeLaune, R. D., and Patrik Jr., W. H.: Sediment accretion rates from four coastal wetlands along the Gulf of Mexico, J. Coastal. Res., 13, 181–191, 1997.
Callaway, J. C., DeLaune, R. D., and Patrick, W. H.: Chernobyl 137Cs used to determine sediment accretion rates at selected northern European coastal wetlands, Limnol. Oceanogr., 41, 444–450, https://doi.org/10.4319/lo.1996.41.3.0444, 1996.
Cambridge, M. L., Bastyan, G. R., and Walker, D. I.: Recovery of Posidonia meadows in Oyster Harbour, southwestern Australia, B. Mar. Sci., 71, 1279–1289, 2002.
Carroll, J. and Lerche, I.: Sedimentary processes?: quantification using radionuclides, Elsevier, Oxford, 272 pp., 2003.
Castañeda-Moya, E., Twilley, R., and Rivera-Monroy, V.: Sediment and nutrient deposition associated with Hurricane Wilma in mangroves of the Florida Coastal Everglades, Estuar. Coast., 33, 45–58, https://doi.org/10.1007/s12237-009-9242-0, 2010.
Cearreta, A., Irabien, M. J., Ulibarri, I., Yusta, I., Croudace, I. W., and Cundy, A. B.: Recent Salt Marsh Development and Natural Regeneration of Reclaimed Areas in the Plentzia Estuary, N. Spain, Estuar. Coast. Shelf S., 54, 863–886, https://doi.org/10.1006/ecss.2001.0862, 2002.
Chanton, J. P., Martens, C. S., and Kipphut, G. W.: Lead-210 sediment geochronology in a changing coastal environment, Geochim. Cosmochim. Ac., 47, 1791–1804, https://doi.org/10.1016/0016-7037(83)90027-3, 1983.
Chen, R. and Twilley, R. R.: A simulation model of organic matter and nutrient accumulation in mangrove wetland soils, Biogeochemistry, 44, 93–118, https://doi.org/10.1007/BF00993000, 1999.
Chmura, G. L., Anisfeld, S. C., Cahoon, D. R., and Lynch, J. C.: Global carbon sequestration in tidal, saline wetland soils, Global Biogeochem. Cy., 17, 1111, https://doi.org/10.1029/2002GB001917, 2003.
Church, T. M., Lord, C. J., and Somayajulu, B. L. K.: Uranium, thorium and lead nuclides in a Delaware salt marsh sediment, Estuar. Coast. Shelf S., 13, 267–275, https://doi.org/10.1016/S0302-3524(81)80025-4, 1981.
Cochran, J. and Masqué, P.: Natural radionuclides applied to coastal zone processes, Mar. Radioact., 6, 1–21, https://doi.org/10.1016/S1569-4860(05)80002-6, 2005.
Cochran, J. K., Hirschberg, D. J., Wang, J., and Dere, C.: Atmospheric Deposition of Metals to Coastal Waters (Long Island Sound, New York U.S.A.): Evidence from Saltmarsh Deposits, Estuar. Coast. Shelf S., 46, 503–522, https://doi.org/10.1006/ecss.1997.0299, 1998.
Corbett, D. R. and Walsh, J. P.: 210Lead and 137Cesium: establishing a chronology for the last century, in: Handbook of Sea-Level Research, edited by: Shennan, I., Long, A. J., and Horton, B. P., 361–372, John Wiley & Sons, Ltd., Chichester, UK, 2015.
Craft, C.: Freshwater input structures soil properties, vertical accretion, and nutrient accumulation of Georgia and U.S tidal marshes, Limnol. Oceanogr., 52, 1220–1230, https://doi.org/10.4319/lo.2007.52.3.1220, 2007.
Cremers, A., Elsen, A., De Preter, P., and Maes, A.: Quantitative analysis of radiocaesium retention in soils, Nature, 335, 247–249, https://doi.org/10.1038/335247a0, 1988.
Crusius, J. and Anderson, R. F.: Evaluating the mobility of 137Cs, 239+240Pu and 210Pb from their distributions in laminated lake sediments, J. Paleolimnol., 13, 119–141, https://doi.org/10.1007/BF00678102, 1995.
Crusius, J., Bothner, M. H., and Sommerfield, C. K.: Bioturbation depths, rates and processes in Massachusetts Bay sediments inferred from modeling of 210Pb and 239+240Pu profiles, Estuar. Coast. Shelf S., 61, 643–655, https://doi.org/10.1016/j.ecss.2004.07.005, 2004.
Cundy, A. B. and Croudace, I. W.: Physical and chemical associations of radionuclides and trace metals in estuarine sediments: an example from Poole Harbour, Southern England, J. Environ. Radioactiv., 29, 191–211, https://doi.org/10.1016/0265-931X(95)00031-5, 1995.
Dahl, M., Deyanova, D., Gütschow, S., Asplund, M. E., Lyimo, L. D., Karamfilov, V., Santos, R., Björk, M., and Gullström, M.: Sediment Properties as Important Predictors of Carbon Storage in Zostera marina Meadows: A Comparison of Four European Areas, edited by: Wang, X., PLoS One, 11, e0167493, https://doi.org/10.1371/journal.pone.0167493, 2016
Davis, R., Hess, C., and Norton, S.: 137Cs and 210Pb dating of sediments from soft-water lakes in New England (USA) and Scandinavia, a failure of 137Cs dating, Chem. Geol., 44, 151–185, 1984.
Donato, D. C., Kauffman, J. B., Murdiyarso, D., Kurnianto, S., and Stidham, M.: Mangroves among the most carbon-rich forests in the tropics, Nat. Geosci., 4, 1–5, https://doi.org/10.1038/ngeo1123, 2011.
Diemer, J., Allan, C., Eckardt, I., Kroening, D., and Vinson, D.: Sedimentation in a piedmont reservoir: Evidence from Brown's Cove, Lake Wylie, North Carolina, Environ. Eng. Geosci., 17, 123–142, https://doi.org/10.2113/gseegeosci.17.2.123, 2011.
Du, J. Z., Zhang, J., and Baskaran, M.: Applications of Short-Lived Radionuclides (7Be, 210Pb, 210Po, 137Cs and 234Th) to Trace the Sources, Transport Pathways and Deposition of Particles/Sediments in Rivers, Estuaries and Coasts, in: Handbook of Environmental Isotope Geochemistry, Springer, Berlin Heidelberg, 305–329, 2012.
Duarte, C. M., Losada, I. J., Hendriks, I. E., Mazarrasa, I., and Marbà, N.: The role of coastal plant communities for climate change mitigation and adaptation, Nat. Clim. Change, 3, 961–968, https://doi.org/10.1038/nclimate1970, 2013.
Ember, L., Williams, D., and Morris, J.: Processes that influence carbon isotope variations in salt marsh sediments, Mar. Ecol.-Prog. Ser., 36, 33–42, 1987.
Fourqurean, J. W., Duarte, C. M., Kennedy, H., Marbà, N., Holmer, M., Mateo, M. A., Apostolaki, E. T., Kendrick, G. A., Krause-Jensen, D., McGlathery, K. J., and Serrano, O.: Seagrass ecosystems as a globally significant carbon stock, Nat. Geosci., 5, 505–509, https://doi.org/10.1038/ngeo1477, 2012.
Garcia-Orellana, J., Gràcia, E., Vizcaino, A., Masqué, P., Olid, C., Martínez-Ruiz, F., Piñero, E., Sanchez-Cabeza, J. A., and Dañobeitia, J.: Identifying instrumental and historical earthquake records in the SW Iberian margin 210Pb turbidite chronology, Geophys. Res. Lett., 33, 1–6, https://doi.org/10.1029/2006GL028417, 2006.
Garcia-Orellana, J., Cañas, L., Masqué, P., Obrador, B., Olid, C., and Pretus, J.: Chronological reconstruction of metal contamination in the Port of Maó (Minorca, Spain), Mar. Pollut. Bull., 62, 1632–1640, https://doi.org/10.1016/j.marpolbul.2011.06.013, 2011.
Gardner, L. R., Sharma, P., and Moore, W. S.: A Regeneration Model for the Effect of Bioturbation by Fiddler Crabs on 210Pb Profiles in Salt Marsh Sediments, J. Environ. Radioactiv., 5, 25–36, 1987.
Gehrels, W. R., Kirby, J. R., Prokoph, A., Newnham, R. M., Achterberg, E. P., Evans, H., Black, S., and Scott, D. B.: Onset of recent rapid sea-level rise in the western Atlantic Ocean, Quaternary Sci. Rev., 24, 2083–2100, https://doi.org/10.1016/j.quascirev.2004.11.016, 2005.
Goldberg, E. D., Gamble, E., Griffin, J. J., and Koide, M.: Pollution history of Narragansett Bay as recorded in its sediments, Estuar. Coast. Mar. Sci., 5, 549–561, https://doi.org/10.1016/0302-3524(77)90101-3, 1977.
Goldstein, S. J. and Stirling, C. H.: Techniques for measuring uranium-series nuclides: 1992–2002, Rev. Mineral. Geochem., 52, 23–57, https://doi.org/10.2113/0520023, 2003
Goodbred, S. L. and Kuehl, S. A.: Floodplain processes in the Bengal Basin and the storage of Ganges–Brahmaputra river sediment: an accretion study using 137Cs and 210Pb geochronology, Sediment. Geol., 121, 239–258, https://doi.org/10.1016/S0037-0738(98)00082-7, 1998.
Greiner, J. T., McGlathery, K. J., Gunnell, J., and McKee, B. A.: Seagrass Restoration Enhances “Blue Carbon” Sequestration in Coastal Waters, PLoS One, 8, e72469, https://doi.org/10.1371/journal.pone.0072469, 2013.
Haslett, S., Cundy, A., Davies, C., and Powell, E.: Salt marsh sedimentation over the past c. 120 years along the west Cotentin coast of Normandy (France): relationship to sea-level rise and sediment supply, J. Coastal Res., 19, 609–620, 2003.
Hatton, R., DeLaune, R., and Patrik Jr., W. H.: Sedimentation, accretion, and subsidence in marshes of Barataria Basin, Louisiana, Limnol. Oceanogr., 28, 494–502, 1983.
He, Q. and Walling, D. E.: Interpreting Particle Size Effects in the Adsorption of 137Cs and Unsupported 210Pb by Mineral Soils and Sediments, J. Environ. Radioactiv., 30, 117–137, 1996a.
He, Q. and Walling, D. E.: Use of fallout Pb-210 measurements to investigate longer-term rates and patterns of overbank sediment deposition on the floodplains of lowland rivers, Earth Surf. Proc. Land., 21, 141–154, 1996b.
Holmes, C. W., Robbins, J., Halley, R., Bothner, M., Ten Brink, M., and Marot, M.: Sediment dynamics of Florida Bay mud banks on decadal time scale, Bull. Am. Paleontol., 361, 31–40, 2001.
Howard, J., Hoyt, S., Isensee, K., Pidgeon, E., and Telszewski, M.: Coastal Blue Carbon: Methods for Assessing Carbon Stocks and Emissions Factors in Mangroves, Tidal Salt Marshes, and Seagrass Meadows, Conserv. Int. Intergov. Oceanogr. Comm. UNESCO, Int. Union Conserv. Nature, Arlington, Virginia, USA, 1–180, 2014.
Howard, J., Sutton-Grier, A., Herr, D., Kleypas, J., Landis, E., Mcleod, E., Pidgeon, E., and Simpson, S.: Clarifying the role of coastal and marine systems in climate mitigation, Front. Ecol. Environ., 15, 42–50, https://doi.org/10.1002/fee.1451, 2017.
IAEA-TECDOC-1360: Collection and preparation of bottom sediment samples for analysis of radionuclides and trace elements, International Atomic Energy Agency, IAEA, Viena, 2003.
Jaeger, J., Mehta, A., Faas, R., and Grella, M.: Anthropogenic impacts on sedimentary sources and processes in a small urbanized subtropical estuary, Florida, J. Coastal. Res., 25, 30–47, 2009.
Jaeger, J. M. and Nittrouer, C. A.: A quantitative examination of modern sedimentary lithofacies formation on the glacially influenced Gulf of Alaska continental shelf, Cont. Shelf Res., 26, 2178–2204, https://doi.org/10.1016/j.csr.2006.07.014, 2006.
Jankowska, E., Michel, L. N., Zaborska, A., and Włodarska-Kowalczuk, M.: Sediment carbon sink in low-density temperate eelgrass meadows (Baltic Sea), J. Geophys. Res.-Biogeo., 121, 2918–2934, https://doi.org/10.1002/2016JG003424, 2016.
Johannessen, S. C. and Macdonald, R. W.: Geoengineering with seagrasses: is credit due where credit is given?, Environ. Res. Lett., 11, 113001, https://doi.org/10.1088/1748-9326/11/11/113001, 2016.
Johannessen, S. C. and Macdonald, R. W.: Reply to Macreadie et al. comment on “Geoengineering with seagrasses?: is credit due where credit is given??”, Environ. Res. Lett., 13, 28001, https://doi.org/10.1088/1748-9326/aaa7b5, 2018.
Jury, W. and Horton, R.: Soil physics, 6th Edn., John Wiley & Sons, New York, 2004.
Kauffman, J. and Donato, D.: Protocols for the measurement, monitoring and reporting of structure, biomass and carbon stocks in mangrove forests, Center for International Forestry Research (CIFOR), Bogor, Indonesia, 40 pp., https://doi.org/10.17528/cifor/003749, 2012.
Kelley, J. M., Bond, L. A., and Beasley, T. M.: Global distribution of Pu isotopes and 237Np, Sci. Total Environ., 237, 483–500, 1999.
Kirchner, G. and Ehlers, H.: Sediment geochronology in changing coastal environments: Potentials and limitations of the 137Cs and 210Pb methods, J. Coastal Res., 14, 483–492, 1998.
Klubi, E., Abril, J. M., Nyarko, E., Laissaoui, A., and Benmansour, M.: Radioecological assessment and radiometric dating of sediment cores from dynamic sedimentary systems of Pra and Volta estuaries (Ghana) along the Equatorial Atlantic, J. Environ. Radioactiv., 178–179, 116–126, https://doi.org/10.1016/j.jenvrad.2017.08.001, 2017.
Koch, E.: Beyond light: physical, geological, and geochemical parameters as possible submersed aquatic vegetation habitat requirements, Estuaries, 24, 1–17, https://doi.org/10.2307/1352808, 2001.
Koide, M., Soutar, A., and Goldberg, E. D.: Marine geochronology with 210Pb, Earth Planet. Sc. Lett., 14, 442–446, https://doi.org/10.1016/0012-821X(72)90146-X, 1972.
Krishnaswamy, S., Lal, D., Martin, J. M., and Meybeck, M.: Geochronology of lake sediments, Earth Planet. Sc. Lett., 11, 407–414, https://doi.org/10.1016/0012-821X(71)90202-0, 1971.
Laissaoui, A., Benmansour, M., Ziad, N., Ibn Majah, M., Abril, J. M., and Mulsow, S.: Anthropogenic radionuclides in the water column and a sediment core from the Alboran Sea: Application to radiometric dating and reconstruction of historical water column radionuclide concentrations, J. Paleolimnol., 40, 823–833, https://doi.org/10.1007/s10933-008-9201-y, 2008.
López-Merino, L., Colás-Ruiz, N. R., Adame, M. F., Serrano, O., Martínez Cortizas, A., and Mateo, M. A.: A six thousand-year record of climate and land-use change from Mediterranean seagrass mats, J. Ecol., 105, 1267–1278, https://doi.org/10.1111/1365-2745.12741, 2017.
Loring, D.: Normalization of heavy-metal data from estuarine and coastal sediments, ICES J. Mar. Sci., 48, 101–105, 1991.
Lovelock, C., Ruess, R., and Feller, I.: CO2 efflux from cleared mangrove peat, PLoS One, 6, e21279, https://doi.org/10.1371/journal.pone.0021279, 2011.
Lovelock, C. E., Atwood, T., Baldock, J., Duarte, C. M., Hickey, S., and Lavery, P. S.: Assessing the risk of carbon dioxide emissions from blue carbon ecosystems, Front. Ecol. Environ., 15, 257–265, https://doi.org/10.1002/fee.1491, 2017a.
Lovelock, C. E., Fourqurean, J. W., and Morris, J. T.: Modeled CO2 Emissions from Coastal Wetland Transitions to Other Land Uses: Tidal Marshes, Mangrove Forests, and Seagrass Beds, Front. Mar. Sci., 4, 1–11, https://doi.org/10.3389/fmars.2017.00143, 2017b.
Lynch, J. C., Meriwether, J. R., McKee, B. A., Vera-Herrera, F., and Twilley, R. R.: Recent Accretion in Mangrove Ecosystems Based on 137Cs and 210Pb, Estuaries, 12, 284, https://doi.org/10.2307/1351907, 1989.
Mabit, L., Benmansour, M., Abril, J. M., Walling, D. E., Meusburger, K., Iurian, A. R., Bernard, C., Tarján, S., Owens, P. N., Blake, W. H., and Alewell, C.: Fallout 210Pb as a soil and sediment tracer in catchment sediment budget investigations: A review, Earth-Sci. Rev., 138, 335–351, https://doi.org/10.1016/j.earscirev.2014.06.007, 2014.
MacKenzie, A. B., Hardie, S. M. L., Farmer, J. G., Eades, L. J., and Pulford, I. D.: Analytical and sampling constraints in 210Pb dating, Sci. Total Environ., 409, 1298–1304, https://doi.org/10.1016/j.scitotenv.2010.11.040, 2011.
Macreadie, P. I., Hughes, A. R., Kimbro, D. L., D'Odorico, P., and McGlathery, K.: Loss of “Blue Carbon” from Coastal Salt Marshes Following Habitat Disturbance, PLoS One, 8, e69244, https://doi.org/10.1371/journal.pone.0069244, 2013.
Macreadie, P. I., Trevathan-Tackett, S. M., Skilbeck, C. G., Sanderman, J., Curlevski, N., Jacobsen, G., and Seymour, J. R.: Losses and recovery of organic carbon from a seagrass ecosystem following disturbance, Proceedings Biol. Sci., 282, 20151537, https://doi.org/10.1098/rspb.2015.1537, 2015.
Macreadie, P. I., Ewers-Lewis, C. J., Whitt, A. A., Ollivier, Q., Trevathan-Tackett, S. M., Carnell, P., and Serrano, O.: Comment on “Geoengineering with seagrasses: is credit due where credit is given?”, Environ. Res. Lett., 13, 28002, https://doi.org/10.1088/1748-9326/aaa7ad, 2018.
Marbà, N., Arias-Ortiz, A., Masqué, P., Kendrick, G. A., Mazarrasa, I., Bastyan, G. R., Garcia-Orellana, J., and Duarte, C. M.: Impact of seagrass loss and subsequent revegetation on carbon sequestration and stocks, J. Ecol., 103, 296–302, https://doi.org/10.1111/1365-2745.12370, 2015.
Marland, G., Fruit, K., and Sedjo, R.: Accounting for sequestered carbon: the question of permanence, Environ. Sci. Policy, 4, 259–268, https://doi.org/10.1016/S1462-9011(01)00038-7, 2001.
Martz, L. and de Jong, E.: Using cesium-137 and landform classification to develop a net soil erosion budget for a small Canadian prairie watershed, Catena, 18, 289–308, 1991.
Mateo, M. A., Romero, J., Pérez, M., Littler, M. M., and Littler, D. S.: Dynamics of Millenary Organic Deposits Resulting from the Growth of the Mediterranean Seagrass Posidonia oceanica, Estuar. Coast. Shelf S., 44, 103–110, https://doi.org/10.1006/ecss.1996.0116, 1997.
Mazarrasa, I., Marbà, N., Lovelock, C. E., Serrano, O., Lavery, P. S., Fourqurean, J. W., Kennedy, H., Mateo, M. A., Krause-Jensen, D., Steven, A. D. L., and Duarte, C. M.: Seagrass meadows as a globally significant carbonate reservoir, Biogeosciences, 12, 4993–5003, https://doi.org/10.5194/bg-12-4993-2015, 2015.
Mazarrasa, I., Marbà, N., Garcia-Orellana, J., Masqué, P., Arias-Ortiz, A., and Duarte, C. M.: Effect of environmental factors (wave exposure and depth) and anthropogenic pressure in the C sink capacity of Posidonia oceanica meadows, Limnol. Oceanogr., 62, 1436–1450, https://doi.org/10.1002/lno.10510, 2017.
McGlathery, K. J., Reynolds, L. K., Cole, L. W., Orth, R. J., Marion, S. R., and Schwarzschild, A.: Recovery trajectories during state change from bare sediment to eelgrass dominance, Mar. Ecol.-Prog. Ser., 448, 209–221, https://doi.org/10.3354/meps09574, 2012.
McKee, K. L.: Biophysical controls on accretion and elevation change in Caribbean mangrove ecosystems, Estuar. Coast. Shelf S., 91, 475–483, https://doi.org/10.1016/J.ECSS.2010.05.001, 2011.
Mcleod, E., Chmura, G. L., Bouillon, S., Salm, R., Björk, M., Duarte, C. M., Lovelock, C. E., Schlesinger, W. H., and Silliman, B. R.: A blueprint for blue carbon: toward an improved understanding of the role of vegetated coastal habitats in sequestering CO2, Front. Ecol. Environ., 9, 552–560, https://doi.org/10.1890/110004, 2011.
Mudd, S. M., Howell, S. M., and Morris, J. T.: Impact of dynamic feedbacks between sedimentation, sea-level rise, and biomass production on near-surface marsh stratigraphy and carbon accumulation, Estuar. Coast. Shelf S., 82, 377–389, https://doi.org/10.1016/j.ecss.2009.01.028, 2009.
Mudd, S. M., D'Alpaos, A., and Morris, J. T.: How does vegetation affect sedimentation on tidal marshes? Investigating particle capture and hydrodynamic controls on biologically mediated sedimentation, J. Geophys. Res.-Earth, 115, 1–14, https://doi.org/10.1029/2009JF001566, 2010.
Nellemann, C., Corcoran, E., Duarte, C. M., Valdes, L., DeYoung, C., Fonseca, L., and Grimsditch, G.: Blue Carbon, The role of healthy oceans in binding carbon, A Rapid Response Assessment, United Nations Environment Programme, GRID-Arendal, 80 pp., 2009.
Oldfield, F., Appleby, P. G., and Battarbee, R. W.: Alternative 210Pb dating: results from the New Guinea Highlands and Lough Erne, Nature, 271, 339–342, https://doi.org/10.1038/271339a0, 1978.
Olff, H., De Leeuw, J., Bakker, J. P., Platerink, R. J., and van Wijnen, H. J.: Vegetation Succession and Herbivory in a Salt Marsh: Changes Induced by Sea Level Rise and Silt Deposition Along an Elevational Gradient, J. Ecol., 85, 799, https://doi.org/10.2307/2960603, 1997.
Olid, C., Garcia-Orellana, J., Martínez-Cortizas, A., Masqué, P., Peiteado, E., and Sanchez-Cabeza, J. A.: Role of Surface Vegetation in 210Pb-Dating of Peat Cores, Environ. Sci. Technol., 42, 8858–8864, https://doi.org/10.1021/es801552v, 2008.
Olid, C., Diego, D., Garcia-Orellana, J., Cortizas, A. M., and Klaminder, J.: Modeling the downward transport of 210Pb in Peatlands: Initial Penetration-Constant Rate of Supply (IP-CRS) model, Sci. Total Environ., 541, 1222–1231, https://doi.org/10.1016/j.scitotenv.2015.09.131, 2016.
Ouyang, X. and Lee, S. Y.: Updated estimates of carbon accumulation rates in coastal marsh sediments, Biogeosciences, 11, 5057–5071, https://doi.org/10.5194/bg-11-5057-2014, 2014.
Pendleton, L., Donato, D. C., Murray, B. C., Crooks, S., Jenkins, W. A., Sifleet, S., Craft, C., Fourqurean, J. W., Kauffman, J. B., Marbà, N., Megonigal, P., Pidgeon, E., Herr, D., Gordon, D., and Baldera, A.: Estimating Global “Blue Carbon” Emissions from Conversion and Degradation of Vegetated Coastal Ecosystems, PLoS One, 7, e43542, https://doi.org/10.1371/journal.pone.0043542, 2012.
Peterson, R. N.: Natural Radionuclide Applications for Riverine and Coastal Marine Investigations, Florida State University, 2009
Preiss, N., Mélières, M.-A., and Pourchet, M.: A compilation of data on lead-210 concentration in surface air and fluxes at the air-surface and water-sediment interfaces, J. Geophys. Res., 101, 28847, https://doi.org/10.1029/96JD01836, 1996.
Ravens, T., Thomas, R., and Roberts, K.: Causes of salt marsh erosion in Galveston Bay, Texas, J. Coastal Res., 25, 265–272, 2009.
Ribeiro Guevara, S. and Arribére, M.: 137Cs dating of lake cores from the Nahuel Huapi National Park, Patagonia, Argentina: Historical records and profile measurements, J. Radioanal. Nucl. Chem., 252, 37–45, https://doi.org/10.1023/A:1015275418412, 2002.
Robbins, J.: Geochemical and geophysical applications of radioactive lead, in: The biogeochemistry of lead in the environment, edited by: Nriagu, J., Elsevier, Amsterdam, 285–393, 1978.
Robbins, J. A.: A model for particle-selective transport of tracers in sediments with conveyor belt deposit feeders, J. Geophys. Res., 91, 8542, https://doi.org/10.1029/JC091iC07p08542, 1986.
Robbins, J. A. and Edgington, D. N.: Determination of recent sedimentation rates in Lake Michigan using Pb-210 and Cs-137, Geochim. Cosmochim. Ac., 39, 285–304, https://doi.org/10.1016/0016-7037(75)90198-2, 1975.
Ruiz-Fernández, A. C. and Hillaire-Marcel, C.: 210Pb-derived ages for the reconstruction of terrestrial contaminant history into the Mexican Pacific coast: Potential and limitations, Mar. Pollut. Bull., 59, 134–145, https://doi.org/10.1016/j.marpolbul.2009.05.006, 2009.
Saderne, V., Cusack, M., Almahasheer, H., Serrano, O., Masqué, P., Arias-Ortiz, A., Krishnakumar, P. K., Rabaoui, L., Qurban, M. A., and Duarte, C. M.: Accumulation of Carbonates Contributes to Coastal Vegetated Ecosystems Keeping Pace With Sea Level Rise in an Arid Region (Arabian Peninsula), J. Geophys. Res.-Biogeo., 123, 1498–1510, https://doi.org/10.1029/2017JG004288, 2018.
Sanchez-Cabeza, J. A. and Ruiz-Fernández, A. C.: 210Pb sediment radiochronology: An integrated formulation and classification of dating models, Geochim. Cosmochim. Ac., 82, 183–200, https://doi.org/10.1016/j.gca.2010.12.024, 2012.
Sanders, C. J., Smoak, J. M., Sanders, L. M., Waters, M. N., Patchineelam, S. R., and Ketterer, M. E.: Intertidal mangrove mudflat 240+239Pu signatures, confirming a 210Pb geochronology on the southeastern coast of Brazil, J. Radioanal. Nucl. Ch., 283, 593–596, https://doi.org/10.1007/s10967-009-0418-7, 2010a.
Sanders, C. J., Smoak, J. M., Naidu, A. S., Sanders, L. M., and Patchineelam, S. R.: Organic carbon burial in a mangrove forest, margin and intertidal mud flat, Estuar. Coast. Shelf S., 90, 168–172, https://doi.org/10.1016/j.ecss.2010.08.013, 2010b.
Sanders, C. J., Smoak, J. M., Waters, M. N., Sanders, L. M., Brandini, N., and Patchineelam, S. R.: Organic matter content and particle size modifications in mangrove sediments as responses to sea level rise, Mar. Environ. Res., 77, 150–155, https://doi.org/10.1016/j.marenvres.2012.02.004, 2012.
Sanders, C. J., Eyre, B. D., Santos, I. R., Machado, W., Luiz-silva, W., Smoak, J. M., Breithaupt, J. L., Ketterer, M. E., Sanders, L., Marotta, H., and Silva-filho, E.: Elevated rates of organic carbon, nitrogen, and phosphorus accumulation in a highly impacted mangrove wetland, Geophys. Res. Lett., 41, 2475–2480, https://doi.org/10.1002/2014GL059789, 2014.
Sanders, C. J., Santos, I. R., Maher, D. T., Breithaupt, J. L., Smoak, J. M., Ketterer, M., Call, M., Sanders, L., and Eyre, B. D.: Examining 239+240Pu, 210Pb and historical events to determine carbon, nitrogen and phosphorus burial in mangrove sediments of Moreton Bay, Australia, J. Environ. Radioactiv., 151, 623–629, https://doi.org/10.1016/j.jenvrad.2015.04.018, 2016.
Serrano, O., Mateo, M. A., Renom, P., and Julià, R.: Characterization of soils beneath a Posidonia oceanica meadow, Geoderma, 185–186, 26–36, https://doi.org/10.1016/j.geoderma.2012.03.020, 2012.
Serrano, O., Ruhon, R., Lavery, P. S., Kendrick, G. A., Hickey, S., Masqué, P., Arias-Ortiz, A., Steven, A., and Duarte, C. M.: Impact of mooring activities on carbon stocks in seagrass meadows, Sci. Rep.-UK, 6, 23193, https://doi.org/10.1038/srep23193, 2016a.
Serrano, O., Ricart, A. M., Lavery, P. S., Mateo, M. A., Arias-Ortiz, A., Masque, P., Rozaimi, M., Steven, A., and Duarte, C. M.: Key biogeochemical factors affecting soil carbon storage in Posidonia meadows, Biogeosciences, 13, 4581–4594, https://doi.org/10.5194/bg-13-4581-2016, 2016b.
Serrano, O., Davis, G., Lavery, P. S., Duarte, C. M., Martinez-Cortizas, A., Mateo, M. A., Masqué, P., Arias-Ortiz, A., Rozaimi, M., and Kendrick, G. A.: Reconstruction of centennial-scale fluxes of chemical elements in the Australian coastal environment using seagrass archives, Sci. Total Environ., 541, 883–894, https://doi.org/10.1016/j.scitotenv.2015.09.017, 2016c.
Serrano, O., Lavery, P., Masque, P., Inostroza, K., Bongiovanni, J., and Duarte, C.: Seagrass sediments reveal the long-term deterioration of an estuarine ecosystem, Glob. Change Biol., 22, 1523–1531, https://doi.org/10.1111/gcb.13195, 2016d.
Sharma, P., Gardner, L. R., Moore, W. S., and Bollinger, M. S.: Sedimentation and bioturbation in a salt marsh as revealed by 210Pb, 137Cs, and 7Be studies, Limnol. Oceanogr., 32, 313–326, https://doi.org/10.4319/lo.1987.32.2.0313, 1987.
Short, F. T. and Wyllie-Echeverria, S.: Natural and human-induced disturbance of seagrasses, Environ. Conserv., 23, 17, https://doi.org/10.1017/S0376892900038212, 1996.
Smith, J.: Why should we believe 210Pb sediment geochronologies?, J. Environ. Radioactiv., 55, 121–123, 2001.
Smith, J., Boudreau, B., and Noshkin, V.: Plutonium and 210Pb distributions in northeast Atlantic sediments: subsurface anomalies caused by non-local mixing, Earth Planet. Sc. Lett., 81, 15–28, https://doi.org/10.1016/0012-821X(86)90097-X, 1986.
Smoak, J. M. and Patchineelam, S. R.: Sediment mixing and accumulation in a mangrove ecosystem?: evidence from 210Pb, 234Th and 7Be, Mangroves Salt Marshes, 3, 17–27, https://doi.org/10.1023/A:1009979631884, 1999.
Smoak, J. M., Breithaupt, J. L., Smith, T. J., and Sanders, C. J.: Sediment accretion and organic carbon burial relative to sea-level rise and storm events in two mangrove forests in Everglades National Park, Catena, 104, 58–66, https://doi.org/10.1016/j.catena.2012.10.009, 2013.
Sommerfield, C. and Nittrouer, C.: Modern accumulation rates and a sediment budget for the Eel shelf: a flood-dominated depositional environment, Mar. Geol., 154, 227–241, 1999.
Staunton, S., Dumat, C., and Zsolnay, A.: Possible role of organic matter in radiocaesium adsorption in soils, J. Environ. Radioactiv., 58, 163–173, https://doi.org/10.1016/S0265-931X(01)00064-9, 2002.
Stupar, Y. V., Schäfer, J., García, M. G., Schmidt, S., Piovano, E., Blanc, G., Huneau, F., and Le Coustumer, P.: Historical mercury trends recorded in sediments from the Laguna del Plata, Córdoba, Argentina, Chem. Erde-Geochem., 74, 353–363, https://doi.org/10.1016/j.chemer.2013.11.002, 2014.
Sun, X., Fan, D., Tian, Y., and Zheng, S.: Normalization of excess 210Pb with grain size in the sediment cores from the Yangtze River Estuary and adjacent areas: Implications for sedimentary processes, Holocene, 28, 545–557, https://doi.org/10.1177/0959683617735591, 2017.
Swales, A. and Bentley, S.: Mangrove-forest evolution in a sediment-rich estuarine system: opportunists or agents of geomorphic change?, Earth Surf. Proc. Land., 40, 1672–1687, 2015.
Swindles, G. T., Galloway, J. M., Macumber, A. L., Croudace, I. W., Emery, A. R., Woulds, C., Bateman, M. D., Parry, L., Jones, J. M., Selby, K., Rushby, G. T., Baird, A. J., Woodroffe, S. A., and Barlow, N. L. M.: Sedimentary records of coastal storm surges: Evidence of the 1953 North Sea event, Mar. Geol., 403, 262–270, https://doi.org/10.1016/j.margeo.2018.06.013, 2018.
Turner, R. E., Swenson, E. M., Milan, C. S., and Lee, J. M.: Hurricane signals in salt marsh sediments: Inorganic sources and soil volume, Limnol. Oceanogr., 52, 1231–1238, https://doi.org/10.4319/lo.2007.52.3.1231, 2007.
Van Eaton, A. R., Zimmerman, A. R., Jaeger, J. M., Brenner, M., Kenney, W. F., and Schmid, J. R.: A novel application of radionuclides for dating sediment cores from sandy, anthropogenically disturbed estuaries, Mar. Freshwater Res., 61, 1268–1277, https://doi.org/10.1071/MF10028, 2010.
Walling, D., Collins, A., and Sichingabula, H.: Using unsupported lead-210 measurements to investigate soil erosion and sediment delivery in a small Zambian catchment, Geomorphology, 52, 193–213, 2003.
Walsh, J. P. and Nittrouer, C. A.: Mangrove-bank sedimentation in a mesotidal environment with large sediment supply, Gulf of Papua, Mar. Geol., 208, 225–248, https://doi.org/10.1016/j.margeo.2004.04.010, 2004.
Wan, G. J., Chen, J. a., Wu, F. C., Xu, S. Q., Bai, Z. G., Wan, E. Y., Wang, C. S., Huang, R. G., Yeager, K. M., and Santschi, P. H.: Coupling between 210Pbex and organic matter in sediments of a nutrient-enriched lake: An example from Lake Chenghai, China, Chem. Geol., 224, 223–236, https://doi.org/10.1016/j.chemgeo.2005.07.025, 2005.
Wentworth, C.: A scale of grade and class terms for clastic sediments, J. Geol., 30, 377–392, 1922.
Xu, B., Bianchi, T. S., Allison, M. A., Dimova, N. T., Wang, H., Zhang, L., Diao, S., Jiang, X., Zhen, Y., Yao, P., Chen, H., Yao, Q., Dong, W., Sui, J., and Yu, Z.: Using multi-radiotracer techniques to better understand sedimentary dynamics of reworked muds in the Changjiang River estuary and inner shelf of East China Sea, Mar. Geol., 370, 76–86, https://doi.org/10.1016/j.margeo.2015.10.006, 2015.
Yeager, K. and Santschi, P.: Invariance of isotope ratios of lithogenic radionuclides: more evidence for their use as sediment source tracers, J. Environ. Radioactiv., 69, 159–176, 2003.
Yeager, K. M., Brunner, C. A., Kulp, M. A., Fischer, D., Feagin, R. A., Schindler, K. J., Prouhet, J., and Bera, G.: Significance of active growth faulting on marsh accretion processes in the lower Pearl River, Louisiana, Geomorphology, 153–154, 127–143, https://doi.org/10.1016/j.geomorph.2012.02.018, 2012.