the Creative Commons Attribution 4.0 License.
the Creative Commons Attribution 4.0 License.
 | 30 Apr 2020
Patterns and trends of the dominant environmental controls of net biome productivity
Barbara Marcolla
Mirco Migliavacca
Christian Rödenbeck
Alessandro Cescatti
In the last decades terrestrial ecosystems have reabsorbed on average more than one-quarter of anthropogenic emissions (Le Quéré et al., 2018). However, this large carbon sink is modulated by climate and is therefore highly variable in time and space. The magnitude and temporal changes in the sensitivity of terrestrial CO2 fluxes to climate drivers are key factors to determine future atmospheric CO2 concentration and climate trajectories. In the literature, there is so far a strong focus on the climatic controls of daily and long-term variability, while less is known about the key drivers at a seasonal timescale and about their variation over time (Wohlfahrt et al., 2008). This latter temporal scale is relevant to assess which climatic drivers dominate the seasonality of the fluxes and to understand which factors limit the CO2 exchange during the course of the year. Here, we investigate the global sensitivity of net terrestrial CO2 fluxes, derived from atmospheric inversion, to three key climate drivers (i.e. global radiation and temperature from WFDEI and soil water content from ERA-Interim) from weekly to seasonal temporal scales, in order to explore the short-term interdependence between climate and the terrestrial carbon budget. We observed that the CO2 exchange is controlled by temperature during the carbon uptake period over most of the land surface (from 55 % to 52 % of the total surface), while radiation is the most widespread dominant climate driver during the carbon release period (from 64 % to 70 % of the total surface). As expected, soil water content plays a key role in arid regions of the Southern Hemisphere during both the carbon uptake and the carbon release period. Looking at the decadal trend of these sensitivities (1985–2016) we observed that the importance of radiation as a driver is increasing over time, while we observed a decrease in sensitivity to temperature in Eurasia. Overall, we show that flux temporal variation due to a specific driver has been dominated by the temporal changes in ecosystem sensitivity (i.e. the response of ecosystem to climate) rather than to the temporal variability of the climate driver itself over the last decades. Ultimately, this analysis shows that the ecosystem response to climate is significantly changing both in space and in time, with potential repercussion on the future terrestrial CO2 sink and therefore on the role that land may play in climate trajectories.
- Article
(6036 KB) - Full-text XML
-
Supplement
(900 KB) - BibTeX
- EndNote


Just over one-quarter of the anthropogenic emissions of carbon dioxide (CO2) on average are reabsorbed by terrestrial ecosystems (Le Quéré et al., 2018). This large sink is influenced by climate and therefore by its short- and long-term variability (Beer et al., 2010; Ciais et al., 2005; Rödenbeck et al., 2018; Sitch et al., 2015). In fact, key climate drivers, like radiation, temperature, precipitation regime and soil moisture, control the fundamental processes of photosynthesis and respiration that are modulating the net ecosystem CO2 exchange (Reich et al., 2018). Moreover, climate change is affecting the phenological cycle of plants and, therefore, the functioning of ecosystems which in turn affect climate (Richardson et al., 2013). Due to this interrelation, model studies show that the response of land CO2 fluxes to climate drivers may heavily determine the future climate trajectories (Friedlingstein et al., 2001). Ultimately, the large uncertainty of climate projections could be significantly improved with a better understanding of vegetation response to the climate variability observed in the past (Papagiannopoulou et al., 2017).
In the last decades the climate sensitivity of terrestrial ecosystem CO2 exchange has been investigated at different temporal and spatial scales and with a variety of measurement techniques ranging from eddy covariance, which continuously monitors fluxes at the local scale (Baldocchi, 2003; Baldocchi et al., 2001), to global-scale retrievals based on satellite remote sensing.
An increasing range of sensors on different satellite platforms are continuously monitoring the structural and functional properties of global vegetation with different techniques and wavebands (i.e. optical, thermal, microwave). The combination of multiple sources of Earth observations has proved to be a valuable method to assess land–climate interactions at a large scale and to constrain model representation (Alkama and Cescatti, 2016; Duveiller et al., 2018; Jung et al., 2017; Ryu et al., 2019; Tramontana et al., 2016).
Evidence-driven model products based on data assimilation are another important tool to analyse the vegetation–climate interplay and can be used to assess the generalisability of ground-based observations (Fernández-Martínez et al., 2019). Among these, atmospheric inversions (such as the Jena CarboScope Inversion used here) combine modelled atmospheric transport with high-precision measurements of atmospheric CO2 concentrations to derive surface fluxes (Rödenbeck et al., 2003). Atmospheric inversions are particularly suitable for the assessment of vegetation–climate interactions because these data products are not assuming a priori any trend in the interplay between climate and fluxes. Besides, inversions provide global data over several decades and are therefore useful to assess temporal changes at a large spatial scale.
The sensitivity of ecosystem net biome productivity (NBP) to climate variability has been so far mostly investigated at an annual scale, while it is still poorly investigated across multiple sub-annual temporal scales. However, it is at the diurnal to seasonal scales where climate variability is directly acting on ecosystems (e.g. though heatwaves, droughts or cold spells) (Katul et al., 2001), while annual anomalies are just the sum over such sub-annual responses. Besides, climate variability can have different impacts on the CO2 flux (enhancing or dampening its variability) depending on the time period of the year when it occurs (Marcolla et al., 2011; Sippel et al., 2016). Thus, it is important to assess the limiting climate factors that control weekly or monthly evolution of ecosystem carbon fluxes in order to assess the vulnerability and forecast the future evolution of the ecosystem carbon budgets (De Keersmaecker et al., 2015; le Maire et al., 2010). To this scope, in our work we explore the recent patterns and temporal trends of the environmental drivers of NBP. In particular, we assess the relative importance of key drivers like global radiation, temperature and soil water content (Jung et al., 2017) at the sub-annual timescales (weekly to seasonal). The analysis was framed to (i) identify the limiting factors of global net biome productivity (NBP) from weekly to seasonal timescales, (ii) assess how the NBP sensitivity to the main climate drivers has been changing in recent decades, and (iii) quantify the contribution of the variations in the climate drivers and in the response of ecosystems to climate in determining the total temporal variability of CO2 fluxes.
2.1 Datasets
Gridded global flux estimates were obtained from the top-down product Jena CarboScope CO2 Inversion (version s85_v4.1, 21 atmospheric sites) (Rödenbeck et al., 2003). Atmospheric inversions yield surface flux fields that achieve the best match to high-precision measurements of atmospheric CO2 concentrations, where the fluxes are linked to atmospheric mole fractions by modelled atmospheric transport. For this specific inversion, atmospheric transport is simulated by the global three-dimensional transport model TM3 (Heimann and Körner, 2003) driven by meteorological data from the NCEP reanalysis (Kalnay et al., 1996). The product version used in this analysis covers the period 1985–2016 at a daily timescale; however, since the inversion uses temporal a priori correlations that smooth away any flux variations faster than about a week, the minimum time resolution we analysed is 7 d. The Jena Inversion is particularly suited for the analysis of temporal trends and variability since it is based on a temporally constant observation network for the entire simulation period, in order to minimise spurious influences from the beginning or ending of data records on the spatio-temporal variation in the fluxes. From the versions of the Jena CarboScope CO2 Inversion, we selected s85_v4.1 since it represents a good compromise between the length of the time series (needed to assess temporal trends) and the density of the observation network (required to have a good spatial representativeness of the dataset). In order to prove the robustness of the results, we also performed part of the analysis with other versions of the s85 Jena CarboScope product that were produced to explore the uncertainty of the inversion driven by the priors and by the spatio-temporal correlation of the error (s85oc_tight_v4.3 with halved prior uncertainty, s85oc_loose_v4.3 with double prior uncertainty, s85oc_short_v4.3 with shorter spatial correlation and s85oc_fast_v4.3 with shorter temporal correlation). In addition, we also explored a different version of the product (s81oc_v4.3). We limited the analysis of the uncertainty to different versions of the Jena CarboScope CO2 Inversion since, to our knowledge, all other long-term inversions are produced with a varying observation network (the number of atmospheric stations used in the inversion changes during the time series) and are therefore not adequate for the scope of our study.
Concerning climate variables, global radiation (RG), air temperature (TA) and soil water content (SWC) were used as key drivers for NBP (Jung et al., 2017; Ma et al., 2007; Papagiannopoulou et al., 2017). These environmental variables are generally recognised as the major factors driving the variation in CO2 fluxes from hourly to multiday timescales (Chu et al., 2016; Richardson et al., 2007), while the response at longer timescales becomes more complex and often involves indirect effects through functional changes (Teklemariam et al., 2010). Vapour pressure deficit (VPD) has been evaluated as an alternative to SWC, but ultimately it was not included in the analysis since it controls only one of the two processes (gross primary productivity, GPP) determining the ecosystem NBP, while SWC has an impact on both GPP and total ecosystem respiration (TER).
Global radiation and air temperature data were retrieved from the WFDEI database (Weedon et al., 2014). The dataset covers the period 1985–2016 with a spatial resolution of and a temporal resolution of 1 d. The WFDEI meteorological forcing dataset has been generated using the same methodology as the WATCH Forcing Data (WFD) by making use of the ERA-Interim reanalysis data. ERA-Interim is a global atmospheric reanalysis from 1979, continuously updated in real time by the European Centre for Medium-Range Weather Forecasts (ECMWF; Berrisford et al., 2011). The ERA-Interim dataset was also used to retrieve the soil water content (level 2, from 0.07 to 0.28 m depth).
2.2 Statistical data analysis
All datasets were aggregated at the spatial resolution of the inversion product () with the R package “raster” using the mean of the variables as the aggregation function (Hijmans, 2017). A moving window of 7, 30 and 90 d was then applied to the data to have data at weekly, monthly and seasonal temporal resolution, respectively. We chose this statistical method among those available (e.g. Fourier transformation, wavelet analysis, SSA) because of a combination of simplicity, robustness and clarity.
Multilinear regression models have been extensively used to assess the interlinkages between global vegetation and climate (Barichivich et al., 2014; Nemani et al., 2003). In this study regressions between Jena CarboScope NBP and global radiation (RG), air temperature (TA) and soil water content (SWC) were estimated at the pixel level using the R package “glmnet” (Friedman et al., 2010), which is suitable to calculate linear regression coefficients in the case of collinearity, as is often the case with multiple climate drivers. The presence of collinearity was assessed computing the variance inflation factor (Fig. S1 in the Supplement), which measures how much the variance of a regression coefficient is inflated due to multicollinearity in the model (Gareth et al., 2014). When multicollinearity occurs, least-squares estimates are unbiased, but their variances are so large that they may be completely inaccurate. Hence, to account for collinearity, the loss function is modified in a way so that not only the sum of squared residuals is minimised, but the size of parameter estimates is also penalised, in order to shrink them towards zero. The ideal penalty is somewhere in between 0 (ordinary least square) and ∞ (all coefficients shrunk to 0) and gives the minimum mean cross-validated error.
Regression coefficients for each pixel were estimated first using the entire time series and then separately for the carbon uptake period (CUP, defined as the period when the land acts as a carbon sink since gross primary productivity dominates over respiratory terms) and the carbon release period (CRP, when respiration is larger than gross primary productivity and the land is a carbon source). Since GPP and TER cannot be derived from inversion products, we performed the regression analysis using NBP of CUP and of CRP as proxies of GPP and TER, respectively (Migliavacca et al., 2011, 2015). Climatological CUP and CRP were identified using the seasonality of NBP (sign convention: NBP>0 corresponds to uptake) for each pixel, and periods with NBP>0 were classified as CUP and periods with NBP<0 as CRP.
The absolute value of standardised coefficients was used as a measure of the relative importance of the drivers. Hence the dominant driver for each pixel was the one having the largest coefficient. In order to assess the temporal variation in the sensitivity to climate drivers, the observation period was split into eight sub-periods of 4 years each. For each sub-period a multilinear regression of NBP versus the selected climate drivers (RG, TA, SWC) was estimated at the pixel level, obtaining eight angular coefficients (i.e. sensitivities) for each driver (mdriver). Average values of the drivers were also calculated for each sub-period. The temporal trend of the sensitivities to climate drivers was investigated with linear regressions versus time at the pixel level.
The contributions to NBP total temporal variability due to temporal variation in the climate drivers and in the ecosystem sensitivity to drivers were separately estimated according to the following equation:
where mdriver is the coefficient of a driver in the multilinear regression.
The contribution of the temporal change in the ecosystem sensitivity to the driver was obtained by estimating a linear regression against time for the eight angular coefficients (mdriver) previously calculated for the eight sub-periods of 4 years, and the temporal sensitivity obtained from the regression was multiplied by the average value of the driver in the sub-periods. The contribution of the temporal changes in the drivers was obtained by estimating a linear regression of the sub-periods' average driver values against time, and the temporal sensitivity of the driver was multiplied by the sensitivity-to-driver coefficients.
3.1 Dominant drivers across regions and climates
The analysis of the drivers of sub-annual NBP fluctuations shows clear spatial patterns, where a single climate variable dominates specific geographic regions in the different climate zones (Fig. 1). In particular, the climate driver that controls the fluctuation of NBP in most of the Northern Hemisphere is radiation, with an increasing dominance from the weekly to seasonal temporal scale, while in the Southern Hemisphere soil water content controls NBP in the driest regions of Africa and South America, and radiation and temperature dominate elsewhere.
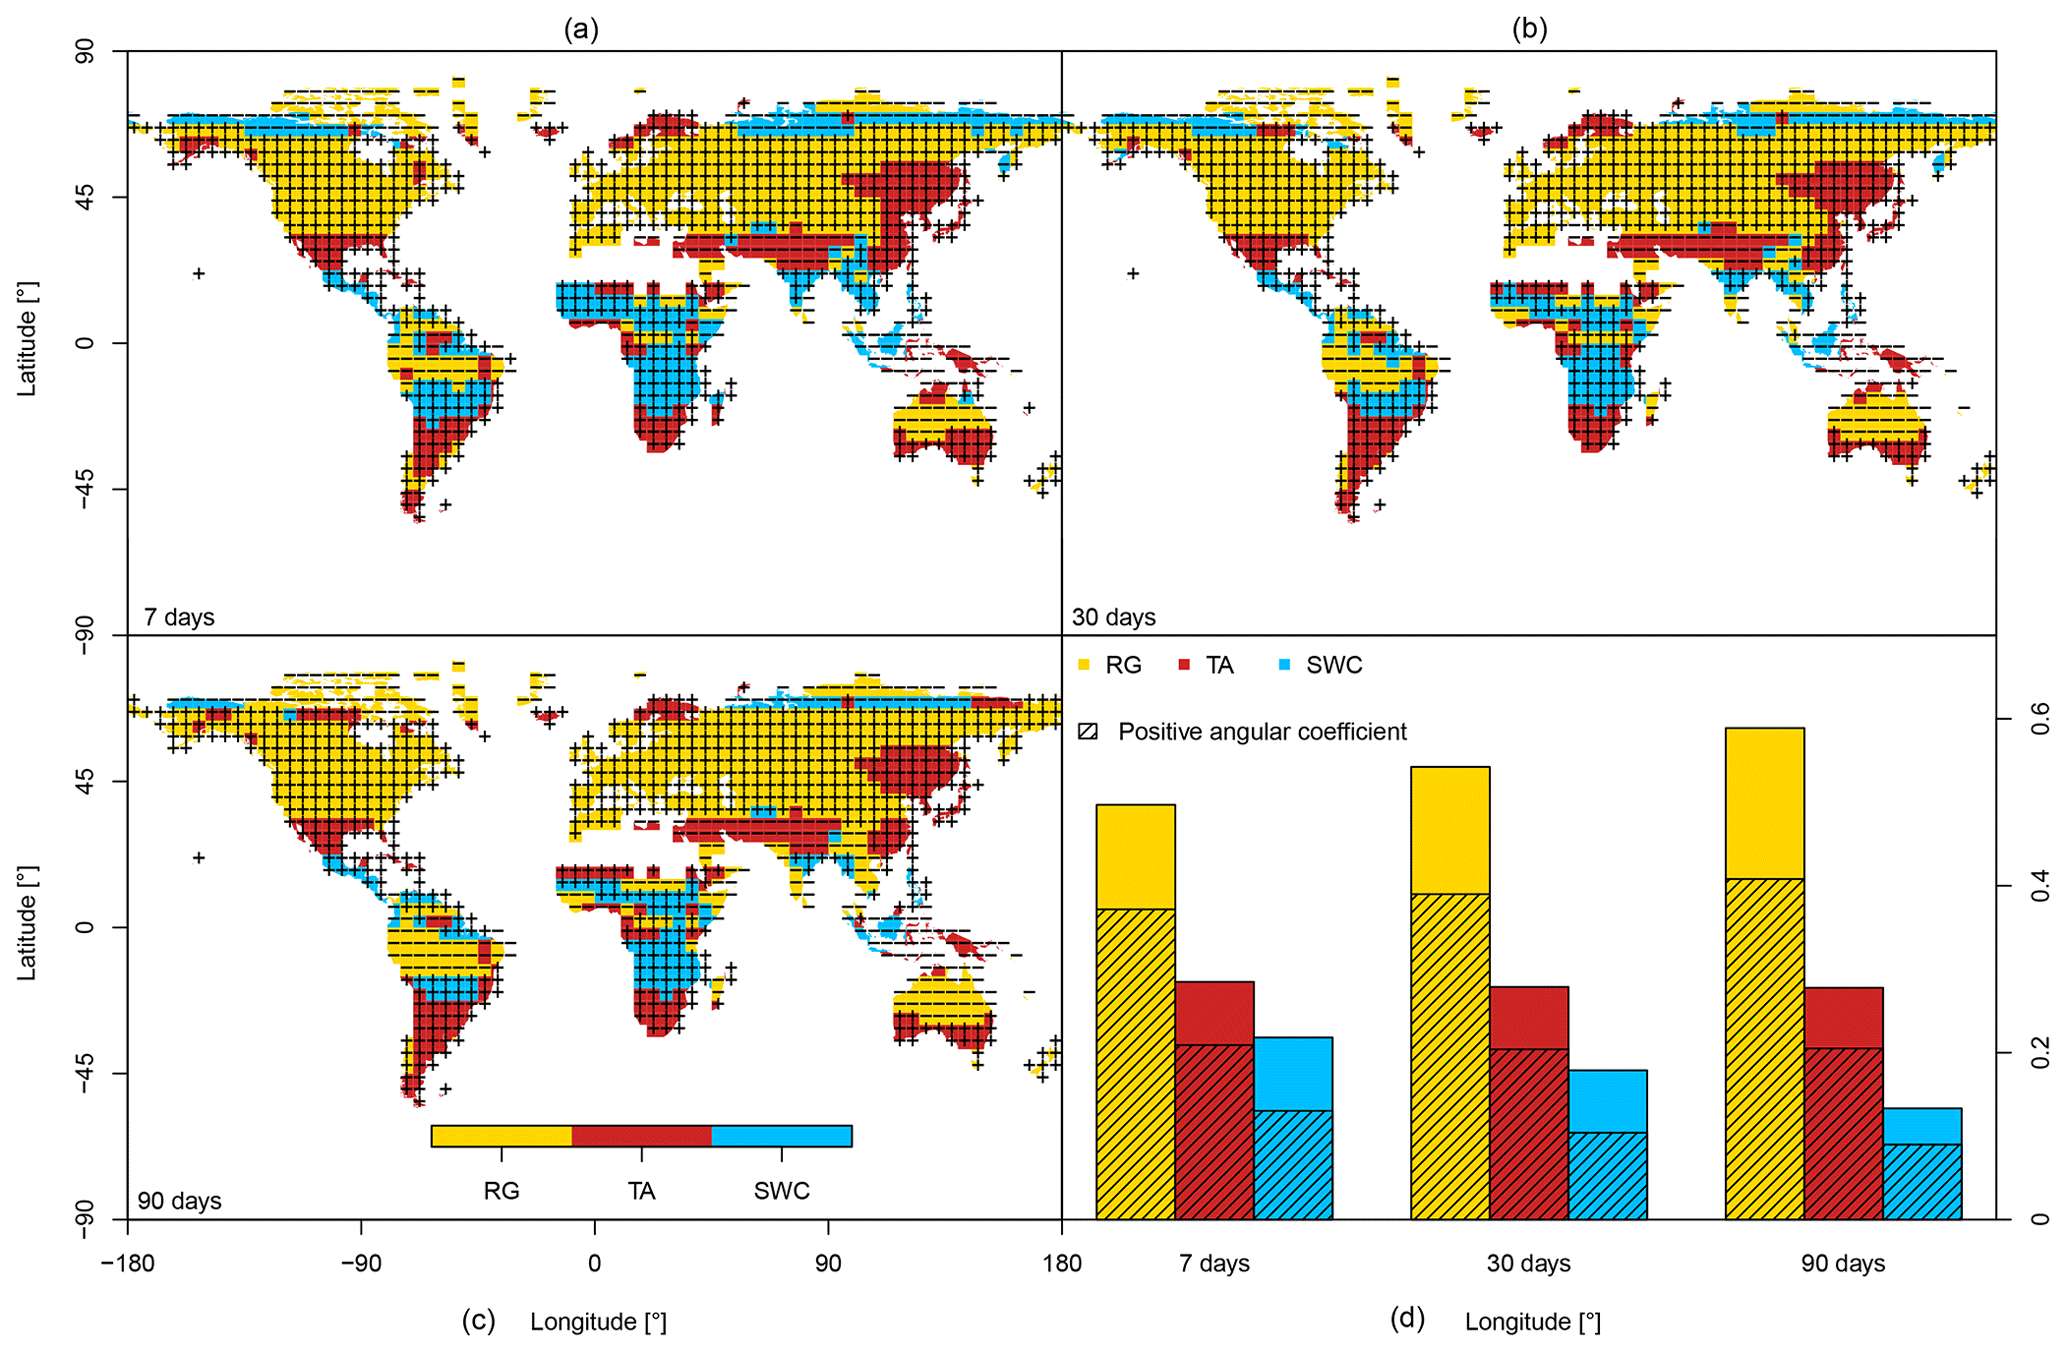
Figure 1Maps of the dominant drivers calculated over the entire time series and sign of their angular coefficients in a multilinear regression. Results are shown for three temporal resolutions, namely 7, 30 and 90 d. (d) Frequency of each dominant variable for the three analysed temporal resolutions; dashed areas represent the frequency of positive angular coefficients.
Looking at the sign of the relationships between NBP and drivers, it is interesting to notice that the global maps are dominated by positive correlations between drivers and NBP (regions with a plus sign in Fig. 1), meaning that the terrestrial land sink is larger during periods with higher temperature, radiation and soil water content. As expected, negative correlation with radiation occurs in tropical regions where high radiation loads are related to stressful conditions (e.g. heat stress, water limitation or a combination of the two).
Looking at the differences between temporal scales, we observe that the area with positive correlation is rather stable at the various time resolutions (11 % increase from 7 to 90 d), whereas the areas with negative correlations show a much stronger increase (50 % increase from 7 to 90 d), suggesting that the negative interplay between radiation and NBP typically occurs at longer time scales than the positive interplay. This should be interpreted by considering that positive correlations are likely due to the direct effect of the rapid response of photosynthesis to light, whereas negative correlations are due to the indirect effect on the overall growing conditions, typically leading to stomatal limitation (e.g. dry season in the tropical regions with high VPD and low soil water content).
Temperature is the second most frequent dominant variable and controls the tropics in the Northern Hemisphere, the southernmost latitudes and East Asia. Similarly to radiation, the effect of temperature on the weekly to seasonal variation in NBP is mostly positive (Wu et al., 2015) except in arid regions of the Middle East. Soil water content controls the boreal latitudes and has a negative effect on carbon fluxes (drier periods show higher uptake), while in arid regions of the Southern Hemisphere it has a positive effect (humid periods show higher uptake).
In order to assess the consistency of the results, the analysis of the dominant climate controls was repeated with the five other versions of the CarboScope inversion. Results confirm the robustness of the findings, with an agreement on the dominant driver in five out of six products over about 90 % of the land surface (Fig. S2, Supplement).
3.2 Dominant drivers across temporal phases
Since the processes that dominate the CO2 exchange are different between the period of carbon uptake when the land is a sink (CUP) and the period of carbon release (CRP), the regression analysis was repeated separately for these two phases of the ecosystem carbon budget (Figs. 2, 3).
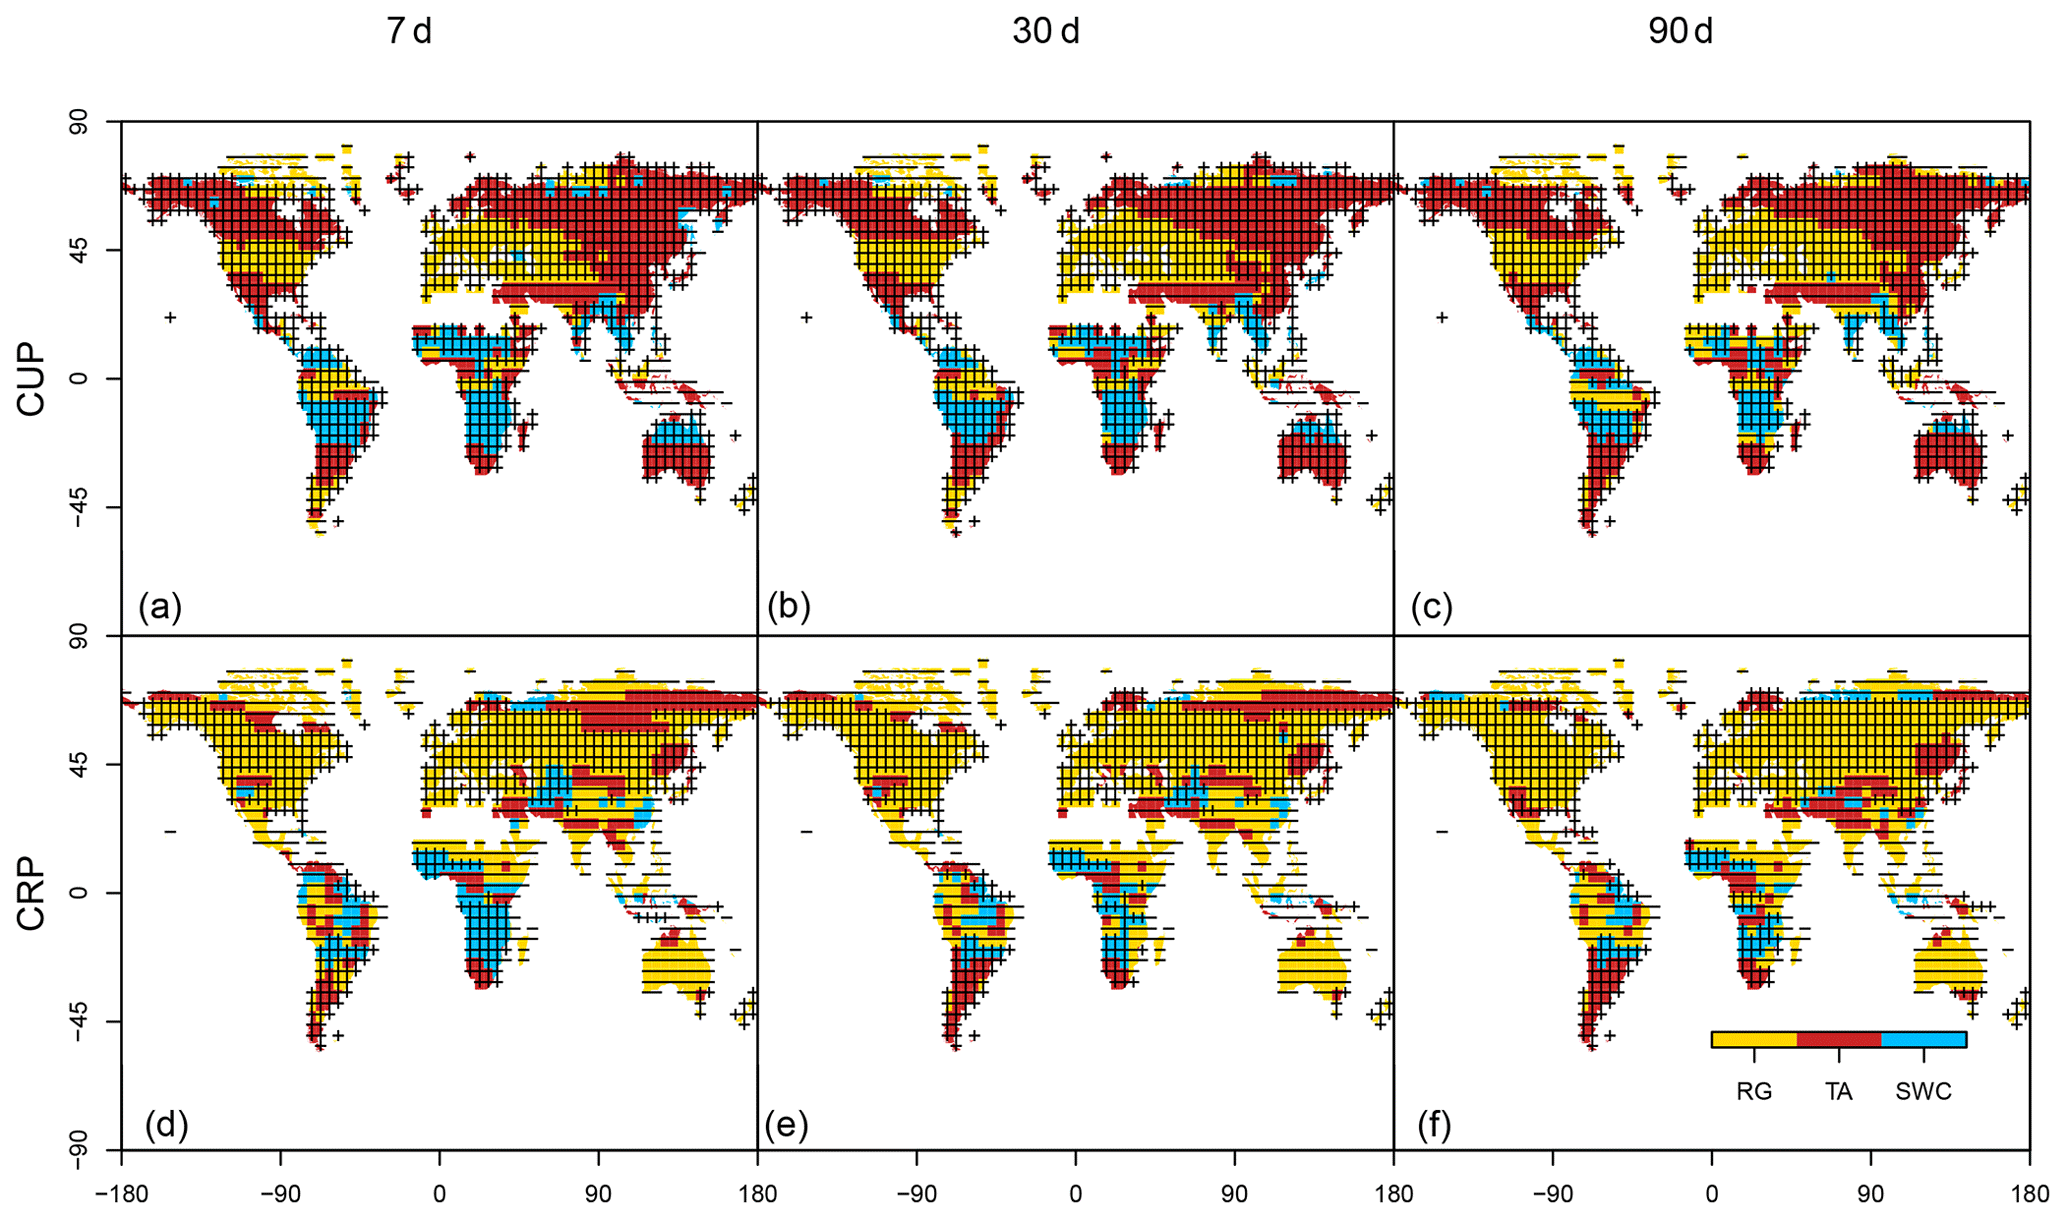
Figure 2Maps of the dominant drivers and sign of their angular coefficients in a multilinear regression calculated separately for the carbon uptake period (CUP, a, b, c) and carbon release period (CRP, d, e, f). Results are shown for three temporal resolutions, namely 7, 30 and 90 d.
Results show that the dominant drivers of the high-frequency fluctuation in NBP are different between the two periods. In the continental regions of the boreal hemisphere, the variability in the period dominated by photosynthesis (CUP) is mostly driven by positive relationships with temperature and NBP, while the temperate zone shows a mixed pattern of temperature and radiation limitation (Fig. 2). During CUP in the Southern Hemisphere, a key role is played by soil water availability which is positively correlated with NBP fluxes across the tropical region.
Interesting results emerge from the analysis of the key drivers during the carbon release period (Figs. 2, 3). Globally the most common limiting factor is radiation, with a strong positive and negative control in the Northern Hemisphere and Southern Hemisphere, respectively. This distinct pattern is related to the different processes limiting the carbon uptake in the two hemispheres: the low radiation load occurring off season in the boreal hemisphere and the condition of high radiation and aridity in the Southern Hemisphere (confirmed by the positive effect of soil water content).

Figure 3Frequency of the dominant variables plotted for the carbon uptake period (CUP) and carbon release period (CRP) at different temporal resolutions (7, 30 and 90 d), and frequency of dominant variables with positive coefficients (dashed bars).
Altogether we observed an important asymmetry in the sign of the controlling drivers between the CUP and CRP. While the former is stimulated by the increase in the drivers on a large fraction of the Earth surface (more than 80 % on average for all drivers), the latter shows a mixed pattern where the CO2 sink is stimulated in about half of the planet and depressed in the other half by radiation (Fig. 3). Concerning temperature, the key parameter from a global change perspective, the asymmetry is even stronger, with a control overwhelmingly positive in the CUP (in ∼85 % of the temperature-dominated surface at all the investigated temporal resolutions) and mostly negative (in 76, 68 and 45 % of the temperature-dominated surface at 7, 30 and 90 d, respectively) in the CRP. This pattern is likely due to the temperature stimulation of the two opposite processes GPP and TER that control NBP during CUP and CRP, respectively.
3.3 Temporal trends of environmental controls of NBP
In a scenario of rapidly changing climate it is particularly important to assess how the sensitivity of NBP to the different drivers has been changing over time and in which geographic regions. To this end, Fig. 4 summarises global maps of the average values (panels a, c and e) and temporal trends (panels b, d and f) of the regression coefficients that can be ultimately interpreted as sensitivities to climate drivers. Regressions have been computed at 7 d temporal resolution and for the all-year period.
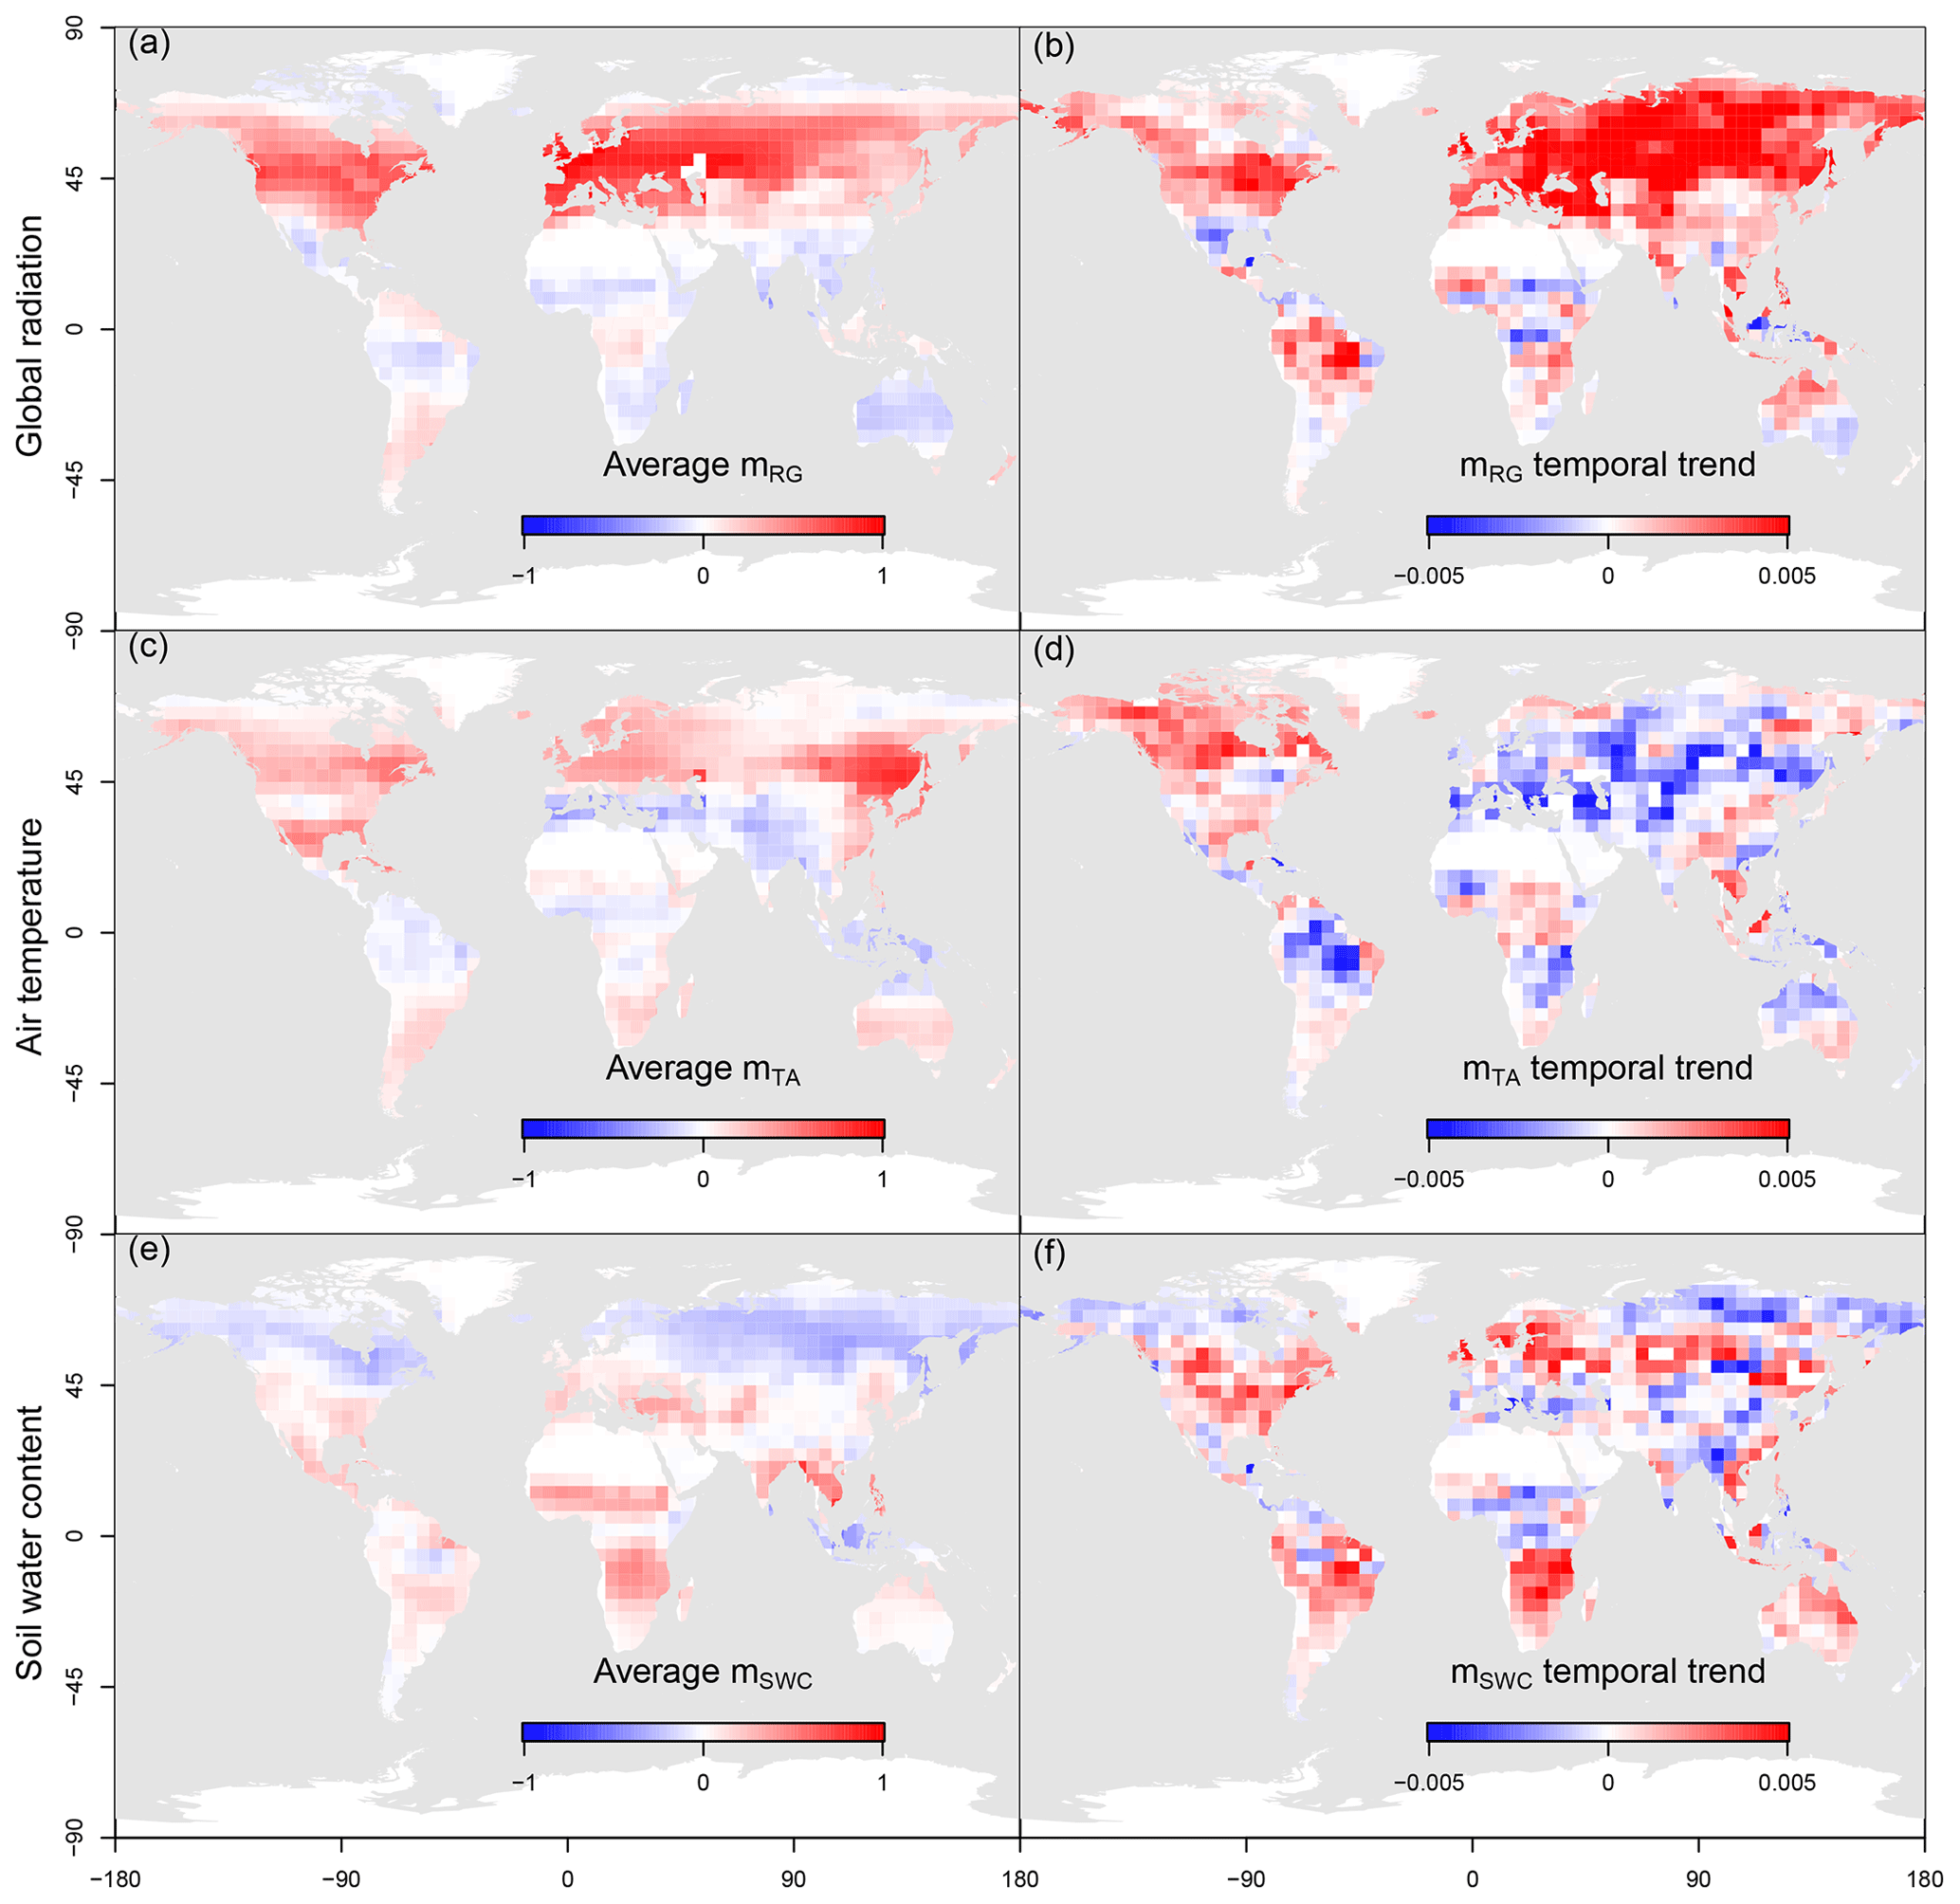
Figure 4Maps of magnitude (a, c, e) and trends (b, d, f) of the sensitivity of net biome productivity (NBP) to global radiation (a, b), air temperature (c, d) and soil water content (e, f) at a weekly timescale.
Concerning radiation, the positive sensitivity shown in Fig. 1 and in Fig. 4a is increasing in time (Fig. 4b) in most of the Northern Hemisphere. This positive trend observed in the last 3 decades is likely due to the increasing leaf area index (LAI) and primary productivity of the northern regions, leading to increased light use efficiency and therefore to a stronger control of NBP by light. Conversely, in the Southern Hemisphere the average sensitivity to radiation is mostly negative and the trends are heterogeneous since light may exert a negative indirect effect on the carbon budget in warm/arid climates.
A mostly positive sensitivity of NBP to soil water content occurs in arid regions, where evapotranspiration is supply limited and water stress may limit productivity. Conversely, in northern regions, where evaporation is limited by atmospheric demand, the sensitivity is negative (Fig. 4e). The trend in the sensitivity to water availability does not show a clear spatial pattern, likely due to the complex interplay between changes in precipitation and evapotranspiration in the different regions. Ultimately the sensitivity is likely to decrease where water availability is increasing, and it may increase in areas that are experiencing increasing water stress (Fig. 4f).
This analysis was repeated with five other inversion products to check for result consistency. We observed a low standard deviation of NBP sensitivity to climate drivers among products (Fig. S3, second column) and an overall agreement in terms of temporal trends of these sensitivities over most of the land surface (Fig. S3, third column).
In order to explore the relationships between sensitivities, trends and background climate, results shown in the global maps of Fig. 4 are summarised according to climate coordinates (i.e. annual cumulative rainfall and mean temperature, Fig. 5). A clear pattern emerges for radiation, with negative sensitivities in regions with high and very low temperatures, independently from precipitation values, while at intermediate temperatures radiation has a consistent positive effect on carbon fluxes. Figure 5 shows that the climate dependence of the trend in sensitivity to radiation generally follows the pattern of the mean sensitivity, with positive trends in climate regions characterised by positive sensitivity and vice versa. Ultimately this combination of mean effects and trends increases the spatial variance in the ecosystem response to light, amplifying the differences between regions with positive and negative controls.
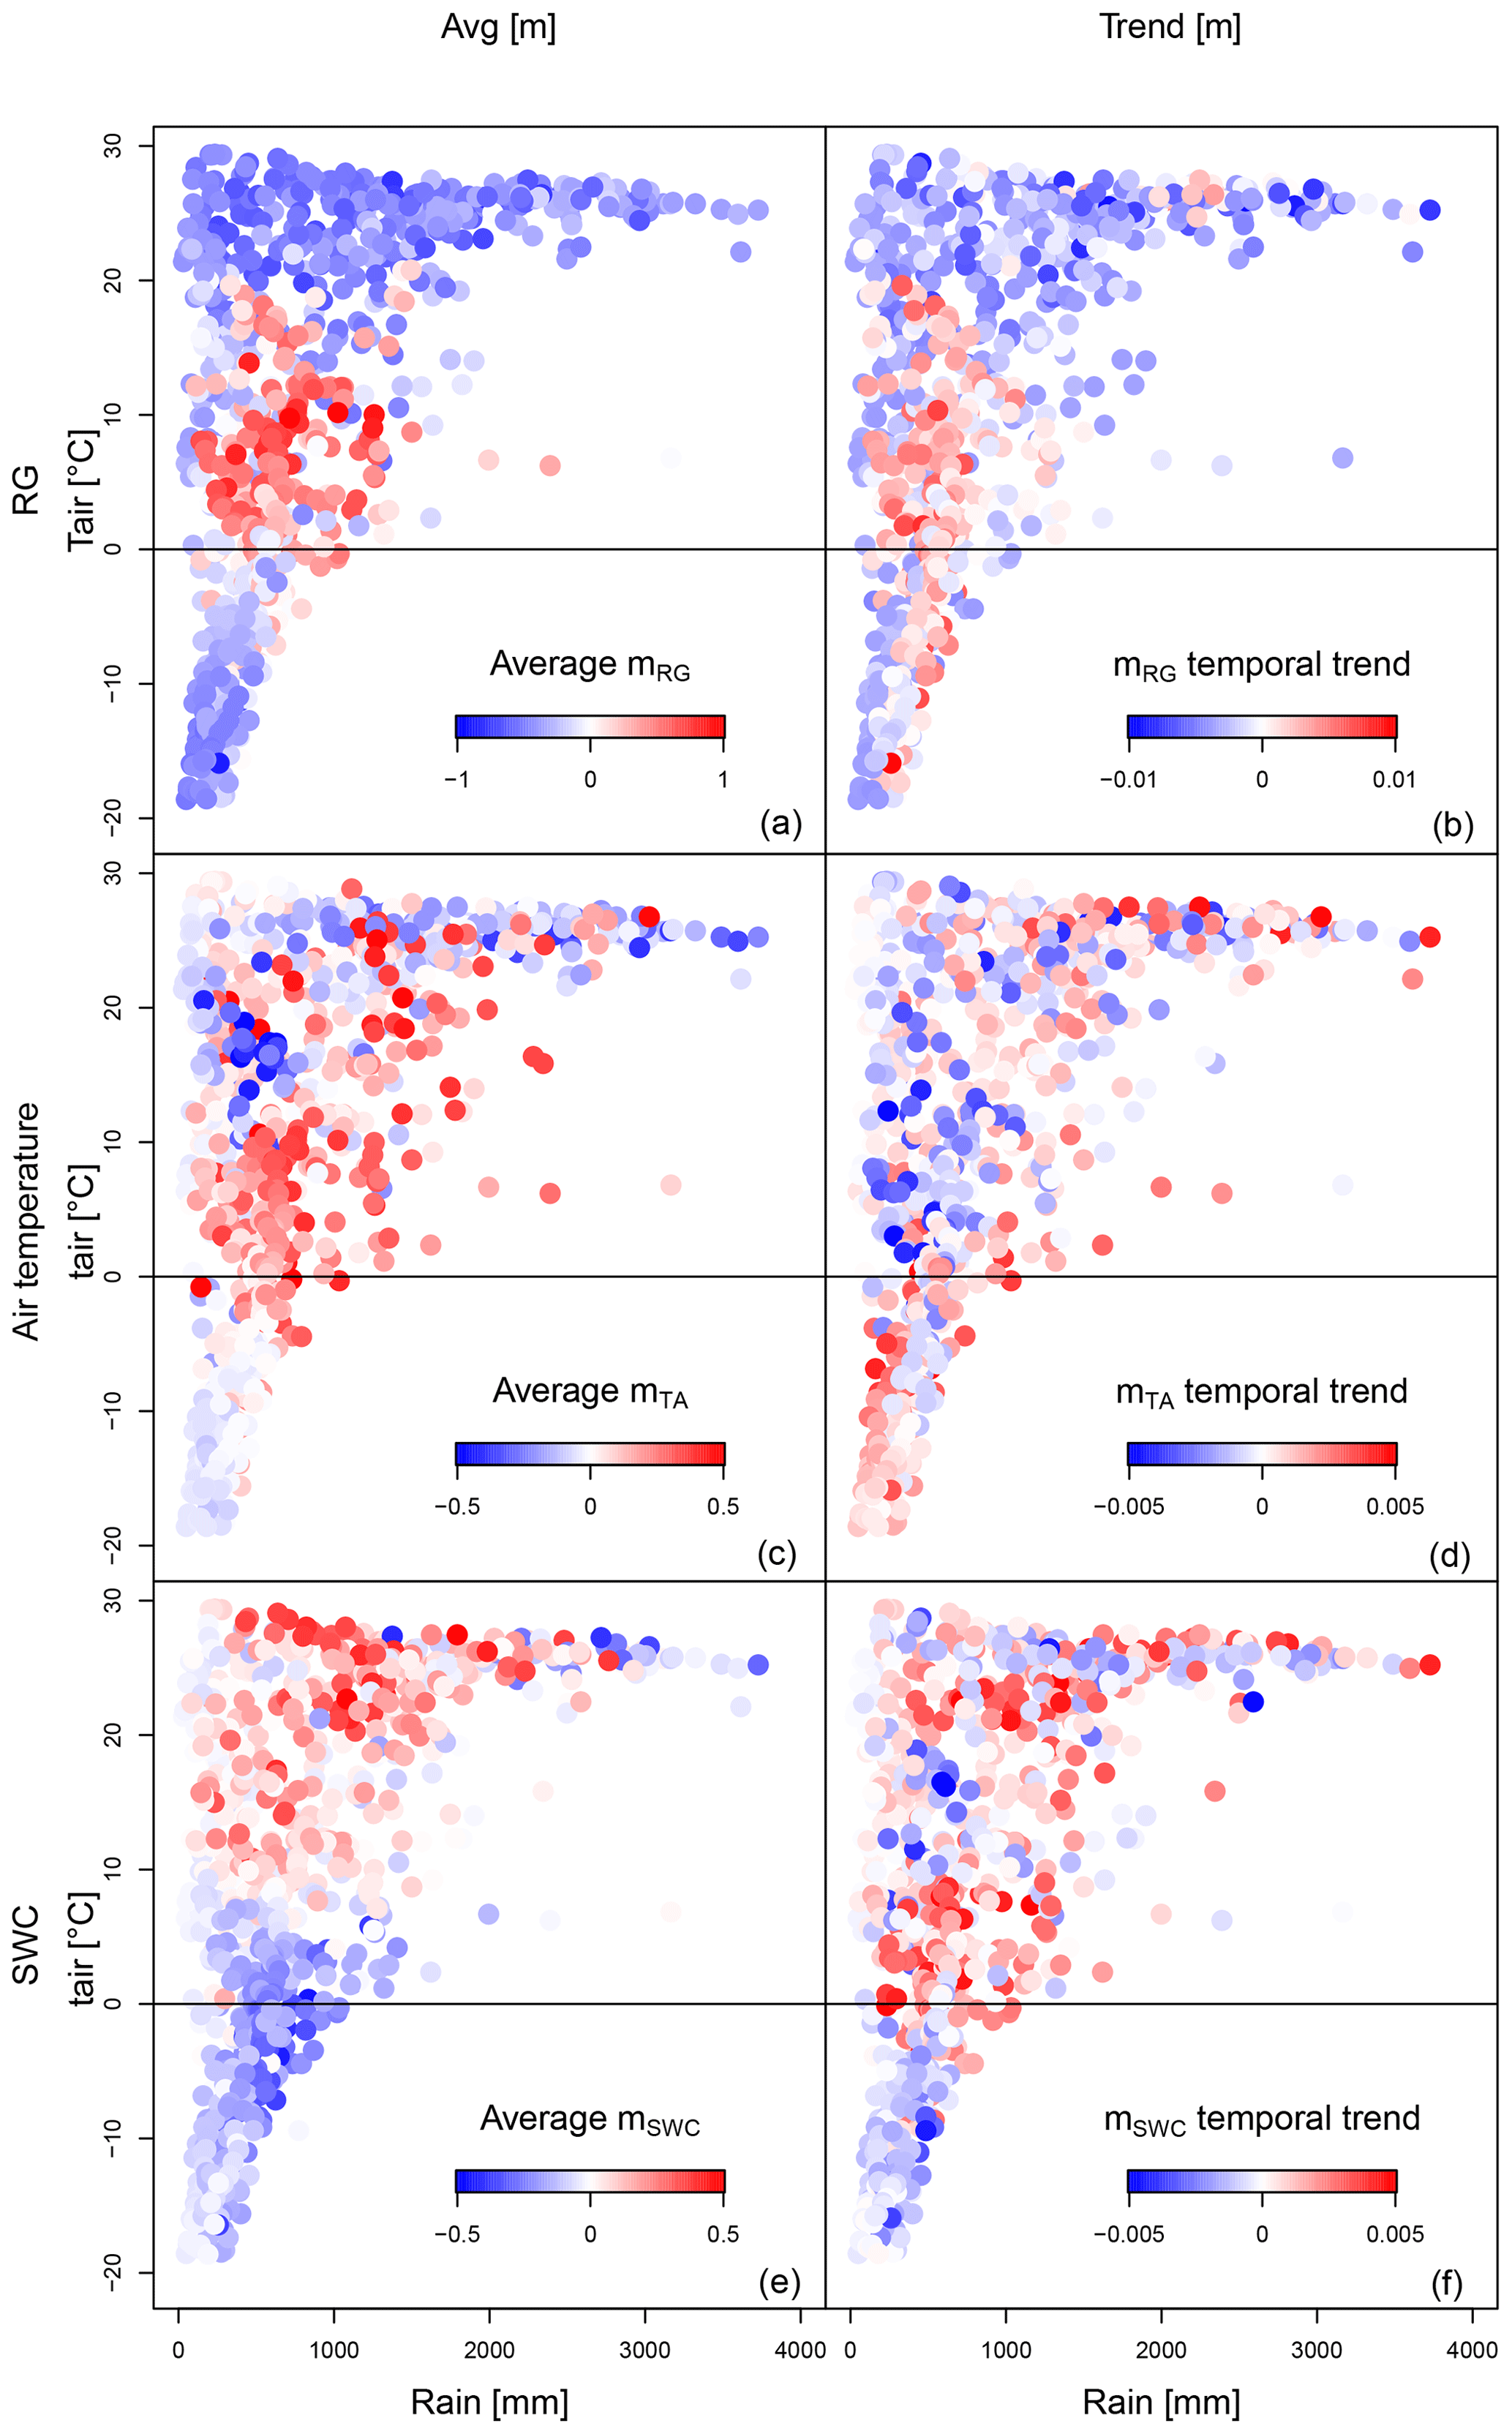
Figure 5Scatter plots of sensitivity to climate drivers (a, c, e) and of trends of the sensitivities (b, d, f) plotted in a precipitation–temperature space at a weekly timescale.
Similarly to radiation, temperature also shows positive sensitivities at intermediate mean temperatures. However, the different patterns of temperature and radiation trends suggest that the underlying processes triggered by the two drivers are likely different. In fact, the climate dependence of the trend in sensitivity to temperature does not follow the pattern of the mean sensitivity, being opposite in sign at intermediate temperatures and leading in this way to a homogenisation of its spatial variability. The sign and magnitude of the sensitivity of NBP to soil water content are clearly controlled by the background mean temperature, with a sharp threshold at about 7 ∘C between regions with positive and negative sensitivity. On average the sensitivity to soil water content is increasing in regions warmer than 0 ∘C, but with considerable local variation, suggesting in general an increasing impact of water limitations on the fluctuations of the terrestrial carbon cycle, as also reported by Jung et al. (2017). It is interesting to highlight the positive trend of the soil water control in cold climates (temperature between −2 and 7 ∘C), where historically the mean signal has been negative. This finding is in agreement with the recent literature about the increasing control of soil water content on the NBP of boreal ecosystems (Buermann et al., 2018; Lian et al., 2020).
Analysing the trends of NBP sensitivity to climatic drivers separately for CUP and CRP (Fig. 6) we noticed that the importance of radiation increases in most of the Northern Hemisphere in both periods, suggesting an overall increase in the occurrence of light-limited photosynthesis. This is likely due to a combination of warming, nitrogen deposition and CO2 fertilisation that has led to an extended growing season length and greening. In particular, the large increase in the sensitivity to radiation (likely related to the greening of the planet, as suggested by the spatial patterns of LAI trends reported by Zhu et al., 2016) dominates the radiation-related changes in NBP. The increase in light limitation goes hand in hand with the decline of temperature limitation, in particular during the CRP in Eurasia. Opposite trends of sensitivity to radiation and temperature also occur in the Amazon, where during the CUP we observe an increasing control of radiation and decreasing control of temperature and the opposite during CRP.

Figure 6Maps of sensitivity temporal trends separately shown for the carbon uptake period (CUP, a, c, e) and carbon release period (CRP, b, d, f) at a weekly timescale. Maps are plotted for global radiation (a, b), air temperature (c, d) and soil water content (e, f).
Finally, we factored out the observed total temporal variability in NBP in two components: the variability due to the temporal change in the drivers and that due to variations in the ecosystem response to drivers (i.e. ecosystem sensitivity to climate). Results show that the average contribution of the temporal change in sensitivity (Fig. 7a, c, e) is on average much larger than the contribution of the driver variability (Fig. 7b, d, f). This means that indirect climate effects, leading to a change in ecosystem sensitivity (e.g. aridity that increases the NBP sensitivity to water availability), are extremely relevant in determining the overall variability of the global NBP and may eventually amplify (when the two components have the same sign) or dampen (when opposite in sign) the effect of variation in climate drivers on terrestrial ecosystems.
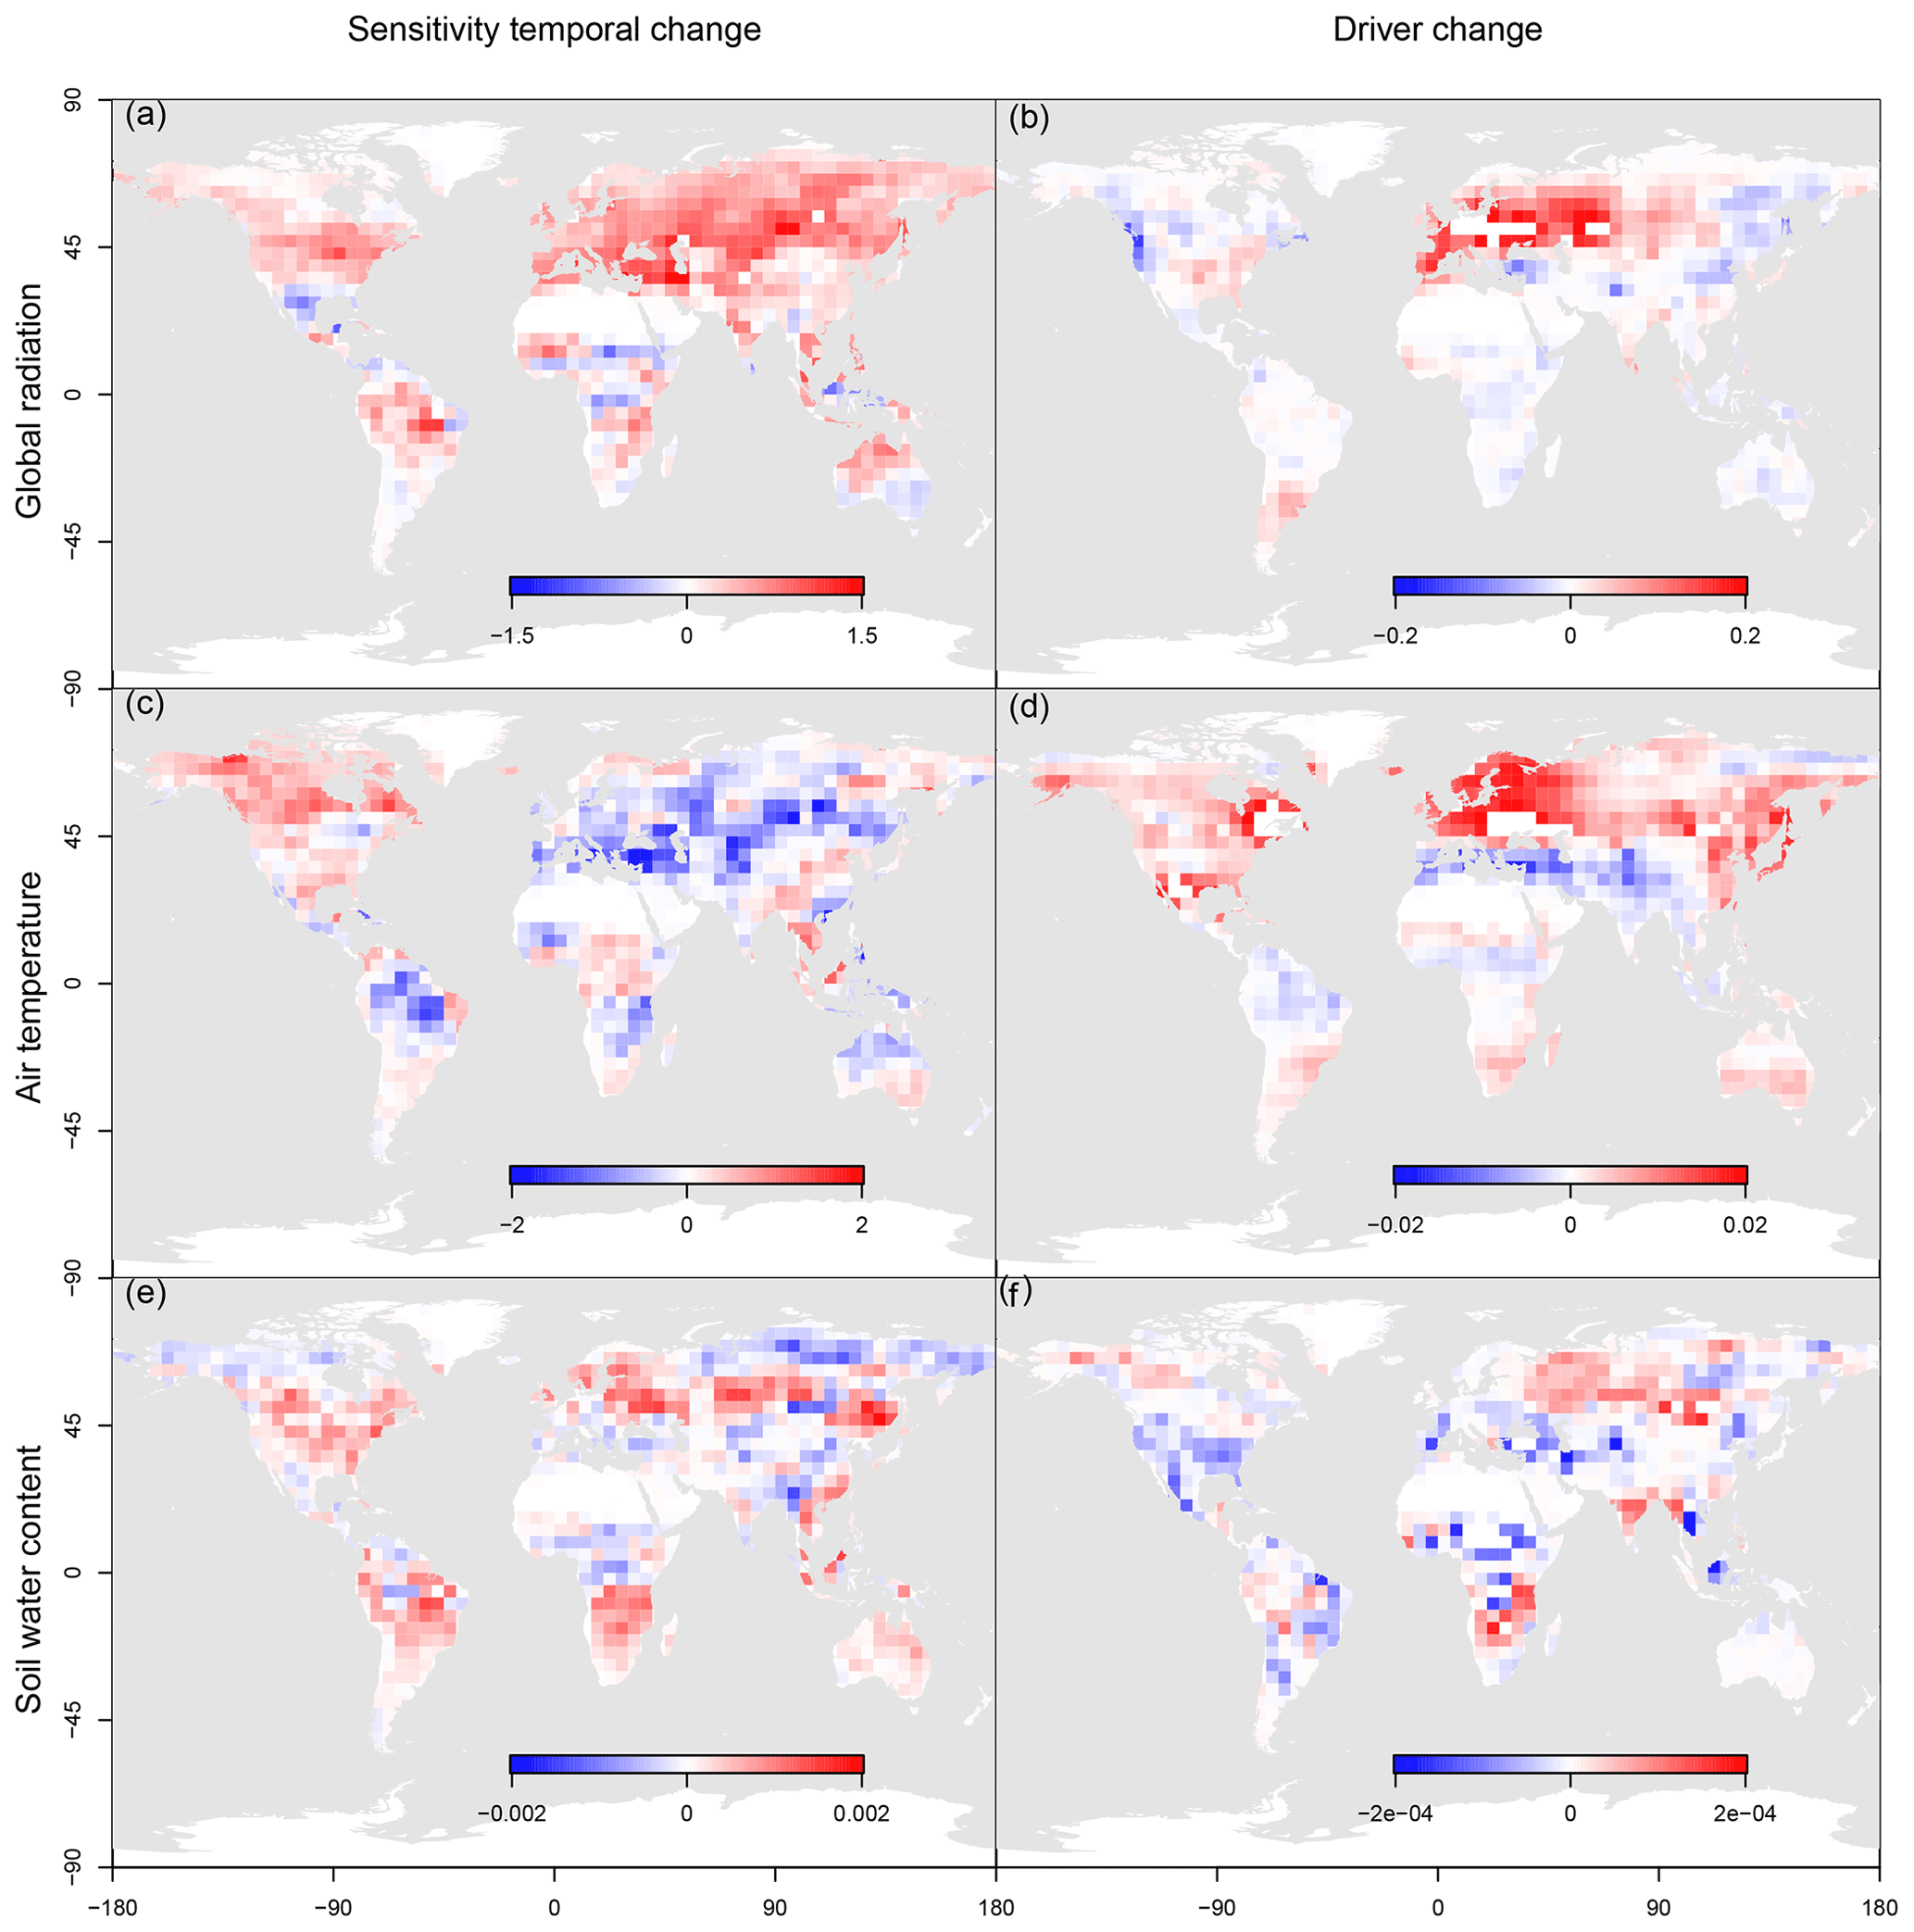
Figure 7Maps of the average contribution of sensitivity temporal change (a, c, e) and of the temporal change of the driver (b, d, f) to the total temporal variability of net biome productivity (NBP) in the investigated period. Maps are plotted for global radiation (a, b), air temperature (c, d) and soil water content (e, f).
4.1 Potential and limitations of the methodology
The analysis presented in this contribution largely builds on the data-driven estimates of NBP performed with the inversion of a global atmospheric transport model constrained by observations of atmospheric CO2 concentrations. For this reason, the strengths and weaknesses of the study are related to those of the underlying NBP data product.
On the one hand, the atmospheric inversion technique offers the advantage for the specific goals of this assessment that the fluxes at any location are detected by the observational network and can be spatially attributed on large scales. That is, the results are not limited by an incomplete representation of ecosystems that may be inherent in estimates based on point-level NBP observations. In addition, the inversion estimates cover more than 3 decades, representing the longest time series of spatially explicit, observation-driven estimates of the terrestrial carbon fluxes. A third specific advantage of the Jena CarboScope Inversion framework is that both the observation network (i.e. the number and location of atmospheric stations) and the prior fluxes are constant during the simulation period. Consequently, temporal changes in the estimated NBP are most directly driven by the atmospheric concentration field.
On the other hand, the inversion estimates of ecosystem CO2 fluxes are affected by uncertainties. Probably the largest source of uncertainty is represented by transport model errors, in particular vertical mixing. Transport model errors are expected to affect mean fluxes and the amplitude of flux variations, but they are likely also time-dependent themselves. Further, errors in the estimates of anthropogenic fluxes directly affect NBP estimates as the atmospheric signals reflect the total surface flux, including anthropogenic emissions of CO2. Additional limitation of the inversion estimates is that prior fluxes are generated with a land surface model (Sitch et al., 2003) which embeds a priori knowledge of the relationship between climate drivers and terrestrial CO2 fluxes. As such, prior estimates may affect the mean sensitivities shown in Figs. 1 to 3, while they do not affect the trends shown in the other figures given that the priors are mean annual climatology of modelled land fluxes and therefore do not show a temporal trend. Finally, inversion estimates cannot distinguish between the counteracting CO2 fluxes originated from photosynthesis and respiration and can therefore provide only limited insights into the factors controlling the individual ecosystem processes. As a proxy, we therefore analysed NBP during the CUP and CRP that are dominated by photosynthesis and respiration, respectively. However, the signal in these two sub-periods is actually affected by both GPP and TER and therefore the results cannot be interpreted as if they were originated by single processes. For instance the observed dominant role of light during CRP suggests that it is actually the light limitation of GPP that is controlling the rapid fluctuation of NBP off season.
The overall structural uncertainty of Jena CarboScope was evaluated by comparing runs of the same inversion system performed with a different number of atmospheric stations (and therefore temporal coverage). Further, uncertainties due to statistical assumptions in the a priori error covariance structure were evaluated by varying the assumed de-correlation lengths or other covariance parameters.
4.2 Spatial patterns of climatic controls on NBP
The global distribution of the limiting factors of the net biome productivity shows a high level of spatial coherence, so that large regions are controlled by a specific environmental factor, varying with the climate background. The most common driver of the short-term fluctuations in NBP is radiation, with positive correlation in most of the Northern Hemisphere. This pattern is likely due to the favourable growing conditions in the temperate zone, where weekly to seasonal variations in the ecosystem CO2 flux are controlled by light-limited GPP. Conversely, negative correlations dominate in the Southern Hemisphere, likely due to unfavourable growing conditions during the sunny and dry season. Surprisingly the northernmost latitudes also show a negative correlation to radiation, suggesting a negative impact of sunny weather on the carbon budget, in line with recent findings about the reduction of NBP in the boreal zone, due to the anticipated phenology that reduces the uptake in summer (Buermann et al., 2018; Lian et al., 2020). This finding is of particular relevance since those regions are exposed to accelerated warming (IPCC, 2014) and store large quantities of carbon in the terrestrial ecosystems (Carvalhais et al., 2014).
The second most important driver of short-term NBP fluctuations is temperature, with a positive correlation in most regions of the Southern Hemisphere at all the investigated temporal scales. This suggests that tropical ecosystems are still operating below their optimal temperature, as suggested by Huang et al. (2019). The sensitivity to soil water content shows the expected strong positive control on NBP in warm and arid regions. A similar reduction in NBP due to soil moisture limitation and the non-linear response of carbon uptake to water stress were reported by Seddon et al. (2016) and agree with what was observed by Green et al. (2019) analysing outputs from four Earth system models. According to this study the most affected regions are those characterised by seasonally dry climate, like tropical savannahs and semi-arid monsoonal regions. A faster atmospheric CO2 growth rate in drier periods is also reported in Humphrey et al. (2018), who conclude that drier years are associated with a weakening of the land carbon sink.
Our results differ substantially from the outcome of a previous study on the potential climatic constraint on net primary production (NPP) (Nemani et al., 2003) based on monthly climate statistics and remote sensing observations of vegetation over 2 decades (1982–1999). In addition to the different methodologies used in the two studies, it is important to stress that our assessment addresses NBP and therefore also includes CO2 fluxes from heterotrophic respiration and disturbances, while the analysis by Nemani et al. (2003) was limited to primary productivity.
Additional insights into the environmental controls of NBP can be gained by assessing the fluxes for the periods when land is a net sink or a net source of CO2 (CUP and CRP, respectively). During CUP the strong control of temperature in the boreal zone is in accordance with a study performed on 23 FLUXNET sites that shows how variations in GPP at northern sites can be explained to a large extent by mean annual temperature (Reichstein et al., 2007). Rödenbeck et al. (2018), working at an inter-annual timescale, found similar positive relationships of NBP and temperature during spring and autumn in all northern extratropical land areas, a signal which is consistent with photosynthesis being temperature limited in this time of the year. In temperate regions the control of NBP during CUP is led by radiation, whereas in the tropical zone it is led by soil moisture.
The relative importance of radiation and temperature is reversed during the carbon release period, when the fluctuations in NBP are mostly controlled by the incoming radiation across most of the planet. However, during CRP radiation limits NBP in opposite directions in the two hemispheres: positive dependence in the light-limited boreal CRP and negative dependence in the water-limited austral CRP. An important variation in the sign of temperature control occurs between the CUP (positive relationship) and the CRP (negative control) (Figs. 2 and 3). This pattern is likely due to the positive response of both photosynthesis and ecosystem respiration to increasing temperatures (Barr et al., 2007; Krishnan et al., 2008; Reichstein et al., 2002; Ueyama et al., 2014). This asymmetry in the thermal response of the CO2 fluxes originating from photosynthesis and respiration is at the base of the large uncertainty of the terrestrial C budget under climate change (Friedlingstein et al., 2014).
4.3 Temporal variability of the key drivers
Robust and independent estimates of temporal changes in the limiting factors of NBP are particularly relevant, given the relevant changes in the climate drivers that have occurred in the last 3 decades (IPCC, 2014) and the uncertainties on the ecosystem responses to varying climate drivers. The strongest signal emerging from the analysis is the broad increase in the positive sensitivity to radiation during both CRP and CUP in the Northern Hemisphere, while it decreases in most of the Southern Hemisphere where the average signal is negative. This positive trend observed in the last 3 decades is likely due to the increasing leaf area index (LAI) and primary productivity of the northern regions (Zhu et al., 2016), leading to increased light use efficiency and therefore to a stronger control of radiation on NBP. For the interpretation of these results it is important to consider that the ecosystem carbon exchange is controlled by light only in ideal growing conditions, when neither temperatures nor water are limiting photosynthesis. The positive trend in sensitivity to solar radiation during CUP in the boreal zone can therefore be interpreted as a tendency toward improved growing conditions due to a reduction of low-temperature limitations. From the positive trends in light sensitivity observed here, one could infer that the recent changes in climate, CO2 concentration and nutrient availability have eased the growing conditions of plants (Nemani et al., 2003).
Interestingly, the trend in sensitivity to radiation generally follows the sign of the mean sensitivity, with positive trends in climate regions characterised by positive sensitivity and vice versa. This coherence between sensitivity and trend can likely be explained with the acceleration of the terrestrial carbon cycle that is inherently leading to an increased sensitivity of CO2 fluxes to drivers. Ultimately this phenomenon is leading to an increased spatial variance in the response of ecosystem to radiation.
Concerning temperature, in Eurasia the sensitivity of NBP is decreasing with time, in agreement with Piao et al. (2017), who report a declining temperature response of spring NPP ascribed to reduced chilling during dormancy and emerging light limitation. The sensitivity to soil water content is mostly increasing, in particular during CRP in most regions, except western Europe, in line with the recent findings by Buermann et al. (2018) about the increasing role of water limitation in the boreal zone. Soil water content also shows an increasing control on the seasonality of NBP in the US, South America and South Africa, confirming the increasing relevance of water stress for primary productivity (Humphrey et al., 2018; Jung et al., 2010) and control of arid zones on variability of the terrestrial carbon budget (Ahlstrom et al., 2015).
Finally, the analysis of the sources of variability of NBP revealed that the largest fraction of the signal is coming from the temporal variation in the ecosystem response to the environmental drivers and not from the variation in the drivers. Temporal variations in ecosystem responses may originate from structural and physiological changes in vegetation characteristics, eventually occurring in response to changing environmental conditions (Marcolla et al., 2011; Richardson et al., 2007). For instance, the large increase in the sensitivity to radiation could be due to the increase in LAI and subsequent increase in the fraction of absorbed radiation occurring in most of the Northern Hemisphere. Ultimately, indirect effects of climate on the ecosystem response to environmental drivers may amplify the overall impact of climate variability and trends on the future dynamic of the terrestrial carbon budget, posing further uncertainty on the efficacy and vulnerability of land-based mitigation strategies.
We focused this analysis on the climate drivers of the sub-annual variability of land CO2 fluxes, as derived from an atmospheric inversion system, in order to characterise the key driver in the different world regions and climates. The short-term drivers of NBP can be interpreted as the limiting factors of the ecosystem carbon budget at weekly to seasonal scale. The assessment of the dominant drivers and their temporal trends is essential to understand the potential impact of the changing climate on the terrestrial carbon budget, with the ultimate goal of reducing the large uncertainty about the role of land in future climate trajectories (Friedlingstein et al., 2014).
Given that the atmospheric inversion does not allow a direct separation of NBP in gross primary productivity and ecosystem respiration, we analysed two contrasting periods: the carbon uptake period (CUP) when NBP is dominated by photosynthesis and the carbon release period (CRP) when NBP is dominated by respiration. Results show drastic differences in the response of the terrestrial carbon budget to environmental drivers in the two periods. More specifically, during the CUP we detected three clear driving factors, temperature in the northernmost regions, radiation in the temperate regions and soil water content in the tropical region, with temperature being the most common driver. During the CRP a large fraction of the planet is radiation controlled, with positive correlation in the Northern Hemisphere and negative correlation in the Southern Hemisphere. This contrasting pattern is likely due to the off-season light-limited photosynthesis in the boreal hemisphere (triggering the positive correlation) and by the indirect negative effect of high radiation loads on photosynthesis in warm and arid regions of the Southern Hemisphere.
The rapid changes in the climate drivers and in ecosystem properties observed in the last decades (e.g. greening) have driven important changes in the climatic control of the net biome productivity. In particular, air temperature shows a positive correlation with NBP in Eurasia, but with a decline in sensitivity over time; conversely, sensitivity to radiation is increasing in almost the entire boreal hemisphere during both CUP and CRP, suggesting that NBP is becoming increasingly light limited at short timescales.
Factoring out the sources of temporal variability of NBP, we showed that ecosystem CO2 fluxes are controlled more by the temporal variation in the ecosystem sensitivities to climate drivers than by the temporal changes in the drivers. This finding suggests that the indirect impacts of climate change on the ecosystem sensitivity may actually be more relevant than the direct impact of the climate variability on the terrestrial CO2 fluxes. Ultimately, indirect climate effects may trigger an important amplification of direct climate impact on NBP, leading to unexpected and non-linear responses.
Overall this analysis shows the spatial complexity and the clear dependencies on the climate background of the environmental controls on the terrestrial carbon budget. The significant changes in the climate sensitivities that have occurred in the last 3 decades demonstrate the rapid, ongoing evolution of the relationships between climate and the terrestrial carbon budget. Advancing the knowledge on the limiting factors and their variation is an important step in understanding and predicting the impacts of climate change on the terrestrial carbon budget.
The Jena CarboScope database can be found at http://www.bgc-jena.mpg.de/CarboScope/ (Rödenbeck et al., 2003).
The WFDEI database can be found at http://www.eu-watch.org/data_availability (Weedon et al., 2014).
The ERA-Interim database can be found at https://www.ecmwf.int/en/forecasts/datasets/reanalysis-datasets/era-interim (Berrisford et al., 2011).
The supplement related to this article is available online at: https://doi.org/10.5194/bg-17-2365-2020-supplement.
AC and BM conceived the study and designed the methods. CR provided the Jena CarboScope data. BM performed the data analysis. AC and BM interpreted the results. MM and CR contributed to the improvement of the methods and to the interpretation of results. AC and BM wrote the manuscript with contributions from the other co-authors.
The authors declare that they have no conflict of interest.
This paper was edited by Paul Stoy and reviewed by three anonymous referees.
Ahlstrom, A., Raupach, M. R., Schurgers, G., Smith, B., Arneth, A., Jung, M., Reichstein, M., Canadell, J. G., Friedlingstein, P., Jain, a. K., Kato, E., Poulter, B., Sitch, S., Stocker, B. D., Viovy, N., Wang, Y. P., Wiltshire, A., Zaehle, S., and Zeng, N.: The dominant role of semi-arid ecosystems in the trend and variability of the land CO2 sink, Science, 348, 895–899, https://doi.org/10.1126/science.aaa1668, 2015.
Alkama, R. and Cescatti, A.: Biophysical climate impacts of recent changes in global forest cover, Science, 351, 600–604, https://doi.org/10.1126/science.aac8083, 2016.
Baldocchi, D.: Assessing the eddy covariance technique for evaluating carbon dioxide exchange rates of ecosystems: past, present and future, Glob. Chang. Biol., 9, 479–492, 2003.
Baldocchi, D., Falge, E., Gu, L., Olson, R., Hollinger, D., Running, S., Anthoni, P., Bernhofer, C., Davis, K., Evans, R., Fuentes, J., Goldstein, A., Katul, G., Law, B., Lee, X., Malhi, Y., Meyers, T., Munger, W., Oechel, W., Paw, K. T., Pilegaard, K., Schmid, H. P., Valentini, R., Verma, S., Vesala, T., Wilson, K., and Wofsy, S.: FLUXNET: A New Tool to Study the Temporal and Spatial Variability of Ecosystem–Scale Carbon Dioxide, Water Vapor, and Energy Flux Densities, B. Am. Meteorol. Soc., 82, 2415–2434, 2001.
Barichivich, J., Briffa, K. R., Myneni, R., van der Schrier, G., Dorigo, W., Tucker, C. J., Osborn, T. J., and Melvin, T. M.: Temperature and snow-mediated moisture controls of summer photosynthetic activity in northern terrestrial ecosystems between 1982 and 2011, Remote Sens., 6, 1390–1431, https://doi.org/10.3390/rs6021390, 2014.
Barr, A. G., Black, T. A., Hogg, E. H., Griffis, T. J., Morgenstern, K., Kljun, N., Theede, A., and Nesic, Z.: Climatic controls on the carbon and water balances of a boreal aspen forest, 1994–2003, Glob. Chang. Biol., 13, 561–576, https://doi.org/10.1111/j.1365-2486.2006.01220.x, 2007.
Beer, C., Reichstein, M., Tomelleri, E., Ciais, P., Jung, M., Carvalhais, N., Rödenbeck, C., Arain, M. A., Baldocchi, D., Bonan, G. B., Bondeau, A., Cescatti, A., Lasslop, G., Lindroth, A., Lomas, M., Luyssaert, S., Margolis, H., Oleson, K. W., Roupsard, O., Veenendaal, E., Viovy, N., Williams, C., Woodward, F. I., and Papale, D.: Terrestrial gross carbon dioxide uptake: global distribution and covariation with climate., Science, 329, 834–838, https://doi.org/10.1126/science.1184984, 2010.
Berrisford, P., Dee, D., Poli, P., Brugge, R., Fielding, K., Fuentes, M., Kallberg, P., Kobayashi, S., Uppala, S., and Simmons, A.: The ERA-Interim Archive, ERA Rep. Ser., 1, available at: https://www.ecmwf.int/node/8174 (last access: 14 April 2020), 2011 (data available at: https://www.ecmwf.int/en/forecasts/datasets/reanalysis-datasets/era-interim, last access: 14 April 2020).
Buermann, W., Forkel, M., O'Sullivan, M., Sitch, S., Friedlingstein, P., Haverd, V., Jain, A. K., Kato, E., Kautz, M., Lienert, S., Lombardozzi, D., Nabel, J. E. M. S., Tian, H., Wiltshire, A. J., Zhu, D., Smith, W. K., and Richardson, A. D.: Widespread seasonal compensation effects of spring warming on northern plant productivity, Nature, 562, 110–114, https://doi.org/10.1038/s41586-018-0555-7, 2018.
Carvalhais, N., Forkel, M., Khomik, M., Bellarby, J., Jung, M., Migliavacca, M., Mu, M., Saatchi, S., Santoro, M., Thurner, M., Weber, U., Ahrens, B., Beer, C., Cescatti, A., Randerson, J. T., and Reichstein, M.: Global covariation of carbon turnover times with climate in terrestrial ecosystems, Nature, 514, 213–217, https://doi.org/10.1038/nature13731, 2014.
Chu, H., Chen, J., Gottgens, J. F., Desai, A. R., Ouyang, Z., and Qian, S. S.: Response and biophysical regulation of carbon dioxide fluxes to climate variability and anomaly in contrasting ecosystems in northwestern Ohio, USA, Agr. Forest Meteorol., 220, 50–68, https://doi.org/10.1016/j.agrformet.2016.01.008, 2016.
Ciais, P., Reichstein, M., Viovy, N., Commission, A. E., and Granier, A.: Europe-wide reduction in primary productivity caused by the heat and drought in 2003, Nature, 437, 529–533, https://doi.org/10.1038/nature03972, 2005.
De Keersmaecker, W., Lhermitte, S., Tits, L., Honnay, O., Somers, B., and Coppin, P.: A model quantifying global vegetation resistance and resilience to short-term climate anomalies and their relationship with vegetation cover, Glob. Ecol. Biogeogr., 24, 539–548, https://doi.org/10.1111/geb.12279, 2015.
Duveiller, G., Forzieri, G., Robertson, E., Li, W., Georgievski, G., Lawrence, P., Wiltshire, A., Ciais, P., Pongratz, J., Sitch, S., Arneth, A., and Cescatti, A.: Biophysics and vegetation cover change: a process-based evaluation framework for confronting land surface models with satellite observations, Earth Syst. Sci. Data, 10, 1265–1279, https://doi.org/10.5194/essd-10-1265-2018, 2018.
Fernández-Martínez, M., Sardans, J., Chevallier, F., Ciais, P., Obersteiner, M., Vicca, S., Canadell, J. G., Bastos, A., Friedlingstein, P., Sitch, S., Piao, S. L., Janssens, I. A., and Peñuelas, J.: Global trends in carbon sinks and their relationships with CO2 and temperature, Nat. Clim. Chang., 9, 73–79, https://doi.org/10.1038/s41558-018-0367-7, 2019.
Friedlingstein, P., Bopp, L., Ciais, P., Dufresne, J.-L., Fairhead, L., Le Treut, H., Monfray, P., and Orr, J.: Positive feedback between future climate change and the carbon cycle, Geophys. Res. Lett., 28, 1543–1546, 2001.
Friedlingstein, P., Meinshausen, M., Arora, V. K., Jones, C. D., Anav, A., Liddicoat, S. K., and Knutti, R.: Uncertainties in CMIP5 climate projections due to carbon cycle feedbacks, J. Clim., 27, 511–526, https://doi.org/10.1175/JCLI-D-12-00579.1, 2014.
Friedman, J., Hastie, T., and Tibshirani, R.: Regularization Paths for Generalized Linear Models via Coordinate Descent, J. Stat. Softw., 33, 1–22, 2010.
Gareth, J., Witten, D., Hastie, T., and Tibshirani, R.: An Introduction to Statistical Learning with Applications in R, Springer Publishing Company, Incorporated., 2014.
Green, J. K., Seneviratne, S. I., Berg, A. M., Findell, K. L., Hagemann, S., Lawrence, D. M., and Gentine, P.: Large influence of soil moisture on long-term terrestrial carbon uptake, Nature, 565, 476–492, https://doi.org/10.1038/s41586-018-0848-x, 2019.
Heimann, M. and Körner, S.: The Global Atmospheric Tracer Model TM3: Model Description and User's Manual Release 3.8a, Max-Planck Institute, Jena, Ger., 2003.
Hijmans, R. J.: raster: Geographic Data Analysis and Modeling, R package version 2.6-7, available at: https://cran.r-project.org/package=raster (last access: 14 April 2020), 2017.
Huang, M., Piao, S., Ciais, P., Peñuelas, J., Wang, X., Keenan, T. F., Peng, S., Berry, J. A., Wang, K., Mao, J., Alkama, R., Cescatti, A., Cuntz, M., De Deurwaerder, H., Gao, M., He, Y., Liu, Y., Luo, Y., Myneni, R. B., Niu, S., Shi, X., Yuan, W., Verbeeck, H., Wang, T., Wu, J., and Janssens, I. A.: Air temperature optima of vegetation productivity across global biomes, Nat. Ecol. Evol., 3, 772–779, https://doi.org/10.1038/s41559-019-0838-x, 2019.
Humphrey, V., Zscheischler, J., Ciais, P., Gudmundsson, L., Sitch, S., and Seneviratne, S. I.: Sensitivity of atmospheric CO2 growth rate to observed changes in terrestrial water storage, Nature, 560, 628–631, https://doi.org/10.1038/s41586-018-0424-4, 2018.
IPCC: Climate Change 2014: Synthesis Report. Contribution of Working Groups I, II and III to the Fifth Assessment Report of the Intergovernmental Panel on Climate Change, edited by: Core Writing Team, Pachauri, R. K., and Meyer, L. A., IPCC, Geneva, Switzerland, 151 pp., 2014.
Jung, M., Reichstein, M., Ciais, P., Seneviratne, S. I., Sheffield, J., Goulden, M. L., Bonan, G., Cescatti, A., Chen, J., de Jeu, R., Dolman, A. J., Eugster, W., Gerten, D., Gianelle, D., Gobron, N., Heinke, J., Kimball, J., Law, B. E., Montagnani, L., Mu, Q., Mueller, B., Oleson, K., Papale, D., Richardson, A. D., Roupsard, O., Running, S., Tomelleri, E., Viovy, N., Weber, U., Williams, C., Wood, E., Zaehle, S., and Zhang, K.: Recent decline in the global land evapotranspiration trend due to limited moisture supply, Nature, 467, 951–954, https://doi.org/10.1038/nature09396, 2010.
Jung, M., Reichstein, M., Schwalm, C. R., Huntingford, C., Sitch, S., Ahlström, A., Arneth, A., Camps-Valls, G., Ciais, P., Friedlingstein, P., Gans, F., Ichii, K., Jain, A. K., Kato, E., Papale, D., Poulter, B., Raduly, B., Rödenbeck, C., Tramontana, G., Viovy, N., Wang, Y. P., Weber, U., Zaehle, S., and Zeng, N.: Compensatory water effects link yearly global land CO2 sink changes to temperature, Nature, 541, 516–520, https://doi.org/10.1038/nature20780, 2017.
Kalnay, E., Kanamitsu, M., Kistler, R., Collins, W., Deaven, D., Gandin, L., Iredell, M., Saha, S., White, G., Woollen, J., Zhu, Y., Chelliah, M., Ebisuzaki, W., Higgins, W., Janowiak, J., Mo, K. C., Ropelewski, C., Wang, J., Leetmaa, A., Reynolds, R., Jenne, R., and Joseph, D.: The NCEP/NCAR 40-year reanalysis project, B. Am. Meteorol. Soc., 77, 437–471, 1996.
Katul, G., Lai, C. T., Schäfer, K., Vidakovic, B., Albertson, J., Ellsworth, D., and Oren, R.: Multiscale analysis of vegetation surface fluxes: From seconds to years, Adv. Water Resour., 24, 1119–1132, https://doi.org/10.1016/S0309-1708(01)00029-X, 2001.
Krishnan, P., Black, T. A., Barr, A. G., Grant, N. J., Gaumont-Guay, D., and Nesic, Z.: Factors controlling the interannual variability in the carbon balance of a southern boreal black spruce forest, J. Geophys. Res.-Atmos., 113, 1–16, https://doi.org/10.1029/2007JD008965, 2008.
le Maire, G., Delpierre, N., Jung, M., Ciais, P., Reichstein, M., Viovy, N., Granier, A., Ibrom, A., Kolari, P., Longdoz, B., Moors, E. J., Pilegaard, K., Rambal, S., Richardson, A. D., and Vesala, T.: Detecting the critical periods that underpin interannual fluctuations in the carbon balance of European forests, J. Geophys. Res., 115, G00H03, https://doi.org/10.1029/2009JG001244, 2010.
Le Quéré, C., Andrew, R. M., Friedlingstein, P., Sitch, S., Hauck, J., Pongratz, J., Pickers, P. A., Korsbakken, J. I., Peters, G. P., Canadell, J. G., Arneth, A., Arora, V. K., Barbero, L., Bastos, A., Bopp, L., Chevallier, F., Chini, L. P., Ciais, P., Doney, S. C., Gkritzalis, T., Goll, D. S., Harris, I., Haverd, V., Hoffman, F. M., Hoppema, M., Houghton, R. A., Hurtt, G., Ilyina, T., Jain, A. K., Johannessen, T., Jones, C. D., Kato, E., Keeling, R. F., Goldewijk, K. K., Landschützer, P., Lefèvre, N., Lienert, S., Liu, Z., Lombardozzi, D., Metzl, N., Munro, D. R., Nabel, J. E. M. S., Nakaoka, S., Neill, C., Olsen, A., Ono, T., Patra, P., Peregon, A., Peters, W., Peylin, P., Pfeil, B., Pierrot, D., Poulter, B., Rehder, G., Resplandy, L., Robertson, E., Rocher, M., Rödenbeck, C., Schuster, U., Schwinger, J., Séférian, R., Skjelvan, I., Steinhoff, T., Sutton, A., Tans, P. P., Tian, H., Tilbrook, B., Tubiello, F. N., van der Laan-Luijkx, I. T., van der Werf, G. R., Viovy, N., Walker, A. P., Wiltshire, A. J., Wright, R., Zaehle, S., and Zheng, B.: Global Carbon Budget 2018, Earth Syst. Sci. Data, 10, 2141–2194, https://doi.org/10.5194/essd-10-2141-2018, 2018.
Lian, X., Piao, S., Li, L. Z. X., Li, Y., Huntingford, C., Ciais, P., Cescatti, A., Janssens, I. A., Peñuelas, J., Buermann, W., Chen, A., Li, X., Myneni, R. B., Wang, X., Wang, Y., Yang, Y., Zeng, Z., Zhang, Y., and McVicar, T. R.: Summer soil drying exacerbated by earlier spring greening of northern vegetation, Sci. Adv., 6, eaax0255, https://doi.org/10.1126/sciadv.aax0255, 2020.
Ma, S., Baldocchi, D. D., Xu, L., and Hehn, T.: Inter-annual variability in carbon dioxide exchange of an oak/grass savanna and open grassland in California, Agr. Forest Meteorol., 147, 157–171, https://doi.org/10.1016/j.agrformet.2007.07.008, 2007.
Marcolla, B., Cescatti, A., Manca, G., Zorer, R., Cavagna, M., Fiora, A., Gianelle, D., Rodeghiero, M., Sottocornola, M., and Zampedri, R.: Climatic controls and ecosystem responses drive the inter-annual variability of the net ecosystem exchange of an alpine meadow, Agr. Forest Meteorol., 151, 1233–1243, https://doi.org/10.1016/j.agrformet.2011.04.015, 2011.
Migliavacca, M., Reichstein, M., Richardson, A. D., Colombo, R., Sutton, M. A., Lasslop, G., Tomelleri, E., Wohlfahrt, G., Carvalhais, N., Cescatti, A., Mahecha, M. D., Montagnani, L., Papale, D., Zaehle, S., Arain, A., Arneth, A., Black, T. A., Carrara, A., Dore, S., Gianelle, D., Helfter, C., Hollinger, D., Kutsch, W. L., Lafleur, P. M., Nouvellon, Y., Rebmann, C., Da Rocha, H. R., Rodeghiero, M., Roupsard, O., Sebastià, M., Seufert, G., Soussana, J., and Van Der Molen, M. K.: Semiempirical modeling of abiotic and biotic factors controlling ecosystem respiration across eddy covariance sites, Glob. Chang. Biol., 17, 390–409, https://doi.org/10.1111/j.1365-2486.2010.02243.x, 2011.
Migliavacca, M., Reichstein, M., Richardson, A. D., Mahecha, M. D., Cremonese, E., Delpierre, N., Galvagno, M., Law, B. E., Wohlfahrt, G., Andrew Black, T., Carvalhais, N., Ceccherini, G., Chen, J., Gobron, N., Koffi, E., Munger, W., Perez-Priego, O., Robustelli, M., Tomelleri, E., and Cescatti, A.: Influence of physiological phenology on the seasonal pattern of ecosystem respiration in deciduous forests, Glob. Chang. Biol., 21, 363–376, https://doi.org/10.1111/gcb.12671, 2015.
Nemani, R. R., Keeling, C. D., Hashimoto, H., Jolly, W. M., Piper, S. C., Tucker, C. J., Myneni, R. B., and Running, S. W.: Climate-Driven Increases in Global Terrestrial Net Primary Production from 1982 to 1999, Science, 300, 1560–1563, https://doi.org/10.1126/science.1082750, 2003.
Papagiannopoulou, C., Miralles, D. G., Decubber, S., Demuzere, M., Verhoest, N. E. C., Dorigo, W. A., and Waegeman, W.: A non-linear Granger-causality framework to investigate climate–vegetation dynamics, Geosci. Model Dev., 10, 1945–1960, https://doi.org/10.5194/gmd-10-1945-2017, 2017.
Piao, S., Liu, Z., Wang, T., Peng, S., Ciais, P., Huang, M., Ahlstrom, A., Burkhart, J. F., Chevallier, F., Janssens, I. A., Jeong, S. J., Lin, X., Mao, J., Miller, J., Mohammat, A., Myneni, R. B., Peñuelas, J., Shi, X., Stohl, A., Yao, Y., Zhu, Z., and Tans, P. P.: Weakening temperature control on the interannual variations of spring carbon uptake across northern lands, Nat. Clim. Chang., 7, 359–363, https://doi.org/10.1038/nclimate3277, 2017.
Reich, P. B., Sendall, K. M., Stefanski, A., Rich, R. L., Hobbie, S. E., and Montgomery, R. A.: Effects of climate warming on photosynthesis in boreal tree species depend on soil moisture, Nature, 562, 263–267, https://doi.org/10.1038/s41586-018-0582-4, 2018.
Reichstein, M., Tenhunen, J. D., Roupsard, O., Ourcival, J. M., Rambal, S., Miglietta, F., Peressotti, A., Pecchiari, M., Tirone, G., and Valentini, R.: Severe drought effects on ecosystem CO2 and H2O fluxes at three Mediterranean evergreen sites: Revision of current hypotheses?, Glob. Chang. Biol., 8, 999–1017, https://doi.org/10.1046/j.1365-2486.2002.00530.x, 2002.
Reichstein, M., Papale, D., Valentini, R., Aubinet, M., Bernhofer, C., Knohl, A., Laurila, T., Lindroth, A., Moors, E., Pilegaard, K., and Seufert, G.: Determinants of terrestrial ecosystem carbon balance inferred from European eddy covariance flux sites, Geophys. Res. Lett., 34, L01402, https://doi.org/10.1029/2006GL027880, 2007.
Richardson, A. D., Hollinger, D. Y., Aber, J. D., Ollinger, S. V., and Braswell, B. H.: Environmental variation is directly responsible for short- but not long-term variation in forest-atmosphere carbon exchange, Glob. Chang. Biol., 13, 788–803, https://doi.org/10.1111/j.1365-2486.2007.01330.x, 2007.
Richardson, A. D., Keenan, T. F., Migliavacca, M., Ryu, Y., Sonnentag, O., and Toomey, M.: Climate change, phenology, and phenological control of vegetation feedbacks to the climate system, Agr. Forest Meteorol., 169, 156–173, https://doi.org/10.1016/j.agrformet.2012.09.012, 2013.
Rödenbeck, C., Houweling, S., Gloor, M., and Heimann, M.: CO2 flux history 1982–2001 inferred from atmospheric data using a global inversion of atmospheric transport, Atmos. Chem. Phys., 3, 1919–1964, https://doi.org/10.5194/acp-3-1919-2003, 2003 (data available at: http://www.bgc-jena.mpg.de/CarboScope/, last access: 14 April 2020).
Rödenbeck, C., Zaehle, S., Keeling, R., and Heimann, M.: How does the terrestrial carbon exchange respond to inter-annual climatic variations? A quantification based on atmospheric CO2 data, Biogeosciences, 15, 2481–2498, https://doi.org/10.5194/bg-15-2481-2018, 2018.
Ryu, Y., Berry, J. A., and Baldocchi, D. D.: What is global photosynthesis? History, uncertainties and opportunities, Remote Sens. Environ., 223, 95–114, https://doi.org/10.1016/j.rse.2019.01.016, 2019.
Seddon, A. W. R., Macias-Fauria, M., Long, P. R., Benz, D., and Willis, K. J.: Sensitivity of global terrestrial ecosystems to climate variability, Nature, 531, 229–232, https://doi.org/10.1038/nature16986, 2016.
Sippel, S., Zscheischler, J., and Reichstein, M.: Ecosystem impacts of climate extremes crucially depend on the timing, P. Natl. Acad. Sci. USA, 113, 5768–5770, https://doi.org/10.1073/pnas.1605667113, 2016.
Sitch, S., Smith, B., Prentice, I. C., Arneth, A., Bondeau, A., Cramer, W., Kaplan, J. O., Levis, S., Lucht, W., Sykes, M. T., Thonicke, K., and Venevsky, S.: Evaluation of ecosystem dynamics, plant geography and terrestrial carbon cycling in the LPJ dynamic global vegetation model, Glob. Chang. Biol., 9, 161–185, https://doi.org/10.1046/j.1365-2486.2003.00569.x, 2003.
Sitch, S., Friedlingstein, P., Gruber, N., Jones, S. D., Murray-Tortarolo, G., Ahlström, A., Doney, S. C., Graven, H., Heinze, C., Huntingford, C., Levis, S., Levy, P. E., Lomas, M., Poulter, B., Viovy, N., Zaehle, S., Zeng, N., Arneth, A., Bonan, G., Bopp, L., Canadell, J. G., Chevallier, F., Ciais, P., Ellis, R., Gloor, M., Peylin, P., Piao, S. L., Le Quéré, C., Smith, B., Zhu, Z., and Myneni, R.: Recent trends and drivers of regional sources and sinks of carbon dioxide, Biogeosciences, 12, 653–679, https://doi.org/10.5194/bg-12-653-2015, 2015.
Teklemariam, T. a., Lafleur, P. M., Moore, T. R., Roulet, N. T., and Humphreys, E. R.: The direct and indirect effects of inter-annual meteorological variability on ecosystem carbon dioxide exchange at a temperate ombrotrophic bog, Agr. Forest Meteorol., 150, 1402–1411, https://doi.org/10.1016/j.agrformet.2010.07.002, 2010.
Tramontana, G., Jung, M., Schwalm, C. R., Ichii, K., Camps-Valls, G., Ráduly, B., Reichstein, M., Arain, M. A., Cescatti, A., Kiely, G., Merbold, L., Serrano-Ortiz, P., Sickert, S., Wolf, S., and Papale, D.: Predicting carbon dioxide and energy fluxes across global FLUXNET sites with regression algorithms, Biogeosciences, 13, 4291–4313, https://doi.org/10.5194/bg-13-4291-2016, 2016.
Ueyama, M., Iwata, H., and Harazono, Y.: Autumn warming reduces the CO2 sink of a black spruce forest in interior Alaska based on a nine-year eddy covariance measurement, Glob. Chang. Biol., 20, 1161–1173, https://doi.org/10.1111/gcb.12434, 2014.
Weedon, G. P., Balsamo, G., Bellouin, N., Gomes, S., Best, M. J., and Viterbo, P.: The WFDEI meteorological forcing data set: WATCH Forcing Data methodology applied to ERA-Interim reanalysis data, Water Resour. Res., 50, 7505–7514, https://doi.org/10.1002/2014WR015638, 2014 (data available at: http://www.eu-watch.org/data_availability, last access: 14 April 2020).
Wohlfahrt, G., Hammerle, A., Haslwanter, A., Bahn, M., Tappeiner, U., and Cernusca, A.: Seasonal and inter-annual variability of the net ecosystem CO2 exchange of a temperate mountain grassland: effects of climate and management, J. Geophys. Res.-Atmos., 113, D08110, https://doi.org/10.1029/2007jd009286, 2008.
Wu, D., Zhao, X., Liang, S., Zhou, T., Huang, K., Tang, B., and Zhao, W.: Time-lag effects of global vegetation responses to climate change, Glob. Chang. Biol., 21, 3520–3531, https://doi.org/10.1111/gcb.12945, 2015.
Zhu, Z., Piao, S., Myneni, R. B., Huang, M., Zeng, Z., Canadell, J. G., Ciais, P., Sitch, S., Friedlingstein, P., Arneth, A., Cao, C., Cheng, L., Kato, E., Koven, C., Li, Y., Lian, X., Liu, Y., Liu, R., Mao, J., Pan, Y., Peng, S., Peuelas, J., Poulter, B., Pugh, T. A. M., Stocker, B. D., Viovy, N., Wang, X., Wang, Y., Xiao, Z., Yang, H., Zaehle, S., and Zeng, N.: Greening of the Earth and its drivers, Nat. Clim. Chang., 6, 791–795, https://doi.org/10.1038/nclimate3004, 2016.