the Creative Commons Attribution 4.0 License.
the Creative Commons Attribution 4.0 License.
 | 29 Jun 2020
Decoupling of ΔO2∕Ar and particulate organic carbon dynamics in nearshore surface ocean waters
Sarah Z. Rosengard
Robert W. Izett
William J. Burt
Nina Schuback
Philippe D. Tortell
We report results from two Lagrangian drifter surveys off the Oregon coast, using continuous shipboard sensors to estimate mixed-layer gross primary productivity (GPP), community respiration (CR), and net community production (NCP) from variations in biological oxygen saturation (ΔO2∕Ar) and optically derived particulate organic carbon (POC). At the first drifter survey, conducted in a nearshore upwelling zone during the development of a microplankton bloom, net changes in ΔO2∕Ar and [POC] were significantly decoupled. Differences in GPP and NCP derived from ΔO2∕Ar (NCP) and POC (NCPPOC) time series suggest the presence of large POC losses from the mixed layer. At this site, we utilized the discrepancy between NCP and NCPPOC, and additional constraints derived from surface water excess nitrous oxide (N2O), to evaluate POC loss through particle export, DOC production, and vertical mixing fluxes. At the second drifter survey, conducted in lower-productivity, density-stratified offshore waters, we also observed offsets between ΔO2∕Ar and POC-derived GPP and CR rates. At this site, however, net [POC] and ΔO2∕Ar changes yielded closer agreement in NCP estimates, suggesting a tighter relationship between production and community respiration, as well as lower POC loss rates. These results provide insight into the possibilities and limitations of estimating productivity from continuous underway POC and ΔO2∕Ar data in contrasting oceanic waters. Our observations support the use of diel POC measurements to estimate NCP in lower-productivity waters with limited vertical carbon export and the potential utility of coupled O2 and optical measurements to estimate the fate of POC in high-productivity regions with significant POC export.
- Article
(518 KB) - Full-text XML
-
Supplement
(554 KB) - BibTeX
- EndNote


Marine primary productivity provides the main source of organic carbon to the ocean, supporting the vast majority of marine ecosystem biomass. On short timescales, a large fraction of this fixed organic carbon is converted back to CO2 through community respiration (CR). The difference between gross primary productivity (GPP) and CR – net community production (NCP) – sets an upper limit on the quantity of particulate organic carbon that can be exported out of the mixed layer as sinking particles, transferred to the dissolved organic carbon (DOC) pool, or consumed by upper trophic levels. Accurate assessment of NCP is thus critical to understanding trophic balance and the fate of organic carbon in the surface ocean. Traditional incubation-based approaches to quantify GPP, net primary productivity (NPP), and CR are labor-intensive and prone to sample containment artifacts (Gieskes et al., 1979; Fogg and Calvario-Martinez, 1989; Marra, 2009; Quay et al., 2010), such that NCP remains challenging to quantify on ecologically relevant time- and space scales.
In recent years, automated in situ measurements of seawater optical properties have been increasingly used to estimate gross and net primary productivity from changes in optically derived surface water particulate organic carbon (POC) concentrations (e.g., Graff et al., 2016; Burt et al., 2018). This approach is based on the relationship between POC concentrations and the particulate fraction of the beam attenuation coefficient (cp) (Siegel et al., 1989; Stramska and Dickey, 1992; Gardner et al., 1993; Claustre et al., 1999; Gernez et al., 2011), which can be used to resolve diurnal variations in POC. This diurnal variability results from the daytime accumulation of photosynthetically produced organic carbon, as well as nighttime loss of fixed carbon through community respiration, and can thus be used to infer NCP on daily timescales. The accuracy of this approach depends on the key assumption that variations in cp capture most of the variability in POC concentration, and it has been shown that beam attenuation is most sensitive to particles with a diameter range of 0.5–20 µm (Stramski and Kiefer 1991; Marra, 2002; Claustre et al., 2008). To date, most efforts to calculate daily NCP from cp variability have focused on low-productivity offshore regions, where particle sizes are small and POC losses through particle export are limited (Claustre et al., 2008; White et al., 2017). These studies have reported good agreement between optically derived GPP estimates and independent estimates of NPP from 14C incubations (White et al., 2017), suggesting a tight coupling between primary productivity and mixed-layer POC dynamics over daily timescales.
Another approach to NCP quantification is based on autonomous measurements of surface water dissolved-oxygen-to-argon ratios (O2∕Ar). Argon normalization is used to correct for any physically induced changes in O2 saturation, such that the derived saturation anomaly, ΔO2∕Ar, is a tracer of net biological O2 production (Kaiser et al., 2005; Tortell, 2005; Cassar et al., 2009). At steady state, and in the absence of significant lateral advection and vertical mixing, the sea–air flux of excess biologically produced O2 is equivalent to NCP. With the development of automated shipboard mass spectrometers, there has been a significant expansion of surface water O2∕Ar measurements. These data have been used to examine O2 variability resulting from diurnal variations of photosynthesis and respiration, as well as to infer NCP in a variety of oceanic ecosystems (Reuer et al., 2007; Stanley et al., 2010; Tortell et al., 2011, 2014; Hamme et al., 2012; Nicholson et al., 2015; Manning et al., 2017). Recent efforts have shown that NCP estimates from ΔO2∕Ar measurements can be corrected for vertical mixing using water column N2O measurements as a tracer (Cassar et al., 2014; Izett et al., 2018), but application of this methodology assumes that lateral advective fluxes of O2 are negligible.
Combined measurement of mixed-layer POC and O2 dynamics holds the potential to better constrain surface water carbon budgets in biogeochemically dynamic regions at high spatial and temporal resolution. In net autotrophic systems, an increase in ΔO2∕Ar reflects the accumulation of excess photosynthetic O2 in the mixed layer but provides no direct insight into the fate of the resulting organic carbon. In the absence of particle export, grazing or DOC production, an increase in ΔO2∕Ar, corrected for air–sea exchange and vertical mixing, should be matched by a parallel increase in POC accumulation measured by optical sensors. By comparison, high POC export, DOC production, or grazing coupled to vertical migrations would act to decouple ΔO2∕Ar from optically derived POC measurements in the mixed layer.
Previous authors have used simultaneous O2 and cp measurements on moorings to describe mixed-layer O2 and POC dynamics in various marine environments (Stramska and Dickey, 1992; Kinkade et al., 1999; Dickey and Chang, 2002). However, few studies to date have compared estimates of primary productivity from simultaneous measurements on daily timescales. Briggs et al. (2018) and Alkire et al. (2012) were the first to explicitly combine concurrent measurements of O2 and POC from in situ autonomous sensors to quantify mixed-layer productivity during a ∼2-month Lagrangian study of the 2008 North Atlantic spring bloom. Tracking daily changes in mixed-layer O2 and POC concentrations, Alkire et al. (2012) constructed a detailed budget of surface ocean organic carbon throughout the course of the bloom, using the difference between O2-based NCP and net POC accumulation to assess the partitioning of NCP into different carbon pools (sinking particles, phytoplankton biomass, and DOC). Building on this work, Briggs et al. (2018) examined the role of respiration, particle export, and DOC production in decoupling O2 and POC dynamics through different bloom stages, demonstrating significant differences between GPP estimates derived from O2, beam attenuation, and backscatter measurements. To our knowledge, such a detailed examination of O2 and POC dynamics has not been reported for other marine systems.
Here, we present new results from a field study of diel variability in ΔO2∕Ar and optical properties in two contrasting nearshore regions of the subarctic North Pacific. Using shipboard automated sensors deployed along a Lagrangian drifter track, we resolved fine-scale temporal patterns in biological oxygen production and POC concentration in a high-productivity coastal upwelling zone over the continental slope and in lower-productivity stratified waters offshore. The biogeochemical differences between both sites provided a unique opportunity to compare GPP, CR, and NCP estimates derived from ΔO2∕Ar and POC in contrasting trophic regimes. We expected to observe significant differences between ΔO2∕Ar and POC-derived GPP, CR, and NCP estimates in the higher-productivity site, reflecting greater carbon export capacity and DOC production. By comparison, we hypothesized that discrepancies in these rates would be smaller at the lower-productivity site, reflecting a tighter coupling between O2 and POC dynamics.
The results of this investigation extend the results from the 2008 North Atlantic bloom to a high-productivity coastal upwelling environment where vertical mixing fluxes significantly influence the surface water mass balance. These dynamic systems play a disproportionately important role in marine biogeochemical cycling, but they pose significant challenges for interpreting time series of ecosystem metabolism. Furthermore, our study results further expand applications of a recent field approach to correcting NCP for vertical mixing (Izett et al., 2018), suggesting that this approach has significant merit in reconstructing productivity estimates from a variety of mixed-layer tracers. We discuss the implications of our coupled O2–POC measurements for understanding biological carbon cycling in marine waters and suggest some approaches to improve the utility of these measurements for evaluating the fate of marine primary productivity across marine trophic gradients.
2.1 Field site and Lagrangian surveys
Field studies were conducted on board the R/V Oceanus in August 2017, during a transect through the northeastern subarctic Pacific Ocean. Two Lagrangian drifters were deployed off the Oregon coast, allowing us to track diurnal patterns in phytoplankton productivity and particulate organic carbon cycling in two distinct water masses (Fig. 1). Underway temperature and salinity measurements, collected by a Sea-Bird SBE 45 thermosalinograph, as well as satellite- (Aqua MODIS) and ship-based chlorophyll-a (Chl-a) observations, were used to guide the specific location and timing of the drifter deployments. Drifter 1 was deployed on 20 August 2017 (∼ 09:30 PDT), ∼40 km from the Oregon coast (44.54∘ N, 124.58∘ W), in the vicinity of an upwelling feature detected based on low sea surface temperature (SST) and elevated salinity and [Chl-a]. The drifter, consisting of a beacon, GPS transmitter and 5 m drogue, was recovered at ∼ 18:30 on 23 August 2017 (44.40∘ N, 124.55∘ W) for a total deployment of 3 d and 9 h. Upon recovery, the drogue was missing, implying the potential for some erratic subsurface drifting (discussed below). Drifter 2 was deployed approximately 200 km from shore (43.75∘ N, 126.50∘ W) in a relatively warm and low-salinity water mass, with low Chl-a concentrations. This second drifter was deployed at ∼ 07:45 on 24 August 2017 and was recovered after 2 d and 6 h at ∼ 14:00 on 26 August 2017 at 43.80∘ N, 126.99∘ W. Because the R/V Oceanus lacks a dynamic positioning system, the ship was not always able to perfectly track the drifter locations. To correct for these positional offsets, we discarded any observations obtained when the ship was more than 1.5 km away from the drifter location. This filtered data set resulted in underway measurements (Sect. 2.2) every ∼15 min during the two drifter deployments, yielding 325 and 218 quality-controlled underway observations for drifters 1 and 2, respectively.
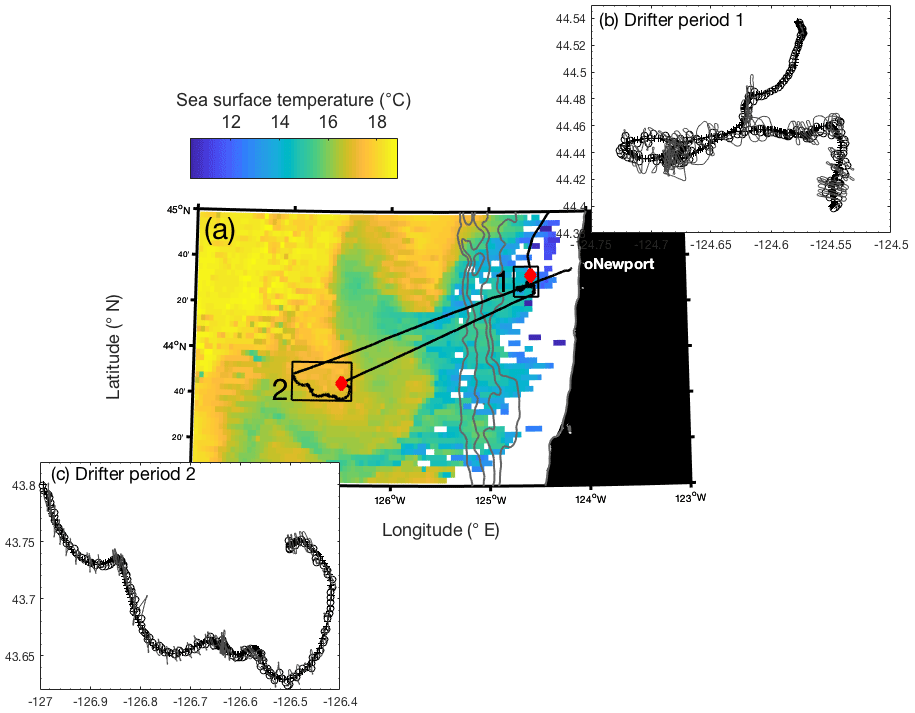
Figure 1(a) Map of Aqua MODIS-derived 8 d composite sea surface temperature (11 µm, nighttime) from 21 to 28 August 2017, overlapping with the duration of both drifter deployments. The two hollow boxes on the map denote the location of drifter tracks, with the red diamonds indicating the location of the initial release. Gray bathymetry contours represent 0, 500, 1000, 1500, and 2000 m depths. Panels (b) and (c) show a detailed view of the two drifter tracks (cross symbol), with the ship's track shown in a light gray line and open circles denoting times when the ship was <1.5 km away from the drifter position. Only measurements taken at these crossover locations were used for analysis.
2.2 Underway measurements
Continuous underway measurements of surface seawater optical properties were collected using Sea-Bird (formerly WET Labs) ECO-BB3 and ac-s sensors, following the methods outlined in detail by Burt et al. (2018). Water was collected from the ship's seawater supply system with a nominal intake of 5 m depth. Our instrument package included fully automated data collection and hourly filtered blanks (0.2 µm), which provided measurements of dissolved seawater optical properties used to infer particulate absorption (ap) and beam attenuation (cp) at 82 wavelengths between 400 and ∼735 nm, as well as backscatter (bbp) at 470, 532, and 650 nm. The BB3 and ac-s measurements were binned into 1 min intervals. Prior to binning, the absorption and beam attenuation data were first subsampled every 50 data acquisition cycles (∼12.5 s) to enable faster processing time. The optical measurements were accompanied by continuous surface photosynthetically active radiation (PAR) and wind speed data obtained from a Biospherical QSR-220 PAR sensor and Gill WindObserver II ultrasonic wind sensor mounted on the ship's bow.
Chlorophyll-a (Chl-a) concentrations were derived from the particulate absorption line height at 676 nm (aLH) (Roesler and Barnard, 2013). Five-minute matchups between underway aLH and discrete filtered [Chl-a] measurements from the entire cruise transect (Sect. 2.4) were used to derive a best-fit coefficient for the linear relationship between aLH and [Chl-a] (r2=0.87, n=58, p<0.01). Particulate organic carbon (POC) concentrations (µg L−1) were derived from particulate beam attenuation at 660 nm (cp,660), using the empirical model in Graff et al. (2015). Similarly, phytoplankton organic carbon (Cph) concentrations were calculated, using an empirical relationship between particulate backscatter at 470 nm (bbp,470) and [Cph] in micrograms per liter (µg L−1; Graff et al., 2015). We used a limited set of 5 m discrete measurements (n=6; Sect. 2.4) to evaluate the relationship between POC concentrations and cp at 660 nm, as well as the applicability of the Graff et al. (2015) model to our observations. As shown in Fig. S1 in the Supplement, the POC measurements were significantly correlated to cp (r2=0.88, p<0.05), with a slope and intercept of 391.6±201.6 and 36.7±79.1, respectively. This slope was not significantly different from that of the Graff et al. algorithm (419.8) although our y intercept was higher. Notwithstanding the relatively small number of discrete POC samples, and some scatter around the regression line, the similarity of our POC–cp calibration to that reported by Graff et al. (2015) suggests that our optically derived POC estimates are reasonably robust.
To obtain information on the particle size spectrum, we derived the wavelength-dependent slope of particulate backscatter by fitting the three bbp coefficients (470, 532, 650 nm) to an exponential equation (Stramska et al., 2003; Loisel et al., 2006; Kostadinov et al., 2009). Finally, to assess interference of inorganic minerals on POC, and Cph variability, we calculated the wavelength-specific bulk refractive index (ηp) from backscatter ∕ total scatter ratios and the wavelength-dependent cp slope, following the approach of Boss et al. (2001), Twardowski et al. (2001), and Sullivan et al. (2005).
In addition to optical measurements, the seawater biological oxygen saturation anomaly (ΔO2∕Ar) was measured at a ∼20 s resolution using a membrane inlet mass spectrometer connected to the ship's seawater intake. The seawater ratio of dissolved O2 and Ar was determined by diverting a continuous flow of water across a dimethylsilicone membrane interfaced with a Hiden Analytical HAL20 triple filter quadrupole mass spectrometer. The O2∕Ar ratio of air-equilibrated standards ([O2∕Ar]eq), incubated at ambient sea surface temperature, was measured every 2 h. Values of ΔO2∕Ar were thus calculated as the percent deviation of seawater O2∕Ar measurements from the air-equilibrated ratio, using (Tortell, 2005; Tortell et al., 2011).
2.3 Mixed-layer depth
Over the course of both drifter deployments, we conducted regular sampling casts (every 6 to 10 h) to examine depth profiles of seawater hydrography and biogeochemical variables. Temperature, salinity, dissolved O2 concentrations, and Chl-a fluorescence profile data from the CTD casts were measured by a Sea-Bird SBE 38 temperature sensor, Sea-Bird SBE 4 conductivity sensor, SBE 43 dissolved O2 sensor, and a Sea-Bird ECO fluorometer, respectively, and binned into 1 m intervals. Vertical profiles at the drifter 1 site showed relatively weak density stratification, likely as a result of recent upwelling. For this reason, we estimated mixed-layer depths (zmld) based on visible inflection points in the dissolved [O2], fluorescence, and density profiles, assuming that dissolved O2 concentrations and fluorescence are relatively uniform in the mixed layer. Within a single CTD cast, mixed-layer depths varied by up to 28 % across all three profile measurements. The [Chl-a] fluorescence profiles had the most well-defined inflection points, and we thus used these data to estimate zmld at all casts. Excluding fluorescence profiles from the first day (Sect. 3.1) and two casts at 06:00 and midnight on second and third 24 h intervals, respectively, which displayed relatively noisy density profiles, an average zmld value (19±2 m) was derived and applied to all subsequent analyses.
In comparison to the drifter 1 site, CTD cast profiles during drifter deployment 2 showed larger density gradients. We thus computed zmld using a density difference criterion of 0.25 kg m−3 (Thomson and Fine, 2003; de Boyer Montégut et al., 2004) from median values within the uppermost 4–6 m of the profile. We found that this critical density criterion was necessary to capture the depth of inflection in O2 and [Chl-a]. In all CTD casts except one, density difference-based zmld values were within 5 m of the values derived from the inflection points on density profiles. An average zmld value estimated from the density-difference approach (22±5 m) was applied to all subsequent analyses.
2.4 Discrete samples
Concentrations of phosphate ([]), dissolved silica ([SiO2]), and nitrate and nitrite ([]) were measured in seawater samples collected from daily Niskin bottle casts. Following collection, nutrient samples were filtered through 0.2 µm pore polycarbonate membranes and immediately frozen at −80 ∘C on board the ship. These samples were stored at −20 ∘C until subsequent colorimetric laboratory analyses (Murphy and Riley, 1962; Riley, 1977) with a Lachat QuikChem 8500 Series 2 Flow Injection Analysis System.
Concentrations of nitrous oxide (N2O) were measured in discrete samples collected in Niskin bottles during both drifter deployments (Fig. S2), following methods outlined in Capelle et al. (2015). These N2O measurements were used to correct NCP estimates for vertical mixing (see Sect. 2.6), following the approach described by Cassar et al. (2014) and Izett et al. (2018). Profile samples from the first day of drifter deployment 1 (20 August) were omitted from calculations, as underway surface temperature and salinity measurements indicated intrusion of an external water mass (further discussed in Sect. 3.1) (Fig. S3). Three profiles collected from 12:00 (PDT) CTD casts during the following 3 d of the deployment (21, 22, and 23 August) were applied to the NCP mixing correction at drifter station 1 (Sect. 2.6.1).
Surface (∼5 m) discrete seawater samples were collected either from Niskin bottles or from the ship's surface seawater intake system for high-performance liquid chromatography (HPLC) analysis of Chl-a concentrations and other phytoplankton pigments. Single or duplicate samples were filtered onto 25 mm GF/F filters, flash-frozen in liquid nitrogen, and stored at −80 ∘C until analysis, following the methodology described in Schuback et al. (2016). Additional samples were collected from the seawater intake for size-fractionated Chl-a analysis (Zeng et al., 2018). These samples were filtered through stacked 47 mm filters (0.2, 2 and 20 µm pore size) separated by a mesh spacer. Filtered samples were extracted in 5 mL of 90 % acetone at 4 ∘C until analysis within 24–48 h using a Turner Trilogy fluorometer on board the ship.
Discrete samples for POC analysis were collected at two depths from several CTD casts. Surface samples were collected at both drifter sites from 5 m depth, while deeper samples were collected at near the base of the euphotic zone (∼1 % PAR), corresponding to 40–60 m at drifter site 1 and 100–120 m at drifter site 2. POC samples (∼ 1–4 L) were filtered through a precombusted (450 ∘C) Whatman GF/F filter (nominal pore size ∼0.7 µm) and stored at −80 ∘C until laboratory analysis. Prior to analysis, samples were thawed and dried at 50 ∘C overnight, fumigated with concentrated hydrochloric acid for 48 h, and dried again at 50 ∘C overnight. POC concentrations in samples (and blank combusted filters treated as described above) were quantified using an Elementar vario MICRO cube CHNS analyzer. Blank-corrected discrete POC concentrations were used to validate application of the [POC] model in Graff et al. (2015) to our underway cp data (Sect. 2.2; Fig. S1).
2.5 Net primary productivity
Daily integrated net primary productivity (NPP) was calculated in two ways. First, carbon uptake was determined from 24 h 14C incubations with 5 m triplicate seawater samples collected from early morning CTD casts. Measurements were made on two different mornings during drifter deployment 1 and on one morning during drifter deployment 2. The measurements were conducted following the protocol outlined in Hoppe et al. (2017). Depth-integrated NPP was calculated by multiplying the derived 24 h volumetric carbon fixation rate by the average mixed-layer depth for the respective drifter period.
Second, daily integrated net primary productivity was also estimated as a product of [Cph] values derived from bbp and phytoplankton growth rates according to the carbon-based production model (CbPM) (Behrenfeld et al., 2005; Westberry et al., 2008; Graff et al., 2016; Burt et al., 2018). In these calculations, daily averaged [Cph], [Chl-a]∕[Cph], and mixed-layer irradiance (Eg) calculated from the MODIS-derived surface PAR matched to drifter location were used to calculate growth rates and NPP every 24 h. Chlorophyll-a concentrations were derived from absorption line height, [Cph] values from bbp (Sect. 2.2), and light extinction coefficients (Kd) obtained from [Chl-a] to calculate Eg (Morel et al., 2007). An average mixed-layer depth for each drifter period was applied to estimate mixed-layer NPP (Sect. 2.3).
2.6 Quantification of GPP, CR, and NCP
Gross primary productivity (GPP), community respiration (CR), and net community production (NCP) rates were calculated based on linear regressions of ΔO2∕Ar and POC against time (dt in units of days) over subsequent day (d) and night (n) intervals during both drifter deployments. Daytime was defined as the period during which PAR levels exceeded 20 µmol quanta m−2 s−1. The average length of the daytime period was 13.6±0.14 h over the two drifter deployments. In the following sections, td represents the day length normalized to 24 h, and tn analogously represents the fractional night length, equivalent to 1−td. All daily rates were integrated through the mixed layer using the average zmld for each drifter period, as described in Sect. 2.3.
2.6.1 O2∕Ar-derived rates
Quantification of GPP, CR, and NCP rates from diurnal cycles in ΔO2∕Ar (Ferrón et al., 2015) requires corrections for gas exchange and, potentially, vertical mixing fluxes. For these calculations, we first computed the rate of change in ΔO2∕Ar (dO2bio∕dt) using linear regression analysis within successive day or night intervals. We then derived estimates for the air–sea gas exchange (Jex) and vertical mixing fluxes (Fmix) over the respective time interval to isolate the NCP contribution to observed ΔO2∕Ar changes (Izett et al., 2018; Tortell et al., 2014). A negative Jex indicates net transfer of O2 from the atmosphere to the mixed layer, while a negative Fmix indicates vertical transfer of ΔO2∕Ar-depleted to the mixed layer, both in units of millimoles per square meter per day (mmol m−2 d−1). Gross O2 production rates were converted into carbon units using a photosynthetic quotient (PQ) for new production of 1.4 for drifter-period-1 calculations and a PQ for regenerated production of 1.1 for drifter period 2 (Laws, 1991). Community respiration rates were converted into carbon units using the same PQ values and considered constant over each respective day length period (i.e., td+tn). This assumption of an equivalent respiratory quotient (RQ) and PQ within each drifter period is reasonable given the wide range of respiration ratios reported in prior studies across a range of oceanic environments (Anderson and Sarmiento, 1994; Robinson and Williams, 1999; Robinson et al., 1999, 2002; Hedges et al., 2002; Lønborg et al., 2011; Daneri et al., 2012; Fernández-Urruzola et al., 2014). Moreover, Robinson and Williams (1999) estimated lower RQ values at lower-productivity stations in the Arabian Sea, suggesting that it is reasonable to assume a lower RQ value (equivalent to PQ = 1.1) at drifter site 2.
Equilibrium concentrations of O2 and N2O ([O2]eq and [N2O]eq) were calculated using the salinity- and temperature-dependent equations of Garcia and Gordon (1992) and Weiss and Price (1980), respectively, and sea surface temperature and salinity from the ship's thermosalinograph. Estimates of surface excess N2O saturation, [N2O]bio, included a heat flux correction to account for solubility changes (Keeling and Shertz, 1992; Jin et al., 2007; Izett et al., 2018). Nonweighted piston velocities ( and ; units of m d−1) were calculated using the diffusive air–sea gas flux and Schmidt number parameterizations of Wanninkhof (2014) and Raymond et al. (2012), as well as ship-based wind speed data 10 m above the sea surface. Daytime and nighttime estimates for the gas exchange term, Jex, were calculated using day or night average [O2]eq, ΔO2∕Ar, and values. Vertical gas gradients were estimated from our discrete N2O measurements and rosette O2 profiles over the upper 100 m of the water column, following Izett et al. (2018).
At drifter site 1, daily Fmix values were calculated using daily [N2O]bio, daily vertical gradient, and daily average values and converted to carbon units using a PQ of 1.4. Denitrification should not have been a source of N2O within the upper 100 m of the water column because measured O2 concentrations were consistently greater than the threshold value of ∼50 mmol m−3 (e.g., Hopkinson and Barbeau, 2007). Likewise, we assumed no lateral advection of N2O into drifter site 1, as there were little differences in the mixing ratio [O2]bio∕[N2O]bio across profile measurements (Fig. S2). While the 22 August CTD cast did exhibit a more anomalous [O2]bio∕[N2O]bio profile relative to the other two cast profiles, inclusion of these data had little impact on the vertical mixing correction. At drifter site 2, we assumed that vertical mixing was negligible due to the presence of strong density stratification and therefore did not calculate a mixing flux correction at this site. In any case, the presence of a subsurface O2 maximum (Fig. S2) at this site would limit the application of the N2O correction (Izett et al., 2018).
2.6.2 Optically derived rates
We used the approach of Claustre et al. (2008) and White et al. (2017) to calculate daily integrated GPPPOC, CRPOC, and NCPPOC from daytime and nighttime changes in POC (dPOC∕dt), derived from linear regressions of POC concentrations against time through day and night intervals. In certain ocean environments, NCPPOC will not equate to NCP as a result of additional POC sinks, including export, grazing, and DOC production. Under these conditions, CRPOC includes these loss terms, and therefore NCPPOC more accurately reflects net POC accumulation, as will be discussed further in Sect. 4. Nonetheless, for consistency with previous studies, we use the term NCPPOC to describe the quantities computed in Eq. (8).
The presence of significant upwelling at drifter site 1 provides additional complexity in the estimate of NCP from optically derived POC measurements. In particular, vertical transport of particle-deficient seawater from below the mixed layer into the surface could dilute the cp signal used to derive POC concentrations (Stramska and Dickey, 1994). To address this, we applied the vertical mixing term, kmix, derived from Eq. (6) to estimate the average daily dilution effect on mixed-layer POC concentrations through drifter period 1:
A negative Fmix,POC indicates transfer of [POC]-deficient seawater into the mixed layer. The term d[POC]∕dz represents the vertical gradient in [POC], derived from daily average POC concentrations measured in rosette samples at 5 m and near the base of the euphotic zone, below the mixed layer (40–60 m) (Sect. 2.4). The dz term was calculated as the difference between the average mixed-layer depth from all CTD casts and the daily average shallowest depth of minimum particle concentrations based on beam transmission profiles. At drifter site 2, Fmix,POC was considered negligible (Sect. 2.6.1) due to the high density stratification of the water column.
In total, three sets of 24 h GPP, CR, and NCP values were calculated during the drifter 1 deployment from the three pairs of consecutive day and night intervals, starting with the first night interval and ending with the last day interval. We excluded the first daytime interval from our calculations, due to the erratic salinity values observed during the first day of this drifter deployment (Sect. 3.1; Fig. S3). Because the drifter period was terminated prior to sunset, the last day interval was 1.6 h shorter than the average daytime duration. For the second drifter deployment, two sets of GPP, R, and NCP values were calculated from consecutive day and night intervals, starting with the first daytime interval and ending with the last nighttime interval. The initiation of the drifter period occurred after sunrise, so the first day interval was 1.1 h shorter than the average daytime duration.
2.6.3 Integration timescales
The approach to calculating NCP on the basis of linear regressions utilizes the high temporal resolution of our data set. We compared our results from Sect. 2.6.1 and 2.6.2 to NCP values calculated using several of other integration timescales. Following studies that have calculated daily NCP values from “instantaneous” rates of change (e.g., hourly rates in Hamme et al., 2012, and Tortell et al., 2014), we divided our NCP calculations into shorter increments. Given that the average measurement interval was ∼15 min (after removing values where the ship was not sufficiently close to the drifter; Sect. 2.1), we calculated NCP within 3 h intervals:
For each day of the drifter periods, eight consecutive 3 h NCP values were summed into a 24 h period to yield daily NCP estimates. We then applied the vertical mixing correction to these daily estimates (refer to Eqs. 5, 6, and 10), since the correction was only available on a daily basis given the lower sampling resolution of [N2O] and [POC] profiles. We also calculated daily NCP using the difference between ΔO2∕Ar or [POC] between two time points at the beginning and end of each 24 h period (similar to the approach in Alkire et al., 2012, and Barnes and Antoine, 2014). Finally, we calculated a single daily NCP rate per drifter period using the linear regression of ΔO2∕Ar and [POC] against time over the entire drifter deployment. For these latter two approaches, the 24 h average and drifter-period average of relevant terms in Eqs. (1)–(9) were used to calculate NCP, and a PQ was used to convert O2 to carbon units.
2.7 Error analysis
Errors for all estimates of net primary productivity (CbPM-NPP, 14C-NPP) and net community production (NCP, NCPPOC) were propagated from uncertainties associated with all variables used for the computations. Error estimates for time-averaged variables were generally represented by the standard deviation, as we assumed that this significantly exceeded the error of the individual measurements prior to averaging. The uncertainty in zmld, derived from the standard deviation of mixed-layer depths across individual CTD casts, was 2 m for drifter site 1 and 5 m for drifter site 2 (Sect. 2.3). Small uncertainties in td and tn were calculated as the standard deviations of all day or night lengths measured during both drifter periods (0.14 and 0.10 h, respectively). Mean relative errors of [Chl-a] and [Cph] from Burt et al. (2018) and mean relative standard deviations in MODIS-derived daily surface PAR values were propagated to calculate the error in CbPM-NPP. The standard deviations of triplicate 24 h 14C-uptake incubations were propagated to calculate the error in 14C-NPP estimates. The uncertainties in 14C-NPP values are likely underestimated, as they do not account for bottle effects, as discussed in Sect. 4.3.
All regressions in this study were performed using the regress function in MATLAB. For calculating error in NCP, uncertainties in dO2bio∕dt and dPOC∕dt were derived from the confidence interval of the best-fit slope of linear regression of each variable against time. Standard deviations of averaged ΔO2∕Ar, , and values, as well as the mean relative errors of [N2O]meas, [N2O]Eq, [N2O]thermal, and reported in Izett et al. (2018), were propagated into the mixing correction errors for NCP and NCPPOC. The error in was calculated as the confidence interval of the best-fit slope extracted from a linear regression of pooled drifter 1 [N2O]bio values against depth. In propagating the error associated with the dPOC∕dz term in Eq. (10), we have included the standard deviation of the minimum transmissivity depth across daily CTD casts and the standard deviation of POC measured in multiple blank combusted filters (Sect. 2.4). Finally, to account for variability in the PQ and RQ, we assumed an uncertainty of 0.1, following the range reported in Laws (1991).
3.1 Water mass properties
Shipboard underway measurements revealed clear differences in hydrographic and biogeochemical characteristics between the water masses sampled by the two drifters. Surface water properties at drifter site 1 reflected the presence of a recently upwelled water mass that was relatively cold (11.8±0.4 ∘C), saline (32.6±0.04 g kg−1), and nutrient-rich (Figs. 1, S3, S4). The Pacific Fisheries Environmental Laboratory's coastal upwelling index at 45∘ N, 125∘ W was positive throughout drifter period 1. In contrast, the water mass tracked by the second drifter deployment was warmer (17.5±0.1 ∘C) and fresher (31.8±0.05 g kg−1), with lower average mixed-layer nutrient concentrations.
Examination of surface water hydrographic properties during the two drifter deployments suggests that both drifters tracked a relatively homogenous water mass, excluding a period of salinity variability during the first day of drifter deployment 1, and several transient temperature and salinity excursions after the second night of this deployment (gray patches in Fig. S3). These features indicate potential intrusion of external water masses, possibly a result of loss of the drifter drogue (Sect. 2.1). Observations during these periods were thus removed from the data set prior to analysis. Outside of these intervals, variability in salinity (drifter 1: 32.5–32.7 g kg−1; drifter 2: 31.8–31.9 g kg−1) was small during both drifter deployments. Variability in sea surface temperature was also limited (drifter 1: 11.2–13.0 ∘C, drifter 2: 17.3–17.7 ∘C) and largely reflected a diurnal variation of warming and cooling, which was particularly evident for drifter period 2.
Temporal differences in CTD cast profiles point to some variation in mixed-layer depth (zmld) during both drifter deployments. In general, there were no multiday trends or regular diurnal patterns in zmld through both periods, suggesting that transient shifts in water column turbulence likely contributed to changes in the shape of temperature, salinity, dissolved oxygen, and fluorescence profiles. Average zmld values, calculated over each drifter period, had relatively low relative standard deviations (<25 %) and were applied to all subsequent calculations (Sect. 2.3). A sensitivity analysis, not shown, indicated that the choice of mixed-layer depth using different criteria (i.e., fluorescence profiles, density profiles, and the density difference criterion) and different timescales of integration (i.e., daytime or nighttime, 24 h, and multiday) did not significantly impact the results discussed below.
Average mixed-layer nutrient concentrations fluctuated during both drifter deployments but did not exhibit regular diurnal cycles (Fig. S4). At drifter site 1, concentrations ranged from 0.74 to 0.85 µM phosphate, 7.8 to 9.0 µM nitrate and nitrite, and 9.2 to 11.1 µM dissolved silica, excluding day 1 of the drifter deployment and anomalously high concentrations measured during a noisy CTD cast at midnight on the last day of the deployment. Excluding these outliers, a significant (p<0.05) linear regression of each nutrient concentration against time revealed that phosphate concentrations decreased by ∼0.07 µM, [] decreased by 0.9 µM, and [SiO2] decreased by 1.2 µM over the 3 d drifter period, roughly in Redfield ratio proportions (Sect. 3.4). Nutrient concentrations varied less at site 2, from 0.08 to 0.10 µM [], from 0.29 to 0.61 µM [], and from 1.2 to 1.7 [SiO2]. While [] and [SiO2] increased significantly (p<0.05) by 0.015 and 0.48 µM, respectively, these changes were small compared to the nutrient drawdown observed during drifter period 1 and did not reflect Redfield ratio proportions. It is possible that intrusions of an external water mass with slightly elevated nutrient concentrations contributed to the small increase in [] and [SiO2] measured during these CTD casts, even though we assume that such effects on our derived productivity estimates are negligible based on inspection of underway temperature and salinity data (Fig. S3).
3.2 Biogeochemical comparisons between drifter sites
Elevated nutrient concentrations at the drifter 1 site supported high productivity and the accumulation of phytoplankton biomass, as indicated by elevated chlorophyll-a ([Chl-a] = 0.66–1.5 µg L−1), phytoplankton carbon ([Cph] = 83–115 µg L−1), and particulate organic carbon concentrations ([POC] = 130–261 µg L−1) (Fig. 2a–c). We observed [Cph]∕[Chl-a] ratios ranging from 68 to 143 g g−1, with a median value of 85 g g−1 (Fig. 2f). Using the carbon-based production model (CbPM; Sect. 2.5) and daily averaged mixed-layer PAR derived from satellite values matched to drifter location (within 5 km), these [Cph]∕[Chl-a] ratios translate into phytoplankton growth rates ranging from 0.75 to 0.94 d−1. At the second drifter site, phytoplankton productivity and biomass were significantly lower in the nutrient-poor waters ([Chl-a] = 0.06–0.21 µg L−1, [Cph] = 11–17 µg L−1, and [POC] = 25–38 µg L−1). Ratios of [Cph] to [Chl-a] at site 2 were significantly higher (p<0.05) than those observed at site 1, ranging from 69 to 203 g g−1, with a median value of 108 g g−1. The higher ratios may reflect reduced cellular [Chl-a] associated with greater nutrient limitation, higher daily integrated PAR, and proportionally more picoplankton than microplankton at drifter site 2 (Westberry et al., 2008; Hirata et al., 2011; Graff et al., 2016; Burt et al., 2018). Median PAR levels were higher and less variable at site 2, in part contributing to lower variability in CbPM-based growth rates, which ranged from 0.81 to 0.85 d−1.
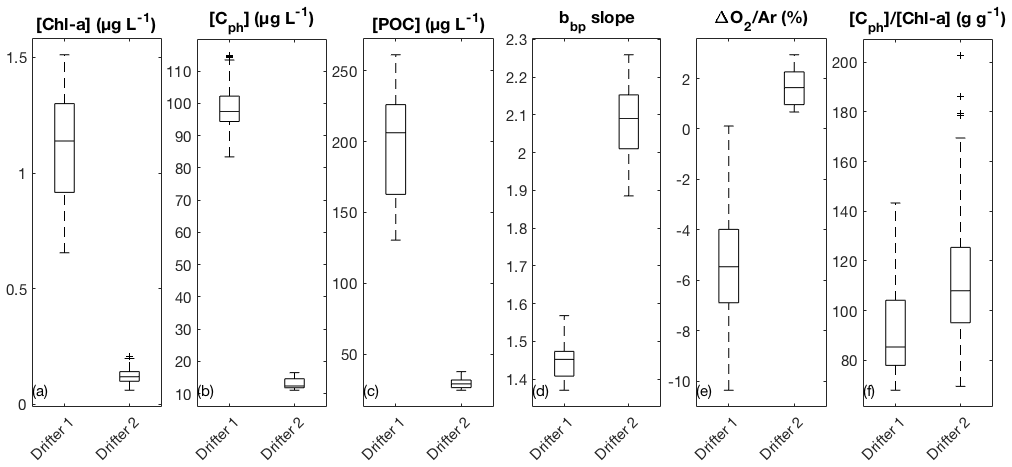
Figure 2Comparison of average surface water properties between the two drifter deployments: (a) chlorophyll-a concentration (Chl-a), (b) phytoplankton carbon concentration (Cph), (c) particulate organic carbon (POC) concentration, (d) the wavelength-dependent slope of particulate backscatter (bbp), (e) biological oxygen saturation anomaly (ΔO2∕Ar), and (f) the [Cph] ∕ [Chl-a] ratio. Boxes represent the median (centerline) and 25th and 75th percentiles (box edges). Outliers are indicated as black plus (+) signs.
Several lines of evidence suggest that the phytoplankton assemblage at drifter site 1 was enriched in large-celled phytoplankton, as compared to drifter site 2. The wavelength-dependent slope of particulate backscatter (bbp) was lower at site 1 (range: 1.4 to 1.6, median: 1.5) than at site 2 (range: 1.9 to 2.3, median: 2.1) (Fig. 2d), suggesting proportionally larger particle sizes (Stramska et al., 2003; Kostadinov et al., 2009). This observation is supported by size-fractionated Chl-a measurements. During the drifter 1 deployment, the > 20 µm size fraction (Sect. 2.4) increased from 21 % to 46 % of the total Chl-a pool, indicating the enrichment of large phytoplankton in the assemblage. Pigment-based estimates of phytoplankton taxonomic composition and size class (Hirata et al., 2011; Zeng et al., 2018) suggested that relative diatom and microplankton abundances exceeded 50 % on the final sampling time point. By comparison, size-fractionated [Chl-a] and HPLC analyses from drifter 2 indicated a lower proportion of large-celled phytoplankton, with 9 %–15 % of total [Chl-a] in the >20 µm size fraction, and diatoms and microplankton estimated to account for 19 %–29 % of the phytoplankton assemblage. The proportion of picoplankton increased through time at drifter site 2 from 31 % to 50 % of total [Chl-a], alongside a slight increase in bbp slope, indicating accumulation of smaller particle sizes (Fig. S3d). Finally, median bulk refractive index values across three wavelengths (470, 532, 650 nm) were higher at site 1 (1.08–1.11) than at site 2 (1.02–1.04) (Fig. S3e), which is consistent with a greater proportion of diatom-derived silica in the particle pool (Lide, 1997; Twardowski et al., 2001).
3.3 Diurnal variability and primary production
As shown in Fig. 3a, clear diurnal cycles in biological oxygen saturation (ΔO2∕Ar) were observed during both drifter deployments. Generally, values of ΔO2∕Ar increased from dawn to dusk and decreased from dusk to dawn, yielding positive slopes of linear regressions of ΔO2∕Ar against time in the daytime and negative slopes at night. During drifter deployment 1, this diurnal cycle was superimposed on a longer-term increase in biological O2 saturation as undersaturated values returned toward atmospheric equilibrium. At least part of this increase is attributable to gas exchange, which would act to erase O2 undersaturation in the mixed layer caused by recent upwelling. However, calculation of the sea–air O2 flux shows that, except for the first 24 h period, only a small amount of the daily increase in ΔO2∕Ar can be explained by gas exchange (absolute value of Jex <10 mmol O2 m−2 d−1) (Table 1). Thus, the temporal change in ΔO2∕Ar can be attributed to a primarily biological source. The magnitude of this increase is further underestimated because of vertical upwelling of deep oxygen-poor waters, which would act to dampen the increase in ΔO2∕Ar through time. After accounting for a mixing correction ranging between 22 and 97 mmol m−2 d−1 O2 (equivalent to 16 to 70 mmol m−2 d−1 C when assuming a photosynthetic quotient of 1.4), daily integrated gross primary productivity (GPP) ranged from 270 to 358 mmol C m−2 d−1, and community respiration (CR) rates ranged from 74 to 172 mmol C m−2 d−1 (Table 1).
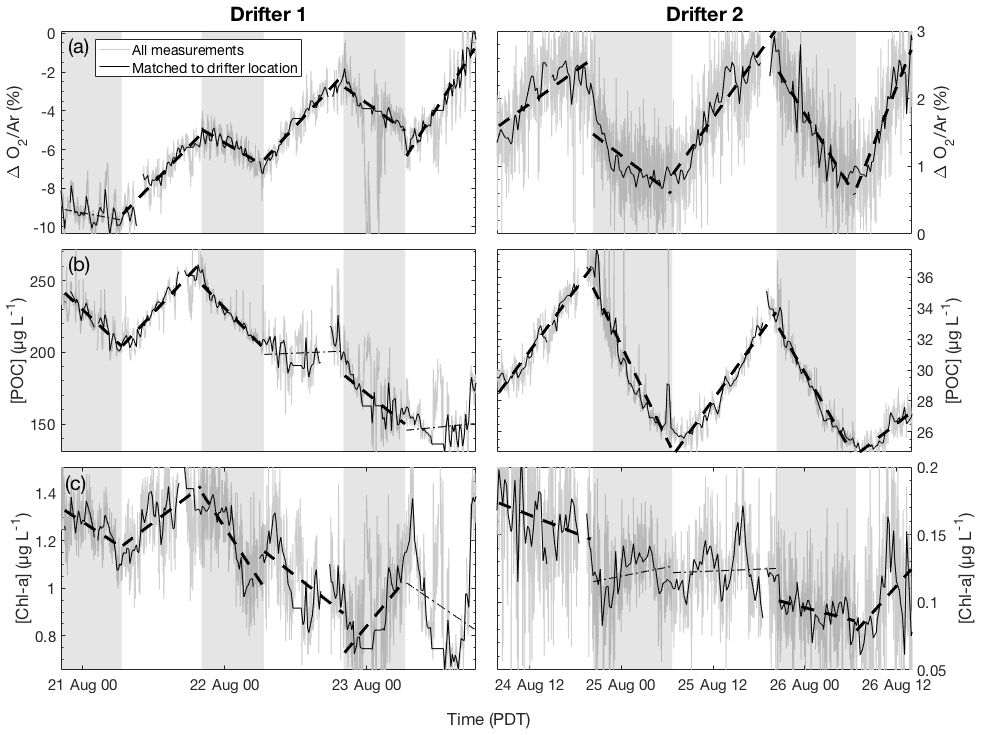
Figure 3Time series of (a) biological oxygen saturation (ΔO2∕Ar), (b) particulate organic carbon (POC) concentration, and (c) chlorophyll-a (Chl-a) concentration during the two drifter deployments (left and right panels, respectively). For each daytime (nonshaded) and nighttime (shaded) interval, the best-fit linear regression line is plotted. Significant regressions (p<0.05) are plotted as thick dashed lines, while nonsignificant regressions (p≥0.05) are plotted as thin dotted lines. Gray lines show all measurements while thicker black line shows observations collected when the ship was within 1.5 km of the drifter location.
Table 1Daily integrated mixed-layer net primary production (NPP) and net community production (NCP), including all components used to calculate NCP from ΔO2∕Ar or POC time series, as indicated: gross primary productivity (GPP), respiration (CR), vertical mixing (Mix), and gas exchange (Jex). All units here are in millimoles of carbon per square meter per day (mmol C m−2 d−1). Note that CbPM is the carbon-based production model (Behrenfeld et al., 2005; Westberry et al., 2008; Graff et al., 2016) (Sect. 2.5).
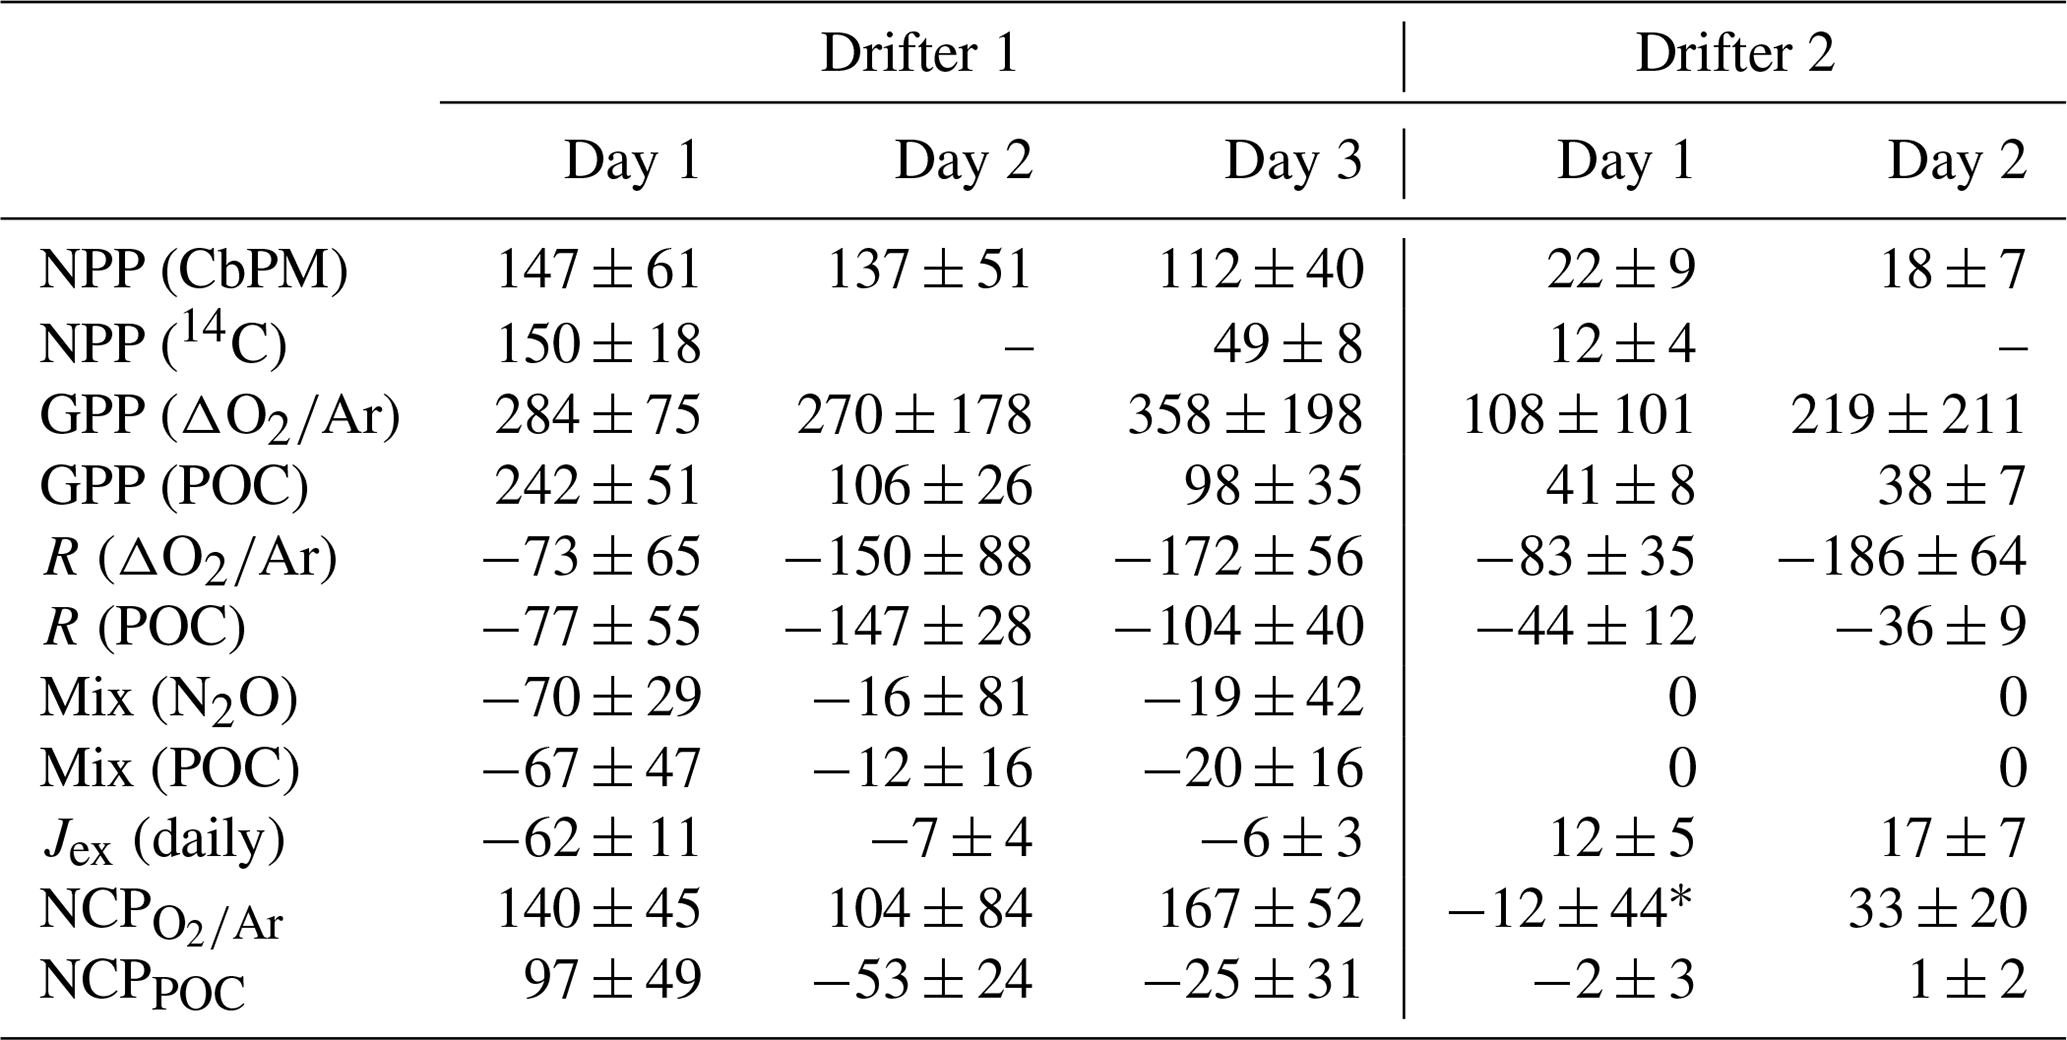
* Calculated using summed 3 h increments of NCP (refer to Table 2 and Sect. 2.6.3). All other NCP values reported here were computed using day and night linear regressions of [POC] and [O2]bio against time (Sect. 2.6.1, 2.6.2).
Examination of the diel variability in POC and Chl-a during drifter period 1 revealed significant differences in the behavior of these variables as compared to ΔO2∕Ar (Fig. 3b, c). In particular, while ΔO2∕Ar increased during the first drifter deployment, [POC] and [Chl-a] values decreased. We estimated that vertical mixing (Fmix,POC) accounted for 12 to 68 mmol m−2 d−1 C of these daily changes in [POC], similar to the magnitude of the mixing correction for ΔO2∕Ar variability (Table 1). After taking mixing into account, daily integrated GPPPOC decreased from 242 mmol m−2 d−1 on day 1 to 98 mmol m−2 d−1 on day 3, while CRPOC rates ranged from 77 to 147 mmol m−2 d−1.
Calculated daily averaged net primary productivity (NPP) was lower than GPP. Rates derived from the CbPM model (Sect. 2.5) declined from 147 mmol C m−2 d−1 on day 1 of drifter deployment 1 to 112 mmol C m−2 d−1 on day 3 (Table 1), reflecting the trend in Chl-a concentrations used to derive NPP (Fig. 3c). The CbPM-derived NPP estimates were similar to that obtained in 14C incubations (150±18 mmol C m−2 d−1) within the first 24 h of drifter deployment 1. However, 14C-based NPP estimates on the third day of the deployment (49±8 mmol C m−2 d−1) were about 2-fold lower than those obtained from CbPM calculations.
Dissolved oxygen and POC dynamics at drifter site 2 differed significantly from those observed at site 1. Compared to the drifter site 1, diel variability in ΔO2∕Ar and [POC] was more tightly coupled during the second drifter deployment (Fig. 3a, b). Both O2∕Ar and [POC] displayed regular diurnal variations, increasing in the daytime to a maximum around dusk and decreasing at night to a minimum around dawn. Over the full drifter deployment, concentrations of Chl-a and, to a lesser extent, POC decreased, in contrast to ΔO2∕Ar, which remained relatively constant across days. Daily integrated GPP values ranged from 108 to 219 mmol C m−2 d−1, and CR rates ranged from 83 to 186 m−2 d−1. POC-derived values were considerably lower and less variable, from 41 to 38 for GPPPOC and 36 to 44 for CRPOC (Table 1). NPP derived from CbPM calculations was 22 mmol C m−2 d−1 on the first day of the drifter period and 18 mmol C m−2 d−1 on the second day, while NPP calculated from one 14C bottle incubation during the first day of the drifter 2 deployment was 12±4 mmol C m−2 d−1, showing good agreement with the CbPM calculations.
3.4 Net community production
Daily net community production (NCP) rates were calculated using linear regressions of ΔO2∕Ar and POC over day and night intervals, corrected for gas exchange and vertical mixing (Sect. 2.6.1, 2.6.2). During drifter period 1, NCP and NCPPOC exhibited contrasting trends, as NCP remained >100 mmol C m−2 d−1 throughout, while NCPPOC declined to negative values on the second and third days (Table 1; Fig. 4). The transition to negative NCPPOC values over the course of the drifter 1 deployment primarily reflected diminishing daytime rates of POC accumulation (dPOC∕dt term in Eq. 8). At drifter period 2, we observed closer agreement between NCP values. ΔO2∕Ar-derived NCP ranged from −12 to 33 mmol C m−2 d−1 over two consecutive 24 h periods, while NCPPOC values ranged from −3 to 1 mmol C m−2 d−1. These lower rates at drifter site 2 are consistent with the lower observed phytoplankton biomass and nutrient concentrations.
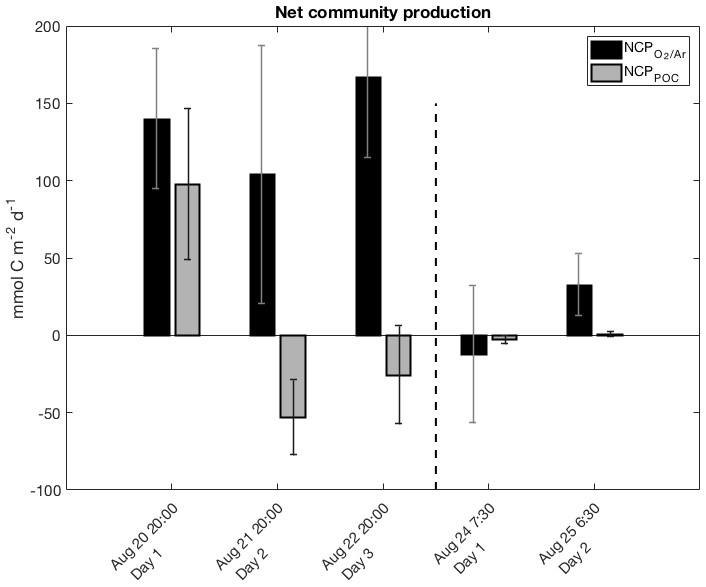
Figure 4Daily net community production (NCP) during successive days of the two drifter deployments derived from diurnal variations of biological oxygen saturation (ΔO2∕Ar) and particulate organic carbon (POC) concentration. Each set of bars is for one 24 h period, with approximate starting times on the x axis. Note that the negative NCP value for the first day of drifter period 2 was computed by integrating NCP values over eight consecutive 3 h increments (refer to Table 2).
Additional constraints on NCP during drifter period 1 can be derived from examining nutrient drawdown. Because vertical upwelling of nutrient-replete waters would dampen the magnitude of observed nutrient drawdown over time (Sect. 3.1; Fig. S4), we used the derived kmix from Eq. (6) and a best-fit vertical gradient in nutrient concentrations between the mixed layer and 100 m (Sect. 2.4) to account for this mixing flux. This correction increases the cumulative 3 d nutrient drawdown by 2.1 to 2.6 times. Over the 3 d drifter deployment, surface Si, N, and P concentrations declined in a ratio of 17 : 13 : 1, which is consistent with the stoichiometry expected for organic matter produced by a diatom-rich assemblage (Brzezinski et al., 1998; Turner et al., 1998; Brzezinski, 2004). Assuming that the observed decrease in SiO2 concentrations over the 3 d is attributable to growth of diatoms in the mixed layer, and applying a stoichiometric ratio of 106 C : 16 Si, we estimate an average C production rate of ∼128 mmol C m−2 d−1 for the drifter period. This value is consistent with NCP rates, which were 137 mmol C m−2 d−1 on average over 3 d, but significantly greater than NCPPOC estimates (7 mmol C m−2 d−1 on average) (Table 2).
Table 2Comparisons of NCP calculated using four different timescales of integration: (rows 1–2) day and night linear regressions, (rows 3–4) summed linear regressions over 3 h increments, (rows 5–6) the difference between two time points every 24 h, and (rows 7–8) a single linear regression over the entire drifter period. Refer to Sect. 2.6.3 for further details. For every calculation approach, “Export + DOC” is the average difference between NCP and NCPPOC values ±1 SD or ± the propagated error. All units here are in millimoles of carbon per square meter per day (mmol C m−2 d−1).

Table 2 summarizes comparisons among NCP values calculated using day and night linear regressions of ΔO2∕Ar and POC against time, as well as other approaches described in Sect. 2.6.3. In general, the different calculation methods did not significantly alter the results. NCP values derived from one linear regression over each drifter period agreed well with the average of two (drifter 2) to three (drifter 1) daily NCP values calculated via the other approaches. Small differences between linear regression-based NCP values and both NCP values calculated from either 3 h increments or two time points are likely due to the effect of lower signal to noise in ΔO2∕Ar, [O2]bio and [POC] values utilized in these latter two approaches. The following discussion thus focuses on productivity rates derived from day and night linear regressions (i.e., Eqs. 1 and 8), which utilize all data points while minimizing uncertainty in the derived rates of change. The exception is the NCP value calculated for day 1 of drifter period 2 using the daytime and nighttime linear regression method. By this approach, we calculated NCP as 26 mmol C m−2 d−1, even though the time series in Fig. 3a clearly indicates a net decrease in ΔO2∕Ar over the 24 h period, and all other ΔO2∕Ar-based NCP calculations (Sect. 2.6.3) yielded negative values. For the discussion, Table 1, and Fig. 4, the NCP value derived from the integrated 3 h increments represents net community production during this particular interval.
A number of previous studies have examined diurnal variation in upper-ocean phytoplankton and organic particle dynamics across a variety of productivity regimes, from oligotrophic environments (Claustre et al., 1999, 2008; Wu et al., 2010; Gernez et al., 2011; Kheireddine and Antoine, 2014; Thyssen et al., 2014; Nicholson et al., 2015; Ribalet et al., 2015; White et al., 2017) to higher-productivity waters and phytoplankton blooms (Brunet and Lizon, 2003; Wu et al., 2010; Gernez et al., 2011; Alkire et al., 2012; Dugenne et al., 2014; Kheireddine and Antoine, 2014; Needham and Fuhrman, 2016; Briggs et al., 2018). In general, these studies have shown that more productive environments exhibit higher amplitude diurnal variations in beam attenuation, POC concentration, phytoplankton cell abundances, Chl-a, and metabolic rates. These prior results are consistent with the differences we observed between the two distinct northeastern Pacific trophic environments represented by drifter sites 1 and 2, respectively (Sect. 3.2; Fig. 2).
Biogeochemical properties during the first Lagrangian survey suggested a dynamic, highly productive phytoplankton community, influenced by upwelling and elevated mixed-layer nutrient concentrations (Figs. 1, S4). Several lines of evidence imply the presence of a developing diatom bloom at this site (Sect. 3.2; Figs. 2, 3). Increasing mixed-layer biological oxygen saturation (ΔO2∕Ar) was contrasted by a general decrease in particulate organic carbon (POC) concentrations, suggesting a significant decoupling between O2 and POC dynamics. This was reflected in significant differences between ΔO2∕Ar-derived gross primary productivity (GPP) and net community production (NCP) rates derived from ΔO2∕Ar and POC measurements (Figs. 4, 5; Table 1). In contrast, biogeochemical properties during the second drifter deployment were indicative of a lower-productivity, nutrient-limited phytoplankton assemblage, with near-zero ΔO2∕Ar values reflecting a close balance between water column photosynthesis and respiration (Fig. 3a). Relative to the drifter 1 site, diurnal variations in ΔO2∕Ar and POC were more closely coupled, while phytoplankton biomass (Cph) and chlorophyll-a (Chl-a) concentrations (dominated by smaller cells) varied little through time. Contrary to our expectations, even though NCP and NCPPOC rates agreed well, we also observed significant discrepancies between GPP and GPPPOC and between CR and CRPOC during drifter period 2. The contrasting properties between the two drifter deployments enable us to examine the coupling of O2 and POC dynamics under different ecological states, with implications for the use of ΔO2∕Ar and POC measurements as proxies for GPP and NCP.
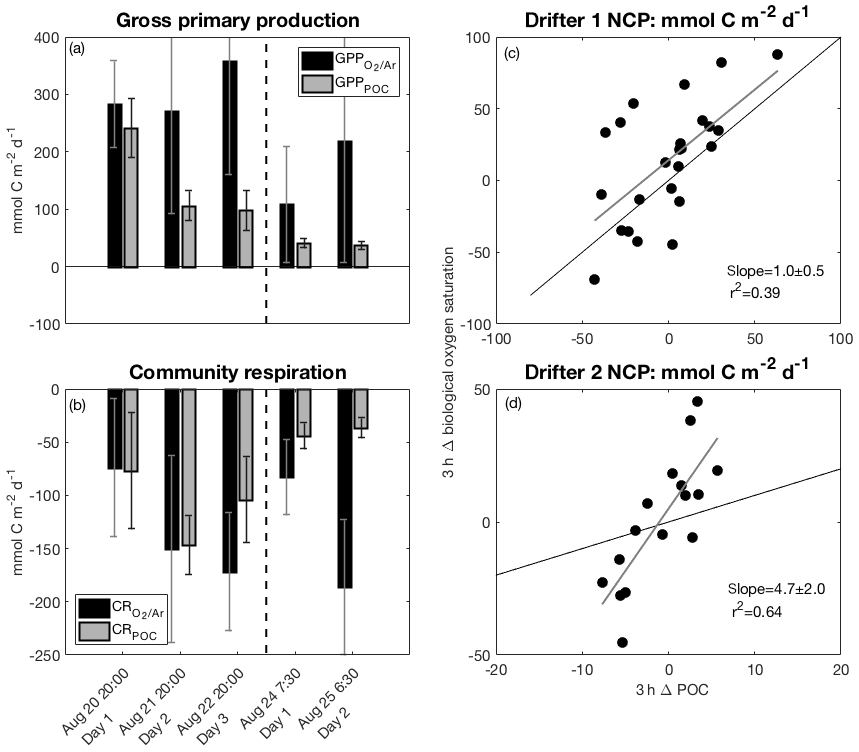
Figure 5The left panels show comparisons between ΔO2∕Ar-derived and POC-derived (a) GPP and (b) CR over the five days of both drifter deployments. The right panels show ΔO2∕Ar-derived NCP (NCP as a function of POC-derived NCP (NCPPOC) over 3 h increments during (c) drifter period 1 and (d) drifter period 2. The vertical dashed lines in (a) and (b) indicate the break between drifter periods 1 and 2. Thin black lines in (c) and (d) represent the 1 : 1 line, while thicker gray lines are the best fit from linear regressions and correspond to the indicated slope and r2 values.
4.1 Decoupling of O2 and POC dynamics in the mixed layer
4.1.1 Drifter 1
In the absence of significant POC sinking and net loss to the dissolved organic carbon (DOC) pool, POC-based productivity rates should approximate ΔO2∕Ar-based rates (Claustre et al., 2008; White et al., 2017). However, at drifter station 1, both GPP and NCP greatly exceeded GPPPOC and NCPPOC, respectively (Figs. 4, 5a; Table 1). Over the three successive 24 h periods of drifter deployment 1, the absolute difference between GPP measures increased from 41 to 260 mmol C m−2 d−1, while the absolute difference between NCP estimates increased from 42 to 193 mmol C m−2 d−1. This discrepancy exceeded the propagated NCP uncertainties during the second and third days of the deployment and was apparent in all approaches used to calculate NCP (Sect. 2.6.3, Table 2).
While mixed-layer ΔO2∕Ar primarily reflected O2 accumulation from GPP and O2 loss from CR, diurnal variability in [POC] was likely affected by several additional loss factors, which are discussed below. The variable difference between O2-based and POC-based NCP measured over 3 h increments (Eq. 11; Fig. S5) suggests that apparent POC loss rates were variable throughout the drifter period and lower at night relative to day. Thus, the higher NCP may be attributed more to differences in daytime accumulation of POC and O2 rather than differential POC and O2 losses at night. Indeed, we found that differences between CR and CRPOC were smaller than differences in NCP or GPP throughout drifter period 1, and CR exceeded CRPOC during two of three nights (Fig. 5b).
In the dynamic, high-productivity upwelling environment of drifter site 1, a number of processes can account for variable POC loss rates on various timescales (Gardner et al., 1993, 1999; White et al., 2017; Briggs et al., 2018). During a diatom bloom, enhanced aggregation of large silica-rich particles and zooplankton fecal pellet production can stimulate POC export and diatom cells out of the mixed layer (Buesseler, 1998; Guidi et al., 2009; Brzezinski et al., 2015; Stukel et al., 2017), progressively decreasing NCPPOC relative to NCP. The discrepancy we observed between NCPPOC and NCP (up to 193 mmol C m−2 d−1) is in the upper range of prior export estimates from various oceanic regions, including the Southern Ocean (∼83 mmol C m−2 d−1), North Atlantic spring bloom (96 mmol C m−2 d−1), and southern California Current system (∼36 mmol C m−2 d−1) (Henson et al., 2012; Alkire et al., 2012; Stukel et al., 2017), suggesting that POC export fluxes could comprise a significant fraction of the inferred POC loss at drifter site 1. At the same time, subdaily changes in particle sinking velocities and size distributions could cause daytime export to exceed nighttime export (Durand and Olson, 1998; Waite and Nodder, 2001; Oubelkheir and Sciandra, 2008; Kheireddine and Antoine, 2014; Ribalet et al., 2015; Briggs et al., 2018), leading to greater differences between GPP and GPPPOC than between CR and CRPOC, as we observed.
Another likely POC loss is DOC production through cellular exudation, viral lysis, and/or grazing (Karl et al., 1998; Lochte et al., 1993; Claustre et al., 2008; Dall'Olmo et al., 2011; Briggs et al., 2018). On daily timescales, this loss term would lower NCPPOC relative to NCP, provided that DOC production exceeds DOC respiration. Further, higher daytime net DOC production would cause GPP to increase more than GPPPOC in the daytime, while a decrease at night would cause CR to exceed CRPOC (Karl et al., 1998). Light- and productivity-dependent increases in DOC production in the daytime could result, for example, from the effects of photorespiration and other mechanisms of dissipating excess light energy (Schuback and Tortell, 2019). While we did not conduct direct measurements of DOC concentrations during the cruise, previous work in a variety of ocean environments has shown that DOC production can account for 3 %–37 % of NCP in the Ross Sea, up to 10 %–40 % in the equatorial Pacific Ocean, up to 66 % in the Sargasso Sea during the seasonal phytoplankton bloom, and 22 %–40 % during the North Atlantic bloom (Hansell and Carlson, 1998; Alkire et al., 2012). In the eastern subarctic Pacific, Bif and Hansell (2019) estimated springtime ΔDOC ∕ NCP ratios of 0.05–0.54 and summertime ratios of 0–0.28 along the Line P transect (130–152∘ W).
In addition, assuming that DOC exudation from phytoplankton cells is positively related to growth in heterotrophic biomass (Fuhrman et al., 1985; Kuipers et al., 2000; Church et al., 2004), variations in total bacterial biomass may have impacted cp measurements at drifter site 1 (Oubelkheir and Sciandra, 2008; Gernez et al., 2011; Barnes and Antoine, 2014). If detected by the ac-s sensor, bacteria could potentially account for some of the discrepancy between diel POC and O2-derived variability. In particular, cp decreases from phytoplankton exudation would counter cp increases from heterotrophic growth. At night, this would decrease CR rates derived from cp-based [POC], relative to O2-derived CR rates.
A final consideration involves diurnal variation of zooplankton abundances and grazing rates, which could enhance POC loss without depleting ΔO2∕Ar (Dall'Olmo et al., 2011; White et al., 2017; Briggs et al., 2018), assuming that biomass accumulation rates from grazing surpass grazer respiration rates (Dagg et al., 1982). Further, once POC is assimilated into the body of a grazer, it joins a larger particle size class that likely exceeds the size-dependent detection limits of the beam attenuation coefficient (Stramski and Kiefer, 1991; Marra, 2002; Claustre et al., 2008), decreasing the cp signal used to derive POC. During our expedition, we observed a strong signature of diel migrating zooplankton based on increased nighttime signal spikes in surface optical backscatter measurements (Burt and Tortell, 2018). These effects would enhance CRPOC relative to CR, contrary to what we observed. We thus assume that grazing at drifter site 1 is minimal relative to the effects of particle export and DOC production on GPP, CR, and NCP.
4.1.2 Drifter 2
Relative to the drifter 1 site, drifter site 2 exhibited similar discrepancies between GPP and GPPPOC, as well as greater discrepancies between CR and CRPOC (Fig. 5a–b; Table 1). Irrespective of the time of day, the rate of ΔO2∕Ar change computed over 3 h intervals (Eq. 11) consistently exceeded POC-derived changes throughout the drifter period (Fig. S5). The strong, positive relationship between these two 3 h measures (p<0.05, r2=0.64), compared to the weaker correlation at drifter site 1 (p<0.05, r2=0.39) (Fig. 5c–d), suggests that, despite large differences in the magnitude of ΔO2∕Ar-derived and POC-derived GPP and CR rates, POC-based changes were a good relative indicator of O2-derived productivity rates at drifter site 2.
Because daytime increases in both ΔO2∕Ar and [POC] were balanced by nighttime decreases, absolute differences in NCP and NCPPOC were smaller than at drifter site 1. This result suggests a closer coupling between primary production and heterotrophic consumption, as expected for this more oligotrophic ecosystem (Claustre et al., 2008; White et al., 2017). While the NCP discrepancy was negligible over the first 24 h period, it increased to 32 mmol C m−2 d−1 over the 24 h period (Table 1; Fig. 4), exceeding the uncertainty of both NCP calculations. This suggests low, but non-negligible, rates of particle export, grazing, and/or net DOC production at drifter site 2. Although we lack direct DOC measurements, this result is consistent with several previous observations of low net DOC production in oligotrophic waters (Bif et al., 2018; Hansell and Carlson, 1998), with values approaching ∼30 % of NCP in low-productivity offshore waters of the subarctic Pacific (Bif and Hansell, 2019). Low particle sinking rates could also explain the smaller absolute discrepancy between NCP and NCPPOC at drifter site 2. Low particle export is generally expected from phytoplankton assemblages dominated by small particle sizes <20 µm, as evident in higher bbp slope values and Chl-a size fractionation measurements at drifter site 2 (Sect. 3.2; Fig. 2) (Fowler and Knauer, 1986; Guidi et al., 2008).
Prior studies have observed that the amplitude of diurnal variability in ΔO2∕Ar exceeds the amplitude of diurnal variability in cp-based [POC], as we observed at drifter site 2 (Kinkade et al., 1999; Hamme et al., 2012; Briggs et al., 2018). For example, Briggs et al. (2018) observed higher amplitude variations in O2 relative to cp-derived [POC] during the North Atlantic bloom, leading to higher absolute O2-derived respiration and gross oxygen production (GOP) rates compared to cp-derived rates. In the Southern Ocean, Hamme et al. (2012) also observed high ratios of underway ΔO2∕Ar-derived gross oxygen production to gross carbon production (i.e., GPP) based on photosynthesis–irradiance incubations. As discussed above for drifter site 1, these offsets between ΔO2∕Ar and POC-based measures might result from the effects of bacteria on cp measurements, especially at a relatively low productivity site like drifter site 2 (Table 1; Fig. 2) (Claustre et al., 2008; Oubelkheir and Sciandra, 2008; Barnes and Antoine, 2014). Bacterial cp variability would act to counter phytoplankton cp variability, decreasing the magnitude of CRPOC relative to the magnitude of CR. Indeed, the positive CR − CRPOC discrepancy at drifter site 2 contributed to 58 %–82 % of the differences between ΔO2∕Ar and POC-derived GPP rates. The remaining difference may be attributed to greater daytime POC losses to the DOC pool and through particle export.
4.2 Other factors driving variability in NCP
In interpreting our results, it is important to consider a number of methodological caveats that could contribute to the apparent difference between NCP and NCPPOC. One important variable in all of our comparisons of productivity rates is the O2-to-POC conversion factor, represented by the photosynthetic (PQ) and respiratory quotient (RQ). Given the relatively narrow range of possible PQ values applicable to our study sites (∼ 1.1–1.4) (Laws, 1991), variability in this term cannot account for the total discrepancy observed between ΔO2∕Ar and POC-derived GPP, CR, and NCP rates. By contrast, RQ values in the ocean are more variable than PQ (Robinson and Williams, 1999; Robinson et al., 1999; Hedges et al., 2002). Therefore, variability in RQ values at both drifter sites could introduce considerable uncertainty into GPP, CR, and NCP calculations unaccounted for in our error propagations (Sect. 2.7). However, we found that use of RQ values ranging between 1.0 and 1.4 (Anderson and Sarmiento, 1994; Robinson and Williams, 1999; Hedges et al., 2002; Daneri et al., 2012) did not greatly change calculated GPP, CR, and NCP relative to GPPPOC, CRPOC, and NCPPOC. Therefore, it is unlikely that our selected RQ values, 1.4 and 1.1 for drifter sites 1 and 2, respectively, biased our main interpretations.
In our analysis, we interpret variations in particulate backscatter (bbp) and beam attenuation (cp) in terms of phytoplankton and total particulate organic carbon concentrations, assuming a negligible influence of inorganic suspended minerals from various sources, including sediment resuspension and transport by the Columbia River plume (Thomas and Weatherbee, 2006). This assumption is supported by the salinity of waters we sampled at both drifter sites, which was significantly higher than that expected for river-influenced regions (below 30 g kg−1; Hickey et al., 1998). At the same time, the observed bulk refractive index of particles (ηp) at drifter site 1 does not preclude the presence of mixing between POC and a small fraction of shelf-derived inorganic particles. Estimates of ηp were generally below 1.12 for this nearshore site (Sect. 2.2; Fig. S3e), as compared to values as high as 1.26 for inorganic minerals in seawater (Lide, 1997; Twardowski et al., 2001). By comparison, calculated ηp values during the drifter 2 deployment were below 1.08, which is much closer to values expected for water-containing predominantly nondiatom phytoplankton organic carbon.
Additional uncertainty in our analysis derives from the algorithms used to estimate POC and phytoplankton carbon Cph from optical measurements (Sect. 2.2). Because of particle size limitations in the optical measurements, they may not fully capture all significant size classes of the particulate pool, such as larger microplankton and zooplankton. Such a size bias in the cp signal at 660 nm, used to derive [POC], would cause an underestimate of larger POC particles measured by beam attenuation (Claustre et al., 2008; Marra, 2002; Stramski and Kiefer, 1991) and thereby contribute to the apparent discrepancy between diel changes in [POC] and diel changes in ΔO2∕Ar. Despite these potential caveats, recent work (Graff et al., 2016; Briggs et al., 2018; Burt et al., 2018) has demonstrated that cp- and bbp-based derivations of [POC] and [Cph] can indeed be robust in high-biomass ocean regions, where productivity and the proportion of large-celled phytoplankton is significant.
Equally important, changes in the cp-to-[POC] relationship through time could also drive apparent variability in optical [POC] estimates. The linear regression of [POC] against cp at 660 nm measured across diverse marine environments is defined over a range of POC concentrations from ∼5 to ∼175 µg L−1 (Graff et al., 2015). At drifter site 2, POC concentrations fell within the range of this fit, and particle properties that may influence POC∕cp values (i.e., bbp slope values, phytoplankton community composition, particle size, and bulk refractive index) were relatively constant through time (Fig. S3d, e). By comparison, POC concentrations at drifter station 1 were 25 % higher than the empirical limits of the cp-based algorithm in Graff et al. (2015), requiring extrapolation of the POC∕cp relationship beyond its calibration range. In a limited comparison with discrete POC samples, we found a POC–cp slope that was similar to that of Graff et al. (2015, albeit with a different y intercept) (Fig. S1). Nonetheless, we cannot rule out changes in the cp660–[POC] relationship due to shifts in cell size and, to a lesser extent, bulk refractive index resulting from diatom accumulation (Kheireddine and Antoine, 2014; Stramski and Reynolds, 1993) (Fig. S3d–e). Indeed, Briggs et al. (2018) observed that the ratio of [POC] to cp decreased by ∼20 % during the rise of the North Atlantic bloom, while values increased by ∼60 % during the bloom decline. If we assume a 20 % decrease in POC∕cp660 values (from ∼420 to ∼340 mg m−2) associated with diatom growth (Briggs et al., 2018), our daily NCPPOC estimates would be less positive during day 1 and less negative during days 2–3. This, in turn, would increase the apparent decoupling between NCPPOC and NCP on day 1 (∼27 %) and day 3 (∼1 %) and bring the values slightly closer on day 2 (∼8 %). Overall, the value of these potential changes is small relative to the differences we observed between NCP and NCPPOC, and we thus conclude that variable POC∕cp660 ratios cannot explain the observed decoupling between POC, Cph, and dissolved O2 dynamics at the drifter 1 site.
There are a number of other potential caveats in our analysis of phytoplankton carbon from bbp and particle size distribution from bbp slope. Previous studies have reported that daily variations in bbp do not always track daily variations in cp, suggesting that bbp dynamics do not reflect phytoplankton carbon dynamics on diel timescales (Kheireddine and Antoine, 2014; Briggs et al., 2018). We observed a similar decoupling between bbp and cp in this study; for example, while cp values at 660 nm steadily declined in the last 24 h of drifter period 1, bbp at 470 nm stayed relatively constant. Nonetheless, [Cph] estimates from bbp (Fig. 2) remain useful for comparisons between drifter sites, and differences in apparent phytoplankton biomass concentration were consistent with a number of the other biogeochemical differences measured between the two trophic regimes. Similarly, the relationship between bbp slope and particle size distribution has been challenged in previous literature (e.g., Zeng et al., 2018). While this limits our interpretation of daily bbp slope dynamics, we did find independent evidence for larger particle sizes at drifter site 1 (as predicted by the bbp slope), from size fractionated [Chl-a] measurements and pigment analysis showing a greater fraction of microplankton (Sect. 3.2).
4.3 Reconciling NCP and NPP
During both drifter surveys, we estimated daily integrated net primary productivity (NPP) values using carbon-based production model (CbPM) calculations and 14C bottle incubations (Sect. 2.5). On several days, these two estimates of NPP were consistently lower than NCP integrated over the same timescales and mixed-layer depths (Table 1). Similarly, Briggs et al. (2018) and Alkire et al. (2012) also reported NCP values that were equal to or greater than NPP values obtained from different methodologies during their Lagrangian study of the North Atlantic bloom.
In theory, NCP cannot exceed NPP, as NCP includes additional respiration terms not included in NPP and must always be equal to or (more realistically) lower than NPP. Recent work in the northeastern Pacific Ocean has reported mean NCP/NPP ratios, based on ΔO2∕Ar measurements and CbPM calculations, ranging from 0.16 to 0.26 in offshore and coastal waters (Burt et al., 2018). These values, determined from continuous observations along a moving ship track, are consistent with theoretical expectations. The observed high (>1) apparent NCP∕NPP values observed in our study and that of Briggs et al. (2018) and Alkire et al. (2012) highlight a number of methodological limitations that could depress NPP estimates.
One possibility, which has been discussed at length by various authors (Gieskes et al., 1979; Fogg and Calvario-Martinez, 1989; Marra, 2009), is that bottle containment effects limit accurate estimates of 14C uptake. This effect would have caused underestimates of 14C-NPP during both drifter surveys, relative to CbPM-NPP and NCP, which do not require discrete sample incubations. In addition, during the last 14C-uptake experiment of drifter survey 2, the incubator warmed (as the ship passed through warm SST water used to cool the tanks), potentially creating heat stress on phytoplankton and depressing 14C-NPP values.
A number of factors may also influence CbPM-based NPP estimates. While the model applies a satellite-based relationship between [Chl-a] ∕ [Cph] and daily mixed-layer irradiance (Eg) to calculate growth rate, these Eg values may not fully parametrize phytoplankton physiology for mixed assemblages in the ocean (Westberry et al., 2008). Indeed, phytoplankton photophysiology varies with other environmental conditions and phytoplankton composition (Cloern et al., 1995; Geider et al., 1998; MacIntyre et al., 2002; Westberry et al., 2008). In addition, the CbPM does not allow calculated growth rates to exceed 2 d−1, which may not apply to all ocean environments (Graff et al., 2016). These uncertainties could potentially impact the applicability of the CbPM parameters to the specific ocean conditions at drifter sites 1 and 2. In addition, a vertical mixing correction for ac-s and backscatter-derived [Chl-a] and [Cph], respectively, not feasible in the present data set, may improve CbPM-based estimates of NPP.
In the current study, biological oxygen saturation (ΔO2∕Ar) and optically derived particulate organic carbon (POC) were measured continuously and simultaneously during two Lagrangian drifter deployments. This dual measurement approach facilitated direct comparison of O2∕Ar- and POC-derived measures of gross primary productivity (GPP), community respiration (CR), and net community production (NCP), from a mesotrophic upwelling-influenced system and a more oligotrophic system further offshore. As hypothesized, the results show that O2- and POC-based measures of GPP and NCP diverge in mid-to-high-productivity phytoplankton communities, where daily fluctuations in ΔO2∕Ar are decoupled from POC cycling. Interestingly, oxygen-based GPP and CR also exceeded POC-based GPP and CR rates at the lower-productivity site, though we found that net changes in POC scaled with ΔO2∕Ar-based productivity estimates, suggesting a tighter coupling between O2 and POC cycles.
These findings are generally consistent with current understanding of productivity dynamics and mixed-layer POC cycling in these two coastal Pacific environments and complement only one prior comparison of daily GPP and NCP estimates from simultaneous, autonomous measurements of cp and O2 in the North Atlantic mixed layer (Alkire et al., 2012; Briggs et al., 2018). Importantly, however, our results differ from earlier studies by providing two examples of significant disagreement between GPP and GPPPOC, as well as CR and CRPOC, likely resulting from subdaily variations in particle export, net DOC production, and bacterial growth over respiration. In such cases, assuming constant daily respiration rates by extrapolating nighttime rates of change may pose challenges for comparing ΔO2∕Ar and POC-based GPP and CR. We have further shown that for upwelling regions like drifter site 1, it is important to account for vertical mixing of subsurface waters into the mixed layer and its effect on not only NCP calculations (Izett et al., 2018), but also on NCPPOC estimates through dilution of the surface POC signature. Our study thus illustrates an application of the vertical mixing coefficient, kmix, derived from [N2O] profiles to more accurately estimate net changes in POC and nutrient concentration in such environments.
Moving forward, the disparity between POC- and O2-based NCP estimates offers an opportunity to continuously track cumulative POC losses in the mixed layer using autonomous shipboard or in situ sensors. As it is labor-intensive to measure POC export on short timescales with sediment traps and the 234Th–238U disequilibrium method (Buesseler et al., 2006; Savoye et al., 2006), simultaneous underway measurements of dissolved O2, particulate beam attenuation and colored dissolved organic matter (CDOM) absorption and spectral slope over a range of wavelengths <400 nm (Del Vecchio and Blough, 2004; Grunert et al., 2018) may provide a valuable, first-order approximation of POC partitioning among living phytoplankton biomass, particle export, and dissolved organic carbon (DOC) in the surface ocean on short timescales. At drifter site 1, for example, taking an upper bound of 40 % of NCP as DOC production (close to the fraction estimated by Alkire et al., 2012, during the North Atlantic spring bloom) yields a 3 d average DOC flux of 55 mmol C m−2 d−1 and residual export flux of 76 mmol C m−2 d−1. Being able to estimate such quantities with this approach is especially important in the California coastal upwelling regime and other similar ecosystems with high NCP and significant potential for carbon transfer to higher trophic levels.
For future work, we recommend a number of approaches to facilitate estimation of POC export from coupled O2, POC, and DOC dynamics. First, it will be valuable to constrain particle size and partition POC into detrital and living (phytoplankton and heterotrophic bacteria) components to properly assess the size range captured by optically derived POC and Cph measurements. Second, independent estimates of POC export and DOC concentrations during each drifter deployment could validate POC export fluxes derived from coupled O2 and POC measurements. Relatedly, depth-resolved backscatter profiles (Briggs et al., 2013, 2018) could be used as another autonomous approach to calculating export fluxes, as an independent check on surface-based estimates. Going forward, there is significant future potential to exploit coupled O2 and cp measurements on autonomous platforms, including various ocean moorings (e.g., the Optical Dynamics Experiment, the Biowatt II program, and the Bermuda Testbed Mooring program), and biogeochemical floats and gliders to resolve opportunistic, high-resolution POC export time series (Stramska and Dickey, 1992; Kinkade et al., 1999; Dickey and Chang, 2002). Deployment of such autonomous measurement systems across a range of oceanic regions will help to constrain POC and productivity dynamics on global scales.
Discrete and underway optical measurements may be accessed at https://github.com/srosengard/rosengard-tortell-oc2017.git (last access: 31 March 2020) and https://doi.org/10.5281/zenodo.3269887 (Rosengard et al., 2019).
The supplement related to this article is available online at: https://doi.org/10.5194/bg-17-3277-2020-supplement.
SZR, PDT, and NS collected the data in the field. RWI processed the CTD cast data and measured nitrous oxide concentrations in discrete samples. SZR wrote the manuscript with significant input from the coauthors.
The authors declare that they have no conflict of interest.
Special thanks to Jessie Gwinn, Ross McCulloch, Chen Zeng, Melissa Beaulac, Chris Payne, and Maureen Soon for assistance in field collection and analysis of samples, as well as to two anonymous reviewers for insightful suggestions on earlier versions of this paper.
This research has been supported by the Natural Sciences and Engineering Research Council of Canada (NSERC) and the US National Science Foundation (NSF project number 1436344).
This paper was edited by Emilio Marañón and reviewed by two anonymous referees.
Alkire, M. B., D'Asaro, E., Lee, C., Jane Perry, M., Gray, A., Cetinić, I., Briggs, N., Rehm, E., Kallin, E., Kaiser, J., and González-Posada, A.: Estimates of net community production and export using high-resolution, Lagrangian measurements of O2, , and POC through the evolution of a spring diatom bloom in the North Atlantic, Deep-Sea Res. Pt. I, 64, 157–174, https://doi.org/10.1016/j.dsr.2012.01.012, 2012.
Anderson, L. A. and Sarmiento, J. L.: Redfield ratios of remineralization determined by nutrient data analysis, Global Biogeochem. Cy., 8, 65–80, 1994.
Barnes, M. and Antoine, D.: Proxies of community production derived from the diel variability of particulate attenuation and backscattering coefficients in the northwest Mediterranean Sea, Limnol. Oceanogr., 59, 2133–2149, 2014.
Behrenfeld, M. J., Boss, E., Siegel, D. A., and Shea, D. M.: Carbon-based ocean productivity and phytoplankton physiology from space, Global Biogeochem. Cy., 19, GB1006, https://doi.org/10.1029/2004GB002299, 2005.
Bif, M. B. and Hansell, D. A.: Seasonality of dissolved organic carbon in the upper Northeast Pacific Ocean, Global Biogeochem. Cy., 33, 526–539, 2019.
Bif, M. B., Hansell, D. A., and Popendorf, K. J.: Controls on the fate of dissolved organic carbon under contrasting upwelling conditions, Front. Mar. Sci., 5, 463, https://doi.org/10.3389/fmars.2018.00463, 2018.
Boss, E., Twardowski, M. S., and Herring, S.: Shape of the particulate beam attenuation spectrum and its inversion to obtain the shape of the particulate size distribution, Appl. Optics, 40, 4885–4893, 2001.
Briggs, N., Guðmundsson, K., Cetinić, I., D'Asaro, E., Rehm, E., Lee, C., and Perry, M. J.: A multi-method autonomous assessment of primary productivity and export efficiency in the springtime North Atlantic, Biogeosciences, 15, 4515–4532, https://doi.org/10.5194/bg-15-4515-2018, 2018.
Briggs, N. T., Slade, W. H., Boss, E., and Perry, M. J.: Method for estimating mean particle size from high-frequency fluctuations in beam attenuation or scattering measurements, Appl. Optics, 52, 6710–6725, 2013.
Brunet, C. and Lizon, F.: Tidal and diel periodicities of size-fractionated phytoplankton pigment signatures at an offshore station in the southeastern English Channel, Estuar. Coast. Shelf S., 56, 833–843, 2003.
Brzezinski, M., Villareal, T., and Lipschultz, F.: Silica production and the contribution of diatoms to new and primary production in the central North Pacific, Mar. Ecol.-Prog. Ser., 167, 89–104, https://doi.org/10.3354/meps167089, 1998.
Brzezinski, M. A.: The Si : C : N ratio of marine diatoms: Interspecific variability and the effect of some environmental variables, J. Phycol., 21, 347–357, https://doi.org/10.1111/j.0022-3646.1985.00347.x, 2004.
Brzezinski, M. A., Krause, J. W., Bundy, R. M., Barbeau, K. A., Franks, P., Goericke, R., Landry, M. R., and Stukel, M. R.: Enhanced silica ballasting from iron stress sustains carbon export in a frontal zone within the California Current, J. Geophys. Res.-Oceans, 120, 4654–4669, 2015.
Buesseler, K. O.: The decoupling of production and particulate export in the surface ocean, Global Biogeochem. Cy., 12, 297–310, 1998.
Buesseler, K. O., Benitez-Nelson, C. R., Moran, S. B., Burd, A., Charette, M., Cochran, J. K., Coppola, L., Fisher, N. S., Fowler, S. W., and Gardner, W. D.: An assessment of particulate organic carbon to thorium-234 ratios in the ocean and their impact on the application of 234Th as a POC flux proxy, Mar. Chem., 100, 213–233, 2006.
Burt, W. J. and Tortell, P. D.: Observations of Zooplankton Diel Vertical Migration From High-Resolution Surface Ocean Optical Measurements, Geophys. Res. Lett., 45, 13396–13404, 2018.
Burt, W. J., Westberry, T. K., Behrenfeld, M. J., Zeng, C., Izett, R. W., and Tortell, P. D.: Carbon: Chlorophyll Ratios and Net Primary Productivity of Subarctic Pacific Surface Waters Derived From Autonomous Shipboard Sensors, Global Biogeochem. Cy., 32, 267–288, https://doi.org/10.1002/2017GB005783, 2018.
Capelle, D. W., Dacey, J. W., and Tortell, P. D.: An automated, high through-put method for accurate and precise measurements of dissolved nitrous-oxide and methane concentrations in natural waters, Limnol. Oceanogr.-Meth., 13, 345–355, 2015.
Cassar, N., Barnett, B. A., Bender, M. L., Kaiser, J., Hamme, R. C., and Tilbrook, B.: Continuous high-frequency dissolved O2∕Ar measurements by equilibrator inlet mass spectrometry, Anal. Chem., 81, 1855–1864, 2009.
Cassar, N., Nevison, C. D., and Manizza, M.: Correcting oceanic O2∕Ar-net community production estimates for vertical mixing using N2O observations, Geophys. Res. Lett., 41, 8961–8970, 2014.
Church, M. J., Ducklow, H. W., and Karl, D. M.: Light dependence of [3H] leucine incorporation in the oligotrophic North Pacific Ocean, Appl. Environ. Microbiol., 70, 4079–4087, 2004.
Claustre, H., Morel, A., Babin, M., Cailliau, C., Marie, D., Marty, J., Tailliez, D., and Vaulot, D.: Variability in particle attenuation and chlorophyll fluorescence in the tropical Pacific: Scales, patterns, and biogeochemical implications, J. Geophys. Res.-Oceans, 104, 3401–3422, 1999.
Claustre, H., Huot, Y., Obernosterer, I., Gentili, B., Tailliez, D., and Lewis, M.: Gross community production and metabolic balance in the South Pacific Gyre, using a non intrusive bio-optical method, Biogeosciences, 5, 463–474, https://doi.org/10.5194/bg-5-463-2008, 2008.
Cloern, J. E., Grenz, C., and Vidergar-Lucas, L.: An empirical model of the phytoplankton chlorophyll: carbon ratio-the conversion factor between productivity and growth rate, Limnol. Oceanogr., 40, 1313–1321, 1995.
Dagg, M. J., Vidal, J., Whitledge, T. E., Iverson, R. L., and Goering, J. J.: The feeding, respiration, and excretion of zooplankton in the Bering Sea during a spring bloom, Deep-Sea Res. Pt. A, 29, 45–63, 1982.
Dall'Olmo, G., Boss, E., Behrenfeld, M. J., Westberry, T. K., Courties, C., Prieur, L., Pujo-Pay, M., Hardman-Mountford, N., and Moutin, T.: Inferring phytoplankton carbon and eco-physiological rates from diel cycles of spectral particulate beam-attenuation coefficient, Biogeosciences, 8, 3423–3439, https://doi.org/10.5194/bg-8-3423-2011, 2011.
Daneri, G., Lizárraga, L., Montero, P., González, H. E., and Tapia, F. J.: Wind forcing and short-term variability of phytoplankton and heterotrophic bacterioplankton in the coastal zone of the Concepción upwelling system (Central Chile), Prog. Oceanogr., 92, 92–96, 2012.
de Boyer Montégut, C., Madec, G., Fischer, A. S., Lazar, A., and Iudicone, D.: Mixed layer depth over the global ocean: An examination of profile data and a profile-based climatology, J. Geophys. Res., 109, C12003, https://doi.org/10.1029/2004JC002378, 2004.
Del Vecchio, R. and Blough, N. V.: Spatial and seasonal distribution of chromophoric dissolved organic matter and dissolved organic carbon in the Middle Atlantic Bight, Mar. Chem., 89, 169–187, 2004.
Dickey, T. D. and Chang, G. C.: Recent advances and future visions: temporal variability of optical and bio-optical properties of the ocean, Oceanogr. DC-Oceanography Soc., 14, 15–29, 2002.
Dugenne, M., Thyssen, M., Nerini, D., Mante, C., Poggiale, J.-C., Garcia, N., Garcia, F., and Grégori, G. J.: Consequence of a sudden wind event on the dynamics of a coastal phytoplankton community: an insight into specific population growth rates using a single cell high frequency approach, Front. Microbiol., 5, 485, https://doi.org/10.3389/fmicb.2014.00485, 2014.
Durand, M. D. and Olson, R. J.: Diel patterns in optical properties of the chlorophyte Nannochloris sp.: Relating individual-cell to bulk measurements, Limnol. Oceanogr., 43, 1107–1118, 1998.
Fernández-Urruzola, I., Osma, N., Packard, T. T., Gómez, M., and Postel, L.: Distribution of zooplankton biomass and potential metabolic activities across the northern Benguela upwelling system, J. Marine Syst., 140, 138–149, 2014.
Ferrón, S., Wilson, S. T., Martínez-García, S., Quay, P. D., and Karl, D. M.: Metabolic balance in the mixed layer of the oligotrophic North Pacific Ocean from diel changes in O2∕Ar saturation ratios, Geophys. Res. Lett., 42, 3421–3430, 2015.
Fogg, G. E. and Calvario-Martinez, O.: Effects of bottle size in determinations of primary productivity by phytoplankton, Hydrobiologia, 173, 89–94, https://doi.org/10.1007/BF00015518, 1989.
Fowler, S. W. and Knauer, G. A.: Role of large particles in the transport of elements and organic compounds through the oceanic water column, Prog. Oceanogr., 16, 147–194, https://doi.org/10.1016/0079-6611(86)90032-7, 1986.
Fuhrman, J. A., Eppley, R. W., Hagström, Å., and Azam, F.: Diel variations in bacterioplankton, phytoplankton, and related parameters in the Southern California Bight, Mar. Ecol.-Prog. Ser., 27, 9–20, 1985.
Garcia, H. E. and Gordon, L. I.: Oxygen solubility in seawater: Better fitting equations, Limnol. Oceanogr., 37, 1307–1312, 1992.
Gardner, W. D., Walsh, I. D., and Richardson, M. J.: Biophysical forcing of particle production and distribution during a spring bloom in the North Atlantic, Deep-Sea Res. Pt. II, 40, 171–195, 1993.
Gardner, W. D., Gundersen, J. S., Richardson, M. J., and Walsh, I. D.: The role of seasonal and diel changes in mixed-layer depth on carbon and chlorophyll distributions in the Arabian Sea, Deep-Sea Res. Pt. II, 46, 1833–1858, https://doi.org/10.1016/S0967-0645(99)00046-6, 1999.
Geider, R. J., Maclntyre, H. L., and Kana, T. M.: A dynamic regulatory model of phytoplanktonic acclimation to light, nutrients, and temperature, Limnol. Oceanogr., 43, 679–694, 1998.
Gernez, P., Antoine, D., and Huot, Y.: Diel cycles of the particulate beam attenuation coefficient under varying trophic conditions in the northwestern Mediterranean Sea: Observations and modeling, Limnol. Oceanogr., 56, 17–36, 2011.
Gieskes, W. W. C., Kraay, G. W., and Baars, M. A.: Current 14C methods for measuring primary production: Gross underestimates in oceanic waters, Neth. J. Sea Res., 13, 58–78, https://doi.org/10.1016/0077-7579(79)90033-4, 1979.
Graff, J. R., Westberry, T. K., Milligan, A. J., Brown, M. B., Dall'Olmo, G., van Dongen-Vogels, V., Reifel, K. M., and Behrenfeld, M. J.: Analytical phytoplankton carbon measurements spanning diverse ecosystems, Deep-Sea Res. Pt. I, 102, 16–25, https://doi.org/10.1016/J.DSR.2015.04.006, 2015.
Graff, J. R., Westberry, T. K., Milligan, A. J., Brown, M. B., Olmo, G. D., Reifel, K. M., and Behrenfeld, M. J.: Photoacclimation of natural phytoplankton communities, Mar. Ecol.-Prog. Ser., 542, 51–62, 2016.
Grunert, B. K., Mouw, C. B., and Ciochetto, A. B.: Characterizing CDOM spectral variability across diverse regions and spectral ranges, Global Biogeochem. Cy., 32, 57–77, 2018.
Guidi, L., Jackson, G. A., Stemmann, L., Carlos Miquel, J., Picheral, M., and Gorsky, G.: Relationship between particle size distribution and flux in the mesopelagic zone, Deep-Sea Res. Pt. I, 55, 1364–1374, https://doi.org/10.1016/j.dsr.2008.05.014, 2008.
Guidi, L., Stemmann, L., Jackson, G. A., Ibanez, F., Claustre, H., Legendre, L., Picheral, M., and Gorskya, G.: Effects of phytoplankton community on production, size, and export of large aggregates: A world-ocean analysis, Limnol. Oceanogr., 54, 1951–1963, 2009.
Hamme, R. C., Cassar, N., Lance, V. P., Vaillancourt, R. D., Bender, M. L., Strutton, P. G., Moore, T. S., DeGrandpre, M. D., Sabine, C. L., and Ho, D. T.: Dissolved O2∕Ar and other methods reveal rapid changes in productivity during a Lagrangian experiment in the Southern Ocean, J. Geophys. Res.-Oceans, 117, C00F12, https://doi.org/10.1029/2011JC007046, 2012.
Hansell, D. A. and Carlson, C. A.: Net community production of dissolved organic carbon, Global Biogeochem. Cy., 12, 443–453, 1998.
Hedges, J. I., Baldock, J. A., Gélinas, Y., Lee, C., Peterson, M. L., and Wakeham, S. G.: The biochemical and elemental compositions of marine plankton: A NMR perspective, Mar. Chem., 78, 47–63, 2002.
Henson, S. A., Sanders, R., and Madsen, E.: Global patterns in efficiency of particulate organic carbon export and transfer to the deep ocean, Global Biogeochem. Cy., 26, GB1028, https://doi.org/10.1029/2011GB004099, 2012.
Hickey, B. M., Pietrafesa, L. J., Jay, D. A., and Boicourt, W. C.: The Columbia River plume study: Subtidal variability in the velocity and salinity fields, J. Geophys. Res.-Oceans, 103, 10339–10368, 1998.
Hirata, T., Hardman-Mountford, N. J., Brewin, R. J. W., Aiken, J., Barlow, R., Suzuki, K., Isada, T., Howell, E., Hashioka, T., Noguchi-Aita, M., and Yamanaka, Y.: Synoptic relationships between surface Chlorophyll-a and diagnostic pigments specific to phytoplankton functional types, Biogeosciences, 8, 311–327, https://doi.org/10.5194/bg-8-311-2011, 2011.
Hopkinson, B. M. and Barbeau, K. A.: Organic and redox speciation of iron in the eastern tropical North Pacific suboxic zone, Mar. Chem., 106, 2–17, 2007.
Hoppe, C. J. M., Schuback, N., Semeniuk, D. M., Maldonado, M. T., and Rost, B.: Functional Redundancy Facilitates Resilience of Subarctic Phytoplankton Assemblages toward Ocean Acidification and High Irradiance, Front. Mar. Sci., 4, 229, https://doi.org/10.3389/fmars.2017.00229, 2017.
Izett, R. W., Manning, C. C., Hamme, R. C., and Tortell, P. D.: Refined estimates of net community production in the Subarctic Northeast Pacific derived from ΔO2∕Ar measurements with N2O-based corrections for vertical mixing, Global Biogeochem. Cy., 32, 326–350, 2018.
Jin, X., Najjar, R. G., Louanchi, F., and Doney, S. C.: A modeling study of the seasonal oxygen budget of the global ocean, J. Geophys. Res.-Oceans, 112, C05017, https://doi.org/10.1029/2006JC003731, 2007.
Kaiser, J., Reuer, M. K., Barnett, B., and Bender, M. L.: Marine productivity estimates from continuous O2∕Ar ratio measurements by membrane inlet mass spectrometry, Geophys. Res. Lett., 32, L19605, https://doi.org/10.1029/2005GL023459, 2005.
Karl, D. M., Hebel, D. V., Björkman, K., and Letelier, R. M.: The role of dissolved organic matter release in the productivity of the oligotrophic North Pacific Ocean, Limnol. Oceanogr., 43, 1270–1286, 1998.
Keeling, R. F. and Shertz, S. R.: Seasonal and interannual variations in atmospheric oxygen and implications for the global carbon cycle, Nature, 358, 723–727, 1992.
Kheireddine, M. and Antoine, D.: Diel variability of the beam attenuation and backscattering coefficients in the northwestern Mediterranean Sea (BOUSSOLE site), J. Geophys. Res.-Oceans, 119, 5465–5482, 2014.
Kinkade, C. S., Marra, J., Dickey, T. D., Langdon, C., Sigurdson, D. E., and Weller, R.: Diel bio-optical variability observed from moored sensors in the Arabian Sea, Deep-Sea Res. Pt. II, 46, 1813–1831, 1999.
Kostadinov, T. S., Siegel, D. A., and Maritorena, S.: Retrieval of the particle size distribution from satellite ocean color observations, J. Geophys. Res., 114, C09015, https://doi.org/10.1029/2009JC005303, 2009.
Kuipers, B., van Noort, G. J., Vosjan, J., and Herndl, G. J.: Diel periodicity of bacterioplankton in the euphotic zone of the subtropical Atlantic Ocean, Mar. Ecol.-Prog. Ser., 201, 13–25, 2000.
Laws, E. A.: Photosynthetic quotients, new production and net community production in the open ocean, Deep-Sea Res. Pt. A, 38, 143–167, 1991.
Lide, D. R.: Physical and optical properties of minerals, CRC Handb. Chem. Phys., 77, 4–130, 1997.
Lochte, K., Ducklow, H. W., Fasham, M. J. R., and Stienen, C.: Plankton succession and carbon cycling at 47∘ N 20∘ W during the JGOFS North Atlantic Bloom Experiment, Deep-Sea Res. Pt. II, 40, 91–114, 1993.
Loisel, H., Nicolas, J.-M., Sciandra, A., Stramski, D., and Poteau, A.: Spectral dependency of optical backscattering by marine particles from satellite remote sensing of the global ocean, J. Geophys. Res., 111, C09024, https://doi.org/10.1029/2005JC003367, 2006.
Lønborg, C., Martínez-García, S., Teira, E., and Álvarez-Salgado, X. A.: Bacterial carbon demand and growth efficiency in a coastal upwelling system, Aquat. Microb. Ecol., 63, 183–191, 2011.
MacIntyre, H. L., Kana, T. M., Anning, T., and Geider, R. J.: Photoacclimation of irradiance response curves and photosynthetic pigments in microalgae and cyanobacteria, J. Phycol., 38, 17–38, https://doi.org/10.1046/j.1529-8817.2002.00094.x, 2002.
Manning, C. C., Stanley, R. H. R., Nicholson, D. P., Smith, J. M., Pennington, J. T., Fewings, M. R., Squibb, M. E., and Chavez, F. P.: Impact of recently upwelled water on productivity investigated using in situ and incubation-based methods in Monterey Bay, J. Geophys. Res.-Oceans, 122, 1901–1926, 2017.
Marra, J.: Approaches to the measurement of plankton production, Phytoplankt, Product. Carbon Assim. Mar. Freshw. Ecosyst., 78–108, 2002.
Marra, J.: Net and gross productivity: weighing in with 14C, Aquat. Microb. Ecol., 56, 123–131, https://doi.org/10.3354/ame01306, 2009.
Morel, A., Huot, Y., Gentili, B., Werdell, P. J., Hooker, S. B., and Franz, B. A.: Examining the consistency of products derived from various ocean color sensors in open ocean (Case 1) waters in the perspective of a multi-sensor approach, Remote Sens. Environ., 111, 69–88, 2007.
Murphy, J. and Riley, J. P.: A modified single solution method for the determination of phosphate in natural waters, Anal. Chim. Acta, 27, 31–36, 1962.
Needham, D. M. and Fuhrman, J. A.: Pronounced daily succession of phytoplankton, archaea and bacteria following a spring bloom, Nat. Microbiol., 1, 16005, https://doi.org/10.1038/NMICROBIOL.2016.5, 2016.
Nicholson, D. P., Wilson, S. T., Doney, S. C., and Karl, D. M.: Quantifying subtropical North Pacific gyre mixed layer primary productivity from Seaglider observations of diel oxygen cycles, Geophys. Res. Lett., 42, 4032–4039, 2015.
Oubelkheir, K. and Sciandra, A.: Diel variations in particle stocks in the oligotrophic waters of the Ionian Sea (Mediterranean), J. Marine Syst., 74, 364–371, 2008.
Quay, P. D., Peacock, C., Björkman, K., and Karl, D. M., Measuring primary production rates in the ocean: Enigmatic results between incubation and non‐incubation methods at Station ALOHA, Global Biogeochem. Cy., 24, 3143, https://doi.org/10.1029/2001JC001195, 2010.
Raymond, P. A., Zappa, C. J., Butman, D., Bott, T. L., Potter, J., Mulholland, P., Laursen, A. E., McDowell, W. H., and Newbold, D.: Scaling the gas transfer velocity and hydraulic geometry in streams and small rivers, Limnol. Oceanogr. Fluids Environ., 2, 41–53, 2012.
Reuer, M. K., Barnett, B. A., Bender, M. L., Falkowski, P. G., and Hendricks, M. B.: New estimates of Southern Ocean biological production rates from O2∕Ar ratios and the triple isotope composition of O2, Deep-Sea Res. Pt. I, 54, 951–974, 2007.
Ribalet, F., Swalwell, J., Clayton, S., Jiménez, V., Sudek, S., Lin, Y., Johnson, Z. I., Worden, A. Z., and Armbrust, E. V.: Light-driven synchrony of Prochlorococcus growth and mortality in the subtropical Pacific gyre, P. Natl. Acad. Sci. USA, 112, 8008–8012, 2015.
Riley, J. P.: Methods of seawater analysis, edited by: Grasshoff, K., xv + 317, 43–60, Chemie, Weinheim and New York, 1977.
Robinson, C. and Williams, P. J. L. B.: Plankton net community production and dark respiration in the Arabian Sea during September 1994, Deep-Sea Res. Pt. II, 46, 745–765, 1999.
Robinson, C., Archer, S. D., and Williams, P. J. L. B.: Microbial dynamics in coastal waters of East Antarctica: plankton production and respiration, Mar. Ecol.-Prog. Ser., 180, 23–36, 1999.
Robinson, C., Serret, P., Tilstone, G., Teira, E., Zubkov, M. V., Rees, A. P., and Woodward, E. M. S.: Plankton respiration in the eastern Atlantic Ocean, Deep-Sea Res. Pt. I, 49, 787–813, 2002.
Roesler, C. S. and Barnard, A. H.: Optical proxy for phytoplankton biomass in the absence of photophysiology: Rethinking the absorption line height, Methods Oceanogr., 7, 79–94, 2013.
Rosengard, S. Z., Izett, R. W., Burt, W. J., Schuback, N., and Tortell, P. D.: rosengard-tortell-oc2017, Zenodo, https://doi.org/10.5281/zenodo.3269887, 2019.
Savoye, N., Benitez-Nelson, C., Burd, A. B., Cochran, J. K., Charette, M., Buesseler, K. O., Jackson, G. A., Roy-Barman, M., Schmidt, S., and Elskens, M.: 234Th sorption and export models in the water column: a review, Mar. Chem., 100, 234–249, 2006.
Schuback, N. and Tortell, P. D.: Diurnal regulation of photosynthetic light absorption, electron transport and carbon fixation in two contrasting oceanic environments, Biogeosciences, 16, 1381–1399, https://doi.org/10.5194/bg-16-1381-2019, 2019.
Schuback, N., Flecken, M., Maldonado, M. T., and Tortell, P. D.: Diurnal variation in the coupling of photosynthetic electron transport and carbon fixation in iron-limited phytoplankton in the NE subarctic Pacific, Biogeosciences, 13, 1019–1035, https://doi.org/10.5194/bg-13-1019-2016, 2016.
Siegel, D. A., Dickey, T. D., Washburn, L., Hamilton, M. K., and Mitchell, B. G.: Optical determination of particulate abundance and production variations in the oligotrophic ocean, Deep-Sea Res. Pt. A, 36, 211–222, 1989.
Stanley, R. H. R., Kirkpatrick, J. B., Cassar, N., Barnett, B. A., and Bender, M. L.: Net community production and gross primary production rates in the western equatorial Pacific, Global Biogeochem. Cy., 24, GB4001, https://doi.org/10.1029/2009GB003651, 2010.
Stramska, M. and Dickey, T. D.: Short-term variations of the bio-optical properties of the ocean in response to cloud-induced irradiance fluctuations, J. Geophys. Res.-Oceans, 97, 5713–5721, 1992.
Stramska, M. and Dickey, T. D.: Modeling phytoplankton dynamics in the northeast Atlantic during the initiation of the spring bloom, J. Geophys. Res.-Oceans, 99, 10241–10253, 1994.
Stramska, M., Stramski, D., Hapter, R., Kaczmarek, S., and Stoń, J. S.: Bio-optical relationships and ocean color algorithms for the north polar region of the Atlantic, J. Geophys. Res., 108, 3143, https://doi.org/10.1029/2001JC001195, 2003.
Stramski, D. and Kiefer, D. A.: Light scattering by microorganisms in the open ocean, Prog. Oceanogr., 28, 343–383, https://doi.org/10.1016/0079-6611(91)90032-H, 1991.
Stramski, D. and Reynolds, R. A.: Diel variations in the optical properties of a marine diatom, Limnol. Oceanogr., 38, 1347–1364, 1993.
Stukel, M. R., Aluwihare, L. I., Barbeau, K. A., Chekalyuk, A. M., Goericke, R., Miller, A. J., Ohman, M. D., Ruacho, A., Song, H., and Stephens, B. M.: Mesoscale ocean fronts enhance carbon export due to gravitational sinking and subduction, P. Natl. Acad. Sci. USA, 114, 1252–1257, 2017.
Sullivan, J. M., Twardowski, M. S., Donaghay, P. L., and Freeman, S. A.: Use of optical scattering to discriminate particle types in coastal waters, Appl. Optics, 44, 1667, https://doi.org/10.1364/AO.44.001667, 2005.
Thomas, A. C. and Weatherbee, R. A.: Satellite-measured temporal variability of the Columbia River plume, Remote Sens. Environ., 100, 167–178, https://doi.org/10.1016/J.RSE.2005.10.018, 2006.
Thomson, R. E. and Fine, I. V.: Estimating Mixed Layer Depth from Oceanic Profile Data, J. Atmos. Ocean. Tech., 20, 319–329, https://doi.org/10.1175/1520-0426(2003)020<0319:EMLDFO>2.0.CO;2, 2003.
Thyssen, M., Grégori, G. J., Grisoni, J.-M., Pedrotti, M. L., Mousseau, L., Artigas, L. F., Marro, S., Garcia, N., Passafiume, O., and Denis, M. J.: Onset of the spring bloom in the northwestern Mediterranean Sea: influence of environmental pulse events on the in situ hourly-scale dynamics of the phytoplankton community structure, Front. Microbiol., 5, 387, https://doi.org/10.3389/fmicb.2014.00387, 2014.
Tortell, P. D.: Dissolved gas measurements in oceanic waters made by membrane inlet mass spectrometry, Limnol. Oceanogr.-Meth., 3, 24–37, 2005.
Tortell, P. D., Guéguen, C., Long, M. C., Payne, C. D., Lee, P., and DiTullio, G. R.: Spatial variability and temporal dynamics of surface water pCO2, ΔO2∕Ar and dimethylsulfide in the Ross Sea, Antarctica, Deep-Sea Res. Pt. I, 58, 241–259, 2011.
Tortell, P. D., Asher, E. C., Ducklow, H. W., Goldman, J. A. L., Dacey, J. W. H., Grzymski, J. J., Young, J. N., Kranz, S. A., Bernard, K. S., and Morel, F. M. M.: Metabolic balance of coastal Antarctic waters revealed by autonomous pCO2 and ΔO2∕Ar measurements, Geophys. Res. Lett., 41, 6803–6810, 2014.
Turner, R. E., Qureshi, N., Rabalais, N. N., Dortch, Q., Justic, D., Shaw, R. F., and Cope, J.: Fluctuating silicate: nitrate ratios and coastal plankton food webs, P. Natl. Acad. Sci. USA, 95, 13048–13051, 1998.
Twardowski, M. S., Boss, E., Macdonald, J. B., Pegau, W. S., Barnard, A. H., and Zaneveld, J. R. V.: A model for estimating bulk refractive index from the optical backscattering ratio and the implications for understanding particle composition in case I and case II waters, J. Geophys. Res.-Oceans, 106, 14129–14142, https://doi.org/10.1029/2000JC000404, 2001.
Waite, A. M. and Nodder, S. D.: The effect of in situ iron addition on the sinking rates and export flux of Southern Ocean diatoms, Deep-Sea Res. Pt. II, 48, 2635–2654, 2001.
Wanninkhof, R.: Relationship between wind speed and gas exchange over the ocean revisited, Limnol. Oceanogr.-Meth., 12, 351–362, 2014.
Weiss, R. F. and Price, B. A.: Nitrous oxide solubility in water and seawater, Mar. Chem., 8, 347–359, 1980.
Westberry, T., Behrenfeld, M. J., Siegel, D. A., and Boss, E.: Carbon-based primary productivity modeling with vertically resolved photoacclimation, Global Biogeochem. Cy., 22, GB2024, https://doi.org/10.1029/2007GB003078, 2008.
White, A. E., Barone, B., Letelier, R. M., and Karl, D. M.: Productivity diagnosed from the diel cycle of particulate carbon in the North Pacific Subtropical Gyre, Geophys. Res. Lett., 44, 3752–3760, 2017.
Wu, C.-J., Chiang, K.-P., and Liu, H.: Diel feeding pattern and prey selection of mesozooplankton on microplankton community, J. Exp. Mar. Biol. Ecol., 390, 134–142, 2010.
Zeng, C., Rosengard, S. Z., Burt, W., Peña, M. A., Nemcek, N., Zeng, T., Arrigo, K. R., and Tortell, P. D.: Optically-derived estimates of phytoplankton size class and taxonomic group biomass in the Eastern Subarctic Pacific Ocean, Deep-Sea Res. Pt. I, 136, 107–118, 2018.