the Creative Commons Attribution 4.0 License.
the Creative Commons Attribution 4.0 License.
 | 15 Mar 2021
Deep maxima of phytoplankton biomass, primary production and bacterial production in the Mediterranean Sea
France Van Wambeke
Julia Uitz
Emmanuel S. Boss
Céline Dimier
Julie Dinasquet
Anja Engel
Nils Haëntjens
María Pérez-Lorenzo
Vincent Taillandier
Birthe Zäncker
The deep chlorophyll maximum (DCM) is a ubiquitous feature of phytoplankton vertical distribution in stratified waters that is relevant to our understanding of the mechanisms that underpin the variability in photoautotroph ecophysiology across environmental gradients and has implications for remote sensing of aquatic productivity. During the PEACETIME (Process studies at the air-sea interface after dust deposition in the Mediterranean Sea) cruise, carried out from 10 May to 11 June 2017, we obtained 23 concurrent vertical profiles of phytoplankton chlorophyll a, carbon biomass and primary production, as well as heterotrophic prokaryotic production, in the western and central Mediterranean basins. Our main aims were to quantify the relative role of photoacclimation and enhanced growth as underlying mechanisms of the DCM and to assess the trophic coupling between phytoplankton and heterotrophic prokaryotic production. We found that the DCM coincided with a maximum in both the biomass and primary production but not in the growth rate of phytoplankton, which averaged 0.3 d−1 and was relatively constant across the euphotic layer. Photoacclimation explained most of the increased chlorophyll a at the DCM, as the ratio of carbon to chlorophyll a (C:Chl a) decreased from ca. 90–100 (g:g) at the surface to 20–30 at the base of the euphotic layer, while phytoplankton carbon biomass increased from ca. 6 mg C m−3 at the surface to 10–15 mg C m−3 at the DCM. As a result of photoacclimation, there was an uncoupling between chlorophyll a-specific and carbon-specific productivity across the euphotic layer. The ratio of fucoxanthin to total chlorophyll a increased markedly with depth, suggesting an increased contribution of diatoms at the DCM. The increased biomass and carbon fixation at the base of the euphotic zone was associated with enhanced rates of heterotrophic prokaryotic activity, which also showed a surface peak linked with warmer temperatures. Considering the phytoplankton biomass and turnover rates measured at the DCM, nutrient diffusive fluxes across the nutricline were able to supply only a minor fraction of the photoautotroph nitrogen and phosphorus requirements. Thus the deep maxima in biomass and primary production were not fuelled by new nutrients but likely resulted from cell sinking from the upper layers in combination with the high photosynthetic efficiency of a diatom-rich, low-light acclimated community largely sustained by regenerated nutrients. Further studies with increased temporal and spatial resolution will be required to ascertain if the peaks of deep primary production associated with the DCM persist across the western and central Mediterranean Sea throughout the stratification season.
- Article
(2599 KB) - Full-text XML
-
Supplement
(2093 KB) - BibTeX
- EndNote


One of the most remarkable features of phytoplankton distribution in lakes and oceans is the presence of a deep chlorophyll maximum (DCM), typically located at the base of the euphotic layer and coinciding with the top of the nutricline, which occurs in permanently and seasonally stratified water columns (Herbland and Voituriez, 1979; Cullen, 2015). Multiple mechanisms that are not mutually exclusive may contribute to the development of a DCM, including photoacclimation (the increase in cellular chlorophyll content as a response to low-light conditions) (Geider, 1987), enhanced growth conditions at the layer where elevated nutrient diffusion from below coexists with still sufficient irradiance (Beckmann and Hense, 2007), a decrease in sinking rates near the pycnocline (Lande and Wood, 1987), and changes in buoyancy regulation or swimming behaviour of cells (Durham and Stocker, 2012). Photoacclimation is a rapid process that takes place in a matter of hours (Fisher et al., 1996), and therefore part of the increased chlorophyll concentration at the DCM is always the result of a decrease in the ratio of phytoplankton carbon to chlorophyll a (C:Chl a), which results mainly from decreased irradiance but is also favoured by enhanced nutrient supply (Geider et al., 1996). Although the role of photoacclimation, particularly in strongly oligotrophic environments, has long been acknowledged (Steele, 1964), the fact that Chl a is used routinely as a surrogate for photoautotrophic biomass has helped to fuel the assumption, often found in the scientific literature and in textbooks, that the DCM is always a maximum in the biomass and, by extension, the growth rate of phytoplankton. The assessment of total phytoplankton biomass along vertical gradients has been traditionally hindered by the time-consuming nature of microscopy techniques, but the increasing use of optical properties such as the particulate beam attenuation and backscattering coefficients to estimate the concentration of suspended particles in the water column (Martinez-Vicente et al., 2013; Behrenfeld et al., 2016) has allowed for the characterization of biogeographic and seasonal patterns in the vertical variability of phytoplankton chlorophyll and biomass in stratified environments (Fennel and Boss, 2003; Mignot et al., 2014; Cullen, 2015).
It is now established that the nature of the DCM changes fundamentally along a gradient of thermal stability and nutrient availability (Cullen, 2015). In the oligotrophic extreme, represented by permanently stratified regions such as the subtropical gyres, the DCM is mostly a result of photoacclimation and does not constitute a biomass maximum (Marañón et al., 2000; Pérez et al., 2006; Mignot et al., 2014). However, a biomass maximum, located at a shallower depth than the DCM, can develop in oligotrophic conditions as a result of the interplay between phytoplankton growth, biological losses and sinking (Fennel and Boss, 2003). In mesotrophic regimes, such as seasonally stratified temperate seas during summer, the DCM is often also a biomass maximum that manifests as a peak in beam attenuation or backscattering (Mignot et al., 2014). Both ends of this trophic gradient can be found in the Mediterranean Sea along its well-known longitudinal trend in nutrient availability, phytoplankton biomass and productivity (Antoine et al., 1995; D'Ortenzio and Ribera d'Alcalà, 2009; Lavigne et al., 2015). Using data from Biogeochemical-Argo (BGC-Argo) profiling floats deployed throughout the Mediterranean, Barbieux et al. (2019) established general patterns in the distribution and seasonal dynamics of biomass (estimated from the particulate backscattering coefficient) and chlorophyll subsurface maxima. They found that in the western Mediterranean Sea, during late spring and summer, a subsurface biomass maximum develops that coincides with a chlorophyll maximum and is located roughly at the same depth as the nutricline and above the 0.3 isolume. In contrast, in the Ionian and Levantine seas the DCM, which has a smaller magnitude, arises solely from photoacclimation and is located well above the nutricline at a depth that corresponds closely with the 0.3 isolume (Barbieux et al., 2019). The presence of a subsurface or deep biomass maximum may suggest that a particularly favourable combination of light and nutrients occurs at that depth, leading to enhanced phytoplankton growth and new production. It remains unknown, however, whether phytoplankton growth and biomass turnover rates are actually higher at the depth of the biomass maximum. An additional source of uncertainty is that both the particulate attenuation and backscattering coefficients relate not only to phytoplankton abundance but to the entire pool of particles, including non-algal and detrital particles, which are known to contribute significantly to total suspended matter in oligotrophic regions (Claustre et al., 1999). Combining direct and specific measurements of phytoplankton production (with the 14C uptake technique) and biovolume (with flow cytometry) offers a way to determine photoautotrophic biomass turnover rates (Kirchman, 2002; Marañón et al., 2014) and thus gain further insight into the dynamics and underlying mechanisms of the DCM. By investigating concurrently the vertical variability in heterotrophic prokaryotic production in relation to phytoplankton standing stocks and productivity, it is also possible to ascertain potential implications of the DCM for trophic coupling within the microbial-plankton community.
The PEACETIME (Process studies at the air-sea interface after dust deposition in the Mediterranean Sea) cruise, which investigated atmospheric deposition fluxes and their impact on biogeochemical cycling in the Mediterranean Sea (Guieu et al., 2020), covered the western, Tyrrhenian and Ionian regions during late spring 2017, when the DCM was already well developed. Here we describe the vertical variability in chlorophyll a concentration, phytoplankton biomass and production, and heterotrophic prokaryotic production. Our main goals are (1) to determine the extent to which photoacclimation, enhanced phytoplankton biomass, and enhanced productivity and growth underlie the DCM; (2) to characterize the vertical variability in C:Chl a and C-biomass-specific and Chl a-specific production; and (3) to assess the trophic coupling between phytoplankton photosynthetic activity and heterotrophic bacterial production. The results presented provide a context, in terms of the abundance and activity of key microbial-plankton groups, for other ecological and biogeochemical investigations carried out during the PEACETIME cruise and included in this special issue.
2.1 Oceanographic cruise
A detailed description of the ensemble of atmospheric and oceanographic observations conducted during the PEACETIME process study can be found in Guieu et al. (2020). Here we report measurements conducted during an oceanographic cruise on board RV Pourquoi Pas?, which took place in the western and central Mediterranean Sea during the period 10 May–11 June 2017 (Fig. 1). The cruise focused on three long-stay stations which were occupied for 4–5 d: station TYRR, located in the Tyrrhenian Sea (39∘20.4′ N, 12∘35.6′ E); station ION, located in the Ionian Sea (35∘29.1′ N, 19∘47.8′ E); and station FAST, located in the Balearic Sea (37∘ 56.8′ N, 2∘54.6′ E). The latter station was occupied as part of a fast-action response to investigate the biogeochemical impacts of an event of atmospheric wet deposition that occurred during the period 3–5 June (Guieu et al., 2020). In addition, 10 short-stay stations were occupied for 8 h. At all stations, CTD (conductivity–pressure–temperature) casts were conducted, and seawater samples were obtained for the measurement of the abundance, biomass and productivity of phytoplankton and bacterioplankton.
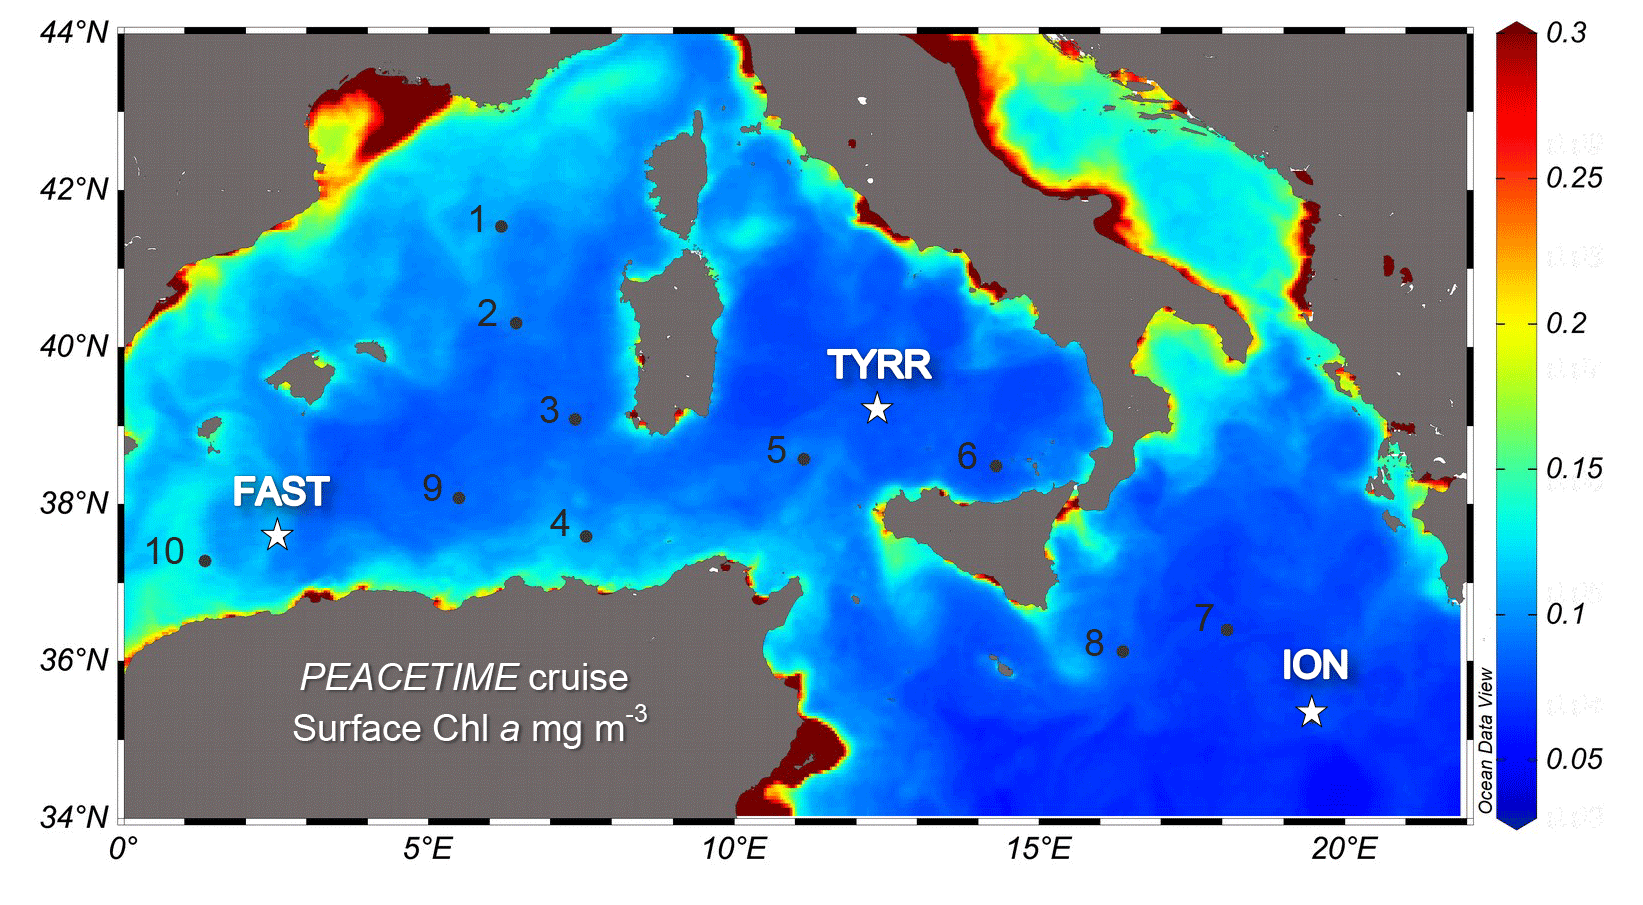
Figure 1Location of the sampled stations superimposed on a map of ocean colour-based surface chlorophyll a concentration (mg m−3) averaged over the period of the PEACETIME cruise (12 May–8 June 2017). Dots and stars indicate the location of short and long stations, respectively. Ocean colour data from MODIS/Aqua, NASA Goddard Space Flight Center.
2.2 Sampling, hydrography and irradiance
We used a Sea-Bird Electronics's SBE911+ CTD underwater unit interfaced with a sampling carousel of 24 Niskin bottles, a Chelsea Acquatracka 3 fluorometer and a LI-COR Biospherical PAR (photosynthetically active radiation) sensor. At the short stations, CTD casts were conducted at 04:00–07:00 LT (with the exception of station 1, which was sampled at 08:40 LT). At the long stations, CTD casts were conducted throughout the day, but in the present report, to avoid the effect of diel variability, we only consider plankton samples from the pre-dawn casts (04:00–05:00 LT). Using CTD casts conducted between 06:00 and 16:00 LT, we calculated the value of the euphotic-layer vertical attenuation coefficient (kd) after fitting the PAR data to
where PAR(0−) is the irradiance just below the surface. From this model we calculated the % PAR level for each sampling depth, which was used to determine the incubation irradiance for each sample during the primary production experiments (see Sect. 2.5 below). We compared the daily integrated values of total solar irradiance (TSI) from the ship's pyranometer (Young 70721) and the theoretical-incident PAR above the surface (PAR(0+)) from the model of Frouin et al. (1989) and used the highest ratio (corresponding to the clearest-sky conditions encountered during the cruise) to obtain a conversion factor (0.42) that transforms TSI into PAR(0+). TSI units (W m−2) were converted to photon flux units () by multiplying by 4.6, and a ratio of PAR (0−) to PAR(0+) of 0.958 was applied (Mobley and Boss, 2012). Using kd and PAR(0−) values for each sampling day the daily irradiance reaching each sampling depth z was calculated with Eq. (1).
2.3 Phytoplankton abundance and biomass
The abundance of phytoplankton cells with an equivalent spherical diameter (ESD) below 5–6 µm was determined with flow cytometry. Seawater samples (4.5 mL in volume) from 8 to 10 depths in the euphotic zone were fixed with glutaraldehyde grade I (1 % final concentration), flash-frozen with liquid nitrogen and stored at −80 ∘C until analysis. Cell counts were performed on a FACSCanto II flow cytometer (Becton Dickinson) with a flow rate of 145 µL min−1 and a counting time of 5 min so that the total analysed volume for each sample was 725 µL. The separation of different autotrophic populations (Synechococcus, picoeukaryotes and small nanophytoplankton) was based on their scattering and fluorescence signals according to Marie et al. (2000) and Larsen et al. (2001). The abundance of Prochlorococcus was determined on 2 mL samples, also fixed with glutaraldehyde grade I (1 % final concentration) and analysed with a FACSCalibur flow cytometer (Becton Dickinson) using a flow rate of 39–41 µL min−1 (Zäncker et al., 2020). To obtain estimates of carbon biomass, we applied different values of cellular carbon content for each group. For Prochlorococcus and Synechococcus, we used a cell carbon content of 0.06 and 0.15 pg C per cell, respectively, which is the mean value obtained by Buitenhuis et al. (2012) from a compilation of multiple open-ocean studies. For picoeukaryotes, we assumed a mean cell diameter of 2 µm and thus a volume of 4.2 µm3 per cell, which gives a carbon content of 0.72 pg C per cell after applying the relationship between cell volume and cell carbon obtained by Marañón et al. (2013) with 22 species of phytoplankton spanning 6 orders of magnitude in cell volume. For small nanophytoplankton, we assumed a mean cell diameter of 4 µm and a volume of 34 µm3 per cell, which gives a carbon content of 4.5 pg C per cell.
The abundance of phytoplankton cells with an ESD above 5 µm was determined with an Imaging FlowCytoBot (IFCB) (Olson and Sosik, 2007), which quantitatively images chlorophyll a-fluorescing particles. Samples (4.7 mL) were obtained from six to eight depths in the euphotic zone and screened through a 150 µm mesh to prevent clogging of the instrument. Size–abundance spectra obtained with microscopy image analysis in oligotrophic waters indicate that cells with a volume ≥10 000 µm3 (which, assuming a cylindrical, elongated shape, corresponds roughly to cells with a length of 150 µm and a diameter of 10 µm) contribute on average approximately 1 % of total biovolume (Huete-Ortega et al., 2012; Marañón, 2015). It is thus unlikely that pre-screening of IFCB samples resulted in significant underestimation of total biovolume. From each obtained image, phytoplankton biovolume was computed following Moberg and Sosik (2012). Processed images, metadata and derived morphometric properties were uploaded to EcoTaxa (https://ecotaxa.obs-vlfr.fr/, last access: 9 March 2021). The biovolume concentration was converted into a carbon biomass concentration by applying the mean ratio of carbon to volume obtained by Marañón et al. (2013) for cells larger than 5 µm in ESD (0.11 pg C µm−3). Total phytoplankton biomass was calculated as the sum of the carbon biomass of Prochlorococcus, Synechococcus, picoeukaryotes, nanoeukaryotes and phytoplankton of >5 µm.
2.4 Pigments
Samples for pigment analysis with high-performance liquid chromatography (HPLC) were collected from 12 depths over the 0–250 m range. Depending on particle load, a volume of 2–2.5 L of seawater was vacuum-filtered under low pressure onto Whatman GF/F (glass microfibre filters) filters (ca. 0.7 µm pore size, 25 mm in diameter). The filters were flash-frozen immediately after filtration in liquid nitrogen, stored at during the cruise and shipped back to the laboratory in cryo-shipping containers filled with liquid nitrogen. Filters were extracted in 3 mL of pure methanol at −20 ∘C for 1 h. The extracts were vacuum-filtered through GF/F filters and then analysed (within 24 h) by HPLC using a complete Agilent Technologies system. The pigments were separated and quantified following the protocol described in Ras et al. (2008). Here we report the concentration of total chlorophyll a (TChl a), which includes chlorophyll a and divinyl chlorophyll a. The ratio of fucoxanthin to TChl a was multiplied by different factors to obtain estimates of the diatom contribution to TChl a. The factors used were 1.41 (Uitz et al., 2006), 1.6 (Di Cicco et al., 2017) and 1.74 (Di Cicco, 2014). Because fucoxanthin is also present in non-diatom groups such as haptophytes and pelagophytes (Di Cicco et al., 2017), which can be identified, respectively, by the marker pigments 19′-hexanoyloxyfucoxanthin (hex-fuco) and 19′-butanoyloxyfucoxanthin (but-fuco), we also calculated the fucoxanthin : (hex-fuco+but-fuco) ratio.
2.5 Primary production
Primary production (PP) was measured with the 14C uptake technique using simulated in situ incubations on deck. For each sampling depth (five to six depths distributed between 5 m and the base of the euphotic layer), seawater was transferred from the Niskin bottle to four polystyrene bottles (three light and one dark bottles) of 70 mL in volume, which were amended with 20–40 µCi of NaH14CO3 and incubated for 24 h in on-deck incubators that were refrigerated with running seawater from the ship's continuous water supply. The incubators were provided with different sets of blue and neutral density filters that simulated the following percentages of attenuation: 70 %, 52 %, 38 %, 25 %, 14 %, 7 %, 4 %, 2 % and 1 %. We incubated the samples at an irradiance level (% PAR) as close as possible to the one corresponding to their depth of origin. After incubation, samples were filtered, using a low-pressure vacuum, through 0.2 µm polycarbonate filters (47 mm in diameter). At three depths on each profile (5 m, 15–30 m and the DCM), samples were filtered sequentially through 2 µm and 0.2 µm polycarbonate filters, thus allowing for determining primary production in the picophytoplankton (<2 µm) and the nano- plus microphytoplankton (>2 µm) size classes. All filters were exposed to concentrated HCl fumes overnight to remove non-fixed, inorganic 14C and then transferred to 4 mL plastic scintillation vials to which 4 mL of a scintillation cocktail (Ultima Gold XR) were added.
We also measured dissolved primary production at three depths on each profile (surface, base of the euphotic layer and an intermediate depth), following the method described in Marañón et al. (2004) but using the same incubation bottles employed to determine particulate primary production. Briefly, after incubation one 5 mL aliquot was taken from each incubation bottle and filtered through a 0.2 µm polycarbonate filter (25 mm in diameter), using a low-pressure vacuum. Filters were processed as described above, whereas the filtrates were acidified with 100 µL of 5 M HCl and maintained in an orbital shaker for 12 h. Then, 15 mL of the liquid scintillation cocktail were added to each sample. The radioactivity in all filter and filtrate samples was measured on board with a Packard 1600TR liquid scintillation counter. The percentage of extracellular release (% PER) was calculated as dissolved primary production divided by the sum of dissolved and particulate primary production.
To calculate daily PP, DPM (disintegrations per minute) counts in the dark samples were subtracted from the DPM counts in the light samples, and actual values of dissolved inorganic carbon concentration, determined during the cruise at each sampling depth, were used. Given that all incubations were conducted at SST (sea surface temperature), we applied a temperature correction to the measured rates, by using the Arrhenius–van 't Hoff equation,
where R is the production rate, A is a coefficient, Ea is the activation energy, K is the Boltzmann's constant () and T is temperature in K. The value of production rate obtained for each sampling depth incubated at SST was used to determine A, and then R was calculated for the in situ temperature at each sampling depth. Following Wang et al. (2019), we used a value of Ea=0.61 eV, which corresponds approximately to a Q10 value of 2.3. The turnover rate of phytoplankton biomass (growth rate, d−1) was calculated by dividing the rate of production () by the concentration of phytoplankton carbon (mg C m−3) (Kirchman, 2002).
2.6 Heterotrophic prokaryotic production
Heterotrophic prokaryotic production (BP) was estimated from rates of 3H-leucine incorporation using the microcentrifugation technique (Smith and Azam, 1992) as detailed in Van Wambeke et al. (2020a). Briefly, triplicate 1.5 mL samples and one blank from 10 depths between the surface and 250 m were incubated in the dark in two thermostated incubators set at 18.6 ∘C for upper layers and 15.2 ∘C for deeper layers. Leucine was added at 20 nM final concentration, and the leucine-to-carbon conversion factor used was 1.5 kg C mol−1. Given that in situ temperature varied from 13.4 to 21.6 ∘C, temperature corrections were applied by using a Q10 factor determined on two occasions during the cruise when different samples were incubated simultaneously in the two incubators. We obtained two values of Q10 (3.9 and 3.3), from which an average value of 3.6 was used for the whole BP data set. The same Q10 was applied to assess the contribution of temperature to the variability of BP in the upper water column, by comparing BP at the in situ temperature and at a constant temperature of 17 ∘C.
3.1 Hydrographic conditions
All three long stations were characterized by broadly similar values of sea surface temperature (SST) (20–21 ∘C) and strong thermal stratification, with a 5–6 ∘C thermocline extending over the 10–70 m depth range (Fig. 2a). Compared to TYRR, stations ION and FAST showed warmer SST and a stronger stratification, and station FAST presented the warmest subsurface waters. The depth of maximum vertical stability, as denoted by the Brunt–Väisälä frequency, took a mean value of 14 m at TYRR and 22–23 m at ION and FAST. The short stations covered a wider range of locations and consequently exhibited higher variability in SST and in the strength and vertical extent of the thermocline (Fig. S1 in the Supplement). Throughout the cruise, nutrient concentrations were low (<0.5 µmol L−1 for nitrate and <0.03 µmol L−1 for phosphate) in the upper 50–60 m of the water column (Guieu et al., 2020). The nitracline, defined as the first depth where nitrate concentration exceeded 0.5 µmol L−1, was located at (mean ± SD; standard deviation) 71±3, 105±2 and 78±8 m at stations TYRR, ION and FAST, respectively. The phosphacline, defined as the first depth where phosphate concentration exceeded 0.03 µmol L−1, was deeper: 86±3, 181±7 and 90±5 at TYRR, ION and FAST, respectively (Table 1). At all stations, fluorescence profiles displayed a DCM (see Sect. 3.2) which was located approximately at the 1 % PAR depth and 5–10 m above the 0.3 isolume (Figs. 2b and S1, Table 1). Both the DCM depth and the 1 % PAR depth were shallower at station TYRR (74±4 and 71±8, respectively) than at station ION (96±4 and 94±6, respectively), with station FAST showing intermediate values (Fig. 2b, Table 1). The depths of both the nitracline and the phosphacline were strongly correlated with the DCM depth throughout the cruise (Pearson's r=0.86, n=23, p <0.001 for the nitracline depth and r=0.74, n=23, p <0.001 for the phosphacline depth).
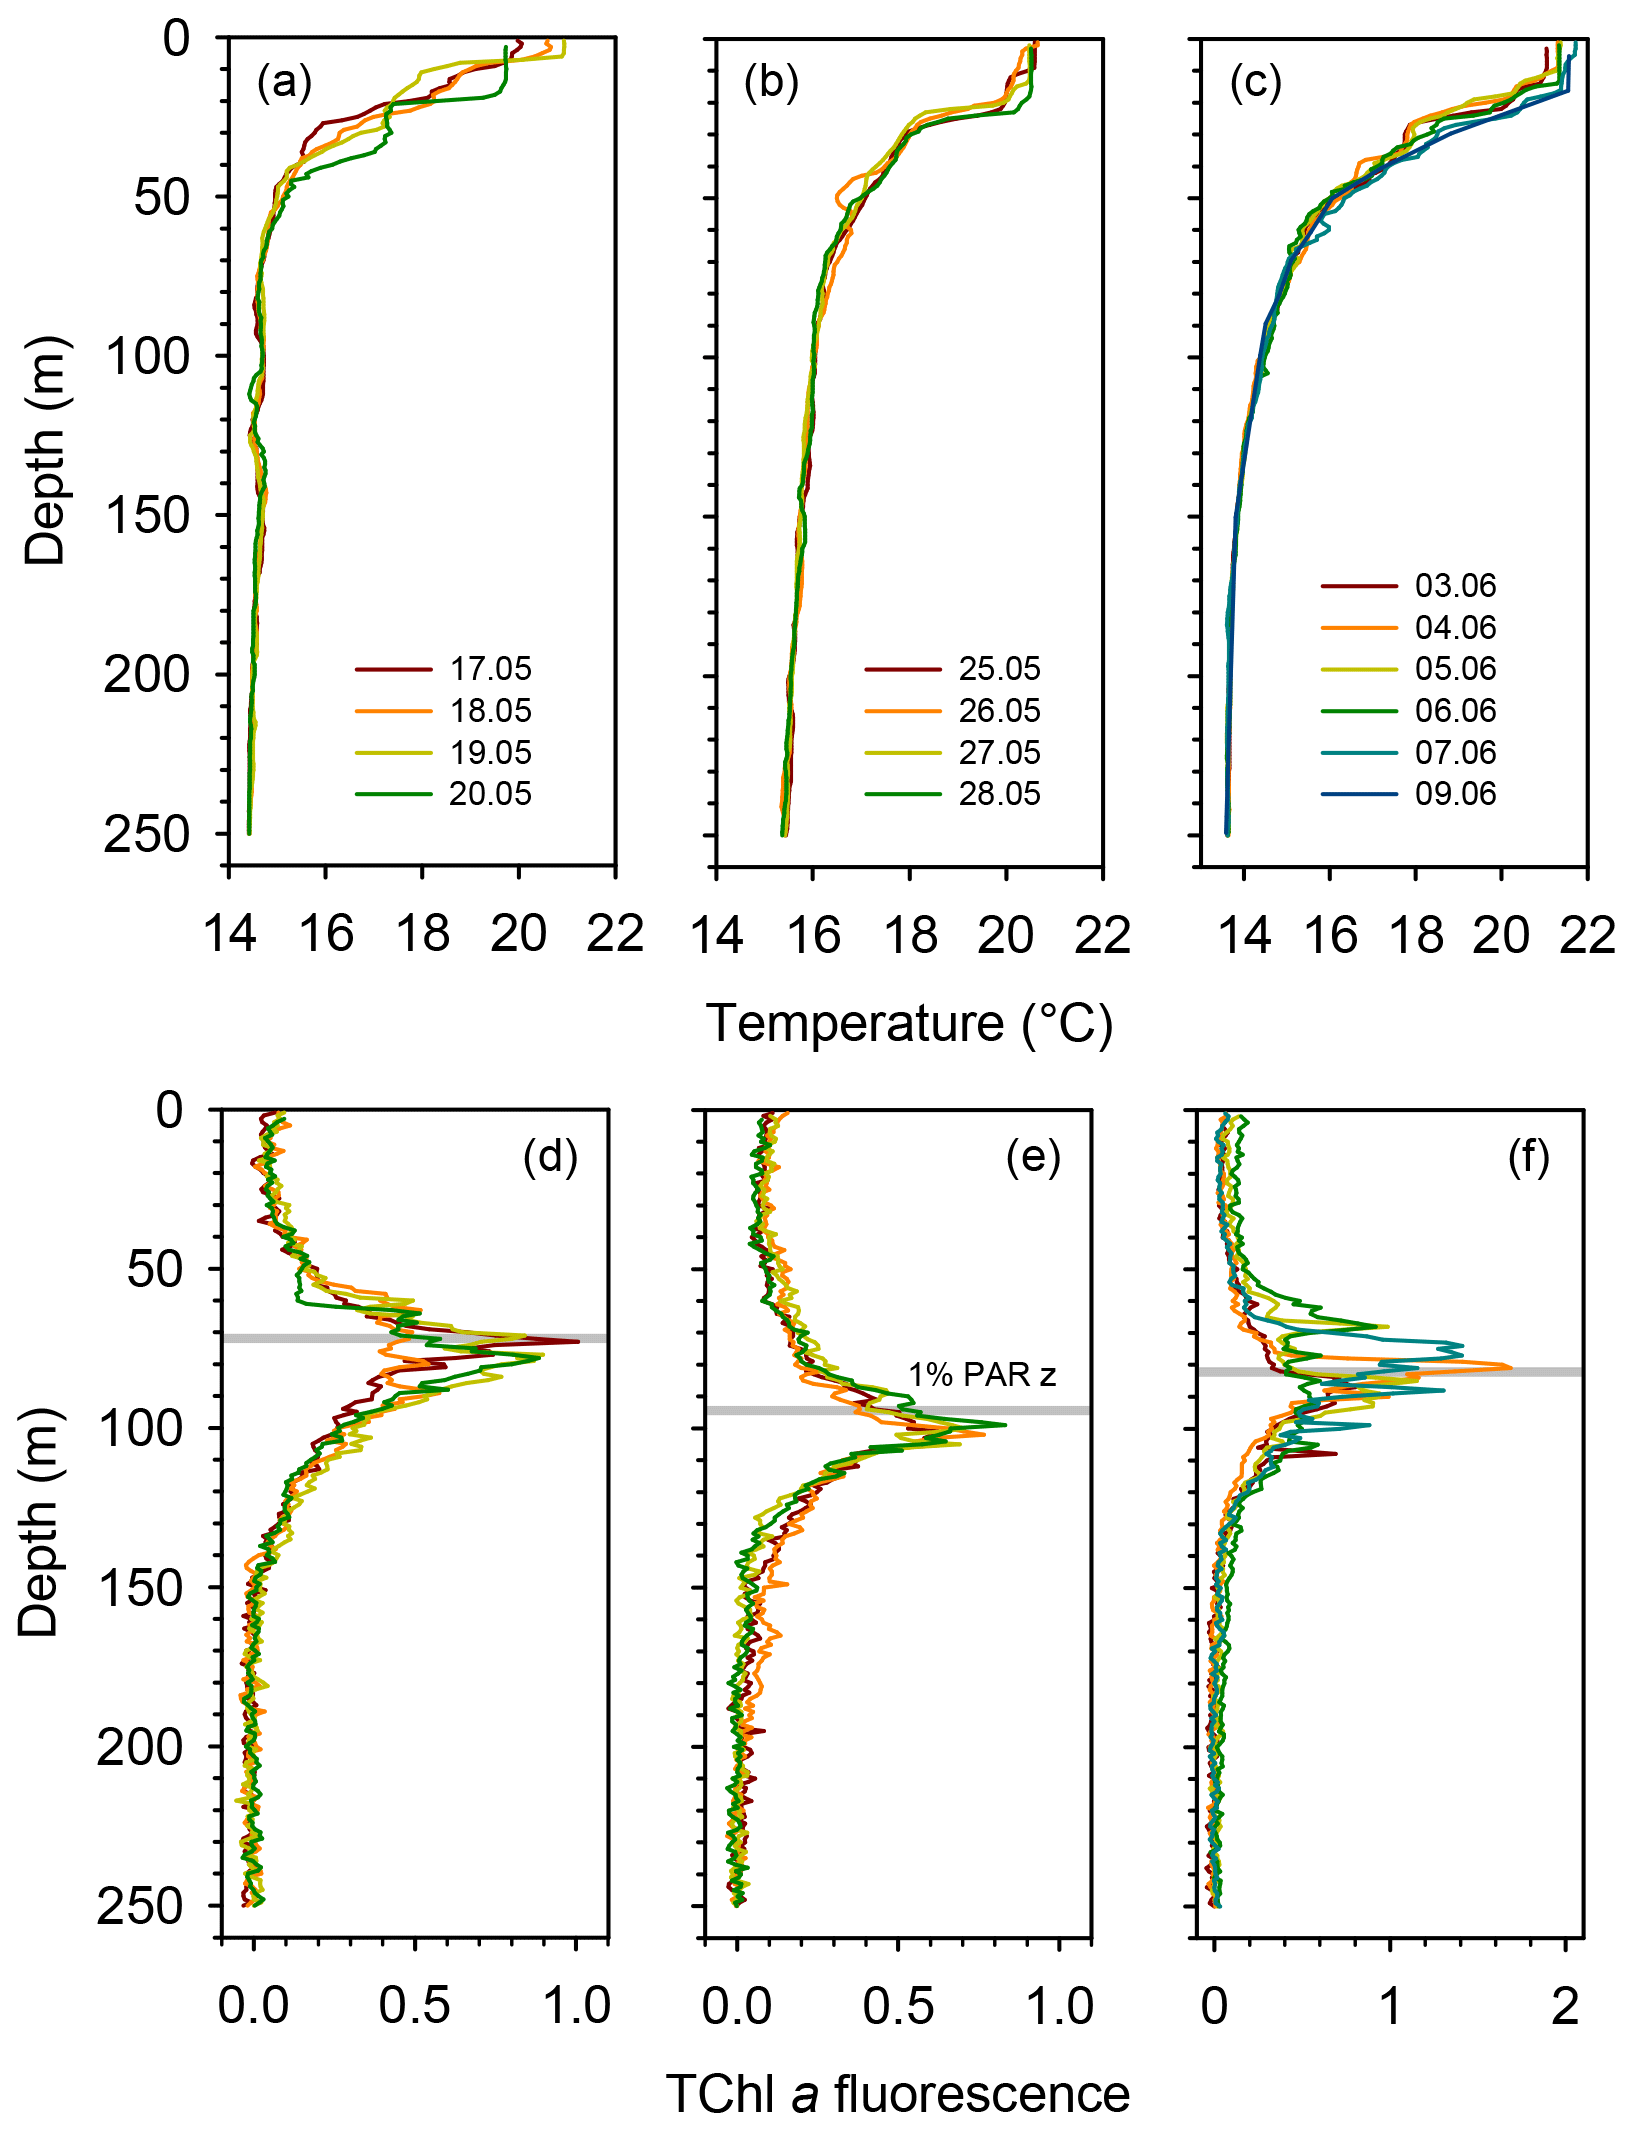
Figure 2Vertical profiles of temperature and fluorescence (0–250 m) during each sampling day at the long stations TYRR (a, c), ION (b, e) and FAST (c, f). The colour code denotes the sampling date in dd.mm format, and the grey bars indicate the mean value of the 1 % PAR depth at each station. The fluorescence signal was calibrated against HPLC-determined total chlorophyll a concentration.
3.2 Phytoplankton total chlorophyll a, biomass and production
Surface total chlorophyll a concentration (TChl a) was low () throughout most of the cruise (Figs. 3a–c and S2a), with the only exception of short station 1, which sampled a filament of enhanced phytoplankton abundance (Fig. 1). The mean surface TChl a was similar at all three long stations (0.07–0.08 mg m−3). All vertical profiles displayed a marked DCM (Figs. 3a–c and S2a), with peak TChl a values in the range 0.4–0.7 mg m−3 at stations TYRR and ION and 0.4–1.0 mg m−3 at station FAST. The mean DCM TChl a at the three stations was similar (0.6 mg m−3) (Table 1). Vertically integrated (from surface to the euphotic layer depth) TChl a was higher and more variable at FAST (21±9 mg m−2) compared with TYRR (16±2 mg m−2) and ION (18±2 mg m−2) (Table 1).
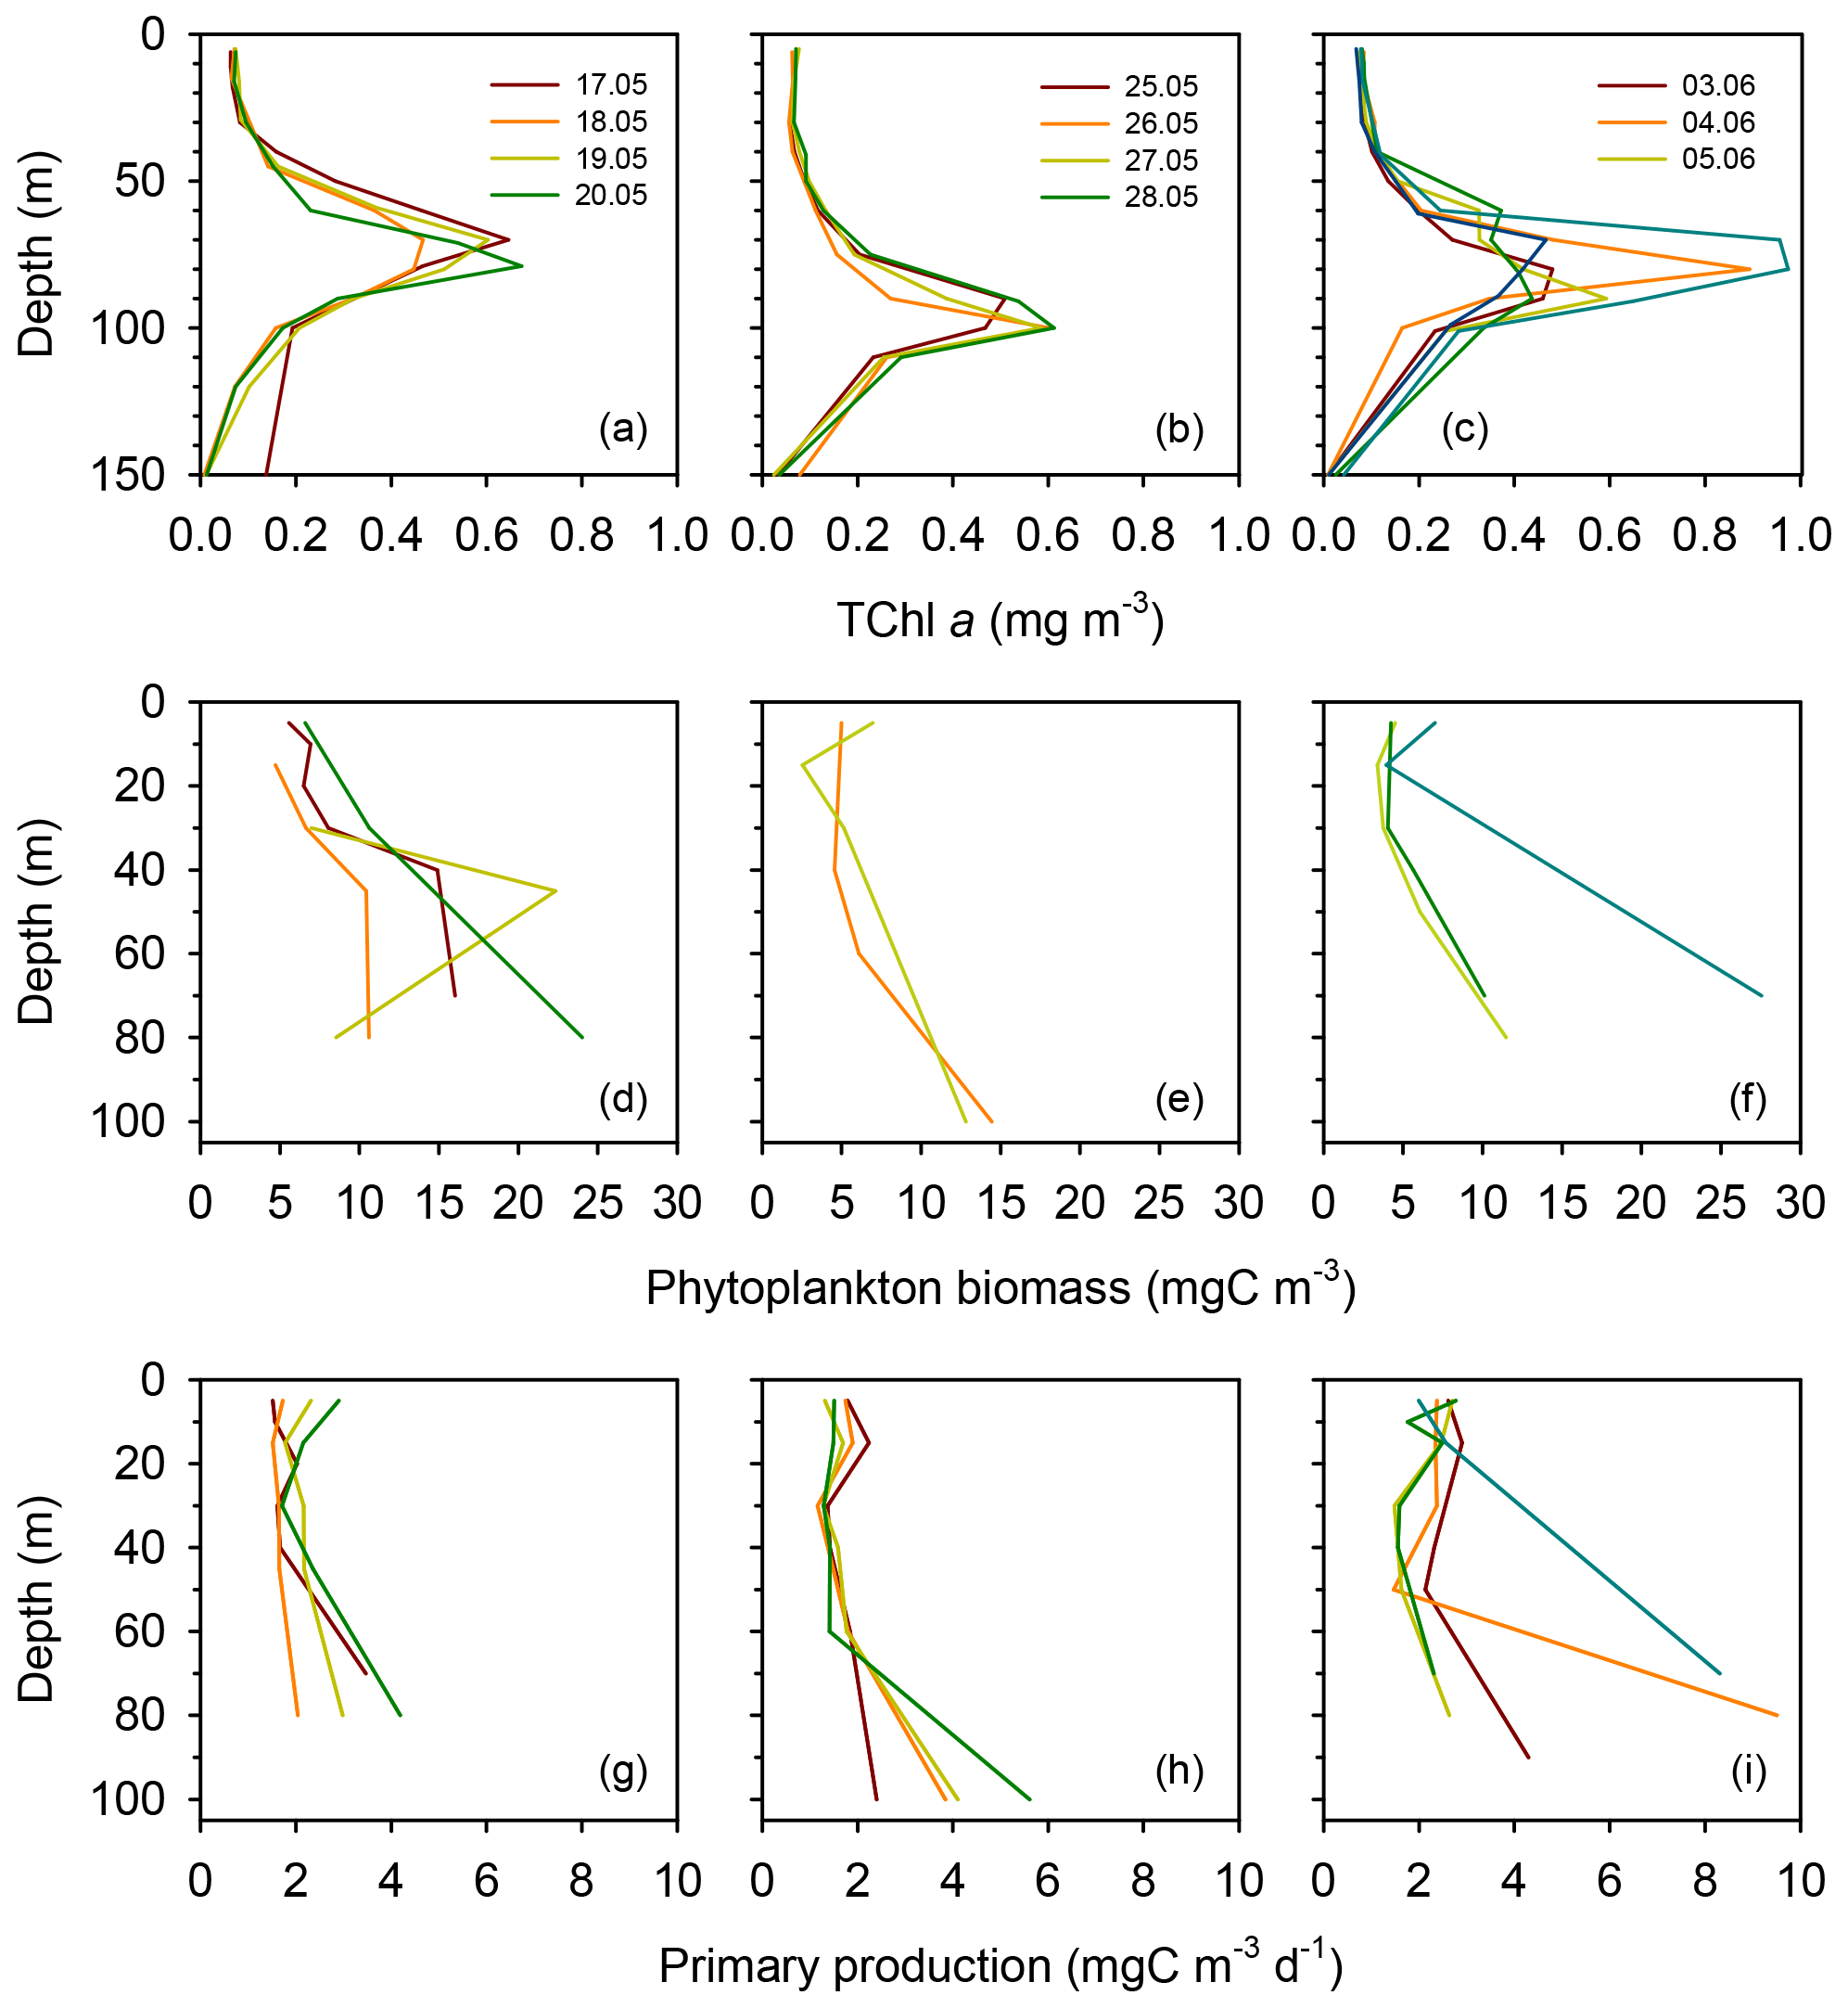
Figure 3Vertical profiles of total chlorophyll a concentration (a–c), phytoplankton biomass concentration (d–f) and primary production (g–i) during each sampling day at the long stations TYRR (a, d, g), ION (b, e, h) and FAST (c, f, i).
Phytoplankton carbon biomass tended to increase with depth, exhibiting maxima at either intermediate depths (40–50 m) or at the base of the euphotic layer (80–100 m) (Figs. 3d–f and S2b). The concentration of phytoplankton C in surface waters was relatively invariant at 6 mg C m−3, whereas mean biomass values at the DCM at stations TYRR, ION and FAST were 15±8, 14±1 and 16±10 mg C m−3, respectively (Table 1). Thus the increase, from the surface to the base of the euphotic layer, in phytoplankton biomass was ca. 2.5-fold, compared with ca. 8-fold for TChl a. Comparing the mean deep to surface ratios in TChl a and C biomass at the three stations indicates that increased phytoplankton biomass was responsible for 29 %–41 % of the increased TChl a at the DCM, while photoacclimation (decreased C:Chl a at depth) was responsible for the remaining 59 %–71 %.
Table 1Mean and standard deviation (in brackets) for different physical, chemical and biological variables at the three long stations. N is the Brunt–Väisälä frequency. Nitracline depth is the first depth at which nitrate concentration reached 0.5 µmol L−1, while phosphacline depth corresponds to the first depth at which phosphate concentration reached 0.03 µmol L−1. Chlorophyll a concentration and particulate primary production (PP) were integrated from the surface to the 1 % PAR depth. Heterotrophic prokaryotic production (BP) was integrated from the surface to 200 m. IFCB: Imaging FlowCytoBot; ESD: equivalent spherical diameter. See Methods for details.
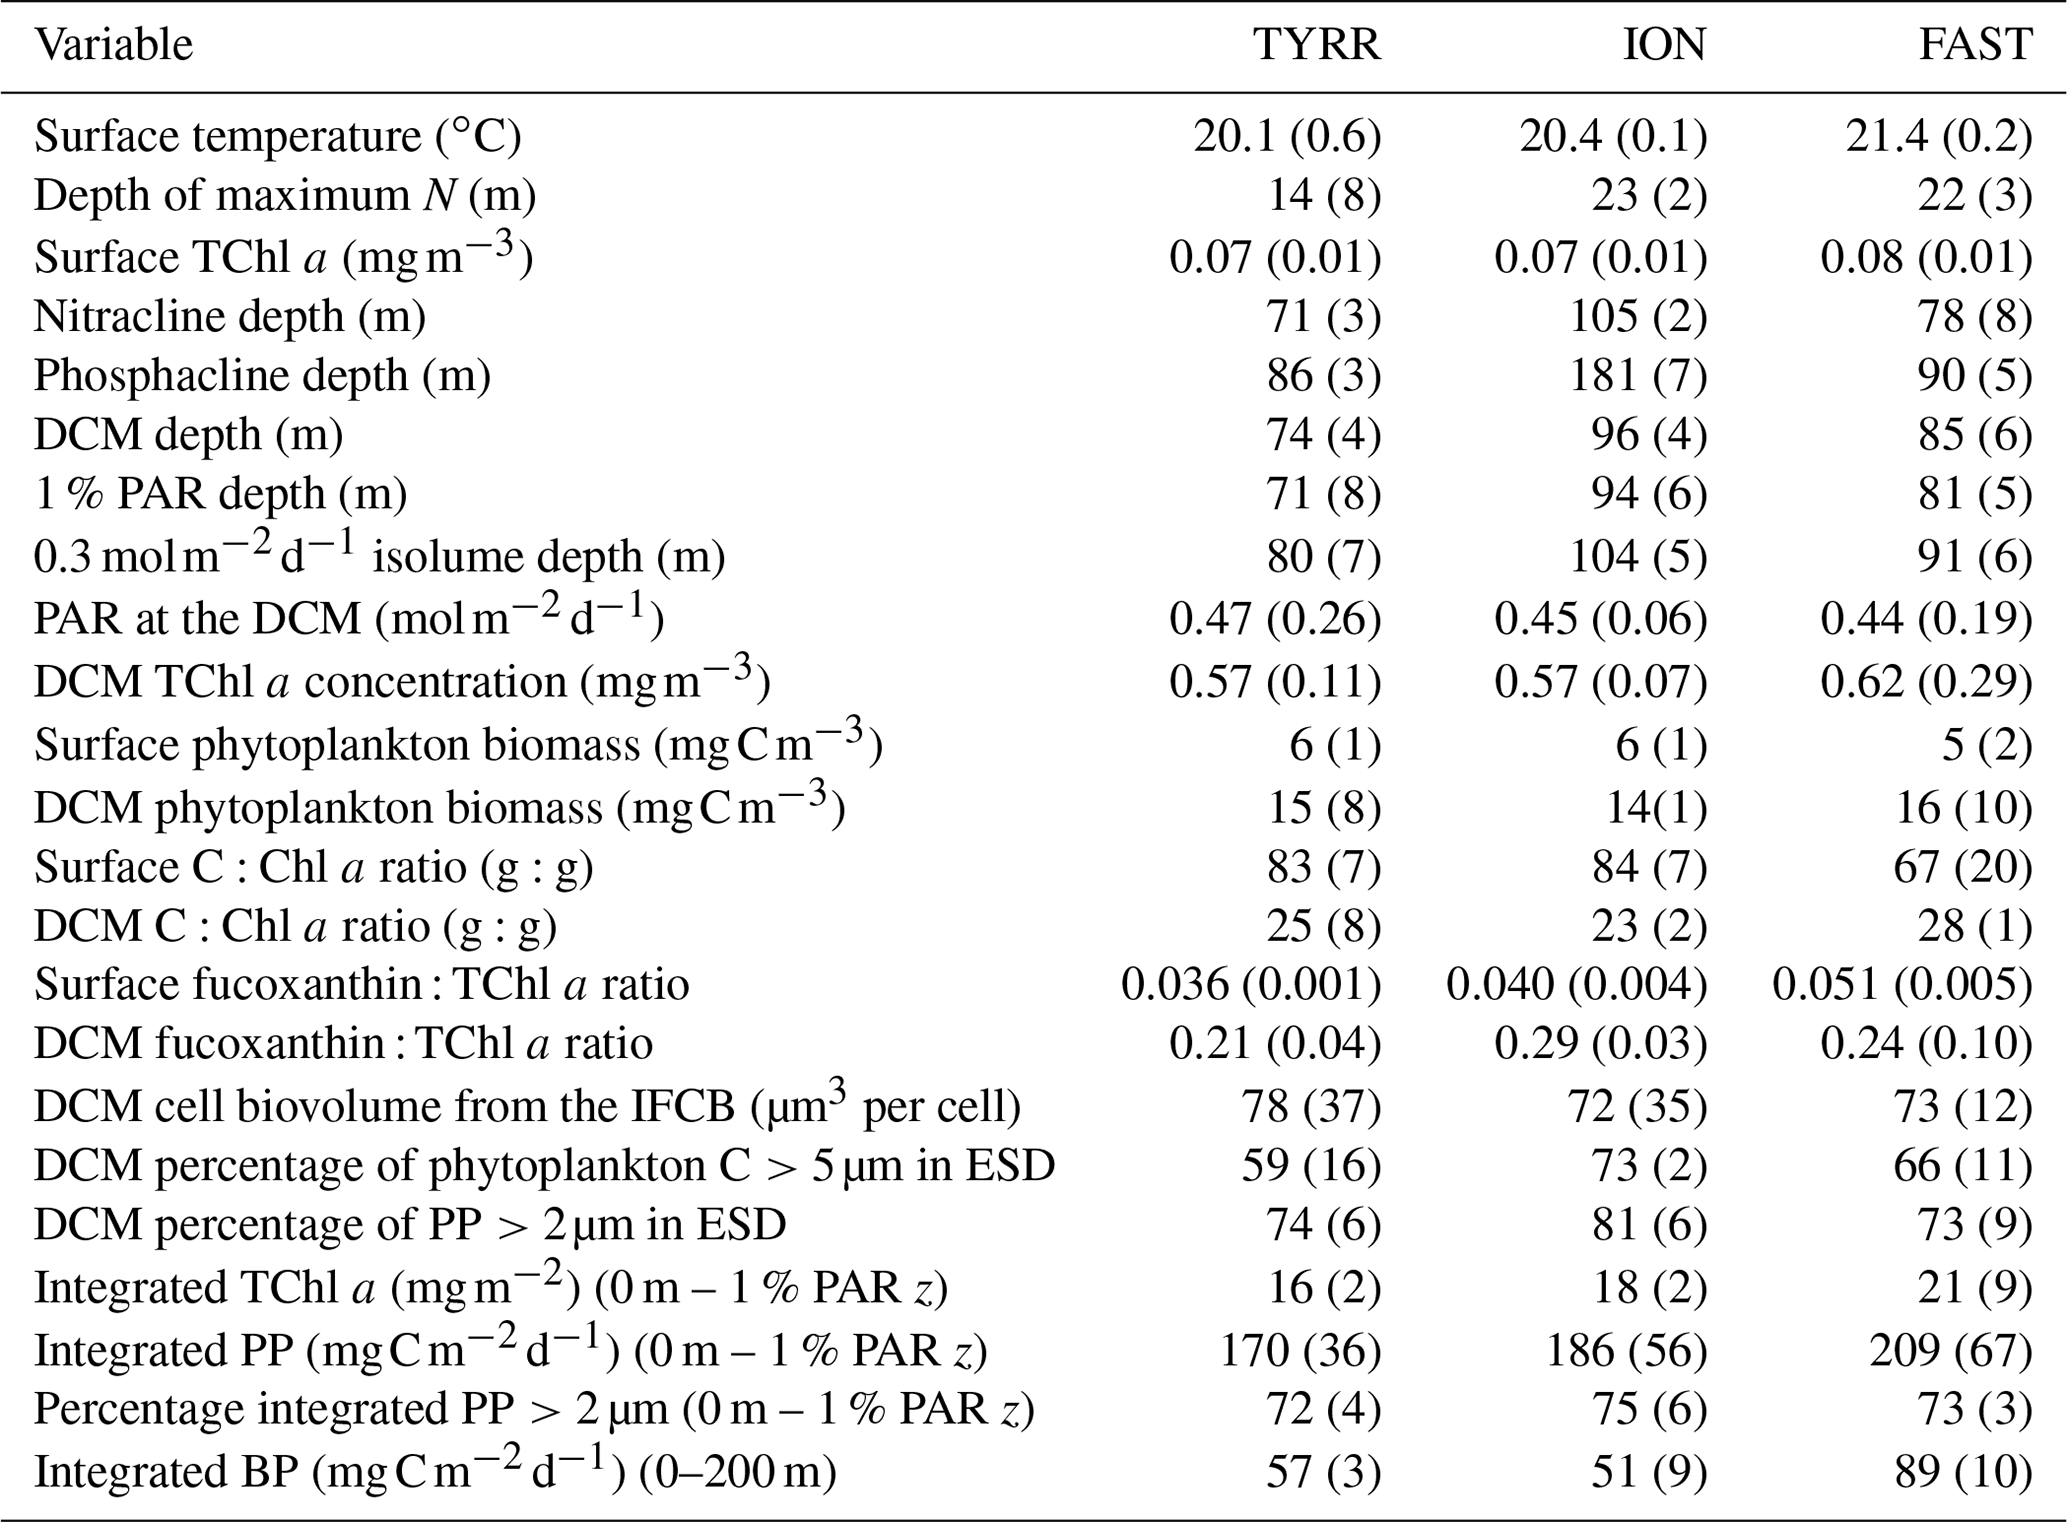
Compared to surface values, the deep maxima in phytoplankton C biomass were of a smaller magnitude than those of TChl a. Consequently, the mean C:Chl a ratio (g:g) was much higher at the surface (89–97) than at the DCM (21–34) at all long stations (Table 1). Considering together the data from all stations, C:Chl a increased with light availability following a saturating curve (Fig. 4a). Particulate primary production (PP) ranged between 1 and 3 in surface waters and tended to increase with depth (Figs. 3h–j and S2c). In most profiles (19 out of 23), the highest value of PP (typically, 3–6 ) was measured in the deepest sample, corresponding to the DCM. There were only small differences in mean integrated PP among stations, which ranged between 170±36 and 209±67 at TYRR and FAST, respectively (Table 1).
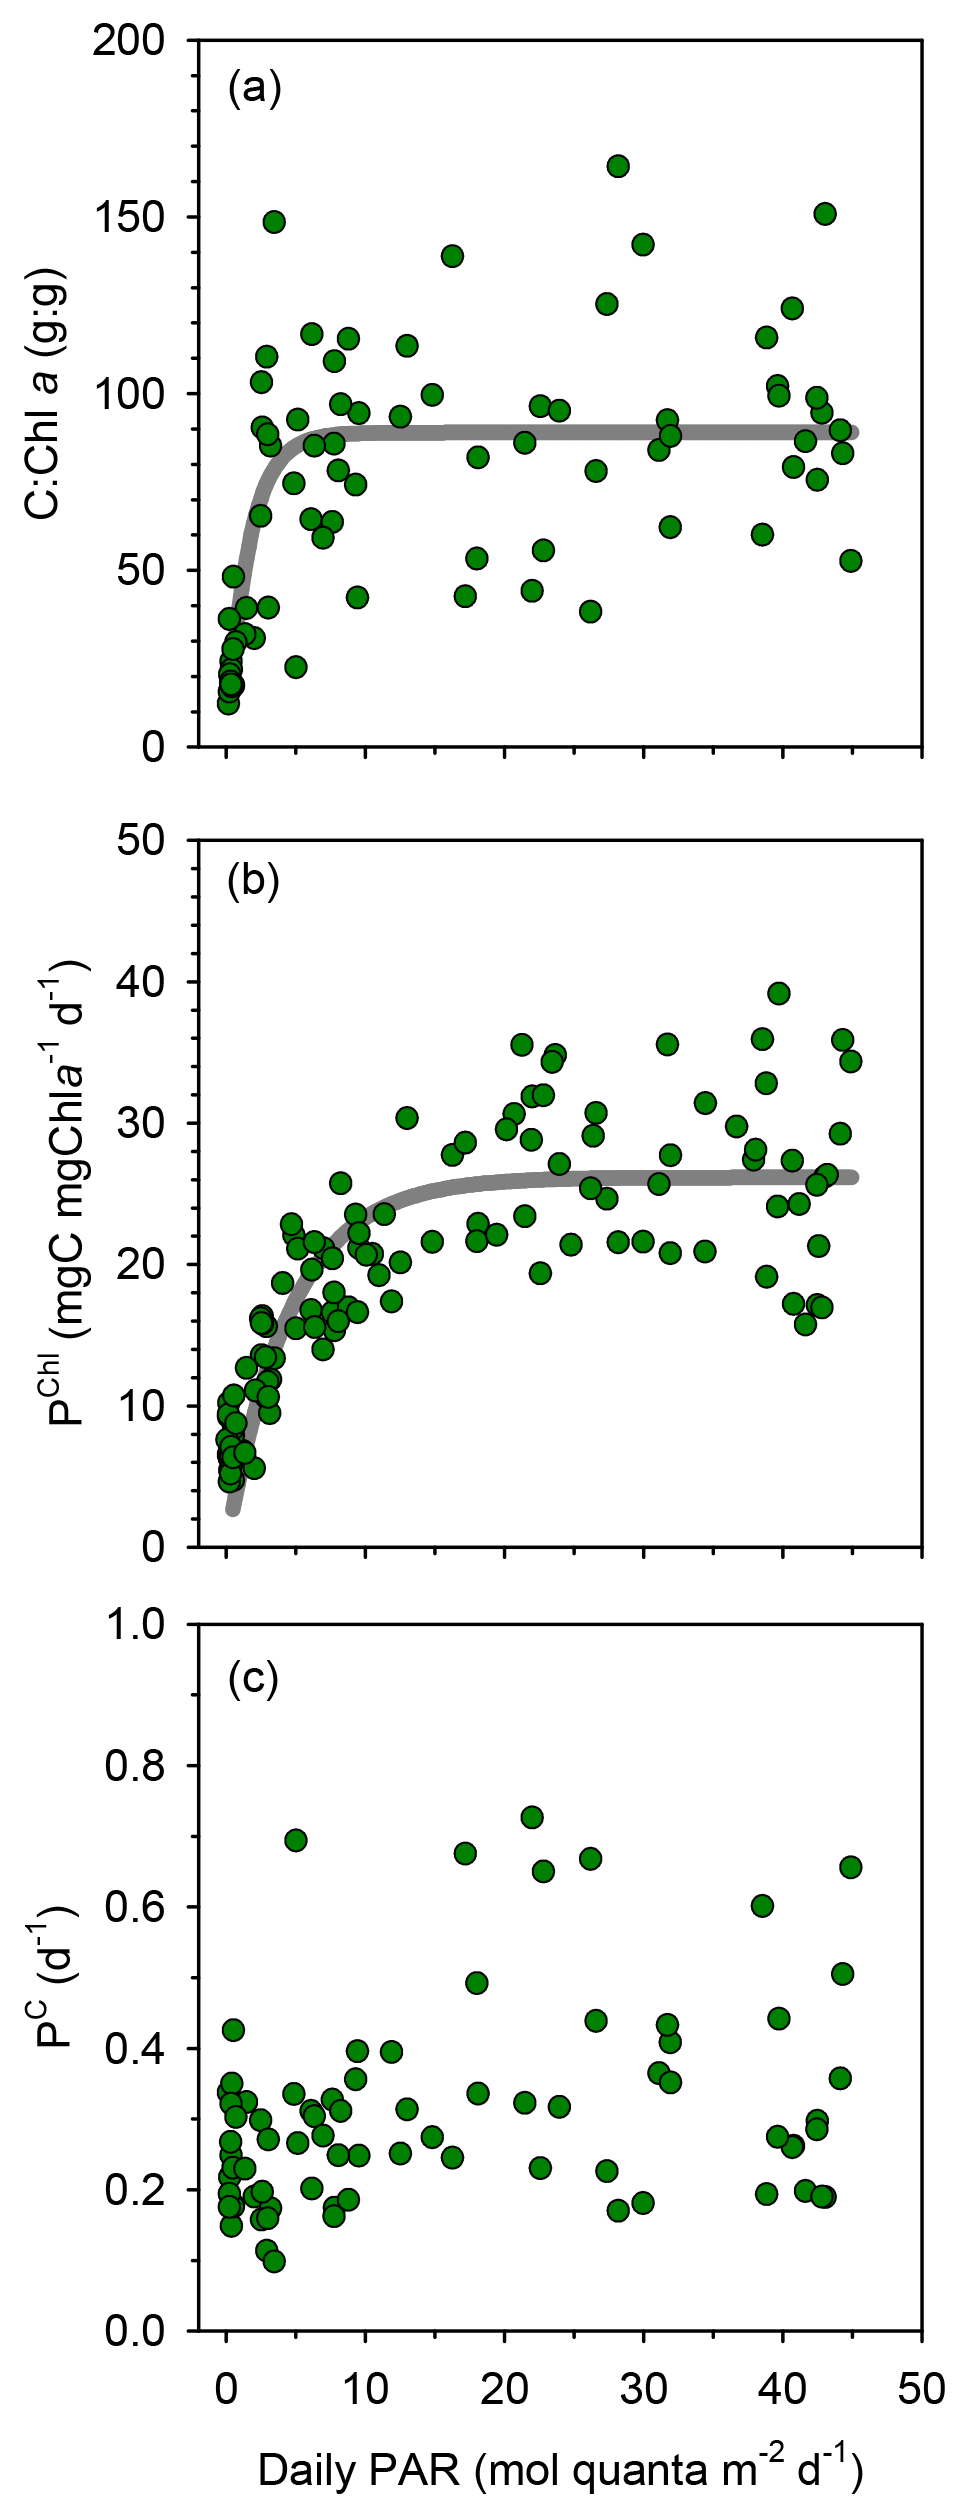
Figure 4Relationship between PAR and (a) the ratio of phytoplankton carbon to chlorophyll a , (b) chlorophyll a-specific particulate primary production and (c) the phytoplankton biomass turnover rate with data from all stations pooled together. The non-linear fits are (a) y=89.0 () (r2=0.48, p <0.001, n=76) and (b) y=26.2 ) (r2=0.68, p <0.001, n=119).
The contribution of cells larger than 5 µm in diameter to total phytoplankton biomass increased slightly with depth and took an overall mean value of 49±14 % for all samples pooled together (Fig. S3a). The contribution of the >2 µm size class to total PP was relatively stable both among stations and with depth, taking a mean value of 73±6 % at the long stations (Fig. S3b). In contrast, the percentage of extracellular release (PER) showed a marked vertical pattern at all stations, decreasing with depth from a mean value of 42±8 % at the surface to 22±4 % at the DCM (Fig. S3c).
TChl a-specific primary production (PChl) displayed a marked light dependence, following a saturating function of light availability and reaching values of 20–35 at near-surface irradiance levels (Fig. 4b). In contrast, the ratio between primary production and phytoplankton C biomass (PC, equivalent to a biomass turnover rate) was independent of irradiance (Pearson's r= 0.17, n=77, p=0.14), with most values falling within the range 0.1–0.5 d−1 throughout the euphotic layer (Fig. 4c). Overall, the mean PC for the whole cruise was 0.3±0.1 d−1, and the same mean PC (0.3 d−1) was measured at the surface and the DCM.
3.3 Vertical distribution of pigment ratios
The ratio of fucoxanthin to total chlorophyll a (fuco:TChl a) consistently increased below the upper 40–50 m at all long stations (Fig. 5). Mean values of fuco:TChl a at the surface were 0.036±0.001 at TYRR, 0.040±0.004 at ION and 0.051±0.005 at FAST (Table 1). Using different conversion factors (see Methods), these ratios translate into a range of diatom contribution to TChl a of 5 %–6 %, 6 %–7 % and 7 %–9 % at TYRR, ION and FAST, respectively. At the DCM, fuco:TChl a was 0.21±0.04 at TYRR, 0.29±0.03 at ION and 0.24±0.10 at FAST, which corresponds to diatom contributions of 30 %–36 %, 41 %–51 % and 34 %–42 %, respectively. The vertical distribution of the fucoxanthin : (19′ hex-fuco+19′ but-fuco) ratio also showed a marked increase below 40–50 m at all stations (Fig. S4), which means that the high values of the fuco:TChl a ratio at depth reflect an increased contribution of diatoms. This was confirmed by the images obtained with the IFCB, which show that diatoms were abundant at the DCM in all three long stations, whereas they were virtually absent in the surface samples (Fig. S5).
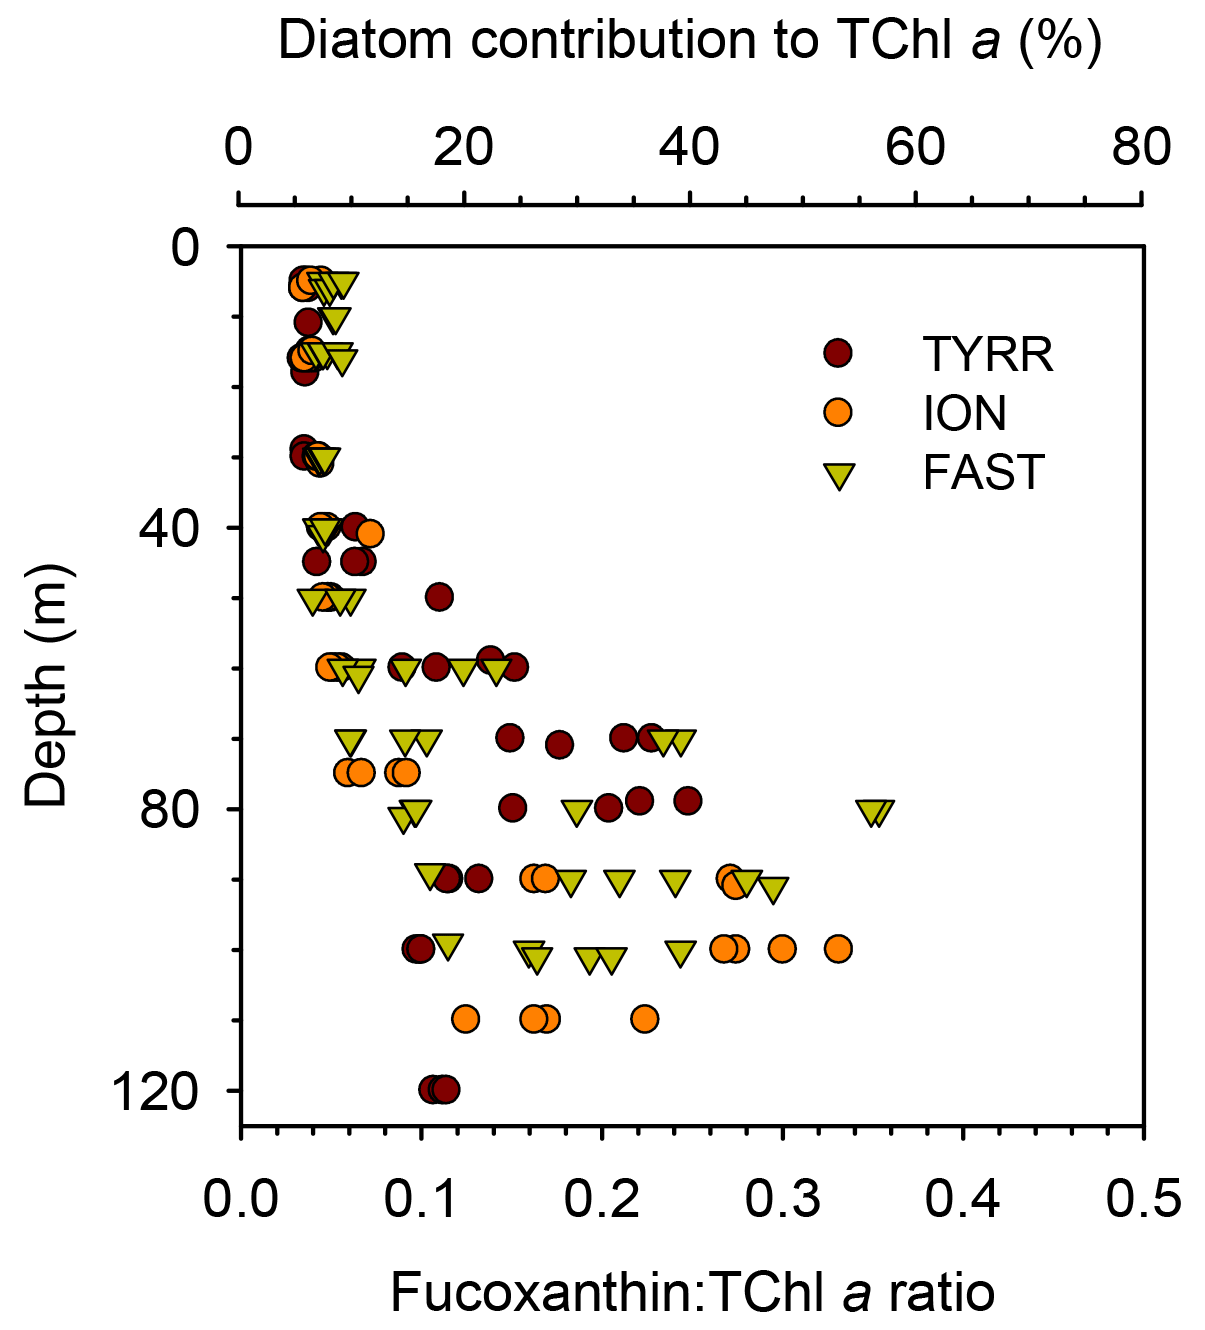
Figure 5Vertical variability of the ratio of fucoxanthin to total chlorophyll a concentration in the three long stations. The upper x axis is included as a reference and shows the estimated diatom contribution to TChl a computed with the mean value of three different conversion factors. See Methods for details.
3.4 Heterotrophic prokaryotic production and relationship with primary production
Rates of heterotrophic prokaryotic production (BP) in the euphotic layer fell within the range 10–50 and took values <10 in the waters below (Figs. 6 and S6). Most vertical profiles of BP were characterized by two peaks: one at the surface and another one in subsurface waters, coinciding with the DCM or slightly above it. We assessed the effect of temperature on BP rates in the upper layer (0–50 m) by comparing the rates calculated at the in situ temperature versus a constant temperature of 17 ∘C (mean temperature for all profiles across 0–250 m). While BP rates at the in situ temperature displayed a marked increase in the two to three most shallow sampling depths, BP at a constant temperature of 17 ∘C remained largely homogenous with depth (Fig. S7). The mean integrated BP at the long stations ranged between 50–60 at stations TYRR and ION and ca. 90 at station FAST (Table 1). Considering all data in the euphotic layer, there was a positive correlation between both particulate and dissolved primary production and BP (Fig. 7). However, primary production explained less than 10 % of the variability in BP. Taking into account that BP displayed a surface maximum, which was rarely observed in the primary production profiles, we explored the relationship between PP and BP in samples from below 30 m (Fig. S8). Although a positive relationship was observed, PP still explained only a small amount of variability in BP, which reflects the fact that the deep maximum in BP was often shallower than the deep PP maximum.
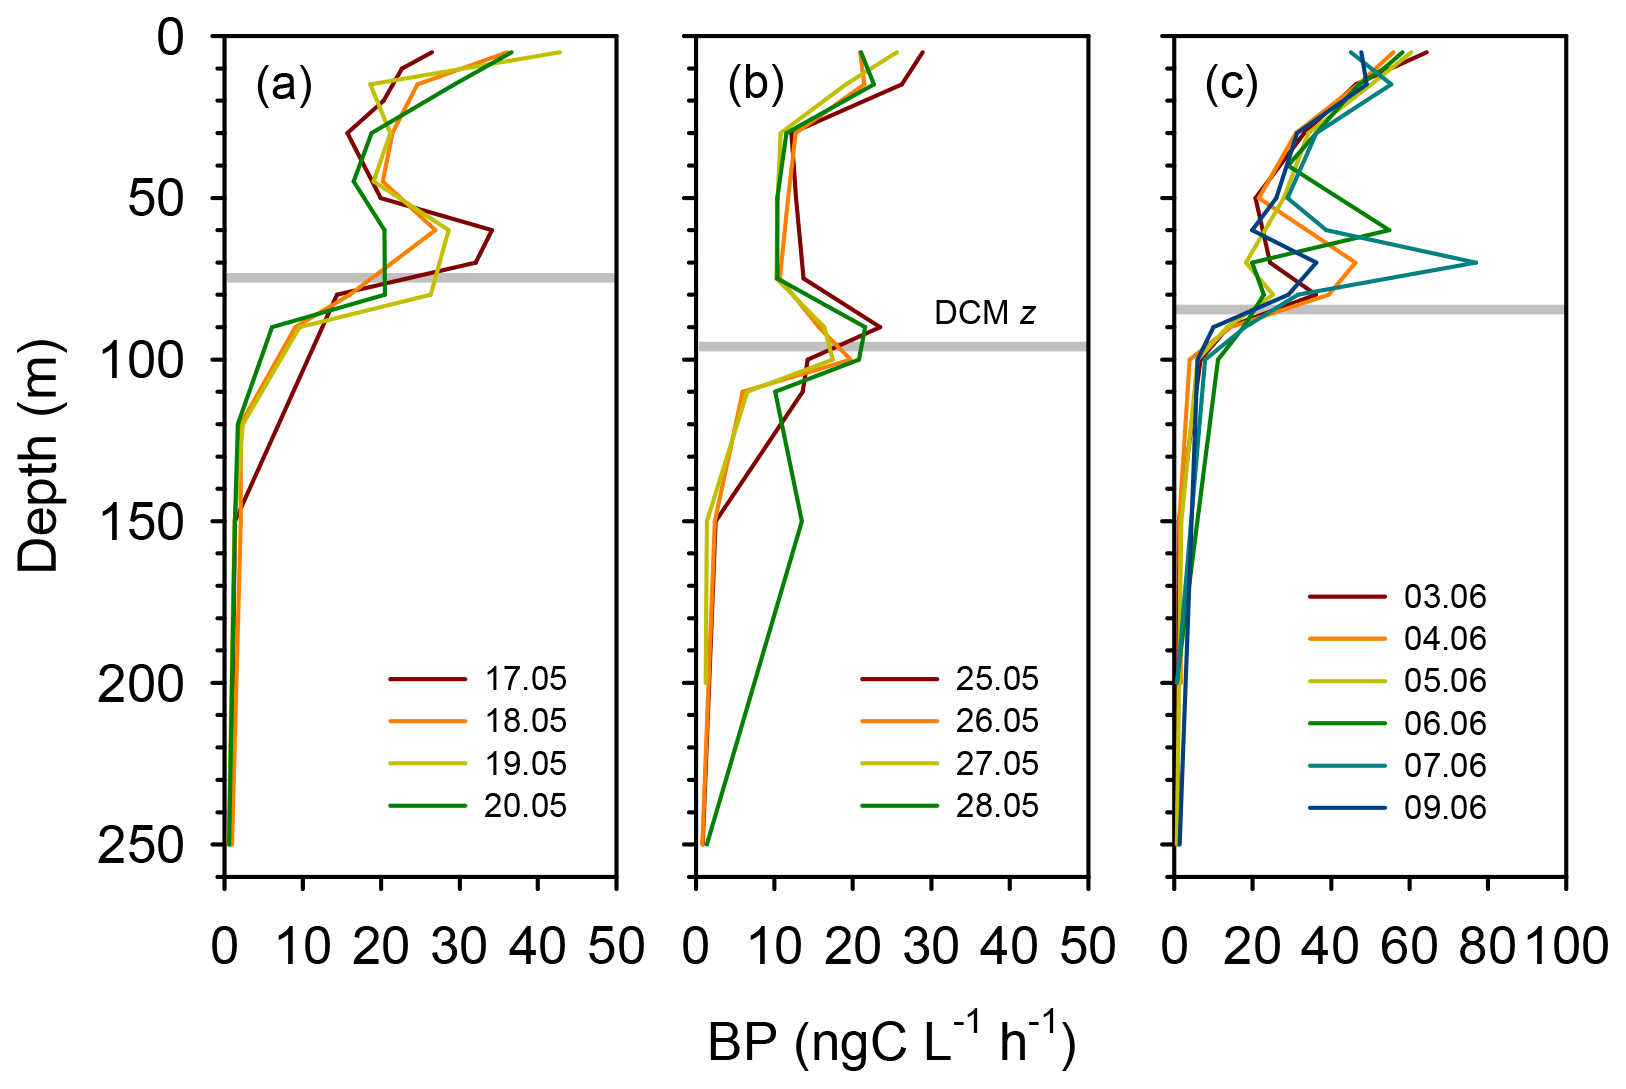
Figure 6Vertical profiles of heterotrophic prokaryotic production (BP, dawn casts only) during each sampling day at the long-term stations (a) TYRR, (b) ION and (c) and FAST. The grey line indicates depth of the DCM at each station.
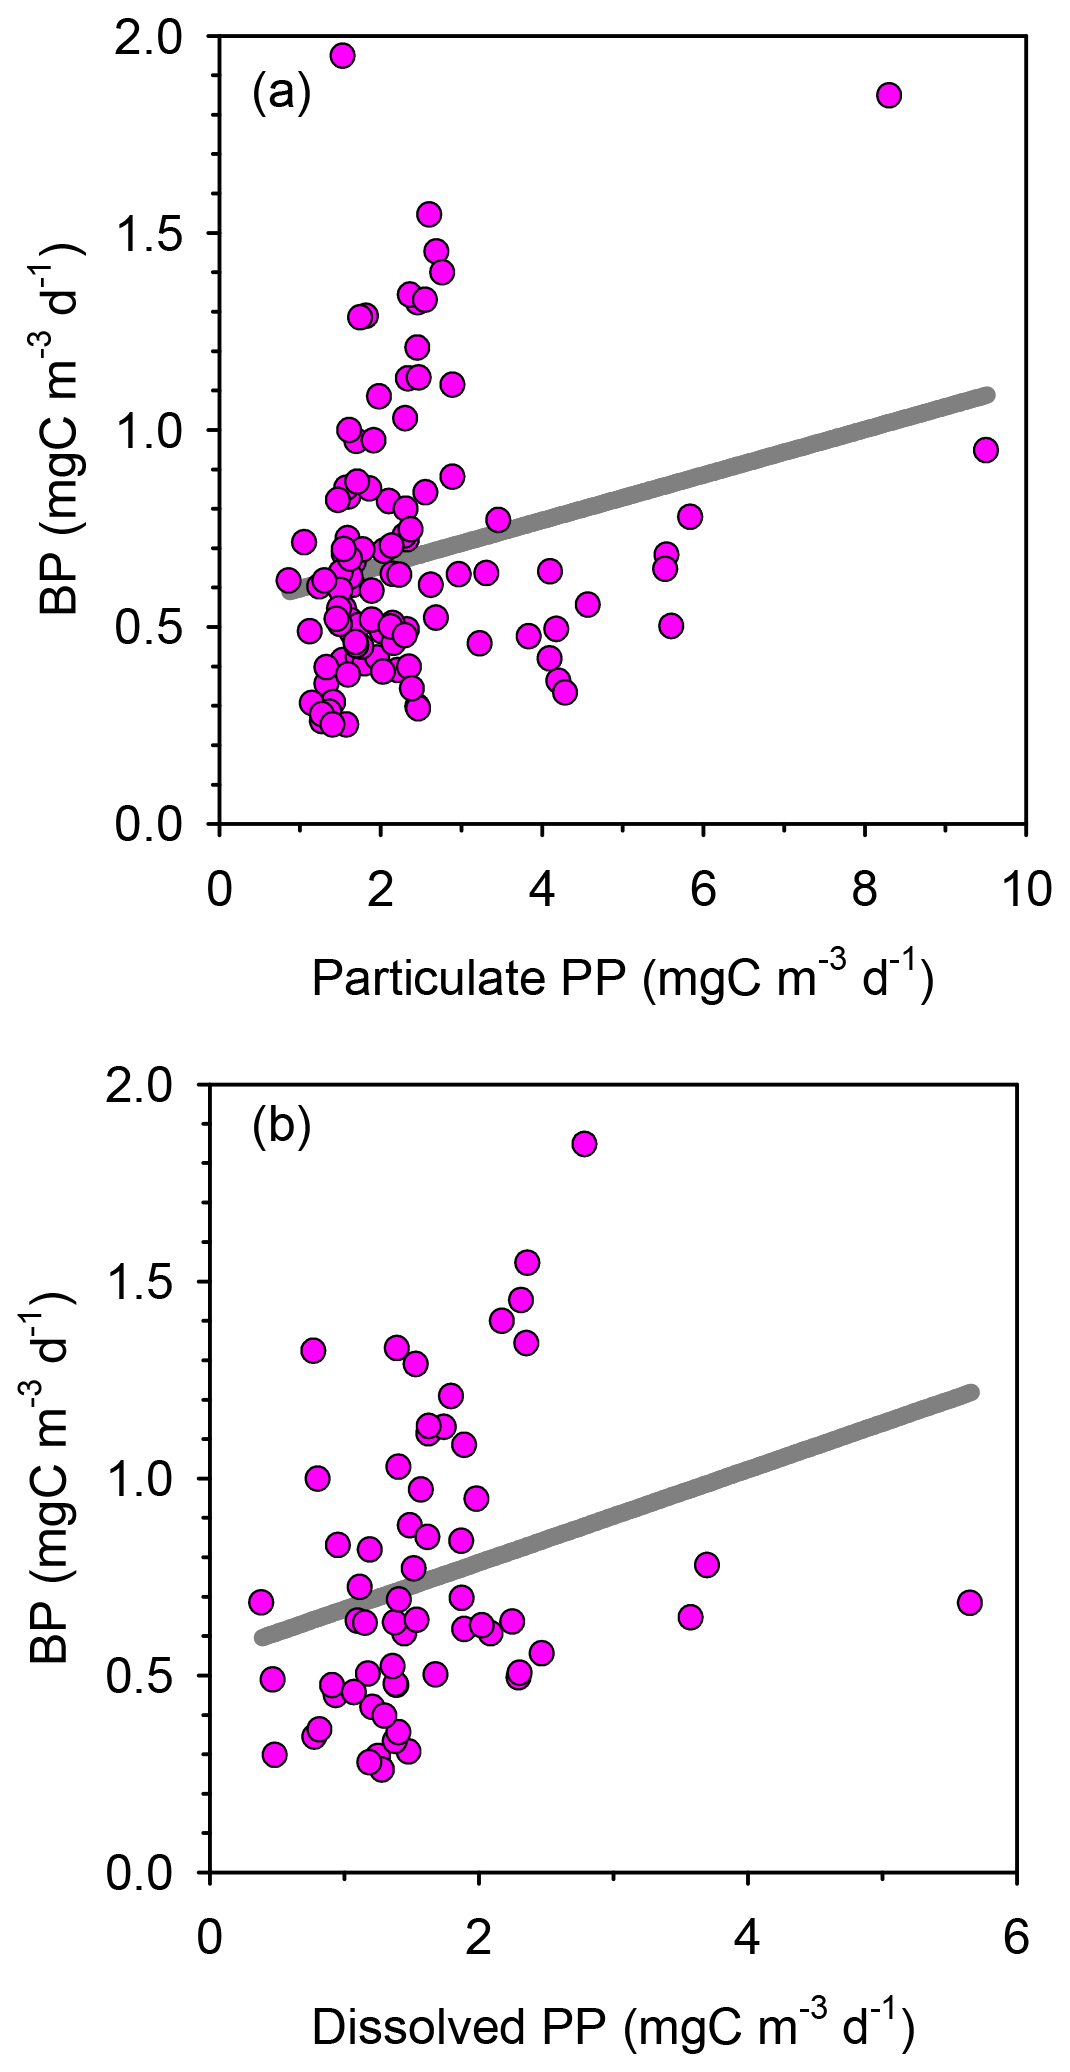
Figure 7Bacterial production as a function of (a) particulate and (b) dissolved primary production with data from all stations pooled together. The linear regression models are (a) y=0.058 x+0.54 (r2=0.05, n=110, p=0.016) and (b) y=0.12 x+0.55 (r2=0.07, n=62, p=0.034).
4.1 Seasonal and geographical context
The vertical location and longitudinal variability of the DCM we observed agree with the patterns previously reported for the Mediterranean Sea, based both on climatological analyses of chlorophyll a profiles (Lavigne et al., 2015) and time-series studies (Lemée et al., 2002; Marty et al., 2002). In the western basin, where the spring bloom is characterized by the presence of a surface chlorophyll maximum, a subsurface maximum develops from April onwards that takes progressively a deeper location, reaching 70–80 m in midsummer. This deepening of the DCM occurs later in the northern than in the southern section of the western basin (Lavigne et al., 2015). In agreement, we found during PEACETIME that the stations located in the southwest had deeper DCMs than those located in the northwest (it has to be noted, though, that the seasonal evolution during the cruise may have influenced the DCM depth and that the southwestern stations were sampled last). In the central Mediterranean (e.g. Ionian Sea), the spring surface chlorophyll maximum does not occur, and the DCM also appears around April but becomes deeper than in the western region. Accordingly, during our cruise the DCM at long station ION was significantly deeper than at the western stations. We also found, as previously described in analyses of vertical structure in stratified waters (Herbland and Voituriez, 1979; Letelier et al., 2004; Cullen, 2015), a general correspondence between the top of the nutricline and the depth of the DCM, with deeper values in the Ionian Sea than in the western basin. These differences reflect the more persistent stratification and stronger degree of oligotrophy that characterizes the central and eastern basins as compared to the western Mediterranean Sea (Bosc et al., 2004; D'Ortenzio and Ribera d'Alcalà, 2009). The nitracline was deeper than the DCM at ION, which reflects longitudinal differences in the way the DCM and the mixed-layer depth are coupled in the Mediterranean Sea, as described by Barbieux et al. (2019). These authors concluded that in the Ionian and Levantine basins the deepest winter mixed layer rarely reaches the top of the nutricline and that the DCM is persistently well above the nutricline during the stratified season.
Numerous surveys at fixed stations (Lemée et al., 2002; Marty and Chiavérini, 2002) as well as along oceanographic transects (Estrada, 1996; Moutin and Raimbault, 2002; López-Sandoval et al., 2011) have described the vertical variability of PP in the Mediterranean Sea during the stratification season. While subsurface maxima are often observed in late spring and summer, these peaks tend to be located above rather than at the DCM (Estrada, 1996; Marty and Chiavérini, 2002). During the MINOS (Mediterranean Investigation of Oligotrophic Systems) cruise, which sampled the entire Mediterranean Sea from the western to the Levantine basin in May–June 1996, Moutin and Raimbault (2002) found a strong correlation between the depths of the deep PP peak and the DCM depth, but the former was on average 20 m shallower. In contrast, during PEACETIME the mean depths of the primary production maximum and the DCM coincided, and only in three profiles was the primary production peak located above the DCM. One potential source of bias during our 14C uptake experiments could come from the fact that all samples were incubated at sea surface temperature. However, the correction we applied to the measured rates assumes a relatively strong degree of temperature dependence (an activation energy of 0.61 eV), while oligotrophic conditions, prevailing during the cruise, are known to result in decreased temperature sensitivity of phytoplankton metabolic rates (O'Connor et al., 2009; Marañón et al., 2018). Had we used a lower temperature sensitivity in our corrections, the magnitude of the deep production peaks would have been even greater. Thanks to the combined measurements of cell abundance and biovolume together with photosynthetic carbon fixation, it is possible to explore the variability in phytoplankton biomass and its turnover rate to assess if the measured deep production peaks are plausible and explore which processes may have been responsible for their occurrence.
Our estimates of growth rate also allowed us to assess if phytoplankton inhabiting the surface waters of the Mediterranean Sea during the stratification season were just experiencing nutrient limitation of their standing stock (yield limitation sensu Liebig) or if they are also limited in their rate of resource use (physiological rate limitation sensu Blackman). As demonstrated in chemostat experiments (Goldman et al., 1979), fast growth rates are compatible with extremely low ambient nutrient concentrations, and therefore oligotrophy itself does not necessarily imply that Blackman limitation is operating. However, the mean growth rate measured in surface waters during the PEACETIME cruise (0.3 d−1) is well below the maximal, nutrient-saturated growth rate that could be expected at warm (>20 ∘C) temperatures for different groups such as diatoms, cyanobacteria and green algae () (Kremer et al., 2017). Similarly low (0.2–0.6 d−1) phytoplankton growth rates have been reported before for the western Mediterranean Sea (Pedrós-Alió et al., 1999) and oligotrophic regions of the Atlantic subtropical gyres (Marañón, 2005; Armengol et al., 2019) and the North Pacific (Landry et al., 2008, 2009; Berthelot et al., 2019). Multiple experimental approaches, including in situ iron additions (Boyd et al., 2007; Yoon et al., 2018) in high-nutrient, low-chlorophyll regions as well as in vitro bioassays with inorganic nutrients (Mills et al., 2004; Tanaka et al., 2011; Tsiola et al., 2016) and desert dust (Marañón et al., 2010; Guieu et al., 2014) in low-nutrient, low-chlorophyll regions typically display larger increases in carbon fixation and nutrient uptake rates than in photoautotroph abundance, which implies enhanced biomass turnover rates upon alleviation of nutrient scarcity. Therefore low nutrient availability, which is widespread in the global ocean (Moore et al., 2013), results not only in low phytoplankton biomass but also in slow growth rates.
4.2 Mechanisms underlying deep production maxima
Earlier studies have shown that both photoacclimation and enhanced biomass contribute to the occurrence of the DCM in the western Mediterranean Sea, whereas in the central and eastern basins photoacclimation alone would be mainly responsible for the increased chlorophyll a at depth (Estrada, 1996; Mignot et al., 2014; Barbieux et al., 2019). In contrast, during our survey the contribution of increased phytoplankton biomass was similar at all stations, including the one located in the Ionian Sea. Most (ca. 75 %) of the increased Chl a concentration at the DCM at all stations was due to photoacclimation, with the rest being a result of increased biomass. The C:Chl a ratios (g:g) we estimate (approximately 90–100 and 20–30 for surface and DCM populations, respectively) agree well with previous results from the Mediterranean Sea (Estrada, 1996) and the Atlantic subtropical gyres (Veldhuis and Kraay, 2004; Marañón, 2005; Pérez et al., 2006) as well as with general patterns observed in light- and nutrient-limited laboratory cultures (MacIntyre et al., 2002; Halsey and Jones, 2015; Behrenfeld et al., 2016). The fact that high C:Chl a values (>50) persisted throughout the water column until PAR was lower than 2 suggests that nutrient limitation prevailed over most of the euphotic layer, because under nutrient-sufficient and light-limited conditions C:Chl a typically takes values <30 (Halsey and Jones, 2015). Only the populations inhabiting the DCM showed clear signs of light limitation, reflected in the decreased C:Chl a ratios. The question remains whether those populations were mainly sustained by new nutrients supplied by diffusion from below the nutricline or by recycled nutrients originated within the euphotic layer.
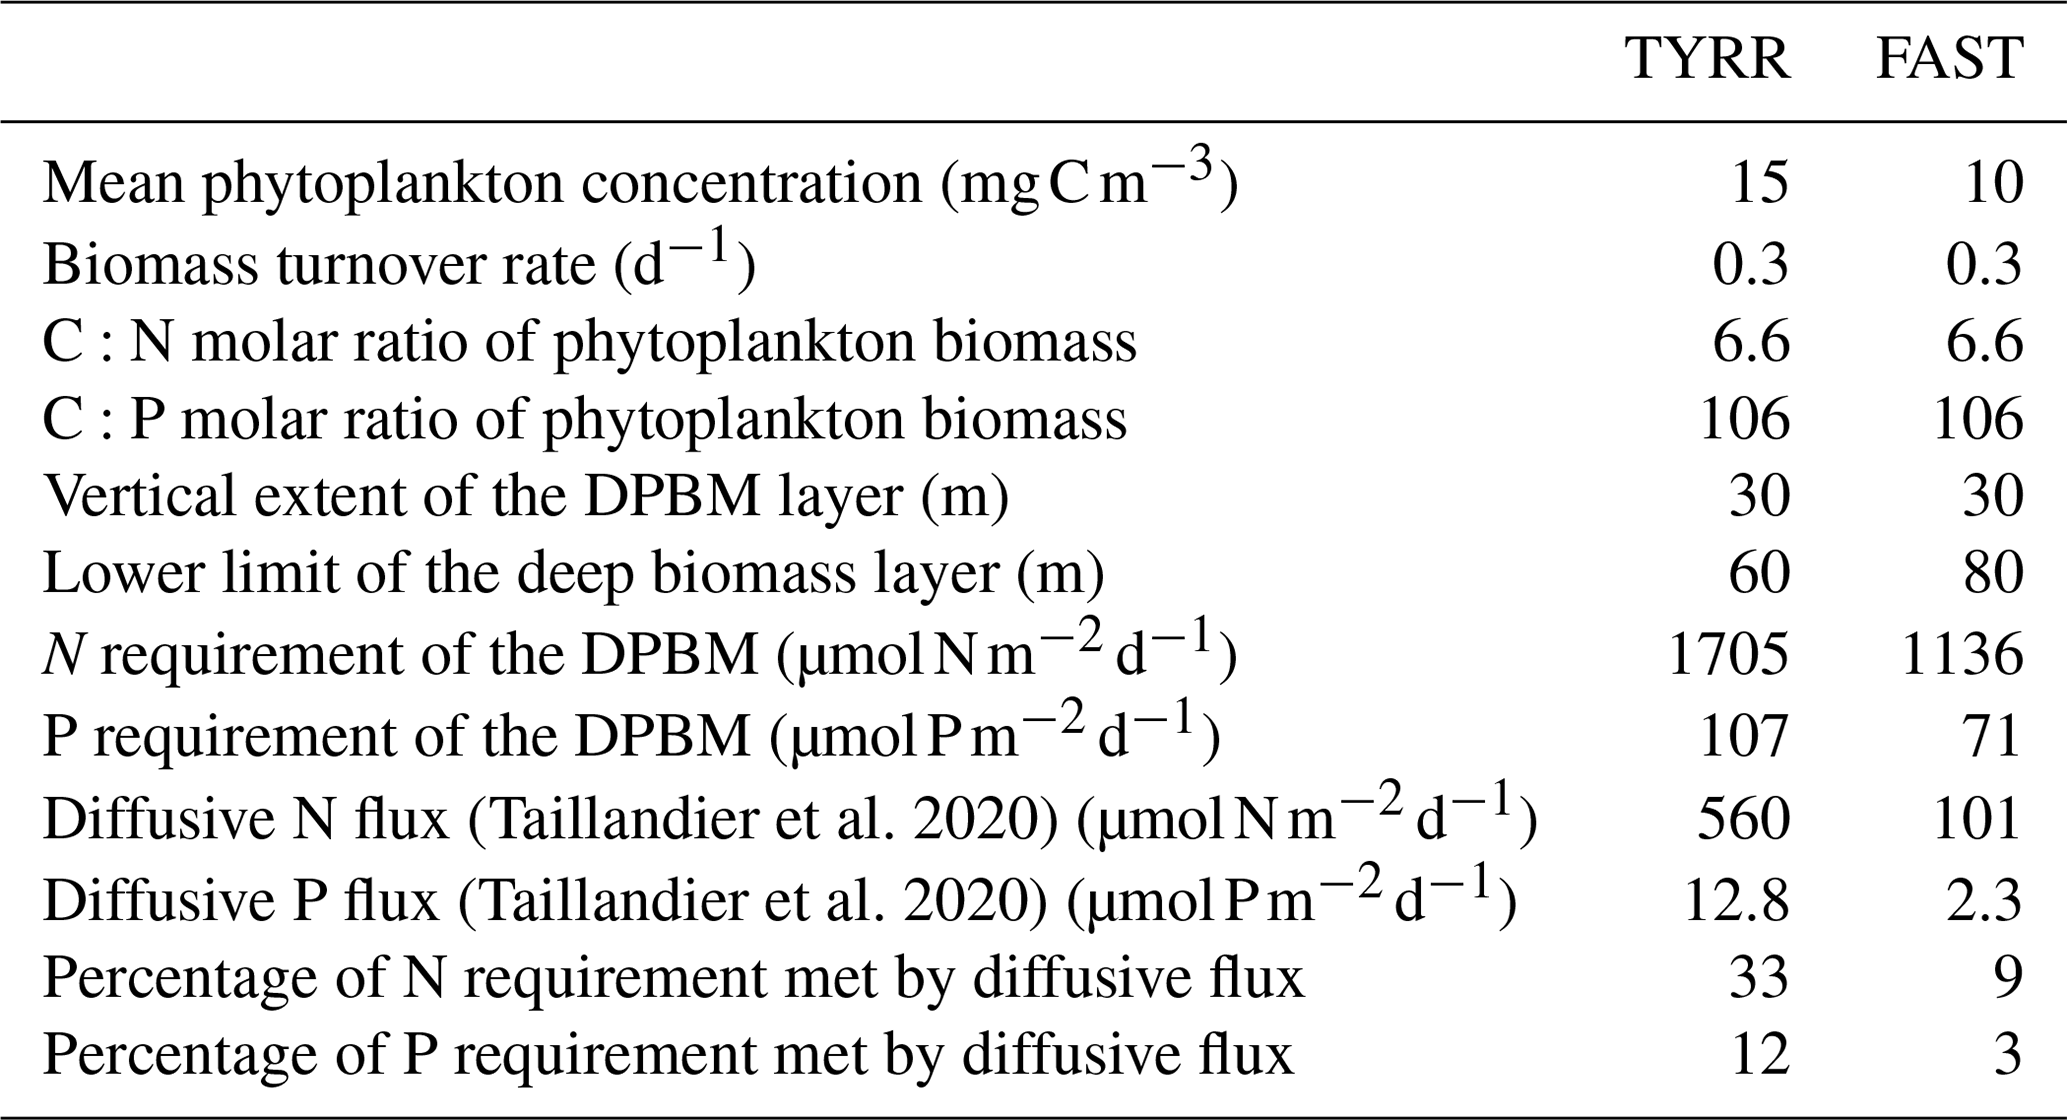
Taillandier et al. (2020) combined measurements of the vertical gradient in nutrient concentrations during PEACETIME with estimates of diffusivity based on turbulent kinetic energy dissipation rates measured by Ferron et al. (2017) in the western Mediterranean Sea, which allowed them to calculate the vertical diffusive fluxes across the nutricline in the Tyrrhenian Sea and the Algerian Basin. We used these fluxes to estimate the contribution of new nutrients to sustain phytoplankton productivity at the deep biomass maximum at stations TYRR and FAST, given the observed biomass concentration and turnover rate (Table 2) and assuming that the deep biomass maximum extended over 30 m. These calculations suggest that diffusive fluxes could provide only a small fraction of the nitrogen and, especially, the phosphorus requirements of the phytoplankton assemblages inhabiting the lower part of the euphotic layer. Thus most of the primary production in the euphotic layer was sustained by recycled nutrients, which agrees with the observation that phytoplankton growth rates did not show any increase at the DCM despite the proximity of the nutricline. The broadly homogeneous distribution of phytoplankton growth throughout the euphotic layer also supports the conclusion of Fennel and Boss (2003) that deep phytoplankton maxima develop approximately at the compensation depth, where growth and losses balance each other. We can speculate that the compensation depth during our cruise broadly coincided with the 1 % PAR light level or 0.5 isolume, but additional primary production measurements in deeper samples would have been required to test this hypothesis.
Table 2Estimation of the contribution of nutrient diffusive fluxes to sustain the requirements of the deep phytoplankton biomass maximum (DPBM) at stations TYRR and FAST. The DPBM layer considered has a thickness of 30 m, and the nutrient requirements of primary production are assumed to follow Redfield proportions. The magnitude of nitrate and phosphate diffusive fluxes at the base of the DPBM is taken from Taillandier et al. (2020).
The nano- and microphytoplankton size classes consistently dominated primary production during the cruise, accounting on average for ca. 70 % of total carbon fixation. The relatively low share (≤30 %–35 %) of primary production due to picophytoplankton agrees well with previous results based on remote sensing across the entire Mediterranean Sea (Uitz et al., 2012), while field measurements conducted in the western and central basins during the stratification season show somewhat higher and more variable picophytoplankton contribution (Magazzù and Decembrini, 1995; Decembrini et al., 2009). During PEACETIME, there a was significant increase with depth in the contribution of diatoms to total phytoplankton biomass, which reached at least 30 % at the DCM of all stations and was particularly high (nearly 50 %) at the most stratified station, located in the Ionian Sea. Deep maxima in diatom abundance are common in the Mediterranean Sea during stratified conditions (Ignatiades et al., 2009; Siokou-Frangou et al., 2010; Mena et al., 2019) and are often associated with peaks in biogenic silica (Crombet et al., 2011). The increased prevalence of diatoms at the base of the euphotic layer, which illustrates the ecological diversity of this group (Kemp and Villareal, 2018), is likely a result of multiple adaptations and mechanisms, including high growth efficiency under low-light conditions (Fisher and Halsey, 2016), buoyancy regulation (Villareal et al., 1996), the ability to exploit transient nutrient pulses through luxury uptake and storage (Cermeño et al., 2011; Kemp and Villareal, 2013) and the enhanced ammonium assimilation mediated by microbial interactions in the phycosphere (Olofsson et al., 2019). However, our observations were restricted in time, and therefore it remains uncertain whether the important presence of diatoms at the DCM observed during our cruise persists during the whole stratification season or if it was associated with the downward export from the previous spring bloom, as previously observed in the western Mediterranean Sea (Estrada et al., 1993).
4.3 Phytoplankton photophysiology and productivity
Although the widespread occurrence of deep chlorophyll maxima, which cannot be detected by ocean colour sensors, is often mentioned as a shortcoming of satellite-based productivity models, the vertical distribution of chlorophyll a concentration can be derived from surface optical properties (Morel and Berthon, 1989; Uitz et al., 2006). The key challenge rests in the quantification of the photophysiological parameters (e.g. photosynthetic efficiency) required to convert photoautotroph biomass or pigment concentration into a measure of carbon fixation. Of special relevance, in the case of low-light-acclimated populations, is the initial slope in the relationship between irradiance and Chl a-specific photosynthesis (αB, mg C (mg Chl a)−1 h−1 . Using a large data set of photosynthetic parameters obtained with the same method, Uitz et al. (2008) found that αB took a mean value of 0.025±0.022 in the lower part of the euphotic layer in oligotrophic regions across the world's oceans. Assuming 14 h of daylight and that nighttime respiration losses account for 20 % of carbon fixed during the day (Geider, 1992) and given the mean Chl a concentration (0.6 mg m−3) and daily PAR (0.5 ) measured at the DCM during PEACETIME, this value of αB translates into a primary production of <1.7 , lower than the rates we measured (2–10 ). Interestingly, the mean αB value determined at the base of the euphotic layer during the PROSOPE (Productivity of Oceanic Pelagic Systems) cruise, which sampled all major basins of the Mediterranean Sea in September 1999, was 0.066±0.024, which would correspond to a DCM primary production of 4.4 , in agreement with our observations. The low αB value reported by Uitz et al. (2008) largely reflected the photophysiological properties of communities dominated by small cells, in contrast with the assemblages encountered during the present study. It thus would appear that the high primary production at the DCM during PEACETIME was due not only to enhanced levels of phytoplankton biomass but also to the presence of a diatom-rich community characterized by high photosynthetic efficiency. These results stress the importance of incorporating the linkage between community structure and photophysiological parameters to improve the application of bio-optical productivity models over diverse ecological and biogeographic settings (Uitz et al., 2010, 2012; Robinson et al., 2018).
We found that phytoplankton can sustain similar rates of biomass-specific carbon fixation across a wide range of irradiances, in spite of considerable variations in Chl a-specific photosynthesis. The uncoupling between these two metrics of productivity likely arises from photoacclimation, whereby cells receiving less irradiance invest more resources in light-harvesting complexes and thus are capable of sustaining rates of nutrient-limited carbon fixation (per unit biomass) similar to those of cells experiencing high light availability (Pan et al., 1996). Using a photoacclimation model in conjunction with satellite observations of phytoplankton carbon and Chl a, Behrenfeld et al. (2016) demonstrated that most of the seasonal and interannual variability in surface Chl a concentrations of multiple ocean biomes resulted from photoacclimation and therefore cannot be readily translated into equivalent changes in productivity. Our results suggest that the same conclusion also applies to small-scale vertical variability in stratified environments, where phytoplankton growth rates are often relatively constant across the euphotic layer (Pérez et al., 2006; Cáceres et al., 2013; Armengol et al., 2019; Berthelot et al., 2019). The fact that C:Chl a is highly sensitive not only to irradiance but to nutrient availability and temperature as well (Geider, 1987; Halsey and Jones, 2015) means that changes in growth rate can be disconnected from Chl a-specific photosynthesis across multiple environmental gradients (Cullen et al., 1992; Marañón et al., 2018). The apparent paradox of relatively constant phytoplankton growth rates across the euphotic layer, in spite of marked changes in both temperature and light availability, can be explained by considering that the physiological effect of a given environmental factor tends to decrease when another factor is limiting (Cross et al., 2015; Edwards et al., 2016; Marañón et al., 2018). Thus the lack of irradiance effects on the growth rate of acclimated phytoplankton assemblages may have resulted from the fact that nutrient limitation prevailed throughout the water column.
4.4 Relationship between heterotrophic prokaryotic and primary production
The vertical distribution of BP, which was characterized by the presence of both surface and deep maxima, likely reflects the combined influence of several controlling factors. Different studies have investigated the relationship between temperature, inorganic nutrients and dissolved organic matter availability as drivers of heterotrophic prokaryotic production and carbon demand in the Mediterranean Sea over seasonal (Lemée et al., 2002; Alonso-Sáez et al., 2008; Céa et al., 2015) and mesoscale to basin-scale (Pedrós-Alió et al., 1999; Pulido-Villena et al., 2012) ranges of variability, but the relative role of these factors at the small vertical scale within the upper water column has been comparatively less explored. Van Wambeke et al. (2002) reported that BP consistently peaked at the surface during a mesoscale survey in the Gulf of Lion in spring, which was probably a result of the fact that primary production also increased in the surface layer, a pattern also reported by Lemée et al. (2002) throughout most of the year at the DYFAMED station (Ligurian Sea). In the case of the PEACETIME cruise, however, the surface peak in BP cannot be attributed to increased primary production, which took the lowest values in the surface layer. Temperature, which exhibited a ca. 5 ∘C gradient over the upper 50 m, appears as the most likely responsible driver of the surface BP peaks, considering that the estimated rates at a constant temperature of 17 ∘C were nearly homogeneous across the upper layer. Seasonal studies in coastal waters of the western Mediterranean Sea have also identified temperature as a factor that contributes to explain the temporal variability of bacterial production in surface waters (Alonso-Sáez et al., 2008; Céa et al., 2015). In contrast, the deep peak in BP found during our cruise was associated, at least in part, with increased phytoplankton biomass and production, so an enhanced availability of organic substrates may have been responsible for the stimulation of bacterial activity near the base of the euphotic layer.
Atmospheric deposition of nutrients may have also contributed to sustain the surface BP peaks observed during our study. Nitrogen and phosphorus amendments to seawater from the mixed layer resulted in BP stimulation after 48 h, indicating NP co-limitation of BP, whereas addition of a labile carbon source (glucose) had no effect (Van Wambeke et al., 2020b). Thus the surface BP peak observed under in situ conditions was not due to dependence of organic carbon substrates but may have resulted in part from new N and P availability through dry atmospheric deposition. The superior ability of heterotrophic bacteria to compete for inorganic nutrients has been shown by the budget analysis and experimental observations of Van Wambeke et al. (2020b), who concluded that dry atmospheric deposition could supply nearly 40 % of the heterotrophic bacteria N demand in the upper mixed layer during the stratification season in the Mediterranean Sea.
Despite the association between increased PP and increased BP in subsurface waters, the overall strength of the relationship between these two variables during PEACETIME was weak. This in contrast with previous analyses in the Mediterranean Sea that included a much broader range of plankton biomass and production regimes than the one covered during our cruise and found stronger correlations between photosynthetic carbon fixation and BP (Turley et al., 2000; Pulido-Villena et al., 2012). If we consider the trophic coupling between heterotrophic bacteria and phytoplankton as the extent to which dissolved primary production meets heterotrophic bacterial carbon demand (Morán et al., 2002), our results suggest a poor coupling during the PEACETIME cruise. Assuming a value of bacterial growth efficiency of 10 %, as determined in the western Mediterranean Sea during summer (Lemée et al., 2002; Alonso-Sáez et al., 2008), our measured rates of dissolved primary production represented, on average, only 25 % (SD=14 %) of estimated bacterial carbon demand. Similar weak phytoplankton–bacterioplankton coupling has been reported before for the Mediterranean Sea during the stratification period (Morán et al., 2002; Alonso-Sáez et al., 2008; López-Sandoval et al., 2011), which emphasizes the role of additional substrates other than recent products of photosynthesis released in dissolved form in fuelling bacterial metabolism. These additional substrates can include dissolved organic carbon released by consumers (e.g. sloppy feeding) or during cell lysis, as well as organic molecules previously produced and accumulated over timescales longer than 1 d or derived from allochthonous sources such as river and atmospheric inputs. However, the fact that bacterial carbon demand often exceeds the instantaneous rate of dissolved primary production does not mean that bacterial metabolism is independent of phytoplankton photosynthesis over annual scales but rather reflects the temporal uncoupling resulting from the episodic nature of phytoplankton production events (Steinberg et al., 2001; Karl et al., 2003; Morán and Alonso-Sáez, 2011).
We have shown that the DCM in the western Mediterranean Sea during the stratification period, already known to be a phytoplankton biomass maximum, can also represent a substantial primary production maximum. These deep maxima in biomass and primary production are not associated with an increase in phytoplankton growth rates and do not seem to be fuelled by new nutrients but likely arise as a result of cell sinking from above in combination with the high photosynthetic efficiency of a diatom-rich, low-light acclimated community which sustains similar growth rates as those measured in the upper, well-illuminated layers. Because of the variability in C:Chl a ratios, changes in Chl a-specific primary production can be disconnected from biomass turnover rates. While the trophic coupling between heterotrophic bacteria and phytoplankton was relatively poor, the increased photosynthetic biomass and carbon fixation measured near the base of the euphotic zone did result in an enhancement of bacterial heterotrophic activity, which in the surface layers appeared to be regulated by temperature. Our results support the combined use of isotope uptake measurements and biovolume-based estimates of phytoplankton carbon biomass to derive growth rates at discrete depths and gain insight into the mechanisms underlying the DCM. Data with higher spatial and temporal resolution, as derived for instance from optical sensors attached to autonomous instruments, will serve to establish if the marked peaks in primary production we observed are a persistent feature of the DCM in the central and western Mediterranean Sea and to quantify their broader biogeochemical significance.
All data from the PEACETIME cruise (https://doi.org/10.17600/17000300, Guieu and Desboeufs, 2017) are stored at the LEFE CYBER Database (http://www.obs-vlfr.fr/proof/php/PEACETIME/peacetime.php, last access: 9 March 2021) (Claustre, 2021) and will be made freely available once all publications are submitted to the PEACETIME special issue. In the meantime, data can be also obtained upon request to the corresponding author.
The supplement related to this article is available online at: https://doi.org/10.5194/bg-18-1749-2021-supplement.
The study was designed by EM, FVW, JU and ESB. Field data were obtained by FVW, JU, CD, JD, AE, NH, MPL, VT and BZ. EM led the data analysis and wrote the paper, with contributions from all authors.
The authors declare that they have no conflict of interest.
This article is part of the special issue “Atmospheric deposition in the low-nutrient–low-chlorophyll (LNLC) ocean: effects on marine life today and in the future (ACP/BG inter-journal SI)”. It is not associated with a conference.
This study is a contribution to the PEACETIME project (http://peacetime-project.org, last access: 9 March 2021), a joint initiative of the MERMEX and ChArMEx components supported by CNRS-INSU, IFREMER, CEA and Météo-France as part of the MISTRALS programme coordinated by INSU. We acknowledge the French Centre National d'Etudes Spatiales (CNES), which supported the bio-optical and ocean colour component of the PEACETIME project (PEACETIME-OC). We also thank the Service d'analyse de pigments par HPLC (SAPIGH) at the Institut de la Mer de Villefranche (IMEV) for HPLC analysis, as well as the captain and crew of the RV Pourquoi Pas? for their help during the work at sea.
This research has been supported by the Spanish Ministry of Science, Innovation and Universities (POLARIS, grant no. PGC2018-094553B-I00) and by the European Union through the H2020 project “Tropical and South Atlantic climate-based marine ecosystem predictions for sustainable management” (TRIATLAS, grant agreement no. 817578).
This paper was edited by Aninda Mazumdar and reviewed by three anonymous referees.
Alonso-Sáez, L., Vázquez-Domínguez, E., Cardelús, C., Pinhassi, J., Sala, M. M., Lekunberri, I., Balagué, V., Vila-Costa, M., Unrein, F., Massana, R., Simó, R., and Gasol, J. M.: Factors Controlling the Year-Round Variability in Carbon Flux Through Bacteria in a Coastal Marine System, Ecosystems, 11, 397–409, https://doi.org/10.1007/s10021-008-9129-0, 2008.
Antoine, D., Morel, A., and André, J.-M.: Algal pigment distribution and primary production in the eastern Mediterranean as derived from coastal zone color scanner observations, J. Geophys. Res.-Oceans, 100, 16193–16209, https://doi.org/10.1029/95jc00466, 1995.
Armengol, L., Calbet, A., Franchy, G., Rodríguez-Santos, A., and Hernández-León, S.: Planktonic food web structure and trophic transfer efficiency along a productivity gradient in the tropical and subtropical Atlantic Ocean, Sci. Rep.-UK, 9, 2044, https://doi.org/10.1038/s41598-019-38507-9, 2019.
Barbieux, M., Uitz, J., Gentili, B., Pasqueron de Fommervault, O., Mignot, A., Poteau, A., Schmechtig, C., Taillandier, V., Leymarie, E., Penkerc'h, C., D'Ortenzio, F., Claustre, H., and Bricaud, A.: Bio-optical characterization of subsurface chlorophyll maxima in the Mediterranean Sea from a Biogeochemical-Argo float database, Biogeosciences, 16, 1321–1342, https://doi.org/10.5194/bg-16-1321-2019, 2019.
Beckmann, A. and Hense, I.: Beneath the surface: Characteristics of oceanic ecosystems under weak mixing conditions – A theoretical investigation, Prog. Oceanogr., 75, 771–796, https://doi.org/10.1016/j.pocean.2007.09.002, 2007.
Behrenfeld, M. J., O'Malley, R. T., Boss, E. S., Westberry, T. K., Graff, J. R., Halsey, K. H., Milligan, A. J., Siegel, D. A., and Brown, M. B.: Revaluating ocean warming impacts on global phytoplankton, Nat. Clim. Change, 6, 323–330, https://doi.org/10.1038/nclimate2838, 2016.
Berthelot, H., Duhamel, S., L'Helguen, S., Maguer, J. F., Wang, S., Cetinić, I., and Cassar, N.: NanoSIMS single cell analyses reveal the contrasting nitrogen sources for small phytoplankton, ISME J., 13, 651–662, https://doi.org/10.1038/s41396-018-0285-8, 2019.
Bosc, E., Bricaud, A., and Antoine, D.: Seasonal and interannual variability in algal biomass and primary production in the Mediterranean Sea, as derived from 4 years of SeaWiFS observations, Global Biogeochem. Cy., 18, 1–17, https://doi.org/10.1029/2003gb002034, 2004.
Boyd, P. W., Jickells, T., Law, C. S., Blain, S., Boyle, E. A., Buesseler, K. O., Coale, K. H., Cullen, J. J., de Baar, H. J. W., Follows, M., Harvey, M., Lancelot, C., Levasseur, M., Owens, N. P. J., Pollard, R., Rivkin, R. B., Sarmiento, J., Schoemann, V., Smetacek, V., Takeda, S., Tsuda, A., Turner, S., and Watson, A. J.: Mesoscale Iron Enrichment Experiments 1993–2005: Synthesis and Future Directions, Science, 315, 612–617, https://doi.org/10.1126/science.1131669, 2007.
Buitenhuis, E. T., Li, W. K. W., Vaulot, D., Lomas, M. W., Landry, M. R., Partensky, F., Karl, D. M., Ulloa, O., Campbell, L., Jacquet, S., Lantoine, F., Chavez, F., Macias, D., Gosselin, M., and McManus, G. B.: Picophytoplankton biomass distribution in the global ocean, Earth Syst. Sci. Data, 4, 37–46, https://doi.org/10.5194/essd-4-37-2012, 2012.
Cáceres, C., Taboada, F. G., Höfer, J., and Anadón, R.: Phytoplankton Growth and Microzooplankton Grazing in the Subtropical Northeast Atlantic, PLOS ONE, 8, e69159, https://doi.org/10.1371/journal.pone.0069159, 2013.
Céa, B., Lefèvre, D., Chirurgien, L., Raimbault, P., Garcia, N., Charrière, B., Grégori, G., Ghiglione, J. F., Barani, A., Lafont, M., and Van Wambeke, F.: An annual survey of bacterial production, respiration and ectoenzyme activity in coastal NW Mediterranean waters: temperature and resource controls, Environ. Sci. Pollut. R., 22, 13654–13668, https://doi.org/10.1007/s11356-014-3500-9, 2015.
Cermeño, P., Lee, J. B., Wyman, K., Schofield, O., and Falkowski, P. G.: Competitive dynamics in two species of marine phytoplankton under non-equilibrium conditions, Mar. Ecol. Prog. Ser., 429, 19–28, 2011.
Claustre, H.: LEFE CYBER database, available at: http://www.obs-vlfr.fr/proof/php/PEACETIME/peacetime.php, last access: 9 March 2021.
Claustre, H., Morel, A., Babin, M., Cailliau, C., Marie, D., Marty, J.-C., Tailliez, D., and Vaulot, D.: Variability in particle attenuation and chlorophyll fluorescence in the tropical Pacific: Scales, patterns, and biogeochemical implications, J. Geophys. Res.-Oceans, 104, 3401–3422, https://doi.org/10.1029/98jc01334, 1999.
Crombet, Y., Leblanc, K., Quéguiner, B., Moutin, T., Rimmelin, P., Ras, J., Claustre, H., Leblond, N., Oriol, L., and Pujo-Pay, M.: Deep silicon maxima in the stratified oligotrophic Mediterranean Sea, Biogeosciences, 8, 459–475, https://doi.org/10.5194/bg-8-459-2011, 2011.
Cross, W. F., Hood, J. M., Benstead, J. P., Huryn, A. D., and Nelson, D.: Interactions between temperature and nutrients across levels of ecological organization, Global Change Biol., 21, 1025–1040, https://doi.org/10.1111/gcb.12809, 2015.
Cullen, J. J.: Subsurface Chlorophyll Maximum Layers: Enduring Enigma or Mystery Solved?, Annu. Rev. Mar. Sci., 7, 207–239, https://doi.org/10.1146/annurev-marine-010213-135111, 2015.
Cullen, J. J., Yang, X., and MacIntyre, H. L.: Nutrient Limitation of Marine Photosynthesis, in: Primary Productivity and Biogeochemical Cycles in the Sea, edited by: Falkowski, P. G., Woodhead, A. D., and Vivirito, K., Springer US, Boston, MA, 69–88, 1992.
Decembrini, F., Caroppo, C., and Azzaro, M.: Size structure and production of phytoplankton community and carbon pathways channelling in the Southern Tyrrhenian Sea (Western Mediterranean), Deep-Sea Res. Pt. II, 56, 687–699, https://doi.org/10.1016/j.dsr2.2008.07.022, 2009.
Di Cicco, A.: Spatial and Temporal Variability of Dominant Phytoplankton Size Classes in the Mediterranean Sea from Remote Sensing, PhD thesis, Tuscia University, Viterbo, Italy, 2014.
Di Cicco, A., Sammartino, M., Marullo, S., and Santoleri, R.: Regional Empirical Algorithms for an Improved Identification of Phytoplankton Functional Types and Size Classes in the Mediterranean Sea Using Satellite Data, Front. Mar. Sci., 4, 1–18, https://doi.org/10.3389/fmars.2017.00126, 2017.
D'Ortenzio, F. and Ribera d'Alcalà, M.: On the trophic regimes of the Mediterranean Sea: a satellite analysis, Biogeosciences, 6, 139–148, https://doi.org/10.5194/bg-6-139-2009, 2009.
Durham, W. M. and Stocker, R.: Thin Phytoplankton Layers: Characteristics, Mechanisms, and Consequences, Annu. Rev. Mar. Sci., 4, 177–207, https://doi.org/10.1146/annurev-marine-120710-100957, 2012.
Edwards, K. F., Thomas, M. K., Klausmeier, C. A., and Litchman, E.: Phytoplankton growth and the interaction of light and temperature: A synthesis at the species and community level, Limnol. Oceanogr., 61, 1232–1244, https://doi.org/10.1002/lno.10282, 2016.
Estrada, M.: Primary production in the northwestern Mediterranean, Sci. Mar., 60, 55–64, 1996.
Estrada, M., Marrasé, C., Latasa, M., Berdalet, E., Delgado, M., and Riera, T.: Variability of deep chlorophyll maximum characteristics in the Northwestern Mediterranean, Mar. Ecol. Prog. Ser., 92, 289–300, 1993.
Fennel, K. and Boss, E.: Subsurface maxima of phytoplankton and chlorophyll: Steady-state solutions from a simple model, Limnol. Oceanogr., 48, 1521–1534, https://doi.org/10.4319/lo.2003.48.4.1521, 2003.
Ferron, B., Bouruet Aubertot, P., Cuypers, Y., Schroeder, K., and Borghini, M.: How important are diapycnal mixing and geothermal heating for the deep circulation of the Western Mediterranean?, Geophys. Res. Lett., 44, 7845–7854, https://doi.org/10.1002/2017gl074169, 2017.
Fisher, N. L. and Halsey, K. H.: Mechanisms that increase the growth efficiency of diatoms in low light, Photosynth. Res., 129, 183–197, https://doi.org/10.1007/s11120-016-0282-6, 2016.
Fisher, T., Minnaard, J., and Dubinsky, Z.: Photoacclimation in the marine alga Nannochloropsis sp. (Eustigmatophyte): a kinetic study, J. Plankton Res., 18, 1797–1818, https://doi.org/10.1093/plankt/18.10.1797, 1996.
Frouin, R., Lingner, D. W., Gautier, C., Baker, K. S., and Smith, R. C.: A simple analytical formula to compute clear sky total and photosynthetically available solar irradiance at the ocean surface, J. Geophys. Res.-Oceans, 94, 9731–9742, https://doi.org/10.1029/JC094iC07p09731, 1989.
Geider, R. J.: Light and temperature dependence of the carbon to chlorophyll a ratio in microalgae and cyanobacteria: implications for physiology and growth of phytoplankton, New Phytol., 106, 1–34, https://doi.org/10.1111/j.1469-8137.1987.tb04788.x, 1987.
Geider, R. J.: Respiration: Taxation Without Representation?, in: Primary Productivity and Biogeochemical Cycles in the Sea, edited by: Falkowski, P. G., Woodhead, A. D., and Vivirito, K., Springer US, Boston, MA, 333–360, 1992.
Geider, R. J., MacIntyre, H. L., and Kana, T. M.: A dynamic model of photoadaptation in phytoplankton, Limnol. Oceanogr., 41, 1–15, https://doi.org/10.4319/lo.1996.41.1.0001, 1996.
Goldman, J. C., McCarthy, J. J., and Peavey, D. G.: Growth rate influence on the chemical composition of phytoplankton in oceanic waters, Nature, 279, 210–215, https://doi.org/10.1038/279210a0, 1979.
Guieu, C. and Desboeufs, K.: PEACETIME cruise, RV Pourquoi pas?, https://doi.org/10.17600/17000300, 2017.
Guieu, C., Aumont, O., Paytan, A., Bopp, L., Law, C. S., Mahowald, N., Achterberg, E. P., Marañón, E., Salihoglu, B., Crise, A., Wagener, T., Herut, B., Desboeufs, K., Kanakidou, M., Olgun, N., Peters, F., Pulido-Villena, E., Tovar-Sanchez, A., and Völker, C.: The significance of the episodic nature of atmospheric deposition to Low Nutrient Low Chlorophyll regions, Global Biogeochem. Cy., 28, 1179–1198, https://doi.org/10.1002/2014gb004852, 2014.
Guieu, C., D'Ortenzio, F., Dulac, F., Taillandier, V., Doglioli, A., Petrenko, A., Barrillon, S., Mallet, M., Nabat, P., and Desboeufs, K.: Introduction: Process studies at the air–sea interface after atmospheric deposition in the Mediterranean Sea – objectives and strategy of the PEACETIME oceanographic campaign (May–June 2017), Biogeosciences, 17, 5563–5585, https://doi.org/10.5194/bg-17-5563-2020, 2020.
Halsey, K. H. and Jones, B. M.: Phytoplankton Strategies for Photosynthetic Energy Allocation, Annu. Rev. Mar. Sci., 7, 265–297, https://doi.org/10.1146/annurev-marine-010814-015813, 2015.
Herbland, A. and Voituriez, B.: Hydrological structure analysis for estimating the primary production in the tropical Atlantic Ocean, J. Mar. Res., 37, 87–101, 1979.
Huete-Ortega, M., Cermeño, P., Calvo-Díaz, A., and Marañón, E.: Isometric size-scaling of metabolic rate and the size abundance distribution of phytoplankton, P. Roy. Soc. B, 279, 1815–1823, https://doi.org/10.1098/rspb.2011.2257, 2012.
Ignatiades, L., Gotsis-Skretas, O., Pagou, K., and Krasakopoulou, E.: Diversification of phytoplankton community structure and related parameters along a large-scale longitudinal east–west transect of the Mediterranean Sea, J. Plankton Res., 31, 411–428, https://doi.org/10.1093/plankt/fbn124, 2009.
Karl, D. M., Laws, E. A., Morris, P., Williams, P. J. l., and Emerson, S.: Metabolic balance of the open sea, Nature, 426, 32–32, https://doi.org/10.1038/426032a, 2003.
Kemp, A. E. S. and Villareal, T. A.: High diatom production and export in stratified waters – A potential negative feedback to global warming, Prog. Oceanogr., 119, 4–23, https://doi.org/10.1016/j.pocean.2013.06.004, 2013.
Kemp, A. E. S. and Villareal, T. A.: The case of the diatoms and the muddled mandalas: Time to recognize diatom adaptations to stratified waters, Prog. Oceanogr., 167, 138–149, https://doi.org/10.1016/j.pocean.2018.08.002, 2018.
Kirchman, D. L.: Calculating microbial growth rates from data on production and standing stocks, Mar. Ecol. Prog. Ser., 233, 303–306, 2002.
Kremer, C. T., Thomas, M. K., and Litchman, E.: Temperature- and size-scaling of phytoplankton population growth rates: Reconciling the Eppley curve and the metabolic theory of ecology, Limnol. Oceanogr., 62, 1658–1670, https://doi.org/10.1002/lno.10523, 2017.
Lande, R. and Wood, A. M.: Suspension times of particles in the upper ocean, Deep-Sea Res. Pt. I, 34, 61–72, https://doi.org/10.1016/0198-0149(87)90122-1, 1987.
Landry, M. R., Brown, S. L., Rii, Y. M., Selph, K. E., Bidigare, R. R., Yang, E. J., and Simmons, M. P.: Depth-stratified phytoplankton dynamics in Cyclone Opal, a subtropical mesoscale eddy, Deep-Sea Res. Pt. II, 55, 1348–1359, https://doi.org/10.1016/j.dsr2.2008.02.001, 2008.
Landry, M. R., Ohman, M. D., Goericke, R., Stukel, M. R., and Tsyrklevich, K.: Lagrangian studies of phytoplankton growth and grazing relationships in a coastal upwelling ecosystem off Southern California, Prog. Oceanogr., 83, 208–216, https://doi.org/10.1016/j.pocean.2009.07.026, 2009.
Larsen, A., Castberg, T., Sandaa, R. A., Brussaard, C. P. D., Egge, J., Heldal, M., Paulino, A., Thyrhaug, R., v. Hannen, E. J., and Bratbak, G.: Population dynamics and diversity of phytoplankton, bacteria and viruses in a seawater enclosure, Mar. Ecol. Prog. Ser., 221, 47–57, 2001.
Lavigne, H., D'Ortenzio, F., Ribera D'Alcalà, M., Claustre, H., Sauzède, R., and Gacic, M.: On the vertical distribution of the chlorophyll a concentration in the Mediterranean Sea: a basin-scale and seasonal approach, Biogeosciences, 12, 5021–5039, https://doi.org/10.5194/bg-12-5021-2015, 2015.
Lemée, R., Rochelle-Newall, E., Wambeke, F. V., Pizay, M. D., Rinaldi, P., and Gattuso, J. P.: Seasonal variation of bacterial production, respiration and growth efficiency in the open NW Mediterranean Sea, Aquat. Microb. Ecol., 29, 227–237, 2002.
Letelier, R. M., Karl, D. M., Abbott, M. R., and Bidigare, R. R.: Light driven seasonal patterns of chlorophyll and nitrate in the lower euphotic zone of the North Pacific Subtropical Gyre, Limnol. Oceanogr., 49, 508–519, https://doi.org/10.4319/lo.2004.49.2.0508, 2004.
López-Sandoval, D. C., Fernández, A., and Marañón, E.: Dissolved and particulate primary production along a longitudinal gradient in the Mediterranean Sea, Biogeosciences, 8, 815–825, https://doi.org/10.5194/bg-8-815-2011, 2011.
MacIntyre, H. L., Kana, T. M., Anning, T., and Geider, R. J.: Photoacclimation of photosynthesis irradiance response curves and photosynthetic pigments in microalgae and cyanobacteria, J. Phycol., 38, 17–38, https://doi.org/10.1046/j.1529-8817.2002.00094.x, 2002.
Magazzù, G. and Decembrini, F.: Primary production, biomass and abundance of phototrophic picoplankton in the Mediterranean Sea: a review, Aquat. Microb. Ecol., 9, 97–104, 1995.
Marañón, E.: Phytoplankton growth rates in the Atlantic subtropical gyres, Limnol. Oceanogr., 50, 299–310, https://doi.org/10.4319/lo.2005.50.1.0299, 2005.
Marañón, E.: Cell Size as a Key Determinant of Phytoplankton Metabolism and Community Structure, Annu. Rev. Mar. Sci., 7, 241–264, https://doi.org/10.1146/annurev-marine-010814-015955, 2015.
Marañón, E., Holligan, P. M., Varela, M., Mouriño, B., and Bale, A. J.: Basin-scale variability of phytoplankton biomass, production and growth in the Atlantic Ocean, Deep-Sea Res. Pt. I , 47, 825–857, https://doi.org/10.1016/S0967-0637(99)00087-4, 2000.
Marañón, E., Cermeño, P., Fernández, E., Rodríguez, J., and Zabala, L.: Significance and mechanisms of photosynthetic production of dissolved organic carbon in a coastal eutrophic ecosystem, Limnol. Oceanogr., 49, 1652–1666, https://doi.org/10.4319/lo.2004.49.5.1652, 2004.
Marañón, E., Fernández, A., Mouriño-Carballido, B., Martínez-GarcÍa, S., Teira, E., Cermeño, P., Chouciño, P., Huete-Ortega, M., Fernández, E., Calvo-Díaz, A., Morán, X. A. G., Bode, A., Moreno-Ostos, E., Varela, M. M., Patey, M. D., and Achterberg, E. P.: Degree of oligotrophy controls the response of microbial plankton to Saharan dust, Limnol. Oceanogr., 55, 2339–2352, https://doi.org/10.4319/lo.2010.55.6.2339, 2010.
Marañón, E., Cermeño, P., López-Sandoval, D. C., Rodríguez-Ramos, T., Sobrino, C., Huete-Ortega, M., Blanco, J. M., and Rodríguez, J.: Unimodal size scaling of phytoplankton growth and the size dependence of nutrient uptake and use, Ecol. Lett., 16, 371–379, https://doi.org/10.1111/ele.12052, 2013.
Marañón, E., Cermeño, P., Huete-Ortega, M., López-Sandoval, D. C., Mouriño-Carballido, B., and Rodríguez-Ramos, T.: Resource Supply Overrides Temperature as Controlling Factor of Marine Phytoplankton Growth, PLOS ONE, 9, e99312, https://doi.org/10.1371/journal.pone.0099312, 2014.
Marañón, E., Lorenzo, M. P., Cermeño, P., and Mouriño-Carballido, B.: Nutrient limitation suppresses the temperature dependence of phytoplankton metabolic rates, ISME J., 12, 1836–1845, https://doi.org/10.1038/s41396-018-0105-1, 2018.
Marie, D., Simon, N., Guillou, L., Partensky, F., and Vaulot, D.: Flow Cytometry Analysis of Marine Picoplankton, in: In Living Color: Protocols in Flow Cytometry and Cell Sorting, edited by: Diamond, R. A., and Demaggio, S., Springer, Berlin, Heidelberg, 421–454, 2000.
Martinez-Vicente, V., Dall'Olmo, G., Tarran, G., Boss, E., and Sathyendranath, S.: Optical backscattering is correlated with phytoplankton carbon across the Atlantic Ocean, Geophys. Res. Lett., 40, 1154–1158, https://doi.org/10.1002/grl.50252, 2013.
Marty, J.-C. and Chiavérini, J.: Seasonal and interannual variations in phytoplankton production at DYFAMED time-series station, northwestern Mediterranean Sea, Deep-Sea Res. Pt. II, 49, 2017–2030, https://doi.org/10.1016/S0967-0645(02)00025-5, 2002.
Marty, J.-C., Chiavérini, J., Pizay, M.-D., and Avril, B.: Seasonal and interannual dynamics of nutrients and phytoplankton pigments in the western Mediterranean Sea at the DYFAMED time-series station (1991–1999), Deep-Sea Res. Pt. II, 49, 1965–1985, https://doi.org/10.1016/S0967-0645(02)00022-X, 2002.
Mena, C., Reglero, P., Hidalgo, M., Sintes, E., Santiago, R., Martín, M., Moyà, G., and Balbín, R.: Phytoplankton Community Structure Is Driven by Stratification in the Oligotrophic Mediterranean Sea, Front. Microbiol., 10, 1–15, https://doi.org/10.3389/fmicb.2019.01698, 2019.
Mignot, A., Claustre, H., Uitz, J., Poteau, A., D'Ortenzio, F., and Xing, X.: Understanding the seasonal dynamics of phytoplankton biomass and the deep chlorophyll maximum in oligotrophic environments: A Bio-Argo float investigation, Global Biogeochem. Cy., 28, 856–876, https://doi.org/10.1002/2013gb004781, 2014.
Mills, M. M., Ridame, C., Davey, M., La Roche, J., and Geider, R. J.: Iron and phosphorus co-limit nitrogen fixation in the eastern tropical North Atlantic, Nature, 429, 292–294, https://doi.org/10.1038/nature02550, 2004.
Moberg, E. A. and Sosik, H. M.: Distance maps to estimate cell volume from two-dimensional plankton images, Limnol. Oceanogr.-Meth., 10, 278–288, https://doi.org/10.4319/lom.2012.10.278, 2012.
Mobley, C. D. and Boss, E. S.: Improved irradiances for use in ocean heating, primary production, and photo-oxidation calculations, Appl. Optics, 51, 6549–6560, https://doi.org/10.1364/AO.51.006549, 2012.
Moore, C. M., Mills, M. M., Arrigo, K. R., Berman-Frank, I., Bopp, L., Boyd, P. W., Galbraith, E. D., Geider, R. J., Guieu, C., Jaccard, S. L., Jickells, T. D., La Roche, J., Lenton, T. M., Mahowald, N. M., Marañón, E., Marinov, I., Moore, J. K., Nakatsuka, T., Oschlies, A., Saito, M. A., Thingstad, T. F., Tsuda, A., and Ulloa, O.: Processes and patterns of oceanic nutrient limitation, Nat. Geosci., 6, 701–710, https://doi.org/10.1038/ngeo1765, 2013.
Morán, X. A. G. and Alonso-Sáez, L.: Independence of bacteria on phytoplankton? Insufficient support for Fouilland & Mostajir's (2010) suggested new concept, FEMS Microbiol. Ecol., 78, 203–205, https://doi.org/10.1111/j.1574-6941.2011.01167.x, 2011.
Morán, X. A. G., Estrada, M., Gasol, J. M., and Pedrós-Alió, C.: Dissolved Primary Production and the Strength of Phytoplankton–Bacterioplankton Coupling in Contrasting Marine Regions, Microbial Ecol., 44, 217–223, https://doi.org/10.1007/s00248-002-1026-z, 2002.
Morel, A. and Berthon, J.-F.: Surface pigments, algal biomass profiles, and potential production of the euphotic layer: Relationships reinvestigated in view of remote-sensing applications, Limnol. Oceanogr., 34, 1545–1562, https://doi.org/10.4319/lo.1989.34.8.1545, 1989.
Moutin, T. and Raimbault, P.: Primary production, carbon export and nutrients availability in western and eastern Mediterranean Sea in early summer 1996 (MINOS cruise), J. Mar. Syst., 33–34, 273–288, https://doi.org/10.1016/S0924-7963(02)00062-3, 2002.
O'Connor, M. I., Piehler, M. F., Leech, D. M., Anton, A., and Bruno, J. F.: Warming and Resource Availability Shift Food Web Structure and Metabolism, PLOS Biol., 7, e1000178, https://doi.org/10.1371/journal.pbio.1000178, 2009.
Olofsson, M., Robertson, E. K., Edler, L., Arneborg, L., Whitehouse, M. J., and Ploug, H.: Nitrate and ammonium fluxes to diatoms and dinoflagellates at a single cell level in mixed field communities in the sea, Sci. Rep.-UK, 9, 1424, https://doi.org/10.1038/s41598-018-38059-4, 2019.
Olson, R. J. and Sosik, H. M.: A submersible imaging-in-flow instrument to analyze nano-and microplankton: Imaging FlowCytobot, Limnol. Oceanogr.-Meth., 5, 195–203, https://doi.org/10.4319/lom.2007.5.195, 2007.
Pan, Y., Rao, D. V. S., and Mann, K. H.: Acclimation to low light intensity in photosynthesis and growth of Pseudo-nitzschia multiseris Hasle, a neurotoxigenic diatom, J. Plankton Res., 18, 1427–1438, https://doi.org/10.1093/plankt/18.8.1427, 1996.
Pedrós-Alió, C., Calderón-Paz, J.-I., Guixa-Boixereu, N., Estrada, M., and Gasol, J. M.: Bacterioplankton and phytoplankton biomass and production during summer stratification in the northwestern Mediterranean Sea, Deep-Sea Res. Pt. I, 46, 985–1019, https://doi.org/10.1016/S0967-0637(98)00106-X, 1999.
Pérez, V., Fernández, E., Marañón, E., Morán, X. A. G., and Zubkov, M. V.: Vertical distribution of phytoplankton biomass, production and growth in the Atlantic subtropical gyres, Deep-Sea Res. Pt. I, 53, 1616–1634, https://doi.org/10.1016/j.dsr.2006.07.008, 2006.
Pulido-Villena, E., Ghiglione, J. F., Ortega-Retuerta, E., Van Wambeke, F., and Zohary, T.: Heterotrophic bacteria in the pelagic realm of the Mediterranean Sea, in: Life in the Mediterranean Sea: A Look at Habitat Changes, edited by: Stambler, N., Nova Science Publishers, Inc., Ramat Gan, Israel, 2012.
Ras, J., Claustre, H., and Uitz, J.: Spatial variability of phytoplankton pigment distributions in the Subtropical South Pacific Ocean: comparison between in situ and predicted data, Biogeosciences, 5, 353–369, https://doi.org/10.5194/bg-5-353-2008, 2008.
Robinson, A., Bouman, H. A., Tilstone, G. H., and Sathyendranath, S.: Size Class Dependent Relationships between Temperature and Phytoplankton Photosynthesis-Irradiance Parameters in the Atlantic Ocean, Front. Mar. Sci., 4, 1–19, https://doi.org/10.3389/fmars.2017.00435, 2018.
Siokou-Frangou, I., Christaki, U., Mazzocchi, M. G., Montresor, M., Ribera d'Alcalá, M., Vaqué, D., and Zingone, A.: Plankton in the open Mediterranean Sea: a review, Biogeosciences, 7, 1543–1586, https://doi.org/10.5194/bg-7-1543-2010, 2010.
Smith, D. C. and Azam, F.: A simple, economical method for measuring bacterial protein synthesis rates in seawater using 3H-leucine, Mar. Microb. Food Webs, 6, 107–114, 1992.
Steele, J.: A study of production in the Gulf of Mexico, J. Mar. Res., 3, 211–222, 1964.
Steinberg, D. K., Carlson, C. A., Bates, N. R., Johnson, R. J., Michaels, A. F., and Knap, A. H.: Overview of the US JGOFS Bermuda Atlantic Time-series Study (BATS): a decade-scale look at ocean biology and biogeochemistry, Deep-Sea Res. Pt. II, 48, 1405–1447, https://doi.org/10.1016/S0967-0645(00)00148-X, 2001.
Taillandier, V., Prieur, L., D'Ortenzio, F., Ribera d'Alcalà, M., and Pulido-Villena, E.: Profiling float observation of thermohaline staircases in the western Mediterranean Sea and impact on nutrient fluxes, Biogeosciences, 17, 3343–3366, https://doi.org/10.5194/bg-17-3343-2020, 2020.
Tanaka, T., Thingstad, T. F., Christaki, U., Colombet, J., Cornet-Barthaux, V., Courties, C., Grattepanche, J.-D., Lagaria, A., Nedoma, J., Oriol, L., Psarra, S., Pujo-Pay, M., and Van Wambeke, F.: Lack of P-limitation of phytoplankton and heterotrophic prokaryotes in surface waters of three anticyclonic eddies in the stratified Mediterranean Sea, Biogeosciences, 8, 525–538, https://doi.org/10.5194/bg-8-525-2011, 2011.
Tsiola, A., Pitta, P., Fodelianakis, S., Pete, R., Magiopoulos, I., Mara, P., Psarra, S., Tanaka, T., and Mostajir, B.: Nutrient Limitation in Surface Waters of the Oligotrophic Eastern Mediterranean Sea: an Enrichment Microcosm Experiment, Microbial Ecol., 71, 575–588, https://doi.org/10.1007/s00248-015-0713-5, 2016.
Turley, C. M., Bianchi, M., Christaki, U., Conan, P., Harris, J. R. W., Psarra, S., Ruddy, G., Stutt, E. D., Tselepides, A., and Wambeke, F. V.: Relationship between primary producers and bacteria in an oligotrophic sea–the Mediterranean and biogeochemical implications, Mar. Ecol. Prog. Ser., 193, 11–18, 2000.
Uitz, J., Claustre, H., Morel, A., and Hooker, S. B.: Vertical distribution of phytoplankton communities in open ocean: An assessment based on surface chlorophyll, J. Geophys. Res.-Oceans, 111, 1–23, https://doi.org/10.1029/2005jc003207, 2006.
Uitz, J., Huot, Y., Bruyant, F., Babin, M., and Claustre, H.: Relating phytoplankton photophysiological properties to community structure on large scales, Limnol. Oceanogr., 53, 614–630, https://doi.org/10.4319/lo.2008.53.2.0614, 2008.
Uitz, J., Claustre, H., Gentili, B., and Stramski, D.: Phytoplankton class-specific primary production in the world's oceans: Seasonal and interannual variability from satellite observations, Global Biogeochem. Cy., 24, 1–19, https://doi.org/10.1029/2009gb003680, 2010.
Uitz, J., Stramski, D., Gentili, B., D'Ortenzio, F., and Claustre, H.: Estimates of phytoplankton class-specific and total primary production in the Mediterranean Sea from satellite ocean color observations, Global Biogeochem. Cy., 26, 1–10, https://doi.org/10.1029/2011gb004055, 2012.
Van Wambeke, F., Heussner, S., Diaz, F., Raimbault, P., and Conan, P.: Small-scale variability in the coupling/uncoupling of bacteria, phytoplankton and organic carbon fluxes along the continental margin of the Gulf of Lions, Northwestern Mediterranean Sea, J. Mar. Syst., 33–34, 411–429, https://doi.org/10.1016/S0924-7963(02)00069-6, 2002.
Van Wambeke, F., Pulido, E., Dinasquet, J., Djaoudi, K., Engel, A., Garel, M., Guasco, S., Nunige, S., Taillandier, V., Zäncker, B., and Tamburini, C.: Spatial patterns of biphasic ectoenzymatic kinetics related to biogeochemical properties in the Mediterranean Sea, Biogeosciences Discuss., [preprint], https://doi.org/10.5194/bg-2020-253, in review, 2020a.
Van Wambeke, F., Taillandier, V., Deboeufs, K., Pulido-Villena, E., Dinasquet, J., Engel, A., Marañón, E., Ridame, C., and Guieu, C.: Influence of atmospheric deposition on biogeochemical cycles in an oligotrophic ocean system, Biogeosciences Discuss. [preprint], https://doi.org/10.5194/bg-2020-411, in review, 2020b.
Veldhuis, M. J. W. and Kraay, G. W.: Phytoplankton in the subtropical Atlantic Ocean: towards a better assessment of biomass and composition, Deep-Sea Res. Pt. I, 51, 507–530, https://doi.org/10.1016/j.dsr.2003.12.002, 2004.
Villareal, T. A., Woods, S., Moore, J. K., and CulverRymsza, K.: Vertical migration of Rhizosolenia mats and their significance to NO3 – fluxes in the central North Pacific gyre, J. Plankton Res., 18, 1103–1121, https://doi.org/10.1093/plankt/18.7.1103, 1996.
Wang, Q., Lyu, Z., Omar, S., Cornell, S., Yang, Z., and Montagnes, D. J. S.: Predicting temperature impacts on aquatic productivity: Questioning the metabolic theory of ecology's “canonical” activation energies, Limnol. Oceanogr., 64, 1172–1185, https://doi.org/10.1002/lno.11105, 2019.
Yoon, J.-E., Yoo, K.-C., Macdonald, A. M., Yoon, H.-I., Park, K.-T., Yang, E. J., Kim, H.-C., Lee, J. I., Lee, M. K., Jung, J., Park, J., Lee, J., Kim, S., Kim, S.-S., Kim, K., and Kim, I.-N.: Reviews and syntheses: Ocean iron fertilization experiments – past, present, and future looking to a future Korean Iron Fertilization Experiment in the Southern Ocean (KIFES) project, Biogeosciences, 15, 5847–5889, https://doi.org/10.5194/bg-15-5847-2018, 2018.
Zäncker, B., Cunliffe, M., and Engel, A.: Eukaryotic community composition in the sea surface microlayer across an east-west transect in the Mediterranean Sea, Biogeosciences Discuss. [preprint], https://doi.org/10.5194/bg-2020-249, in review, 2020.