the Creative Commons Attribution 4.0 License.
the Creative Commons Attribution 4.0 License.
 | 27 Jan 2021
Retrieval and validation of forest background reflectivity from daily Moderate Resolution Imaging Spectroradiometer (MODIS) bidirectional reflectance distribution function (BRDF) data across European forests
Angela Erb
Lauri Korhonen
Tobias Biermann
Arnaud Carrara
Edoardo Cremonese
Matthias Cuntz
Silvano Fares
Giacomo Gerosa
Thomas Grünwald
Niklas Hase
Michal Heliasz
Andreas Ibrom
Alexander Knohl
Johannes Kobler
Bart Kruijt
Holger Lange
Leena Leppänen
Jean-Marc Limousin
Francisco Ramon Lopez Serrano
Denis Loustau
Petr Lukeš
Lars Lundin
Riccardo Marzuoli
Meelis Mölder
Leonardo Montagnani
Johan Neirynck
Matthias Peichl
Corinna Rebmann
Eva Rubio
Margarida Santos-Reis
Crystal Schaaf
Marius Schmidt
Guillaume Simioni
Kamel Soudani
Caroline Vincke
Information about forest background reflectance is needed for accurate biophysical parameter retrieval from forest canopies (overstory) with remote sensing. Separating under- and overstory signals would enable more accurate modeling of forest carbon and energy fluxes. We retrieved values of the normalized difference vegetation index (NDVI) of the forest understory with the multi-angular Moderate Resolution Imaging Spectroradiometer (MODIS) bidirectional reflectance distribution function (BRDF)/albedo data (gridded 500 m daily Collection 6 product), using a method originally developed for boreal forests. The forest floor background reflectance estimates from the MODIS data were compared with in situ understory reflectance measurements carried out at an extensive set of forest ecosystem experimental sites across Europe. The reflectance estimates from MODIS data were, hence, tested across diverse forest conditions and phenological phases during the growing season to examine their applicability for ecosystems other than boreal forests. Here we report that the method can deliver good retrievals, especially over different forest types with open canopies (low foliage cover). The performance of the method was found to be limited over forests with closed canopies (high foliage cover), where the signal from understory becomes too attenuated. The spatial heterogeneity of individual field sites and the limitations and documented quality of the MODIS BRDF product are shown to be important for the correct assessment and validation of the retrievals obtained with remote sensing.
- Article
(9336 KB) - Full-text XML
- BibTeX
- EndNote


The reflectance from the forest canopy background/forest floor can often confound and even dominate the radiometric signal from the upper forest canopy layer to the atmosphere. Forest understory is defined here as all the components found under the forest canopy, including understory vegetation, leaf litter, moss, lichen, rock, soil, snow, or a mixture thereof (Pisek and Chen, 2009). If unaccounted for, forest understory can introduce potential bias in the estimation of overstory biophysical parameters (e.g., leaf area index, LAI, and fraction of absorbed photosynthetically active radiation, fAPAR) and, subsequently, productivity estimates (e.g., the net primary productivity – NPP) as the contribution of the understory to the total energy absorption capacity of a forest stand can be quite significant (Clark et al., 2001; Law et al., 2001). The understory vegetation in forest ecosystems should be treated differently from the overstory in carbon cycle modeling because of the different residence times of carbon fixed through NPP in different ecosystem components (Vogel and Gower, 1998; Rentch et al., 2003; Marques and Oliveira, 2004; Kim et al., 2016). Currently, the understory is often treated as an unknown quantity in carbon models due to the difficulties in measuring it properly and consistently across larger scales (Luyssaert et al., 2007). The predictions regarding the spectral variation in forest background have posed a persistent challenge (McDonald et al., 1998; Gemmell, 2000) because of the high variability in incoming radiance below the forest canopy, challenges with the spectral characterization, and weak signal in some parts of the spectrum for both overstory and understory (Schaepman et al., 2009), and the general varying nature of the understory (Miller et al., 1997).
Multi-angle remote sensing can capture signals of different forest layers because the observed proportions for different forest layers vary with the viewing angle, making it possible to separate forest overstory and understory signal. Here, we aim to consolidate previous efforts of tracking understory reflectance and its dynamics with multi-angle Earth observation data (Canisius and Chen, 2007; Pisek and Chen, 2009; Pisek et al., 2010, 2012, 2015a, 2015b, 2016; Jiao et al., 2014) by testing the validity of this approach, using Moderate Resolution Imaging Spectroradiometer bidirectional reflectance distribution function (MODIS BRDF)/albedo data (gridded 500 m daily Collection; 6 MCD43 product), against in situ understory reflectance measurements over an extended set of Integrated Carbon Observation System (ICOS) forest ecosystem sites. The validation procedure was defined to comply as much as possible with the best practices proposed by the Committee on Earth Observation Satellites (CEOS) Working Group on Calibration and Validation (WGCV) Land Product Validation (LPV) subgroup (Garrigues et al., 2008; Baret et al., 2006). It corresponds to Stage 1 validation, as defined by the CEOS (Nightingale et al., 2011; Weiss et al., 2014), where product accuracy shall be assessed over a small (typically <30) set of locations and time periods by comparison with in situ or other suitable reference data. Using the extended set of ICOS forest ecosystems as validation sites, we asked the following questions:
-
Can ICOS forest ecosystem sites serve as a suitable validation data set with respect to their footprint and the pixel resolution of Earth observation (EO) products?
-
Can we retrieve reliable normalized difference vegetation index (NDVI; Rouse et al., 1973; Tucker, 1979) dynamics for understory with MODIS BRDF data across diverse forest conditions during the growing season?
-
Are there important differences between the total (overstory and understory) and understory-only NDVI signals?
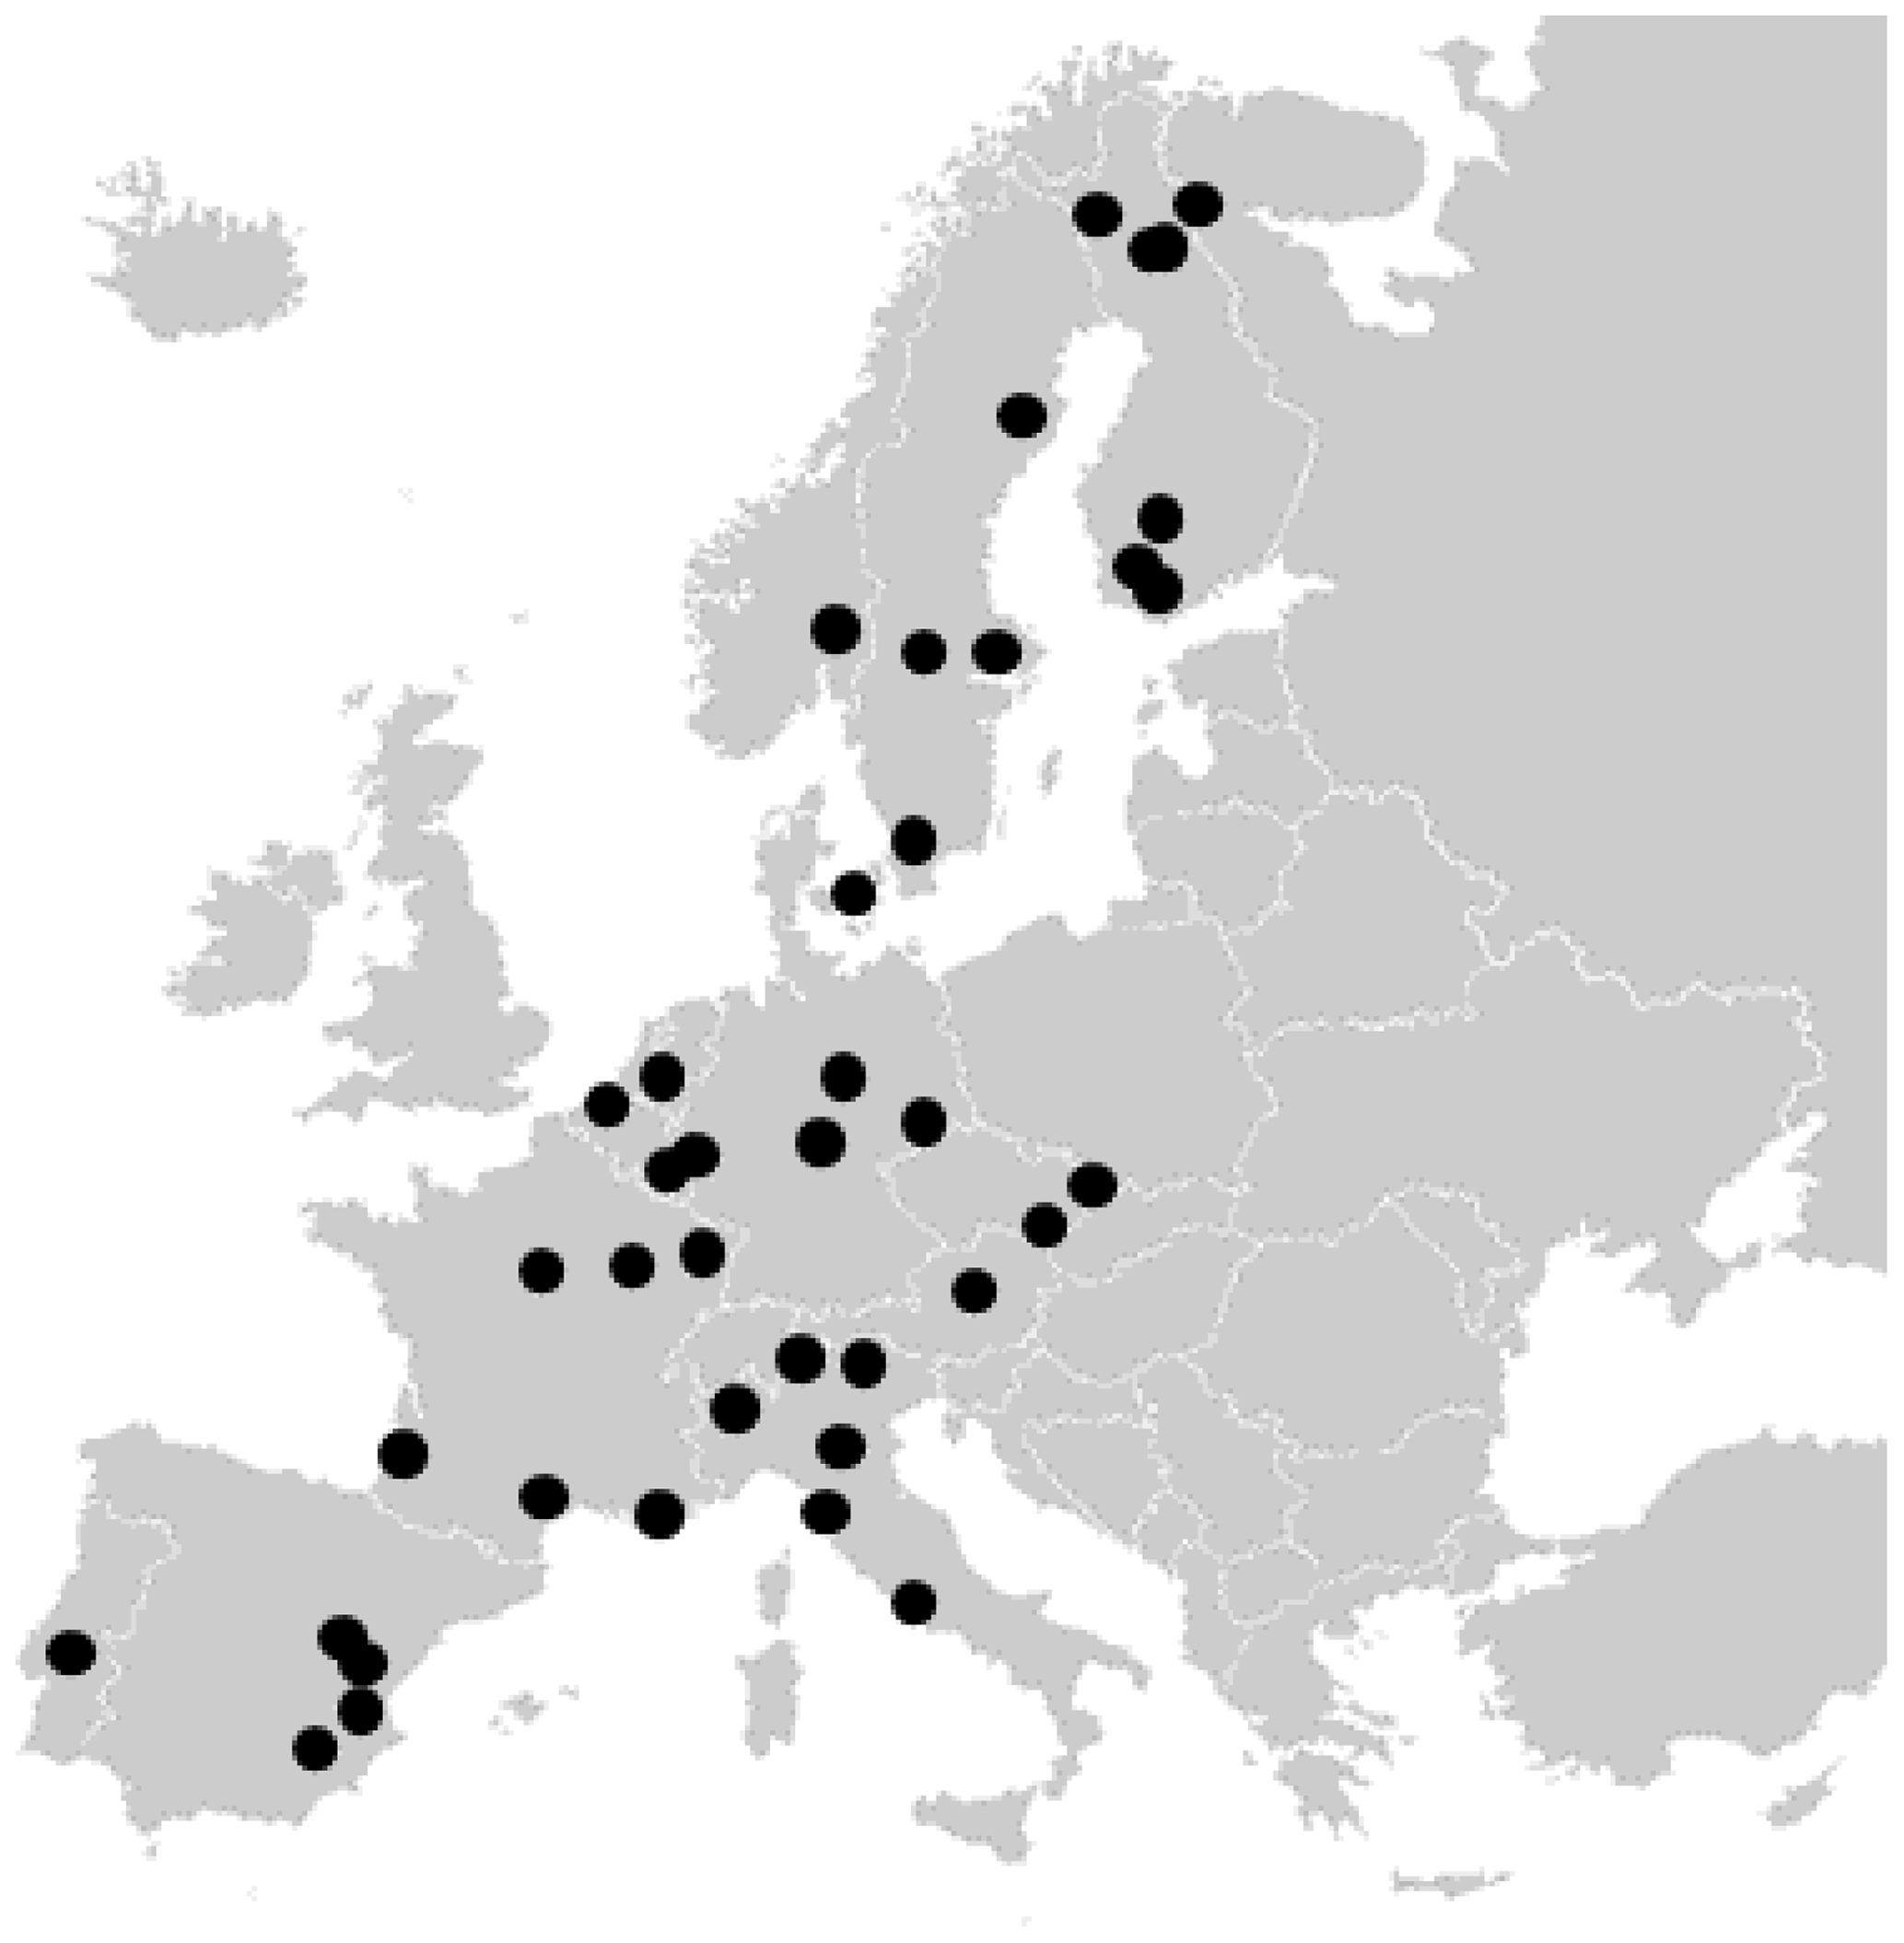
Figure 1Distribution of study sites across Europe; for further details, refer to Table 1.
2.1 Study sites
The ICOS is a distributed pan-European research infrastructure providing in situ standardized, integrated, long-term and high-precision observations of lower atmosphere greenhouse gas (GHG) concentrations and land–atmosphere and ocean–atmosphere GHG interactions (Gielen et al., 2017). In this study, we carried out the evaluation over the network of 31 ICOS-affiliated forest ecosystem sites, complemented with additional sites in Spain, Portugal, Austria, and Finland. Together, these selected 40 study sites comprise a large variety of forest over- and understory types, spanning a wide latitudinal gradient from almost 38∘ N (Yeste, Spain) to 68∘ N (Kenttärova, Finland). Site locations are shown in Fig. 1, and vegetation characteristics are summarized in Table 1.
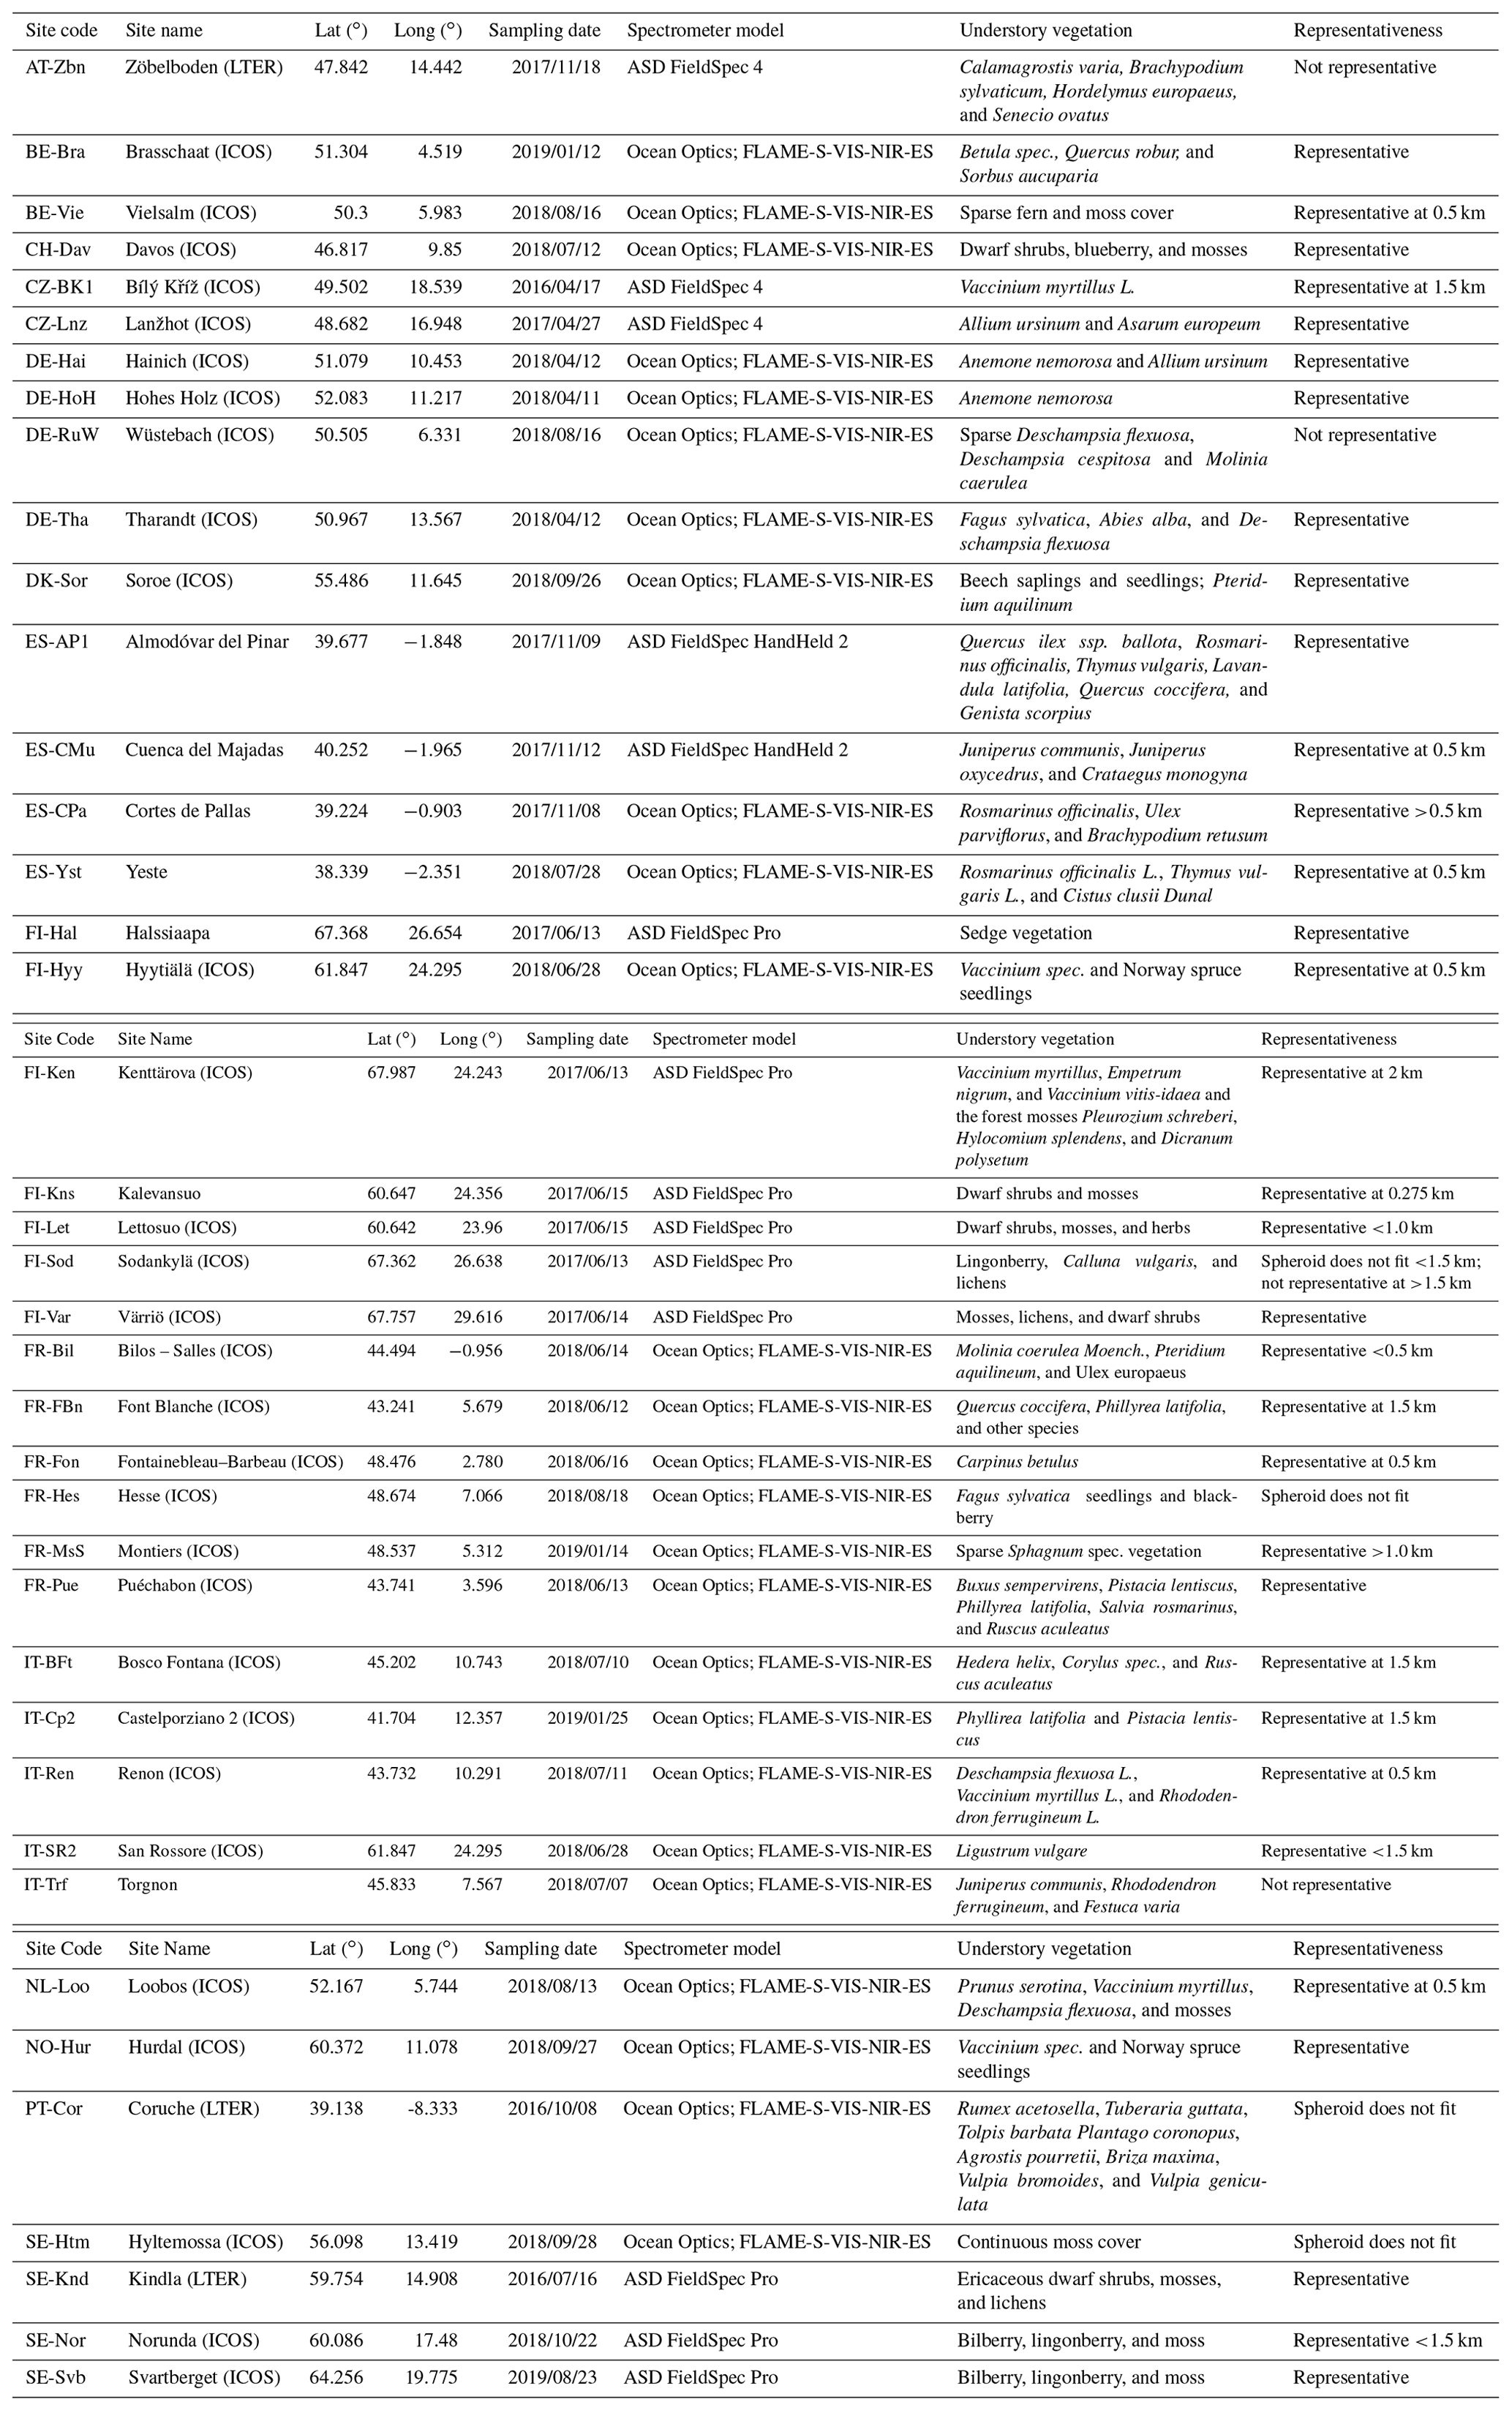
Table 1Study site characteristics and their spatial representativeness status. ICOS – Integrated Carbon Observing System sites; LTER – Long Term Ecological Research Network sites. Note that the sampling dates are shown in the format yyyy/mm/dd.
2.2 Understory spectra and forest canopy cover/closure in situ measurements
Following the terminology by Schaepman-Strub et al. (2006), we refer to the reflectance factors measured by the field spectrometers as the satellite-derived hemispherical–directional reflectance factors (HDRFs). The given spectrometer's field of view is approximated as being angular (cone) and narrower than a whole hemisphere, with some anisotropy captured which corresponds to normal remote sensing viewing geometry. An overview of the undertaken in situ campaigns at each site and their characteristics are given in Table 1.
The individual sites were visited between April 2016 and August 2019, mostly during the growing season. Following the protocol by Rautiainen et al. (2011), the understory spectra were measured with the Sun completely obscured by the clouds or at around sunset (diffuse light conditions), covering the visible/near infrared (NIR) region, depending on the spectrometer (see Table 1 for more details). A total of three understory spectra were measured every 2 m along two 50 m long transects laid at each site, resulting in 50 measurement points (150 individual measurements). Transects covered and characterized conditions within the measurement footprint of the given tower. It should be noted that the tower footprint might be different from the exact MODIS pixel footprint (see Sect. 2.5 for the spatial homogeneity assessment of MODIS pixels). The measurements concerned conditions on the forest floor and low herbaceous and shrubby species or tree seedlings and saplings, as the area sampled by each spectral measurement was estimated to correspond to a ∼50 cm diameter circle on the ground. The downward-pointing spectroradiometer (no fore optics were used) was held by the operator's outstretched hand. A total of three spectra above a 10 in. (0.254 m) Spectralon SRT-99–100 white panel were recorded at the beginning, after every four understory spectra measurement points (every 8 m), and at end of each transect. A hemispherical, conical reflectance factor was obtained with an uncalibrated Spectralon reflectance spectrum and the linearly interpolated irradiance. Finally, broadband HDRFs for red (620–670 nm) and NIR (841–876 nm) wavelengths were computed with relative spectral response functions for the MODIS sensor onboard Terra. The understory NDVI value for given site was calculated from the red and NIR-band values and averaged over the two transects.
Estimates of overstory foliage cover and crown cover were obtained from digital cover photographs (DCPs). Overstory foliage cover was defined as the percentage of ground covered by the vertical projection of foliage and branches and crown cover as the percentage of ground covered by the vertical projections of the outermost perimeters of the crowns on the horizontal plane (without double-counting the overlap; Gschwantner et al., 2009). The DCPs were taken from below the canopy every 8 m along transects at each site. The camera (Nikon CoolPix4500; 2272×1704 resolution) was set to automatic exposure, aperture-priority mode, minimum aperture, and F2 lens (Macfarlane et al., 2007). The camera was leveled at the height of 1.4 m above the ground, and the lens was pointed towards the zenith. This setup provides a view zenith angle from 0 to 15∘, which is comparable with the first ring of the LAI-2000 instrument (Macfarlane et al., 2007).
We used the algorithm by Nobis and Hunziker (2005) to threshold the majority of the DCP images. However, some of the images were visibly overexposed, i.e., the 8 bit digital numbers (DNs) of the background sky were 255, and parts of any portion of the sky were black (typically at 240–250 DN). Next, a method based on mathematical image morphology (Korhonen and Heikkinen, 2009) was applied to estimate the foliage and crown cover fractions. In this method, black and white canopy images are processed with morphological closing and opening operations that are well known in digital image processing (Gonzalez and Woods, 2002). As a result, a filter for large gaps was obtained. When a tuning parameter (called the structuring element in image processing) was set so that large gaps only occurred between individual tree crowns (Korhonen and Heikkinen, 2009), the proportions of gaps inside and between individual crowns could be calculated.
2.3 Background signal retrieval method with EO data
The total reflectance of a pixel (R) results from the weighted linear combination of reflectance values by the forest canopy, forest background, and their sunlit and shaded components (Li and Strahler, 1985; Chen et al., 2000; Bacour and Bréon, 2005; Chopping et al., 2008; Roujean et al., 1992) as follows:
which includes the reflectivities of the sunlit crowns (RT), sunlit understory (RG), shaded crowns (RZT), and shaded understory (RZG). RG marks the bidirectional reflectance factor (BRF) of the target (understory). The kj are the proportions of these components at the chosen viewing angle or in the instantaneous field of view of the sensor at the given irradiation geometry. Following Canisius and Chen (2007), we derive the understory reflectivity (RG) with the assumption that the reflectivities of the overstory and understory at the given illumination geometry differ little between the chosen viewing angles. While the components may not fully meet the definition of Lambertian reflectors (i.e., reflecting electromagnetic radiation equally in all directions), several previous studies (e.g., Bacour and Bréon, 2005; Deering et al., 1999; Peltoniemi et al., 2005) found forward-scattering reflectance factors of various targets off the principal plane to be fairly constant. The most suitable viewing configuration for the retrieval has been identified by Pisek et al. (2015a), using a high angular resolution BRF data set of Kuusk et al. (2014) and accompanying in situ measurements of understory reflectance factors (Kuusk et al., 2013). The configuration consists of the BRF at nadir (Rn=0∘), with the solar zenith angle (SZA) corresponding to the Sun's position at 10:00 local time (LT) for given day and another zenith angle (Ra=40∘) with relative azimuth angle PHI = 130∘. It can be expressed by Eqs. (2) and (3) as follows:
The proportions of the components (kj) were obtained using the four-scale model (Chen and Leblanc, 1997) with parameters for generalized deciduous and coniferous tree stands as an input (see Table 2; Kuusk et al., 2013). The understory reflectance at the desired wavelengths can be calculated by combining and solving Eqs. (2) and (3) and the insertion of Rn and Ra estimates derived from appropriate EO data. The individual components (sunlit/shaded overstory and understory) cannot be resolved with the MODIS spatial resolution. The reflectances of shaded tree crowns (RZT) and understory (RZG) are related to sunlit ones via M as and , where for a reference target, which can be measured in the field or predetermined with the four-scale model. Here, the same M is assumed for overstory trees and the understory. Based on his field work in Canadian boreal forests, White (1999) suggested that angularly constant, wavelength-dependent M values may be appropriate, at least during the growing season. The input stand parameters from Table 2 may not be always precisely known while retrieving the understory signal over larger areas. Figure 2 shows the relationships between the available in situ data for tree heights or tree densities over our study sites with the 1 km2 resolution estimates from the global maps of Simard et al. (2011) and Crowther et al. (2015). The weak relationships indicate the current unsuitability of the site-specific variable estimates of interest (tree height and tree density) from currently available global maps at a given spatial resolution for our purpose. At the same time, the calculated mean values for the tree heights of needleleaved (17.5 m) and broadleaved tree stands (22.7 m) from Simard et al. (2011) over the study sites were reasonably close to our original generalized input parameter values in Table 2. Following Gemmell (2000), we opted to report a range of understory NDVI (NDVIu) values obtained with the combination of parameter values from Table 2 for each site and date. Specifying the correct constraints (window) for background alone has been previously found to greatly reduce the errors in the estimation of overstory parameters (Gemmell, 2000).
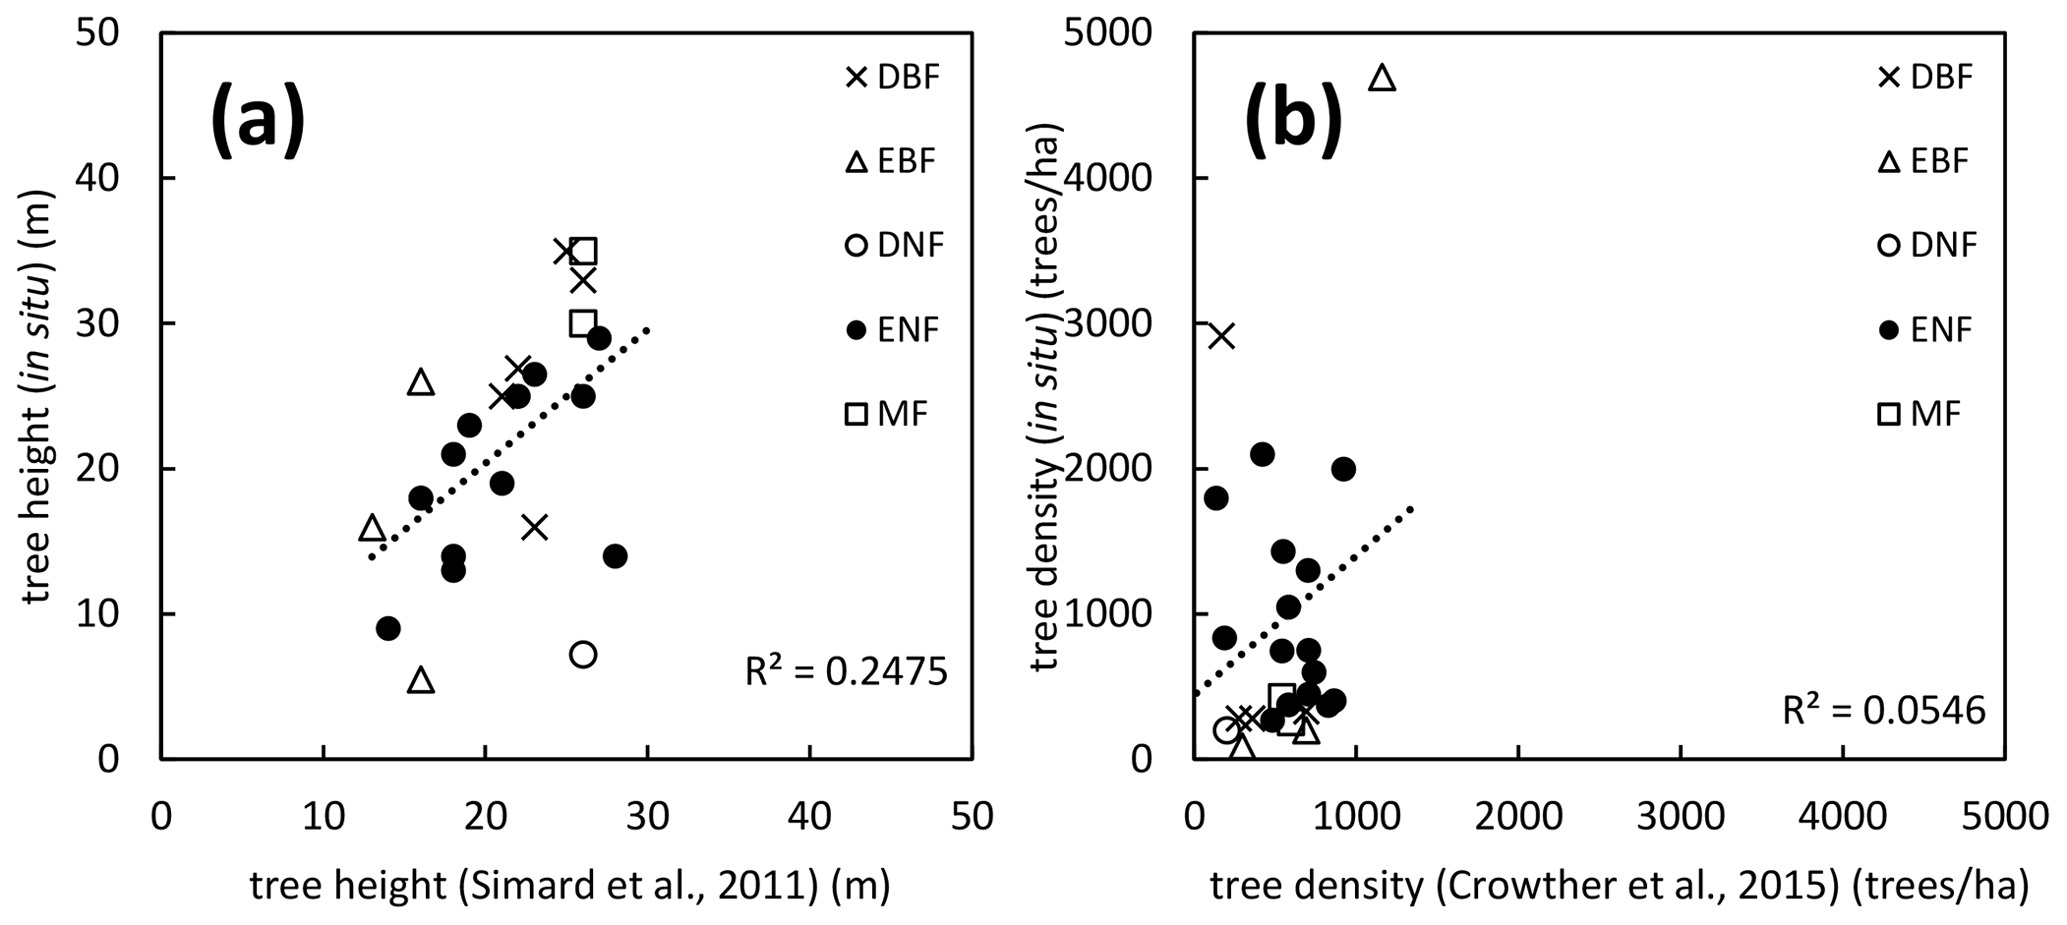
Figure 2(a) Relationship between available in situ estimates of tree height (in meters) with Simard et al.'s (2011) estimate. (b) Relationship between available in situ estimates of tree density (trees per hectare) with Crowther et al.'s (2015) estimates. DBF – deciduous broadleaf forest; EBF – evergreen broadleaf forest; DNF – deciduous needleleaf forest; ENF – evergreen needleleaf forest; MF – mixed forest.

2.4 MODIS BRDF data
The MCD43A1 V6 bidirectional reflectance distribution function and albedo (BRDF/albedo) model parameter data set is a 500 m gridded daily product. MCD43A1 is generated by inverting multi-date, multi-angular, cloud-free, atmospherically corrected, and surface reflectance observations acquired by MODIS instruments onboard the Terra and Aqua satellites over a 16 d period (Wang et al., 2018). The Julian date represents the ninth day of the 16 d retrieval period, and consequently, the observations are further weighted to estimate the BRDF/albedo for that particular day of interest. The MCD43A1 algorithm uses all high-quality observations that adequately sample the viewing hemisphere to fit an appropriate semiempirical BRDF model (the RossThickLiSparse-Reciprocal model; Roujean et al., 1992; Lucht et al., 2000) for that location and date of interest. We computed the bidirectional reflectance factor (BRF) at the top of the canopy with the isotropic parameter and two (volumetric and geometric) kernel functions (Roujean et al., 1992) for MODIS band 1 (red – 620–670 nm) and band 2 (NIR – 841–876 nm). We used the Ross and Li kernels to reconstruct the BRF values for required geometries (see Sect. 2.3) for each date, and then we derived the understory signal, using the formulas described in Sect. 2.3. The associated data quality (MCD43A2) product was employed to assess the effect of the retrieval quality on the accuracy of the calculated understory signal. All MODIS data have been accessed and processed through the Google Earth Engine (Gorelick et al., 2017).
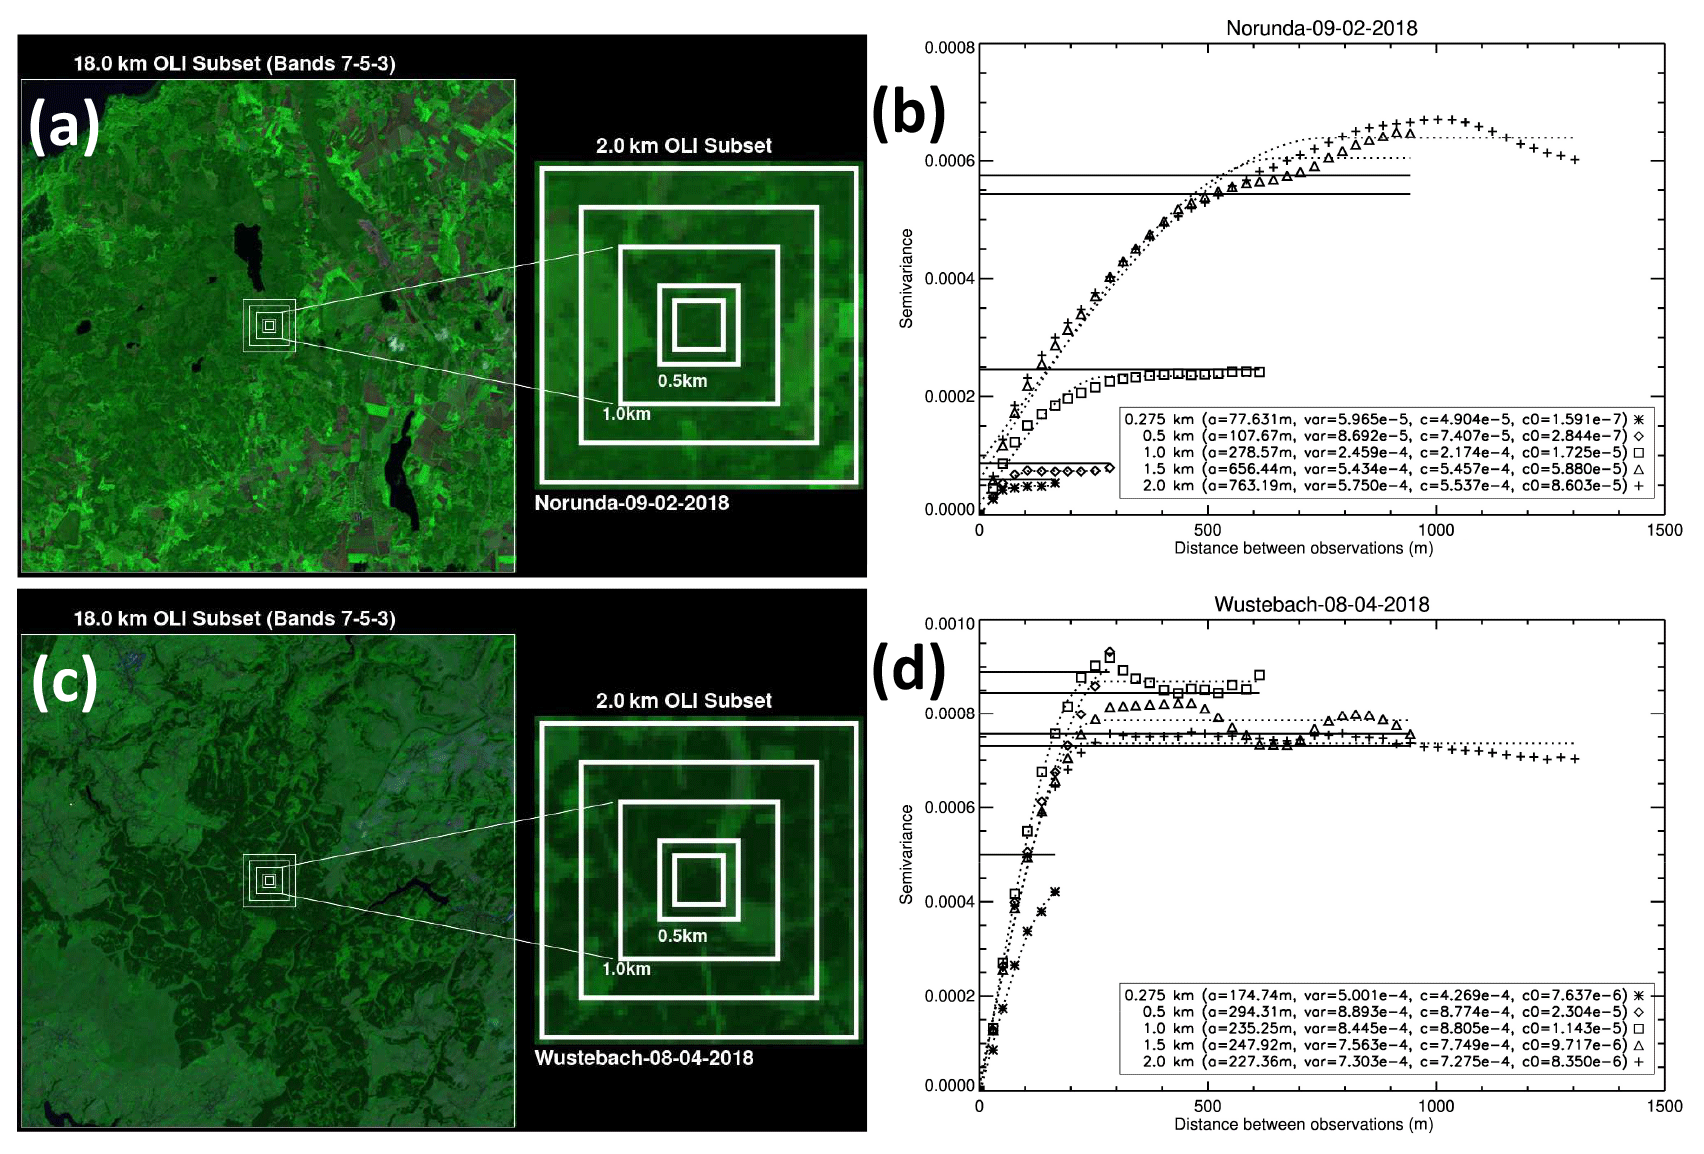
Figure 3Shortwave BRF composites centered at ICOS sites of (a) Norunda in Sweden and (c) Wüstebach in Germany. (b, d) Variogram estimators (points), spherical model results (dotted curves), and sample variances (solid straight lines) obtained over the sites with Operational Land Imager (OLI) subsets and spatial elements of 0.275, 0.5, 1.0, 1.5, and 2 km as a function of the distance between observations. Variogram legend explanations: a – variogram range; var – sample variance; c – variogram sill; c0 – nugget variance.
2.5 Spatial representativeness assessment of the validation sites
A method developed by Román et al. (2009), and refined by Wang et al. (2012, 2014, 2017) was adopted to evaluate the spatial representativeness of in situ measurements to assess the uncertainties arising from a direct comparison between field-measured forest understory spectra and the corresponding estimates with MODIS BRDF data. To characterize the spatial representativeness of a test site to represent a satellite retrieval, this method uses three variogram model parameters (the range, sill, and nugget), obtained by the analysis of near-nadir surface reflectances from cloud-free 30 m Landsat/Operational Land Imager (OLI) data (Román et al., 2009) collected as close to the sampling date as possible. Where valid imagery was not available within a reasonable window of the sampling date, imagery from the corresponding season of a different year was used. As such, the analysis was done to illustrate the representativeness of the tower site with respect to a particular point in time. Campagnolo et al. (2016) showed that the effective spatial resolution of 500 m gridded MODIS BRDF product at mid-latitudes is around 833×618 m because of the varied footprints of the source multi-angular surface reflectance observations. We analyzed each site with five different spatial extents (0.275, 0.5, 1, 1.5, and 2 km) to assess and illustrate the changes in spatial representativeness with different spatial resolutions.
3.1 Spatial representativeness
Table 1 provides the assessment of spatial heterogeneity for all sites included in this study, using OLI subsets acquired around the time of in situ measurements. The example results for the ICOS sites of Norunda (SE-Nor) in Sweden and Wüstebach (DE-RuW) in Germany, using three OLI subsets, are shown in Fig. 3. The variogram functions with relevant model parameters for the two sites are displayed in Fig. 3b and d. The range corresponds to the value on the x axis where the model flattens out. There is no further correlation of a biophysical property associated with that point beyond the range value. The sill is the ordinate value of the range. A smaller sill value indicates a more homogenous surface (less variation in surface reflectance). A surface can be considered spatially representative with respect to the MODIS footprint when the sill value is <5.0e−4 (Román et al., 2009; Wang et al., 2017). The sill values for all spatial extents are well below the value of 5.0e−4, up to 1 km spatial resolution in the case of Norunda (Fig. 3b), which indicates that the field measurements are representative and allow comparison with MODIS retrievals at a 500 m spatial resolution. While the Wüstebach site can be considered spatially homogeneous within the immediate vicinity of 275 m around the tower, the sill value exceeds the criteria of 5.0e−4 at >0.5 km spatial resolution. During late summer/early autumn of 2013, trees were almost completely removed in an area of 9 ha west of the tower in order to promote the natural regeneration of a near-natural deciduous forest from a spruce monoculture forest. The clear-felling area can be seen in Fig. 3d. This action resulted in an increase in the spatial heterogeneity of this ICOS site. In situ measurements collected within the footprint of the Wüstebach tower, thus, cannot be deemed fully comparable with the retrievals with MODIS at a 500 m spatial resolution. Overall, most of the sites were found representative at the spatial resolution of MODIS BRDF gridded data. The non-representative cases and the effect on the understory signal retrieval and agreement with the corresponding in situ measurements carried within the measurement footprint of the individual towers are further discussed in Sect. 3.2 and 3.3. Román et al. (2009) provide further details on the assessment of spatial representativeness, using a set of four geostatistical attributes derived from semivariograms.
3.2 NDVI ranges
There is only a weak relationship between the total (overstory and understory) NDVI signal retrieved with MODIS BRDF data and corresponding in situ understory NDVI measurements (R2=0.19; Fig. 4). Total NDVI values alone do not allow one to disentangle the correct understory signal. In contrast, our retrieval method could track the understory signal dynamics over a broad NDVI range (Fig. 5). The predicted understory NDVI ranges were beyond the uncertainty limits of in situ understory measurements (corresponding to ± 1 standard deviation (SD) here) in less than 15 % of cases. These sites with poor retrievals were carefully investigated to identify the issues precluding good results. Below, we focus on a discussion of results where the predicted and in situ measured NDVI ranges of the understory layer did not agree.
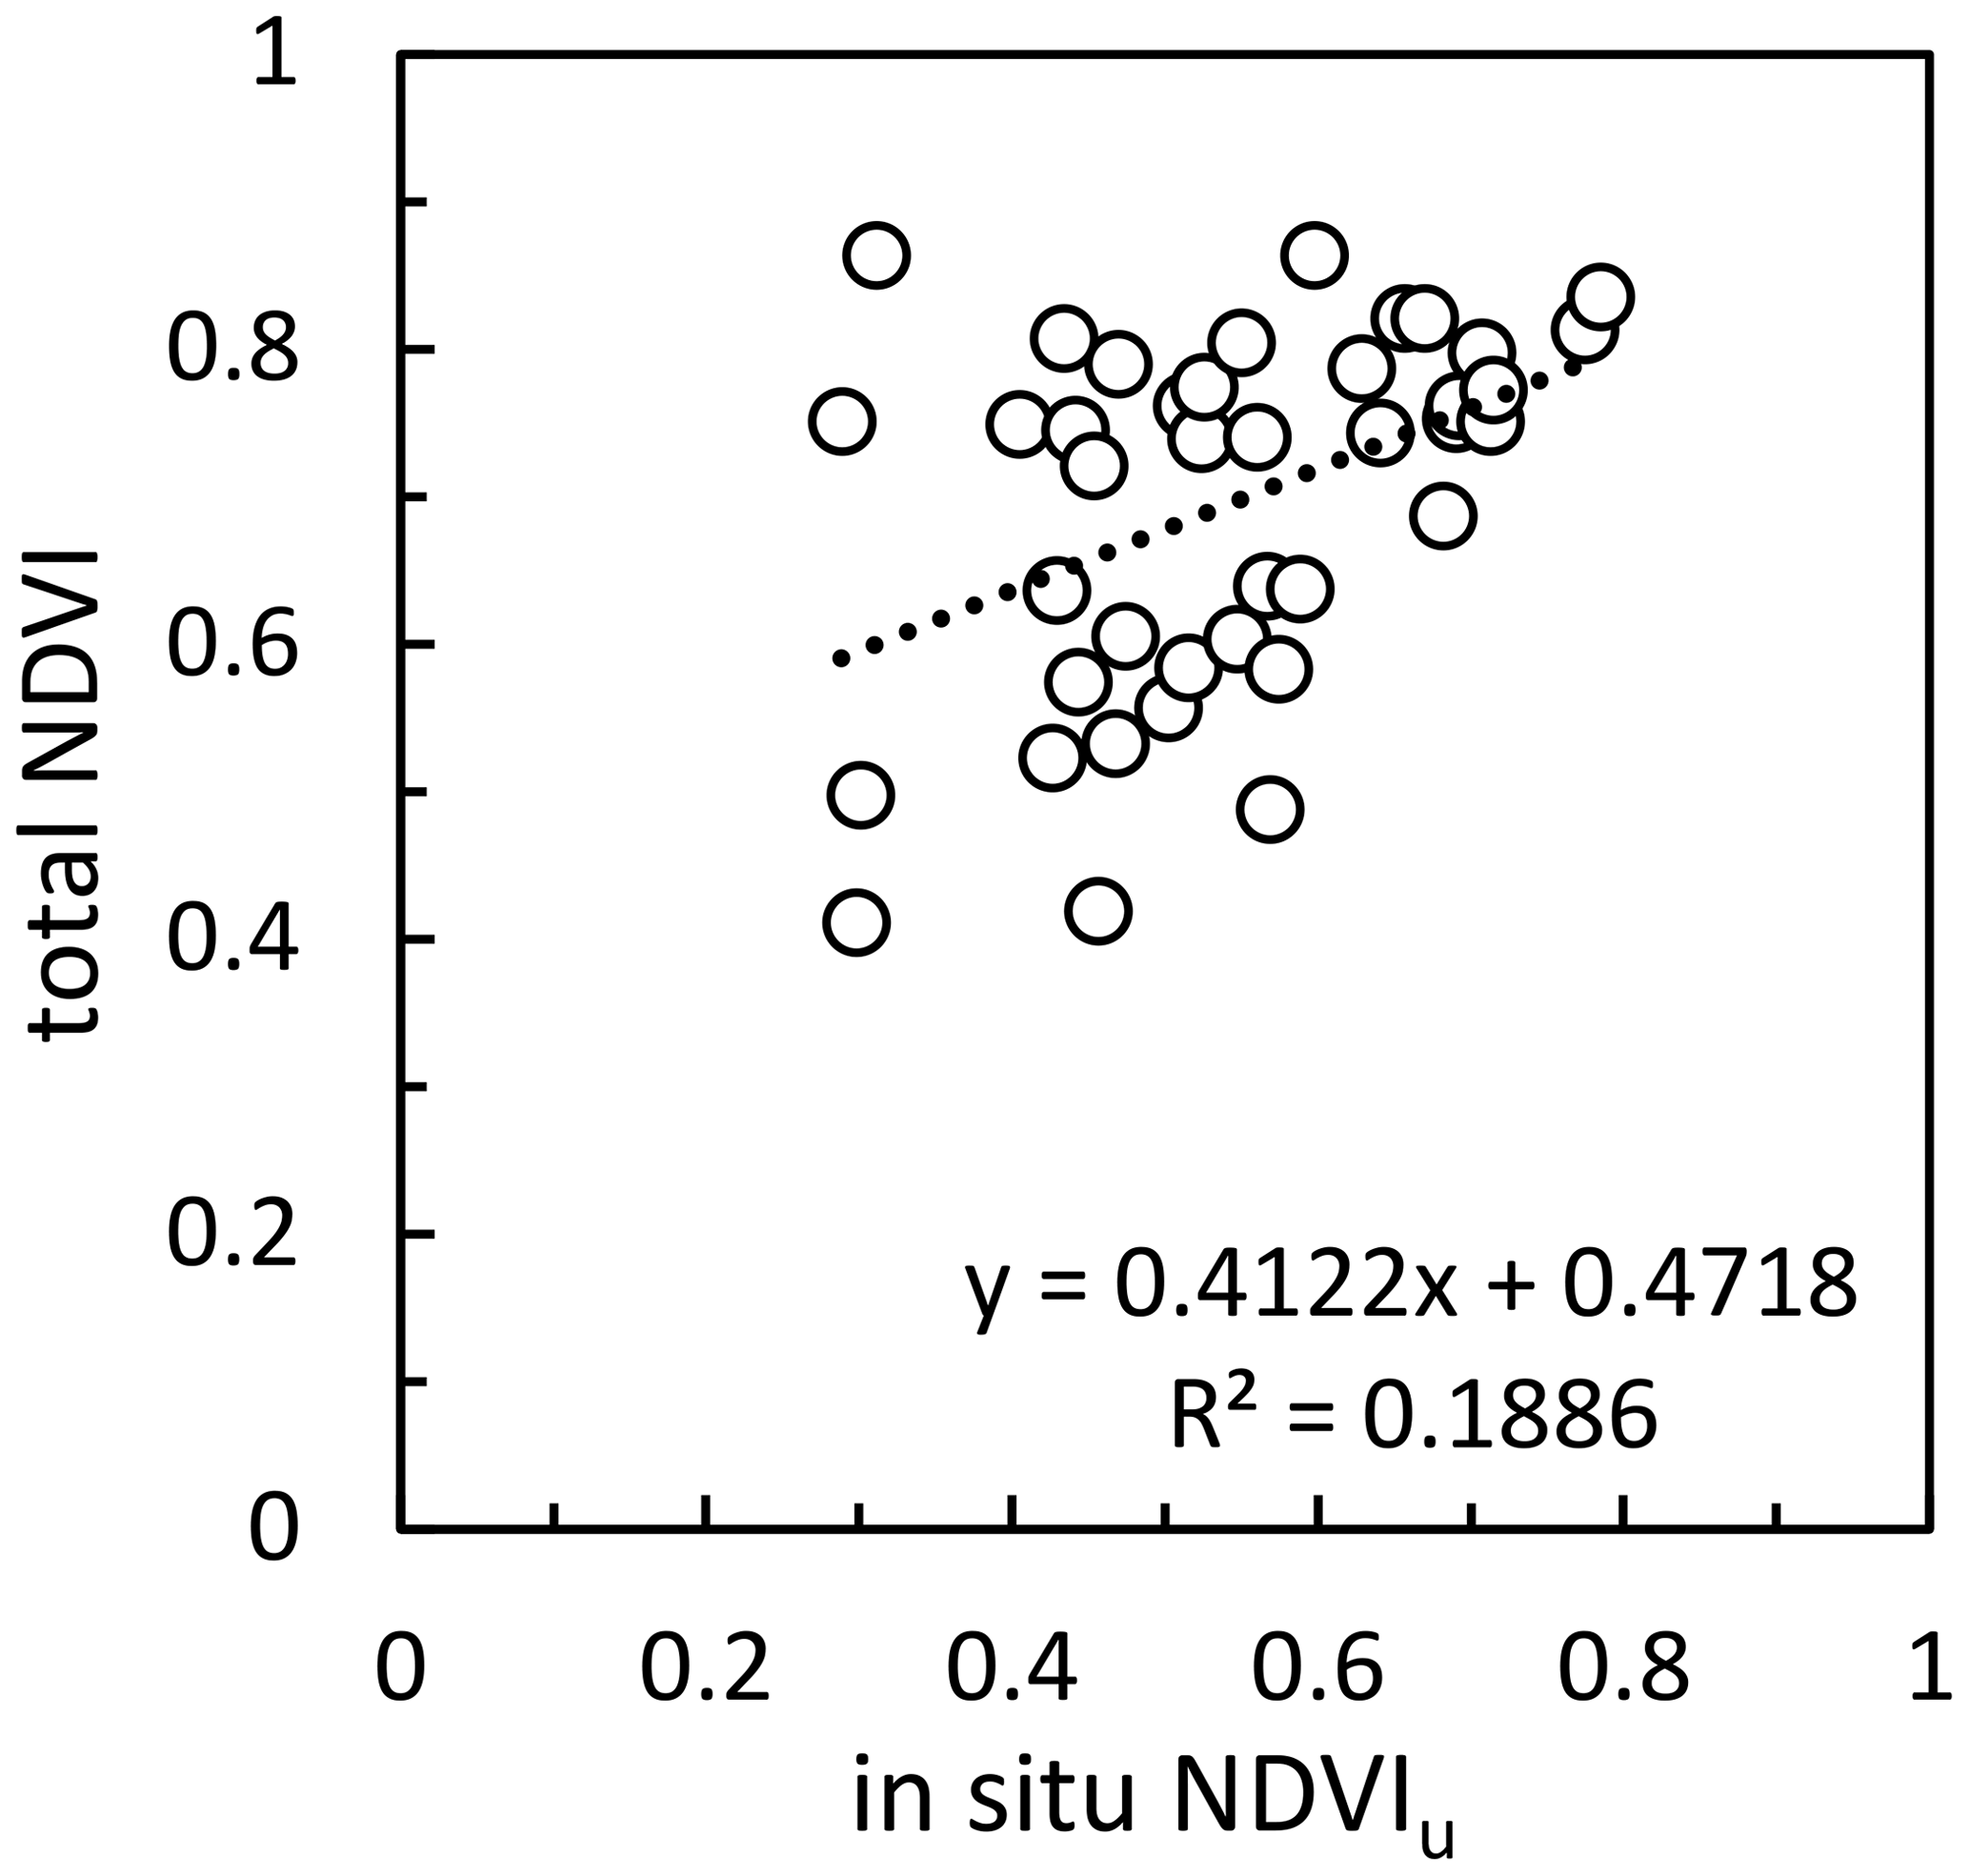
Figure 4Relationship between total (overstory and understory) NDVI values computed from nadir NDVI values, using MODIS BRDF/albedo data and in situ measured understory NDVI values over the study sites.
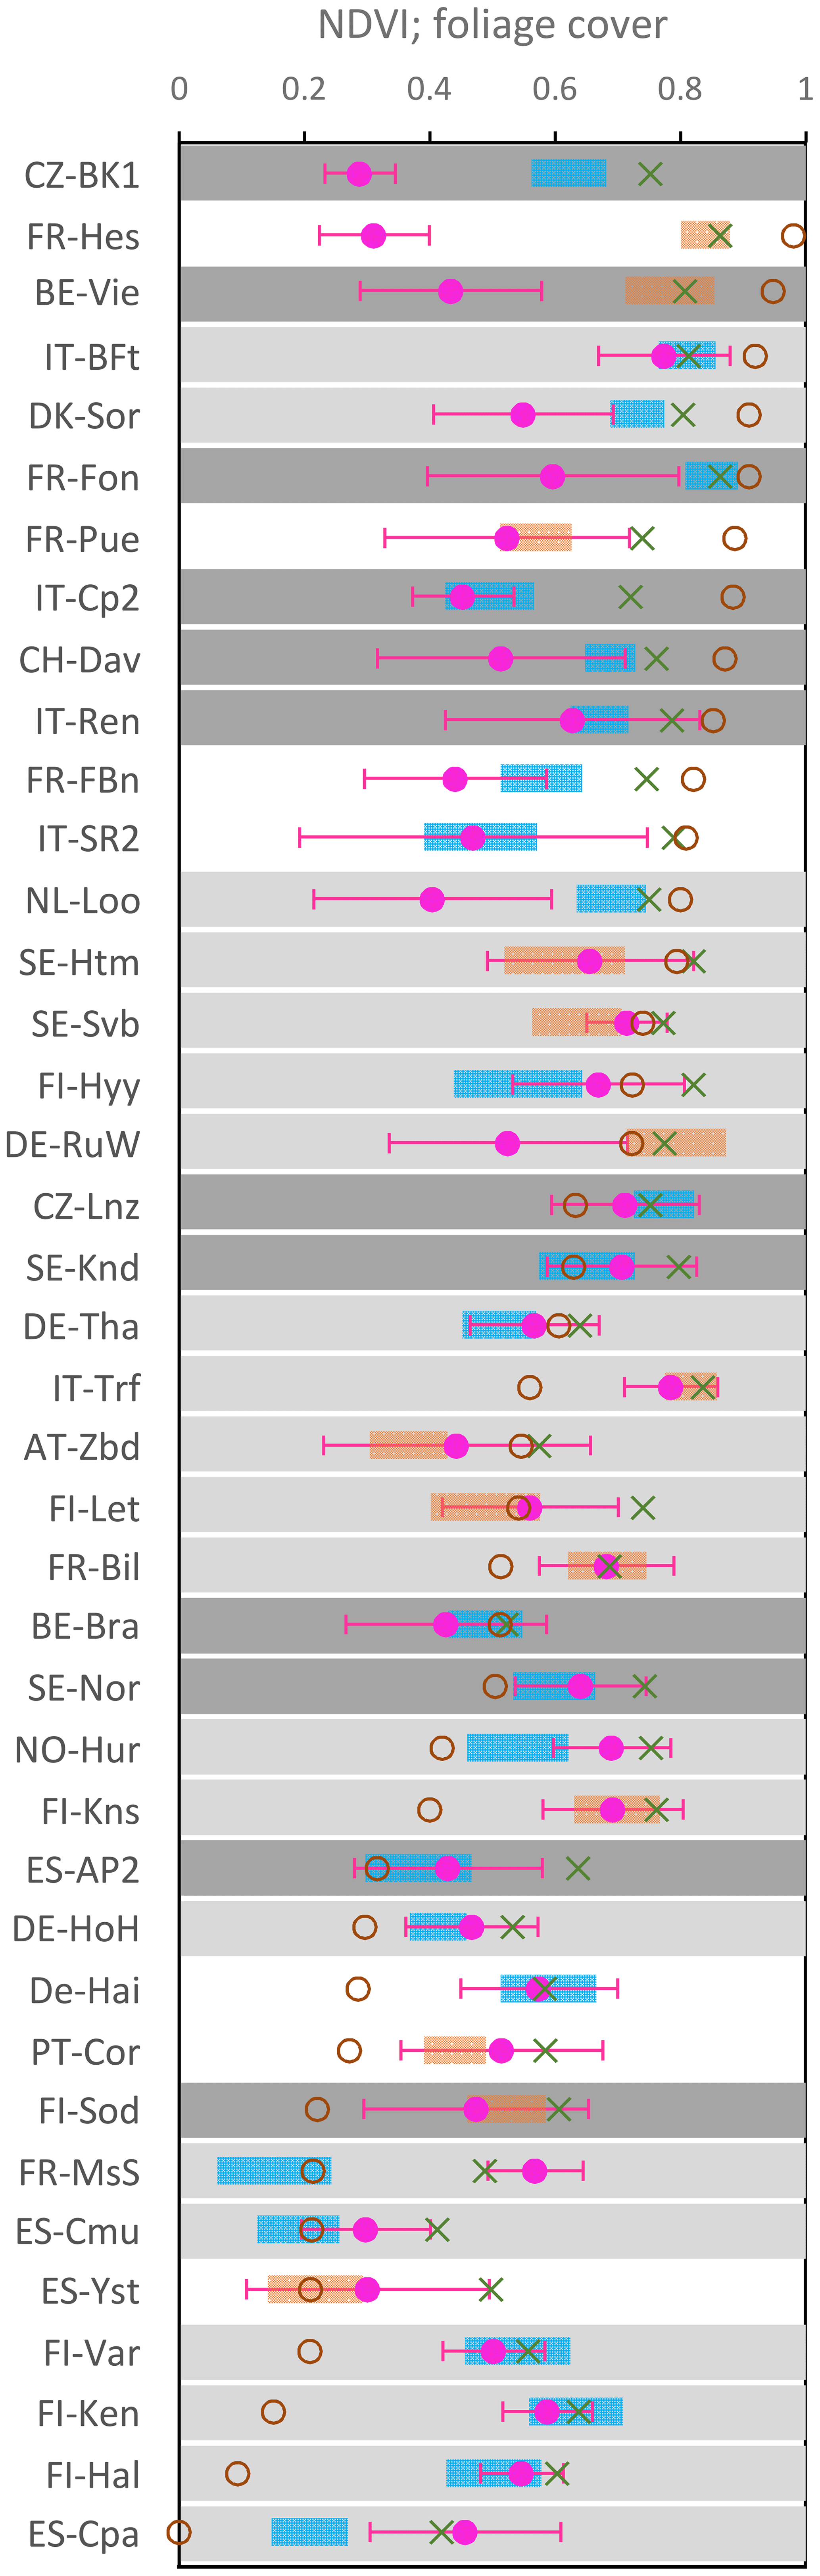
Figure 5Estimated understory NDVI (NDVIu) ranges for selected days (see Sect. 2.3 for how the ranges are obtained; blue bars – site-representative retrievals; orange bars – possible non-site-representative retrievals), in situ measurements (mean ±1 standard deviation (SD) shown in purple), and computed nadir total (understory and overstory) NDVI values from MODIS BRDF/albedo data (green crosses). The fraction of foliage cover is shown with brown open circles. MODIS BRDF parameters with lower quality flags are indicated with light gray (QA = 1) or dark gray (QA >1) bars. QA = 0 – best quality with full inversion; QA = 1 good quality with full inversion (including the cases with no clear-sky observations over the day of interest and those with a solar zenith angle >70∘ ); QA >1 – lower quality magnitude inversion, using archetypal BRDF shapes (for details please see Schaaf et al., 2002).
The understory dominated the overall signal of open shrubland at the Cortes de Pallas (ES-CPa) site and the deciduous broadleaf forest site at Montiers (FR-MsS) during the leaf-off part of the season (Fig. 5). Both sites were found to be spatially representative for comparison with MODIS footprint data at the time of the available in situ measurements (Table 1). There are only very few trees scattered across the Cortes de Pallas site, and ground vegetation is fully exposed. Extremely low tree density does not match with any of the original generalized input parameter values in Table 2, and the predicted understory signal does not match well with the in situ measurements. In situ measurements at Montiers were carried out during the leaf-off part of the season, which allowed a full exposure of the understory. Despite this, the predicted understory NDVI range from the MODIS data did not overlap with the in situ measurements at Montiers at all. However, the MODIS BRDF values for these sites were marked with lower data quality flags (QA >1), which correctly signals a decrease in accuracy in the calculations of the understory reflectance as well. Overall, our results confirm that, under conditions of very low tree density/leaf-off conditions, the understory signal can be assumed to be identical to the total scene NDVI.
The performance of the method turns out to be limited over sites with a closed canopy, such as Bílý Kříž (CZ-BK1), Hesse (FR-Hes), or Vielsalm (BE-Vie; Fig. 5). This is because the shadowing effect makes diffuse scattering the dominant mechanism in such stands, and the understory carries only a negligible influence on the top-of-canopy signal. Bosco Fontana (IT-BFt) is another broadleaf forest site with very high foliage cover (FC =0.91), yet the predicted understory NDVI range entirely overlaps with the collected in situ values. It should be noted that, in contrast to other sites with closed canopies, Bosco Fontana has very dense vegetation throughout the full vertical profile, and no clear distinction between overstory and understory can be made. Our results (Fig. 5) indicate that, in general, a reliable, independent retrieval of understory signal is not possible if the foliage cover exceeds 85 %.
MODIS BRDF data were of the best quality in the case of Font Blanche site (FR-FBn). The canopy here was also relatively open (FC =0.18), yet the predicted understory NDVI range was higher than the lower NDVI captured by the in situ understory measurements. The Font Blanche site has a dense intermediate layer dominated by juvenile holm oaks (Quercus ilex L.) with a mean height of 6 m (Fig. 7). Although the site was deemed spatially homogeneous at MODIS footprint scale (Table 2), the tall, dense layer made it impossible to obtain truly representative in situ measurements of understory reflectance. A similar situation with a tall shrub layer and, thus, a mismatch between the available in situ measurements and the predicted range of understory NDVI values was also encountered at another pine-dominated, spatially homogeneous site at Loobos (NL-Loo). Under such conditions, the understory NDVI values retrieved with EO data might actually provide a more complete picture of understory condition.
MODIS BRDF data were also of the best quality over the Coruche (PT-Cor) site, with a very open canopy (FC =0.272). Such a scenario should be optimal for the understory signal retrieval, yet the in situ measured NDVI of the understory is still higher than the predicted range with MODIS BRDF data. This disagreement appears to be caused by the presence of a water reservoir within the footprint of the MODIS pixel overlapping this site, which has contributed to lower reflectance in the red and NIR part of the spectrum. The water surface was not sampled during in situ measurements. A similar effect due to a nearby lake can be also observed in the case of the Hurdal (NO-Hur) site.
As discussed in Sect. 2.5, clear felling was carried near the Wüstebach (DE-RuW) tower in 2013. Our assessment of site homogeneity showed that the site cannot be considered spatially homogeneous at the gridded 500 m spatial resolution of MODIS pixels (Fig. 3d). The clear-felling action exposed the understory and encouraged the growth, resulting in an overlap of the total and retrieved understory signal by MODIS BRDF data. In situ measurements carried within the still-forested part of the site around the tower, with greater canopy closure, resulted in lower understory NDVI values. The Wüstebach site illustrates the importance of taking into account the spatial heterogeneity of a given site while comparing in situ measurements with EO observations at the corresponding scale. The proposed framework by Román et al. (2009) and Wang et al. (2017), using semivariograms, is an efficient tool for evaluating site spatial representativeness.
In summary, while the understory retrieval algorithm was originally developed for conditions within the boreal region forests (Canisius and Chen, 2007), Fig. 5 suggests encouraging the performance of the retrieval algorithm over a much wider range of different forest sites. Reliable retrievals of forest understory appear to be feasible, while taking into account the limitations due to site heterogeneity, foliage cover, and input data quality.
3.3 Seasonal courses
Figure 6 offers the overview of the seasonal dynamics of understory for six select sites over the full latitudinal range (67–38∘ N) across Europe.
The Station for Measuring Ecosystem–Atmosphere Relations (SMEAR) in Värriö (FI-Var), located in northern Finland (67∘ 46′ N, 29∘ 35′ E), represents a subarctic climate regime near the northern timberline. This site experiences very rapid increases in NDVI values at the beginning of the growing season (Fig. 6a). This is linked with the disappearance of snow and the exposure of the underlying understory vegetation, which predominantly consists of moss and lichen. The overstory coverage by Scots pine trees is sparse, and the overall NDVI signal fluctuations during the year are governed by the understory layer. This site is also often covered with clouds, which prevents the acquisition of large number of good quality MODIS observations. However, in situ understory NDVI measurements fall within the predicted NDVI range when the MODIS data were acquired early in the growing season (day of year (DOY) 165), even despite the lower quality of the MODIS data (QA =1). No MODIS observations can be made of this site after DOY 259, due to an insufficient amount of light.
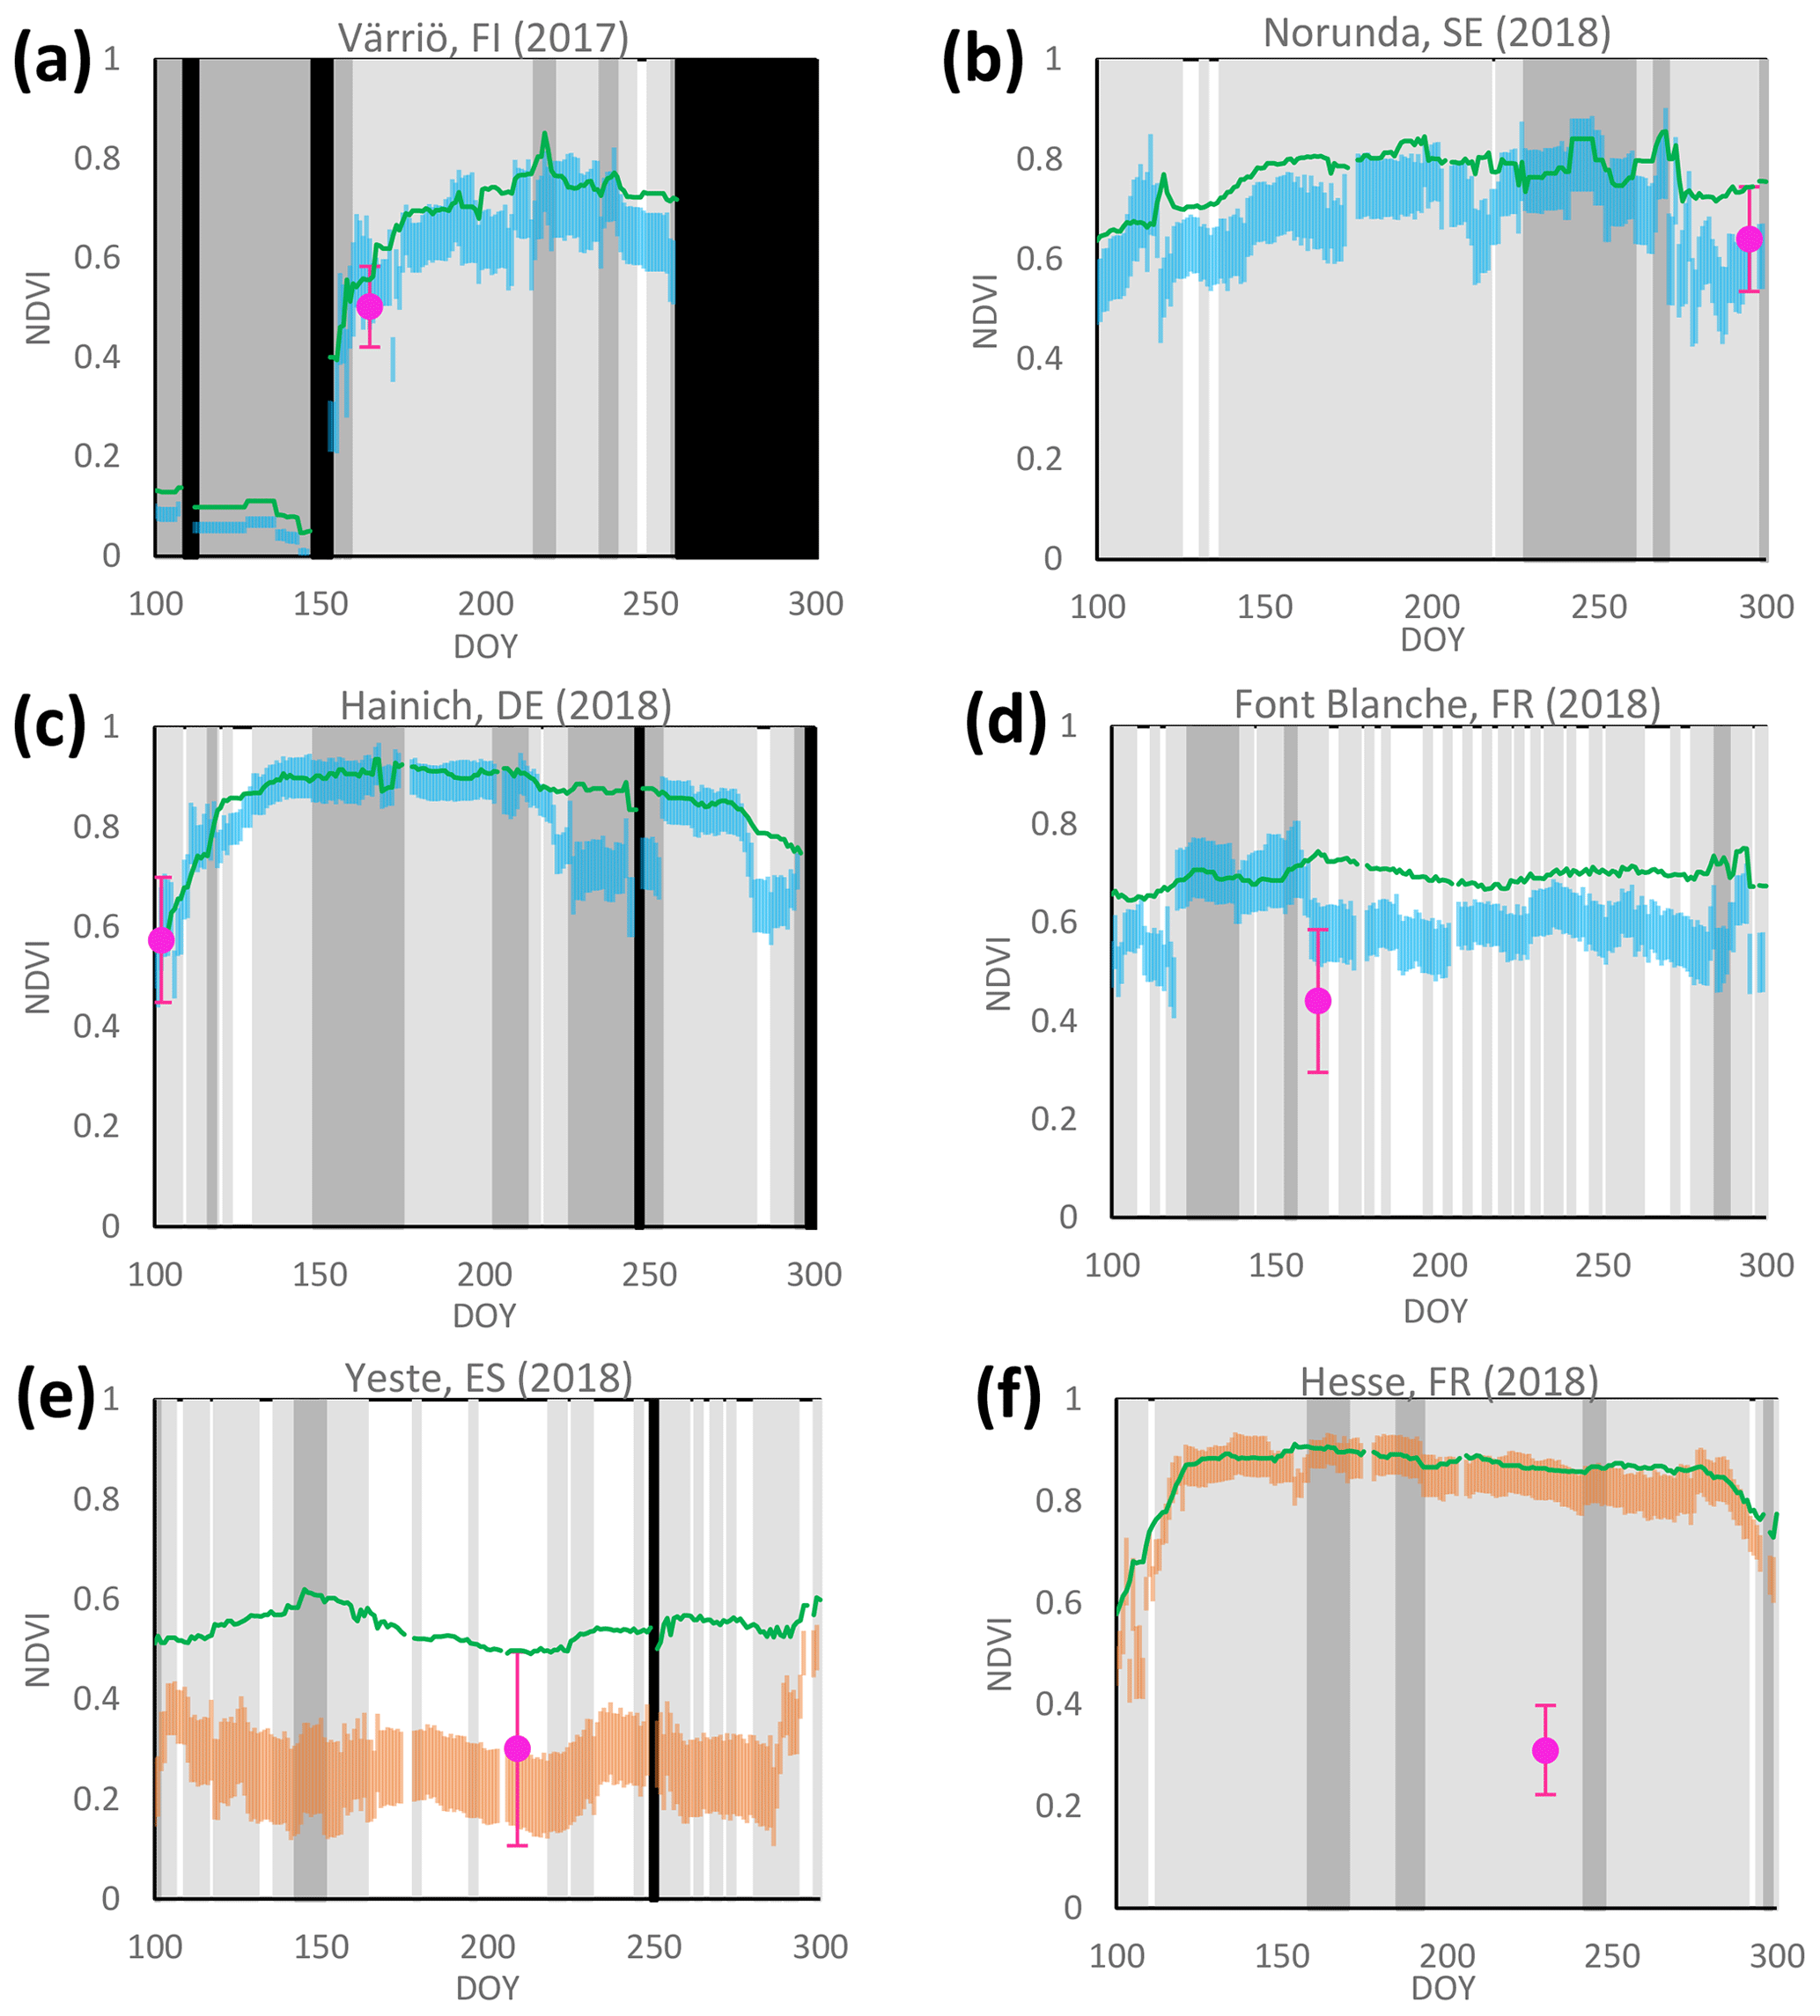
Figure 6Seasonal courses of estimated understory NDVI (NDVIu) ranges (blue bars – site-representative retrievals; orange bars – possible non-site-representative retrievals), nadir total (understory and overstory) NDVI values from MODIS BRDF/albedo data (green lines), and in situ measurements (mean ±1 SD shown in purple) over selected study sites. Gray bars mark MODIS BRDF parameters with lower quality flags (light gray – QA = 1; dark gray – QA >1). Black bars indicate where no data are available.

Figure 7Foliage stratification between overstory and understory bushes at the ICOS site of Font Blanche in southeastern France. Please note that the understory in situ measurements reported in Fig. 6 did not include the tall (h>2 m) bushes located under the Pinus-halepensis-dominated overstory.
The forest floor is mainly covered by moss at Norunda (SE-Nor) as well. While understory NDVI values reach similar values in summer at both sites (Fig. 6a–b), the snow disappears earlier at Norunda, which results in an earlier onset of higher understory NDVI values. In situ measurements fit very well within the predicted range with MODIS data on DOY 295. While Värriö has a higher tree density (748 trees ha−1) than Norunda (600 trees ha−1), Norunda, dominated with Norway spruce trees, has much higher foliage cover (FC; FC =0.5 at Norunda compared to FC =0.21 at Värriö). The understory signal contribution is smaller, and the total NDVI is higher at Norunda. The Norunda site provides yet another excellent demonstration of the influence of MODIS data quality on the understory NDVI retrievals as well. There was a repeated unrealistic fluctuation of understory NDVI values with the period of DOY 229–260 (Fig. 6b). The MODIS BRDF data during that period were marked with lower data quality flags (QA >1).
Very good agreement is observed among in situ measurements, understory, and total NDVI signal from MODIS (Fig. 6c) at Hainich (DE-Hai) at the beginning of the growing season (DOY = 102). The site is dominated by deciduous beech trees, which were leafless when the in situ measurements were taken. This allowed a full exposure of the understory, which dominated the total reflectance signal from the stand during that moment in the season. The understory coverage was a mixture of litter and sprouting green understory. Later on, the Hainich test site quickly develops an overstory layer with LAI values reaching up to 5 (Pinty et al., 2011). Such a dense layer would prevent the retrieval of true understory signal with our methodology. This is confirmed by the unrealistic, very close agreement between the very high NDVI values (NDVI ∼0.9) obtained from the total and understory signal at the Hainich test site during the peak of growing season (Fig. 6c). However, this shortcoming would be mitigated by the fact that, in such cases, the understory may be negligible in terms of LAI and overall contribution to the total signal.
A clear difference can be observed between the total and understory NDVI values at Font Blanche (FR-FBn) for most of the growing season (Fig. 6d). The site is composed of an overstory top stratum (13 m) dominated by Aleppo pines (Pinus halepensis Mill), an intermediate stratum (6 m) dominated by holm oaks (Quercus ilex L.), and a shrub stratum (Simioni et al., 2020). Rainfall occurs mainly during autumn and winter, with about 75 % falling between September and April. The higher NDVIu values derived from the MODIS BRDF data during the period DOY 120–160 may be treated with caution due to the more frequent flagging of the MODIS inputs with lower data quality flags (Fig. 6d). Even lower understory NDVI values (NDVIu range – 0.15–0.35) occur at another site with a Mediterranean-type climate, namely Yeste in Spain (Fig. 6e). The seasonal course of NDVI values here, with a low variation, is quite similar to Font Blanche. The increase in understory NDVI values in the autumn from DOY 288 is linked with the onset of the rainfall period.
As illustrated above, given the high quality of MODIS BRDF data, the understory signal retrieval method performs well with forests with an open canopy. However, it is not quite possible to separate the understory signal in closed canopies. There is an obvious disagreement between available in situ measurements and the predicted understory NDVI range at Hesse (FR-Hes; Fig. 6f), which could be only partly explained by the insufficient spatial homogeneity of the site at the MODIS pixel footprint (Table 2). Hesse has a high foliage cover (FC = 0.98), LAI up to 7, and tall trees (h>23 m). The understory would then have a negligible influence on the top-of-canopy signal. The visibility and contribution of the understory signal also diminishes even further at off-nadir viewing directions (Rautiainen et al., 2008). Figure 6f confirms that, in such situations, the retrieval method cannot provide a correct, independent estimation of the understory signal. At the same time, it should be noted that, for closed canopies, the understory signal (or lack of information about it) is not critical for the retrieval of biophysical properties of prime interest, i.e. LAI and fAPAR of the upper forest canopy layer with remote sensing (Garrigues et al., 2008; Weiss et al., 2014).
We report on the performance of a physically based approach for estimating understory NDVI from daily MODIS BRDF/albedo data, at a 500 m gridded spatial resolution, over the extended network of the Integrated Carbon Observing System (ICOS) forest ecosystem sites, distributed along wide latitudinal and elevational ranges (68–38∘ N, 12–1864 m above sea level – a.s.l.) across Europe. The analysis corresponds to a Stage 1 validation, as defined by the CEOS (Nightingale et al., 2011; Weiss et al., 2014). The method can deliver reasonable retrievals over different forest types with canopies that have a foliage cover that does not exceed 85 %. The performance of the method was found to be limited over forests with closed canopies (high foliage cover), where the signal from understory is much attenuated. Our results illustrate the importance of considering both the spatial heterogeneity of the field site and the limitations and documented quality of the MODIS BRDF product. The results from the in situ measurements of the understory layer can be valuable, in and of themselves, as sources of information over the wide array of forest understory conditions contained within the tower footprints of individual ICOS forest ecosystem sites and serve as an input for the improved modeling of local carbon and energy fluxes.
The in situ data set is available from https://data.mendeley.com/datasets/m97y3kbvt8/1 (Pisek, 2021, last access: 25 January 2021). The MCD43A1 V6 bidirectional reflectance distribution function and albedo (BRDF/albedo) data product (https://lpdaac.usgs.gov/products/mcd43a1v006/, Schaaf and Wang, 2021a, Land Processes Distributed Active Archive Center – LP DAAC; last access: 25 January 2021) and the associated data quality (MCD43A2) product (https://lpdaac.usgs.gov/products/mcd43a2v006/, Schaaf and Wang, 2021b, LP DAAC, last access: 25 January 2021) were acquired through the Google Earth Engine platform.
JP conceived the project, collected data, ran the data analysis and interpretation, and led the writing of paper. AE and CS carried out the spatial representativeness analysis. LK analyzed the forest canopy cover/closure analysis. NH helped with the field collection at Hohes Holz. PL helped with the field collection at Bílý Kříž. JP wrote the original draft, which was reviewed and edited by TB, AC, EC, MC, AE, SF, GG, TG, MH, NH, AI, AK, JK, BK, HL, LL, J-ML, FRLS, DL, PL, LL, RM, MM, LM, JN, MP, CR, ER, MS-R, CS, MS, GS, KS, and CV. (Authors after LK are listed in alphabetic order.)
The authors declare that they have no conflict of interest.
This study was supported by the Estonian Research Council (grant no. PUT1355) and the Mobilitas Pluss MOBERC11 program. This research (field campaigns at Brasschaat, Kindla, Zoebelboden, and Machuqueira do Grou/LTsER Montado platform) was cofunded by the Transnational Access scheme of eLTER (Horizon 2020 project; grant no. 654359). We acknowledge ICOS Sweden, cofunded by the Swedish Research Council (SRC; grant no. 2015-06020), for providing measurement facilities and experimental support. The MODIS BRDF data are supported by NASA (grant no. 80NSSC18K0642). We thank the anonymous reviewer and Alexei Lyapustin for the constructive comments that helped to improve the paper.
This research has been supported by the Eesti Teadusagentuur (grant nos. PUT1355 and Mobilitas Pluss MOBERC11), Horizon 2020 (grant no. eLTER 654359), the Swedish Research Council (grant no. 2015-06020), and NASA (grant no. 80NSSC18K0642).
This paper was edited by Paul Stoy and reviewed by Alexei Lyapustin and one anonymous referee.
Bacour, C. and Bréon, F. M.: Variability of biome reflectance directional signatures as seen by POLDER, Remote Sens. Environ., 98, 80–95, 2005.
Baret, F., Morisette, J. T., Fernandes, R. A., Champeaux, J. L., Myneni, R. B., Chen, J., Plummer, S., Weiss, M., Bacour, C., Garrigues, S., and Nickeson, J. E.: Evaluation of the representativeness of networks of sites for the global validation and intercomparison of land biophysical products: Proposition of the CEOSBELMANIP, IEEE T. Geosci. Remote Sens., 44, 1794–1803, 2006.
Campagnolo, M. L., Sun, Q., Liu, Y., Schaaf, C., Wang, Z., and Román, M. O.: Estimating the effective spatial resolution of the operational BRDF, albedo, andnadir reflectance products from MODIS and VIIRS, Remote Sens. Environ., 175, 52–64, https://doi.org/10.1016/j.rse.2015.12.033, 2016.
Canisius, F. and Chen, J. M.: Retrieving forest background reflectance in a boreal region from Multi-angle Imaging SpectroRadiometer (MISR) data, Remote Sens. Environ., 107, 312–321, 2007.
Chen, J. M., Li, X., Nilson, T., and Strahler, A.: Recent advances in geometrical optical modeling and its applications, Remote Sens. Rev., 18, 227–262, 2000.
Chopping, M., Moisen, G. G., Su, L. H., Laliberte, A., Rango, A., Martonchik, J. V., and Peters, D. P. C.: Large area mapping of southwestern crown cover, canopy height, and biomass using the NASA Multiangle Imaging Spectro-Radiometer, Remote Sens. Environ., 112, 2051–2063, 2008.
Clark, D. A., Brown, S., Kicklighter, D. W., Chambers, J. Q., Thomlinson, J. R., and Ni, J.: Measuring net primary production in forests: concepts and field methods, Ecol. Appl., 11, 356–370, 2001.
Crowther, T. W., Glick, H. B., Covey, K. R., Bettigole, C., Maynard, D. S., Thomas, S. M., Smith, J. R., Hintler, G., Duguid, M. C., Amatulli, G., Tuanmu, M. N., Jetz, W., Salas, C., Stam, C., Piotto, D., Tavani, R., Green, S., Bruce, G., Williams, S. J., Wiser, S. K., Huber, M. O., Hengeveld, G. M., Nabuurs, G. J., Tikhonova, E., Borchardt, P., Li, C. F., Powrie, L. W., Fischer, M., Hemp, A., Homeier, J., Cho, P., Vibrans, A. C., Umunay, P.M., Piao, S. L., Rowe, C. W., Ashton, M. S., Crane, P. R., and Bradford, M. A.: Mapping tree density at a global scale, Nature, 525, 201–205, 2015.
Deering, D. W., Eck, T. F., and Banerjee, B.: Characterization of the reflectance anisotropy of three boreal forest canopies in spring–summer, Remote Sens. Environ., 67, 205–229, 1999.
Garrigues, S., Lacaze, R., Baret, F., Morisette, J. T., Weiss, M., Nickeson, J. E., Fernandes, R., Plummer, S., Shabanov, N. V., Myneni, R. B., Knyazikhin, Y., and Yang, W.: Validation and intercomparison of global leaf area index products derived from remote sensing data, J. Geophys. Res., 113, G02028, https://doi.org/10.1029/2007JG000635, 2008.
Gemmell, F.: Testing the utility of multi-angle spectral data for reducing the effects of background spectral variations in forest reflectance model inversion, Remote Sens. Environ., 72, 46–63, 2000.
Gielen, B., de Beeck, M. O., Loustau, D., Ceulemans, R., Jordan, A., and Papale, D.: Integrated Carbon Observation System (ICOS): An Infrastructure to Monitor the European Greenhouse Gas Balance, in: Terrestrial Ecosystem Research Infrastructures: Challenges and Opportunities, CRC press, Boca Raton, FL, USA, 505–520, 2017.
Gonzalez, R. C. and Woods, R. E.: Digital Image Processing, 2nd Edn., Prentice Hall, Upper Saddle River (NJ), 793 pp., 2002.
Gorelick, N., Hancher, M., Dixon, M., Ilyushchenko, S., Thau, D., and Moore, R.: Google earth engine: planetary-scale geospatial analysis for everyone, Remote Sens. Environ., 202, 18–27, 2017.
Gschwantner, T., Schadauer, K., Vidal, C., Lanz, A., Tomppo, E., di Cosmo, L., Robert, N., Englert Duursma, D., and Lawrence, M.: Common tree definitions for national forest inventories in Europe, Silva Fennica, 43, 303–321, 2009.
Jiao, T., Liu, R., Liu, Y., Pisek, J., and Chen, J. M.: Mapping global seasonal forest background reflectivity with Multi-angle Imaging Spectroradiometer data, J. Geophys. Res.-Biogeo., 119, 1063–1077, 2014.
Kim, D., Oren, R., and Qian, S. S.: Response to CO2 enrichment of understory vegetation in the shade of forests, Glob. Change Biol., 22, 944–956, https://doi.org/10.1111/gcb.13126, 2016.
Korhonen, L. and Heikkinen, J.: Automated analysis of in situ canopy images for the estimation of forest canopy cover, Forest Sci., 55, 323–334, 2009.
Kuusk, A., Lang, M., and Kuusk, J.: Database of optical and structural data for the validation of forest radiative transfer models, in: Radiative transfer and optical properties of atmosphere and underlying surface, edited by: Kokhanovsky, A. A., Light Scattering Reviews, Berlin, Germany, Springer, Vol. 7, 109–148, 2013.
Kuusk, A., Kuusk, J., and Lang, M.: Measured spectral bidirectional reflection properties of three mature hemiboreal forests, Agr. Forest Meteorol., 185, 14–19, 2014.
Law, B. E., Van Tuyl, S., Cescatti, A., and Baldocchi, D. D.: Estimation of leaf area index in open-canopy ponderosa pine forests at different successional stages and management regimes in Oregon., Agr. Forest Meteorol., 108, 1–14, 2001.
Li, X. and Strahler, A.: Geometric-optical modelling of a conifer forest canopy, IEEE T.n Geosci. Remote Sens., 23, 207–221, 1985.
Lucht, W., Schaaf, C. B., and Strahler, A. H.: An Algorithm for the retrieval of albedo from space using semiempirical BRDF models, IEEE T. Geosci. Remote Sens., 38, 977–998, 2000.
Luyssaert, S. , Inglima, I., Jung, M., Richardson, A. D., Reichstein, M., Papale, D., Piao, S. L., Schulze, E. D., Wingate, L., Matteucci, G., Aragao, L., Aubinet, M., Beer, C., Bernhofer, C., Black, K. G., Bonal, D., Bonnefond, J.M., Chambers, J., Ciais, P., Cook, B., Davis, K. J., Dolman, A.J., Gielen, B., Goulden, M., Grace, J., Granier, A., Grelle, A., Griffis, T., Gruenwald, T., Guidolotti, G., Hanson, P. J., Harding, R., Hollinger, D. Y., Hutyra, L. R., Kolari, P., Kruijt, B., Kutsch, W., Lagergren, F., and Laurila, T.: CO2 balance of boreal, temperate, and tropical forests derived from a global database, Glob. Change Biol., 13, 2509–2537, 2007.
Macfarlane, C., Hoffman, M., Eamus, D., Kerp, N., Higginson, S., McMurtrie, R., and Adams, M.: Estimation of leaf area index in eucalypt forest using digital photography, Agr. Forest Meteorol., 143, 176–188, 2007.
Marques, M. C. M. and Oliveira, P. E. A. M.: Phenology of canopy and understory species of two Coastal Plain Forests in Southern Brazil, Braz. J. Bot., 27, 713–723, https://doi.org/10.1590/s0100-84042004000400011, 2004.
McDonald, A. J., Gemmell, F. M., and Lewis, P. E.: Investigation of the utility of spectral vegetation indices for determining information on coniferous forests, Remote Sens. Environ., 66, 250–272, 1998.
Miller, J., White, P., Chen, J., Peddle, D., McDemid, G., Fournier, R., Sheperd, P., Rubinstein, I., Freemantle, J., Soffer, R., and LeDrew, E.: Seasonal change in the understory reflectance of boreal forests and influence on canopy vegetation indices, J. Geophys. Res., 102, 29475–29482, https://doi.org/10.1029/97JD02558, 1997.
Nightingale, J., Schaepman-Strub, G., Nickeson, J., and Leads, L. F. A.: Assessing satellite-derived land product quality for earth system science applications: overview of the CEOS LPV sub-group, in: Proceedings of the 34th International Symposium on Remote Sensing of Environment, Sydney, NSW, Australia, 10–15 April 2011.
Nobis, M. and Hunziker, U.: Automatic thresholding for hemispherical canopy-photographs based on edge detection, Agr. Forest Meteorol., 128, 243–250, https://doi.org/10.1016/j.agrformet.2004.10.002, 2005.
Peltoniemi, J. I., Kaasalainen, S., Näränen, J., Rautiainen, M., Stenberg, P., Smolander, H., Smolander, S., and Voipio, O.: BRDF measurement of understory vegetation in pine forests: Dwarf shrubs, lichen and moss, Remote Sens. Environ., 94, 343–354, 2005.
Pinty, B., Jung, M., Kaminski, T., Lavergne, T., Mund, M., Plummer, S., Thomas, E., and Widlowski, J.-L.: Evaluation of the JRC-TIP 0.01∘ products over a mid-latitude deciduous forest site, Remote Sens. Environ., 115, 3567–3581, 2011.
Pisek, J.: Dataset of understory reflectance measurements across 40 ICOS Research Infrastructure and other forest ecosystem sites in Europe, Mendeley Data, V1, https://doi.org/10.17632/m97y3kbvt8.1, 2021.
Pisek, J. and Chen, J. M.: Mapping forest background reflectivity over North America with multi-angle imaging spectroradiometer (MISR) data, Remote Sens. Environ., 113, 2412–2423, 2009.
Pisek, J., Chen, J. M., Miller, J. R., Freemantle, J. R., Peltoniemi, J. I., and Simic, A.: Mapping forest background reflectance in a boreal region using multi-angle Compact Airborne Spectrographic Imager (CASI) data, IEEE T. Geosci. Remote Sens., 48, 499–510, 2010.
Pisek, J., Rautiainen, M., Heiskanen, J., and Mõttus, M.: Retrieval of seasonal dynamics of forest understory reflectance in a Northern European boreal forest from MODIS BRDF data, Remote Sens. Environ., 117, 464–468, 2012.
Pisek, J., Lang, M., and Kuusk, J.: A note on suitable viewing configuration for retrieval of forest understory reflectance from multi-angle remote sensing data, Remote Sens. Environ., 156, 242–246, 2015a.
Pisek, J., Rautiainen, M., Nikopensius, M., and Raabe K.: Estimation of seasonal dynamics of understory NDVI in northern forests using MODIS BRDF data: Semi-empirical versus physically-based approach, Remote Sens. Environ., 163, 42–47, 2015b.
Pisek, J., Chen, J. M., Kobayashi, H., Rautiainen, M., Schaepman, M. E., Karnieli, A., Sprintsin, M., Ryu, Y., Nikopensius, M., and Raabe, K.: Retrieval of seasonal dynamics of forest understory reflectance from semiarid to boreal forests using MODIS BRDF data, J. Geophys. Res.-Biogeo., 121, 855–863, 2016.
Rautiainen, M., Lang, M., Mõttus, M., Kuusk, A., Nilson, T., Kuusk, J., and Lükk, T.: Multi-angular reflectance properties of a hemiboreal forest: an analysis using CHRIS PROBA data, Remote Sens. Environ., 112, 2627–2642, 2008.
Rautiainen, M., Mõttus, M., Heiskanen, J., Akujärvi, A., Majasalmi, T., and Stenberg, P.: Seasonal reflectance dynamics of common understory types in a northern European boreal forest, Remote Sens. Environ., 115, 3020–3028, 2011.
Rentch, J. S., Fajvan, M. A., and Hicks, R. R.: Oak establishment and canopy accession strategies in five old-growth stands in the central hardwood forest region, Forest Ecol. Manage., 184, 285–297, https://doi.org/10.1016/s0378-1127(03)00155-5, 2003.
Román, M. O., Schaaf, C. B., Woodcock, C. E., Strahler, A. H., Yang, X., Braswell, R. H.,Curtis, P. S., Davis, K. J., Dragoni, D., and Goulden, M. L.: The MODIS (CollectionV005) BRDF/albedo product: assessment of spatial representativeness overforested landscapes, Remote Sens. Environ., 113, 2476–2498, https://doi.org/10.1016/j.rse.2009.07.009, 2009.
Roujean, J.-L., Leroy, M., and Deschamps, P. Y.: A bi-directional reflectance model of the Earth's surface for the correction of remote sensing data, J. Geophys. Res., 97, 20455–20468, https://doi.org/10.1029/92JD01411, 1992.
Rouse, W. J., Haas Jr., H. R., Schell, A. J., and Deering, W. D.: Monitoring vegetation systems in the Great Plains with ERTS, in Third ERTS Symposium, NASASP-351, Vol. 1, NASA, Washington, DC, 309–317, 1973.
Schaaf, C. and Wang, Z.: MCD43A1 MODIS/Terra+Aqua BRDF/Albedo Model Parameters Daily L3 Global – 500m V006, 2015, distributed by: NASA EOSDIS Land Processes DAAC, https://doi.org/10.5067/MODIS/MCD43A1.006, 2021a.
Schaaf, C. and Wang, Z.: MCD43A2 MODIS/Terra+Aqua BRDF/Albedo Quality Daily L3 Global – 500m V006, 2015, distributed by: NASA EOSDIS Land Processes DAAC, https://doi.org/10.5067/MODIS/MCD43A2.006, 2021b.
Schaaf, C. B., Gao, F., Strahler, A. H., Lucht, W., Li, X., and Tsang, T.: First operational BRDF albedo, nadir reflectance products from MODIS, Remote Sens. Environ., 83, 135–148, 2002.
Schaepman, M. E., Ustin, S. L., Plaza, A. J., Painter, T. H., Verrelst, J., and Liang, S.: Earth system science related imaging spectroscopy-An assessment, Remote Sens. Environ., 113, S123–S137, 2009.
Schaepman-Strub, G., Schaepman, M. E., Painter, T. H., Dangel, S., and Martonchik, J. V.: Reflectance quantities in optical remote sensing – Definitions and case studies, Remote Sens. Environ., 103, 27–42, 2006.
Simard, M., Pinto, N., Fisher, J. B., and Baccini, A.: Mapping forest canopy height globally with spaceborne lidar, J. Geophys. Res., 116, G04021, https://doi.org/10.1029/2011JG001708, 2011.
Simioni, G., Marie, G., Davi, H., Martin-St Paul, N., and Huc, R.: Natural forest dynamics have more influence than climate change on the net ecosystem production of a mixed Mediterranean forest, Ecol. Model., 416, 108921, https://doi.org/10.1016/j.ecolmodel.2019.108921, 2020.
Tucker, C. J.: Red and photographic infrared linear combinations for monitoring vegetation, Remote Sens. Environ., 8, 127–150, 1979.
Vogel, J. G. and Gower, S. T.: Carbon and nitrogen dynamics of boreal jack pine stands with and without a green alder understory, Ecosystems, 1, 386–400, https://doi.org/10.1007/s100219900032, 1998.
Wang, Z., Schaaf, C. B., Chopping, M. J., Strahler, A. H., Wang, J., Román, M. O., Rocha, A. V., Woodcock, C. E., and Shuai, Y.: Evaluation of Moderate-resolution Imaging Spectroradiometer (MODIS) snow albedo product (MCD43A) overtundra, Remote Sens. Environ., 117, 264–280, https://doi.org/10.1016/j.rse.2011.10.002, 2012.
Wang, Z., Schaaf, C. B., Strahler, A. H., Chopping, M. J., Román, M. O., Shuai, Y., Woodcock, C. E., Hollinger, D. Y., and Fitzjarrald, D. R.: Evaluation of MODISalbedo product (MCD43A) over grassland, agriculture and forest surface types during dormant and snow-covered periods, Remote Sens. Environ., 140, 60–77, https://doi.org/10.1016/j.rse.2013.08.025, 2014.
Wang, Z., Schaaf, C. B., Sun, Q., Kim, J., Erb, A. M., Gao, F., Román, M. O., Yang, Y., Petroy, S., and Taylor, J. R.: Monitoring land surface albedo and vegetation dynamics using high spatial and temporal resolution synthetic time series from Landsat and the MODIS BRDF/NBAR/albedo product, Int. J. Appl. Earth Obs. Geoinf., 59, 104–117, 2017.
Wang, Z., Schaaf, C. B., Sun, Q., Shuai, Y., and Román, M. O.: Capturing Rapid Land Surface Dynamics with Collection V006 MODIS BRDF/NBAR/Albedo (MCD43) Products, Remote Sens. Environ., 207, 50–64, 2018.
Weiss, M., Baret, F., Block, T., Koetz, B., Burini, A., Scholze, B., Lecharpentier, P., Brockmann, C., Fernandes, R., Plummer, S., Myneni, R., Gobron, N., Nightingale, J., Schaepman-Strub, G., Camacho, F., and Sanchez-Azofeifa, A.: On line validation exercise (OLIVE): A web based service for the validation of medium resolution land products, Application to FAPAR products, Remote Sens., 6, 4190–4216, 2014.
White, H. P.: Investigations of boreal forest bidirectional reflectance factor (BRF), PhD. thesis, York University, Toronto, Ontario, Canada, 328 pp., 1999.