the Creative Commons Attribution 4.0 License.
the Creative Commons Attribution 4.0 License.
 | 27 Jul 2022
Interannual variabilities, long-term trends, and regulating factors of low-oxygen conditions in the coastal waters off Hong Kong
Zheng Chen
Chuang Xu
Zhongren Zhang
Shiyu Li
Jiatang Hu
The summertime low-oxygen conditions in the Pearl River Estuary (PRE) have experienced a significant spatial expansion associated with notable deoxygenation in recent decades. Nevertheless, there is still a lack of quantitative data on the long-term trends and interannual variabilities in oxygen conditions in the PRE as well as on the driving factors. Therefore, the long-term deoxygenation in a subregion of the PRE (the coastal waters off Hong Kong) was comprehensively investigated in this study using monthly observations during 1994–2018. To evaluate the changes in scope and intensity of oxygen conditions, an indicator (defined as the low-oxygen index, LOI) that integrates several metrics related to low-oxygen conditions was introduced as the result of a principal component analysis (PCA). Moreover, primary physical and biogeochemical factors controlling the interannual variabilities and long-term trends in oxygen conditions were discerned, and their relative contributions were quantified by multiple regression analysis. Results showed that the regression models explained over 60 % of the interannual variations in LOI. Both the wind speeds and concentrations of dissolved inorganic nitrogen (DIN) played a significant role in determining the interannual variations (by 39 % and 49 %, respectively) and long-term trends (by 39 % and 56 %, respectively) in LOI. Due to the increasing nutrient loads and alterations in physical conditions (e.g., the long-term decreasing trend in wind speeds), coastal eutrophication was exaggerated and massive marine-sourced organic matter was subsequently produced, thereby resulting in an expansion of intensified low-oxygen conditions. The deteriorating eutrophication has also driven a shift in the dominant source of organic matter from terrestrial inputs to in situ primary production, which has probably led to an earlier onset of hypoxia in summer. In summary, the Hong Kong waters have undergone considerable deterioration of low-oxygen conditions driven by substantial changes in anthropogenic eutrophication and external physical factors.
- Article
(12120 KB) - Full-text XML
- BibTeX
- EndNote


Dissolved oxygen (DO) plays a vital role in maintaining the good functioning of aquatic ecosystems. Hypoxia (DO < 2 mg L−1) could lead to a marked reduction in habitat for aquatic organisms (Ludsin et al., 2009) and imposes detrimental effects on the ecosystem community structure and energy flow (Diaz and Rosenberg, 2008). In recent decades, long-term exacerbation of hypoxia in terms of its spatial extent and intensity has been documented in estuaries and coastal waters worldwide, including the Baltic Sea (Conley et al., 2011; Meier et al., 2019), the northern Gulf of Mexico (Obenour et al., 2013; Laurent and Fennel, 2019), Chesapeake Bay (Li et al., 2016; Ni et al., 2020), the Yangtze River Estuary (Zhu et al., 2011; Zhang et al., 2021), and the Pearl River Estuary (Li et al., 2020; Hu et al., 2021). In addition, changes in the phenology of hypoxia were also reported. For example, in Chesapeake Bay, hypoxic volume has shown a significant increase in early summer but a slight decrease in late summer since 1985 (Murphy et al., 2011; Testa et al., 2018). Zhou et al. (2014) also found that the timing of maximum hypoxic volume in Chesapeake Bay was advanced from late July to early July during 1985–2010.
A great number of studies have indicated that the exacerbation of hypoxia in coastal systems was closely related to human activities, such as urbanization and industrialization (Breitburg et al., 2018). Due to the anthropogenic influence, massive organic matter and nutrients were discharged into estuaries and coastal waters. Terrestrial organic matter could lead to intense microbial respiration (Rabalais et al., 2010) and excessive nutrient inputs could further stimulate the growth of phytoplankton and exacerbate eutrophication, with a dramatic increase in oxygen demand from marine-sourced organic matter (Fennel and Testa, 2018). Moreover, physical processes such as stratification (Rabalais et al., 1991), convergence and migration of water masses (Li et al., 2021), and upwelling (Feng et al., 2014) could regulate the spatial extent and intensity of hypoxia as well. These processes are closely linked to wind forcing and freshwater discharge (Feng et al., 2012; Yu et al., 2015). In general, the physical and biogeochemical processes exert joint impacts on the generation and development of hypoxia, but different mechanisms may predominate in different systems due to their distinctive natural conditions (e.g., topography) and pressure from anthropogenic pollution. Ni et al. (2020) quantified the contributions of estuary warming, sea level rise, and nutrient load reduction to the long-term changes in hypoxia in Chesapeake Bay through numerical simulation experiments, suggesting that warming was the dominant factor. Forrest et al. (2011) investigated the effects of various processes on the interannual variations of hypoxia in the northern Gulf of Mexico by statistical methods and pointed out that the east–west winds and nutrient loads each accounted for a considerable contribution. In the Yangtze River Estuary, studies showed that vertical density stratification, which was heavily influenced by a combination of freshwater inputs, various water masses, and winds, was the key factor controlling the interannual changes in hypoxia (Chi et al., 2020).
With the rapid socioeconomic development, the Pearl River Estuary (PRE) has received a large amount of pollutants and nutrients, resulting in a series of environmental problems, including eutrophication, red tide, and hypoxia (Dai et al., 2008; Li et al., 2020). Since the 1980s, low-oxygen (DO <4 mg L−1) and hypoxic conditions have been reported in the upper reach of Lingdingyang Bay (Li et al., 2020; Cui et al., 2018; Hu et al., 2021), Modaomen Bay, Huangmaohai Bay (Su et al., 2017; Shi et al., 2019; Wang et al., 2017; Zhang and Li, 2010), and coastal waters adjacent to Hong Kong (Yin et al., 2004; Su et al., 2017; Shi et al., 2019). Previous studies have shown that hypoxia in the PRE typically occurred in the bottom waters during summer (Yin et al., 2004), driven by strong stratification and sediment oxygen consumption (Zhang and Li, 2010; Wang et al., 2017). Due to relatively shallow topography, short water residence time (Rabouille et al., 2008), and short maintenance of stratification (Luo et al., 2009; Lu et al., 2018), hypoxia in the PRE appeared to be episodic and localized (Rabouille et al., 2008). However, this long-standing point of view has been challenged by recent observations showing the emergence of large low-oxygen and hypoxic extents. The area affected by low oxygen in the bottom waters of the PRE was estimated to be around 1000 km2 in 2010 (Wen et al., 2020) and ∼1500 km2 in 2015 (Li et al., 2018). With the increasing availability of observations, an apparent expansion of hypoxia with large interannual variations was revealed from data during the period 1976–2017 (Hu et al., 2021). Nevertheless, due to the scarcity of observations in both time and space and significant differences in sampling periods and locations (sometimes the water quality measurement methods as well) between available datasets, a clear understanding of the long-term trend and interannual changes in hypoxia in the PRE as well as the associated drivers is still lacking, especially from a quantitative perspective.
In this study, we utilize observational oxygen and related data collected by the Hong Kong Environmental Protection Department (HKEPD) at certain coastal sites off Hong Kong (see details in Sect. 2.1), which have significant merits in terms of temporal coverage (∼30 years) and consistency of sampling locations, in order to perform a quantitative analysis of the long-term oxygen changes (trend and interannual variability) in the region. Moreover, we also aim to discern the key factors controlling the interannual variability and long-term trends in the low-oxygen conditions and to quantify the relative contribution of each primary factor using multiple regression models (Murphy et al., 2011; Forrest et al., 2011; Wang et al., 2021). It is important to note that the HKEPD data with good spatiotemporal continuity allowed us to make a better estimation of the long-term deoxygenation in the coastal waters off Hong Kong, which was close to a hotspot area of low-oxygen conditions in the eastern PRE (Hu et al., 2021) and subject to frequent occurrences of low-oxygen and hypoxic events as well (Yin et al., 2004; Su et al., 2017; Shi et al., 2019). In addition, previous studies showed that the dominant deoxygenation mechanisms varied between subregions in the PRE; for instance, the low-oxygen conditions in Modaomen Bay were primarily determined by terrestrial pollutant inputs (Li et al., 2020; Wang et al., 2017, 2018), whereas those in the coastal waters off Hong Kong were largely controlled by the joint effect of physical processes (e.g., convergence of water masses; Li et al., 2021) and eutrophication (Qian et al., 2018). Therefore, the extensive investigation of deoxygenation performed here for the Hong Kong waters is a significant supplement to the understanding of low-oxygen conditions for the whole PRE.
2.1 Data sources
Monthly monitoring data from the HKEPD at 10 stations (Fig. 1) in the coastal waters off Hong Kong (113.8–114.5∘ E, 22.1–22.6∘ N) were chosen for formal analysis. Specifically, the data in use include vertical profiles of DO, temperature, salinity, dissolved inorganic nitrogen (DIN), and chlorophyll a (Chl a) concentrations measured in the water columns during 1994–2018 as well as total organic carbon (TOC) and total nitrogen (TN) measured in the sediments during 1998–2018. The survey stations can be divided into three subregions: (1) the northwestern subregion, including stations NM5 (with water depth of 20 m), NM6 (5 m), and NM8 (8 m); (2) the southern subregion, including stations SM20 (7 m), SM17 (12 m), SM18 (21 m), and SM19 (24 m); and (3) the eastern subregion, including stations MM8 (31 m), MM13 (28 m), and MM14 (25 m). Water samples were collected from the surface (1 m b.s.f.), middle (half of the depth at each station), and bottom (1 m above the sediments) layers, respectively. Details on the sampling procedures and measurements were described by Xu et al. (2010).

Figure 1(a) Map of the Pearl River Estuary (PRE) and monitoring stations in the coastal waters off Hong Kong. Note that the blue, red, green dots represent stations in the northwestern, southern, eastern subregions of Hong Kong, respectively. The red triangle denotes the location of the automatic weather station on Waglan Island and the purple dots indicate the location of cities in the Guangdong–Hong Kong–Macao Greater Bay Area. (b) Four subgraphs showing the vertical distributions of mean DO concentrations in winter (December, January, February), spring (March, April, May), summer (June, July, August) and autumn (September, October, November) during 1994–2018.
In addition, the monthly data of wind speeds and directions used for analysis were estimated using the daily wind observations during 1994–2018 provided by the Waglan Island automatic weather station (Fig. 1) of the Hong Kong Observatory. It should be noted that the duration of southwestern winds was defined as the number of their occurrence in days during summer. As for the freshwater inputs from the Pearl River, the monthly data during 1994–2018 were calculated using the discharge data obtained from three major hydrological stations (i.e., Gaoyao, Shijiao, and Boluo) of the Pearl River Water Resources Commission of the Ministry of Water Resources.
2.2 Statistical methods
Several metrics, including the cross-sectional area and the layer thickness of low oxygen (DO <4 mg L−1), oxygen deficiency (DO <3 mg L−1), and hypoxia (DO <2 mg L−1) as well as the mean and minimum DO concentrations in the bottom waters, were used to depict the oxygen conditions in the region. Firstly, the observed DO profiles were interpolated with the “natural neighbor” method through MATLAB along the three subregions with a grid resolution of 600 m (distance) × 0.3 m (depth). The total areas of DO below 4, 3, and 2 mg L−1 were then calculated as the cross-sectional areas of low oxygen, oxygen deficiency, and hypoxia, respectively. The associated layer thickness was defined as the averaged thickness of the grids with DO below the corresponding levels (i.e., 4, 3, and 2 mg L−1). Regarding the island between stations NM8 and SM20, the spatial interpolations were performed directly with all the observed data and then the areas covered by the island were masked out roughly based on its size (Figs. 2, 3, and A1 in the Appendix), as the topographic data of the island were not available. Such treatment has little influence on the estimation of vertical low-oxygen areas because low-oxygen conditions were seldom found in stations NM8 and SM20. Moreover, the same treatment procedure was applied to the data for each month over 25 years to generate an interpolation set for every month, making it consistent when investigating the interannual variations in low-oxygen conditions.

Figure 2Spatiotemporal distribution of temperature (a, b), salinity (c, d) in the surface and bottom waters, and vertical density differences (e) during 1994–2018. Note that the stations investigated are denoted by the black dots on the right of the figure. The blue triangles point to each month of December over 25 years, while the red ones point to July.
In order to investigate the main variation (interannual changes) of oxygen conditions, we have introduced an indicator integrating the above metrics (except the hypoxic area and thickness, Table A1) through the PCA (principal component analysis) technique, which can reduce the dimensionality of a dataset to make it more interpretable with minimum information loss (Cadima et al., 2016). The two metrics related to hypoxia were excluded from PCA because the occurrence of hypoxia was relatively rare and its interannual variation was not as significant as that of low oxygen and oxygen deficiency. The results of PCA analysis (Table A2) showed that the first component explained most of the variance (86.40 %) for the six input variables, while the remaining components explained less variance (13.60 %). The first component was highly correlated with the interannual variations of the cross-sectional areas (with a correlation coefficient r of 0.96, p<0.01) and the thickness (r=0.96, p<0.01) of low oxygen as well as the bottom DO concentrations (, p<0.01), and it was thereafter referred to as “low-oxygen index” (LOI, Eq. 1) to describe the interannual severity of low-oxygen conditions comprehensively.
where DOmean and DOmin represent the mean and the minimum DO concentrations in the bottom waters, respectively; Area4 (Area3) and Thickness4 (Thickness3) represent the cross-sectional area and the thickness of low oxygen (oxygen deficiency), respectively.
As the low-oxygen conditions within Hong Kong waters were jointly affected by physical and biogeochemical processes, we attempted to quantify the relative contributions of multiple relevant factors including wind, freshwater, water temperature, and nutrients to interannual variability and long-term trends of the oxygen conditions through multiple regression. As for the selection of the wind variable in use, the daily wind data were processed into monthly average wind speed (WS), southwestern wind duration (SWWD), southwestern wind cumulative stress (SWCS), and southeastern wind cumulative stress (SECS) in summer (June–August) to examine the effect of wind speed and direction (Fig. A2). Then, a suite of multiple regressions was carried out to fit the LOI for each wind-related variable. As shown in Table A3, the fitting effect of LOI was better when using WS, which also has the highest correlation with LOI among the wind-related variables, revealing that WS explained the highest interannual variation in LOI among the wind-related factors. Therefore, WS was eventually adopted to be the wind-related input variable in the multiple regression with freshwater discharge (flow), the monthly spatial average of bottom temperature (T), and surface DIN in the summer. The resulting regression coefficients were then standardized by multiplying the ratio between the standard deviation of each input variable (e.g., WS) and the standard deviation of LOI to evaluate their interannual contributions (Eq. 2).
where and Ci represent the regression coefficients of WS, flow, T, and DIN after and before standardization, respectively; SDi represents the standard deviation of WS, flow, T, and DIN; SDLOI represents the standard deviation of LOI.
In addition, the dataset was randomly split into a training dataset (70 %) and a testing dataset (30 %) in order to provide a more robust data fitting with estimates on the uncertainties arising from different data selections. Consequently, over 480 700 combinations of training and testing datasets were generated randomly from this splitting process and were used to build up a variety of regression models. Coefficient of determination (R2) was used to measure the fitting effect in training and testing datasets. Of all the established models, the fitting effect of training datasets (e.g., ) and coefficients of the four variables were similar, but the predictive skills in the testing dataset (e.g., ) varied over a large range (Fig. A3, Table A4). Besides, a larger standard deviation occurred in coefficients in cases with worse testing effects. To provide a more robust estimation for the fitting, only those with R2 over or equal to 0.6 both for the training and testing datasets were selected to quantify the impact of each input variable according to their regression coefficients on average (Fig. A4). Furthermore, based on the selected models (with R2≥ 0.6 for both datasets), we also set up four sensitive experiments in which the long-term trend of each input variable was removed and only interannual fluctuations were retained. The LOI was then re-calculated in each scenario and its change relative to the original LOI was used to assess the impact of each variable on the long-term oxygen trend.
3.1 Seasonal and interannual variabilities in water quality variables in the coastal waters off Hong Kong
3.1.1 Hydrological and eutrophication parameters
Significant seasonal variations could be found for the hydrological settings (Fig. 2). In winter (December–February), temperature generally exhibited low levels, with climatological mean values of 18.62 and 18.54 ∘C during 1994–2018 on the surface (Fig. 2a) and in the bottom waters (Fig. 2b), respectively; salinity reached high values due to the invasion of shelf saline waters, with means of 32.05 PSU on the surface (Fig. 2c) and 32.44 PSU at the bottom (Fig. 2d). Small differences of temperature and salinity between the surface and the bottom layers in winter indicated that the water column was well mixed (with mean vertical density differences of 0.33 kg m−3; Fig. 2e). By comparison, temperature and salinity in summer (June–August) showed larger vertical gradients and interannual variability. The summertime temperature fluctuated between 28.21 ± 1.19 ∘C (i.e., climatological mean ± 1 SD) on the surface, which was markedly higher than that at the bottom (24.93 ± 2.14 ∘C). Being affected by massive freshwater inputs from the Pearl River, salinity in summer was much lower than that in winter and displayed pronounced vertical differences with 22.86 ± 7.53 PSU on the surface and 30.90 ± 5.26 PSU at the bottom, respectively. Consequently, strong water stratification prevailed in summer, where the vertical density differences (Δρ) fluctuated at 7.26 ± 4.54 kg m−3 (Fig. 2e).
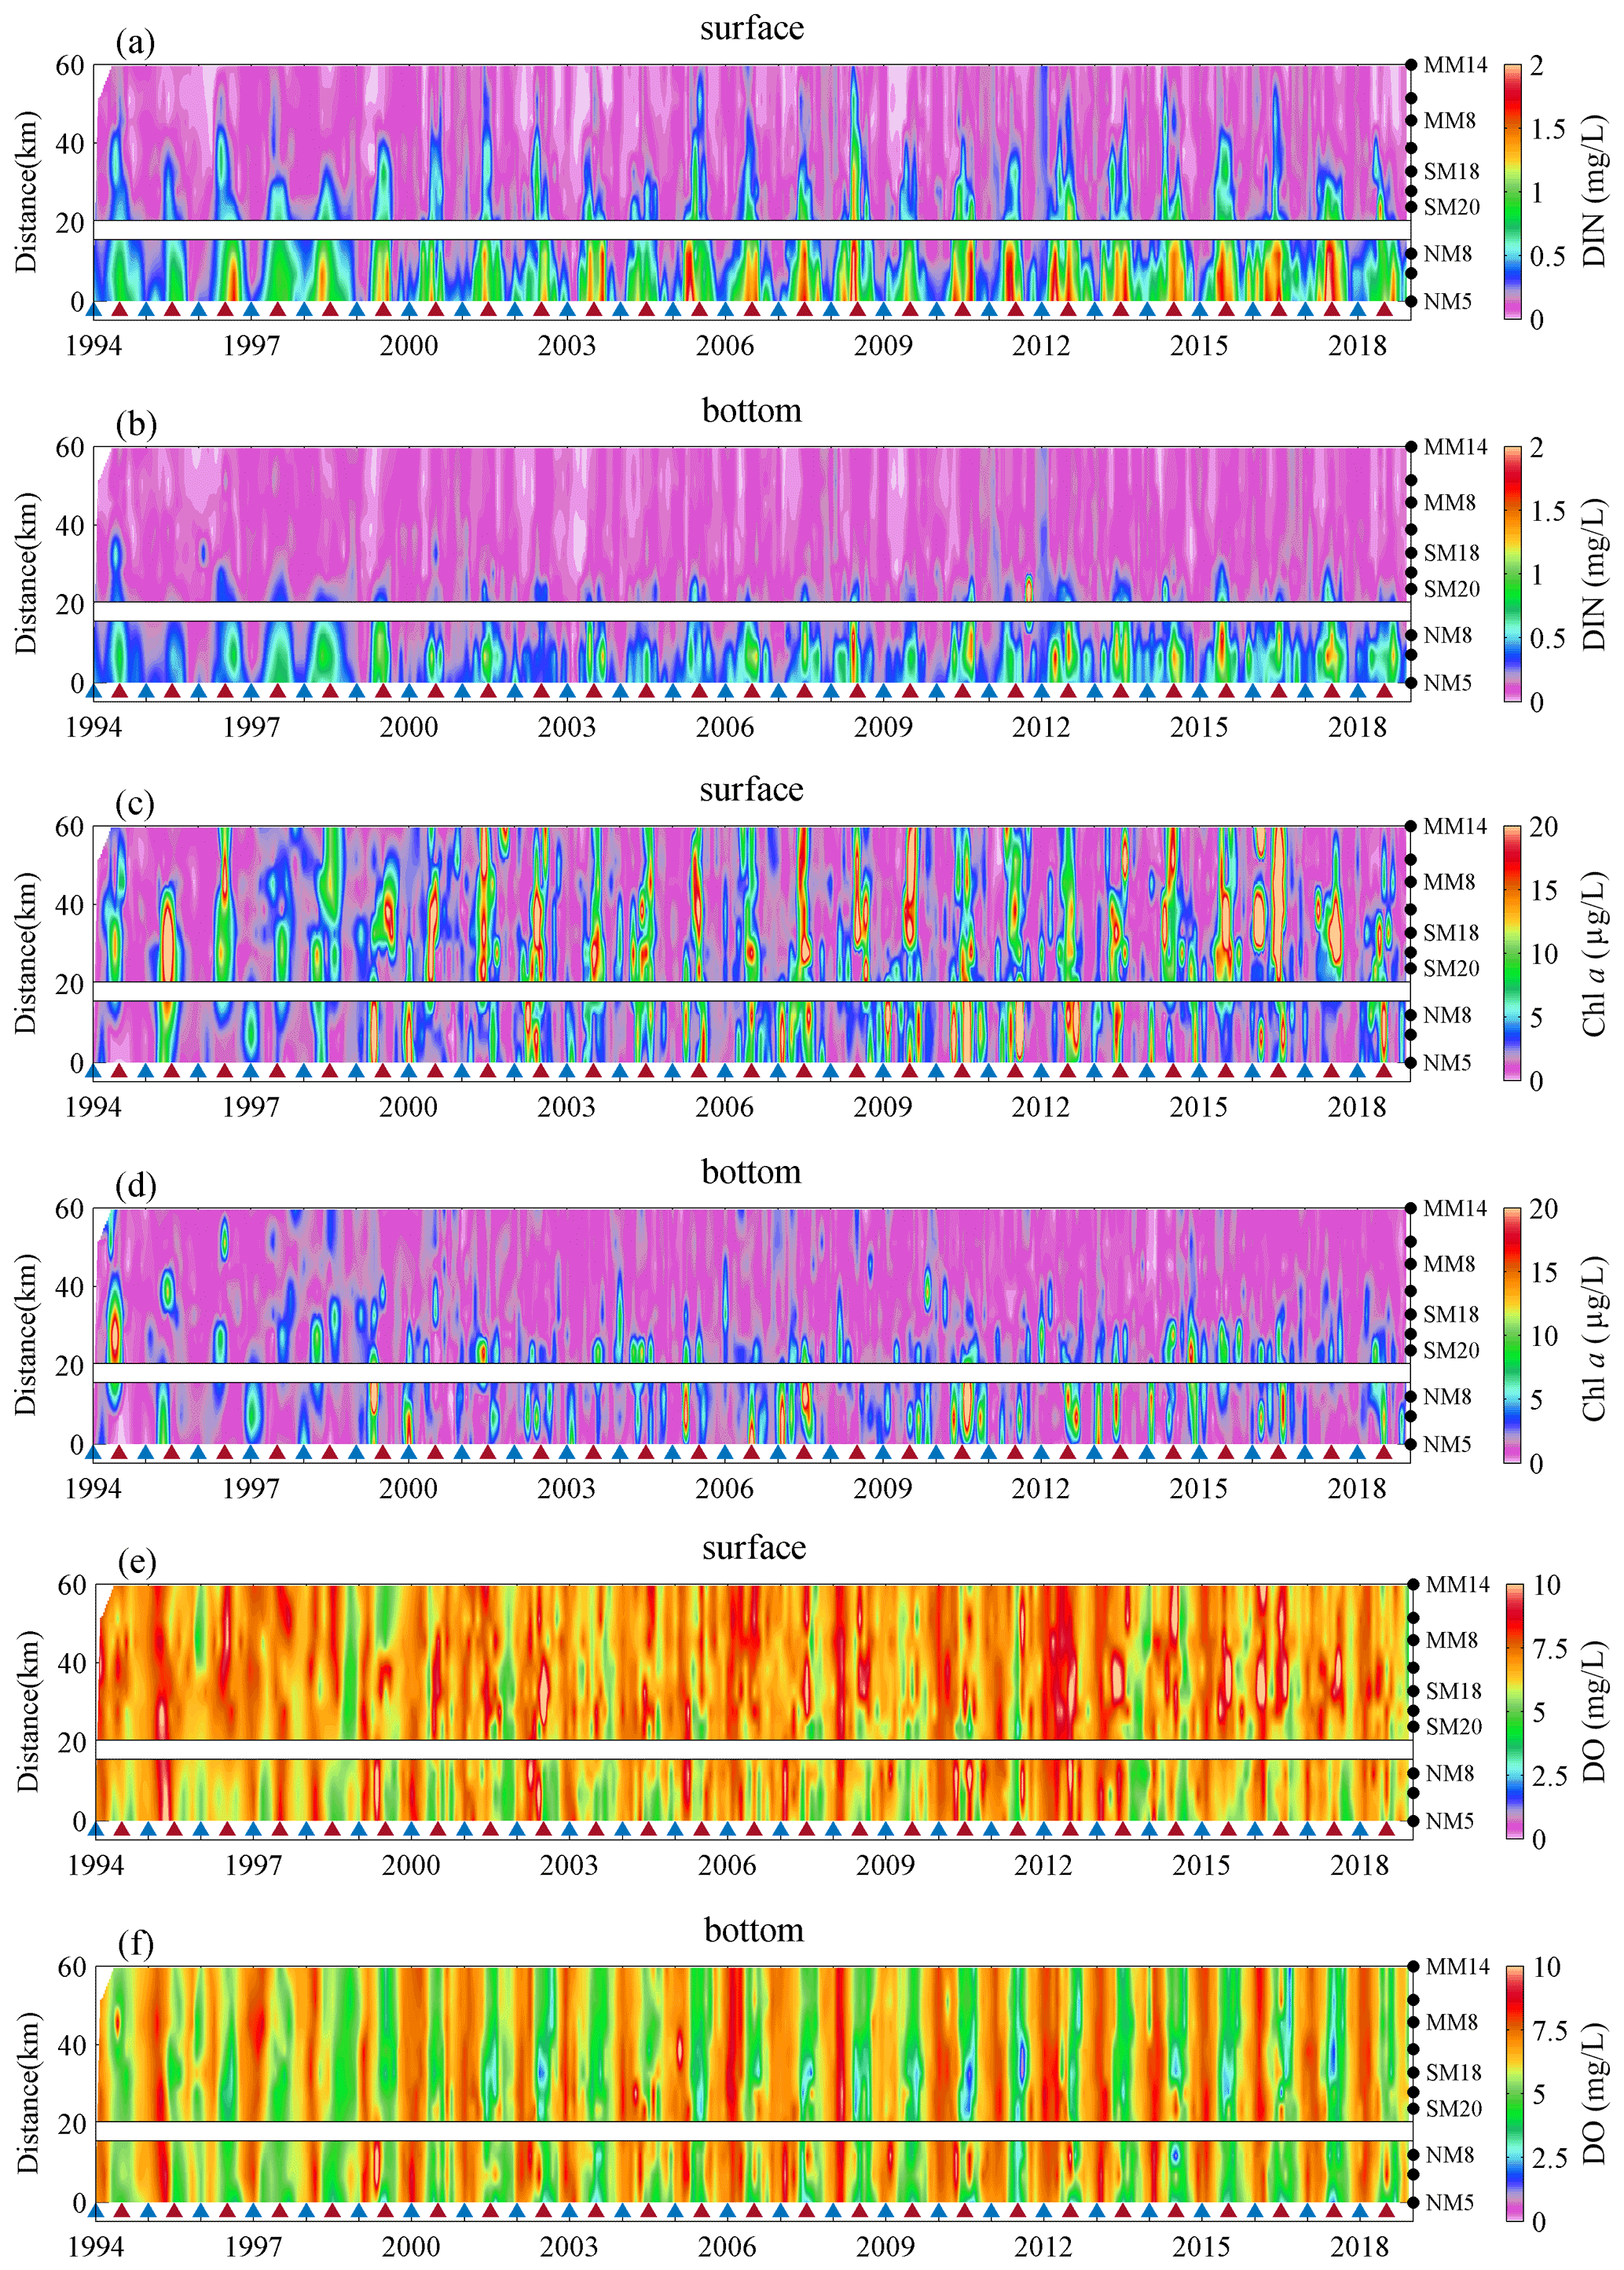
DIN and Chl a are two important parameters related to eutrophication and they both showed remarkable changes over time (Fig. 3a–d). In winter, the concentrations of DIN and Chl a were generally low, with climatological means of 0.19 mg L−1 (surface) and 0.16 mg L−1 (bottom) for DIN and means of 2.45 µg L−1 (surface) and 2.04 µg L−1 (bottom) for Chl a. In summer, on the other hand, DIN and Chl a reached comparatively high levels with significant interannual variability. Overall, the DIN concentrations fluctuated at 0.56 ± 0.50 mg L−1 on the surface (Fig. 3a), which was higher that at the bottom (0.28 ± 0.34 mg L−1; Fig. 3b). Chl a also showed considerable vertical differences with 8.56 ± 9.30 µg L−1 on the surface (Fig. 3c) and 2.46 ± 4.13 µg L−1 at the bottom (Fig. 3d).
In terms of spatial distributions, distinct differences were observed for the hydrological and eutrophication parameters among the three subregions investigated. Due to the profound influence of river discharges, temperature and salinity in the northwestern subregion (NM5–NM8, closer to the river outlets) was noticeably higher and lower when compared to the other two (Fig. 2a–d), varying by 28.61 ± 1.09 ∘C/14.63 ± 6.23 PSU on the surface in summer. Meanwhile, the DIN concentration in the northwestern subregion was the highest (Fig. 3a–b), reaching 1.17 ± 0.40 mg L−1 on the surface. On the contrary, the eastern subregion (MM8–MM14), which was farthest from the river outlets and more heavily affected by the shelf water, had the lowest temperature (27.85 ± 1.27 ∘C), highest salinity (29.22 ± 3.10 PSU), and lowest DIN concentration (0.14 ± 0.13 mg L−1) in the surface waters. For Chl a (Fig. 3c–d), the highest level appeared in the southern subregion (SM17–SM20, with 10.19 ± 8.86 µg L−1 at the surface in summer), while the lowest one was found at the northwestern subregion (with 6.82 ± 10.67 µg L−1 at the surface).
3.1.2 Dissolved oxygen and low-oxygen conditions
DO concentrations exhibited significant seasonal and interannual variations in both layers (Fig. 3e–f). The DO concentrations remained at higher levels during winter (with 7.07 ± 0.99 and 7.27 ± 0.87 mg L−1 in the surface and the bottom waters over 1994–2018, respectively) and dropped to a level of 6.91 ± 1.71 mg L−1 on the surface and 4.42 ± 1.37 mg L−1 at the bottom in summer. Statistical test results showed that low-oxygen events mainly appeared in the bottom waters during summer, which had much higher occurrences of DO <4 mg L−1 and DO <2 mg L−1 compared to other seasons and other layers (Fig. A5). In addition, the summertime DO minimum at the bottom (Fig. 4a) fluctuated at 2.28 ± 0.89 mg L−1, further indicating the water quality deterioration with severe oxygen deficits in the Hong Kong waters. Among the three subregions, the northwestern and the southern ones had relatively lower bottom DO levels (with 4.56 ± 1.56 and 4.14 ± 1.45 mg L−1, respectively) and considerably higher occurrences of low-oxygen conditions (with 38.76 % and 49.32 %, respectively) compared to the eastern subregion (with DO of 4.68 ± 0.93 mg L−1 and occurrence of 17.24 %; Fig. A5).
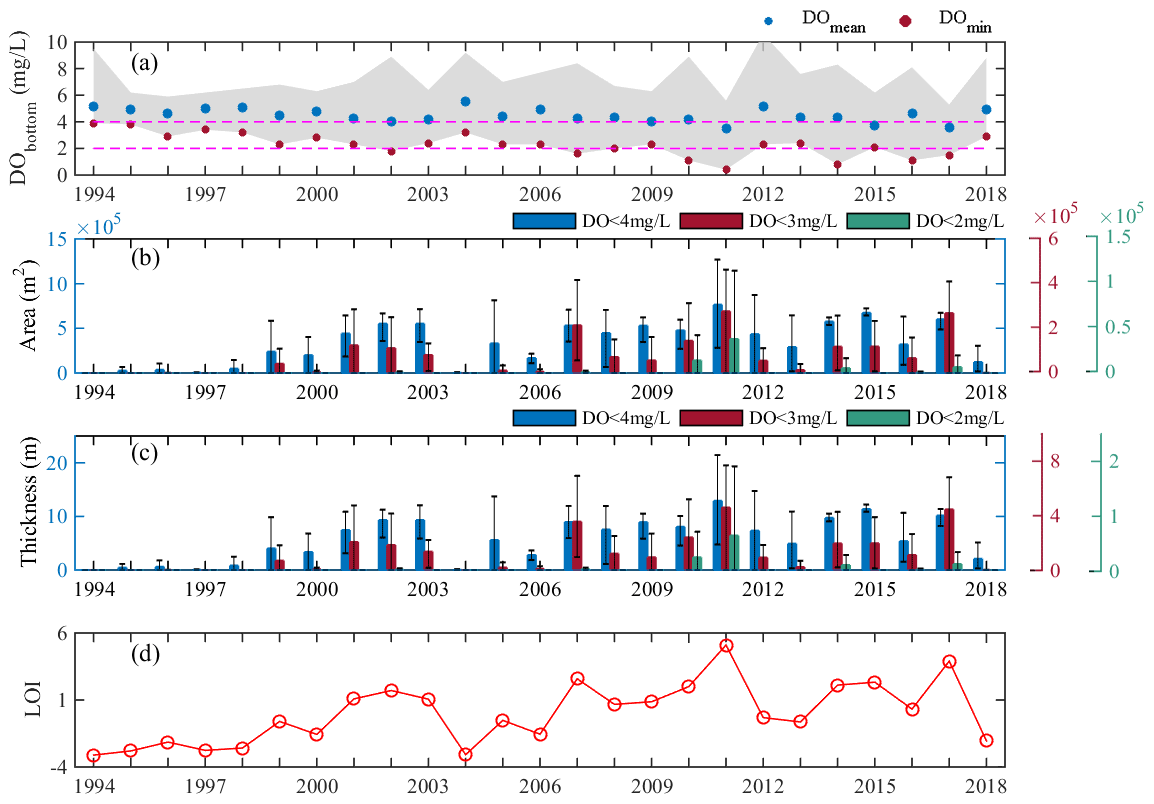
Figure 4Interannual variations in the spatiotemporally (10 stations in June, July, and August) mean and minimum concentrations of dissolved oxygen (DO) observed at the bottom (a), the cross-sectional areas (b), and layer thicknesses (c) of low-oxygen conditions, and low-oxygen index (LOI) (d) in summer during 1994–2018. Note that the gray patch in (a) represents the range of bottom DO observed at the 10 stations in 3 summer months; the colored bars in (b) and (c) show the mean values of 3 summer months, while the thin black error bars represent the range across 3 summer months.
In addition to the DO levels, we also investigated the interannual changes in the summertime low-oxygen conditions in terms of areal extents (vertical profiles), thickness, and the LOI as defined in Sect. 2.2 (Fig. 4). Significant interannual fluctuations were found for all these metrics; for example, the area and thickness affected by low oxygen fluctuated between (3.35 ± 2.38) ×105 m2 and 5.66 ± 4.01 m, respectively, while those for oxygen deficiency were (7.13 ± 8.37) ×104 m2 and 1.20 ± 1.41 m. Low-oxygen and hypoxic conditions were more severe in the years such as 2007, 2011, and 2017, as indicated by the high LOI values. In particular, the year 2011 had the largest low-oxygen area ( m2) and the lowest DO concentration (∼0.40 mg L−1) over the past 25 years, thus possessing the highest LOI; it could be observed that the low-oxygen waters occupied almost the entire middle-to-bottom layers across all the sites during this period (Fig. A1). On the other hand, hypoxic conditions were absent in some years (e.g., 2004, 2006, and 2018), where the water column resided in a comparatively well-oxygenated status (Fig. A1); the corresponding LOI in these hypoxia-relief years dropped to large negative values (Fig. 4d).
3.2 Long-term trends of low-oxygen conditions in the coastal waters off Hong Kong
Despite the large DO fluctuations according to year, a clear deoxygenation trend could be observed in summer over the past 25 years, showing a long-term decline in the DO concentrations associated with increases in the areas and occurrences affected by low oxygen (Fig. 4). More specifically, before 2000 the spatially averaged DO concentrations in the bottom waters exceeded 4 mg L−1 and low-oxygen conditions were seldom observed (Fig. 4a), while the DO minimums were all above 2 mg L−1 (i.e., no hypoxic events occurred). However, since 2000 the occurrences of low oxygen and hypoxia have become more frequent, with a significant growth in the LOI and its related metrics, confirming the exacerbation of low-oxygen conditions in the Hong Kong waters.
To further quantify the intensity of long-term deoxygenation in summer, linear regressions were performed for the DO concentrations in different layers and in different subregions and also for the areal extents of low-oxygen conditions during 1994–2018 (Fig. 5). As shown, apparent declining trends were found for the DO series both at the surface (although not significant, Fig. 5a) and the bottom (Fig. 5b). For the bottom waters, the averaged DO concentrations displayed a decreasing pattern with a rate of 0.03 mg L−1 yr−1 (equivalent to approximately 0.7 % of the climatological DO mean at the bottom), while the DO minimums showed a more significant decline with a rate of 0.08 mg L−1 yr−1 (∼3.5 % of the climatological mean of the bottom DO minimums). It was also noted that the intensity of deoxygenation varied between subregions (Fig. 5c–h). As for the bottom DO concentrations, the most significant decrease was found in the eastern subregion (with a deoxygenation rate of 0.05 mg L−1 yr−1, Fig. 5h), while the most significant decline in the DO minimum appeared in the southern subregion (with a rate of 0.08 mg L−1 yr−1, Fig. 5f). Likewise, significant increasing trends were also found for the areas of low oxygen and oxygen deficiency (Fig. 5i–j), showing an annual growth rate at 1.95×10⁴ m2 and 4.75×10³ m2, respectively. Regarding the changes in LOI, it had a growth rate of 0.20 yr−1, which corresponds to an increasing rate of 1.99×10⁴ m2 in the low-oxygen area and a declining rate of 0.07 mg L−1 in the DO minimum.
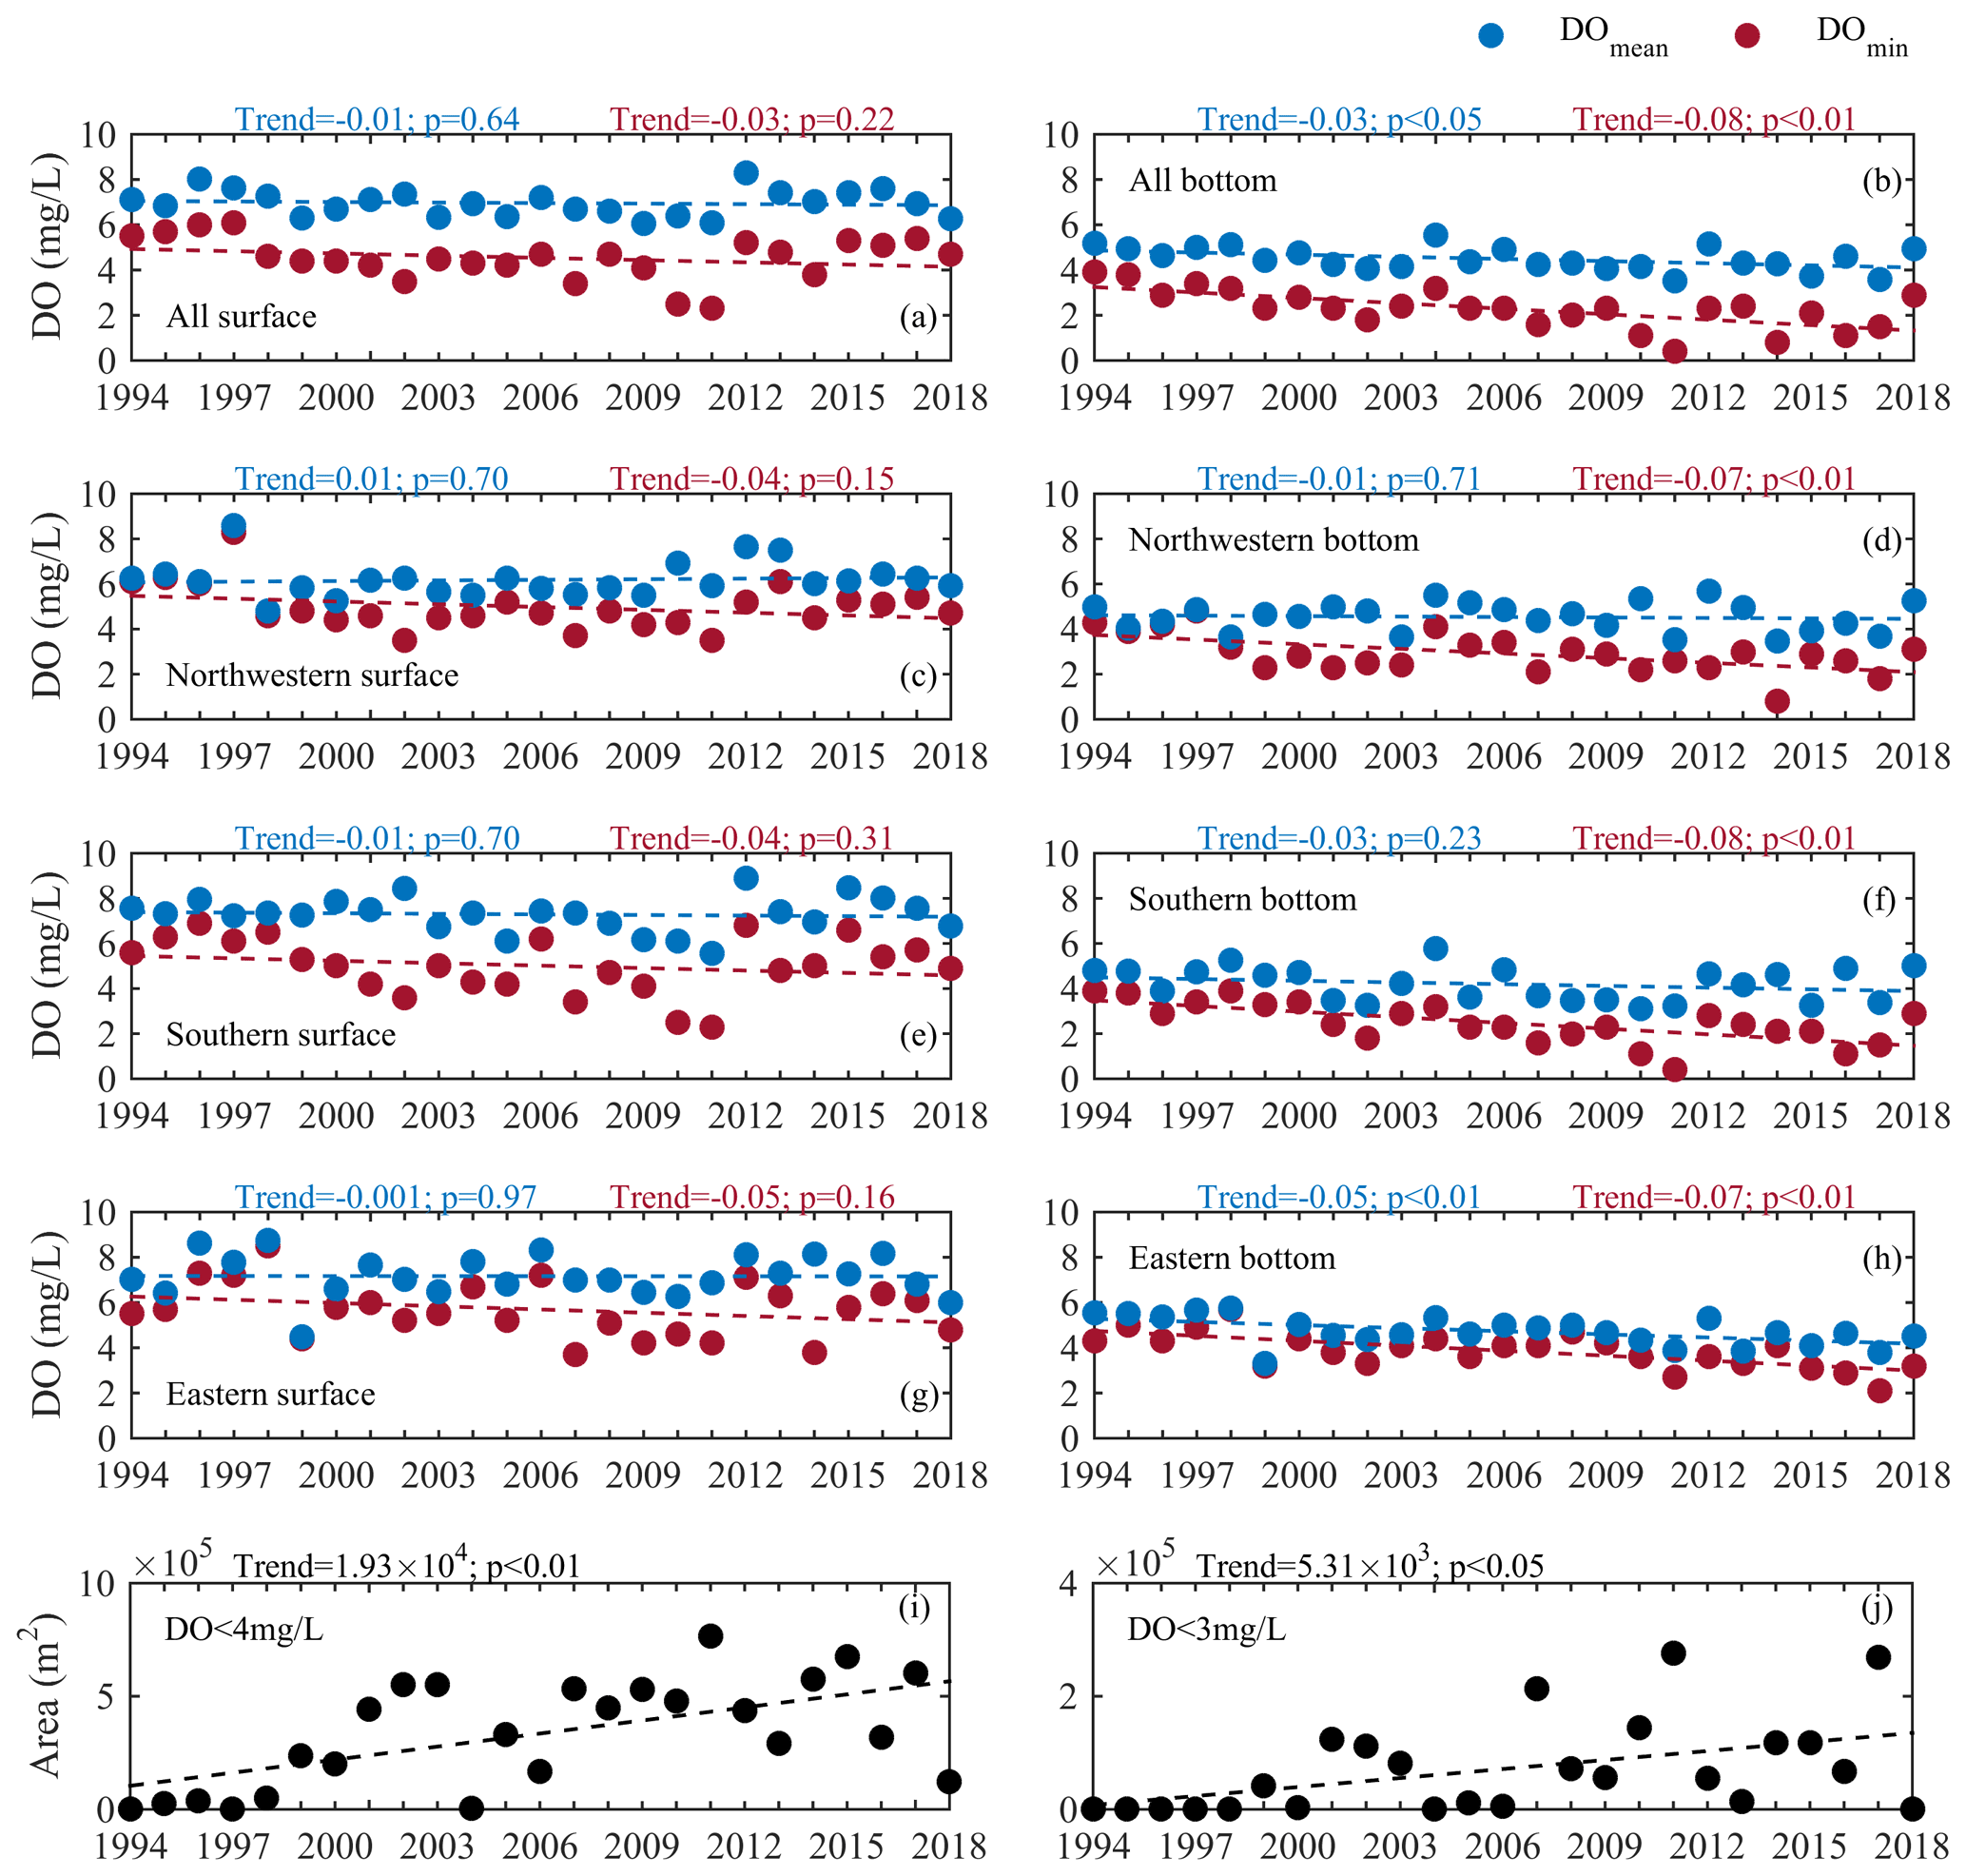
Figure 5Long-term trends of the mean and minimum values of observed dissolved oxygen (DO) on the surface and in bottom waters in 3 summer months for all the stations (a, b) and for the northwestern (c, d), southern (e, f), and eastern (g, h) subregions, and long-term trends of the cross-sectional areas of low oxygen (i) and oxygen deficiency (j).
Furthermore, the long-term oxygen changes varied between different months of the summer season as well (Fig. 6). It could be seen that the decreasing magnitudes of the averaged DO concentration were close to each other for all the summer months, while the decline in the DO minimum was most pronounced in July (with a decreasing rate of 0.10 mg L−1 yr−1, Fig. 6c), followed by that in August (0.06 mg L−1 yr−1, Fig. 6e). In fact, the long-term changes in the DO minimum had different patterns in July and August. For July, the DO minimum generally showed a consecutive decrease over the past 25 years (Fig. 6d). While in August, the DO minimum experienced a rapid decline at a rate of 0.14 mg L−1 yr−1 during 1994–2011, which was higher than that in July during the same period (0.11 mg L−1 yr−1), but subsequently has undergone a recovery from the hypoxic conditions since 2012 (Fig. 6f). Along with such distinctive intraseasonal patterns, an interesting phenomenon was also noticed: hypoxic events were present mostly in August prior to 2012 (e.g., in 2007 and 2010–2011; no hypoxia was found in July during the same period) but since 2012 only in July instead (e.g., in 2014 and 2016–2017), as shown in Fig. 6. This finding implied a potential shift in the onset of hypoxia generation from August to July, i.e., an earlier timing for the arrival of the summertime hypoxia. Accordingly, distinct changes were found for the areas affected by hypoxia in the two periods around 2012. The hypoxic area estimated in July increased from 0 during 1994–2011 to (5.42 ± 8.77) ×103 m2 during 2012–2018, whereas the hypoxic area in August decreased from (0.89 ± 2.82) ×104 m2 to 0.
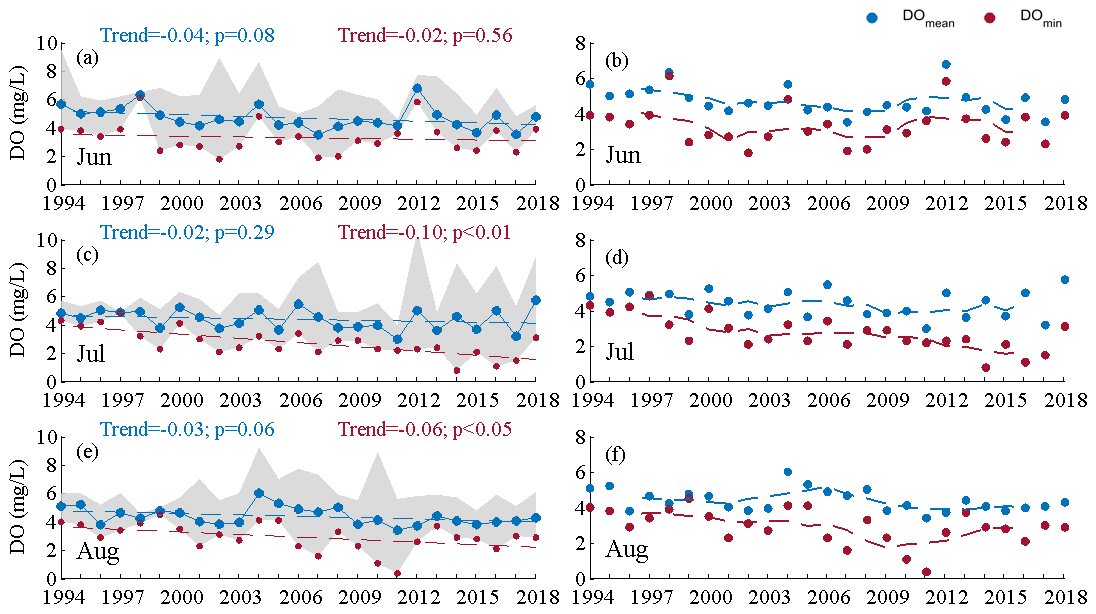
Figure 6Mean and minimum concentrations of dissolved oxygen (DO) at the bottom with their long-term trends (a, c, e) and with 5-year sliding mean values (b, d, f) in summer months during 1994–2018. Note that the gray patches represent the range of DO observed in the 10 stations.
4.1 Primary factors controlling the interannual variabilities in low-oxygen conditions
As shown above, significant interannual variabilities were observed in the spatial extent (e.g., cross-sectional area) and intensity of oxygen conditions (e.g., the mean bottom DO concentrations). Such variabilities were largely influenced by multiple physical and biogeochemical factors, including wind forcing, freshwater discharge, water temperature, and nutrient loads. These processes act jointly to affect density stratification (Yu et al., 2015), water residence time (Li et al., 2021), and temporal and spatial distributions of eutrophication parameters (Cui et al., 2018). As described in Sect. 2.2, four important influential factors (i.e., WS, flow, T, and DIN) were used to predict the interannual variations in LOI with multiple regression models, in which there have been 56 010 cases (∼12 % of the total, Fig. 7) with R2≥0.6 both in the training dataset (mean R2 of 0.64) and the testing dataset (mean R2 of 0.70). The standardized coefficients (mean ± SD) for these well-performing regression cases were given as follows:
As denoted by the regression coefficients, wind forcing has exerted a significant impact on the interannual changes in LOI, with a relative contribution of 39 ± 12 % to the LOI variability explained. Its importance could also be evidenced by the significant negative correlation between WS and LOI (, p<0.01, Fig. 8), suggesting that calm winds were beneficial to low-oxygen conditions. In most cases (e.g., in Modaomen Bay in the PRE and the northern Gulf of Mexico), strong winds could break down stratification in the water column (Rabalais et al., 1991; Feng et al., 2012), which was conducive to water mixing and atmospheric reoxygenation (Rabalais et al., 1991). However, the weak correlation between WS and Δρ (Fig. 8) indicated that the wind forcing may control hypoxia through other alternative mechanisms. Actually, weak winds in combination with flow convergence induced by wind-driven circulation could contribute to long water residence time and nutrient accumulation in the eastern PRE and thus favor the phytoplankton blooms (Li et al., 2021). This could be supported by the significant negative correlation between WS and Chl a (, p<0.01). By contrast, the wind direction showed less significant effect on the interannual variability in low-oxygen conditions, as suggested by the comparatively poor performance in the LOI fitting and the weaker correlations of the wind direction-related variables with LOI (Table A3). It was noted that the monthly average wind direction in summer was generally southerly with small changes (mostly varying between 150 and 200∘, Fig. A2). Overall, our results indicated that the wind speed played a more important role in regulating the low-oxygen conditions in the coastal waters off Hong Kong from an interannual perspective, although the wind direction could significantly influence the short-term generation and development of low-oxygen conditions by modulating the Pearl River plume and material fluxes (Yin et al., 2004; Li et al., 2021). With respect to the DIN concentrations, they played a vital role in determining the interannual variabilities of the oxygen conditions, with a contribution of up to 49 ± 12%. It has been widely recognized that eutrophication stimulated by anthropogenic nutrient inputs could provide a large quantity of depositing detritus and subsequently lead to substantial oxygen depletion and occurrence of low-oxygen events (Rabalais et al., 2010; Fennel and Testa, 2018); for example, in the northern Gulf of Mexico (Feng et al., 2012; Forrest et al., 2011) and Chesapeake Bay (Wang et al., 2015), the interannual hypoxic areas in summer were directly regulated by the nutrient levels. A similar situation was found in the PRE (Li et al., 2020) and Hong Kong waters, as confirmed by the significant positive correlation between DIN and LOI (r=0.65, p<0.01). Collectively, DIN and WS were identified as the two key factors controlling the interannual changes in low-oxygen conditions.

Figure 7Combined fitting results of the regression models with R2>0.6 both in the training dataset and the testing dataset. Note that the hollow red dots denote the low-oxygen index (LOI) estimated based on observational data, while the solid blue dots and the gray patch represent the mean values and ranges of the fitted LOI in the selected regression cases, respectively.
Compared to WS and DIN, the freshwater discharges (flow) had a much smaller contribution (∼14 ± 12 %) to the variations in LOI. Generally, large freshwater inputs tend to enhance the intensity of water stratification and facilitate the generation of hypoxia (Rabalais et al., 1991). However, we found a negative correlation between flow and LOI (, p<0.05, Fig. 8), implying that the effect of freshwater discharges on low-oxygen conditions might involve more complex mechanisms and act through indirect pathways. Due to their long distance from the river outlets of the Pearl River, the coastal waters off Hong Kong were relatively less influenced by terrestrial inputs (Yu et al., 2021) and the effect of freshwater discharge and its carrying of organic matter in this area was not as significant as that in other subregions (e.g., the upper reach of Lingdingyang Bay and the western PRE). Nevertheless, freshwater discharge in combination with the wind-driven circulation could significantly affect the water residence time (Sun et al., 2014) and nutrient accumulation in the Hong Kong waters (Li et al., 2021). Specifically, the weakened discharge could prolong the retention of nutrients and thereby stimulate local production of organic matter in the region (Li et al., 2021), which ultimately promoted oxygen depletion. Regarding the water temperature, previous studies showed that it could exert significant influence on coastal hypoxia largely by regulating water stratification intensity, oxygen solubility, and microbial respiration rate (Breitburg et al., 2018). However, our results showed that the contribution of water temperature (T) to the LOI changes (∼11 ± 8 %) was not significant in the Hong Kong waters, as revealed by its weak correlation with LOI as well. Given the fact that the Hong Kong waters are a region heavily affected by human activities, the effect of temperature (e.g., global warming) might be more significant in the region with a larger geographic scale. Overall, the role of temperature and freshwater discharges in regulating the interannual oxygen variability in the Hong Kong waters appeared to be secondary.
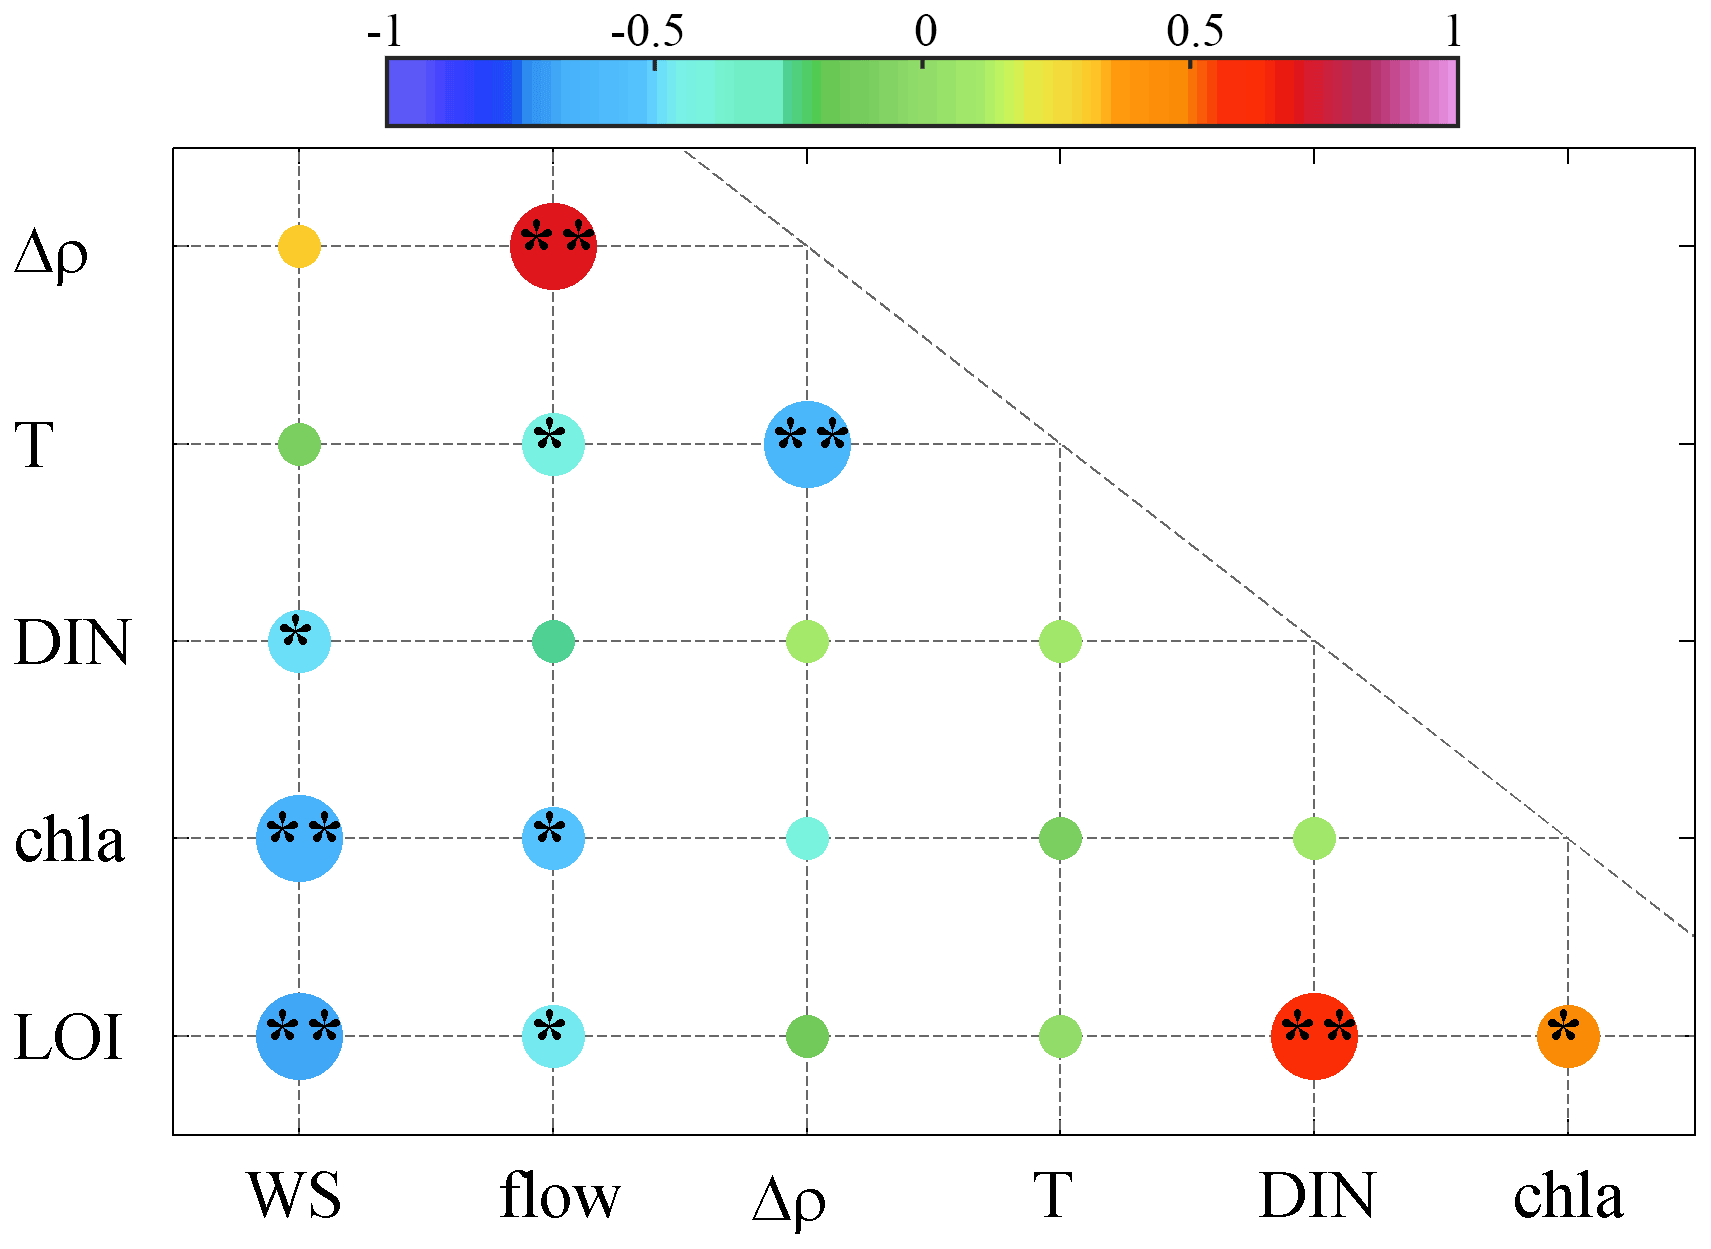
Figure 8Pearson correlation coefficients (r) among the wind speeds (WS), freshwater discharges (flow), vertical density differences (Δρ), bottom temperature (T), surface DIN concentrations (DIN), surface Chl a concentrations (Chl a), and low-oxygen index (LOI). Note that the color of the dots shows the correlation coefficients, and the symbols * and ** represent the significance level at p<0.05 and p<0.01, respectively.
4.2 Drivers of the long-term deoxygenation trend
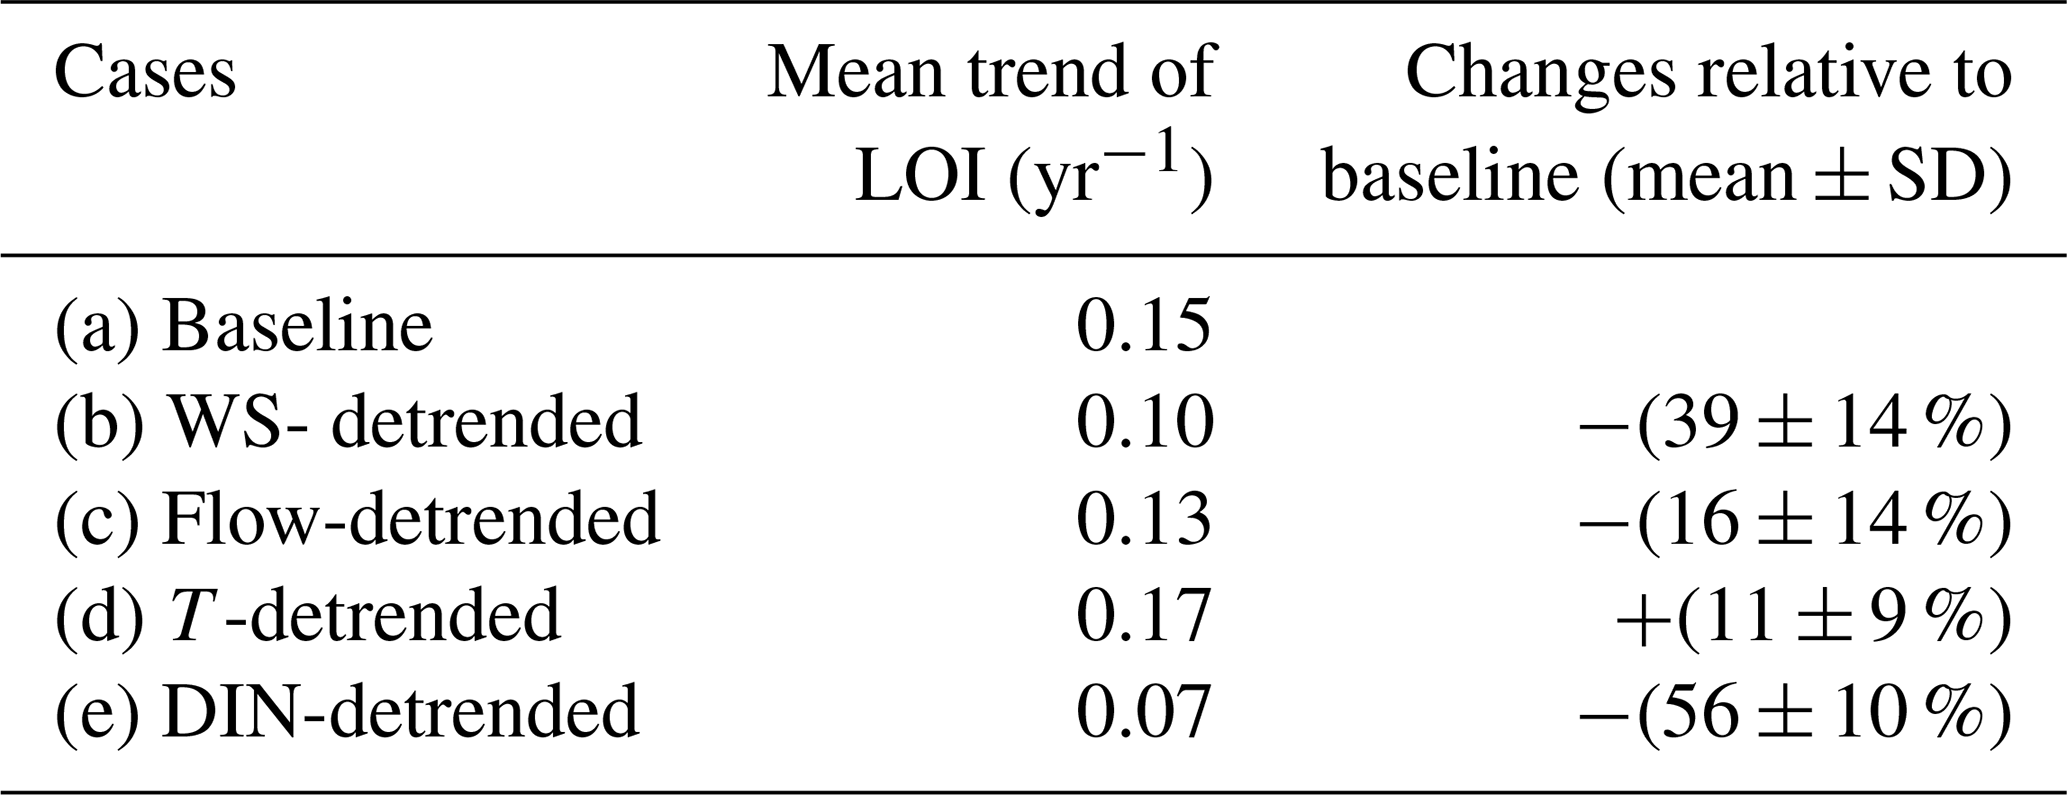
The data over the past 25 years showed that the coastal waters off Hong Kong have experienced a notable long-term oxygen decline, especially for the DO minimum in the bottom waters. Based on the observed deoxygenation rate, the bottom DO minimum was expected to decrease by approximately 15 %–70 % in 5–20 years (reaching a level of 0.4–1.6 mg L−1) compared to the climatological mean of 1994–2018. The impacts of influential factors on the long-term deoxygenation trend were then evaluated using the regression models mentioned in Sect. 4.1 and quantified by the relative changes of LOI in the sensitive experiments (see details in Sect. 2.2) compared to the original one. It was noted that WS exhibited a decreasing trend of 0.03 m s−1 yr−1 (p<0.05, Fig. 9a) within the coastal regions off Hong Kong over the past 25 years, while a similar situation was also found in the Pearl River Basin (Zhang et al., 2019) and the northern South China Sea (Gao et al., 2020) due to the long-term climate changes (Xu et al., 2006; Zhang et al., 2009; Chen et al., 2020). Meanwhile, DIN showed an increasing trend with a rate of 0.01 mg L−1 yr−1 (p<0.01, Fig. 9e). The growth in DIN and decline in WS led to a 56 ± 10 % and 39 ± 14 % increase in LOI (Table 1), respectively, indicating that DIN and WS were the main driving factors for the long-term deoxygenation. On the other hand, significant long-term trends were also found for the freshwater discharges (with a decreasing rate of 4.19×10² m3 s−1 yr−1, Fig. 9b) and water temperature (with an increasing rate of 0.06 ∘C yr−1, Fig. 9d), but their impacts were relatively small, resulting in a 16 ± 14 % increase and 11 ± 9 % decrease in LOI, respectively.
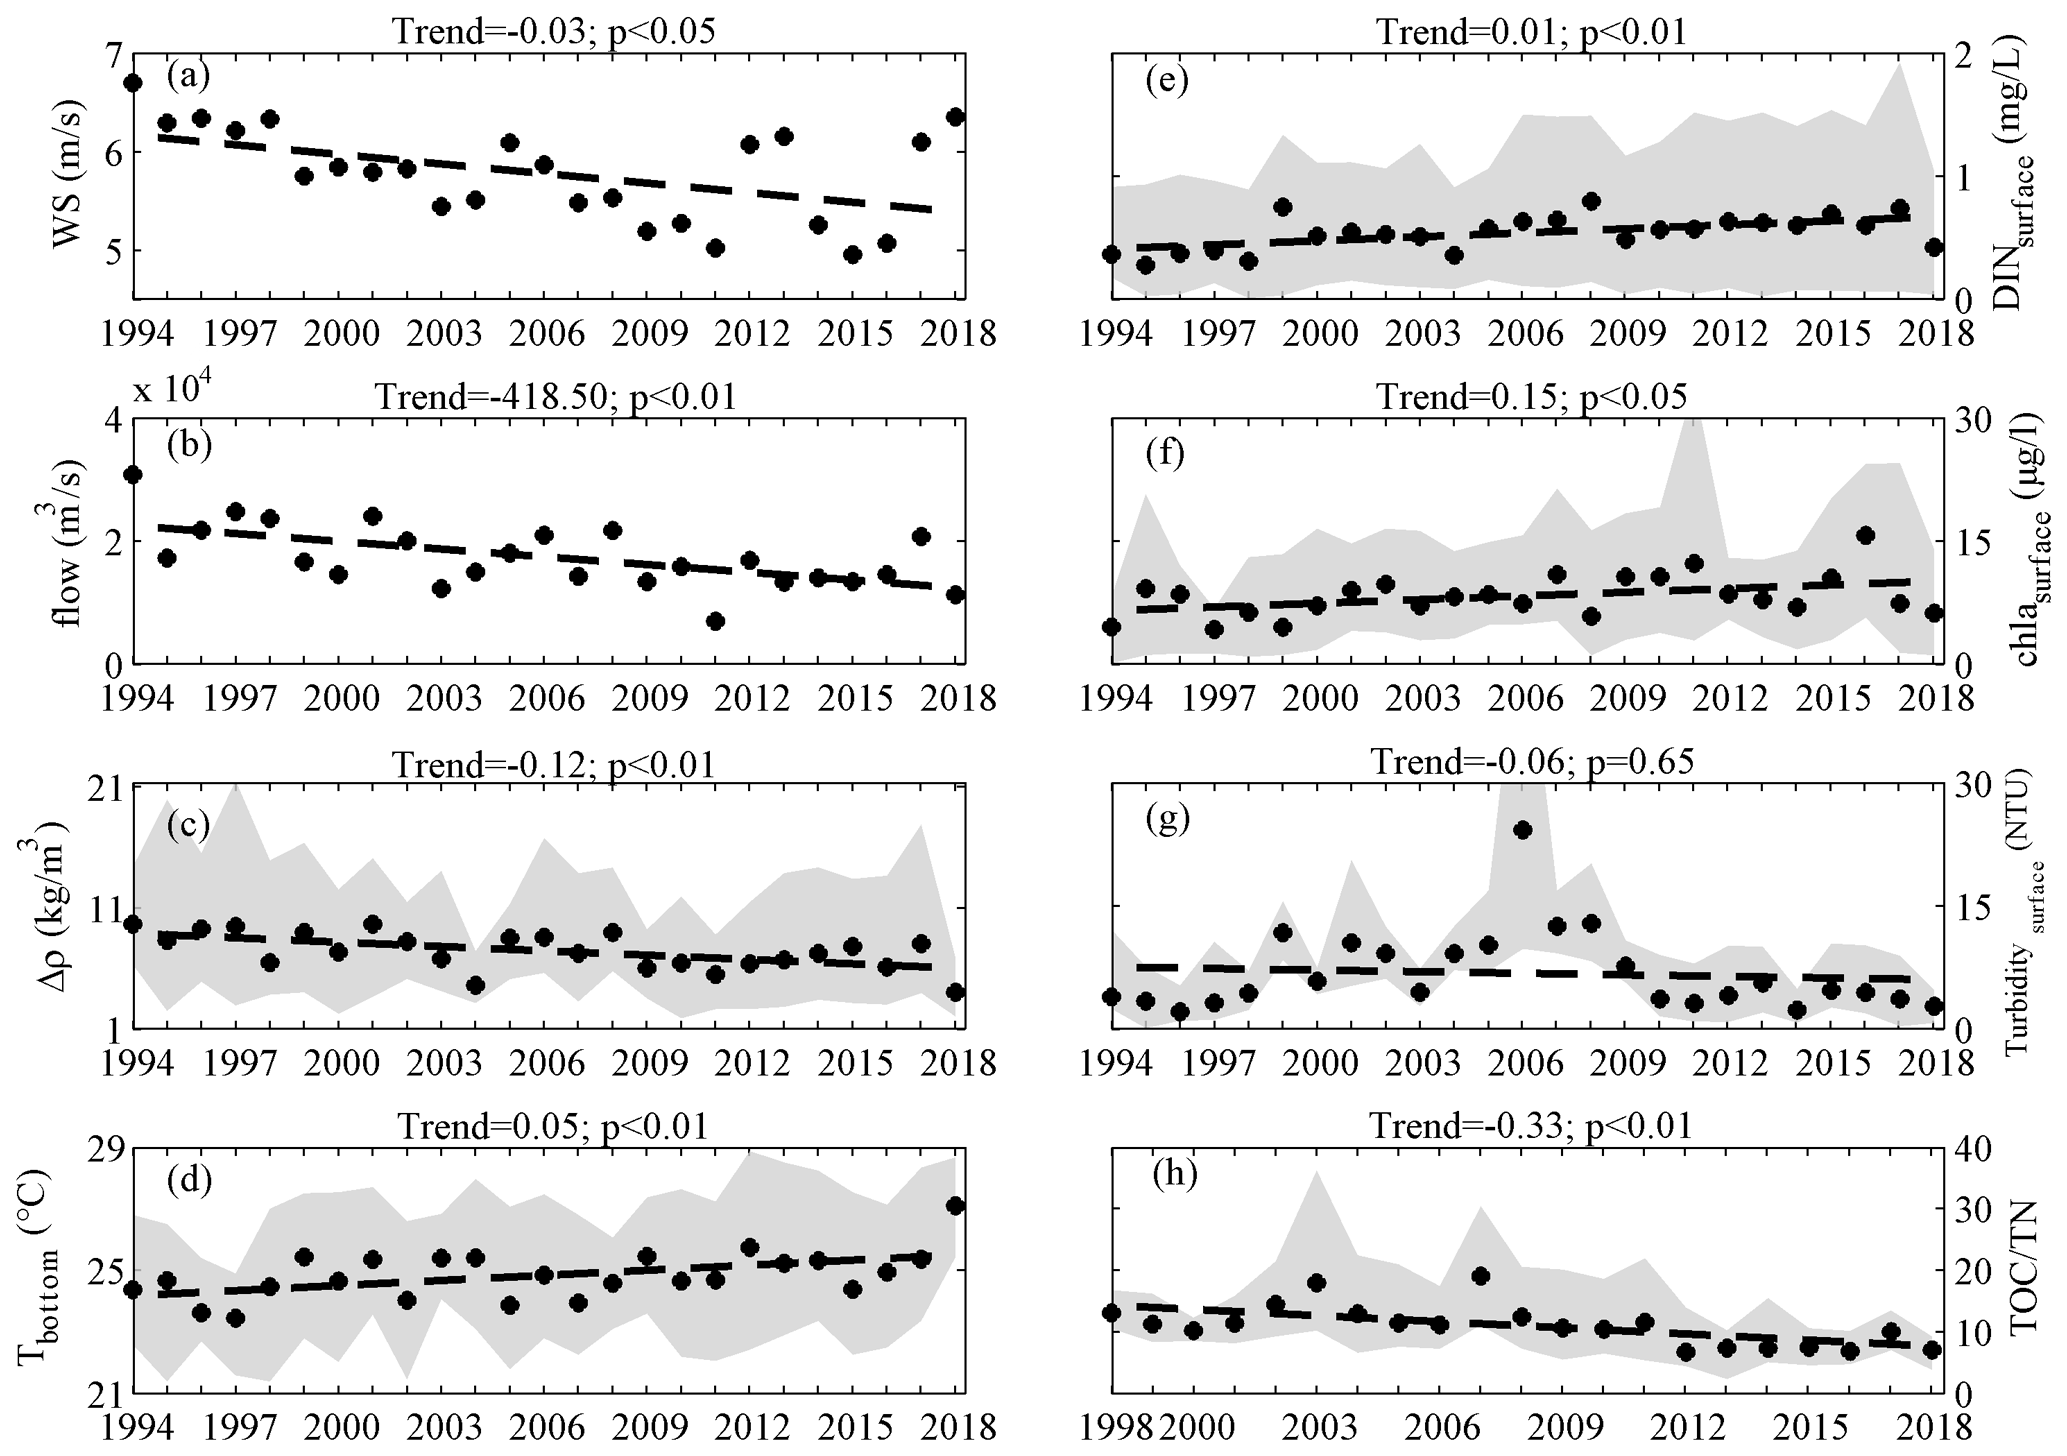
Figure 9Long-term trends of the wind speeds (a), freshwater discharges (b), density differences (c), bottom temperature (d), surface DIN (e), surface Chl a (f), surface turbidity (g), and measured in the sediments (h) in summer during 1998–2018. Note that the black dots represent the spatial average values of each variable and the gray patches represent the range of each variable observed in the 10 stations.
Table 1Long-term trends in the fitted LOI on average for the selected regression cases with R2>0.6 (baseline) and for the sensitive experiments with respect to the effects of wind speeds (b), freshwater discharges (c), water temperature (d), and surface DIN concentrations (e).
Despite the different influences of the factors mentioned above, they were likely to exert synergetic impacts on the low-oxygen conditions by aggravating eutrophication as discussed earlier; it was observed that the long-term growth in Chl a (with a rate of 0.15 µg L−1 yr−1, Fig. 9f) matched well with the increase in LOI. Specifically, the significant increase in phytoplankton biomass was primarily due to the combined effects of more stable water-column conditions and longer residence time facilitated by the weakened wind forcing and river discharges, higher nutrient levels, and lower water turbidity (Fig. 9g) in recent years. Consequently, the elevated organic matter through phytoplankton primary production would lead to strong oxygen consumption, thereby contributing to an expansion of low-oxygen conditions in terms of areal extent and intensity.
Moreover, with massive algal fragments provided by primary production, the composition of organic matter in the coastal waters off Hong Kong has probably changed and would cause substantial changes in the timing of hypoxia generation. As noted in Sect. 3.2, the onset of hypoxia was observed to shift from August to July around 2012. To explore this issue, we first used the ratio of TOC to TN measured in the sediments to estimate the main source of organic matter, with values of 14–30 pointing to a terrestrial source and values of 4–10 indicating a marine source from in situ production (Bordovskiy, 1965; Meyers and Ishiwatari, 1993). It is clear that the TOC:TN showed a significant decreasing trend and was mostly below 10 from 2012 on (Fig. 9h). This implied a shift in the dominant source of organic matter from terrestrial inputs to local production (marine sourced). As such, oxygen consumption became faster because the marine-sourced organic matter was fresher and more active (Raymond and Bauer, 2001) and therefore the time required to reach hypoxia would be shortened. Furthermore, changes in the physical conditions provided sufficient time for a more thorough decomposition of organic matter in July, which left less organic matter for August and thus weakened the deoxygenation therein.
Similarly, the long-term oxygen changes in terms of the areal extents and arrival timing of hypoxia have also been found in other coastal systems. For example, in Chesapeake Bay, sea level rise and elevated freshwater discharges would lead to an approximately 10 %–30 % increase in hypoxic volume between the late 20th and the mid-21st centuries (Ni et al., 2019), while the increase in water temperature would cause hypoxia to develop 5–10 d earlier in ∼30 years (Ni et al., 2020). In the northern Gulf of Mexico, the growth in riverine nutrient inputs would result in an increase in the frequency of hypoxia occurrence by 37 % (Justić et al., 2003). While in the Hong Kong waters, low-oxygen conditions would develop into hypoxic conditions in two decades with larger areal extent and earlier arrival ascribed to the ongoing alterations in physical conditions and nutrients as mentioned earlier. This inference was based on the assumption that the external factors (e.g., wind speed, DIN, discharges) would change at the same rates as those in the past 25 years. Although the real situation would be more complicated and compounded by factors such as the implementation of management and nonlinear changes in climatic factors, our findings still served as an alarming signal that changes in wind and freshwater discharges could cancel out potential benefits of nutrient management. To this end, it is of great importance to conduct long-term and more intensive control of nutrient inputs in order to mitigate the low-oxygen conditions in the region.
We comprehensively investigated the spatiotemporal characteristics of DO and various related water quality variables in the coastal waters off Hong Kong and found that low-oxygen conditions occurred mostly in the bottom waters of summer, with significant interannual variability and an apparent deoxygenation trend over the past 25 years. We also quantified the contribution of each primary factor by statistical methods and found that the increasing DIN levels and the decreasing wind speeds, both of which would eventually lead to the intensification of eutrophication, contributed most to the interannual variations and long-term trend in LOI. Therefore, more marine-sourced organic matter was produced by the elevated primary production, leading to an exacerbation in low-oxygen conditions with larger areal extents as well as a potential earlier onset of the summertime hypoxia. By comparison, the freshwater inputs and water temperature had relatively small impacts on the long-term changes in LOI. To sum up, this study has shown that oxygen conditions in the coastal waters off Hong Kong have been deteriorating under the interactions of altered physical forcing (e.g., winds) and aggravated eutrophication and it would develop into a severe hypoxic state within the next two decades. Lastly, given the significant intraseasonal variability in low-oxygen conditions during summer, it is of great importance to conduct more cruise surveys to collect estuary-wide observations on a longer time scale in order to fully capture the generation and development of hypoxia and to confirm the change in the timing of its arrival.
Table A1Description of variables in the principal component analysis (PCA).
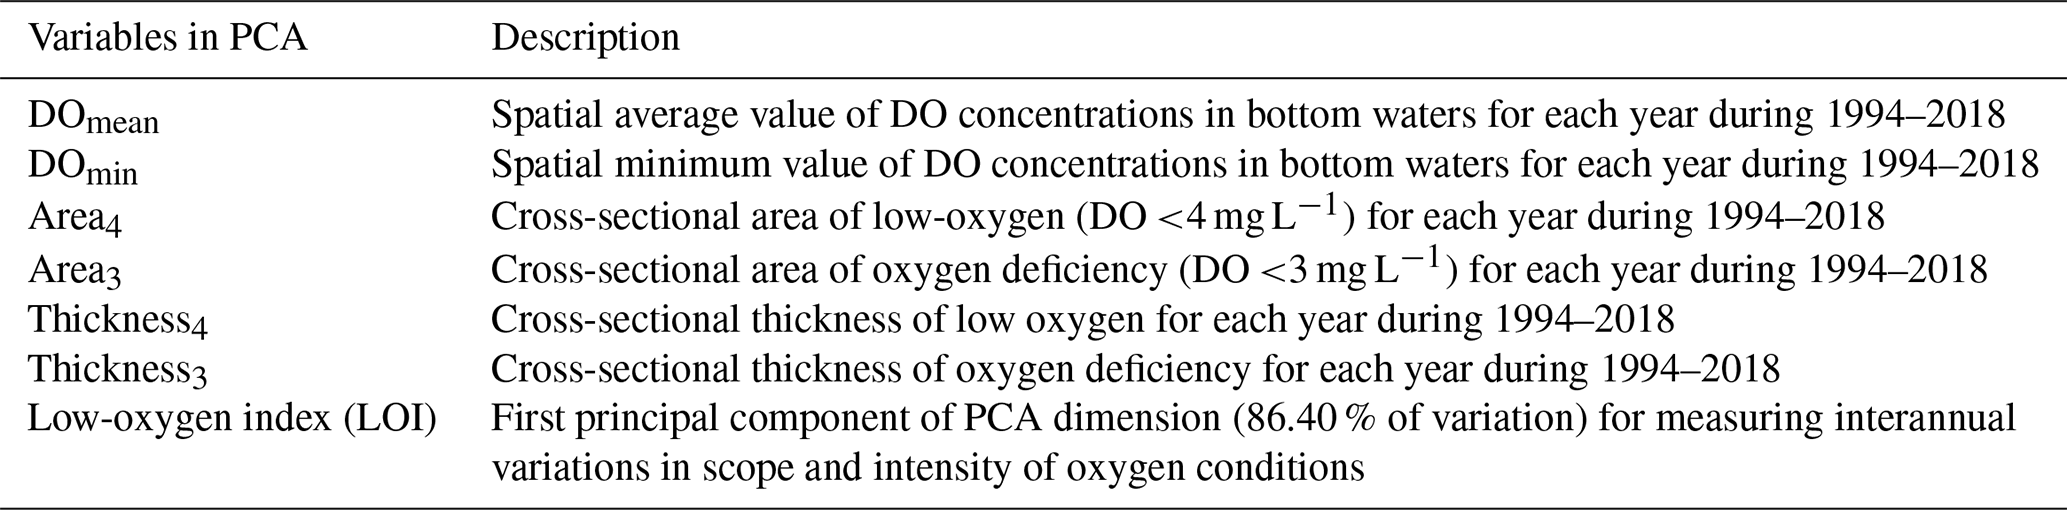
Table A2Total variance explained and the feature matrix of the first component in the PCA.

Table A3Coefficients of determination (R2) for average wind speed (WS), southwestern wind duration (SWWD), southwestern wind cumulative stress (SWCS), and southeastern wind cumulative stress (SECS) in fitting LOI; Pearson correlation coefficient of WS, SWWD, SWCS, and SECS with LOI.
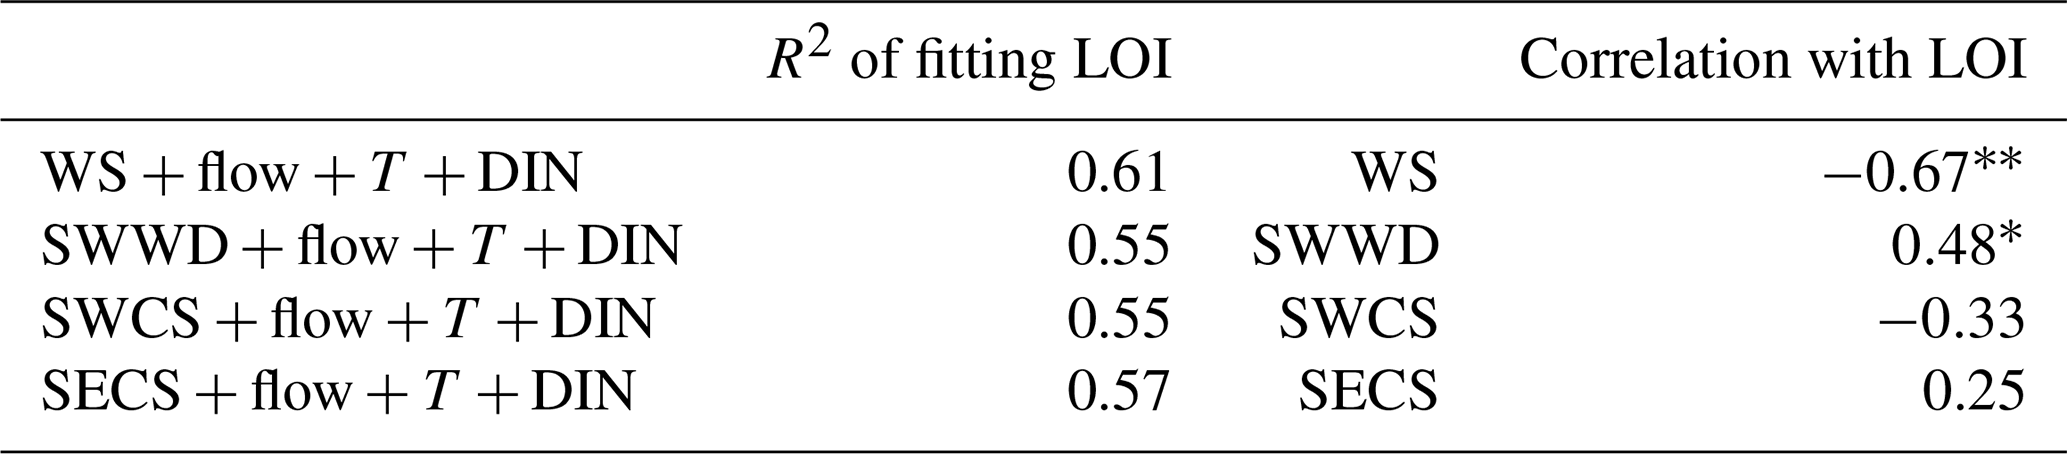
Note that the symbols * and represent the significance level at p<0.05 and p<0.01, respectively.
Table A4Regression coefficients of wind speed (WS), freshwater discharge (flow), bottom temperature (T), and surface dissolved inorganic nitrogen (DIN) of different sample datasets (mean ± SD); R2 and Pearson correlation coefficient (r) of training and testing dataset in different sample datasets (mean ± SD).
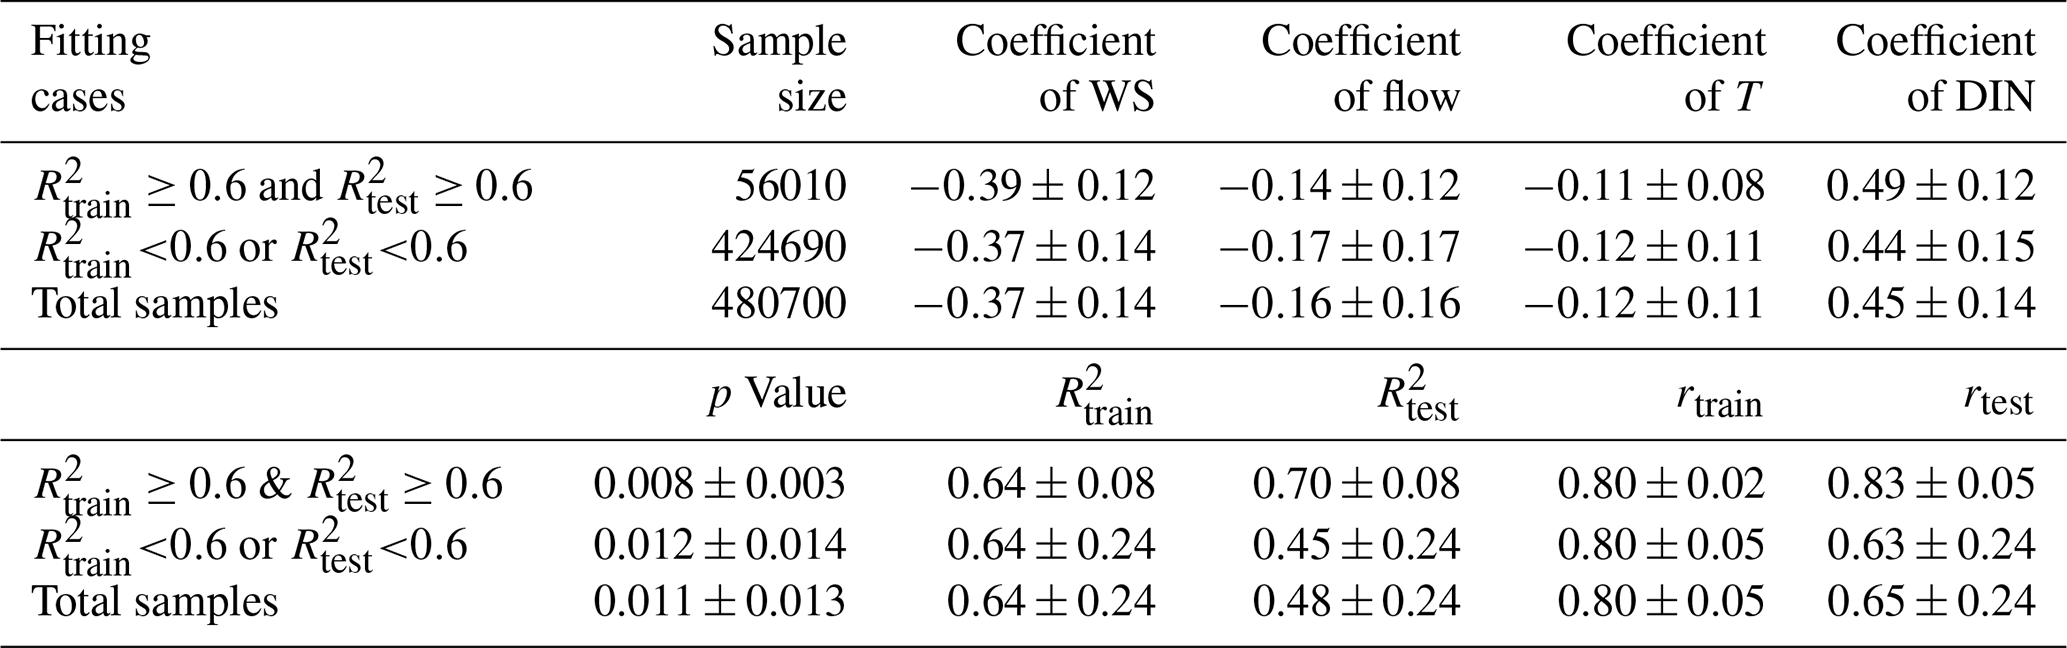
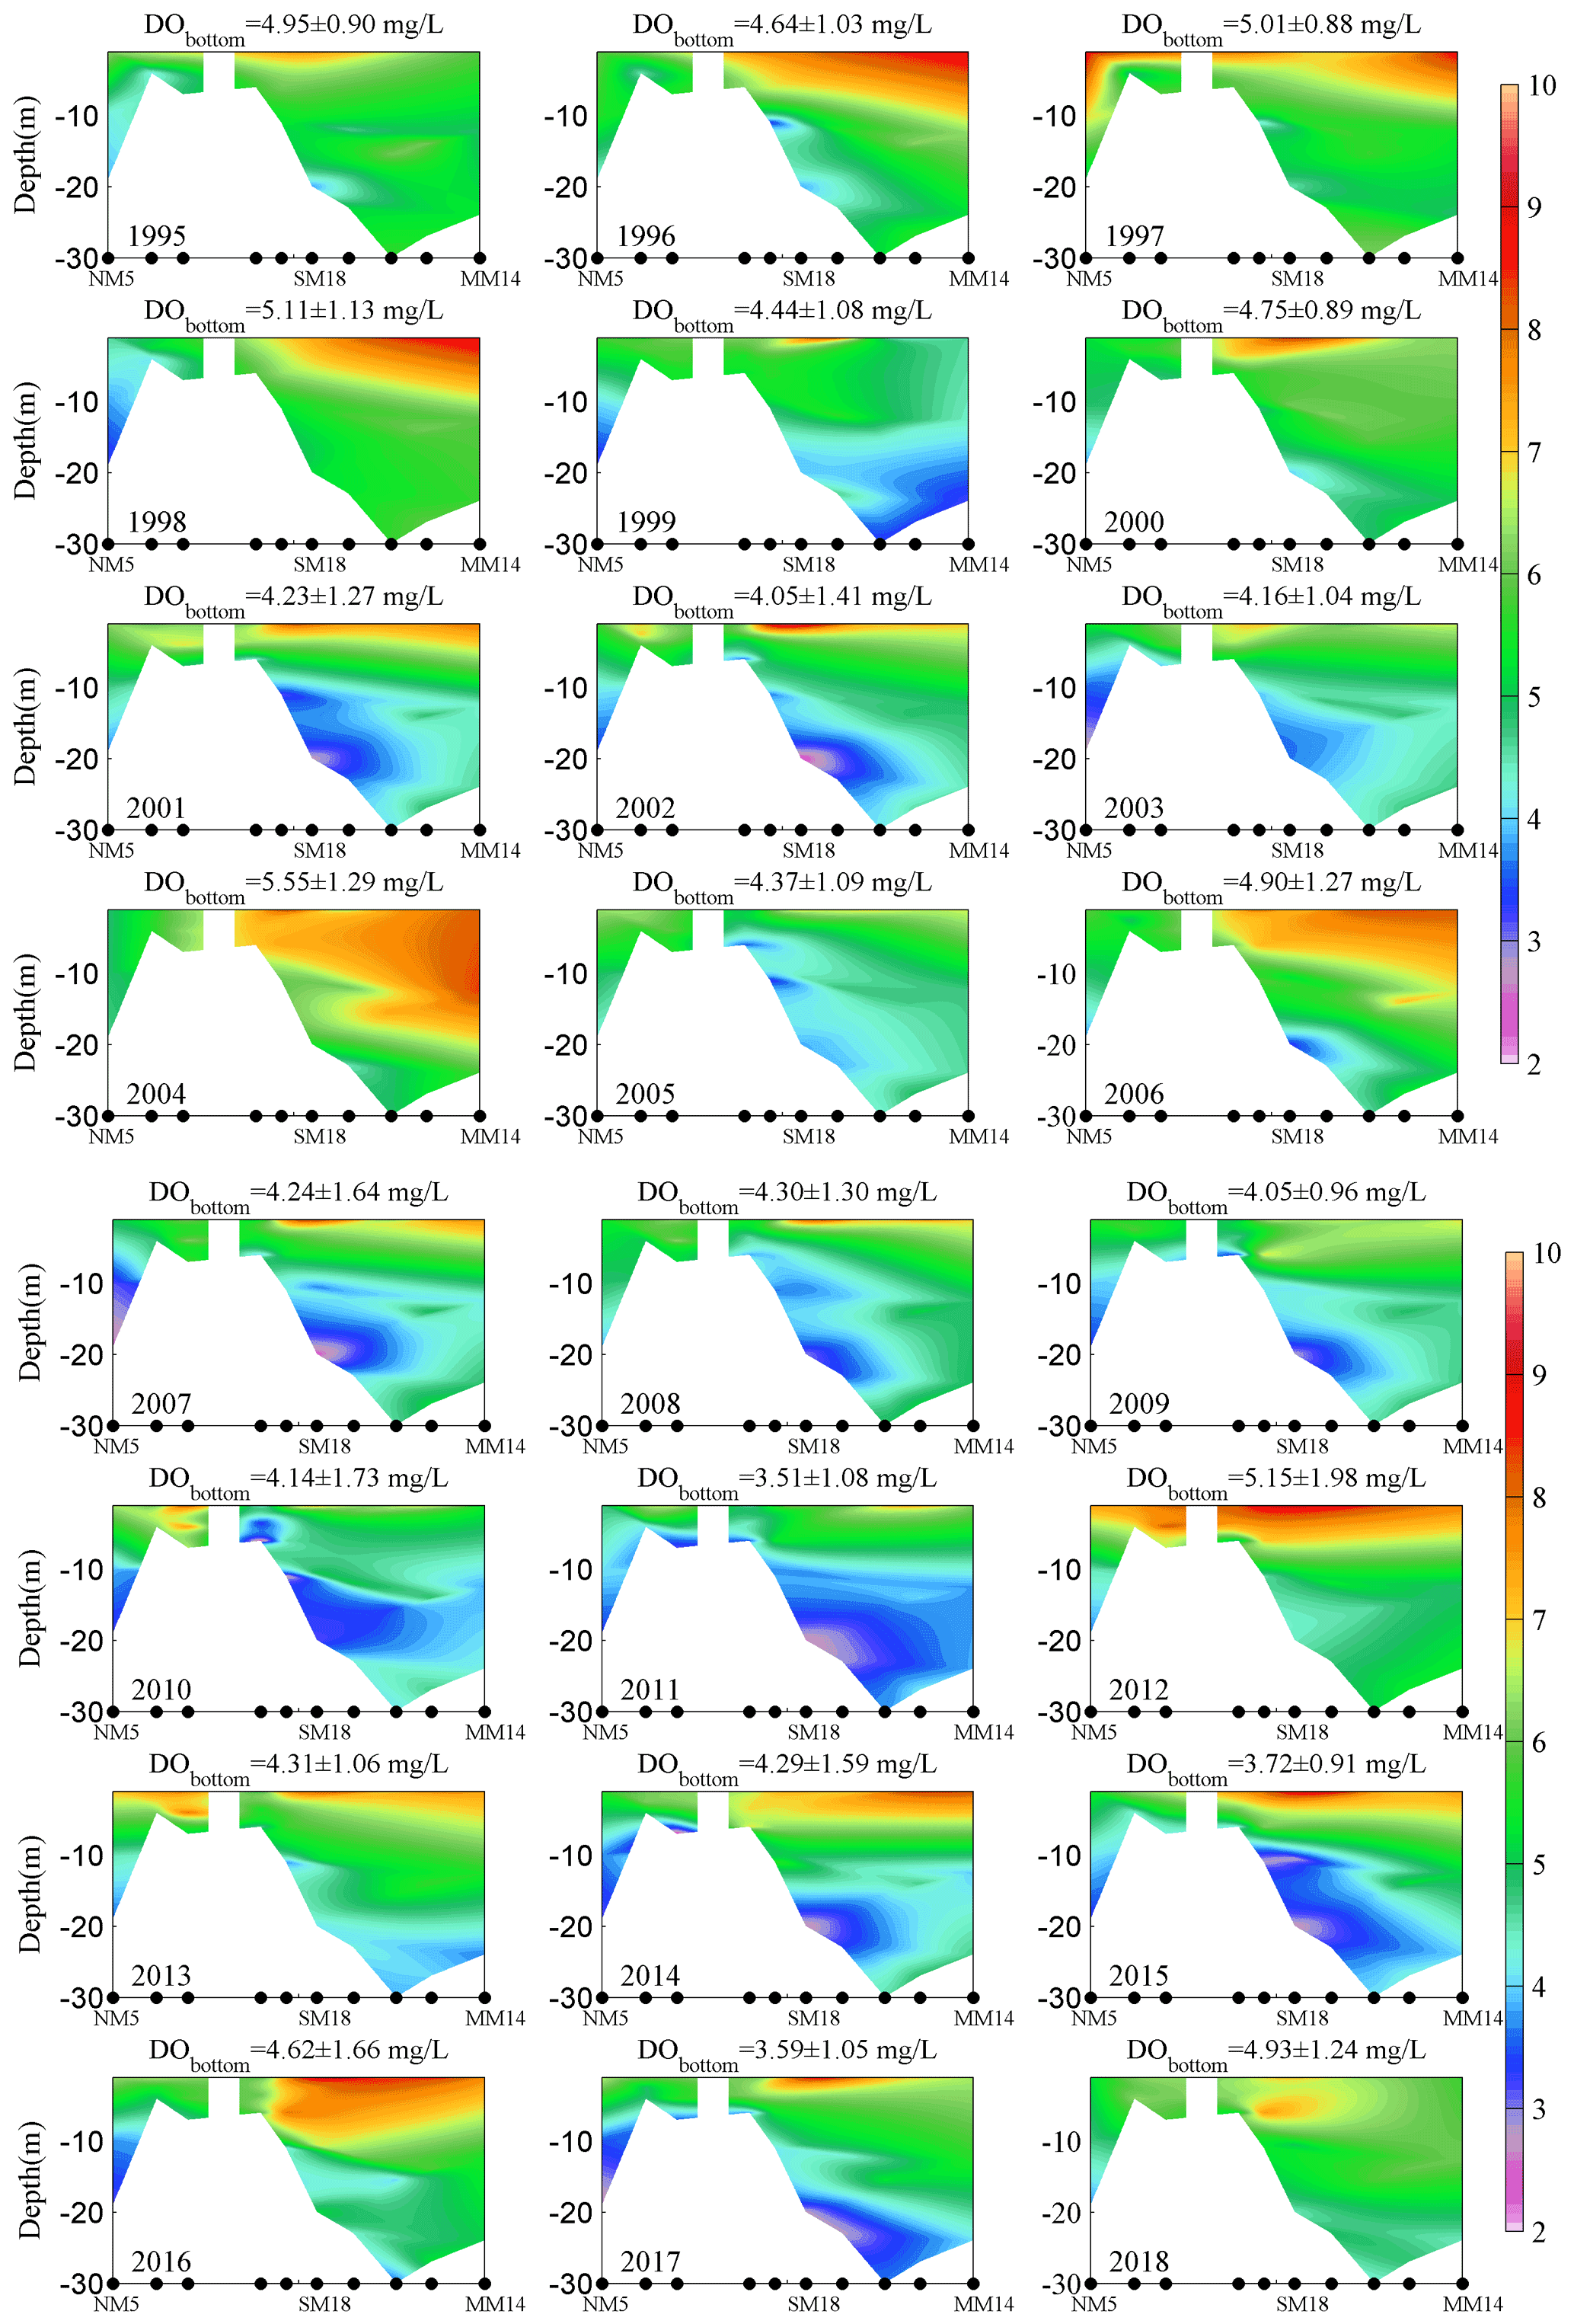
Figure A1Vertical distributions of average DO of all summer cruises (3 months). Note that the mean values and standard deviations of bottom-water DO are also shown at the top of each subplot.
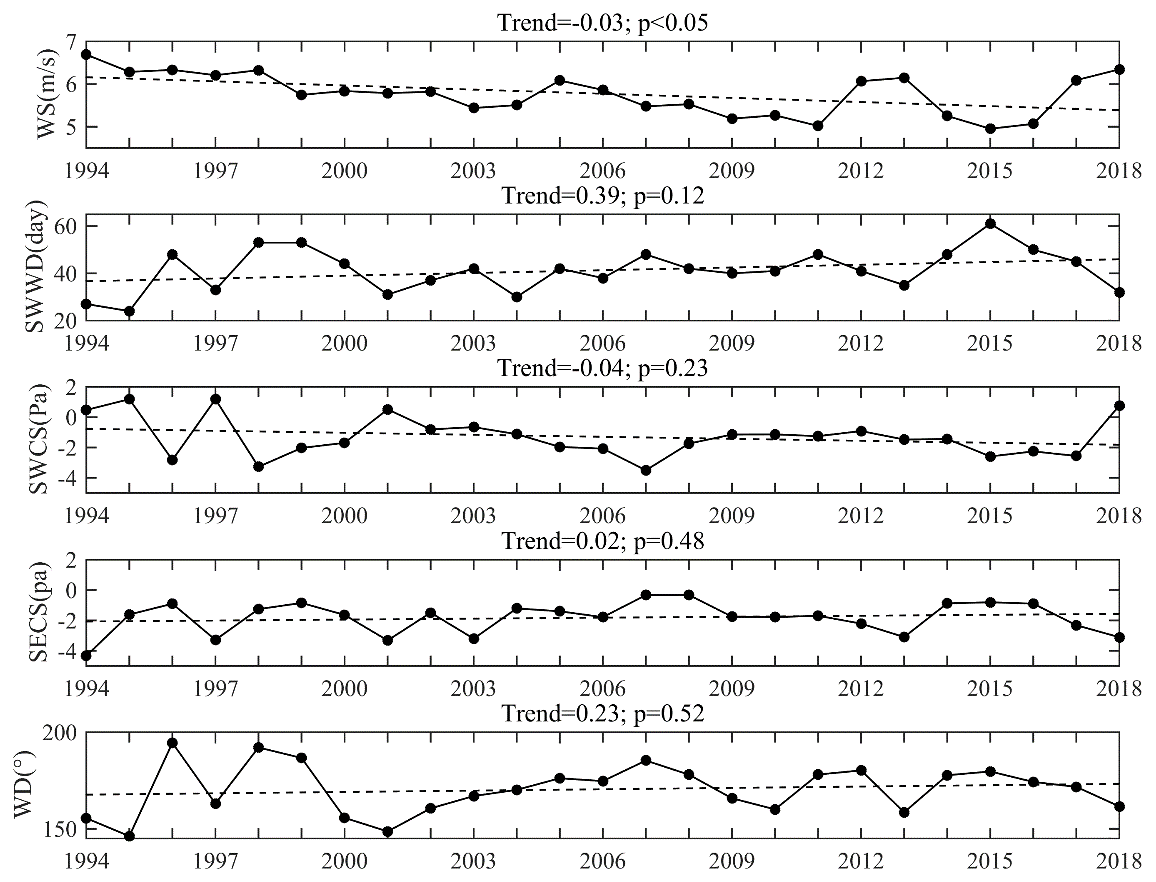
Figure A2Average wind speed (WS), southwestern wind duration (SWWD), southwestern wind cumulative stress (SWCS), southeastern wind cumulative stress (SECS), average wind direction (WD) in summer, and their long-term trends during 1994–2018. Note that the negative values of SWCS and SECS represent southwestern and southeastern wind, respectively. The trends and significant p values are shown in the title of each subgraph.
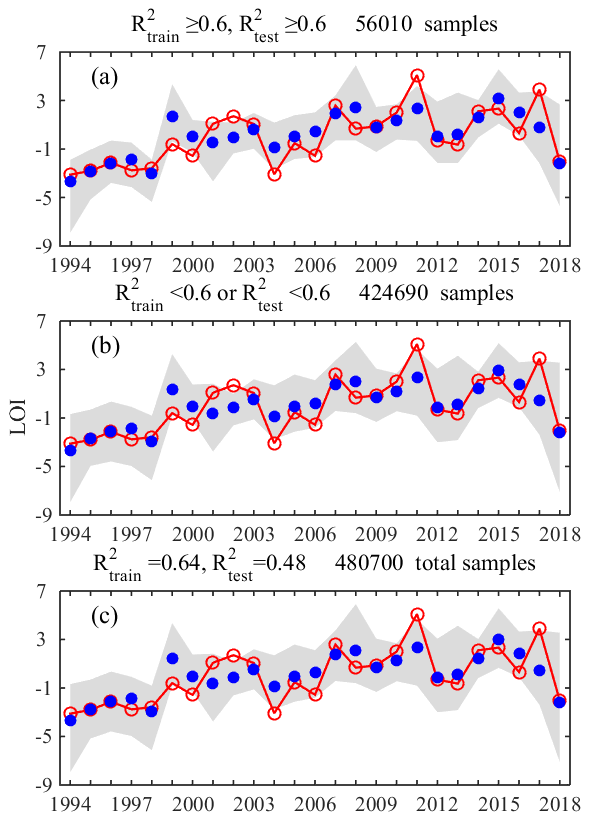
Figure A3Combined fitting results of the regression models with different combinations of training and testing datasets. R2 values in (a) were greater than or equal to 0.6 both in the training and testing datasets. R2 values in (b) were less than 0.6 both in the training and testing datasets. Fitting results of total samples were in (c). Note that the hollow red dots denote the LOI estimated based on observational data, while the solid blue dots and the gray patch represent the mean values and ranges of the fitted LOI in the selected regression cases, respectively.

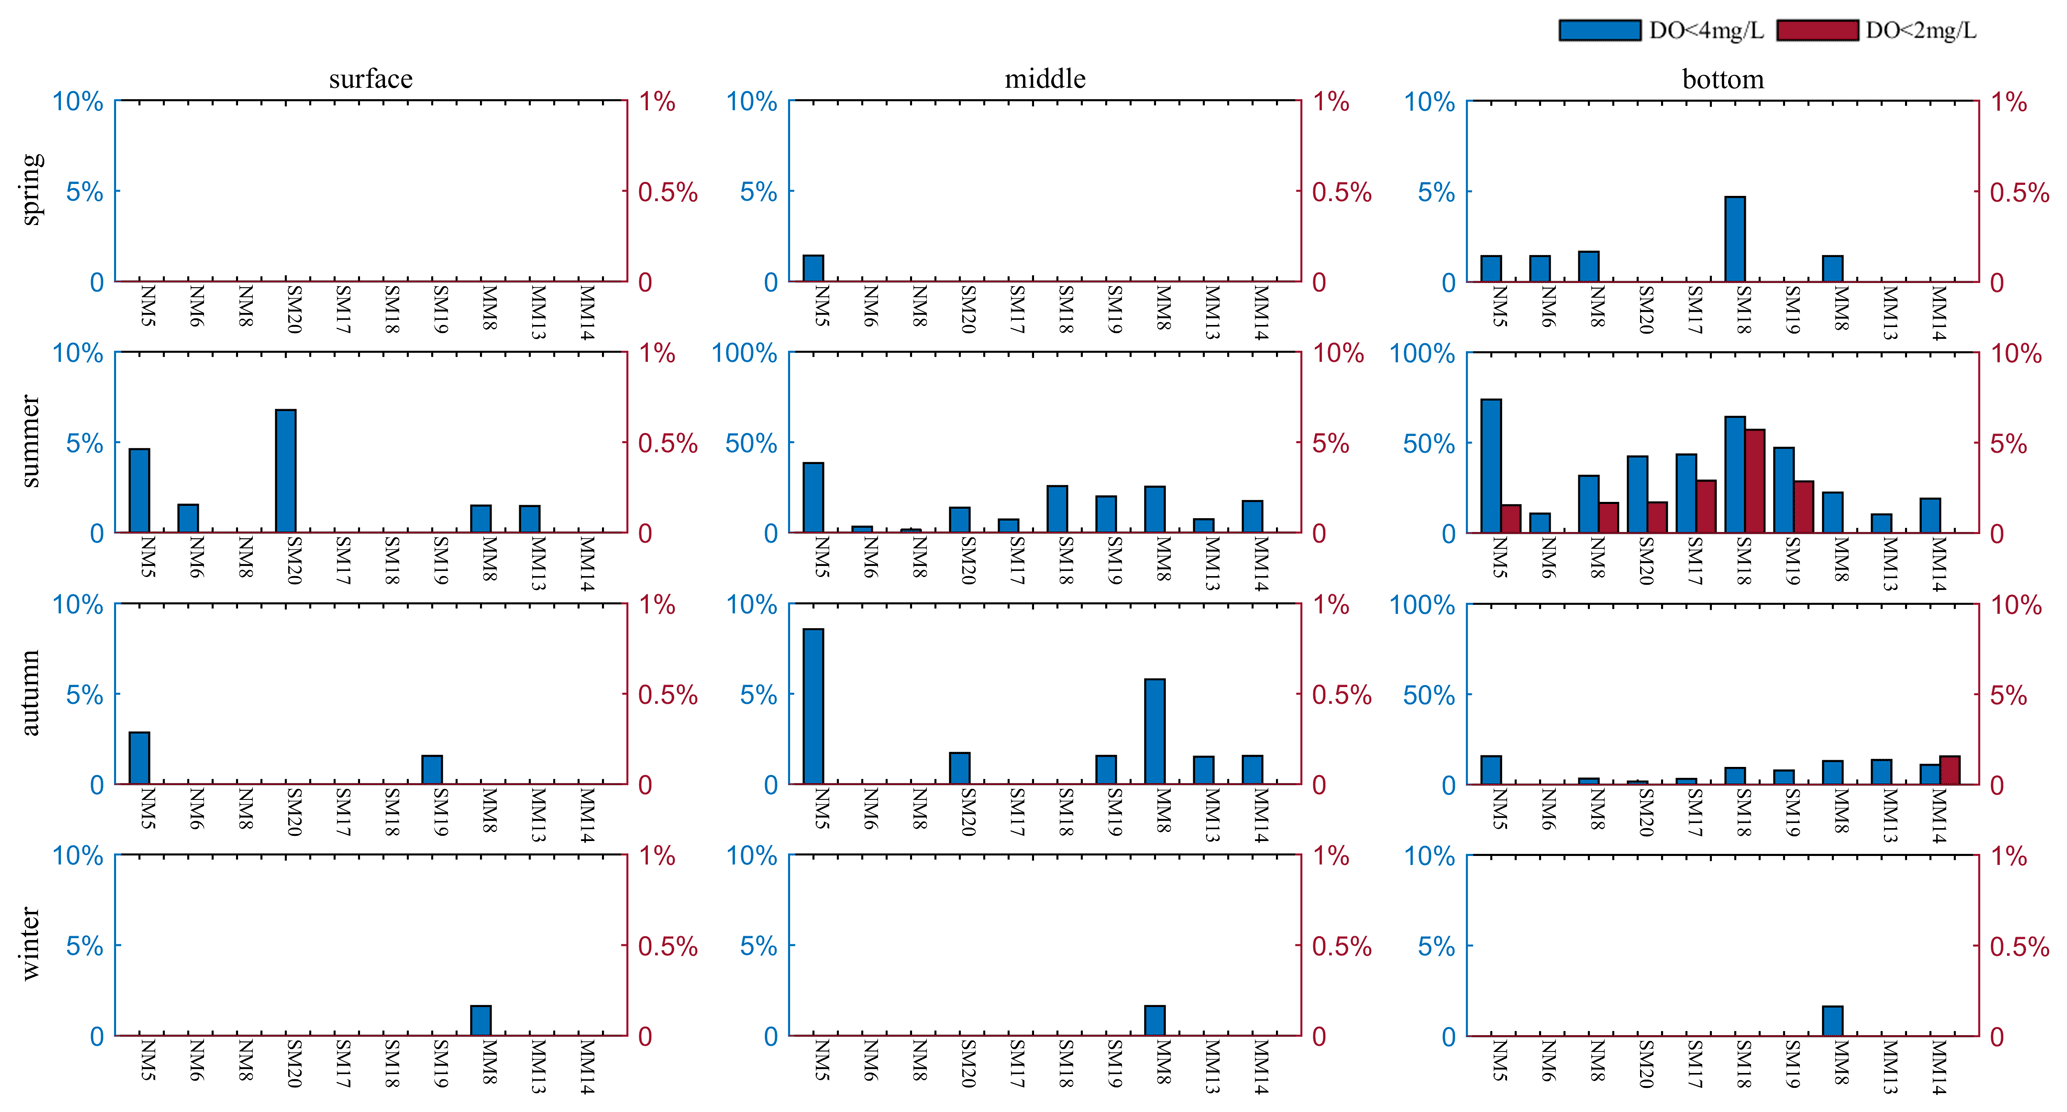
Figure A5Frequencies of occurrence of low-oxygen and hypoxic events during four seasons in the surface, middle, and bottom layers.
The marine water quality data and the sediment data during 1994–2018 from the HKEPD are available at https://www.epd.gov.hk/epd/epic/english/epichome.html (Environmental Protection Department, 2021), while the daily wind observation data from Waglan Island automatic weather station are available at https://www.hko.gov.hk/sc/cis/climat.htm (Hong Kong Observatory, 2021). Daily discharge data of hydrological stations (i.e., Gaoyao, Shijiao, and Boluo) can be collected at http://www.zwswj.com/cms/webfile/waterInfo/index.html, (last access: 29 December 2021) and the monthly discharge data are available at https://doi.org/10.5281/zenodo.6859871 (Chen, 2022).
Conceptualization of the study was carried out by JH. ZC completed the data analysis and graphic visualization. This work was supervised by JH and SL. ZC wrote the paper with contributions from BW, CX, ZZ, SL, and JH. All co-authors contributed to the reviewing and editing of the manuscript, especially JH and BW.
The contact author has declared that none of the authors has any competing interests.
Publisher’s note: Copernicus Publications remains neutral with regard to jurisdictional claims in published maps and institutional affiliations.
We would like to express gratitude to the Environmental Protection Department of Hong Kong, the Waglan Island automatic weather station of the Hong Kong Observatory, and the Pearl River Water Resources Commission of the Ministry of Water Resources for sharing the monitoring data.
This research has been supported by the National Natural Science Foundation of China-Guangdong Joint Fund (grant no. U1901209).
This paper was edited by Kenneth Rose and reviewed by two anonymous referees.
Bordovskiy, O. K.: Sources of organic matter in marine basins, Mar. Geol., 3, 5–31, https://doi.org/10.1016/0025-3227(65)90003-4, 1965.
Breitburg, D., Levin, L., Oschlies, A., Grégoire, M., Chavez, F., Conley, D., Garcon, V., Gilbert, D., Gutiérrez, D., Isensee, K., Jacinto, G., Limburg, K., Montes, I., Naqvi, S. W. A., Pitcher, G., Rabalais, N., Roman, M., Rose, K., Seibel, B., and Zhang, J.: Declining oxygen in the global ocean and coastal waters, Science, 359, 1–13, https://doi.org/10.1126/science.aam7240, 2018.
Jolliffe, I. T. and Cadima, J.: Principal component analysis: a review and recent developments, Philos. T. R. Soc. Math. Phys. Eng. Sci., 374, 20150202, https://doi.org/10.1098/rsta.2015.0202, 2016.
Chen, J., Wang, Z., Tam, C.-Y., Lau, N.-C., Lau, D.-S. D., and Mok, H.-Y.: Impacts of climate change on tropical cyclones and induced storm surges in the Pearl River Delta region using pseudo-global-warming method, Scientific Reports, 10, 1965, https://doi.org/10.1038/s41598-020-58824-8, 2020.
Chen, Z.: The long-term monthly discharge data of hydrological stations in the Pearl River during 1994–2018, Zenodo [data set], https://doi.org/10.5281/zenodo.6859871, 2022.
Chi, L., Song, X., Yuan, Y., Wang, W., Cao, X., Wu, Z., and Yu, Z.: Main factors dominating the development, formation and dissipation of hypoxia off the Changjiang Estuary (CE) and its adjacent waters, China, Environ. Pollut., 265, 115066, https://doi.org/10.1016/j.envpol.2020.115066, 2020.
Conley, D., Carstensen, J., Aigars, J., Axe, P., Bonsdorff, E., Eremina, T., Haahti, B.-M., Humborg, C., Jonsson, P., Kotta, J., Lännegren, C., Larsson, U., Maximov, A., Medina, M., Lysiak-Pastuszak, E., Remeikaitė-Nikienė, N., Walve, J., Wilhelms, S., and Zillén, L.: Hypoxia is increasing in the coastal zone of the Baltic Sea, Environ. Sci. Technol., 45, 6777–6783, https://doi.org/10.1021/es201212r, 2011.
Cui, Y., Wu, J. X., Ren, J., and Xu, J.: Physical dynamics structures and oxygen budget of summer hypoxia in the Pearl River Estuary: Dynamical structures and oxygen budget of hypoxia, Limnol. Oceanogr., 64, 131–148, https://doi.org/10.1002/lno.11025, 2018.
Dai, M., Zhai, W., Cai, W.-J., Callahan, J., Huang, B., Shang, S., Huang, T., Li, X., Lu, Z., Chen, W., and Chen, Z.: Effects of an estuarine plume-associated bloom on the carbonate system in the lower reaches of the Pearl River estuary and the coastal zone of the northern South China Sea, Cont. Shelf Res., 28, 1416–1423, https://doi.org/10.1016/j.csr.2007.04.018, 2008.
Diaz, R. J. and Rosenberg, R.: Spreading dead zones and consequences for marine ecosystems, Science, 321, 926–929, https://doi.org/10.1126/science.1156401, 2008.
Feng, Y., DiMarco, S. F., and Jackson, G. A.: Relative role of wind forcing and riverine nutrient input on the extent of hypoxia in the northern Gulf of Mexico, Geophys. Res. Lett., 39, L09601, https://doi.org/10.1029/2012GL051192, 2012.
Feng, Y., Fennel, K., Jackson, G. A., DiMarco, S. F., and Hetland, R. D.: A model study of the response of hypoxia to upwelling-favorable wind on the northern Gulf of Mexico shelf, J. Marine Syst., 131, 63–73, https://doi.org/10.1016/j.jmarsys.2013.11.009, 2014.
Fennel, K. and Testa, J.: Biogeochemical Controls on Coastal Hypoxia, Annu. Rev. Mar. Sci., 11, 105–130, https://doi.org/10.1146/annurev-marine-010318-095138, 2018.
Forrest, D., Hetland, R., and Dimarco, S.: Multivariable statistical regression models of the areal extent of hypoxia over the Texas-Louisiana Shelf, Environ. Res. Lett., 6, 045002, https://doi.org/10.1088/1748-9326/6/4/045002, 2011.
Gao, N., Ma, Y., Zhao, M., Zhang, L., Zhan, H., and He, Q.: Quantile Analysis of Long-Term Trends of Near-Surface Chlorophyll-a in the Pearl River Plume, Water, 12, 1662, https://doi.org/10.3390/w12061662, 2020.
Hu, J., Zhang, Z., Wang, B., and Huang, J.: Long-term spatiotemporal variations in and expansion of low-oxygen conditions in the Pearl River estuary: a study synthesizing observations during 1976–2017, Biogeosciences, 18, 5247–5264, https://doi.org/10.5194/bg-18-5247-2021, 2021.
Justić, D., Rabalais, N., and Turner, R.: Simulated Responses of the Gulf of Mexico Hypoxia to Variations in Climate and Anthropogenic Nutrient Loading, J. Marine Syst., 42, 115–126, https://doi.org/10.1016/S0924-7963(03)00070-8, 2003.
Laurent, A. and Fennel, K.: Time-evolving, spatially explicit forecasts of the Northern Gulf of Mexico hypoxic zone, Environ. Sci. Technol., 53, 14449–14458, https://doi.org/10.1021/acs.est.9b05790, 2019.
Li, D., Gan, J., Hui, C., Yu, L., Liu, Z., Lu, Z., Kao, S.-J., and Dai, M.: Spatiotemporal development and dissipation of hypoxia induced by variable wind-driven shelf circulation off the Pearl River Estuary: Observational and modeling studies, J. Geophys. Res.-Oceans, 126, e2020JC016700, https://doi.org/10.1029/2020JC016700, 2021.
Li, G., Liu, J., Diao, Z., Jiang, X., Li, J., Ke, Z., Shen, P., Ren, L., Huang, L., and Tan, Y.: Subsurface low dissolved oxygen occurred at fresh- and saline-water intersection of the Pearl River estuary during the summer period, Mar. Pollut. Bull., 126, 585–591, https://doi.org/10.1016/j.marpolbul.2017.09.061, 2018.
Li, M., Lee, Y. J., Testa, J. M., Li, Y., Ni, W., Kemp, W. M., and Di Toro, D. M.: What drives interannual variability of hypoxia in Chesapeake Bay: Climate forcing versus nutrient loading?, Geophys. Res. Lett., 43, 2127–2134, https://doi.org/10.1002/2015GL067334, 2016.
Li, X., Lu, C., Zhang, Y., Zhao, H., Wang, J., Liu, H., and Yin, K.: Low dissolved oxygen in the Pearl River estuary in summer: Long-term spatio-temporal patterns, trends, and regulating factors, Mar. Pollut. Bull., 151, 110814, https://doi.org/10.1016/j.marpolbul.2019.110814, 2020.
Ludsin, S. A., Zhang, X., Brandt, S. B., Roman, M. R., Boicourt, W. C., Mason, D. M., and Costantini, M.: Hypoxia-avoidance by planktivorous fish in Chesapeake Bay: Implications for food web interactions and fish recruitment, J. Exp. Mar. Biol. Ecol., 381, S121–S131, https://doi.org/10.1016/j.jembe.2009.07.016, 2009.
Luo, L., Li, S., and Wang, D.: Hypoxia in the Pearl River Estuary, the South China Sea, in July 1999, Aquat. Ecosyst. Health, 12, 418–428, https://doi.org/10.1080/14634980903352407, 2009.
Lu, Z., Gan, J., Dai, M., Liu, H., and Zhao, X.: Joint effects of extrinsic biophysical fluxes and intrinsic hydrodynamics on the formation of hypoxia west off the Pearl River Estuary, J. Geophys. Res.-Oceans, 123, 6241–6259, 2018.
Meier, H. E. M., Eilola, K., Almroth-Rosell, E., Schimanke, S., Kniebusch, M., Höglund, A., Pemberton, P., Liu, Y., Väli, G., and Saraiva, S.: Disentangling the impact of nutrient load and climate changes on Baltic Sea hypoxia and eutrophication since 1850, Clim. Dynam., 53, 1145–1166, https://doi.org/10.1007/s00382-018-4296-y, 2019.
Meyers, P. A. and Ishiwatari, R.: Lacustrine organic geochemistry – an overview of indicators of organic matter sources and diagenesis in lake sediments, Org. Geochem., 20, 867–900, https://doi.org/10.1016/0146-6380(93)90100-P, 1993.
Murphy, R., Kemp, W., and Ball, W.: Long-Term Trends in Chesapeake Bay Seasonal Hypoxia, Stratification, and Nutrient Loading, Estuar. Coast., 34, 1293–1309, https://doi.org/10.1007/s12237-011-9413-7, 2011.
Ni, W., Li, M., Ross, A. C., and Najjar, R. G.: Large Projected Decline in Dissolved Oxygen in a Eutrophic Estuary Due to Climate Change, J. Geophys. Res.-Oceans, 124, 8271–8289, https://doi.org/10.1029/2019JC015274, 2019.
Ni, W., Li, M., and Testa, J. M.: Discerning effects of warming, sea level rise and nutrient management on long-term hypoxia trends in Chesapeake Bay, Sci. Total Environ., 737, 139717, https://doi.org/10.1016/j.scitotenv.2020.139717, 2020.
Obenour, D., Scavia, D., Rabalais, N., Turner, R., and Michalak, A.: Retrospective Analysis of Midsummer Hypoxic Area and Volume in the Northern Gulf of Mexico, 1985–2011, Environ. Sci. Technol., 47, 9808–9815, https://doi.org/10.1021/es400983g, 2013.
Qian, W., Gan, J., Liu, J., He, B., Lu, Z., Guo, X., Wang, D., Guo, L., Huang, T., and Dai, M.: Current status of emerging hypoxia in a eutrophic estuary: The lower reach of the Pearl River Estuary, China, Estuar. Coast. Shelf S., 205, 58–67, https://doi.org/10.1016/j.ecss.2018.03.004, 2018.
Rabalais, N., Turner, R., and Boesch, D.: A brief summary of hypoxia on the northern Gulf of Mexico continental shelf: 1985–1988, Geo. Soc. S. P., 58, 35–47, https://doi.org/10.1144/GSL.SP.1991.058.01.03, 1991.
Rabalais, N. N., Díaz, R. J., Levin, L. A., Turner, R. E., Gilbert, D., and Zhang, J.: Dynamics and distribution of natural and human-caused hypoxia, Biogeosciences, 7, 585–619, https://doi.org/10.5194/bg-7-585-2010, 2010.
Rabouille, C., Conley, D. J., Dai, M. H., Cai, W. J., Chen, C. T. A., Lansard, B., Green, R., Yin, K., Harrison, P. J., Dagg, M., and McKee, B.: Comparison of hypoxia among four river-dominated ocean margins: The Changjiang (Yangtze), Mississippi, Pearl, and Rhône rivers, Cont. Shelf Res., 28, 1527–1537, https://doi.org/10.1016/j.csr.2008.01.020, 2008.
Raymond, P. and Bauer, J.: Use of 14C and 13C natural abundances for evaluating riverine, estuarine, and coastal DOC and POC sources and cycling: A review and synthesis, Org. Geochem., 32, 469–485, https://doi.org/10.1016/S0146-6380(00)00190-X, 2001.
Shi, Z., Liu, K., Zhang, S., Xu, H., and Liu, H.: Spatial distributions of mesozooplankton biomass, community composition and grazing impact in association with hypoxia in the Pearl River Estuary, Estuar. Coast. Shelf Sci., 225, 106237, https://doi.org/10.1016/j.ecss.2019.05.019, 2019.
Su, J., Dai, M., He, B., Wang, L., Gan, J., Guo, X., Zhao, H., and Yu, F.: Tracing the origin of the oxygen-consuming organic matter in the hypoxic zone in a large eutrophic estuary: the lower reach of the Pearl River Estuary, China, Biogeosciences, 14, 4085–4099, https://doi.org/10.5194/bg-14-4085-2017, 2017.
Sun, J., Lin, B., Li, K., and Jiang, G.: A modelling study of residence time and exposure time in the Pearl River Estuary, China, J. Hydro-Environ. Res., 8, 281–291, https://doi.org/10.1016/j.jher.2013.06.003, 2014.
Testa, J., Murphy, R., Brady, D., and Kemp, W.: Nutrient- and Climate-Induced Shifts in the Phenology of Linked Biogeochemical Cycles in a Temperate Estuary, Front. Mar. Sci., 5, 114, https://doi.org/10.3389/fmars.2018.00114, 2018.
Wang, B., Hu, J., Li, S., and Liu, D.: A numerical analysis of biogeochemical controls with physical modulation on hypoxia during summer in the Pearl River estuary, Biogeosciences, 14, 2979–2999, https://doi.org/10.5194/bg-14-2979-2017, 2017.
Wang, B., Hu, J., Li, S., Yu, L., and Huang, J.: Impacts of anthropogenic inputs on hypoxia and oxygen dynamics in the Pearl River estuary, Biogeosciences, 15, 6105–6125, https://doi.org/10.5194/bg-15-6105-2018, 2018.
Wang, K., Cai, W.-J., Chen, J., Kirchman, D., Wang, B., Fan, W., and Huang, D.: Climate and Human-Driven Variability of Summer Hypoxia on a Large River-Dominated Shelf as Revealed by a Hypoxia Index, Front. Mar. Sci., 8, 634184, https://doi.org/10.3389/fmars.2021.634184, 2021.
Wang, P., Wang, H., and Linker, L.: Relative Importance of Nutrient Load and Wind on Regulating Interannual Summer Hypoxia in the Chesapeake Bay, Estuaries Coasts, 38, 1048–1061, https://doi.org/10.1007/s12237-014-9867-5, 2015.
Wen, G., Liang, Z., Xu, X., Cao, R., Wan, Q., Ji, G., Lin, W., Wang, J., Yang, J., and Huang, T.: Inactivation of fungal spores in water using ozone: Kinetics, influencing factors and mechanisms, Water Res., 185, 116218, https://doi.org/10.1016/j.watres.2020.116218, 2020.
Xu, C., Gong, L., Tong, J., Chen, D., and Singh, V.: Analysis of spatial distribution and temporal trend of reference ET in Changjiang catchments, J. Hydrol., 327, 81–93, https://doi.org/10.1016/j.jhydrol.2005.11.029, 2006.
Xu, J., Yin, K. D., Liu, H., Lee, J., Anderson, D., Ho, A., and Harrison, P.: A comparison of eutrophication impacts in two harbours in Hong Kong with different hydrodynamics, J. Marine Syst., 83, 276–286, https://doi.org/10.1016/j.jmarsys.2010.04.002, 2010.
Yin, K., Lin, Z., and Ke, Z.: Temporal and spatial distribution of dissolved oxygen in the Pearl River Estuary and adjacent coastal waters, Cont. Shelf Res., 24, 1935–1948, https://doi.org/10.1016/j.csr.2004.06.017, 2004.
Yu, L., Fennel, K., and Laurent, A.: A modeling study of physical controls on hypoxia generation in the northern Gulf of Mexico, J. Geophys. Res.-Oceans, 120, 5019–5039, https://doi.org/10.1002/2014JC010634, 2015.
Yu, L., Gan, J., Dai, M., Hui, C., Lu, X., and Li, D.: Modeling the role of riverine organic matter in hypoxia formation within the coastal transition zone off the Pearl River Estuary, Limnol. Oceanogr., 66, 452–468, https://doi.org/10.1002/lno.11616, 2021.
Zhang, H. and Li, S.: Effects of physical and biochemical processes on the dissolved oxygen budget for the Pearl River Estuary during summer, J. Marine Syst., 79, 65–88, https://doi.org/10.1016/j.jmarsys.2009.07.002, 2010.
Zhang, T., Chen, Y., and Paw, U. K. T.: Quantifying the impact of climate variables on reference evapotranspiration in Pearl River Basin, China, Hydrolog. Sci. J., 64, 1–13, https://doi.org/10.1080/02626667.2019.1662021, 2019.
Zhang, W., Moriarty, J. M., Wu, H., and Feng, Y.: Response of bottom hypoxia off the Changjiang River Estuary to multiple factors: A numerical study, Ocean Model., 159, 101751, https://doi.org/10.1016/j.ocemod.2021.101751, 2021.
Zhang, X., Ren, Y., Yin, J., Lin, Z., and Zheng, D.: Spatial and temporal variation patterns of reference evapotranspiration across the Qinghai-Tibetan Plateau during 1971–2004, J. Geophys. Res, 114, D15105, https://doi.org/10.1029/2009JD011753, 2009.
Zhou, Y., Scavia, D., and Michalak, A.: Nutrient loading and meteorological conditions explain interannual variability of hypoxia in Chesapeake Bay, Limnol. Oceanogr., 59, 373–384, https://doi.org/10.4319/lo.2014.59.2.0373, 2014.
Zhu, Z., Zhang, J., Wu, Y., Zhang, Y., Lin, J., and Liu, S.: Hypoxia off the Changjiang (Yangtze River) Estuary: Oxygen depletion and organic matter decomposition, Mar. Chem., 125, 108–116, https://doi.org/10.1016/j.marchem.2011.03.005, 2011.