the Creative Commons Attribution 4.0 License.
the Creative Commons Attribution 4.0 License.
 | 26 Aug 2022
Effects of precipitation seasonality, irrigation, vegetation cycle and soil type on enhanced weathering – modeling of cropland case studies across four sites
Giuseppe Cipolla
Salvatore Calabrese
Amilcare Porporato
Leonardo V. Noto
Enhanced weathering (EW) is a promising strategy for carbon sequestration, but several open questions remain regarding the actual rates of dissolution in conditions of natural hydroclimatic variability in comparison to laboratory experiments. In this context, models play a pivotal role, as they allow exploring and predicting EW dynamics under different environmental conditions. Here a comprehensive hydro-biogeochemical model has been applied to four cropland case studies (i.e., Sicily and the Padan plain in Italy and California and Iowa in the USA) characterized by different rainfall seasonality, vegetation (i.e., wheat for Sicily and California and corn for the Padan plain and Iowa), and soil type to explore their influence on dissolution rates. The results reveal that rainfall seasonality and irrigation when applied are crucial in determining EW and carbon sequestration dynamics, given their effect on hydrological fluxes, soil pH and weathering rate. The carbon sequestration rate was found to be strongly affected also by the background weathering flux, which is one of the main factors controlling soil pH before the olivine amendment. Regarding the US case studies, Iowa sequesters the greatest amount of CO2 if compared to California (4.20 and 2.21 kg ha−1 yr−1, respectively), and the same happens for Sicily with respect to the Padan plain (0.62 and 0.39 kg ha−1 yr−1, respectively). These low carbon sequestration values suggest that an in-depth analysis at the global scale is required to assess EW efficacy for carbon sequestration.
- Article
(6827 KB) - Full-text XML
- BibTeX
- EndNote


Enhanced weathering (EW) is considered one of the most promising carbon dioxide removal (CDR) technologies to mitigate climate change (Ramos et al., 2022; Gomez-Casanovas et al., 2021; Russell et al., 2012). Many studies, mainly based on laboratory experiments and modeling approaches, demonstrated a great carbon sequestration potential when applied over large scales (Beerling et al., 2020; Cipolla et al., 2021a, b; Renforth et al., 2015; Goll et al., 2021; Lewis et al., 2021). EW consists of enhancing naturally occurring weathering reaction rates by adding highly reactive minerals, such as Ca–Mg silicates, to the soil (Hartmann et al., 2013; Lal et al., 2021). Reacting with CO2, silicate grains allow for the formation of dissolved bicarbonates () and carbonates (), which can precipitate as carbonates in the soil or at any stage during their transport from land to ocean. Many studies discuss using olivine (often modeled as the endmember forsterite, Mg2SiO4, or fayalite, Fe2SiO4, although the former is the most common mineral that dissolves and reacts faster with CO2) in EW applications (Köhler et al., 2010; ten Berge et al., 2012). This mineral can be found in igneous rocks, such as volcanic (i.e., basalt), plutonic (i.e., gabbro) and mostly in ultramafic rocks, which can have up to 95 % of olivine and are widely distributed across the globe. Additionally, olivine is characterized by relatively fast dissolution rates if compared to other silicate minerals, such as albite and orthoclase (Hartmann et al., 2013).
Despite the increasing attention to EW, a knowledge gap exists about the actual rates and efficiency of EW applications for carbon sequestration in actual field conditions. The technological readiness of EW is currently limited to pilot-scale experiments (Asibor et al., 2021) and quotes the large uncertainties in scaling up laboratory results to field scale (Strefler et al., 2018). The most common elements of uncertainty regard the formation of secondary minerals, the alteration of soil hydrological properties due to silicate amendments (i.e., the formation of the preferential flow path in soil pores) and the effect of the biotic complements (e.g., fungi and bacteria) that, depending on soil pH, may accelerate or slow down the organic matter decomposition and in turn silicates dissolution rates (Vicca et al., 2022).
To begin to address these uncertainties, several experimental approaches have been carried out to characterize olivine or any other Ca–Mg-silicate mineral (such as wollastonite) used for EW dissolution dynamics. These are mainly based on laboratory experiments conducted on single mineral particles (Oelkers et al., 2018; Pokrovsky and Schott, 2000; Peters et al., 2004), as well as laboratory experiments involving soil cores/columns amended with silicate rock powder (SRP), under controlled temperature and irrigation conditions, without biological processes (Renforth et al., 2015; Dietzen et al., 2018), mesocosm or pot experiments, where plants and/or soil organisms are added to larger containers of soil with SRP, representing more closely “real-life” conditions whilst still being a closed and controlled system (ten Berge et al., 2012; Amann et al., 2020; Kelland et al., 2020), and field trials, where SRP is added to real croplands, grasslands or forests, thus simulating the complex real-life conditions (Taylor et al., 2021; Haque et al., 2020 using wollastonite). Amann et al. (2020) realized a mesocosm experiment adding olivine to agricultural loamy sand, extracted from a field in Belgium. The experiment considered the most common crops in that area, i.e., wheat and barley, and focused on both well-watered and water-stressed conditions, secondary mineral formation, cation exchange, and the formation of preferential flow paths. The effects of olivine amendment were assessed by monitoring the chemical characteristics of soil water, particularly looking at the pH, magnesium, and silica concentrations as well as dissolved inorganic carbon (DIC). The achieved weathering rates, expressed in moles of dissolved olivine per unit of specific surface of the mineral and time, were on the order of 10−13 mol m−2 s−1, corresponding to carbon sequestration rates of 23 and 49 kg CO2 ha−1 yr−1, where ha refers to land surface over which mineral dust is spread. Weathering rates in actual field conditions are much lower than those derived in laboratory setups (Palandri and Kharaka, 2004; Rimstidt, 2015) and soil column experiments under controlled conditions (Renforth et al., 2015; ten Berge et al., 2012), underlying the discrepancy between lab and field conditions, which is generally due to an ensemble of intrinsic (e.g., shape and roughness of mineral surface particles) and extrinsic (e.g., pH, temperature and soil water content) factors (White and Brantley, 2003; Gruber et al., 2014), which in the laboratory are not easily reproducible.
These uncertainties in weathering rates inevitably affect the evaluation of a realistic carbon sequestration rate of EW. Modeling approaches may be useful to explore the role of soil processes that cannot be easily replicated in laboratory experiments, such as the complexity of cation exchanges or hydroclimatic fluctuations (Cipolla et al., 2021a). Vicca et al. (2022) highlight that only a few models connecting EW dynamics with plants, climate and biogeochemical processes exist. The reactive transport models summarized by Taylor et al. (2017) vary in their degree of complexity, and plant processes may be absent or oversimplified. Lewis et al. (2021) present an application of a 1-D reactive transport model to simulate EW carbon sequestration potential and the release of base cations (i.e., Mg2+, Ca2+, K+ and Na+) that can be beneficial for plants. Like many other reactive transport models, they assume a constant average infiltration rate, thus excluding rainfall variability effects on EW. In their study, the application of 50 t ha−1 of basalt leads to a carbon sequestration potential between 1.3 and 8.5 t CO2 ha−1 after 15 years of amendment. These values, however, are much higher than the one resulting from the experiment of Amann et al. (2020), which represents a situation closer to the field environment. By introducing stochasticity in rainfall and connecting ecohydrological with biogeochemical processes, the model presented in Cipolla et al. (2021a) leads to carbon sequestration rates of the same order of magnitude as those in the mesocosm experiment of Amann et al. (2020), which represents conditions similar to those in the field, despite not being in the full extent of their complexities.
In this study, the model presented in Cipolla et al. (2021a) is applied to four hypothetical case studies (i.e., agricultural applications of EW), two of them in Italy (i.e., Sicily, in the south, and the Padan plain, in the north) and two in the USA (i.e., California, in the south-west, and Iowa, in the north-central area). Many of the model parameters are obtained from measurements (i.e., pH and cation exchange), and achieved weathering rates are then compared with those of Amann et al. (2020), which is currently one of the experiments closest to field conditions. Extending the work of Cipolla et al. (2021b), where the influence of statistically stationary precipitation with different mean annual precipitation (MAP) on EW is analyzed, in this study we focus on the effect of the seasonal variation of the meteorological forcing, irrigation, soil type and crop cycle on EW dynamics. These four regions are characterized by very similar MAP values but much different rainfall seasonality. They also present similar soils and different crop types. The impact of different vegetation cycles is also considered in this study, given that crops contribute to the water balance through evapotranspiration losses differently during the year, depending on the crop stage, and in the carbon balance since they release organic matter (i.e., litter, D'Odorico et al., 2003; Porporato et al., 2003, and root exudation, Shen et al., 2020; Wang et al., 2015) to the soil. Furthermore, differences among the selected places in terms of cation exchange capacity and background weathering flux have been taken into account, given that these factors strongly affect soil pH before olivine amendment (Cipolla et al., 2021a, b). The main goal of this paper is therefore to understand which of the considered factors (i.e., rainfall seasonality, soil type and composition, and crop cycle) is mostly connected to changes in EW time dynamics. We also explore the role of irrigation on EW, only when required based on crop type and climatic condition. Moreover, analyses allow one to define the most suitable combined characteristics of climate, soil and vegetation for EW, while providing important hypotheses to be tested experimentally.
The paper is structured as follows: Sect. 2 presents a description of the adopted methodology and the four places under study, along with the estimation of the parameters related to the above-mentioned factors. Here, an in-depth discussion of the differences in terms of rainfall seasonality, soil and vegetation types is reported. In Sect. 3, EW dynamics at the four considered sites are presented and discussed, highlighting the role of each of the considered factors on EW. Lastly, Sect. 4 is devoted to some final discussions about the potentials and limitations of the present study with a view to further applications and provides some general conclusions.
2.1 Methodology
The analyses presented in this paper employ a mathematical model of EW dynamics developed and presented in Cipolla et al. (2021a), to which we refer for details. It links ecohydrological and biogeochemical processes (Cipolla et al., 2021a, b) and is externally forced by rainfall fluctuations, which can be in the form of an observed time series or, for long-term EW dynamics, a stochastic representation. The model is composed of four closely related components (see Fig. 2 in Cipolla et al., 2021a). Starting from the organic matter decomposition, which provides one of the sources of CO2 in the system, the model accounts for the mass balance of CO2 in the gas and dissolved phases, with particular attention to the released H+, bicarbonate (i.e., ) and carbonate (i.e., ) ions in soil water. A specific component considers the balance of soil water ions released by olivine dissolution (i.e., silicates and magnesium) as well as other base cations (i.e., Ca2+, K+ and Na+) along with their influence on pH. The cation exchange capacity (CEC) accounts for the adsorption process between the dissolved cations and the solid matrix of the soil, composed of organic and inorganic colloids. The model fully accounts for ecohydrological interactions driven by precipitation variability, including the evapotranspiration effect on nutrient cation uptake from vegetation and, in turn, its acidifying effect on the soil, as well as the impacts of leaching rates on ion removal and hence carbon sequestration. All these aspects are translated into an explicit system of eight mass balance differential equations and an implicit system composed of 22 algebraic equations (Cipolla et al., 2021a).
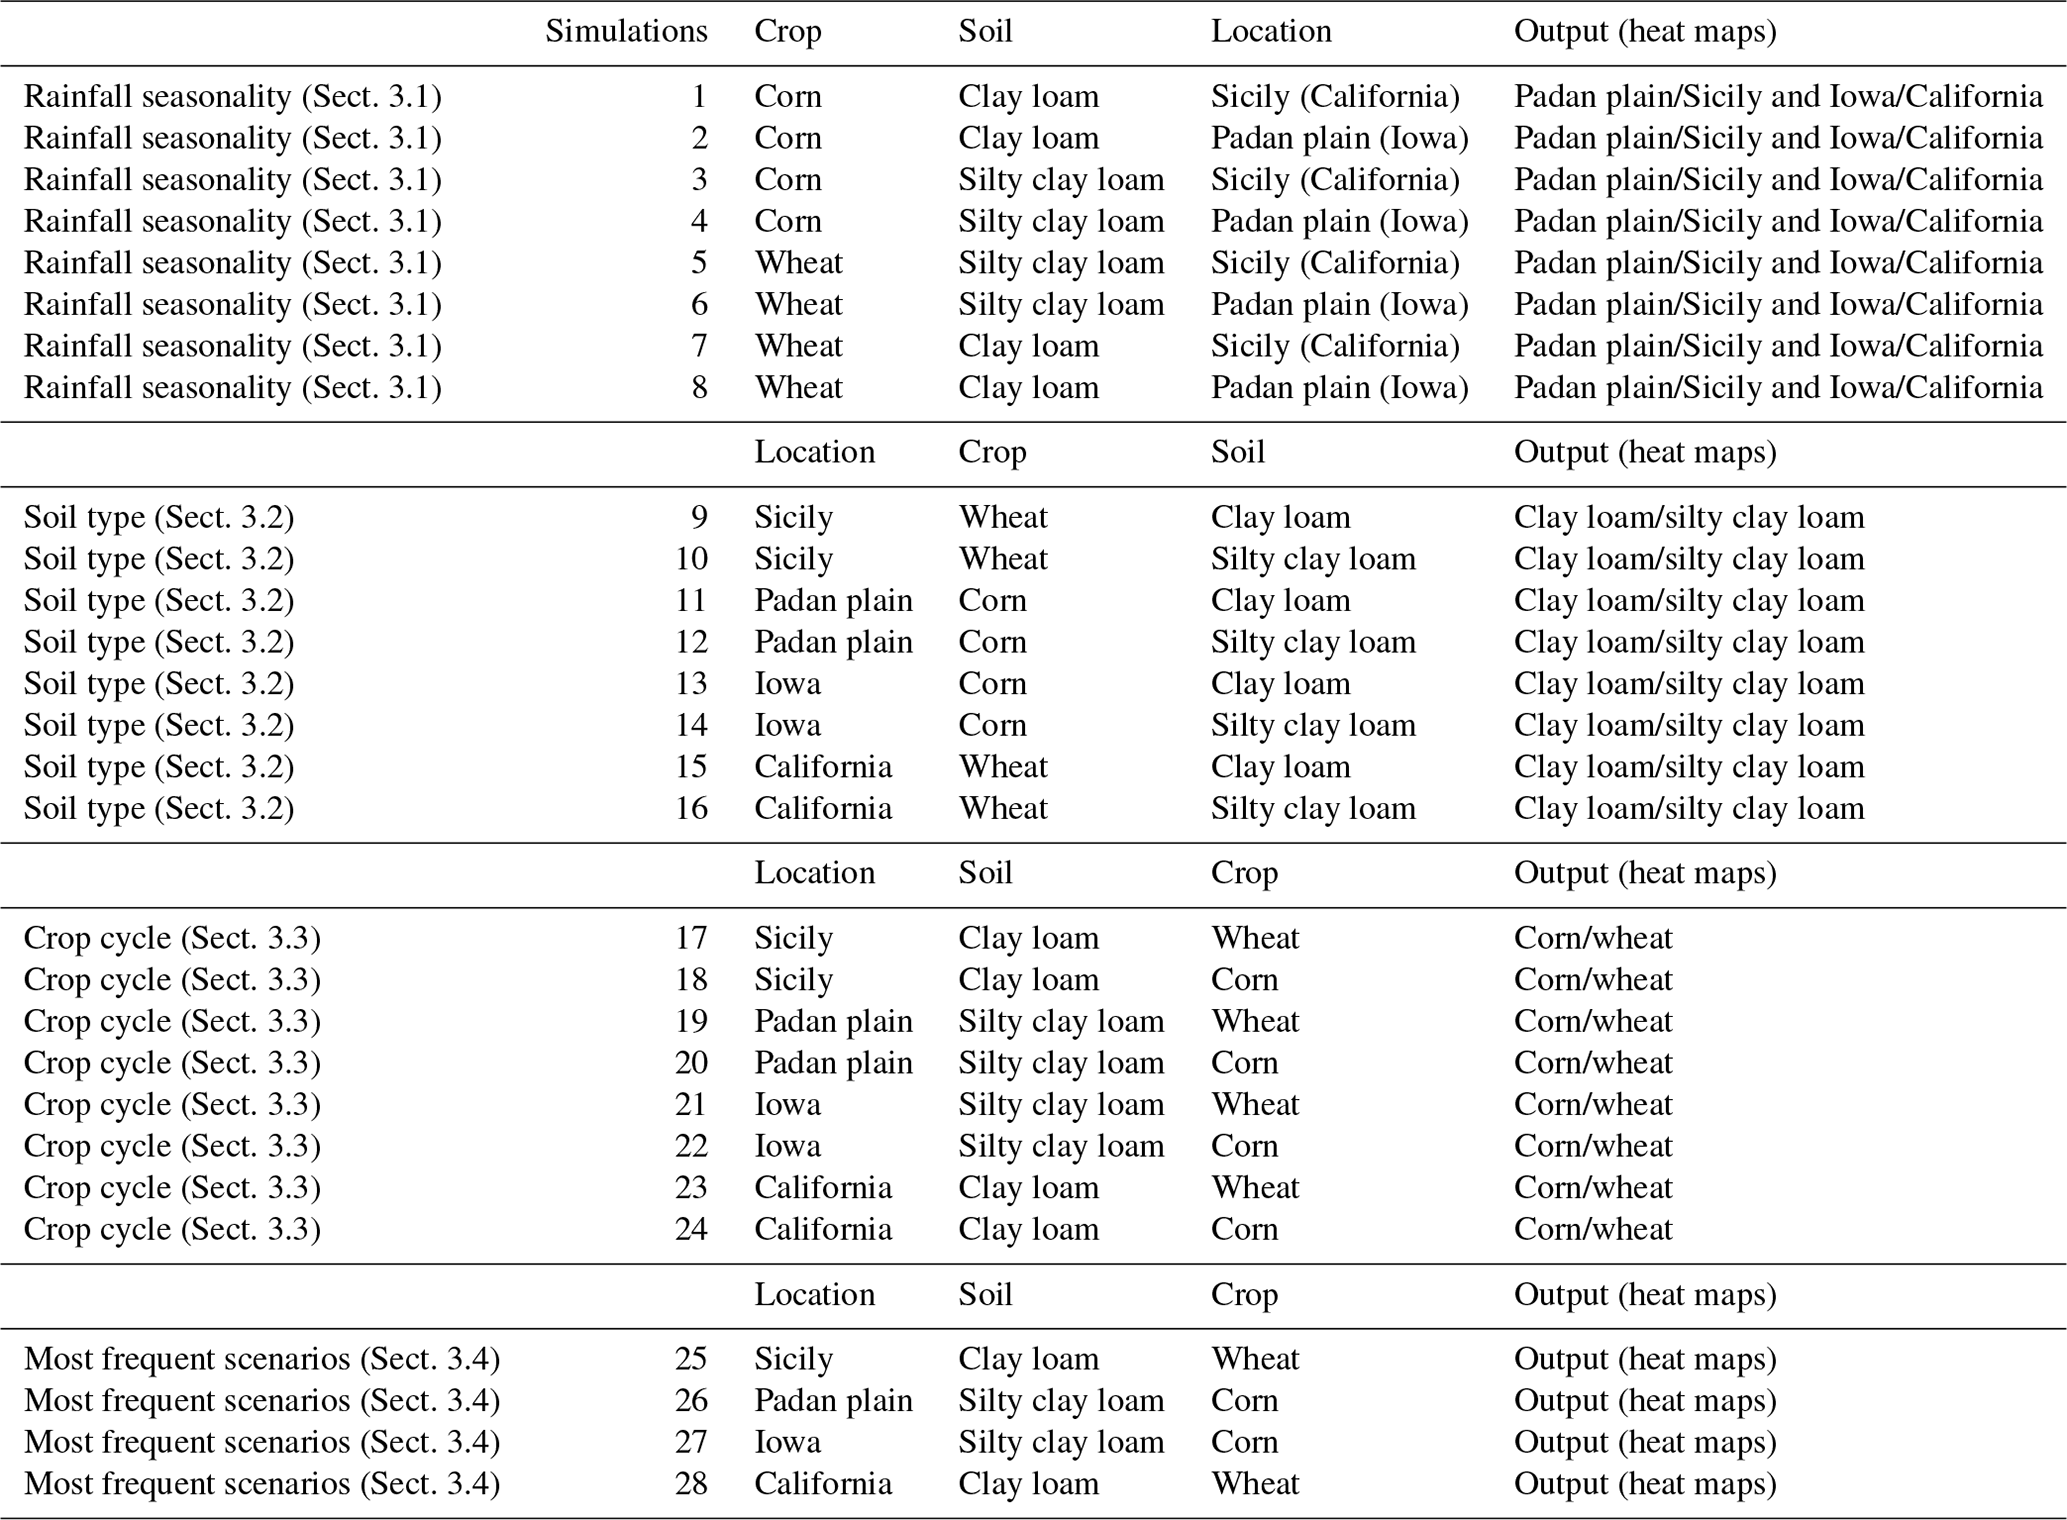
Concerning four specific regions, the case studies presented in the following sections aim to understand which of the factors among rainfall seasonality, soil type and composition, and crop cycle exerts the greatest influence on EW dynamics, in addition to the effects of any irrigation intervention. A flow chart of the methodology employed in this paper is presented in Fig. 1. For the four case studies, rainfall seasonality was characterized by the temporal variability of the average depth and frequency of rainfall events. Soil type and vegetation parameters were characterized by using the spatial distribution of some related variables (i.e., the sand, silt and clay content, organic matter, cation exchange capacity, soil pH, crop type and cycle); see Sect. 2.2. To single out the most important factors on EW dynamics, a combination of numerical experiments was designed to consider different conditions of soil moisture, pH and weathering rates (see Table 1). First, some possible combinations of rainfall seasonality, soil type and crop cycle are taken into account to explore the role of each of them on EW dynamics. The last four simulations presented in Sect. 3.4 are related to the analysis of EW dynamics at the four selected locations, selecting the most frequent combination of soil type and crop cycle with rainfall seasonality. For all the analyzed scenarios, a one-time olivine amendment with a rate of 10 kg m−2 (i.e., 100 t ha−2) was considered. The olivine is assumed to be mixed throughout the whole active root zone depth of the considered crops. All the particles dissolve according to the same rate since the presence of preferential flow paths is not considered. The dissolution of olivine particles is modeled according to the shrinking core model of Lasaga (1984), considering particles as perfect spheres having an initial diameter of 200 µm, since the model considers a single effective diameter, defined as the mean diameter of a particle size distribution, in the name of simplicity. The dissolution rate law is the one presented in Cipolla et al. (2021a), where the weathering rate, expressed in number of moles of dissolved olivine per unit of reactive surface of the mineral and per unit of time, is a function of soil moisture, pH and the ion activity product, which expresses the products of olivine dissolution reaction (i.e., magnesium and silicates) with respect to soil water pH.

Figure 1Flow chart of the employed procedure for the case study of the EW model described in Cipolla et al. (2021a).
Table 1Simulation outline adopted in this study. Here all the explored combinations of the analyzed factors are reported.
2.2 Study areas and data
The case studies refer to two different locations in Italy (i.e., Sicily, in the south, and the Padan plain, in the north) and in the USA (i.e., California, in the south-west, and Iowa, in the north-central area). Figure 2 shows the cropland areas suitable for potential olivine amendment as indicated by Copernicus land cover maps (Buchhorn et al., 2020). For these areas, the most common crops according to the USDA crop production maps (https://ipad.fas.usda.gov/rssiws/al/global_cropprod.aspx, last access: 29 July 2022), namely the wheat for Sicily and California and the corn for the Padan plain and Iowa, are considered. As in Cipolla et al. (2021b), all simulations are related to a unit ground area of homogeneous soil, vegetation and rainfall characteristics, vertically delimited by the active root zone depth of the involved crop, i.e., 40 and 60 cm for the corn and wheat, respectively (Fan et al., 2016).
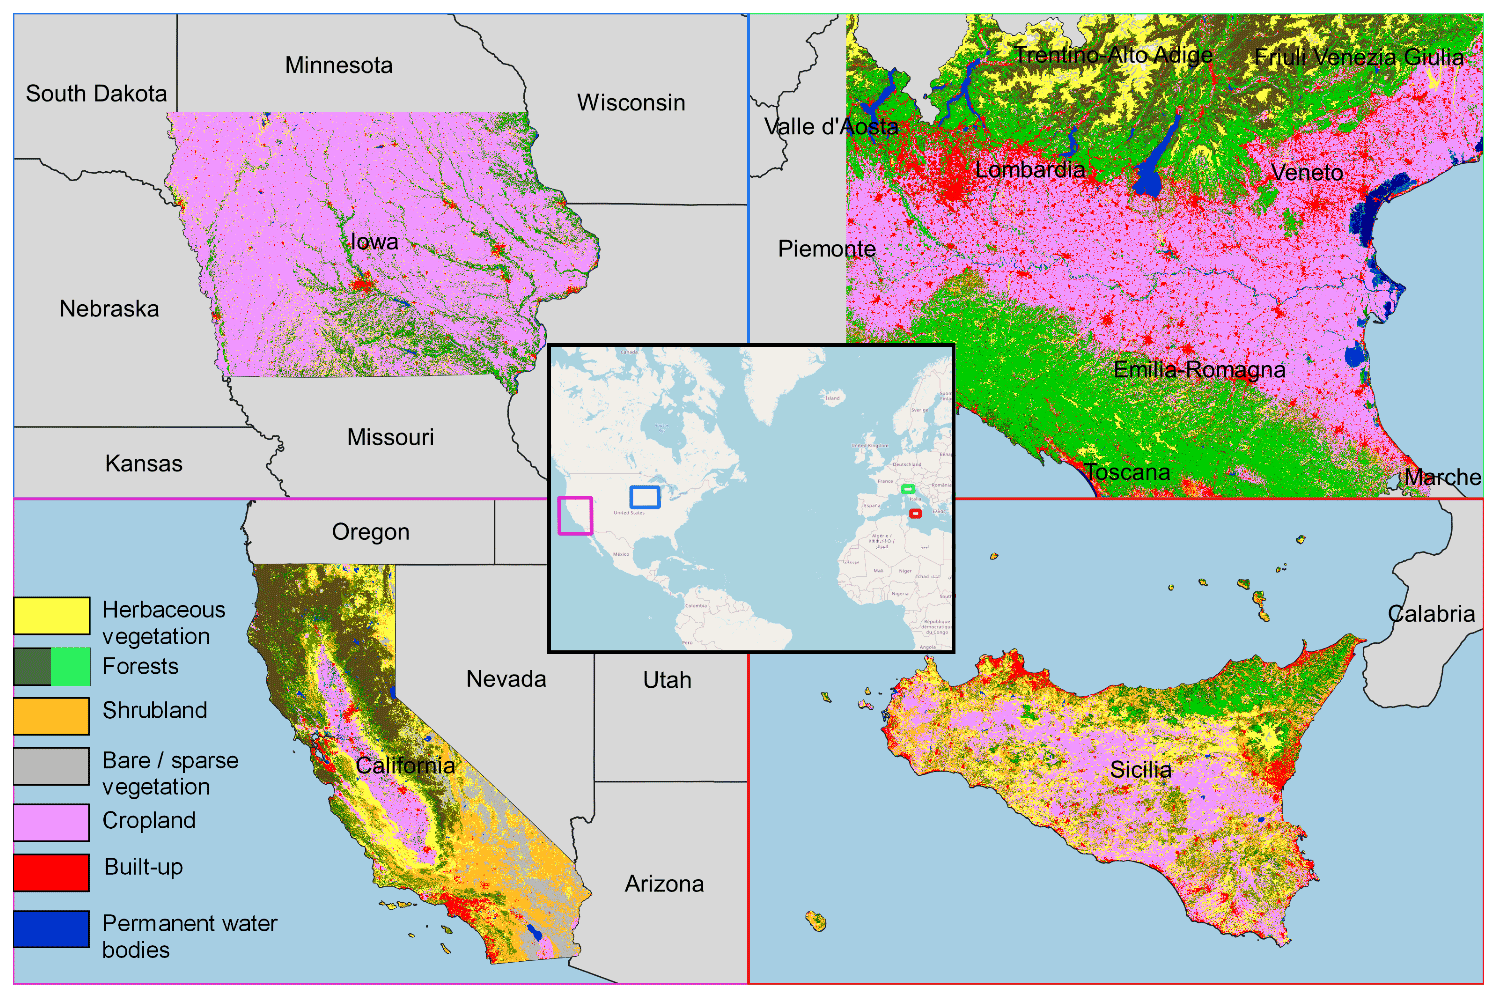
Figure 2Locations of the areas possibly devoted to the olivine amendment in the places under study within the Copernicus land cover maps. In particular, cropland areas in the panels of Padan plain and Iowa are related to corn, while those in the panels of Sicily and California are related to wheat. The central box showing the locations of all the four sites contains the OpenStreetMap as background (© OpenStreetMap contributors 2022. Distributed under the Open Data Commons Open Database License (ODbL) v1.0).
2.2.1 Rainfall seasonality
Following Cipolla et al. (2021a), rainfall is modeled as a marked Poisson process, where the average depth α and the frequency of events λ are defined by the mean rainfall depth and the event frequency, respectively, whose product (if expressed in per year) provides the MAP (Rodriguez-Iturbe et al., 1999). The former, α, represents the average rainfall depth of occurred daily rainy events, while λ is the ratio between the number of rainy days and the total number of days. These parameters have been estimated at a monthly scale from daily rainfall data recorded from 2000 to 2020 by the SIAS (Servizio Informativo Agrometeorologico Siciliano) rain gauge network for Sicily, the Eraclito dataset of ARPA (Agenzia Regionale per la Protezione Ambientale) Emilia Romagna for the Padan plain, and the USGS (United States Geological Survey) for the Iowa and California states. Given the point-scale application of the EW model, data collected by a single rain gauge representative of the area under study have been considered for the analyses. Rainfall parameters α and λ have been obtained on a monthly scale, providing their seasonal variation within the year (see Fig. 3). In particular, Sicily (panel a) and California (panel b) are characterized by a similar pattern of α and λ, since they both reach a minimum during summer months, which are usually rainless, and a peak in winter months, especially between November and January (Cipolla et al., 2020). Regarding the Padan plain (panel c) and Iowa (panel d), rainfall seasonality is less evident than in the other locations, especially in the case of the Padan plain. For the latter, the monthly time series of the two parameters are shifted by about 2 months, while for Iowa the highest values of both α and λ occur during the spring and summer months. These different rainfall seasonality regimes have relevant effects on EW dynamics, especially when considered along with crop phenology and despite the modest MAP differences between sites (i.e., MAP about 600 mm for Sicily and California and 750 mm for the Padan plain and Iowa).

Figure 3Values of the average rainfall depth (α) and frequency (λ) from January (i.e., month indicated with 1) to December (i.e., month indicated with 12) for Sicily (SI), California (CA), Padan plain (PP) and Iowa (IA). The reader is referred to Sect. 2.2.1 for more details.
2.2.2 Irrigation
Since corn is planted in April and concentrates the reproductive and maturity phases during the driest periods in the Mediterranean climate (i.e., Sicily and California), we assumed that an irrigation contribution would be necessary to avoid stress conditions for plants, which would negatively affect productivity. Following previous studies (Vico and Porporato, 2011a, b), stress-avoidance irrigation, a scheme designed to avoid stress conditions for vegetation, has been imposed, activating it when soil moisture becomes less than the point of incipient stress. According to this scheme, an irrigation volume is released to the crop only when the crop coefficient is different than zero and when soil moisture becomes less than or equal to the point of incipient stress. The provided irrigation volume Δs (i.e., the soil moisture gap) is equal to 0.2, but with the condition that soil moisture remains under the value at field capacity, to avoid wasting water due to percolation through deep soils. Figure 4 displays a typical stress-avoidance irrigation scheme for corn planted in a silty clay loam soil in California and the resulting yearly soil moisture and pH time series with and without the irrigation contribution. Here, 14 irrigation interventions, over the 150 d of the vegetation cycle, are needed to bring soil moisture above the point of incipient stress, when there is a lack of rainfall and transpiration losses are significant. The total annual volume of supplied water resulted in about 500 mm. The effects of irrigation are visible in the soil moisture time series (panel c of Fig. 4) since it ranges between the value at incipient stress and the field capacity in days of the year (DOY) 100–250 (i.e., when the crop reproductive and mid-season phases are concentrated). In panel (d) it is visible that irrigation results in a significant reduction of soil pH during the summer season, compared with the case in which no irrigation is provided.
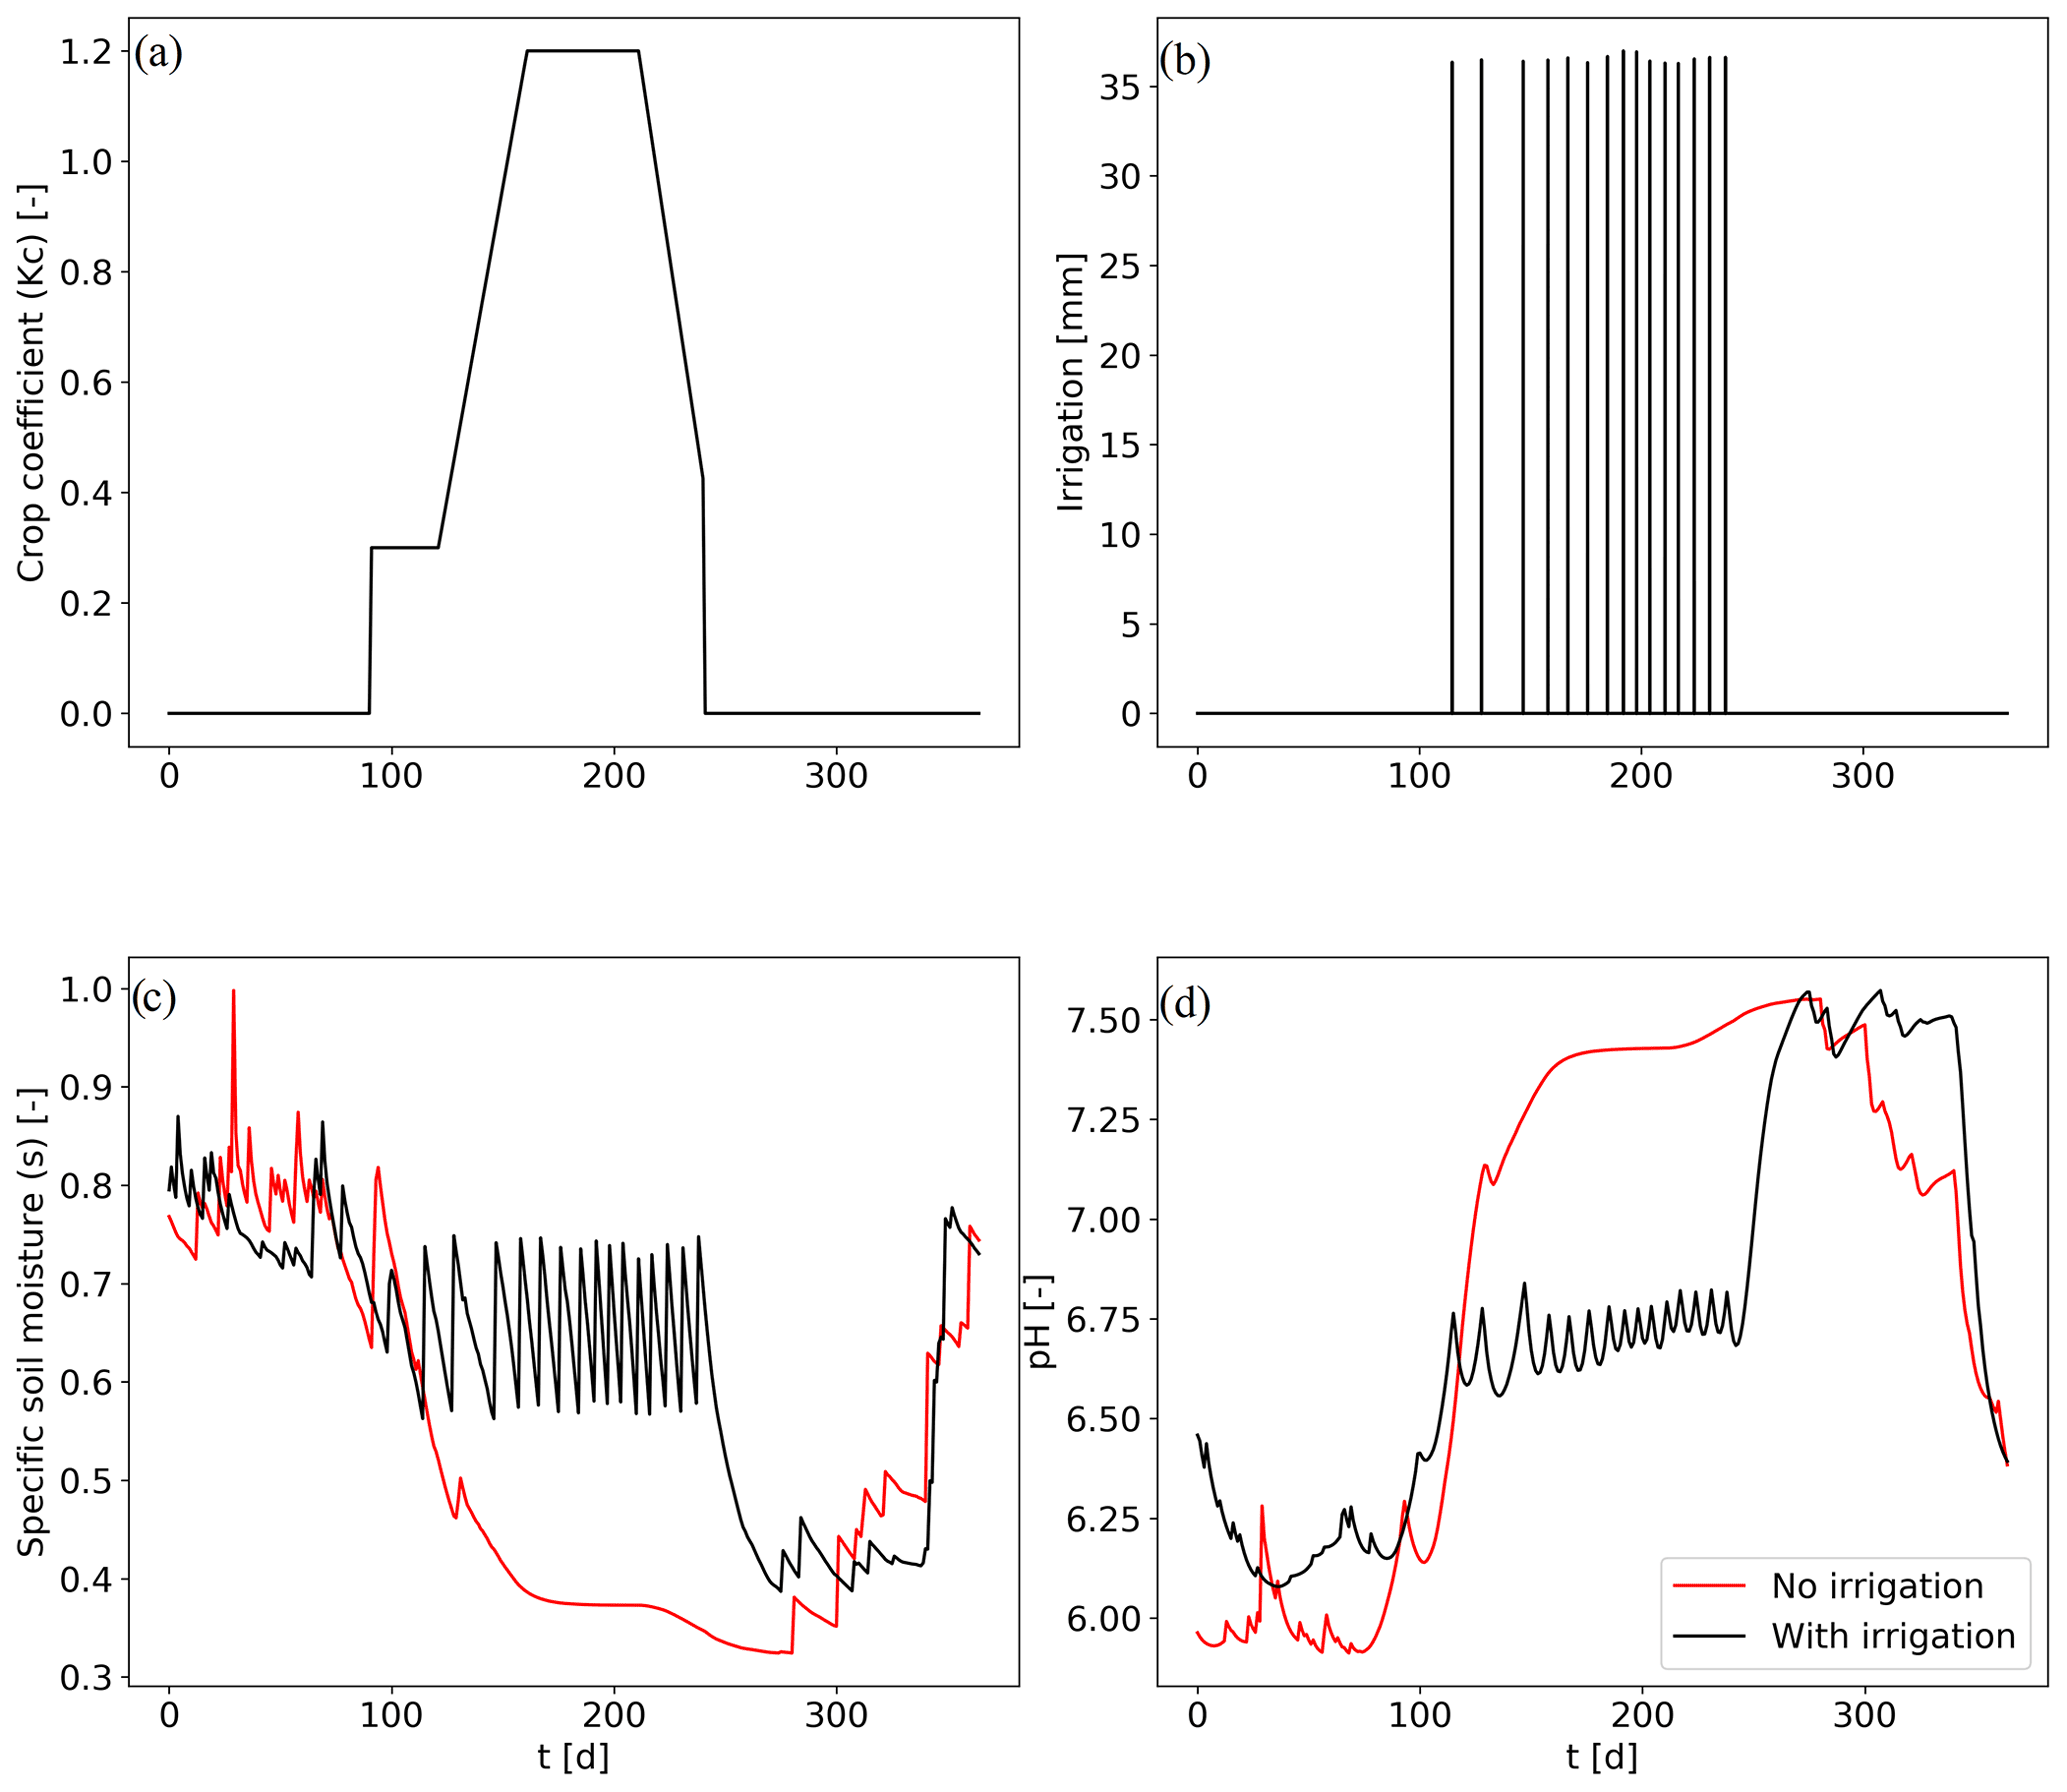
Figure 4Stress-avoidance irrigation procedure for corn (C) planted in silty clay loam soil (SCL) in California (CA). Panel (a) represents the crop coefficient, (b) the specific volume of water added by irrigation, (c) the yearly soil moisture time series with and without irrigation, and (d) the yearly pH time series with and without irrigation.
2.2.3 Soil type and composition
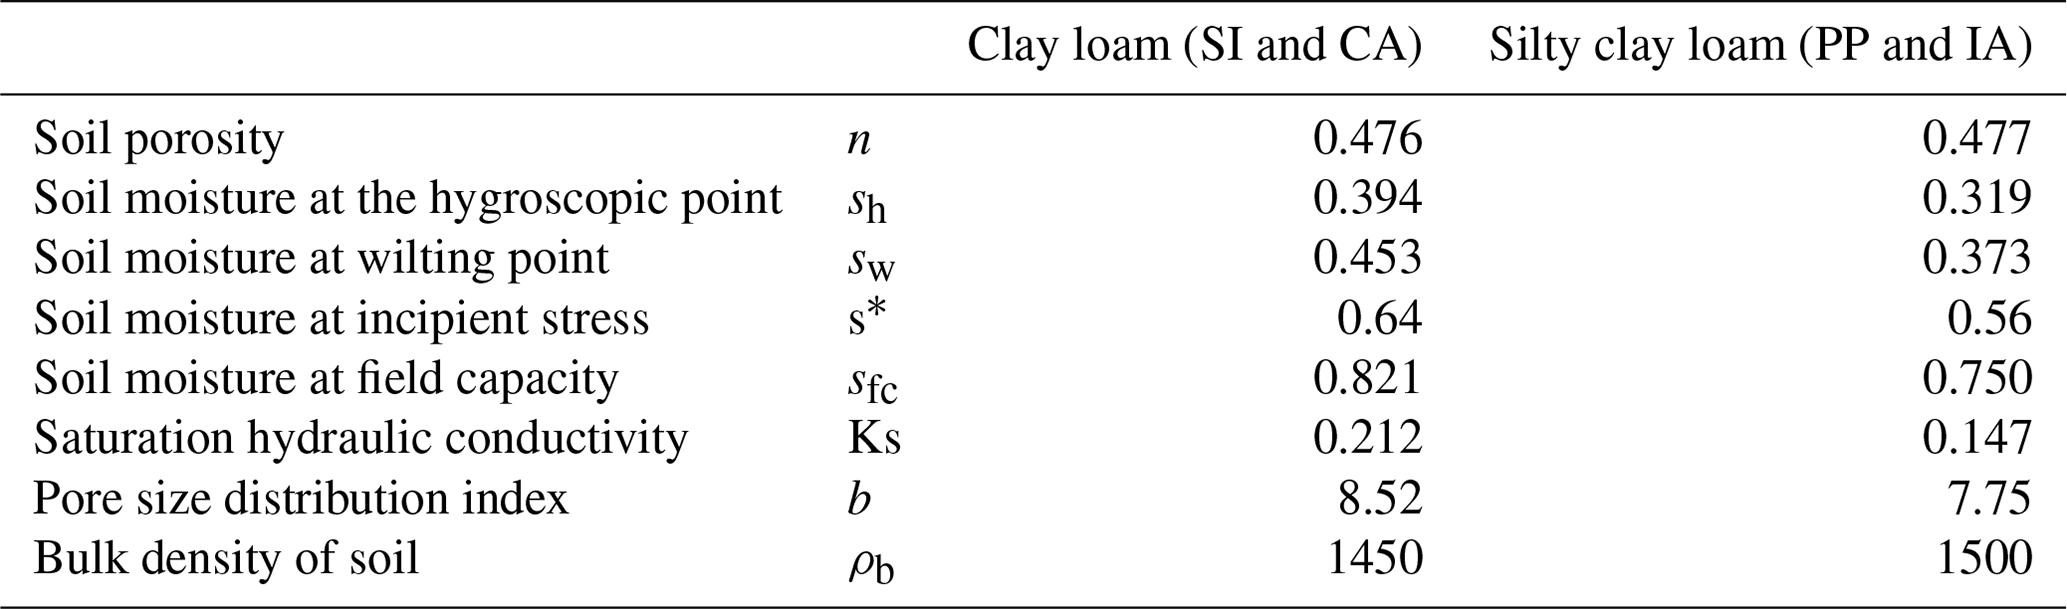
The soil type for the four sites under study was derived using the USDA soil texture triangle, which requires as input the silt, sand and clay fractions. These in turn were extracted from the Soil Grids project maps (Hengl et al., 2017) considering the areas covered by croplands and reaching a depth equal to the active root zone of the considered crops. The most frequent soil types for the four considered sites were considered. These are the clay loam soil for Sicily and California and the silty clay loam soil for the Iowa state and the Padan plain. Following previous studies (Clapp and Hornberger, 1978; Laio et al., 2001), the main properties of these two soil types, such as porosity, the soil moisture values characteristic of the soil water retention curve, the hydraulic conductivity at saturation and the bulk density, have been extracted and presented in Table 2. For the calculation of the soil moisture at the hygroscopic point, the wilting point and at incipient stress, we used the soil water retention curve defined by Clapp and Hornberger (1978), supposing soil water potentials of −10, −3 and −0.03 MPa, respectively, as done in Laio et al. (2001).
Table 2Properties of the clay loam (Sicily and California) and silty clay loam (Padan plain and Iowa) soils used in the model.
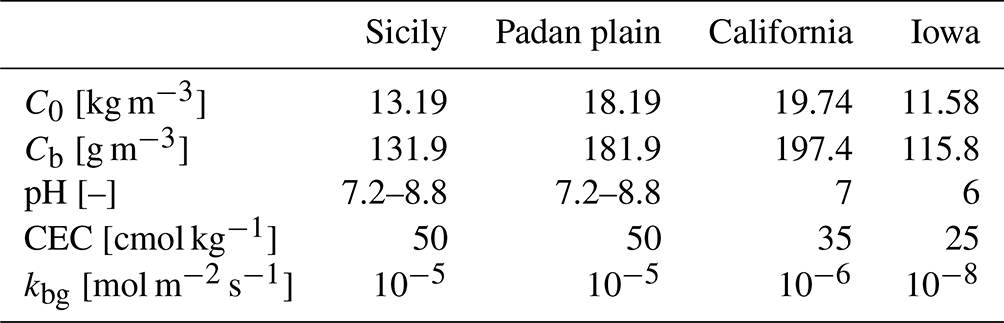
Regarding the soil organic carbon content, the Global Soil Organic Carbon map (GSOCmap) of the Food and Agriculture Organization of the United Nations (FAO) (http://54.229.242.119/GSOCmap/, last access: 29 July 2022) (FAO, 2020), representing a global spatial distribution of the organic carbon content of the first 30 cm soil layer expressed in t ha−1, was used. This could be assimilated as the initial carbon concentration in the litter and humus pools (C0) that, expressed in kg m−3, is given as input to the carbon module of the model. Following D'Odorico et al. (2003), the carbon concentration in the biomass pool (Cb), which regulates the biochemical decomposition rate of organic matter, is considered constant and is defined as about 1 % of the above-defined carbon input. Table 3 lists the two considered organic carbon contents for the four sites under study.
Due to the key role of the cation exchanges between the dissolved ions and soil colloids on pH, the total cation exchange capacity (CEC) per unit mass of the soil has been set based on site-specific values reported in the CEC maps of Ballabio et al. (2019) for the two sites in Italy and by the United States Department of Agriculture (USDA) data for Iowa and California (Hempel et al., 2014; Libohova et al., 2014), resulting in a total CEC equal to 50 cmol kg−1 for Sicily and the Padan plain and 35 and 25 cmol kg−1 for Iowa and California.
The background weathering flux represents the losses of protons due to the chemical weathering process of all the minerals that are naturally present in the soil. In general, locations with the same soil type, vegetation and climate characteristics may lead to different weathering rates according to the minerals within the soil that, with different rates, consume H+ ions available in soil water. This weathering flux can be estimated on the basis of the mineral composition of the soil and the type of the existing bedrock but also depends on the action of various other factors that consume H+. As a preliminary indication of the mineralogical composition of the soil, the lithological map presented in Hartmann and Moosdorf (2012) was used to extract the nature of bedrock at the cropland areas for the four considered sites. Sicily and the Padan plain are prevalently characterized by carbonate sedimentary rocks (e.g., limestone, dolostone mainly composed of carbonate minerals, such as calcite or dolomite), while the other two sites in the USA mainly present siliciclastic sedimentary rocks (e.g., sandstone, conglomerate mainly composed of silicate minerals, such as quartz or feldspars). This results in a very different background weathering rate between places on the two continents since carbonate rocks have a much faster dissolution rate constant than siliciclastic rocks. Indeed, considering Lasaga (1984) and Plummer et al. (1979), at 25 ∘C and pH equal to 5, calcite and quartz minerals are characterized by a dissolution rate constant of about 10−5 and 10−13 mol m−2 s−1, respectively. This factor has a relevant effect on olivine dissolution dynamics since it affects soil pH dynamics before olivine amendment. However, soil pH depends on other factors that are not considered in the EW model (i.e., the presence of fertilizers; the action of microbes, fungi, and bacteria; or the action of other minerals that may release or take up H+ ions).
The dissolution rate constants incorporate these previous aspects and were set to achieve steady-state soil pH values typical of the four sites under study, as reported in Ballabio et al. (2019) for Sicily and the Padan plain (i.e., a value ranging from 7.2 to 8.8) and the USDA (Hempel et al., 2014; Libohova et al., 2014) for California (i.e., a value around 7) and Iowa (i.e., a value around 6). As a result, three values of background weathering flux – a faster one for the case studies in Italy (dissolution rate constant of 10−5 mol m−2 s−1), a lower value for California (dissolution rate constant set to 10−6 mol m−2 s−1) and an even slower one for Iowa (dissolution rate constant set to 10−8 mol m−2 s−1) – were obtained.
2.2.4 Crop cycle
To investigate the role of the crop cycle on the EW dynamics, the monthly variation of the crop coefficient (Kc), commonly defined as the ratio of the crop evapotranspiration over the reference evapotranspiration, was considered. It is here used as a proportionality constant relating actual evapotranspiration to potential evapotranspiration, depending on the crop and stage of growth. For each development stage, a single crop coefficient per crop type and the climatic area was obtained following the Food and Agriculture Organization (FAO) guidelines (Tables 11 and 12 in Allen et al., 1998) (solid lines in Fig. 5). Regarding the considered crops, the wheat plant date is in November for Sicily, December for California, and October for the Padan plain and Iowa. The total crop stage lasts 240, 180 and 335 d, respectively. Corn is usually planted in April, and the total crop stage is 170 d, in both the Padan plain and Iowa. Regarding Sicily and California, the corn cycle is the same as that of Padan plain and Iowa, except for the end-of-season stage that lasts 30 d instead of 50, and, therefore, the total cropping season lasts for 150 d.
Table 3Initial organic carbon content in the litter and humus pools (C0) and the biomass pool (Cb) for the four sites under study. Typical values of pH, CEC and background dissolution rate constants are also reported.
The effects of the seasonal pattern of the crop coefficient on transpiration losses, T(s), were computed as
where s refers to varying soil moisture, sw is soil moisture at wilting point and s* is soil moisture at the incipient stress. ET0(t) is the reference evapotranspiration, which is computed using the Penman–Monteith equation for a reference crop. The annual pattern of this variable, for the four selected locations, has been extracted from the high-resolution database provided by Singer et al. (2021). The term f of Eq. (1) represents the rate of canopy cover over the entire study area, which is complementary to the area covered by bare soil. We here assume it as the ratio between the crop coefficient, at a certain time, and the maximum crop coefficient, which is reached at the mid-season stage. The bare soil evaporation, E(s), is evaluated as
where sh is soil moisture at the hygroscopic point and sfc is soil moisture at the field capacity. The total evapotranspiration water losses are therefore computed as the sum between bare soil evaporation and crop transpiration. The crop coefficient variation across the year, represented in Fig. 5, is determined as
where fi, fd, fms and fls are the periods related to the different crop stages (i.e., initial, development, maturity and late season, respectively), while Kc,ini, Kc,max and Kc,ls are the corresponding crop coefficient values, according to FAO guidelines.
Regarding the added carbon to the soil from vegetation (ADD), we considered the byproducts released as root exudates and the input of litter after crop harvest, which depends on the adopted agricultural practice. Root exudation products consist of carbon-based compounds derived from plant metabolic activity that are released from living roots (Shen et al., 2020). Their contribution to the carbon input to the soil can be modeled as a slight linear increase from the background ADD (i.e., the starting point of the ADD axis in Fig. 5) to a minimum ADD value during the initial growing stage (i.e., from 1 November for 30 d for wheat in Sicily, from 1 December for 20 d for wheat in California, from 1 October for 160 d for wheat in Padan plain and Iowa, and from 1 April for 30 d for corn in all four locations). During the development phase, it can be modeled with a more relevant growth (i.e., from 1 December for 140 d for wheat in Sicily, from 20 December for 60 d for wheat in California, from 9 March for 75 d for wheat in Padan plain and Iowa, and from 1 May for 40 d for corn in all four locations), until reaching a maximum ADD value at which this carbon input remains stable during the maturity period (i.e., from 19 April for 40 d for wheat in Sicily, from 17 February for 70 d for wheat in California, from 23 May for 75 d for wheat in Padan plain and Iowa, and from 9 June for 50 d for corn in all four locations). Lastly, a linear decrease towards the background ADD value has been assumed at the end-of-season stage for vegetation (i.e., from 29 May for 30 d for wheat in Sicily, from 28 April for 30 d for wheat in California, from 6 August for 25 d for wheat in Padan plain and Iowa, from 29 July for 50 d for corn in the Padan plain and Iowa, and from 29 July for 30 d for corn in Sicily and California). After the end of the season, in correspondence with crop harvest, the soil is amended with plant litter, leading to a sudden increase in the carbon input, as visible in the dashed lines of Fig. 5. This carbon input, then, linearly decreases until reaching the background ADD value at the beginning of the next crop stage since it is progressively degraded by the biomass. The constant background ADD is considered to take into account possible other amendments (e.g., manure) or carbon residues (e.g., death roots or stems) from previous cycles. The ADD values shown in Fig. 5, typical of root exudation and added litter, have been defined to achieve the typical carbon concentration in the soils under study (see Table 3) from the organic matter balance module of the EW model and also looking at the typical carbon input from wheat and corn residues presented in Wang et al. (2015).
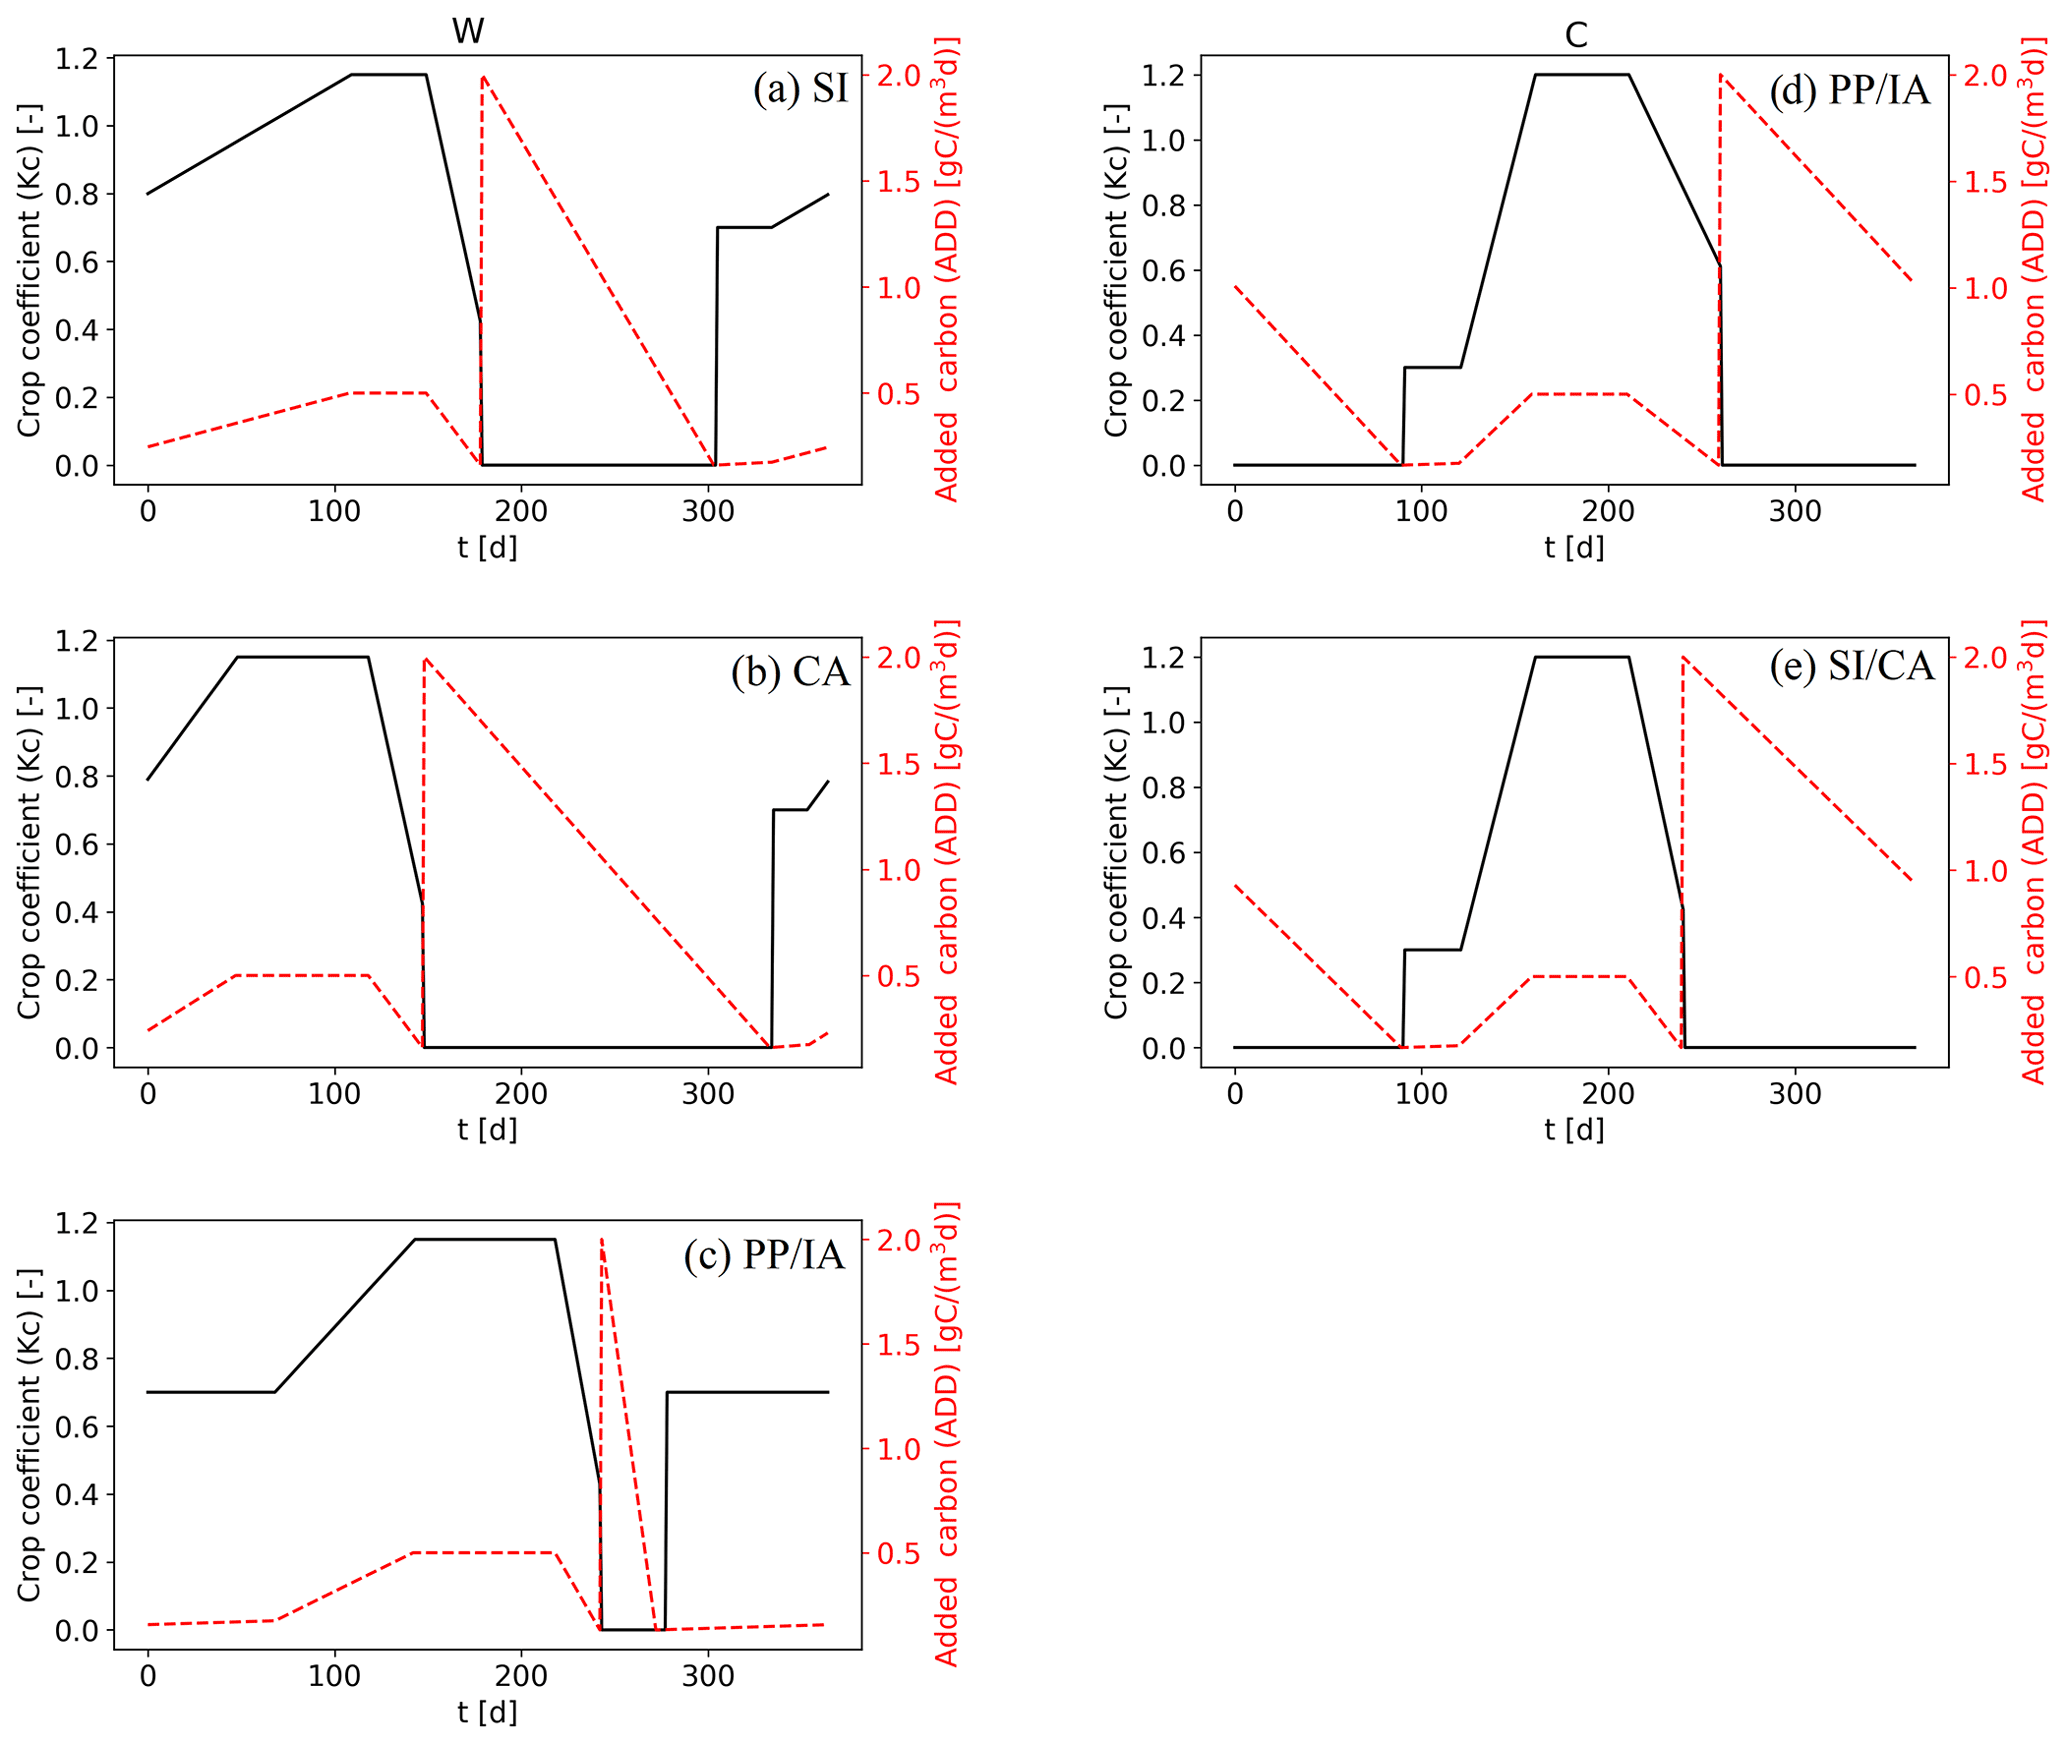
Figure 5Seasonal variability of the crop coefficient (Kc) and the added carbon from vegetation (ADD) for (a) wheat (W) in Sicily (SI), (b) wheat in California (CA), (c) wheat in the Padan plain (PP) and Iowa (IA), (d) corn (C) in the Padan plain and Iowa, and (e) corn in Sicily and California. The reader is referred to Sect. 2.2.3 for more details.
Our analysis is devoted to a comparison of EW dynamics in the four sites, with special attention to rainfall seasonality (and irrigation when applied), soil type and composition, and crop phenology, which are among the factors that most affect EW dynamics. The following results identify the combinations of environmental factors that are most suitable for olivine amendment.
3.1 The role of rainfall seasonality and irrigation on EW dynamics
To explore the role of rainfall seasonality on EW, we present pairwise comparisons of EW dynamics achieved for the case studies in Italy and the USA, given the different rainfall seasonality between Sicily and the Padan plain and California and Iowa. Simulations based on scenarios given in Table 1 have been carried out by fixing the soil and the vegetation type and varying the location of the unit surface area.
Figure 6 displays the heat maps of the ratio between soil moisture (s), pH and weathering rate (Wr) achieved for Iowa (IA) and California (CA). Blue colors indicate higher values of a parameter (e.g., soil moisture, pH, weathering rate) in California than in Iowa at a specific time and under specific crop and soil conditions, while red colors indicate that, for given circumstances of soil, crop type and rainfall seasonality, soil moisture, pH or weathering rate is higher in Iowa than in California. Here, the panels in the first row are related to the corn (C) planted in a clay loam (CL) soil, those in the second row to the corn (C) within the silty clay loam (SCL) soil, panels in the third row to wheat (W) planted in a silty clay loam soil (SCL) and, lastly, those displayed in the last row to wheat (W) within a clay loam (CL) soil. The panels in the last row of the figure show the average daily ratios of the three considered variables of the model. In the cases when corn is considered, during the summer season (i.e., DOY 150–250), soil moisture is higher in California than in Iowa due to irrigation. In the rest of the year, by contrast, the soil in Iowa is as wet as in California, except for some DOY around 300.
The effects of multiple irrigation events are also visible in the pH ratio heat maps related to corn in Fig. 6 since, during the irrigation period, it is higher than 1, corresponding to more acidic soil in California than in Iowa. Weathering rate dynamics are affected by soil moisture and pH. Due to irrigation, which leads to higher soil moisture and lower pH, weathering rate is higher in California with respect to Iowa during summer. The average daily weathering rate ratio with corn assumes values higher than one only for a short period in the beginning and at the end of the year, around the 300th day.
In the case of wheat, Iowa provides significantly wetter and more acidic soil conditions, resulting in greater weathering rates that, for some DOY around 300, may reach values 20 times higher than those achieved in the case of California. Comparing rainfall seasonality (panels b and d of Fig. 3), it is worth noticing that there are higher values of precipitation distribution for Iowa than for California (i.e., similar α but more than double λ for some DOY around 300). Combined with low transpiration during the initial growing stage (see panel c of Fig. 5), this leads to higher soil water content. Averaging the grain-scale weathering rate ratio achieved considering wheat, over the considered 10 years, weathering rates derived for Iowa are about 7 times higher than those in California under the two considered soil types, resulting from slightly higher average soil moisture and slightly lower pH.
Similar considerations apply to corn grown in Italy (Fig. 7). In summer, corn requires irrigation in Sicily, given the scarcity of precipitation, but not on the Padan plain. This provides a faster olivine dissolution in Sicily during this season. During the rest of the year, the Sicilian and Padan plain soils have similar soil moisture (i.e., the soil moisture ratio is near 1) and, in turn, pH and olivine dissolution dynamics. For wheat, soil moisture is higher in the Padan plain than in Sicily during summer, given the near absence of rainfall in Sicily in this period. Therefore, the Padan plain soils tend to be more acidic, and weathering rate tends to be higher (e.g., average daily weathering rate ratio higher than 1). For the rest of the year, the weathering rate ratio between the Padan plain and Sicily tends to be slightly less than 1, translating to slightly more favorable olivine dissolution dynamics.
For the same soil and vegetation, higher rainfall leads to an olivine dissolution considerably faster in Iowa than in California due to higher soil moisture driven by higher seasonal rainfall frequency (λ). For the Italian case studies, rainfall seasonality leads to small differences in EW dynamics, given the similar distribution of precipitation across the year. Irrigation, applied here only during the summer season for corn planted in Sicily and California, leads to a decrease in soil pH and a faster olivine dissolution. Larger MAP differences would likely result in bigger changes of EW dynamics (Cipolla et al., 2021b), emphasizing the effect of rainfall seasonality and climatic conditions on olivine dissolution and EW.
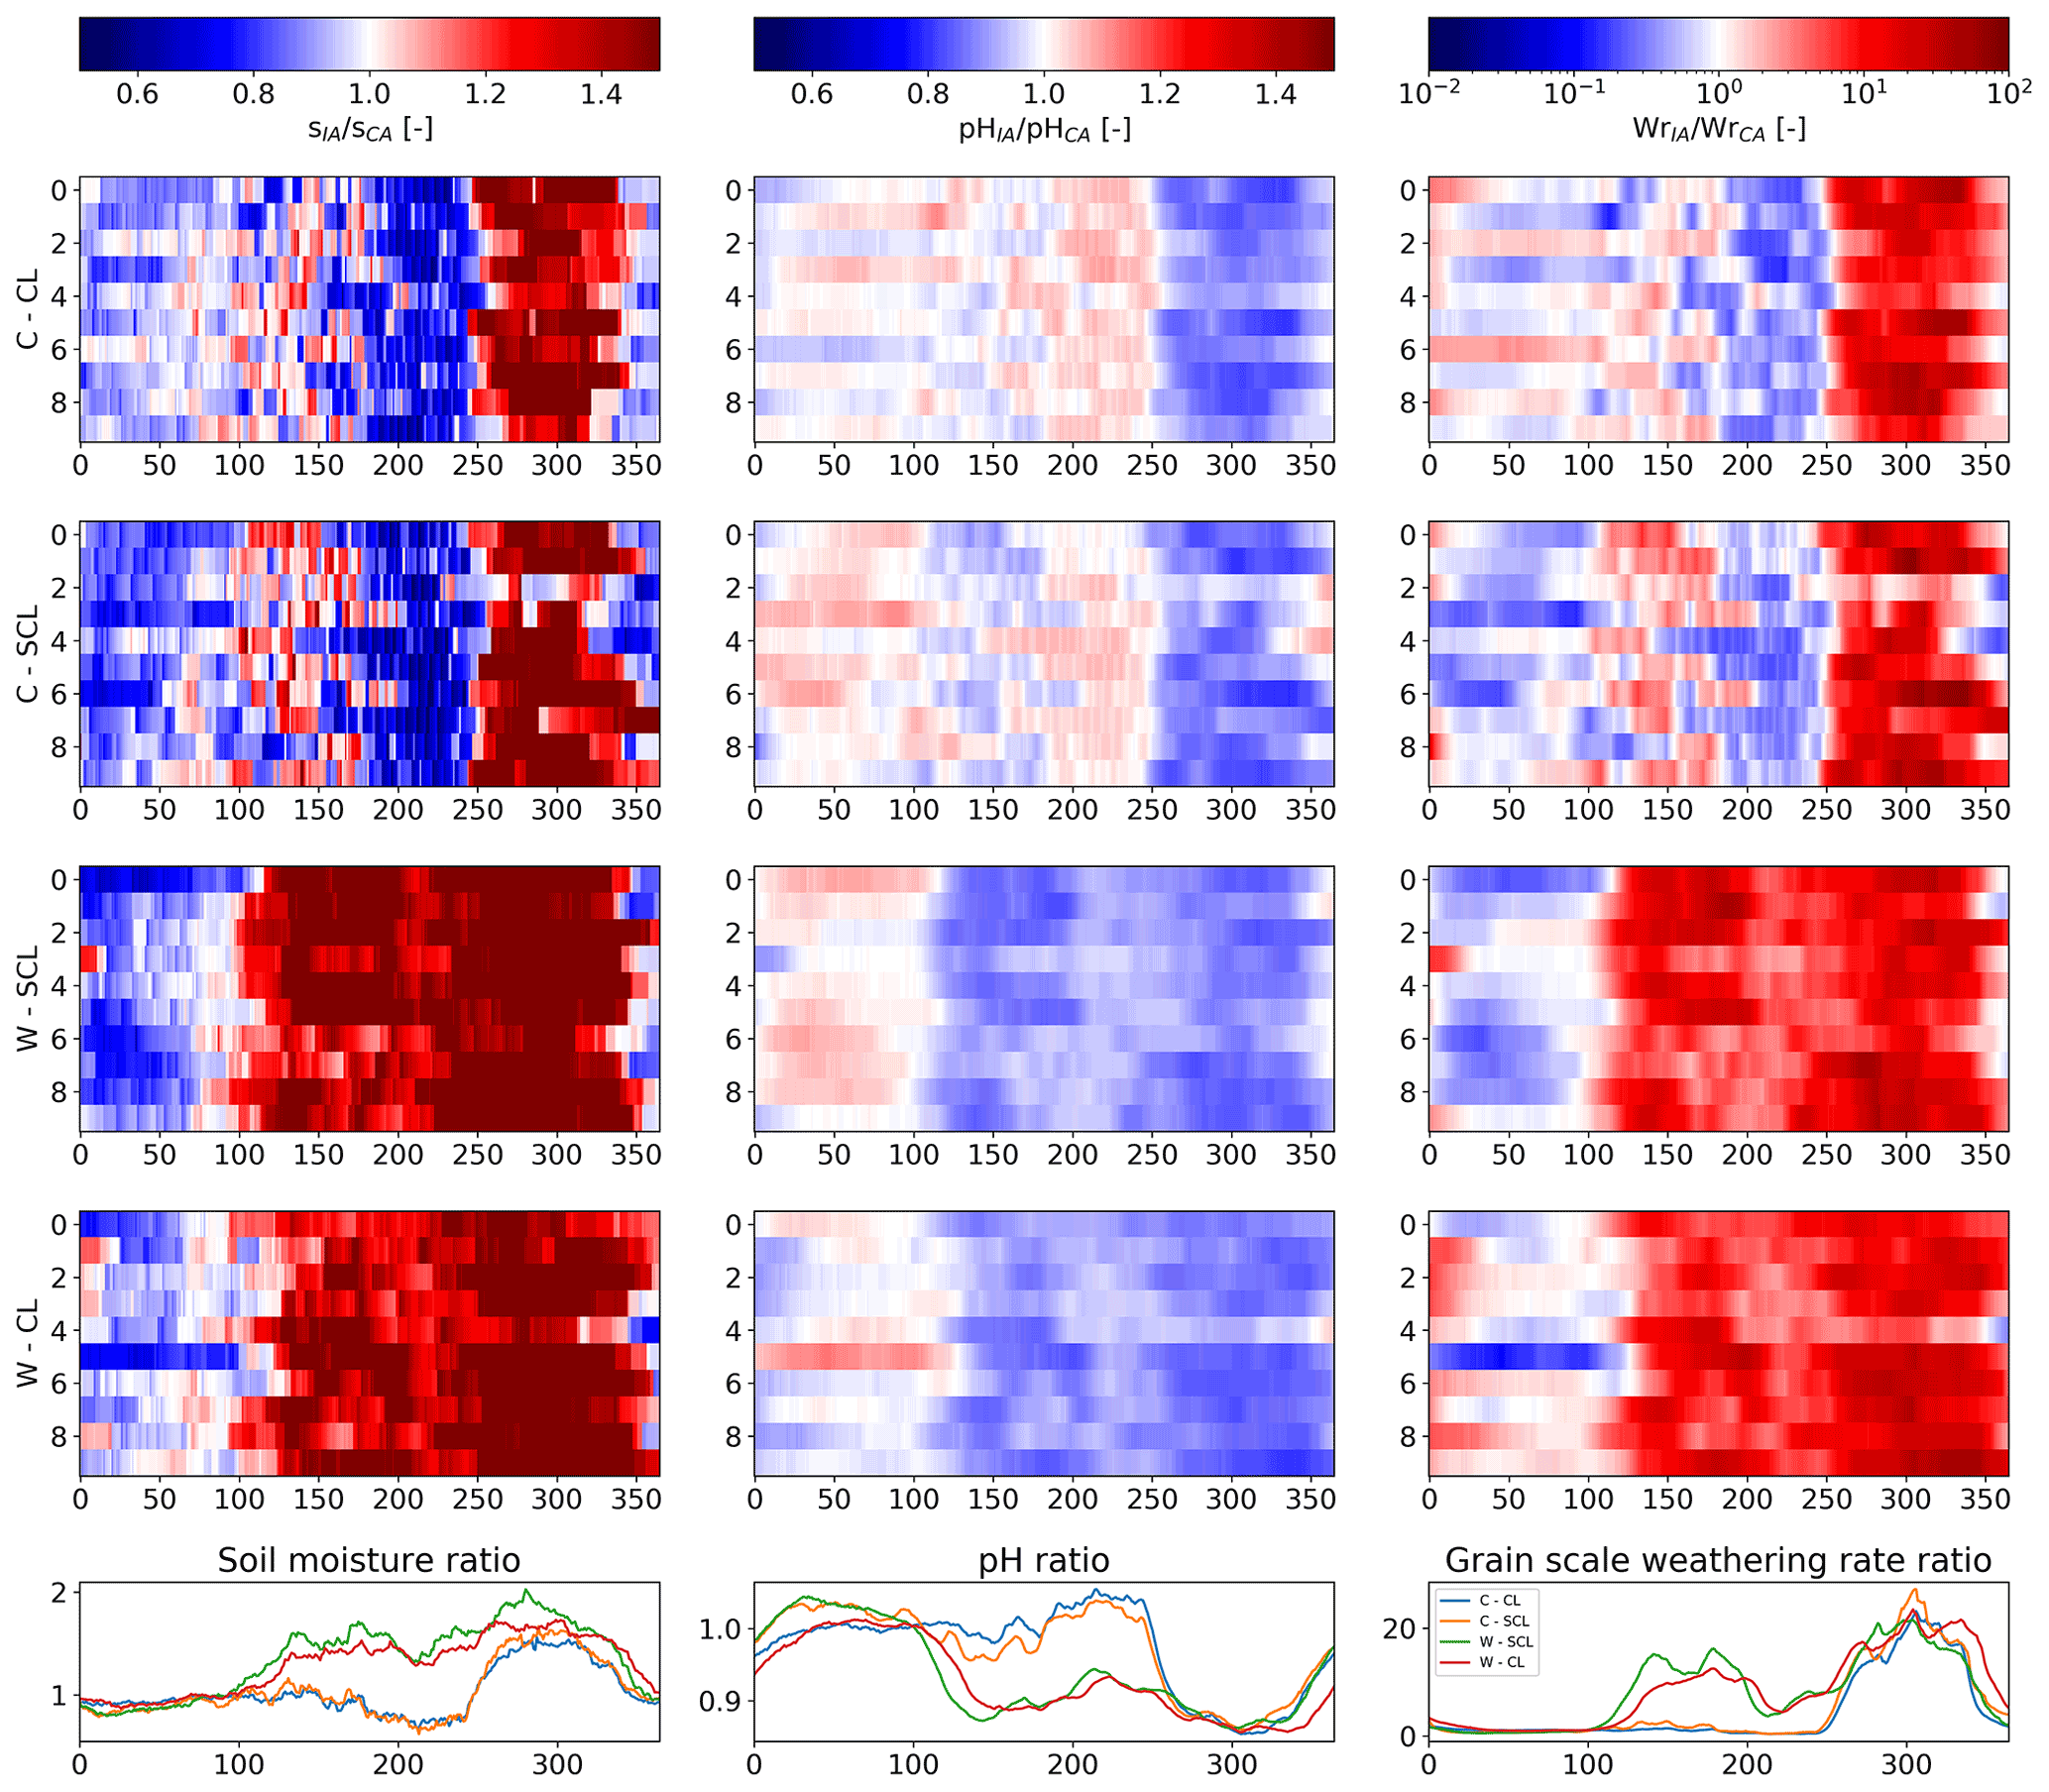
Figure 6Time-series heat maps (x axes: day of year; y axes: simulation year) of the ratio between soil moisture (s), pH and weathering rate (Wr) achieved in the case of Iowa (IA) and those related to California (CA) computed within 10 years after olivine addition. These are related to corn planted in a clay loam soil (C–CL, panels in the first row of the figure), corn planted in a silty clay loam soil (C–SCL, panels in the second row of the figure), wheat planted in a silty clay loam soil (W–SCL, panels in the third row of the figure) and wheat planted in a clay loam soil (W–CL, panels in the fourth row of the figure). The average daily ratios of the three considered variables are shown in the last panel of the figure.

Figure 7Time-series heat maps of the ratio between soil moisture (s), pH and weathering rate (Wr) achieved in the case of the Padan plain (PP) and those related to Sicily (SI) computed within 10 years after olivine addition. These are related to corn planted in a clay loam soil (C–CL, panels in the first row of the figure), corn planted in a silty clay loam soil (C–SCL, panels in the second row of the figure), wheat planted in a silty clay loam soil (W–SCL, panels in the third row of the figure) and wheat planted in a clay loam soil (W–CL, panels in the fourth row of the figure). The average daily ratios of the three considered variables are shown in the last panel of the figure.
3.2 The role of soil type on EW dynamics
The role of different soil types on EW dynamics is explored by considering the same location and vegetation type and varying the two different soils considered in this study (i.e., clay loam soil and silty clay loam soil), since they are the most frequent in the four sites.
Figure 8 displays heat maps of the ratio between soil moisture (s), pH and weathering rate (Wr) achieved considering the clay loam (CL) soil and those obtained with the silty clay (SCL) loam one. The results highlight that the clay loam soil leads to a larger soil water content in most of the cases as compared to the silty clay loam. This is because the latter soil type is characterized by lower soil moisture at the hygroscopic and wilting points, and, for this reason, evapotranspiration losses are higher, as these values are exceeded most frequently. Similar conclusions can be drawn for the soil moisture value at the field capacity that involves water losses for leaching. This produces more acidic conditions and a faster olivine dissolution under the clay loam soil. Averaging the grain-scale weathering rate ratio (i.e., the curves shown in the last row of the figure), the clay loam soil results in a weathering rate about twice as high as what is obtained with the silty clay loam soil, at all four locations. This small difference is due to the very similar characteristics of the clay loam and silty clay loam soils (see Table 2 for more details), which result in similar hydrological fluxes (e.g., infiltration and leaching rates), water balance and all the derived variables (i.e., pH and dissolution rate).

Figure 8Time-series heat maps of the ratio between soil moisture (s), pH and weathering rate (Wr) achieved considering the clay loam soil (CL) and those related to the silty clay loam soil (SCL). The heat maps are related to a period of 10 years after olivine addition. These are related to Sicily with wheat (SI–W, panels in the first row of the figure), Padan plain with corn (PP–C, panels in the second row of the figure), Iowa with corn (IA–C, panels in the third row of the figure) and California with wheat (CA–W, panels in the fourth row of the figure). The average daily ratios of the three considered variables are shown in the last panel of the figure.
3.3 The role of vegetation on EW dynamics
Besides its role in the soil water balance through transpiration, vegetation also plays a significant role in EW dynamics due to its acidifying effect resulting from the displacement of H+ to balance the cations taken from soil water as nutrients (Weil and Brady, 2017). Vegetation furthermore provides the organic matter that, once decomposed, is one of the CO2 sources in the soil system (Porporato et al., 2003). The type of vegetation, therefore, influences the time dynamics of soil moisture, pH and weathering rate given that the different crop phenology determines different dynamics of transpiration and added carbon.
Looking at the panels in Fig. 9, averaging the grain-scale weathering rate ratio, it is evident that corn leads to a weathering rate, on average, about 4 times higher than the one achieved for wheat when planted on clay loam soil in Sicily and California (first and fourth row of the figure). When both crops are planted in a silty clay loam soil in the Padan plain and Iowa (second and third row of the figure), the olivine dissolution dynamics are very similar. An annual average weathering rate daily ratio equal to about 1.5 might reflect slightly higher weathering rates for corn. The greatest weathering rate considering the corn in Sicily and California is obtained during summer and is certainly due to the irrigation contributions. In the rest of the year, or in the cases of Padan plain and Iowa, where irrigation is not considered, crop phenology does not lead to significant differences in EW dynamics. As visible in Fig. 10, when either of the two crops is in the rest phase (for example, in DOY 180–300 for wheat in Sicily and in DOY 0–100 and 250–365 for corn in Padan plain), water losses due to bare soil evaporation are similar in magnitude to transpiration for the other crop. It happens that, when corn is in the rest phase and at the same time wheat is in its initial or mid-season stage, in the first case water losses are mainly governed by bare soil evaporation, while in the other one they are mainly governed by crop transpiration. The fact that wheat and corn cycles are not in phase does not affect much water balance and, in turn, pH and weathering rate dynamics. The only difference for which corn leads to a slightly faster olivine dissolution may be attributed to the smaller active root zone depth (i.e., 0.4 and 0.6 m for corn and wheat, respectively) that causes the soil to reach saturation more easily.
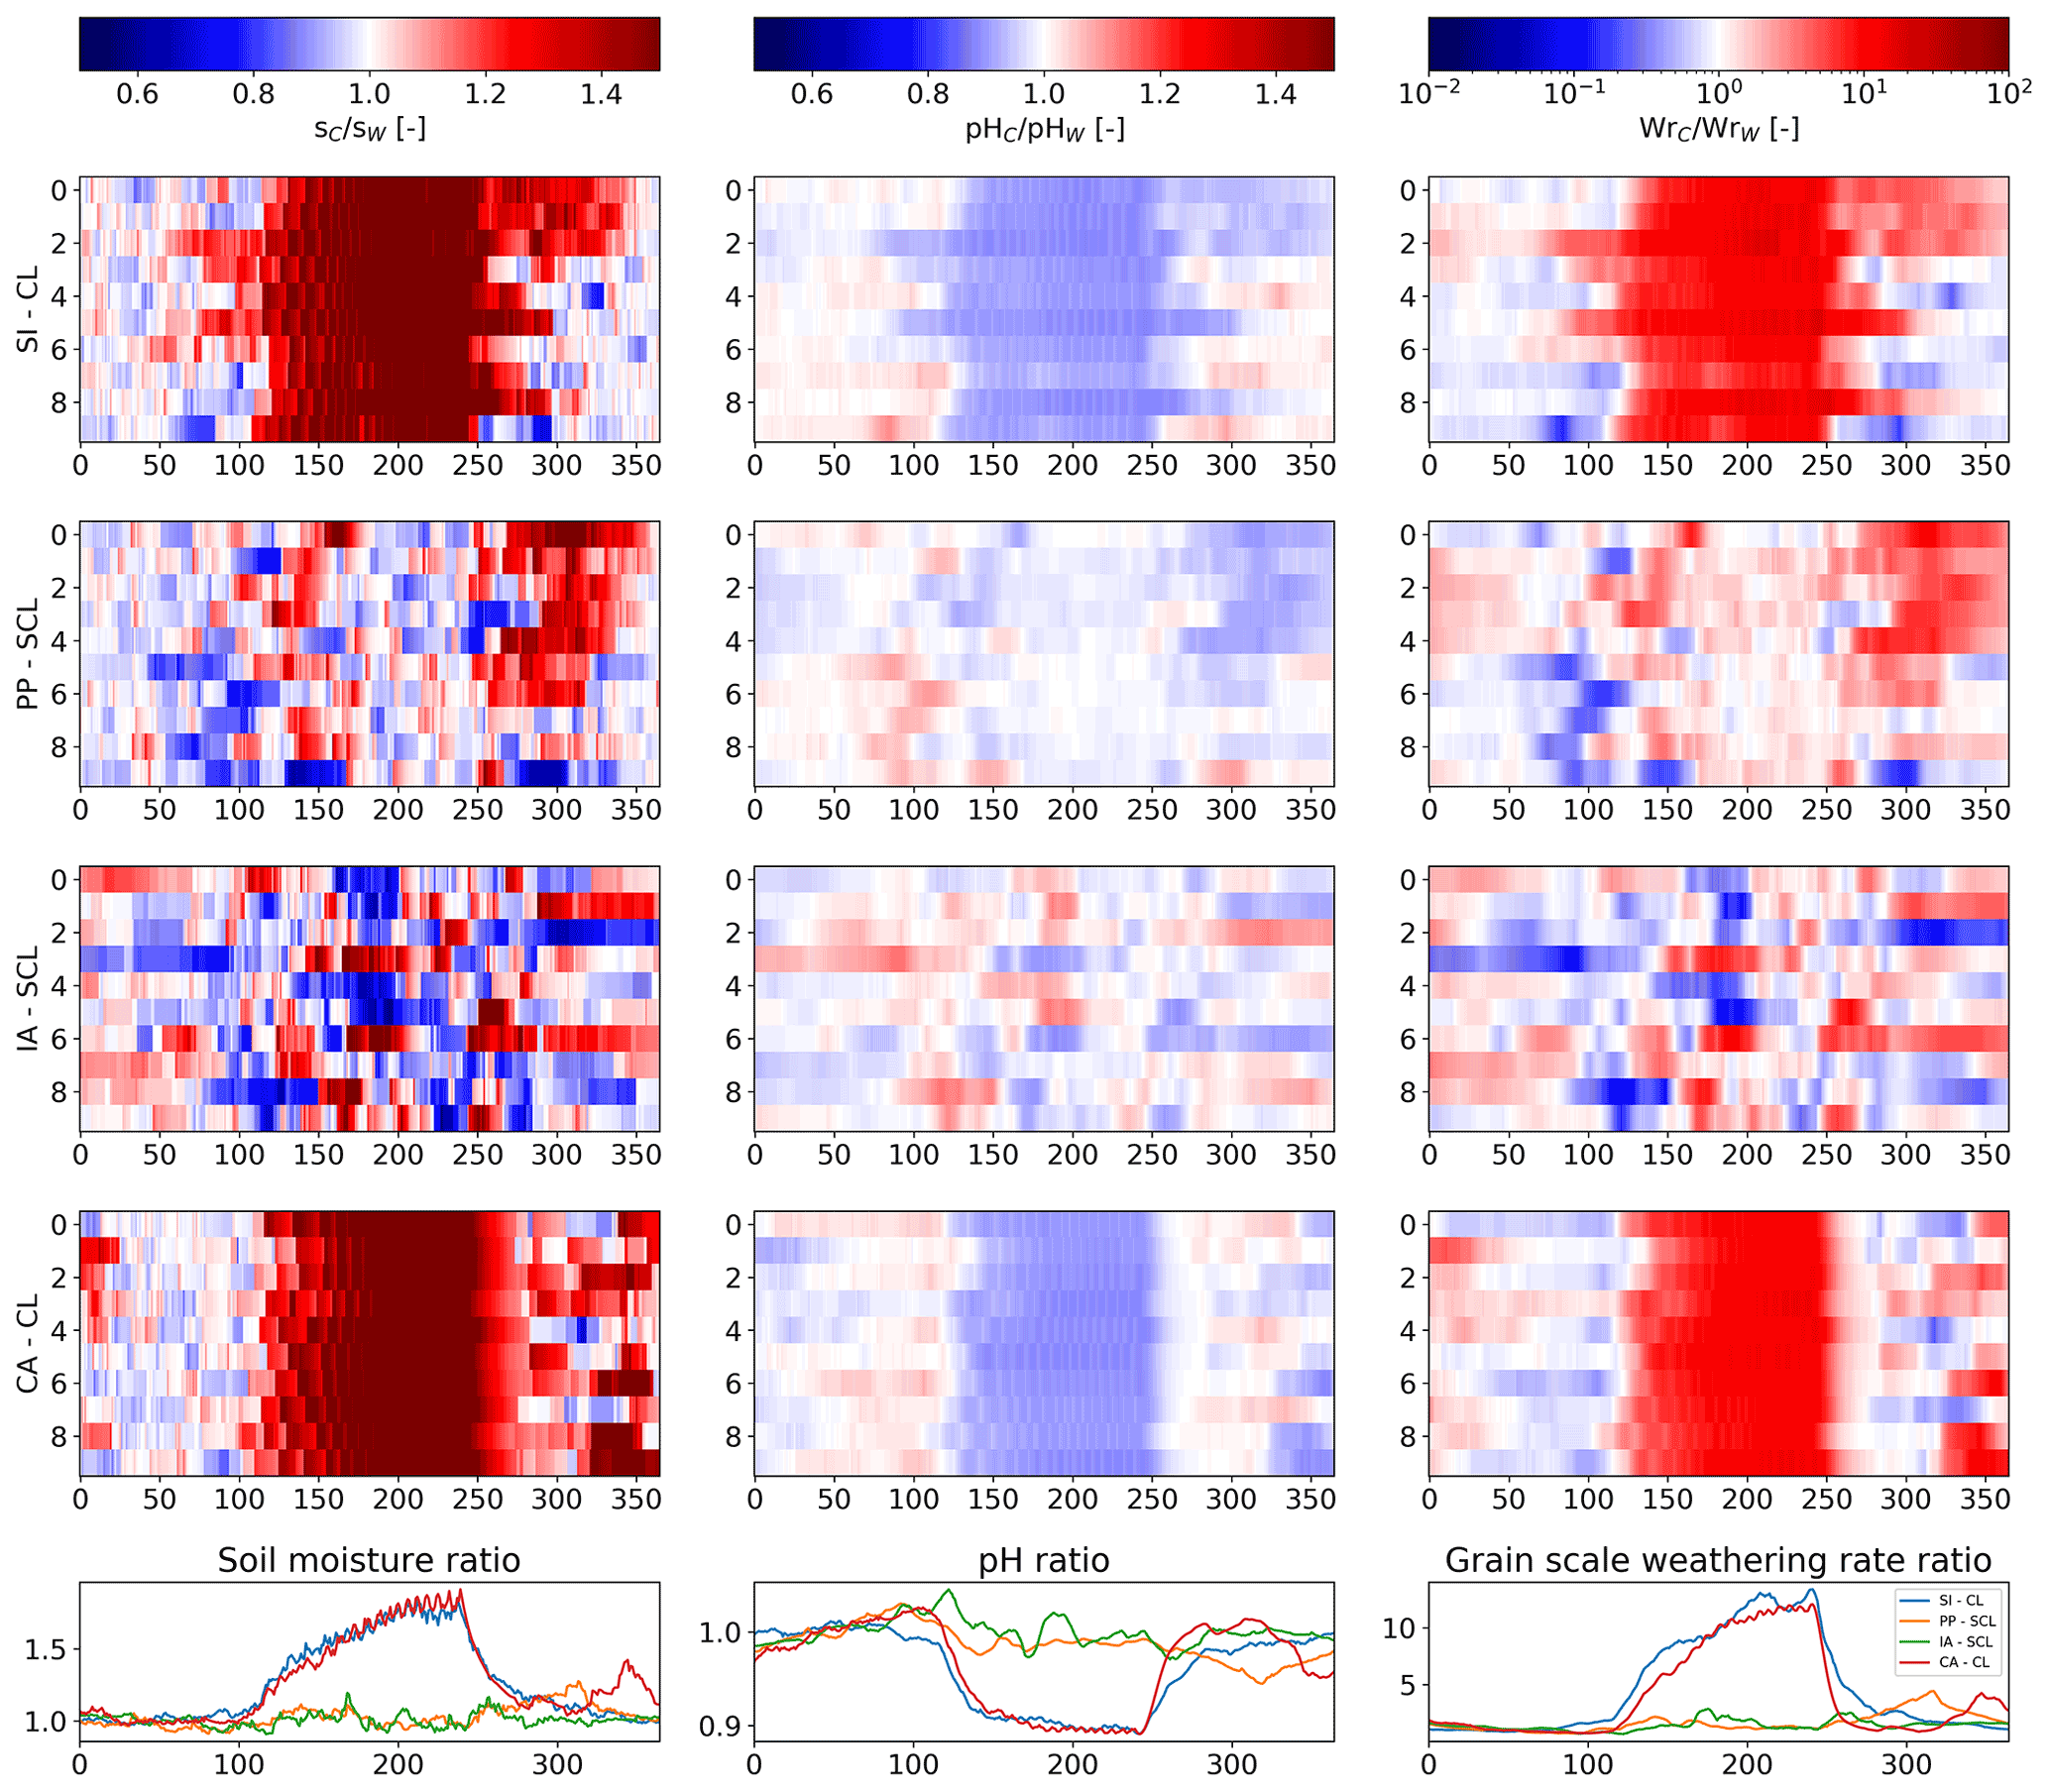
Figure 9Time-series heat maps of the ratio between soil moisture (s), pH and weathering rate (Wr) achieved considering the corn (C) and those related to wheat (W). The heat maps are related to a period of 10 years after olivine addition. These are related to Sicily with clay loam (SI–CL, panels in the first row of the figure), Padan plain with silty clay loam (PP–SCL, panels in the second row of the figure), Iowa with silty clay loam (IA–SCL, panels in the third row of the figure) and California with clay loam soil (CA–CL, panels in the fourth row of the figure). The average daily ratios of the three considered variables are shown in the last panel of the figure.
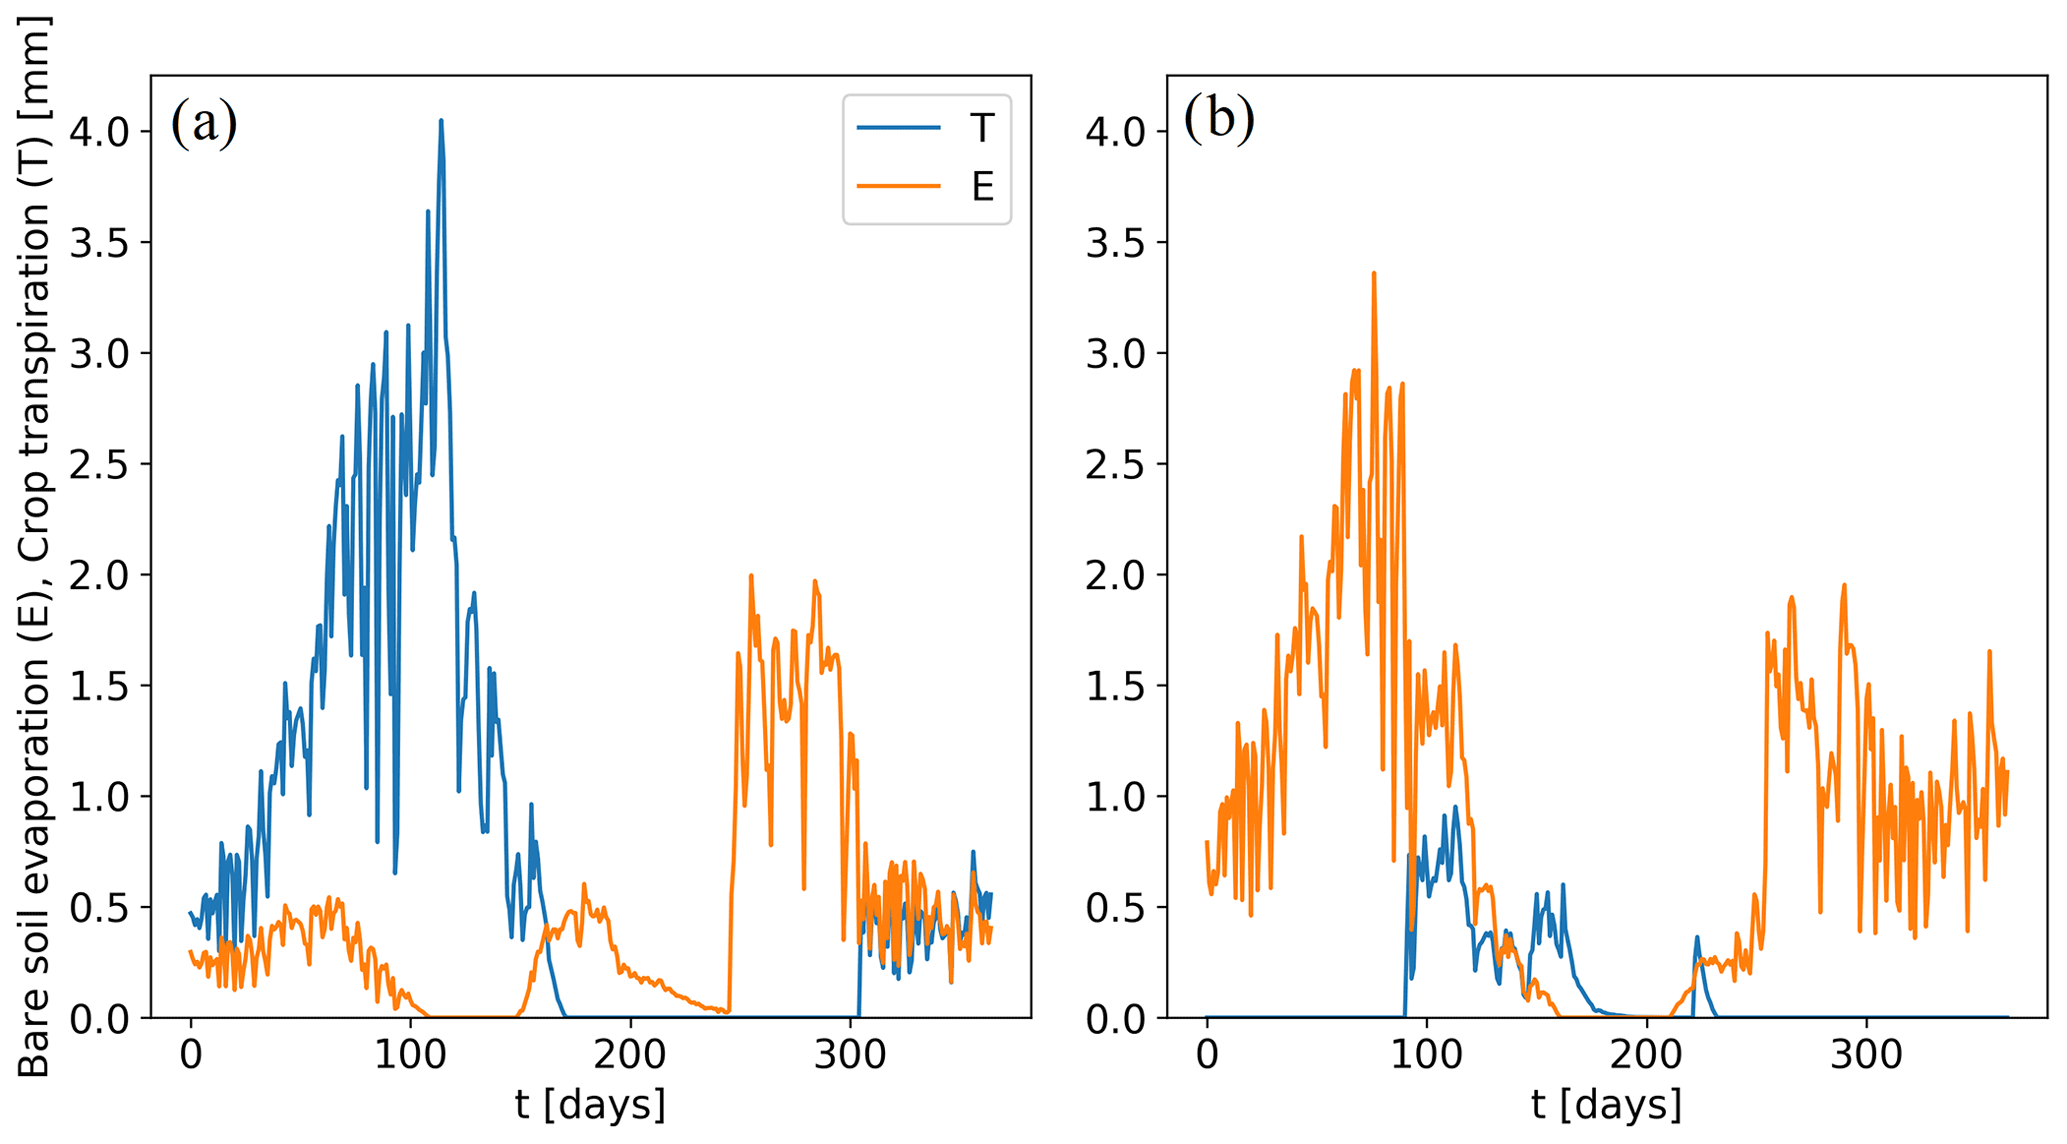
Figure 10Annual time series for bare soil evaporation (E) and crop transpiration (T) in the case of (a) wheat and (b) corn planted in a clay loam in Sicily. Corn is not irrigated in this case.
3.4 EW case studies
The time dynamics of soil moisture, pH and weathering rate across the four locations in Italy and the USA are shown in Fig. 11. The results here analyzed are those related to the simulations referred to as “most frequent scenario” (Sect. 3.4) as shown in Table 1, where the considered climatic condition is analyzed along with the most frequent crop and soil type. California and Iowa are characterized by a slightly different signal in the seasonality of soil moisture, pH and, in turn, weathering rate. The highest soil moisture values for California occur usually in the first (i.e., before DOY 100) and the last (i.e., from DOY 300 onwards) part of the year since those days are characterized by the greatest part of the total annual rainfall. Soil moisture assumes low values in DOY 100–250 mainly due to the scarcity of rainfall during the summer period. On those days where soil moisture is high, pH and weathering rate reach their minimum and maximum values, respectively, as compared to the rest of the year, confirming the fact that weathering reactions are favored by wet and acid conditions (Cipolla et al., 2021a, b; Hartmann et al., 2013; Calabrese and Porporato, 2020).
For Iowa, the period with generally higher soil moisture covers all winter and part of the autumn and spring months, but in summer soil moisture is low due to high transpiration losses associated with a peak of the corn crop coefficient. Annual average values of the three variables calculated for California and Iowa suggest that faster olivine dissolution occurs at the latter site (2.13 × 10⁻¹² mol m−2 s−1) than at the former (1.61 × 10⁻¹² mol m−2 s−1). This is in accordance with a lower annual average pH (6.61 in Iowa and 7.03 in California) and higher mean annual soil moisture (0.62 in Iowa and 0.57 in California). A similar situation can be observed by comparing the two Italian sites, Sicily and Padan plain, which present only small differences in terms of the seasonality of soil moisture, pH, and, in turn, weathering rate. The highest soil moisture values for Sicily occur in the first (i.e., before DOY 100) and the last (i.e., from DOY 300 onward) part of the year, since the greatest part of the total annual rainfall occurs during those days. Low soil moisture values from the DOY 100 to about 250 are due, as in California, to the scarcity of precipitation in this period.
Because of the similar rainfall seasonality and, of course, the same soil type and vegetation, it is possible to make a comparative analysis between Sicily and California and between the Padan plain and Iowa regarding the time dynamics of soil moisture, pH and weathering rate. The greatest difference between Italian and US case studies can be observed in soil pH and the order of magnitude of the olivine weathering rate. Indeed, the two sites in Italy are characterized by a higher annual average pH (7.46 in Sicily and 7.55 in the Padan plain) and lower weathering rates (4.79 × 10⁻¹³ mol m−2 s−1 in Sicily and 3.17 × 10⁻¹³ mol m−2 s−1 in the Padan plain) than the two sites in the USA. This is mainly due to the different lithological properties of the bedrock and the mineral composition of the soil that lead to a more significant background weathering flux, hence H+ consumption and less acidic soil, in the sites in Italy than those in the USA, before olivine amendment (Ballabio et al., 2019; Hempel et al., 2014; Libohova et al., 2014). The order of magnitude of weathering rates provided by our model is more typical of the field environment with respect to those achieved in laboratory conditions (Bandstra et al., 2008). This was also the case for the mesocosm studies of Renforth et al. (2015) and Amann et al. (2020). Our rates (10−11.67 Iowa, 10−11.79 California, 10−12.50 Padan plain and 10−12.32 Sicily, mol m−2 s−1) are comparable to theirs: 10−12.7 to 10−11.8 mol m−2 s−1 in Renforth et al. (2015), as well as 10−13.12 to 10−13.75 mol m−2 s−1 in Amann et al. (2020). Furthermore, the mesocosm experiment of Amann et al. (2020) used a loamy sandy soil with pH equal to about 6.6 and a total amount of annual rain of 800 mm yr−1, similar to the annual average soil pH for Iowa. This aspect stresses the importance of using measurements of soil properties (e.g., CEC, pH) for calibrating the background weathering flux, allowing us to obtain more realistic estimates of olivine dissolution dynamics. Indeed, CEC and background weathering strongly affect pH levels before olivine amendment and, in turn, dissolution rates which are faster under more acidic conditions (e.g., the case of Iowa that has the slowest background weathering flux).
.
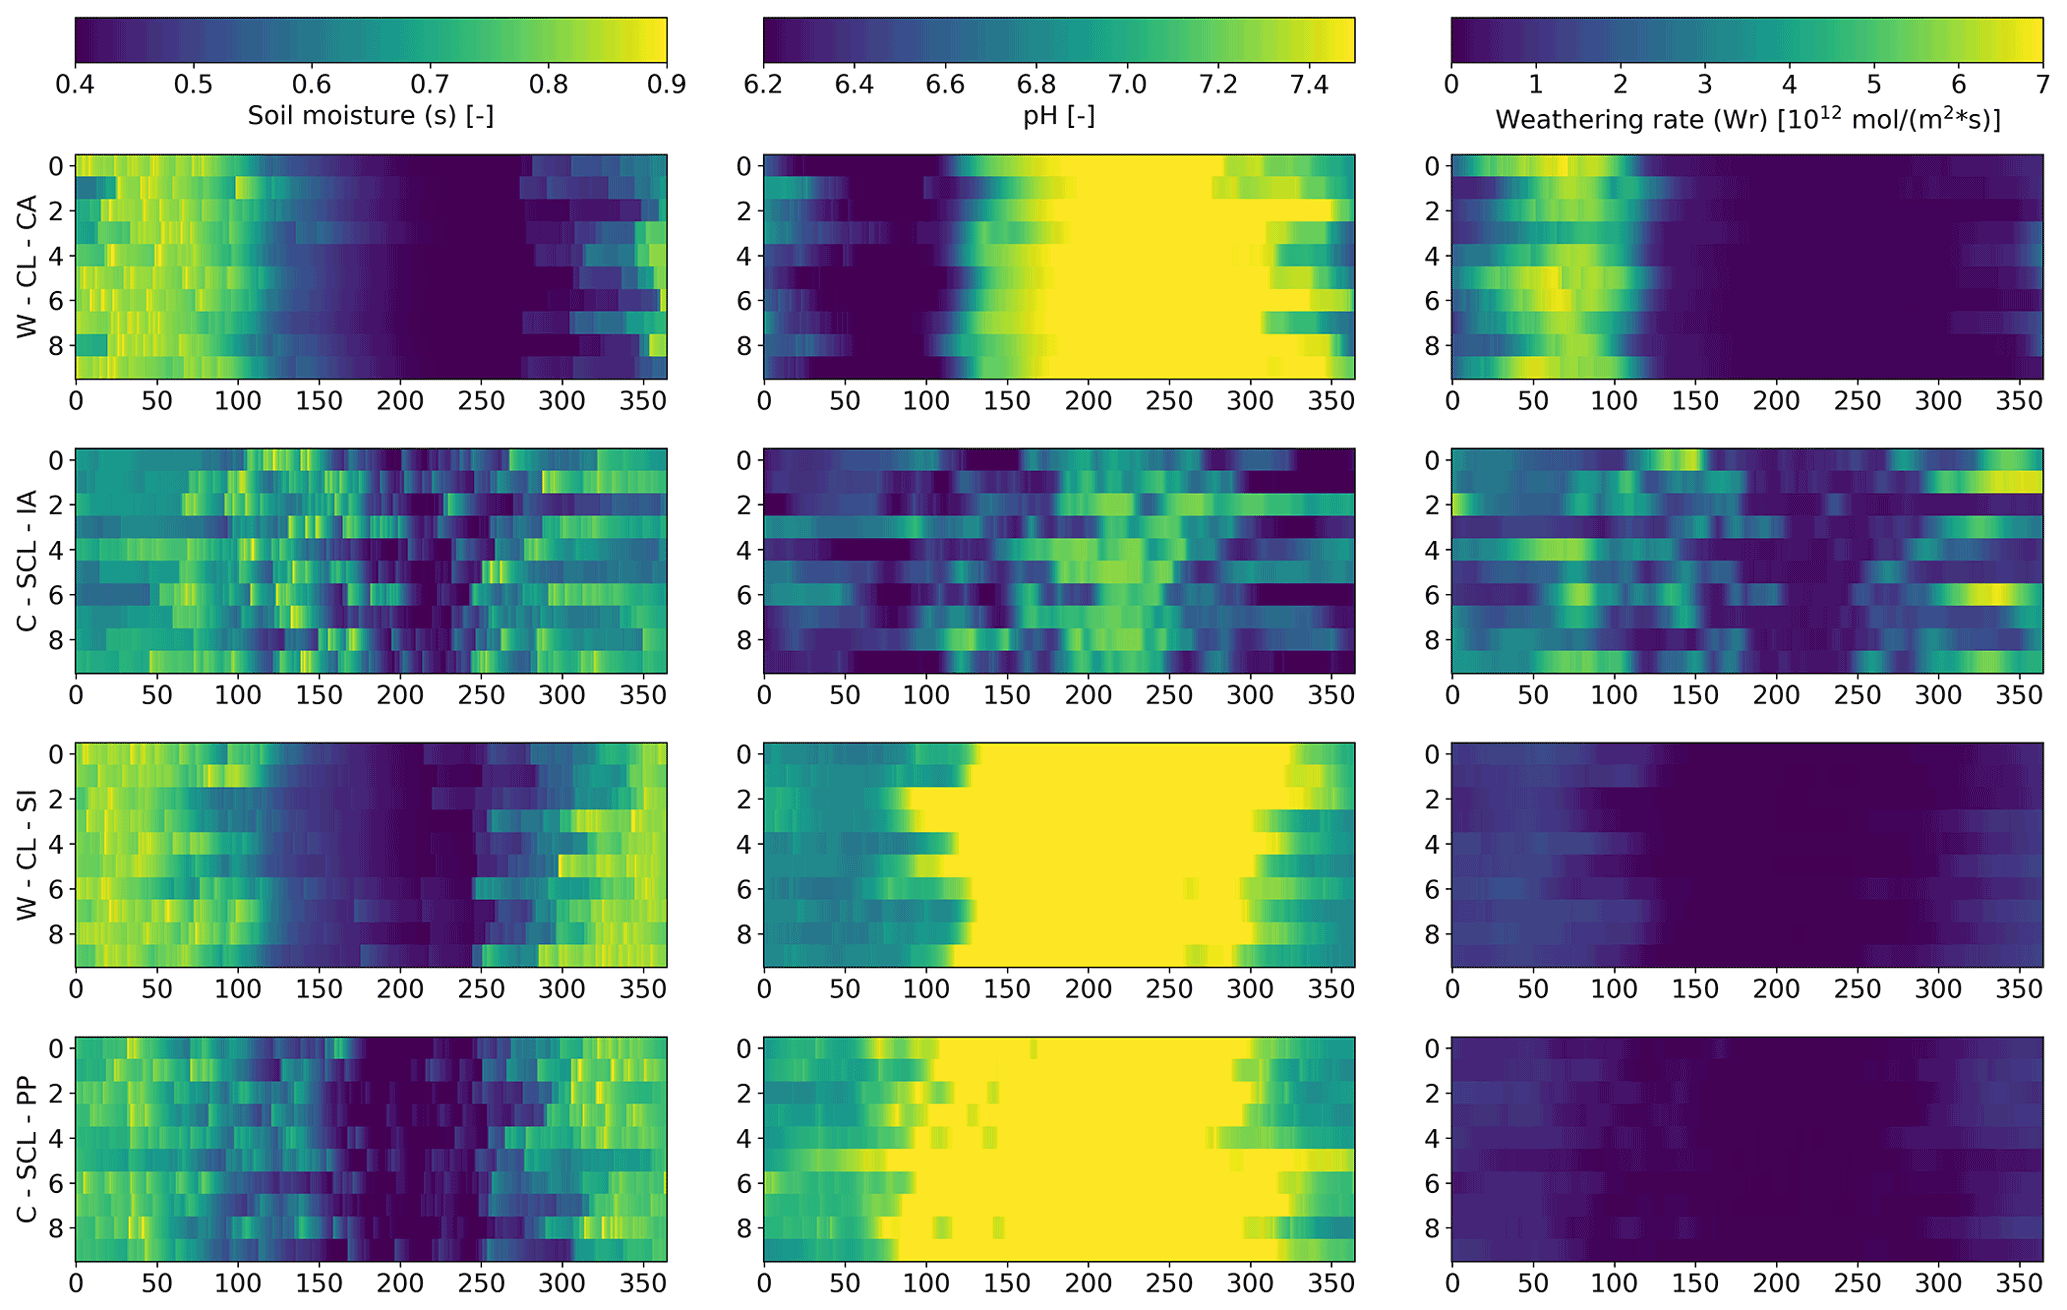
Figure 11Time-series heat maps of soil moisture (s), pH and weathering rate (Wr) computed within 10 years after olivine addition. These are related to wheat planted in clay loam soil for California (W–CL–CA, panels in the first row of the figure), corn in silty clay loam soil for Iowa (C–SCL–IA, panels in the second row of the figure), wheat in clay loam soil for Sicily (W–CL–SI, panels in the third row of the figure) and corn in silty clay loam soil for the Padan plain (C–SCL–PP, panels in the last row of the figure)
The seasonal variability of the sequestered CO2 related to the four sites under study is presented in Fig. 12. This is calculated, as in Cipolla et al. (2021b), as the leaching of the extra and produced by olivine dissolution, considering a time window of 10 years after olivine amendment. In particular, for each time step, the loss of and to groundwater is derived by the product of the leaching rate and the concentration of these ions in soil water, taking into account only the extra amount produced by the weathering reaction. The overall rather low monthly values of sequestered CO2 for all case studies are due to the generally low leaching rate, which reflects the low MAP values for all the considered sites. The annual average sequestered CO2 equals to 0.62 kg ha−1 yr−1 for Sicily, 0.39 kg ha−1 yr−1 for the Padan plain, 2.21 kg ha−1 yr−1 for California and 4.20 kg ha−1 yr−1 for Iowa. The values achieved for the US locations are lower but still comparable with those of Amann et al. (2020), which derived a sequestered CO2 within the range 23–49 kg ha−1 yr−1, amending almost double the amount of olivine with respect to our study (i.e., 22 kg m−2 of dunite corresponding to about 18 kg m−2 of olivine) in his mesocosm experiment with conditions similar to the field environment. Apart from this aspect, the differences in the achieved carbon sequestration rates may be due to the way in which this is computed. Indeed, while Amann et al. (2020) consider the dissolved magnesium produced by olivine dissolution, we refer to the leached concentrations of the extra bicarbonates and carbonates after olivine dissolution. Furthermore, the mesocosm experiment considers two different rain regimes, namely a daily and weekly rainfall, delivering the same total annual precipitation volume. These may be considered as scheduled irrigation interventions, which certainly do not reproduce the stochasticity in the temporal distribution of precipitation.
The seasonal pattern of the sequestered CO2 is very similar to the one of rainfall (Fig. 3), highlighting the fact that hydrological processes play the most relevant role in characterizing EW dynamics. On the other hand, the seasonality of sequestered CO2 is not in phase with crop phenology. A great amount of rainfall, contextually occurring together with low transpiration losses, leads to high soil water content, resulting in a high weathering rate, with a corresponding increase in and concentration produced by olivine reaction with CO2, as well as a high leaching rate. Apart from that, the order of magnitude of sequestered CO2 depends a lot on the achieved weathering rates, which are strongly connected to soil pH before the olivine amendment. In the case studies here presented, this effect is given by the background weathering flux, which provides more acidic conditions within California and Iowa with respect to Sicily and the Padan plain.
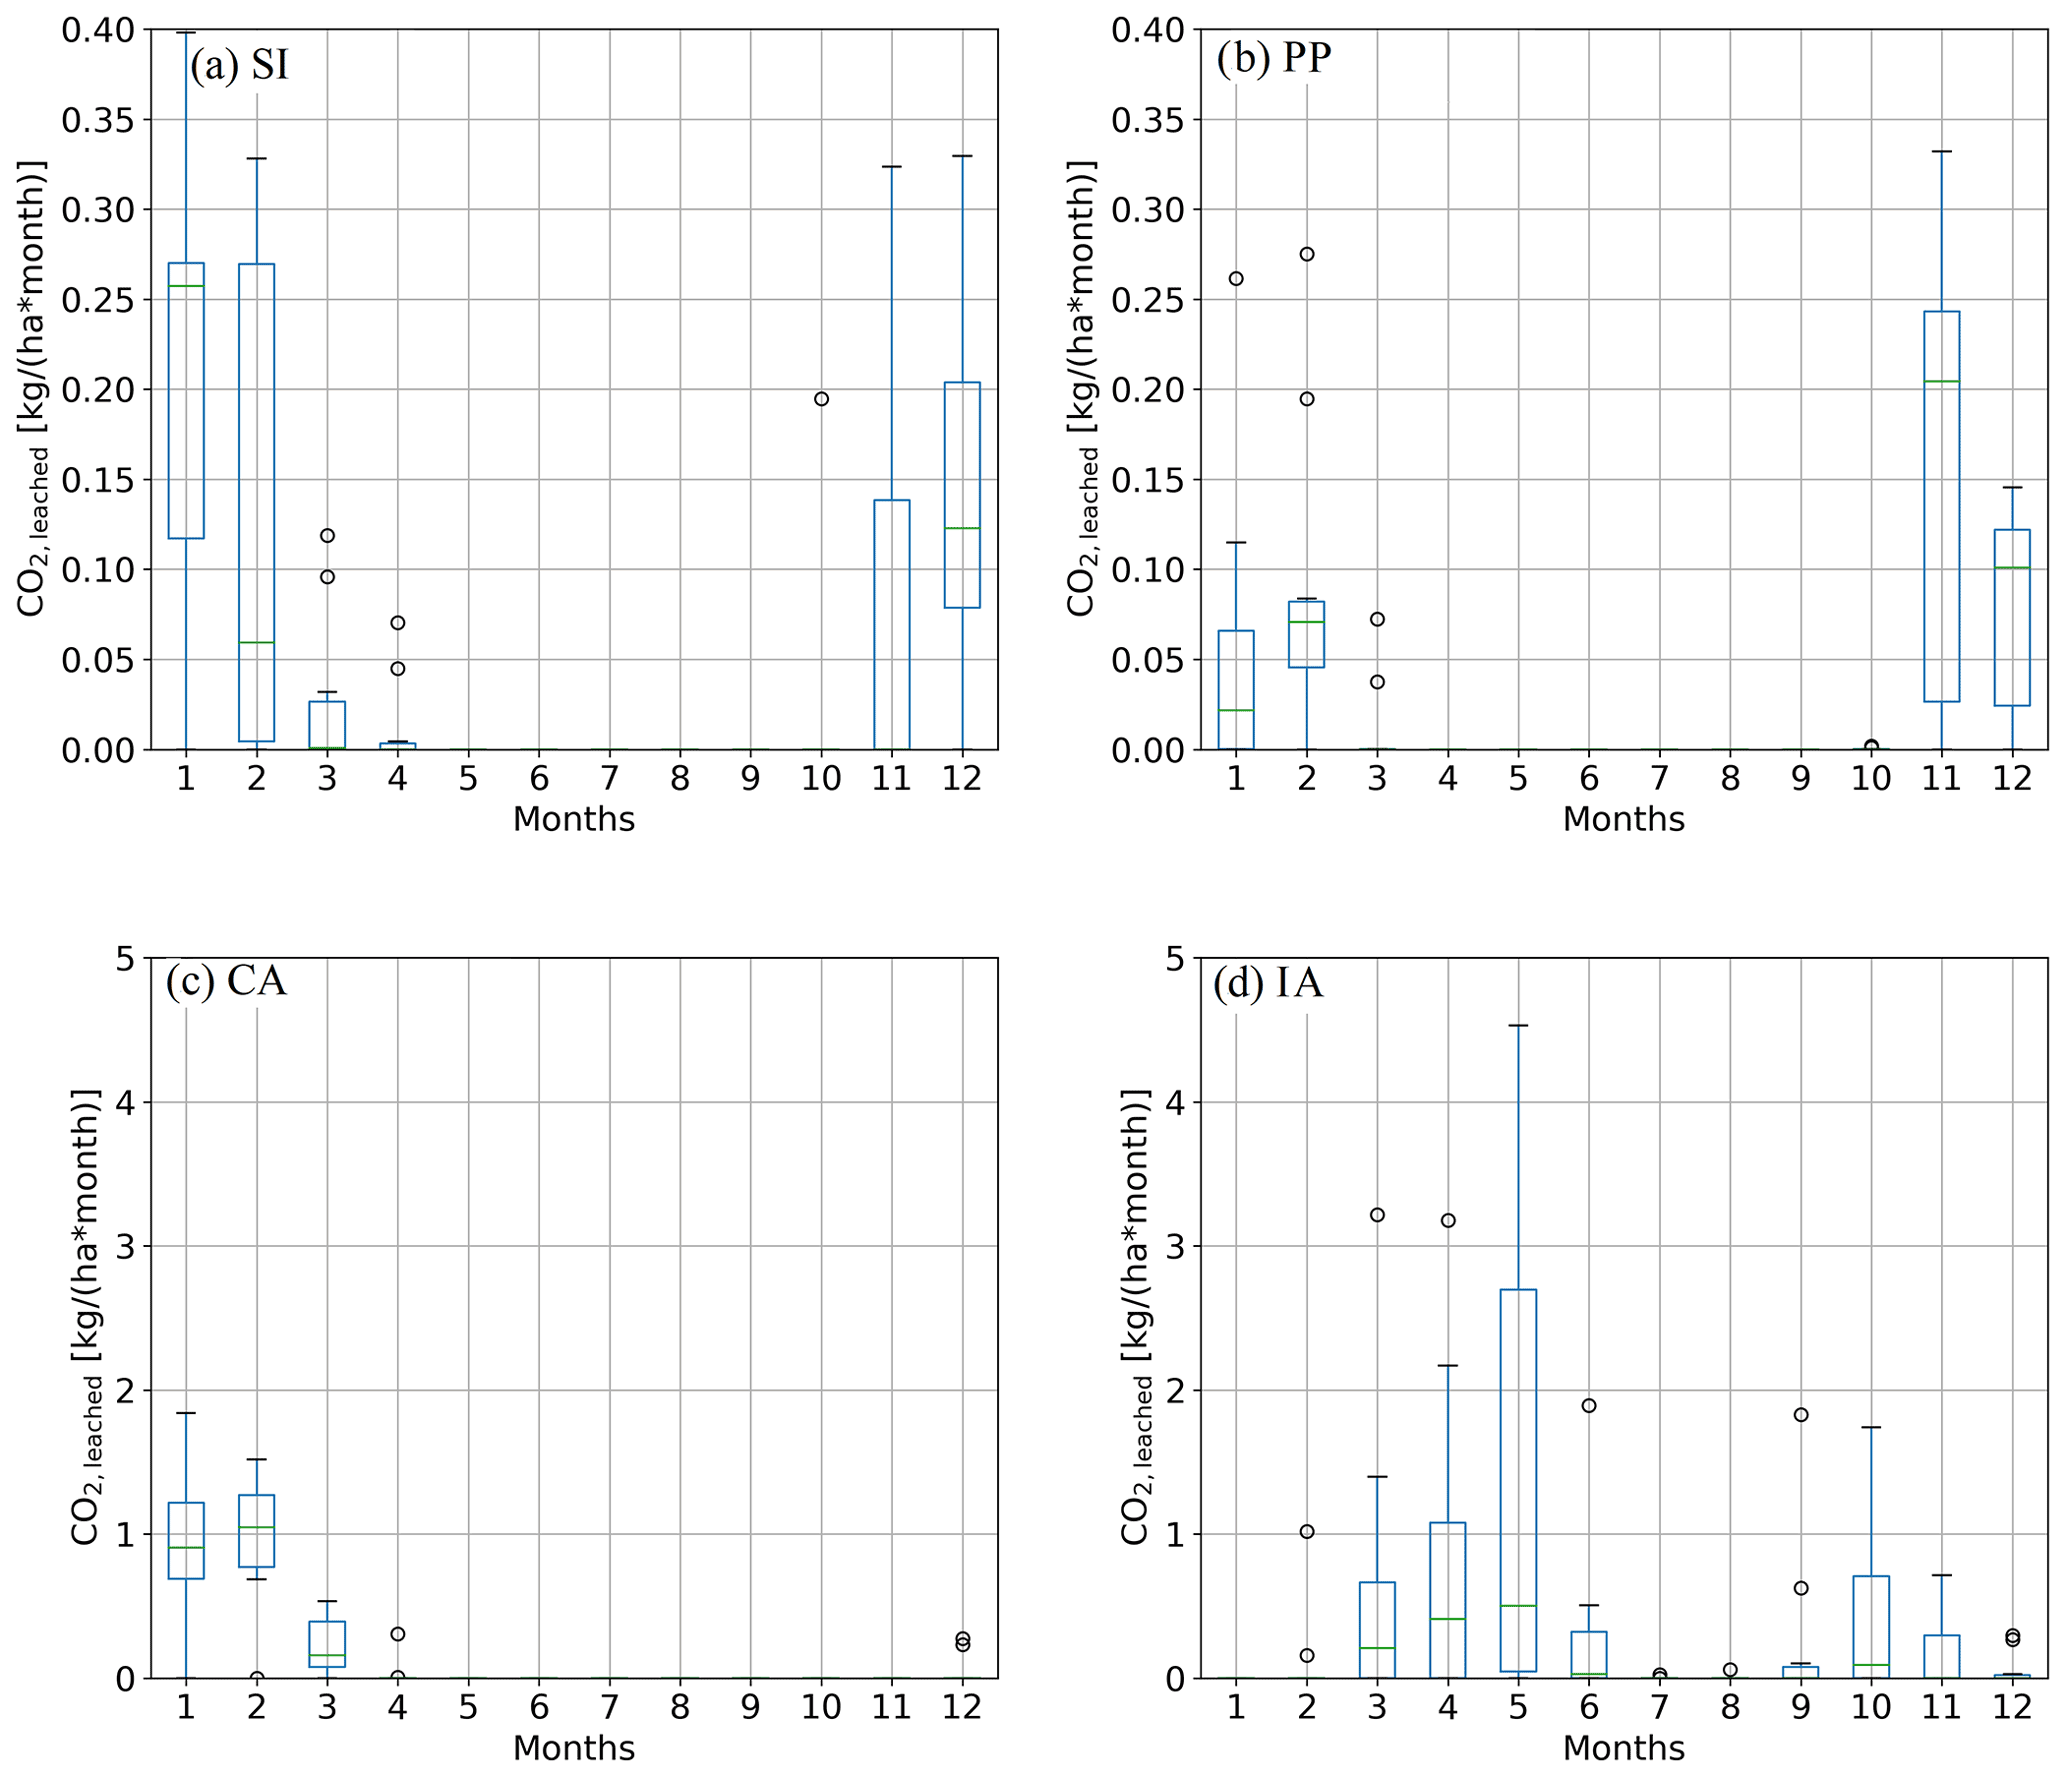
Figure 12Box plots representing the seasonality of the CO2 sequestered by leaching of extra and produced by olivine dissolution, computed over the 10 years subsequent to olivine amendment. The plots are related to (a) wheat in clay loam soil for Sicily (W–CL–SI), (b) corn in silty clay loam soil for the Padan plain (C–SCL–PP), (c) wheat in clay loam soil for California (W–CL–CA) and (d) corn in silty clay loam soil for Iowa (C–SCL–IA).
The introduction of rainfall seasonality, irrigation and crop phenology, in addition to soil properties and composition, in the EW model presented in Cipolla et al. (2021a) is fundamental to characterize EW dynamics in specific cropland areas of the world. In this regard, we here analyzed EW dynamics for two hypothetical case studies in Italy, Sicily and the Padan plain, and two in the USA, California and Iowa.
Analyzing the interactions between rainfall and crop properties helped better capture the EW process in seasonal cropland areas and its carbon sequestration potential. From the case studies presented in this paper, we showed that a fundamental role in EW dynamics is played by rainfall distribution. Comparing EW yields in the case of wheat planted in a clay loam soil for Sicily and California and corn in a silty clay loam of the Padan plain and Iowa, we found that Sicily in the former case and Iowa in the latter are the most favorable for a possible EW intervention. Especially in these latter case studies, the sequestered CO2 is perfectly in phase with rainfall distribution. A great amount of rainfall, contextually occurring during low transpiration losses, leads to high soil water content, resulting in a high weathering rate, with a corresponding increase in and concentration produced by olivine reaction with CO2. Higher soil water contents also mean higher leaching rates and hence better transport of the (bi)carbonate anions away from the active olivine dissolution zone. Irrigation, when considered, provides a significant change in EW dynamics since it leads to a decrease in soil pH and a consequent increase in weathering rate. However, since the stress-avoidance scheme brings soil moisture to the field capacity at most, it does not affect sequestered CO2 by leaching.
Taking into account the case of Iowa, which resulted in the highest carbon sequestration rate and is characterized by a cropland area covered by the corn of about 56 000 km2, the annual average sequestered CO2 (calculated as the average over 10 years of 100 % pure Mg2SiO4 amendment with a rate of 100 t ha−2) could reach the value of about 23 kt yr−1, if the whole cropland area were amended with olivine. Sicily, instead, may sequester on average a mass of 0.2 kt yr−1, if amending the total cropland area cultivated with wheat of about 265 000 ha. As stated by Amann et al. (2020), extending the here achieved carbon sequestration rates at the global scale leads to a low carbon sequestration potential of the EW strategy, if compared with the annual global CO2 emissions by fossil fuels. It is clear that, as we demonstrated in our simulations, an accurate estimation of EW carbon sequestration potential requires an in-depth analysis at the global scale to take the strong spatial variability of the process into account. This would also allow exploring EW dynamics in areas of the world characterized by a higher MAP, thus with a greater capability to sequester carbon. The rates of carbon sequestration presented in Beerling et al. (2020) at the global scale are about 3 orders of magnitude higher than those achieved in this study. However, these are derived using a one-dimensional vertical reactive transport model that considers the CO2 captured by EW as the dissolved inorganic carbon due to the weathering reaction (apart from the CO2 emissions due to logistic operation), which is similar to the one that we called CO2,sw in Cipolla et al. (2021b), which represents the amount of extra bi(carbonate) anions dissolved in soil water due to olivine weathering. In effect, even in our previous work we obtained about a 3-order-of-magnitude difference between the CO2,sw and the CO2 leached, but we believe that the latter is better connected to the actual sequestered CO2, given that some and dissolved in soil water due to olivine dissolution may react with H+ forming the carbonic acid, thus potentially releasing CO2 back to the atmosphere.
The EW applications here presented can be further improved by taking into account some processes that were neglected here. For instance, the competition between fertilizers, composed of nitrates and phosphates, and olivine in the use of H+ ions could be an important aspect to be characterized given that it may alter the olivine weathering reaction rate and, in turn, carbon sequestration. These can be added to the soil to enhance soil fertility and plant productivity, given that many areas of the world present a limitation in nitrogen and phosphorous (Du et al., 2020). Regarding nitrogen fertilization, Hao et al. (2019) carried out a field experiment to understand its impact on soil acidification in a silty clay loam soil in China, adopting a wheat–maize crop rotation system. A pH decrease due to the application of nitrogen fertilizer can be due essentially to three factors, i.e., nitrate leaching, plant uptake of cations and the leaching of bicarbonate ions. The authors derived the contribution on soil pH of each of these three factors, finding out that the greater plant nutrients uptake, due to the increase in soil fertility, is the main factor that leads to pH decrease, given their displacement of H+ action for maintaining the charge balance (Weil and Brady, 2017). Furthermore, the high clay fraction of the soil under study resulted in low leaching of nitrogen products (e.g., ), causing consequent high N losses in the air due to a great denitrification rate. Even though acidification may increase olivine weathering rates, nitric acid (i.e., HNO3) from nitrogen fertilizer would react with carbonate rocks such as those comprising the bedrock in Sicily and the Padan plain, releasing CO2 to the atmosphere (Hartmann et al., 2013) and reducing carbon sequestration potential.
Even though we considered olivine application for EW here, our model is flexible to consider the use of any other silicate mineral. Indeed, many EW experiments have been conducted with wollastonite or using basaltic rocks – among various aspects to avoid or simply reduce the high Ni and Cr content potentially released by olivine during dissolution. These heavy metals are present, in fact, in olivine crystals and are then released upon olivine dissolution. Haque et al. (2020) carried out a wollastonite EW experiment on three farms with different plants, located in three separate sites in Canada. The authors realized that soil inorganic carbon content, in the form of CaCO3, was significantly higher (up to 3 times) than in the same fields without amendment. Furthermore, Kelland et al. (2020) derived greater carbon sequestration rates (i.e., 2–4 t CO2 ha−1 over 1–5 years) with respect to our study and the experiment of Amann et al. (2020) by amending with basalt powder a clay loam soil planted with Sorghum. However, this estimation has been derived by conceptualizing experimental results with a 1-D reactive transport model that does not take into account fluctuations in soil moisture, which are fundamental in EW dynamics. Apart from the leached and , carbon sequestration has been defined as a function of pedogenic carbonate minerals that formed as a result of the combination of calcium and magnesium with bicarbonates of basalt dissolution. Therefore, a possible development of this work may consist of a comparison of EW yields under the amendment of different assemblages of silicate minerals (i.e., basaltic rocks) in various areas of the world, taking into account the dissolution rates of the individual minerals and their relative presence in the silicate rock dust, thus providing a more reliable prediction of EW dynamics.
Another relevant aspect to consider when planning an EW intervention is the economic feasibility on itself. For this purpose, carbon sequestration potentials have to be compared with costs, to find a better compromise between these factors, such that the country adopting this strategy may afford it without a great economic effort. Beerling et al. (2020), after quantifying the CDR potential for several countries of the world, set up a cost analysis for each nation to see if the countries with the highest carbon sequestration potential also present the lowest costs. The authors found an average global cost of about USD 100 per ton of sequestered CO2, with the highest values obtained for the United States, Canada, China, Poland and Spain, especially for a great fraction of the involved cropland area. These costs are, however, similar to other CDR techniques, such as direct air capture and biochar, leading to consideration of EW as a reasonable intervention to mitigate climate change. The main differences in costs depend on many factors, such as the cost of electricity for mineral grinding, transport and spreading operations. An in-depth cost analysis is therefore necessary, with the aim to identify those countries providing simultaneously the highest carbon sequestration potential and minimal related costs. This may be a future enhancement of this work in perspective to apply the EW model at the global scale, deriving a global spatial distribution of CO2 sequestration and costs and providing a tool to decision makers for an actual future application of the EW strategy.
The EW model was developed by a research group, and a detailed description is provided in Cipolla et al. (2021a). The EW model is available upon reasonable request.
To assess rainfall parameters, we used different datasets. The SIAS data are publicly accessible upon registration on the online platform and request to the SIAS agency. The Eraclito datasets of the ARPA Emilia Romagna (https://drive.google.com/file/d/1Hy9KakRnMrcOE5BUaMI_SgbIgOqViBZX/view?usp=sharing, Osservatorio Clima, 2022) and the USGS (https://waterdata.usgs.gov/nwis/current/?type=precip&group_key=state_cd, U.S. Geological Survey, 2022) are publicly accessible, and data can be freely downloaded.
GC carried out part of the conceptualization of the analyses, the data curation, the formal analysis with the EW model, and the investigation and methodology parts, as well as wrote the original draft of the manuscript.
SC and AP contributed to the conceptualization, investigation and methodology parts. They also supervised the work, performed the validation of results and reviewed the original draft of the manuscript. In addition to this, LVN carried out the project administration.
The contact author has declared that none of the authors has any competing interests.
Publisher’s note: Copernicus Publications remains neutral with regard to jurisdictional claims in published maps and institutional affiliations.
This paper was edited by Sara Vicca and reviewed by Ingrid Smet and one anonymous referee.
Allen, R. G., Pereira, L. S., Raes, D., and Smith, M.: Crop evapotranspiration – Guidelines for computing crop water requirements – FAO Irrigation and drainage paper 56, FAO, ISBN 92-5-104219-5, 1998. a
Amann, T., Hartmann, J., Struyf, E., de Oliveira Garcia, W., Fischer, E. K., Janssens, I., Meire, P., and Schoelynck, J.: Enhanced Weathering and related element fluxes – a cropland mesocosm approach, Biogeosciences, 17, 103–119, https://doi.org/10.5194/bg-17-103-2020, 2020. a, b, c, d, e, f, g, h, i, j, k, l
Asibor, J. O., Clough, P. T., Nabavi, S. A., and Manovic, V.: Assessment of optimal conditions for the performance of greenhouse gas removal methods, J. Environ. Manag., 294, 113039, https://doi.org/10.1016/j.jenvman.2021.113039, 2021. a
Ballabio, C., Lugato, E., Fernández-Ugalde, O., Orgiazzi, A., Jones, A., Borrelli, P., Montanarella, L., and Panagos, P.: Mapping LUCAS topsoil chemical properties at European scale using Gaussian process regression, Geoderma, 355, 113912, https://doi.org/10.1016/j.geoderma.2019.113912, 2019. a, b, c
Bandstra, J. Z., Buss, H. L., Campen, R., Liermann, L., Moore, J., Hausrath, E., Navarre-Sitchler, A., Jang, J., and Brantley, S.: Appendix: Compilation of mineral dissolution rates, in: Kinetics of Water–Rock Interaction, 737–823, New York, Springer, 2008. a
Beerling, D. J., Kantzas, E. P., Lomas, M. R., Wade, P., Eufrasio, R. M., Renforth, P., Sarkar, B., Andrews, M. G., James, R. H., Pearce, C. R., Mercure, J.-F., Pollitt, H., Holden, P. B., Edwards, N. R., Khanna, M., Koh, L., Quegan, S., Pidgeon, N. F., Janssens, I. A., Hansen, J., and Banwart, S. A.: Potential for large-scale CO2 removal via enhanced rock weathering with croplands, Nature, 583, 242–248, https://doi.org/10.1038/s41586-020-2448-9, 2020. a, b, c
Buchhorn, M., Lesiv, M., Tsendbazar, N.-E., Herold, M., Bertels, L., and Smets, B.: Copernicus Global Land Cover Layers – Collection 2, Remote Sens., 12v 1044, https://doi.org/10.3390/rs12061044, 2020. a
Calabrese, S. and Porporato, A.: Wetness controls on global chemical weathering, Environ. Res. Commun., 2, 085005, https://doi.org/10.1088/2515-7620/abad7b, 2020. a
Cipolla, G., Francipane, A., and Noto, L. V.: Classification of Extreme Rainfall for a Mediterranean Region by Means of Atmospheric Circulation Patterns and Reanalysis Data, Water Resour. Manag., 34, 3219–3235, https://doi.org/10.1007/s11269-020-02609-1, 2020. a
Cipolla, G., Calabrese, S., Noto, L. V., and Porporato, A.: The role of hydrology on enhanced weathering for carbon sequestration I. Modeling rock-dissolution reactions coupled to plant, soil moisture, and carbon dynamics, Adv. Water Resour., 154, 103934, https://doi.org/10.1016/j.advwatres.2021.103934, 2021a. a, b, c, d, e, f, g, h, i, j, k, l, m, n
Cipolla, G., Calabrese, S., Noto, L. V., and Porporato, A.: The role of hydrology on enhanced weathering for carbon sequestration II. From hydroclimatic scenarios to carbon-sequestration efficiencies, Adv. Water Resour., 154, 103949, https://doi.org/10.1016/j.advwatres.2021.103949, 2021b. a, b, c, d, e, f, g, h, i
Clapp, R. B. and Hornberger, G. M.: Empirical equations for some soil hydraulic properties, Water Resour. Res., 14, 601–604, https://doi.org/10.1029/WR014i004p00601, 1978. a, b
Dietzen, C., Harrison, R., and Michelsen-Correa, S.: Effectiveness of enhanced mineral weathering as a carbon sequestration tool and alternative to agricultural lime: An incubation experiment, Int. J. Greenh. Gas C., 74, 251–258, https://doi.org/10.1016/j.ijggc.2018.05.007, 2018. a
Du, E., Terrer, C., Pellegrini, A. F. A., Ahlström, A., van Lissa, C. J., Zhao, X., Xia, N., Wu, X., and Jackson, R. B.: Global patterns of terrestrial nitrogen and phosphorus limitation, Nat. Geosci., 13, 221–226, https://doi.org/10.1038/s41561-019-0530-4, 2020. a
D'Odorico, P., Laio, F., Porporato, A., and Rodriguez-Iturbe, I.: Hydrologic controls on soil carbon and nitrogen cycles, II. A case study, Adv. Water Resour., 26, 59–70, https://doi.org/10.1016/S0309-1708(02)00095-7, 2003. a, b
Fan, J., McConkey, B., Wang, H., and Janzen, H.: Root distribution by depth for temperate agricultural crops, Field Crops Res., 189, 68–74, https://doi.org/10.1016/j.fcr.2016.02.013, 2016. a
FAO: Global Soil Organic Carbon Map V1.5: Technical report, p. 162, FAO and ITPS, ISBN 978-92-5-132144-7, 2020. a
Goll, D. S., Ciais, P., Amann, T., Buermann, W., Chang, J., Eker, S., Hartmann, J., Janssens, I., Li, W., Obersteiner, M., Penuelas, J., Tanaka, K., and Vicca, S.: Potential CO2 removal from enhanced weathering by ecosystem responses to powdered rock, Nat. Geosci., 14, 545–549, https://doi.org/10.1038/s41561-021-00798-x, 2021. a
Gomez-Casanovas, N., Blanc-Betes, E., Moore, C. E., Bernacchi, C. J., Kantola, I., and DeLucia, E. H.: A review of transformative strategies for climate mitigation by grasslands, Sci. Total Environ., 799, 149466, https://doi.org/10.1016/j.scitotenv.2021.149466, 2021. a
Gruber, C., Zhu, C., Georg, R. B., Zakon, Y., and Ganor, J.: Resolving the gap between laboratory and field rates of feldspar weathering, Geochim. Cosmochim. Ac., 147, 90–106, https://doi.org/10.1016/j.gca.2014.10.013, 2014. a
Hao, T., Zhu, Q., Zeng, M., Shen, J., Shi, X., Liu, X., Zhang, F., and de Vries, W.: Quantification of the contribution of nitrogen fertilization and crop harvesting to soil acidification in a wheat-maize double cropping system, Plant Soil, 434, 167–184, https://doi.org/10.1007/s11104-018-3760-0, 2019. a
Haque, F., Santos, R. M., and Chiang, Y. W.: CO2 sequestration by wollastonite-amended agricultural soils – An Ontario field study, Int. J. Greenh. Gas C., 97, 103017, https://doi.org/10.1016/j.ijggc.2020.103017, 2020. a, b
Hartmann, J. and Moosdorf, N.: The new global lithological map database GLiM: A representation of rock properties at the Earth surface, Geochem. Geophy. Geosy., 13, Q12004, https://doi.org/10.1029/2012GC004370, 2012. a
Hartmann, J., West, A. J., Renforth, P., Köhler, P., De La Rocha, C. L., Wolf-Gladrow, D. A., Dürr, H. H., and Scheffran, J.: Enhanced chemical weathering as a geoengineering strategy to reduce atmospheric carbon dioxide, supply nutrients, and mitigate ocean acidification, Rev. Geophys., 51, 113–149, https://doi.org/10.1002/rog.20004, 2013. a, b, c, d
Hempel, J., Libohova, Z., Thompson, J., Odgers, N. P., Smith, C., Lelyk, G., and Geraldo, G.: GlobalSoilMap North American Node progress, GlobalSoilMap, https://doi.org/10.1201/b16500-11, e-ISBN 9780429227417, 2014. a, b, c
Hengl, T., Mendes de Jesus, J., Heuvelink, G. B. M., Ruiperez Gonzalez, M., Kilibarda, M., Blagotić, A., Shangguan, W., Wright, M. N., Geng, X., Bauer-Marschallinger, B., Guevara, M. A., Vargas, R., MacMillan, R. A., Batjes, N. H., Leenaars, J. G. B., Ribeiro, E., Wheeler, I., Mantel, S., and Kempen, B.: SoilGrids250m: Global gridded soil information based on machine learning, PLOS ONE, 12, 1–40, https://doi.org/10.1371/journal.pone.0169748, 2017. a
Kelland, M. E., Wade, P. W., Lewis, A. L., Taylor, L. L., Sarkar, B., Andrews, M. G., Lomas, M. R., Cotton, T. E. A., Kemp, S. J., James, R. H., Pearce, C. R., Hartley, S. E., Hodson, M. E., Leake, J. R., Banwart, S. A., and Beerling, D. J.: Increased yield and CO2 sequestration potential with the C4 cereal Sorghum bicolor cultivated in basaltic rock dust-amended agricultural soil, Glob. Change Biol., 26, 3658–3676, https://doi.org/10.1111/gcb.15089, 2020. a, b
Köhler, P., Hartmann, J., and Wolf-Gladrow, D. A.: Geoengineering potential of artificially enhanced silicate weathering of olivine, P. Natl. Acad. Sci. USA, 107, 20228–20233, https://doi.org/10.1073/pnas.1000545107, 2010. a
Laio, F., Porporato, A., Ridolfi, L., and Rodriguez-Iturbe, I.: Plants in water-controlled ecosystems: active role in hydrologic processes and response to water stress: II. Probabilistic soil moisture dynamics, Adv. Water Resour., 24, 707–723, https://doi.org/10.1016/S0309-1708(01)00005-7, 2001. a, b
Lal, R., Monger, C., Nave, L., and Smith, P.: The role of soil in regulation of climate, Philos. T. R. Soc. B, 376, 20210084, https://doi.org/10.1098/rstb.2021.0084, 2021. a
Lasaga, A. C.: Chemical kinetics of water-rock interactions, J. Geophys. Res.-Sol. Ea., 89, 4009–4025, https://doi.org/10.1029/JB089iB06p04009, 1984. a, b
Lewis, A. L., Sarkar, B., Wade, P., Kemp, S. J., Hodson, M. E., Taylor, L. L., Yeong, K. L., Davies, K., Nelson, P. N., Bird, M. I., Kantola, I. B., Masters, M. D., DeLucia, E., Leake, J. R., Banwart, S. A., and Beerling, D. J.: Effects of mineralogy, chemistry and physical properties of basalts on carbon capture potential and plant-nutrient element release via enhanced weathering, Appl. Geochem., 132, 105023, https://doi.org/10.1016/j.apgeochem.2021.105023, 2021. a, b
Libohova, Z., Wills, S., Odgers, N. P., Ferguson, R., Nesser, R., Thompson, J. A., West, L. T., and Hempel, J. W.: Converting pH 1:1 H2O and 1:2 CaCl2 to 1:5 H2O to contribute to a harmonized global soil database, Geoderma, 213, 544–550, https://doi.org/10.1016/j.geoderma.2013.08.019, 2014. a, b, c
Osservatorio Clima: ERG5_Eraclito – Dataset climatico dal 1961, Osservatorio Clima [data set], https://drive.google.com/file/d/1Hy9KakRnMrcOE5BUaMI_SgbIgOqViBZX/view?usp=sharing, last access: 1 July 2022. a
Oelkers, E. H., Declercq, J., Saldi, G. D., Gislason, S. R., and Schott, J.: Olivine dissolution rates: A critical review, Chem. Geol., 500, 1–19, https://doi.org/10.1016/j.chemgeo.2018.10.008, 2018. a
Palandri, J. L. and Kharaka, Y. K.: A compilation of rate parameters of water-mineral interaction kinetics for application to geochemical modeling, U. S. Geological Survey, https://doi.org/10.3133/ofr20041068, 2004. a
Peters, S. C., Blum, J. D., Driscoll, C. T., and Likens, G. E.: Dissolution of wollastonite during the experimental manipulation of Hubbard Brook Watershed 1, Biogeochemistry, 67, 309–329, https://doi.org/10.1023/B:BIOG.0000015787.44175.3f, 2004. a
Plummer, L. N., Wigley, T. M. L., and Parkhurst, D. L.: Critical Review of the Kinetics of Calcite Dissolution and Precipitation, in: Chemical Modeling in Aqueous Systems, Am. Chem. Soc., 93, 537–573, 1979. a
Pokrovsky, O. S. and Schott, J.: Kinetics and mechanism of forsterite dissolution at 25 ∘C and pH from 1 to 12, Geochim. Cosmochim. A., 64, 3313–3325, https://doi.org/10.1016/S0016-7037(00)00434-8, 2000. a
Porporato, A., D’Odorico, P., Laio, F., and Rodriguez-Iturbe, I.: Hydrologic controls on soil carbon and nitrogen cycles, I. Modeling scheme, Adv. Water Resour., 26, 45–58, https://doi.org/10.1016/S0309-1708(02)00094-5, 2003. a, b
Ramos, C. G., Hower, J. C., Blanco, E., Oliveira, M. L. S., and Theodoro, S. H.: Possibilities of using silicate rock powder: An overview, Geosci. Front., 13, 101185, https://doi.org/10.1016/j.gsf.2021.101185, 2022. a
Renforth, P., Pogge von Strandmann, P., and Henderson, G.: The dissolution of olivine added to soil: Implications for enhanced weathering, Appl. Geochem., 61, 109–118, https://doi.org/10.1016/j.apgeochem.2015.05.016, 2015. a, b, c, d, e
Rimstidt, J. D.: Diffusion control of quartz and forsterite dissolution rates, Appl. Geochem., 61, 99–108, https://doi.org/10.1016/j.apgeochem.2015.05.020, 2015. a
Rodriguez-Iturbe, I., Porporato, A., Ridolfi, L., Isham, V., and Coxi, D. R.: Probabilistic modelling of water balance at a point: the role of climate, soil and vegetation, P. Roy. Soc. Lond. Ser. A, 455, 3789–3805, https://doi.org/10.1098/rspa.1999.0477, 1999. a
Russell, L. M., Rasch, P. J., Mace, G. M., Jackson, R. B., Shepherd, J., Liss, P., Leinen, M., Schimel, D., Vaughan, N. E., Janetos, A. C., Boyd, P. W., Norby, R. J., Caldeira, K., Merikanto, J., Artaxo, P., Melillo, J. M., and Morgan, M. G.: Ecosystem Impacts of Geoengineering: A Review for Developing a Science Plan, AMBIO, 41, 350–369, https://doi.org/10.1007/s13280-012-0258-5, 2012. a
Shen, X., Yang, F., Xiao, C., and Zhou, Y.: Increased contribution of root exudates to soil carbon input during grassland degradation, Soil Biol. Biochem., 146, 107817, https://doi.org/10.1016/j.soilbio.2020.107817, 2020. a, b
Singer, M. B., Asfaw, D. T., Rosolem, R., Cuthbert, M. O., Miralles, D. G., MacLeod, D., Quichimbo, E. A., and Michaelides, K.: Hourly potential evapotranspiration at 0.1∘ resolution for the global land surface from 1981-present, Sci. Data, 8, 224 , https://doi.org/10.1038/s41597-021-01003-9, 2021. a
Strefler, J., Amann, T., Bauer, N., Kriegler, E., and Hartmann, J.: Potential and costs of carbon dioxide removal by enhanced weathering of rocks, Environ. Res. Lett., 13, 034010, https://doi.org/10.1088/1748-9326/aaa9c4, 2018. a
Taylor, L. L., Beerling, D. J., Quegan, S., and Banwart, S. A.: Simulating carbon capture by enhanced weathering with croplands: an overview of key processes highlighting areas of future model development, Biol. Lett., 13, 20160868, https://doi.org/10.1098/rsbl.2016.0868, 2017. a
Taylor, L. L., Driscoll, C. T., Groffman, P. M., Rau, G. H., Blum, J. D., and Beerling, D. J.: Increased carbon capture by a silicate-treated forested watershed affected by acid deposition, Biogeosciences, 18, 169–188, https://doi.org/10.5194/bg-18-169-2021, 2021. a
ten Berge, H. F. M., van der Meer, H. G., Steenhuizen, J. W., Goedhart, P. W., Knops, P., and Verhagen, J.: Olivine Weathering in Soil, and Its Effects on Growth and Nutrient Uptake in Ryegrass (Lolium perenne L.): A Pot Experiment, PLOS ONE, 7, 1–8, https://doi.org/10.1371/journal.pone.0042098, 2012. a, b, c
U.S. Geological Survey: USGS Current Conditions for the Nation, U.S. Geological Survey [data set], https://waterdata.usgs.gov/nwis/current/?type=precip&group_key=state_cd, last access: 24 August 2022. a
Vicca, S., Goll, D. S., Hagens, M., Hartmann, J., Janssens, I. A., Neubeck, A., Peñuelas, J., Poblador, S., Rijnders, J., Sardans, J., Struyf, E., Swoboda, P., van Groenigen, J. W., Vienne, A., and Verbruggen, E.: Is the climate change mitigation effect of enhanced silicate weathering governed by biological processes?, Glob. Change Biol., 28, 711–726, https://doi.org/10.1111/gcb.15993, 2022. a, b
Vico, G. and Porporato, A.: From rainfed agriculture to stress-avoidance irrigation: I. A generalized irrigation scheme with stochastic soil moisture, Adv. Water Resour., 34, 263–271, https://doi.org/10.1016/j.advwatres.2010.11.010, 2011a. a
Vico, G. and Porporato, A.: From rainfed agriculture to stress-avoidance irrigation: II. Sustainability, crop yield, and profitability, Adv. Water Resour., 34, 272–281, https://doi.org/10.1016/j.advwatres.2010.11.011, 2011b. a
Wang, J., Wang, X., Xu, M., Feng, G., Zhang, W., Yang, X., and Huang, S.: Contributions of wheat and maize residues to soil organic carbon under long-term rotation in north China, Sci. Rep., 5, 11409, https://doi.org/10.1038/srep11409, 2015. a, b
Weil, R. and Brady, N.: The Nature and Properties of Soils, 15th Edn., ISBN 978-0133254488, 2017. a, b
White, A. F. and Brantley, S. L.: The effect of time on the weathering of silicate minerals: why do weathering rates differ in the laboratory and field?, Chem. Geol., 202, 479–506, https://doi.org/10.1016/j.chemgeo.2003.03.001, 2003. a