the Creative Commons Attribution 4.0 License.
the Creative Commons Attribution 4.0 License.
 | 30 Aug 2022
Physical mechanisms for biological carbon uptake during the onset of the spring phytoplankton bloom in the northwestern Mediterranean Sea (BOUSSOLE site)
Liliane Merlivat
Michael Hemming
Jacqueline Boutin
David Antoine
Vincenzo Vellucci
Melek Golbol
Gareth A. Lee
Laurence Beaumont
Several trigger mechanisms have been proposed for the onset of the phytoplankton spring bloom. Among these is that phytoplankton cells begin to bloom when they experience higher average light levels in shallower mixed layers, a result of the surface net heat fluxes becoming positive and wind strength decreasing. We study the impact of these two forcings in the northwestern Mediterranean Sea. We take advantage of hourly measurements of oceanic and atmospheric parameters collected at two neighbouring moorings during the months of March and April in the years 2016 to 2019, combined with glider data in 2016. We identify the onset of the surface phytoplankton growth as concomitant with the start of significant biological activity detected by a sudden decrease in dissolved inorganic carbon derived from measurements in the upper 10 m of the water column. A rapid reduction in wind stress following high-wind events is observed at the same time. A resulting shallow mixing layer favours carbon uptake by phytoplankton lasting a few days. Simultaneously, the air–sea net heat flux switches from negative to positive, linked to changes in the latent air–sea heat flux, which is proportional to the wind speed. This results in an increased thermal stratification of the ocean's surface layers. In 2016, glider data show that the mixing layer is significantly shallower than the mixed layer at the onset of the surface phytoplankton bloom. We conclude that decreases in the mixing- and mixed-layer depths lead to the onset of the phytoplankton growth due to the relaxation of wind speed following storms. We estimate net daily community production in the mixing layer over periods of 3 d between 2016 and 2019 as between 38 and 191 mmol C m−2. These results have important implications, as biological processes play a major role in the seasonal evolution of surface pCO2 and thereby the rate of reduction in atmospheric CO2 by exchange at the air–sea interface.
- Article
(4296 KB) - Full-text XML
- Companion paper
- BibTeX
- EndNote


Investigating the physical and biological mechanisms contributing to changes in air–sea carbon dioxide (CO2) fluxes is essential. It is a critical component of the global carbon cycle and the climate system, with the ocean removing about a quarter of the CO2 emitted into the atmosphere by human activities over the last decade. It depends on the gradient of CO2 partial pressure, pCO2, between the atmosphere and the surface ocean (Takahashi et al., 2009; Rödenbeck et al., 2013; Merlivat et al., 2015). pCO2 in the ocean mixed surface layer depends on the relative contribution of dynamic transport, thermodynamics and biogeochemistry. As the biological carbon pump lowers pCO2 and dissolved inorganic carbon (DIC) at the sea surface, the production of plankton biomass during a bloom can be sufficient to reverse the annual cycle of surface-ocean CO2 uptake. A decrease in surface DIC, after physical processes have been eliminated, indicates the beginning of phytoplankton spring growth. Conceptual frameworks have been proposed to explain when depth-integrated phytoplankton biomass starts accumulating during blooms (Behrenfeld, 2010; Sverdrup, 1953). The timing of the initiation of the surface spring phytoplankton bloom depends in particular on atmospheric forcing (Behrenfeld and Boss, 2014). The physical processes of wind stress, heat flux and vertical mixing control the depth of the mixed/mixing layer and thus the availability of light (Siegel et al., 2002; Chiswell, 2011; Taylor and Ferrari, 2011; Brody and Lozier, 2015; Enriquez and Taylor, 2015; Rumyantseva et al., 2019). Thus, to better understand which fundamental physical processes control the timing of the onset of the surface bloom, in situ measurements are needed at the appropriate hourly to daily timescale. It is important to draw attention to the atmospheric-forcing timescale. In biogeochemical ocean modelling studies, typically built on atmospheric models, reanalysis or satellite data, time resolution of at best a few days is required (Mahadevan et al., 2012).
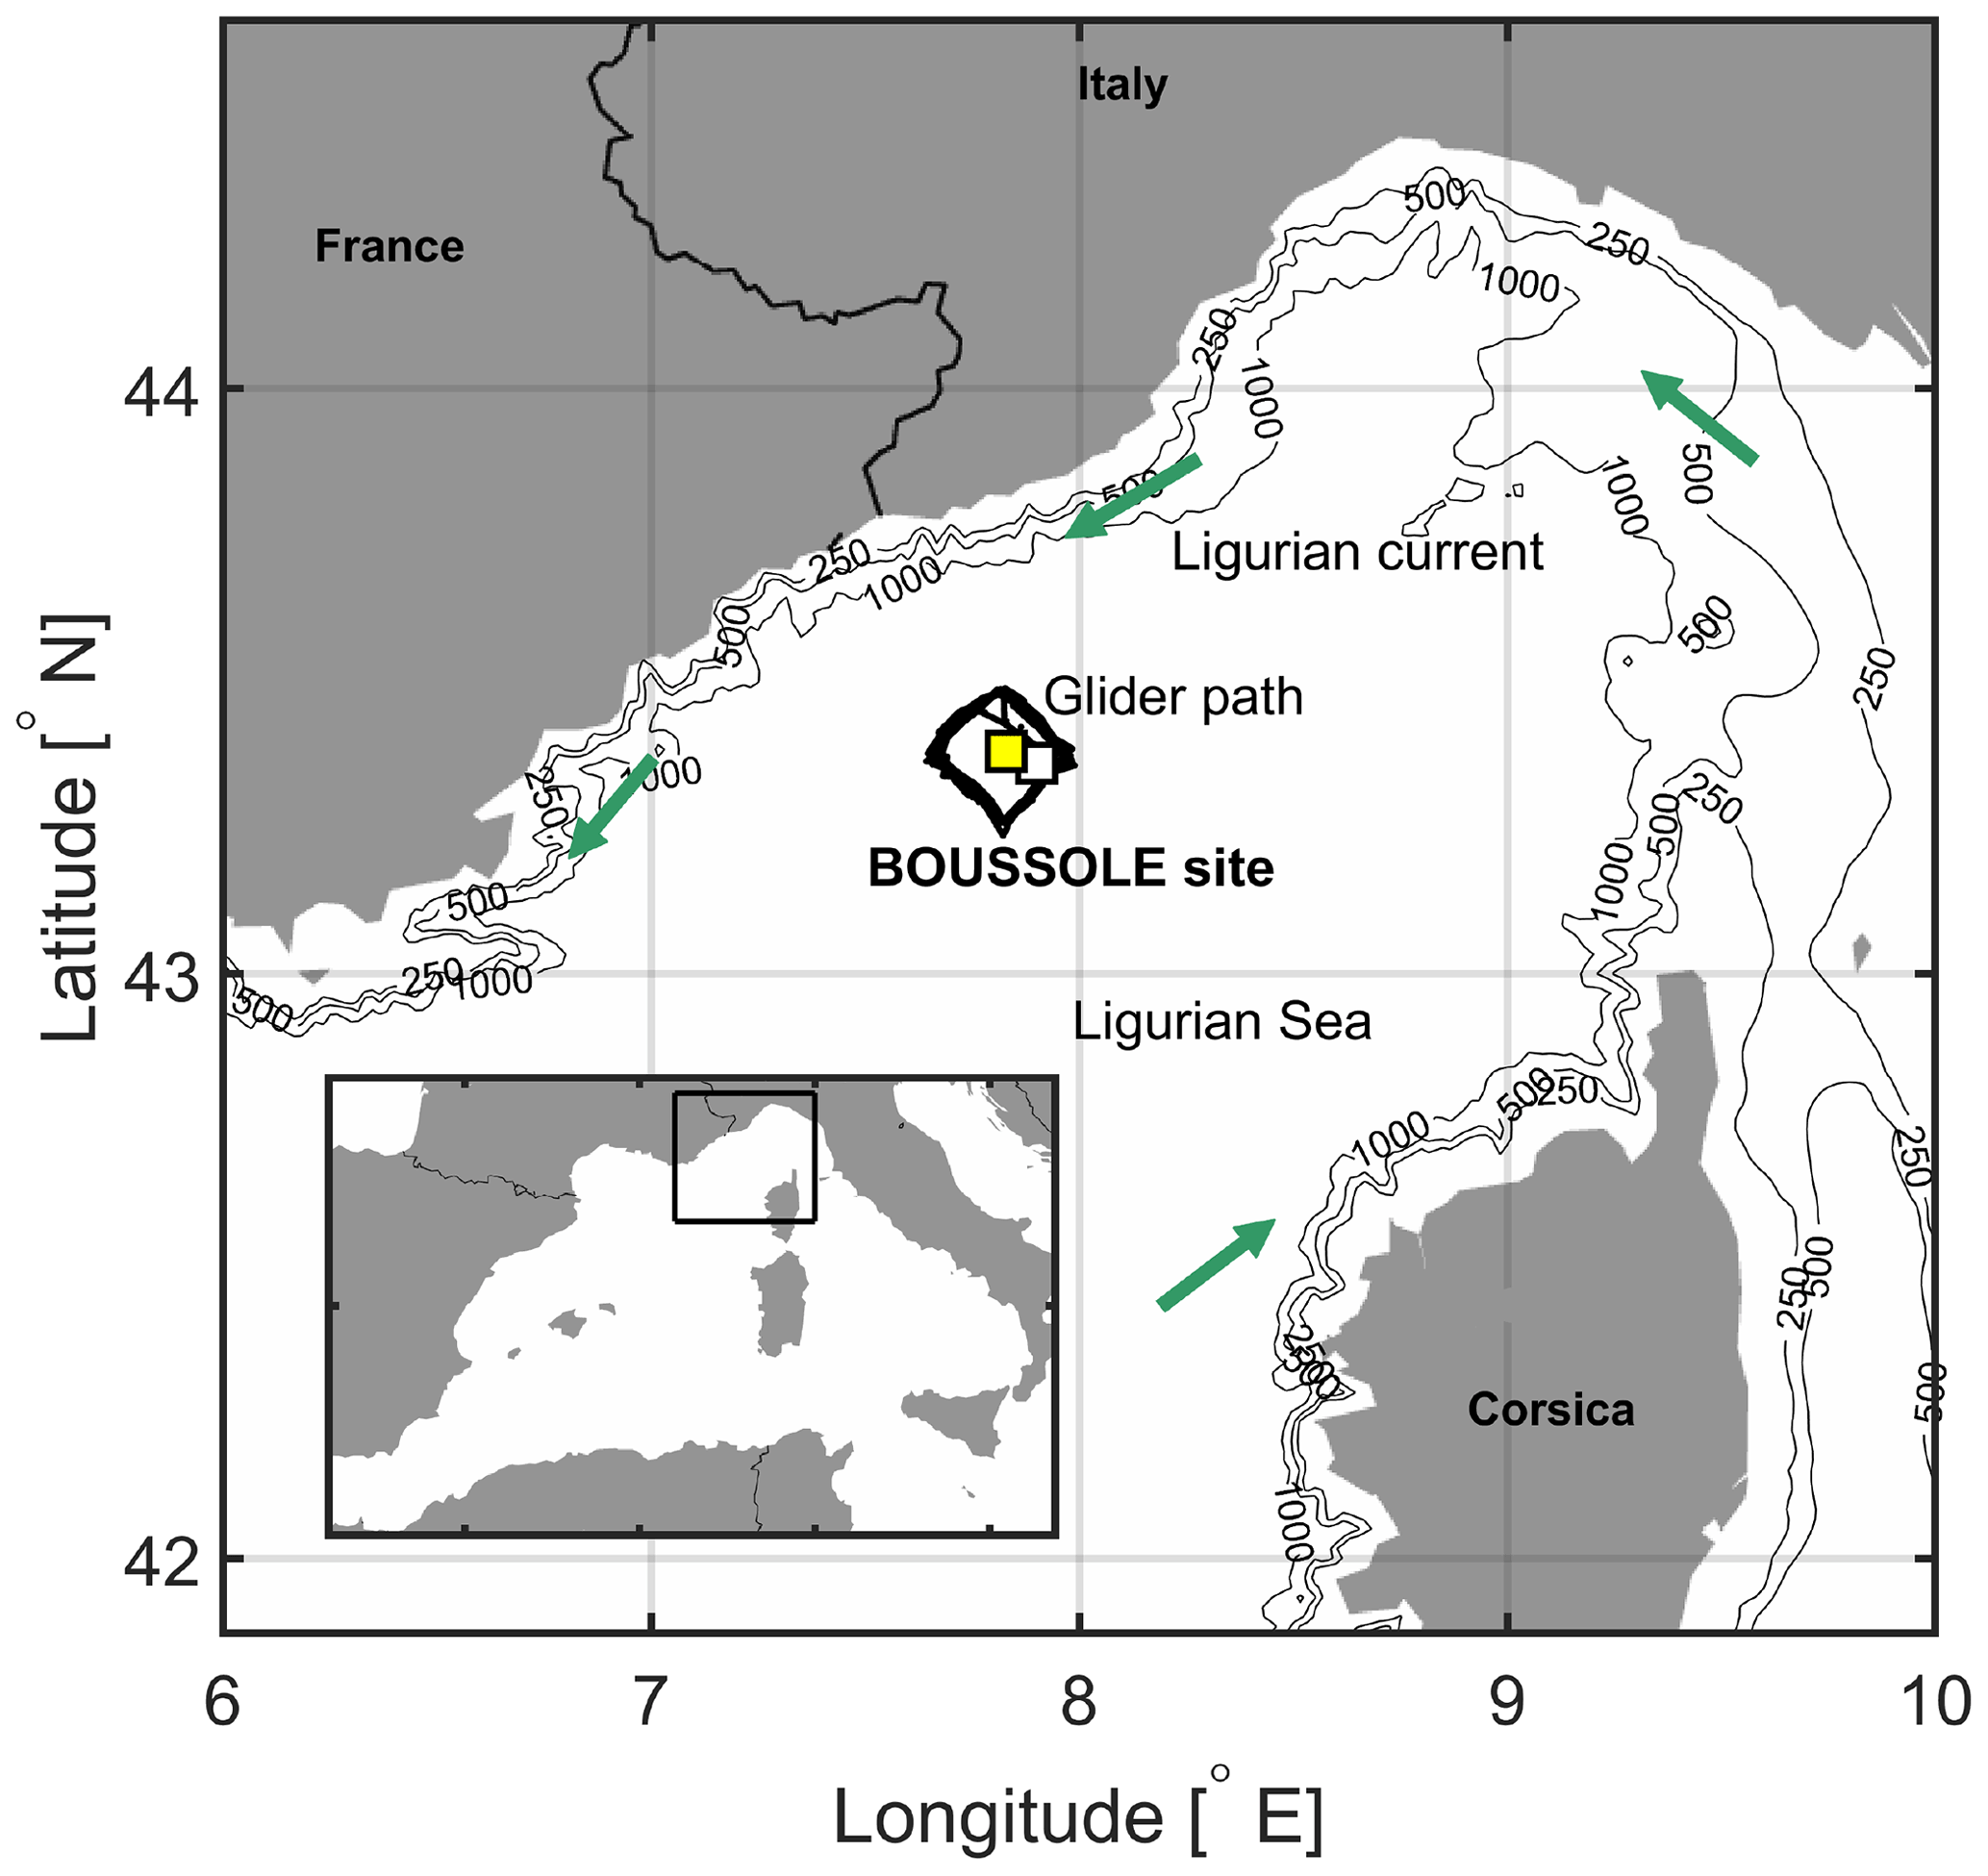
Figure 1The area of the northwestern Mediterranean Sea showing the French Riviera and Italian Riviera, the island of Corsica, the main current branches (green arrows) in the Ligurian Sea, and the locations of the BOUSSOLE buoy (white square) and the Azur meteorological buoy (yellow square). The black line indicates the glider's path in March–April 2016.
In the northwestern Mediterranean Sea, the BOUSSOLE (Bouée pour l'acquisition de Séries Optiques à Long Terme; Antoine et al., 2006, 2008a, b) buoy is located in the central area of the Liguro-Provençal basin (Fig. 1), where the dominant ocean currents are generally weak (< 20 cm s−1) (Millot, 1999; Antoine et al., 2008b; Niewiadomska et al., 2008). The main processes that govern the pCO2 variations at the sea surface on an annual scale, after removal of the temperature effect, are vertical convective mixing and biological production (Begovic and Copin-Montégut, 2002; Copin-Montégut al., 2004; Hood and Merlivat, 2001; Merlivat et al., 2018). Intense convection resulting from repeated high-wind events in winter or early spring when atmospheric temperatures are typically low brings nutrients to the surface layer (Andersen and Prieur, 2000; Antoine et al., 2008b; Marty et al., 2002; Pasqueron de Fommervault et al., 2015).
The objective of this study is to examine the impact of atmospheric forcing on surface phytoplankton bloom initiation in the northwestern Mediterranean Sea. To this aim we use concurrent hourly data of seawater carbon chemistry measured at depths less or equal to 10 m at the BOUSSOLE mooring (Merlivat et al., 2018) and atmospheric flux measurements at the Azur meteorological buoy 3.1 nmi (nautical miles) (5.8 km) away from BOUSSOLE in March and April 2016 to 2019. Additional measurements of phytoplankton chlorophyll a (Chl a), temperature and density were provided by an underwater glider deployed in March–April 2016. The initiation of biological carbon uptake is revealed by the sudden decrease in DIC measured at the BOUSSOLE buoy.
In the “Material and methods” section, we provide the description of data processing, theoretical framework and calculations used to evaluate mixing regimes in the water column and net community production (NCP). The “Results” section presents measured atmospheric and biogeochemical parameters observed in March–April, and NCP estimates from 2016 to 2019. The “Discussion” section relates our results to previous findings and presents our conclusions regarding the drivers of phytoplankton bloom initiation.
2.1 Data from the BOUSSOLE mooring
CARIOCA (CARbon Interface Ocean Atmosphere) sensors (Merlivat and Brault, 1995) installed on the BOUSSOLE buoy (43∘22′ N, 7∘54′ E; Fig. 1) monitored hourly partial pressure, pCO2, at both 3 and 10 m alongside salinity and temperature (Sea-Bird Scientific SBE 37 MicroCAT CTDs; conductivity–temperature–depth). Protocols for calibration of in situ measurements are described in Merlivat et al. (2018). CARIOCA measurements of pCO2 and temperature are combined with total alkalinity (Alk) derived from salinity (Merlivat et al., 2018) to calculate DIC. The dissociation constants of Mehrbach et al. (1973) refitted by Dickson and Millero (1987) are used, as recommended by Álvarez et al. (2014) for the Mediterranean Sea. For the months March–April, mean salinity is 38.3, corresponding with mean Alk equal to 2571.4 µmol kg−1 (Copin-Montégut et al., 2004). The expected precision of the CARIOCA pCO2 and DIC is 5 µatm and 3 µmol kg−1, respectively (Merlivat et al., 2018).
2.2 Glider observations
An iRobot Seaglider model 1KA (SG537) with an ogive fairing operated by the University of East Anglia (UEA) (see Hemming et al., 2017) was deployed during the BOUSSOLE monthly cruise (no. 169) (Golbol et al., 2000) and recovered 1 month later with a ship of opportunity. Diving to 1000 m, 147 dives were completed between 7 March and 5 April 2016, repeatedly sampling a square-shaped path surrounding the BOUSSOLE buoy (Fig. 1) with corners pointing to cardinal directions. Out of 147 dives, a number of them contain data that are within 10 km of the BOUSSOLE mooring, i.e. when it was sampling in the eastern corner of the diamond path. The glider was equipped with a non-pumped Sea-Bird Scientific SBE 9 CTD instrument package providing temperature and salinity and a WET Labs Eco Puck sensor providing relative phytoplankton Chl a fluorescence factory-calibrated into Chl a concentration units (mg m−3) locally adjusted with HPLC (high-performance liquid chromatography) between 100–400 m chlorophyll water samples. We excluded glider Chl a between 05:00 and 20:00 UTC affected by sunlight-induced fluorescence quenching, and we applied a depth-constant offset to glider measurements using Chl a water samples available on 7 March.
2.3 Azur meteorological buoy
The Azur meteorological buoy has been deployed since 1999 by the French weather forecast agency (Météo-France) at 43∘23′ N, 7∘50′ E (Fig. 1). It provides hourly measurements of surface wind speed extrapolated to 10 m height, U10 (m s−1); net incoming and emitted long-wave radiation; incoming short-wave radiation; and the sensible and latent heat fluxes. These are needed to estimate the net air–sea heat budget at the sea surface (http://mistrals.sedoo.fr, last access: 20 March 2017). U10 is used to calculate wind stress, τ, as follows: τ=ρa Cd , where ρa is air density (1.2 kg m−3) and Cd is the drag coefficient (). Photosynthetically active radiation (PAR, mol photons m−2 d−1) is related to solar irradiance (i.e. short-wave flux), SW, following PAR = 0.473 SW (Papaioannou et al., 1993).
2.4 Estimation of mixed- and mixing-layer depths
The mixing-layer depth, Zmx, is the upper part of a mixed layer of uniform density where active turbulence occurs (Brainerd and Gregg, 1995). Several recent studies have highlighted the significance of this layer to understand the phytoplankton phenology of phytoplankton blooms (Brody and Lozier, 2015; Taylor and Ferrari, 2011). Autonomous profiling floats equipped with bio-optical sensors have also highlighted the importance of mixing rather than mixed layers to characterise the onset and the development of a phytoplankton bloom. Wind-driven and buoyancy-driven regimes control the characteristics and depth of active mixing (Brody and Lozier, 2014, 2015; Ramuyantseva et al., 2015; Lacour et al., 2019; Pellichero et al., 2020). Wind-driven mixing dominates in the presence of weak buoyancy forcing when heat fluxes are small. In that case, the dominant mixing length scale is equal to the Ekman length layer depth scale.
The daily mean mixed-layer depth, Zml, is derived for 2016 from glider vertical profiles of temperature and salinity using the algorithm provided by Holte and Talley (2009) estimated using the potential density algorithm.
To estimate Zmx, τ is used to calculate the Ekman layer depth, Zek, as , where γ is an empirical constant (0.5); f is the Coriolis parameter (10−4 s−1) over the BOUSSOLE area; and u∗ is the turbulent friction velocity, (m s−1), with ρw being the density of the surface seawater (Lacour et al., 2019). When heat fluxes are large and positive, Enrikez and Taylor (2015) proposed to express the mixing depth, Zmx, in terms of the surface forcing, i.e. the surface stress and a stabilising surface buoyancy flux, B0, as follows:
with C3=1; C4=0.57; and , where Q is the net surface heat flux, λ is the thermal expansion coefficient ( ∘C−1), g is the gravitational acceleration (9.81 m s−2), cp is the specific heat of water (J kg−1 ∘C−1) and ρ0 is the pure water density (1000 kg m−3).
2.5 Estimation of euphotic depth
The euphotic depth, Zeu, is generally derived as the depth where PAR is 1 % of its surface value. Zeu can be estimated from Chl a at the surface using the method described by Lee et al. (2007) based on the equation of Morel and Berthon (1989):
For the period between 2017 and 2019, GlobColour merged Chl a products were used, which are based on satellite observations with a resolution of 25 km and a binning period of 8 d (http://www.oceancolour.org, last access: 20 March 2017). For 2016, glider surface Chl a was used to derive Zeu instead of satellite measurements.
2.6 Estimation of average mixing-layer irradiance
We calculate the average mixing-layer irradiance, I; function of the incident surface irradiance, PAR; mixing-layer depth, h; and the diffuse attenuation coefficient, Kd, estimated from surface chlorophyll a concentrations (Venables and Moore, 2010).
2.7 Estimation of net community production
Biological net community production rates, NCP (mmol m−2 d−1), are calculated for separate 3 d periods in March–April 2016 to 2019 from DIC concentrations derived from CARIOCA measurements, assuming that measurements in the top 10 m of the water column are representative of an homogeneous mixing layer (Boutin and Merlivat, 2009; Merlivat et al., 2015; Pelicherro et al., 2020). In the study area, current velocities are expected to be small (Millot, 1999; Antoine et al., 2008; Niewiadomska et al., 2008); hence to estimate NCP, we assume that the contribution of horizontal advection was negligible. Vertical mixing events are identified by an increase in DIC resulting from upward movement of high-DIC Levantine Intermediate Water (LIW) at approximately 200 m depth (Copin-Montégut and Bégovic, 2002). We isolated time periods when local physical processes were largely one-dimensional in order to study changes in biological and chemical parameters that occurred during rapid transitions from deep mixing to intermittent stratification. In 2016, over a 4 d period, 18–21 March, the diurnal cycle of DIC values, characterised by a maximum in the morning followed by a minimum at the end of the day, indicates the onset of organic matter formation. The eddy diffusion term is negligible, as the DIC gradient at the base of the mixing layer is very weak; entrainment is not expected, as changes in DIC are observed during periods of stratification. For the identified periods, biological production and air–sea exchange are the dominant processes responsible for daily changes in DIC.
NCP is thus estimated from temporal variation in the DIC integrated over Zmx (DICint) and corrected for the air–sea CO2 flux contribution (Pelicherro et al., 2020):
The first term in Eq. (4), , is the daily variation in DICint calculated over 3 d from the date identified as the start of phytoplankton growth (t0), whilst the remaining part corresponds to DIC variability due to air–sea CO2 exchange, where k is the gas transfer velocity (Wanninkhof, 2014); s is the solubility of CO2 in seawater (Weiss, 1974); and pCO2sw and pCO2atm are, respectively, the partial pressures of CO2 (µatm) in seawater and in air (Merlivat et al., 2018).
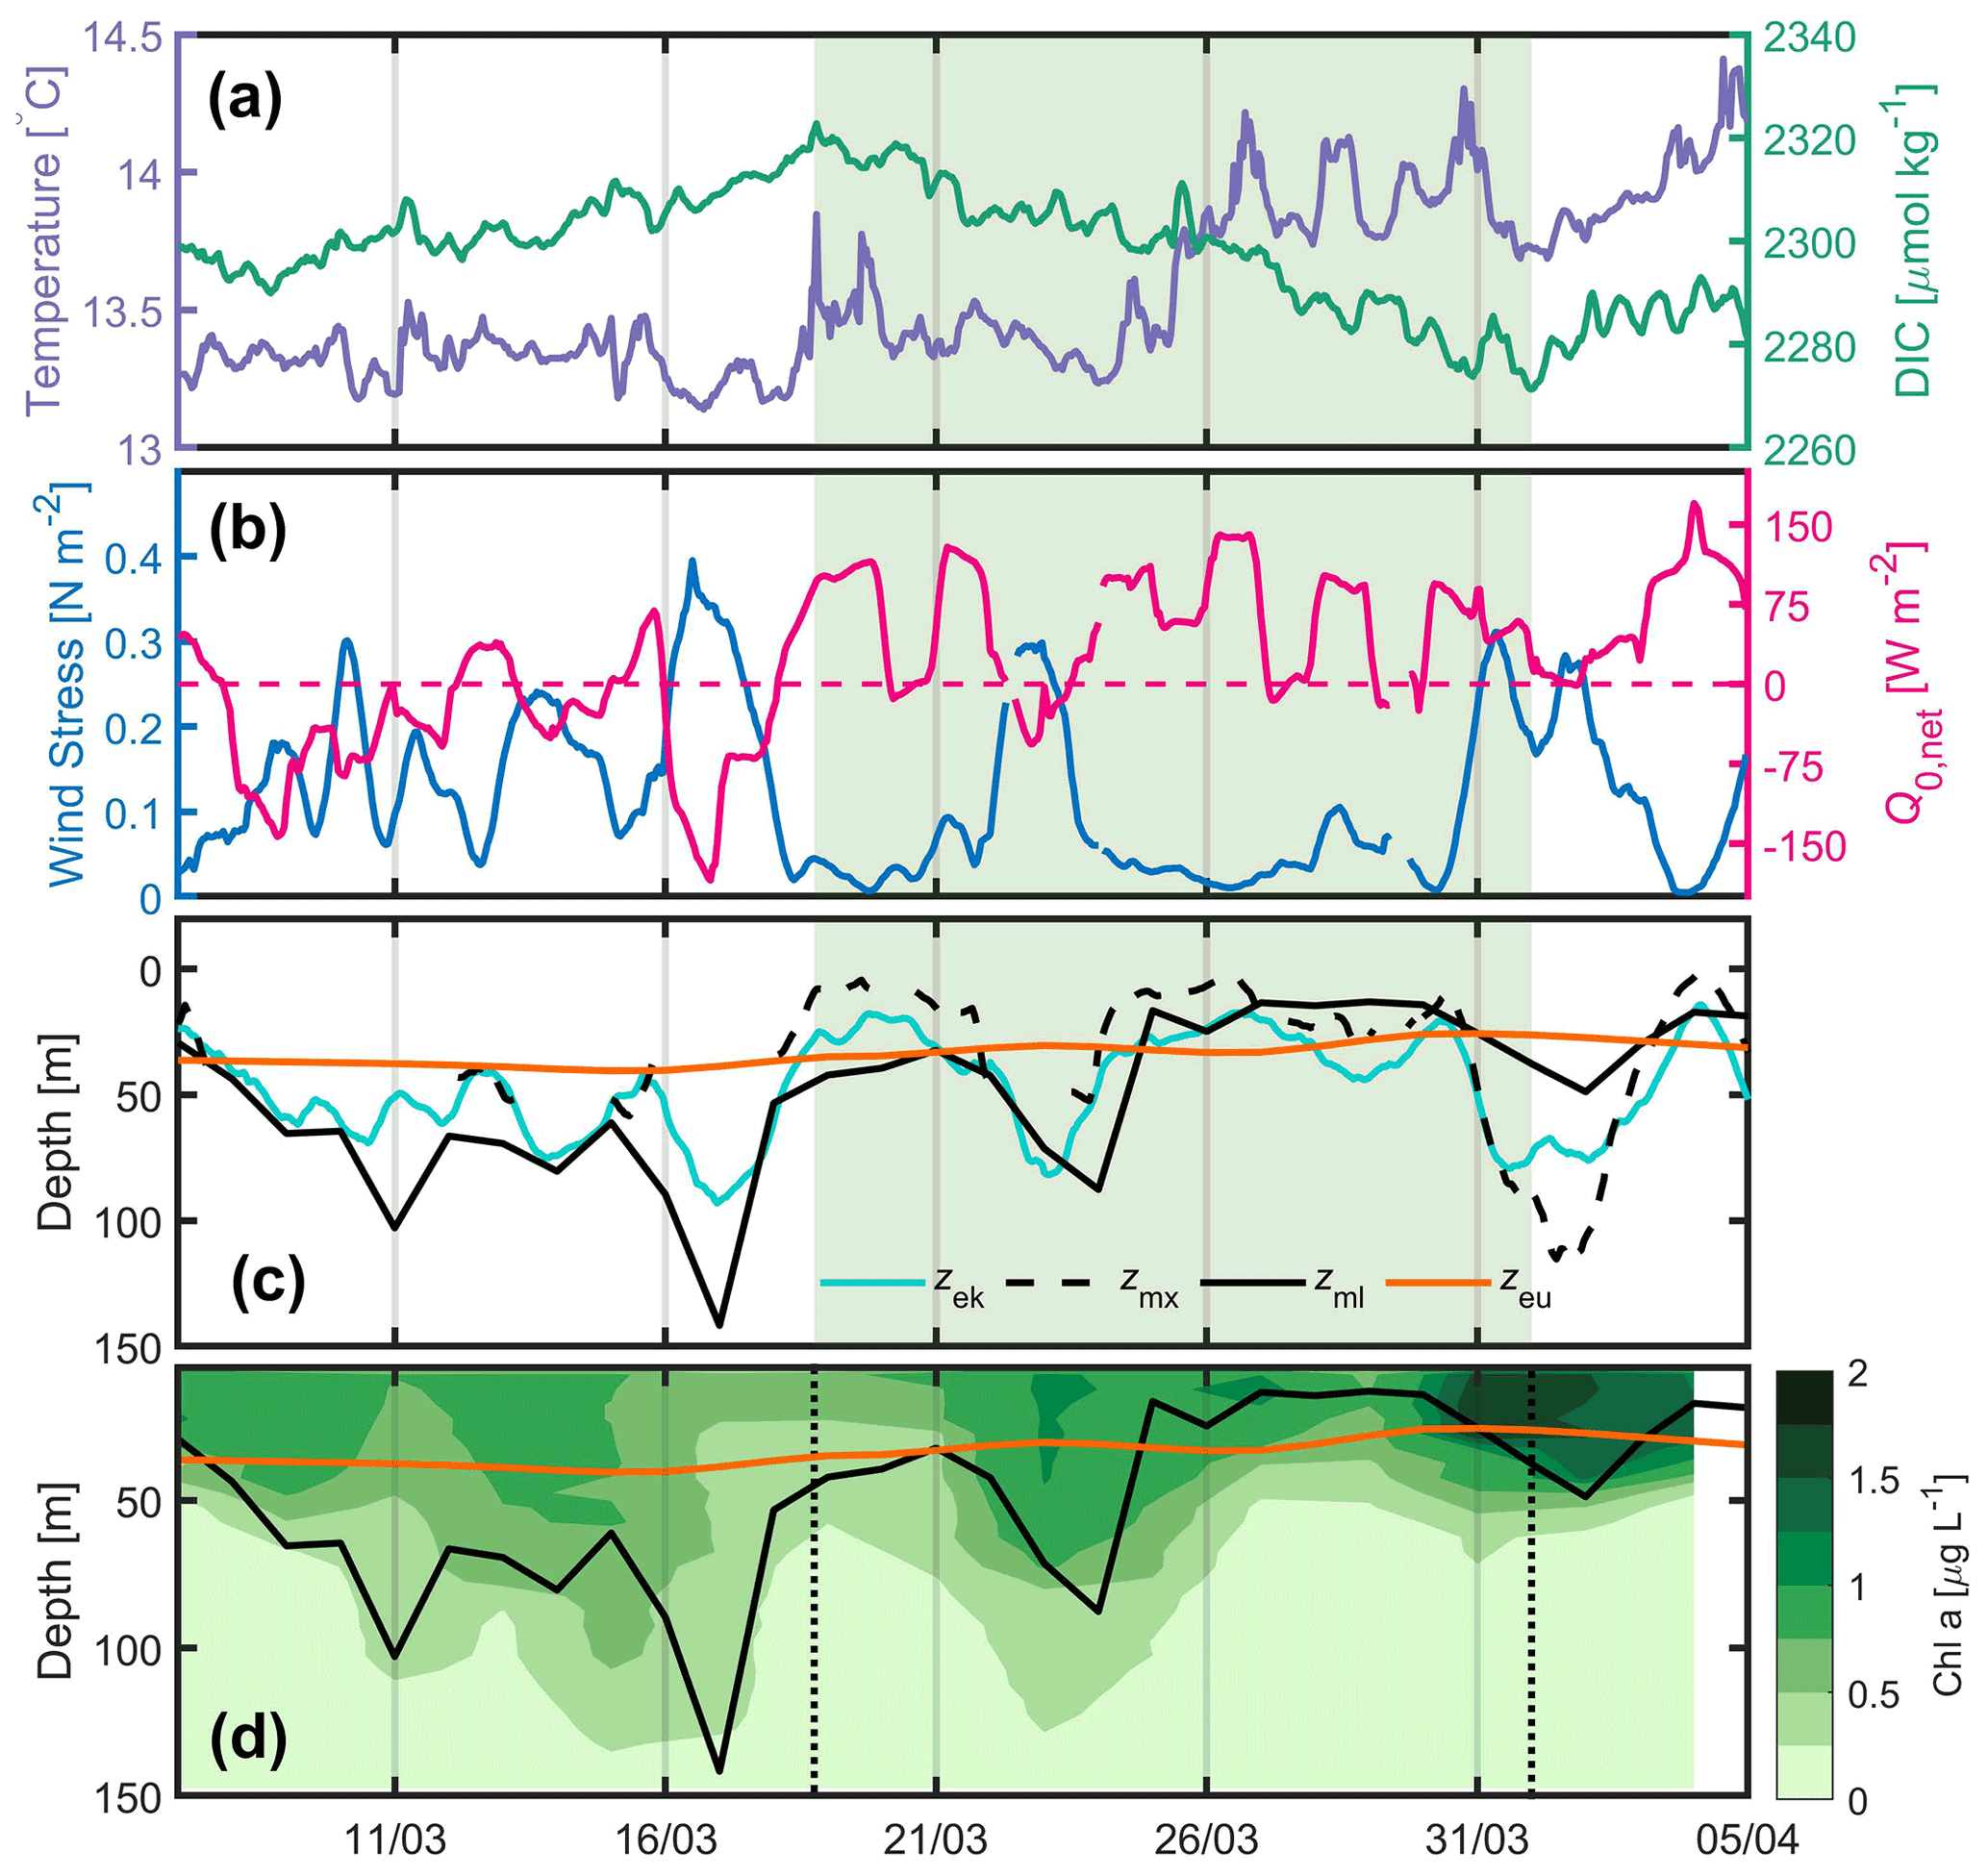
Figure 22016. (a) Hourly DIC (green) and SST (sea surface temperature; purple) at the BOUSSOLE site, (b) hourly wind stress (blue) and net heat flux (pink) at the Azur buoy site. The pink dotted line indicates the change in sign of the net heat flux from negative to positive values, (c) daily depths of the mixed layer (black), mixing layer (dotted black), Ekman layer (cyan) and euphotic layer (orange) at the BOUSSOLE site. The black dotted line in panels (a), (b), (c) and (d) indicates the beginning of DIC decrease on 18 March. (d) Glider-derived depths of the mixed layer (black curve, same as in c), euphotic layer (orange) and nighttime 2 d binned chlorophyll concentration (green colouring) retrieved between 7 March and 5 April.
3.1 Description of the 2016 time series
Physical and biogeochemical parameters have been measured between 7 March and 5 April 2016 (Fig. 2). We observe an initial increase in DIC until 18 March (Fig. 2a), resulting from the vertical mixing of surface waters with the DIC-enriched underlying LIW (Copin-Montégut and Bégovic, 2002), followed by a decrease in DIC that corresponds to an increase in surface Chl a (Fig. 2e). Temperature increases intermittently over the same time period (Fig. 2d), with a sharp increase on 18 and 25 March. Before 18 March frequent atmospheric fronts associated with wind forcing between 0.2 and 0.5 N m−2 were observed (Fig. 2b). Q0,net was negative most of the time leading up to 18 March but mostly positive afterwards (Fig. 2b). A clear anticorrelation was observed between τ and Q0,net (Fig. 2b). The mixed-layer depth derived from the glider measurements (< 20 km away from the BOUSSOLE site) deepened to > 70 m at times between 8 and 18 March, consistent with the passage of frequent atmospheric fronts. From 18 March to 5 April, Zml shoaled from ∼ 45 to ∼ 10 m, excluding two short periods around 24 March and 2 April when atmospheric fronts were passing (Fig. 2c). From 18 to 31 March, Zmx was for a considerable time either shallower than or at a similar depth to Zml and Zeu (Fig. 2c).
During periods of a few days, from 7 March to 5 April, increases in glider Chl a were observed as the result of a series of net accumulation/mixing events. Following the initial growth of surface phytoplankton identified by the DIC decrease on 18 March, biomass accumulation was observed a few days later (Fig. 2e). The same was observed in the Southern Ocean (Pelicherro et al., 2019).
3.2 Description of the 2017–2018–2019 time series
Only measurements at the BOUSSOLE and Azur buoys were available between 2017 and 2019. Here we focus on the periods between 1 March and 25 April. In 2017, from 9 March, after the passage of a very active atmospheric front (τ up to 2.7 N m−2), a decrease in DIC accompanied by an increase in temperature was observed for a period of 14 d despite a few short bursts of vertical mixing, typically lasting less than 1 d (Fig. 3a, d, g). At the same time, the net surface heat flux switched from negative to positive most of the time. Over this 14 d period, Zmx was predominantly shallower than the Zeu at times when DIC was decreasing.
In 2018 (Fig. 3b, e, h) and 2019 (Fig. 3c, f, i), the weather records throughout the month of March are very similar, showing a succession of very strong wind events at the start of the investigated time periods, with τ values of up to 3.7 N m−2 and Zek values as deep as 300 m. On 5 April 2018, following a period of high wind stress resulting in the formation of a deep mixing layer (∼ 250 m), a decrease in DIC and an increase in SST were observed over 3 d. At the same time, the net heat flux oscillated around zero. In 2019, CARIOCA data were only available after 24 March. On 30 March, 3 d after high winds, a decrease in DIC and an increase in temperature lasted 3 d, while simultaneously the net heat flux reversed from negative to positive.
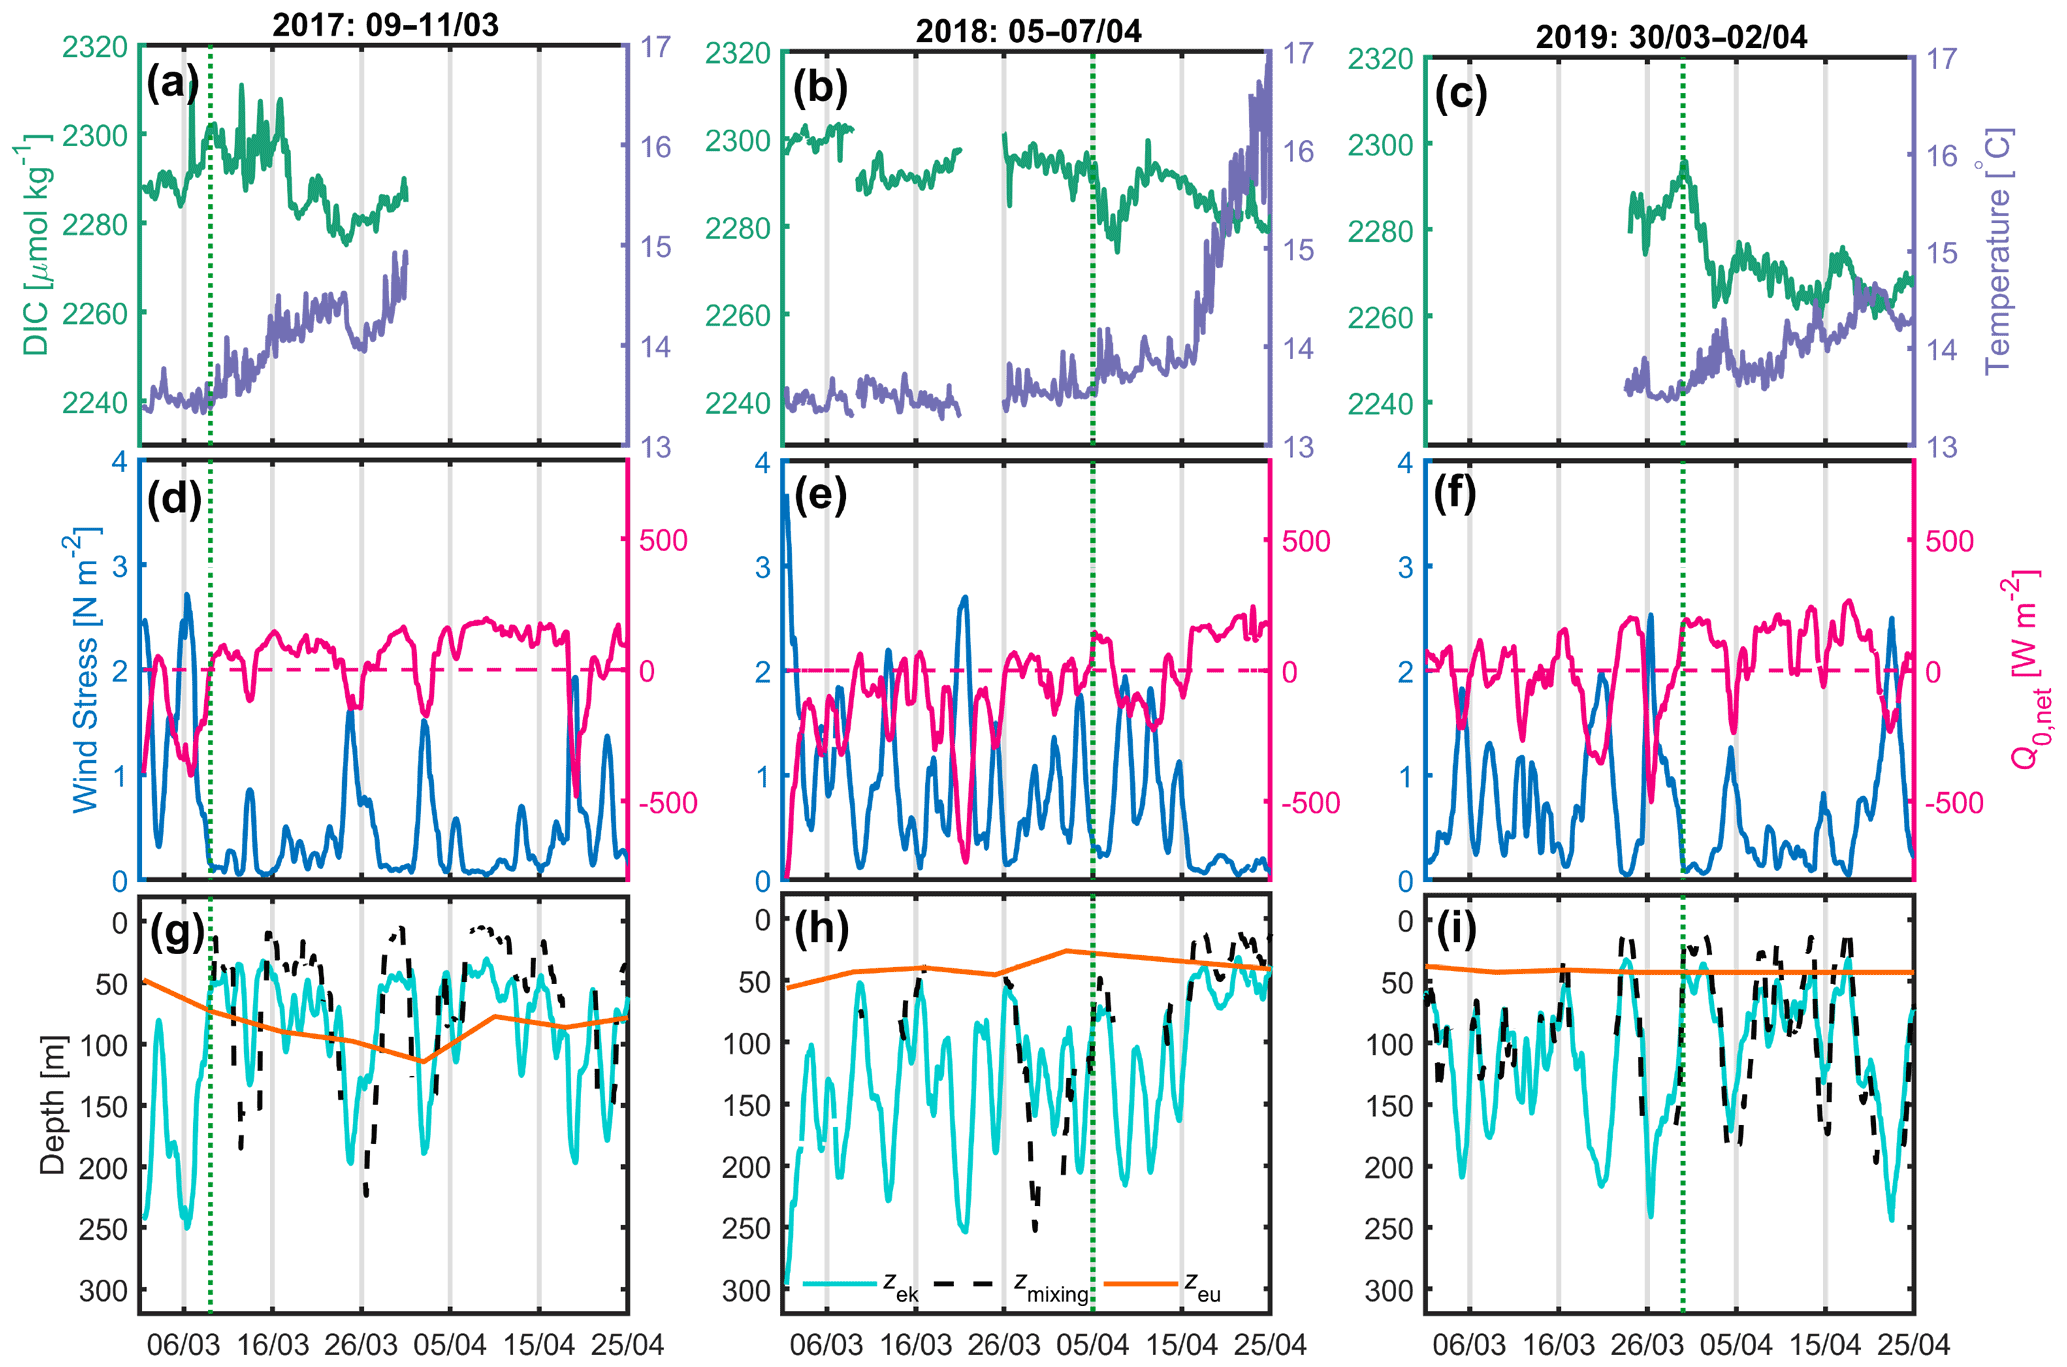
Figure 3(a, b, c) 2017, 2018 and 2019 DIC (green) and SST (purple) at the BOUSSOLE site; (d, e, f) wind stress (blue) and net heat flux (red) at the Azur buoy site. (d, e, f) The red dotted line indicates the change in sign of the net heat flux from negative to positive values; (g, h, i) depths of the mixing layer (dotted black), Ekman layer (cyan) and euphotic layer (orange) at the BOUSSOLE site. The vertical dotted green line indicates the onset of the decrease in DIC.
For the period between 2017 and 2019, only satellite chlorophyll a concentrations with a binning period of 8 d were available, which is too large to calculate the average mixing irradiance, as it is highly variable on a daily scale (Fig. 2d).
3.3 NCP
NCP was estimated (Eq. 3) for 3 d periods over the four time series between 2016 and 2019 (Table 1). Because we compute NCP only during periods when Zml and Zmx shoal and the air–sea CO2 flux are very small, the measured total daily changes in DIC, dDIC dt (correlation coefficient, r*2>0.70), is expected to represent the biological consumption of DIC. In 2016, 2017 and 2019, daily biological carbon uptake fluxes are between 38 and 191 mmol m−2 d−1. PAR and I vary, respectively, from 30 to 53 and 13 to 25 mol photons m−2 d−1 for the four considered periods (Table 2).
Table 1Net community production computed in the mixing layer over 3 d (NCP) after the bloom onset (T0).
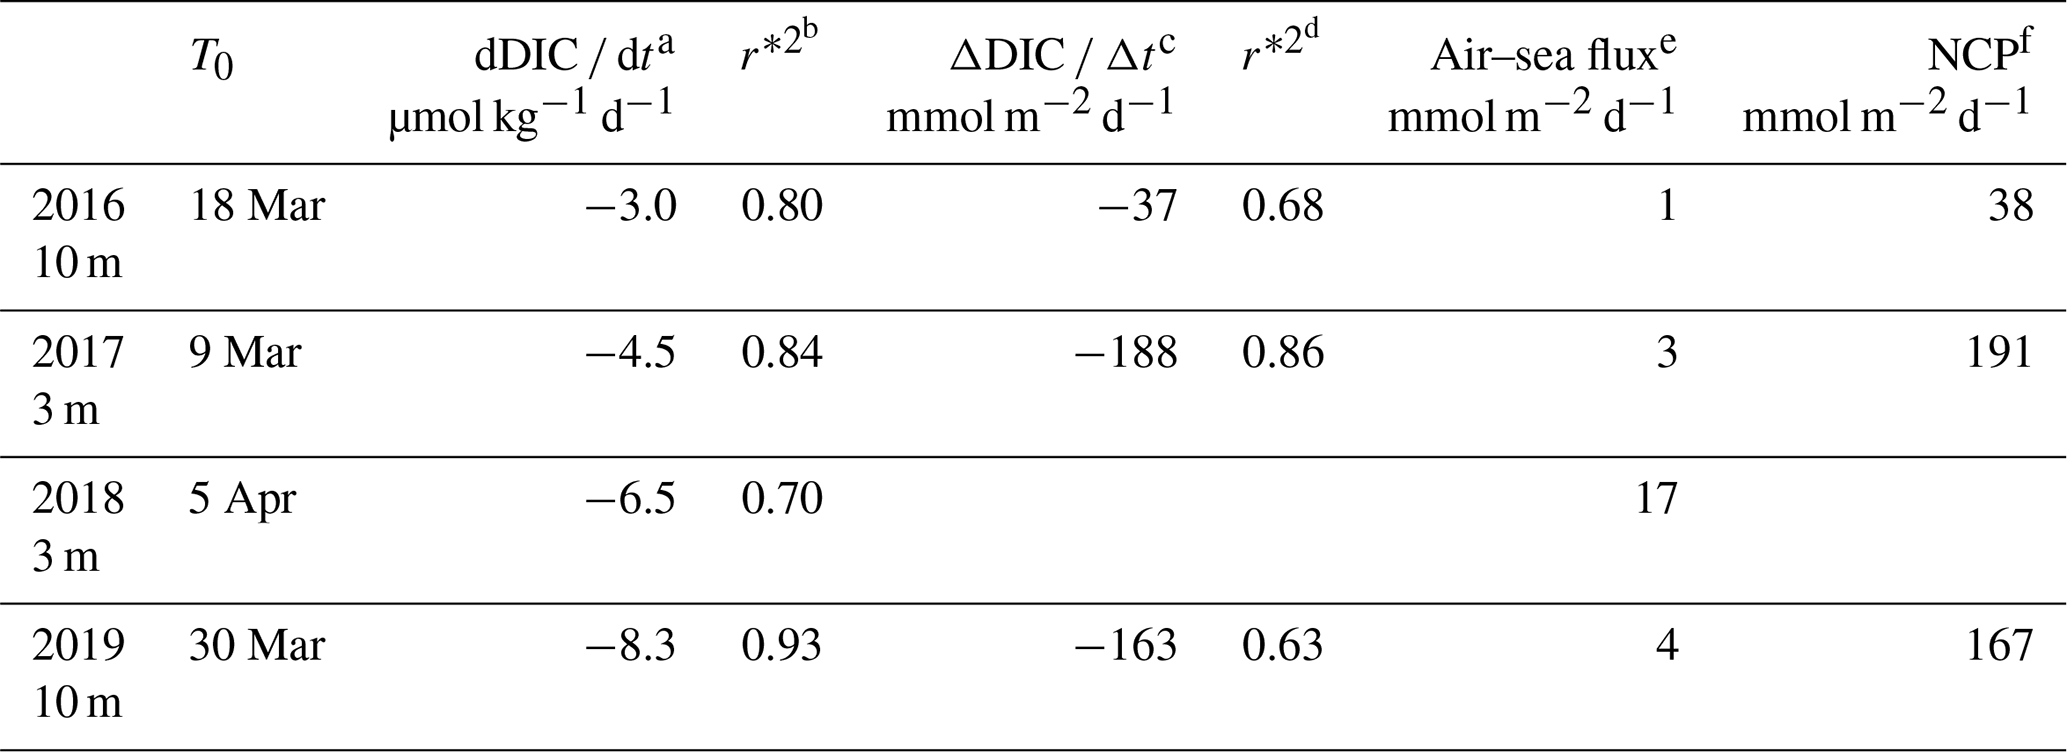
a,b Variation in DIC at the measurement depth and linked correlation coefficient. c,d Change in integrated DIC over Zmx and linked correlation coefficient. e CO2 flux from the atmosphere to the ocean. f Absolute value of calculated NCP is considered in order to provide positive values throughout the presentation and discussion in the paper.
4.1 Analysis of the physical drivers of the bloom initiation over the 4 years, 2016–2019
4.1.1 2016 time series results
In 2016, the consumption of carbon indicated by the decrease in DIC from 18 March attests the initiation of the formation of phytoplankton biomass (Fig. 2). Between 2 successive days, 17 and 18 March, a rapid decrease in daily wind stress from 0.24 to 0.04 N m−2 results in a change in sign of the net heat flux from −68 to +56 W m−2 (Fig. 4a) and a shoaling Zmx, which is for the most part shallower than Zeu (Fig. 4b) after 18 March.
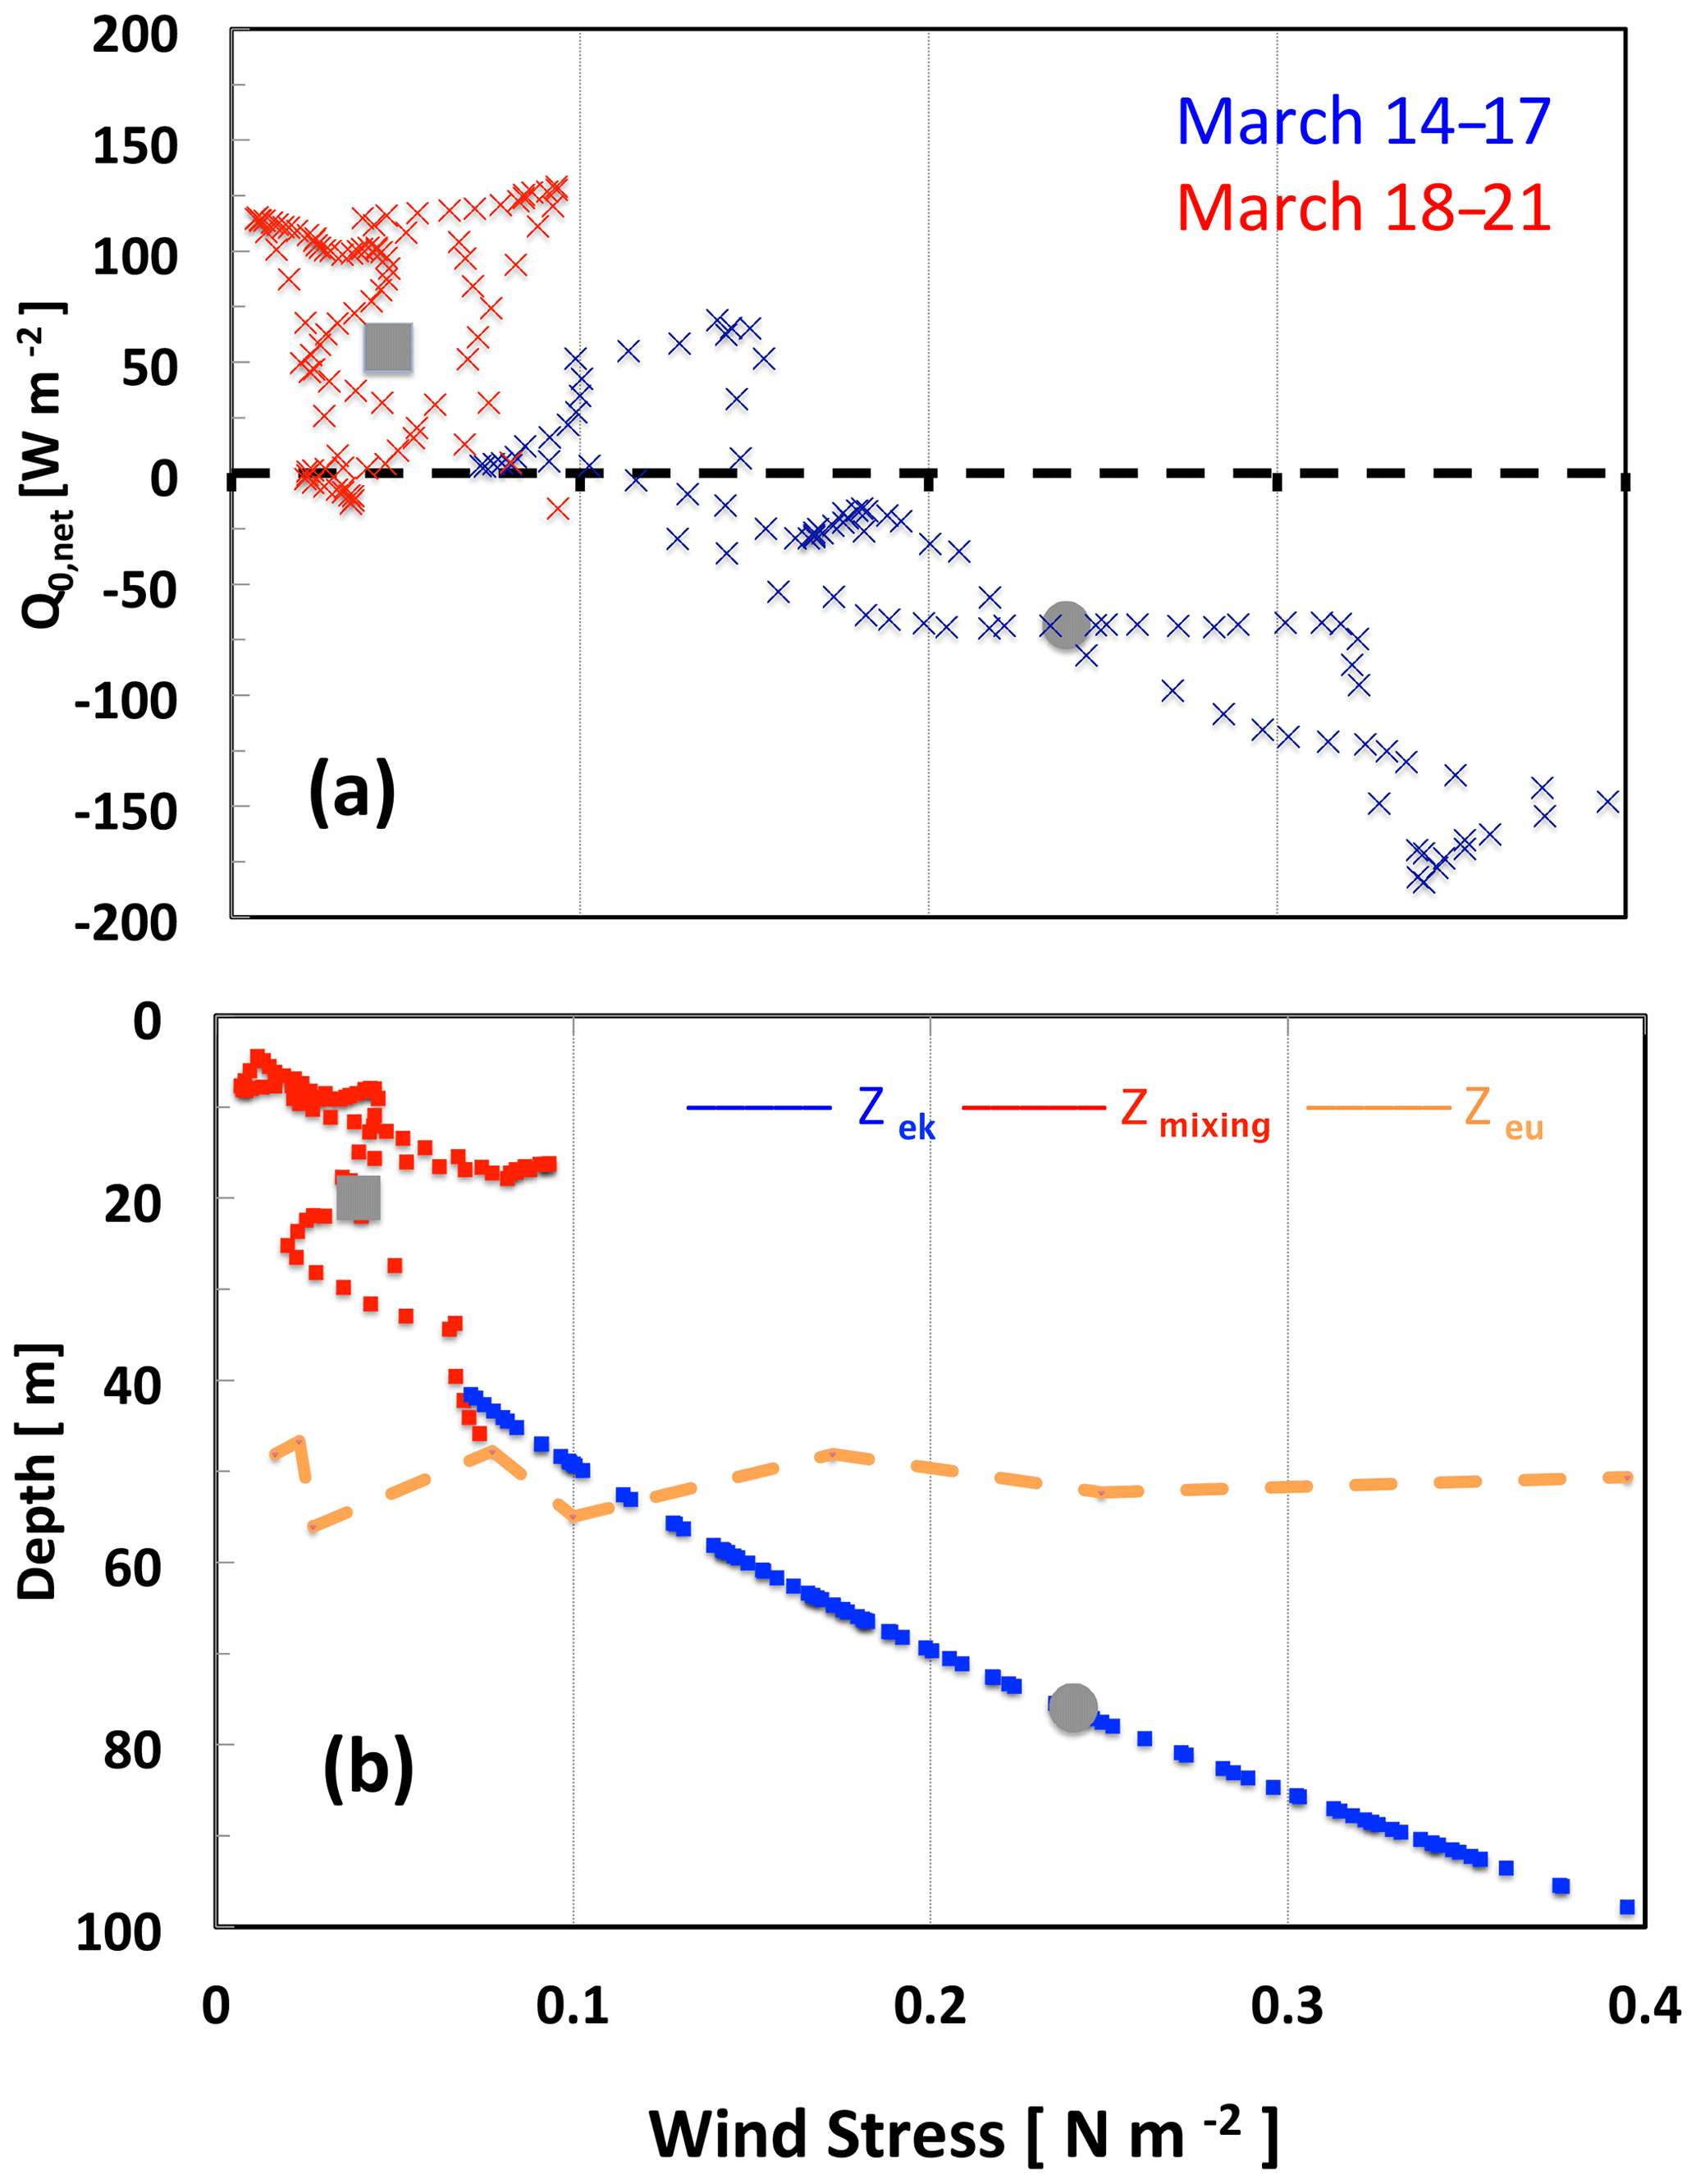
Figure 4Changes in physical parameters (hourly values) at the onset of the 2016 bloom during two consecutive periods of 4 d, 14–17 March (blue) and 18–21 March (red), as a function of wind stress (a); net surface heat flux (b); and depths of the Ekman, mixing and euphotic layer. Grey circles and grey squares indicate mean values, respectively, on 17 and 18 March. For comparison, the orange line shows the euphotic layer depth (14–21 March).
This illustrates the very fast change in heat flux and mixing-layer thickness resulting from the decrease in wind stress. The main drivers to explain the initiation of near-surface spring phytoplankton blooms proposed by Taylor and Ferrari (2011) and Brody-Lozier (2014, 2015) are a decrease in wind strength, a positive surface heat flux and a decrease in the dominant mixing length scale. Our results indicate that a decrease in τ is a common component for these last two mechanisms (Fig. 4). The variability in Q0,net is strongly controlled by the variability in the latent heat flux proportional to the wind speed. From 17 to 18 March, the latent heat flux changed by 84 W m−2, representing nearly two-thirds of the total change in Q0, with the remainder originating from an increased short-wave flux. Hence, Q0,net increased as τ decreased. In the same way Zmx, which is related to τ and Q0,net, decreased. This highlights the major contribution of wind stress relaxation in controlling the net surface heat flux and subsequent stratification leading to shallower Zmx
4.1.2 2017–2018–2019 time series results
Over the 4 years, 2016–2019, during the months of March and April, at the very beginning of spring, the conditions required for initiating the spring bloom are very similar, although the range of wind stress values is smaller in 2016 (Figs. 2, 3). The wind stress values are low following storm events. For all years except 2018, Zmx is smaller than Zeu. The average atmospheric and oceanographic conditions during the onset of the bloom are shown in Table 2. The decrease in wind-driven mixing is then a dominant physical mechanism, namely mixed-layer shoaling which best predicts the timing of the spring bloom (Brody Lozier, 2014, 2015). Likewise, in the Southern Ocean, Pelicherro et al. (2020) showed that a bloom is initiated only when the wind-driven mixed layer decreases, even if the net heat flux has been positive for some months.
4.2 DIC, Chl a and irradiance at the ocean surface in 2016
Between 18 and 21 March, a diurnal cycle in DIC is observed (Fig. 5a), characterised by a maximum in the morning followed by a minimum at the end of the day, indicating the onset of organic matter formation. The decrease in DIC is accompanied by an increase in glider surface Chl a on 18 March and a simultaneous increase in the average mixing-layer irradiance (Fig. 5b). It is worth noting that the Chl a maximum does not occur until 31 March, 13 d after the first decrease in DIC. This maximum is the one identified in most cases by the Chl a satellite measurements with a binning period of 8 d. It follows that satellite data cannot accurately characterise the conditions that prevail for the onset of the phytoplankton growth, as these are dictated by a great temporal variability in atmospheric forcings. Due to the seasonal increase in surface irradiance, as well as the availability of nutrients following vertical mixing with intermediate nutrient-enriched waters (Begovic and Copin-Montégut, 2002), the conditions for the onset of a bloom are met.
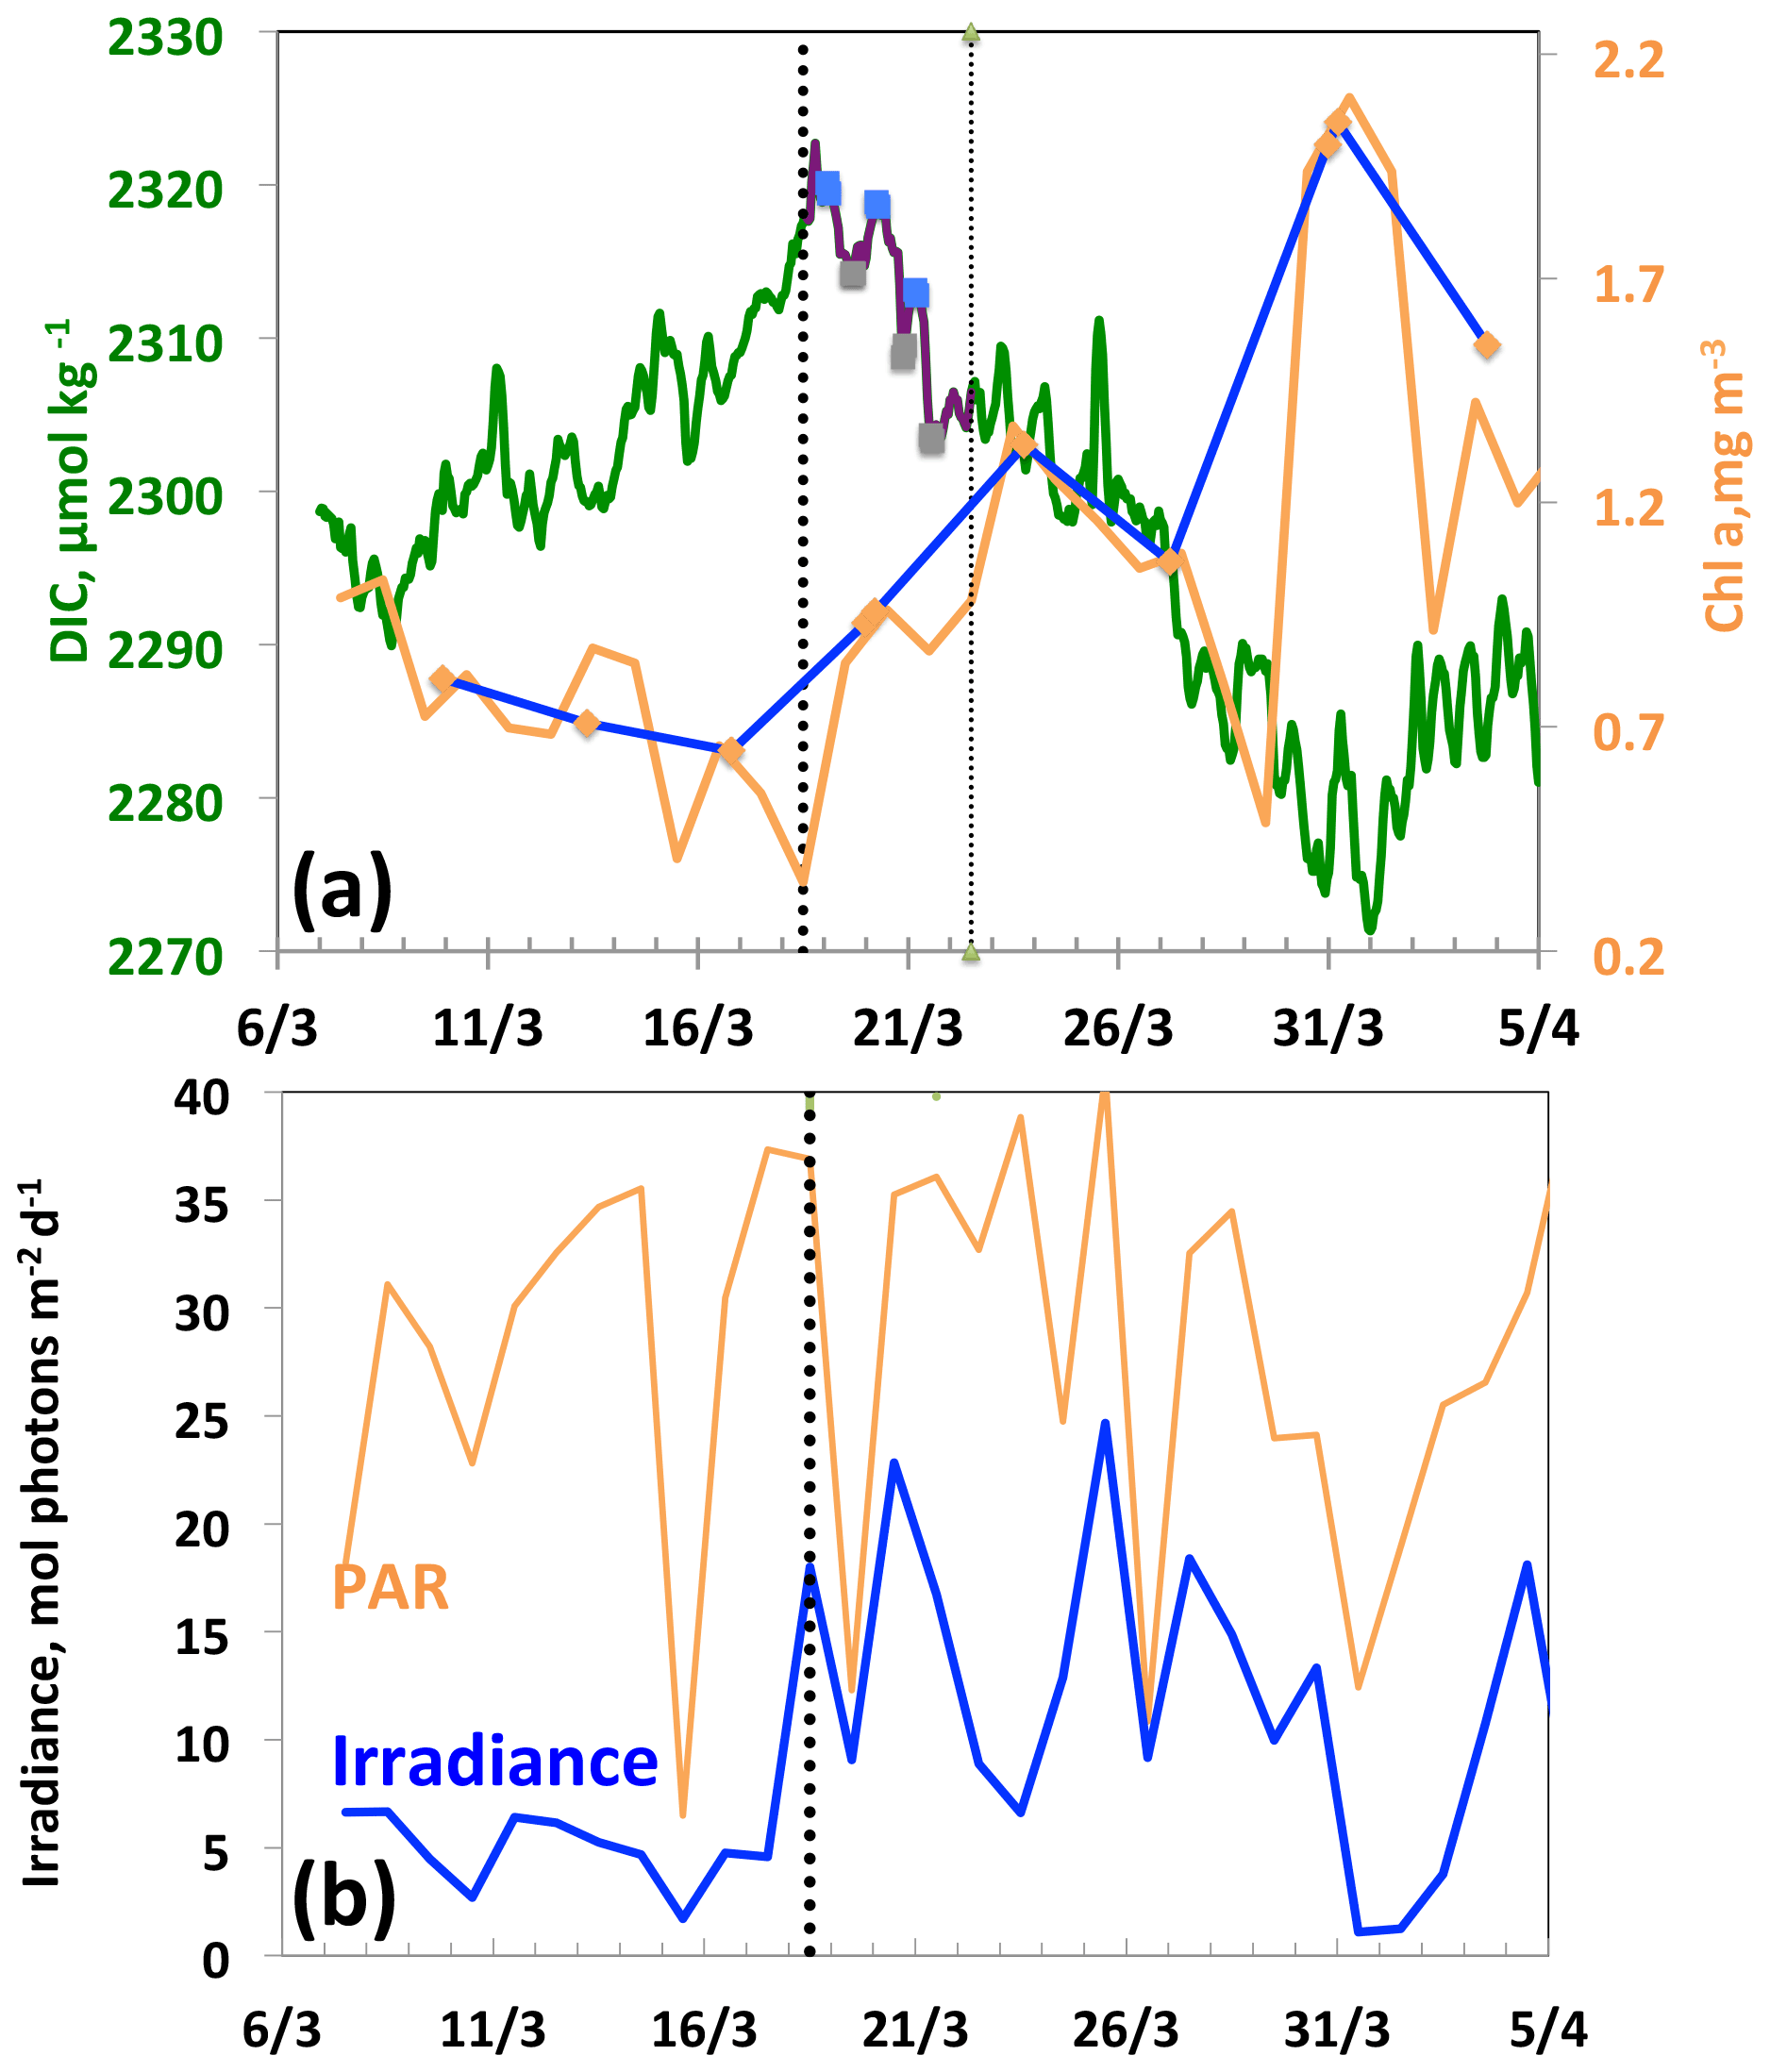
Figure 5From 7 March to 5 April, (a) DIC and Chl a. The purple line and the squares (blue, morning; grey, evening) indicate the 3 d biological diurnal DIC changes during the period considered to compute NCP. The blue and orange lines indicate the surface Chl a when the glider was at a distance of less than 5 km (blue) and less than 20 km (orange), respectively, from the BOUSSOLE buoy. (b) PAR and I, average mixing-layer irradiance. The vertical dotted black line indicates the onset of the bloom on 18 March.
Table 22016–2019. Atmospheric drivers of the onset of the bloom: average values and standard deviation on the day of the start of the bloom, T0.

4.3 Biological carbon uptake
In 2016, 2017 and 2019, at the onset of the bloom Zmx is shallower than Zeu (Table 2). Two factors account for the observed large range of NCP variability at the time of triggering the bloom: dDIC dt and Zml. In 2016 and 2017, DIC decreased over a period of 14 d, whereas it lasted for 3 d in 2018 and 2019, as a result of short-lived high-wind events (τ>1 N m−2). On 2 April 2018, a high value of surface phytoplankton Chl a, 1.9 mg m−3, was measured by satellite (GlobColour data), suggesting a strong biological signal. However, as Zeu is significantly shallower than Zmx (26 m vs. 65 m; Fig. 3h), it would be incorrect to estimate NCP integrated over Zmx using the DIC gradient measured at 3 m depth and likewise to compute the average mixing-layer irradiance.
At the nearby DyFAMed site (Dynamique des Flux Atmosphériques en Méditerranée), using a 20-year O2 time series, Coppola et al. (2018) estimated an annual net community carbon production equal to 7.1 or 19.4 mmol m−2 d−1. Additionally, using determinations of primary production from 14C in situ incubations and of carbon export fluxes from sediment traps at DyFAMed, Marty and Chiaverini (2002) calculated average daily primary productions between 19.6 and 53 mmol m−2 d−1. These estimates may have underestimated the annual NCP values, as they were calculated from monthly observations, while phytoplankton production varies on a daily timescale. Our DIC measurements highlight the large short-term variability in carbon consumption over a few days in March–April when bloom-triggering atmospheric conditions are met, such as a seasonal light increase and the availability of nutrients.
Around March and April in the northwestern Mediterranean Sea, the seasonal change in lighting conditions and atmospheric forcing are the essential parameters that control the triggering of near-surface phytoplankton blooms. These mechanisms have been highlighted through the coupling of high-frequency physical and biogeochemical in situ observations. For the years 2016 to 2019, a bloom started in March or early April, identified by a decrease in surface DIC, following a period of intense mixing. The rapid decrease in surface wind speed entailed a switch from negative to positive air–sea net heat fluxes, essentially due to changes in the latent air–sea heat flux proportional to wind speed. These analyses support the hypothesis that decreases in the depth of active mixing, a result of the transition from buoyancy-driven to wind-driven mixing, control the timing of the surface spring bloom.
We have shown that the onset of surface phytoplankton growth, identified in 2016 by a simultaneous initial decrease in DIC and an increase in surface Chl a, precedes by a few days the surface chlorophyll maximum when detected by satellite measurements with a binning period of 8 d. This time span does not allow for identifying precisely the contribution of atmospheric drivers to trigger the onset of the growth of phytoplankton, as it occurs on a daily basis.
BOUSSOLE data (2016–2019) are available in the SEANOE (SEA scieNtific Open data Edition) database (https://doi.org/10.17882/56709, Merlivat and Boutin, 2020). Data about the Azur meteorological buoy are available at http://mistrals.sedoo.fr/HyMeX. Data were obtained from the HyMeX programme, sponsored by Grants MISTRALS/HyMeX and Météo-France. SChl a, 8 d, 4 km × 4 km resolution, level-3 mapped ocean colour product data distributed by the European Space Agency are available at https://www.globcolour.info (https://hermes.acri.fr/, Globcolour ESA consortium, 2022). All glider data are archived at the British Oceanographic Data Centre (BODC, https://doi.org/10.5285/e686816f-8bdd-4782-e053-6c86abc07adc, Kaiser and Hemming, 2022).
VV and MG were, respectively, in charge of the BOUSSOLE mooring buoy maintenance and monthly water sampling. LB was responsible for the laboratory preparation and calibration of the CARIOCA sensors. GAL led the UEA glider mission in March–April 2016. LM wrote the manuscript to which MH, JB and DA made a significant contribution. DA and VV provided data and funding through the BOUSSOLE project and contributed to the writing and editing of the manuscript.
The contact author has declared that none of the authors has any competing interests.
Publisher's note: Copernicus Publications remains neutral with regard to jurisdictional claims in published maps and institutional affiliations.
Michael Hemming was a PhD student at the University of East Anglia and Sorbonne University under the supervision of Jan Kaiser, Karen J. Heywood, Dorothee Bakker and Jacqueline Boutin and was funded by the Defence Science and Technology Laboratory (contract no. DSTLX1000092277) in cooperation with the Direction Générale de l'Armement (DGA). The assistance of the UEA glider group in keeping the glider flying is also gratefully acknowledged. The authors acknowledge Météo-France for supplying the data from the Azur buoy and the HyMeX (HYdrological cycle in the Mediterranean EXperiment) database teams (ESPRI IPSL and SEDOO Observatoire Midi-Pyrénées) for their help in accessing their data. The calibration of the CARIOCA sensor has been assessed using DIC and Alk monthly samples taken by the BOUSSOLE and DyFAMed teams and analysed at SNAPO-CO2 (Service National d’Analyse des Paramètres Océaniques du CO2) located at the LOCEAN laboratory in Paris. Crew and captains of R/V Téthys II are warmly thanked for assistance with operations at sea. We thank two reviewers for their careful and conscientious reviews.
The BOUSSOLE time series project is funded by the European Space Agency (ESA; ESRIN contract nos. 4000102992/11/I-NB and 4000111801/14/I-NB) and the Centre National d’Etudes Spatiales (CNES, France). It is also supported by the Centre National de la Recherche Scientifique (CNRS), the Institut National des Sciences de l'Univers (INSU), Sorbonne Université and the Institut de la Mer de Villefranche (IMEV). The measurements of the carbonate system were specifically funded through the BIOCAREX project (Agence Nationale de la Recherche, ANR, Paris).
This paper was edited by Anja Engel and reviewed by two anonymous referees.
Álvarez, M., Sanleón-Bartolomé, H., Tanhua, T., Mintrop, L., Luchetta, A., Cantoni, C., Schroeder, K., and Civitarese, G.: The CO2 system in the Mediterranean Sea: a basin wide perspective, Ocean Sci., 10, 69–92, https://doi.org/10.5194/os-10-69-2014, 2014.
Andersen, V. and Prieur, L.: One-month study in the open NW Mediterranean Sea (DYNAPROC experiment, May 1995): Overview of hydrobiogeochemical structures and effects of wind events, Deep-Sea Res. Pt. I, 47, 397–422, 2000.
Antoine, D., Guevel, P., Desté, J.-F., Bécu, G., Louis, F., Scott, A. J., and Bardey, P.: The “BOUSSOLE” buoy; a new transparent-to-swell taut mooring dedicated to marine optics: design, tests and performance at sea, J. Atmos. Ocean. Technol., 25, 968–989, 2008a.
Antoine, D., d'Ortenzio, F., Hooker, S. B., Bécu, G., Gentili, B., Tailliez, D., and Scott, A. J.: Assessment of uncertainty in the ocean reflectance determined by three satellite ocean color sensors (MERIS, SeaWiFS and MODIS-A) at an offshore site in the Mediterranean Sea (BOUSSOLE project), J. Geophys. Res., 113, CO7013, https://doi.org/10.1029/2007JC004472, 2008b.
Antoine, D. M., Chami, H., Claustre, F., D'Ortenzio, A., Morel, G., Bécu, B., Gentili, F., Louis, J., Ras, E., Roussier, A. J., Scott, D., Tailliez, S. B., Hooker, P., Guevel, J.-F., Desté, C., Dempsey, C., and Adams, D.: BOUSSOLE: a joint CNRS-INSU, ESA, CNES and NASA Ocean Color Calibration and Validation Activity, NASA Technical memorandum, no. TM-2006-214147, NASA/GSFC, Greenbelt, USA, National Aeronautics and Space Administration, Washington, DC 20546-0001, 2006.
Begovic, M. and Copin-Montegut, C.: Processes controlling annual variations in the partial pressure of fCO2 in surface waters of the central northwestern Mediterranean sea (Dyfamed site), Deep-Sea Res. Pt. II, 49, 2031–2047, 2002.
Behrenfeld, M. and Boss, E.: Resurrecting the ecological underpinnings of ocean plankton blooms, Ann. Rev. Mar. Sci., 6, 167–194, https://doi.org/10.1146/annurev-marine-052913-021325, 2014.
Behrenfeld, M. J.: Abandoning Sverdrup's critical depth hypothesis on phytoplankton blooms, Ecology, 91, 977–989, 2010.
Boutin, J. and Merlivat, L.: New in situ estimates of carbon biological production rates in the Southern Ocean from CARIOCA drifter measurements, Geophys. Res. Lett., 36, L13608, https://doi.org/10.1029/2009GL038307, 2009.
Brainerd, K. E. and Gregg, M. C.: Surface mixed and mixing layer depths. Deep-Sea Res. Pt. I, 42, 1521–1543, 1995.
Brody, S. and Lozier, M.: Changes in dominant mixing length scale as a driver of phytoplankton bloom initiation in the North Atlantic, Geophys. Res. Lett., 41, 3197–3206, 2014.
Brody, S. R. and Lozier, M. S.: Characterizing upper-ocean mixing and its effect on the spring phytoplankton bloom with in situ data, ICES J. Mar. Sci., 72, 1961–1970, 2015.
Chiswell, S. M.: Annual cycles and spring blooms in phytoplankton: don't abandon Sverdrup completely, Mar. Ecol. Prog. Ser., 443, 39–50, 2011.
Copin-Montégut, C. and Begovic, M.: Distributions of carbonate properties and oxygen along the water column (0–2000 m) in the central part of the NW Mediterranean Sea (Dyfamed site), Influence of winter vertical mixing on air–sea CO2 and O2 exchanges, Deep-Sea Res. Pt. 2, 49, 2049–2066, 2002.
Copin-Montégut, C., Bégovic, M., and Merlivat, L.: Variability of the partial pressure of CO2 on diel to annual time scales in the Northwestern Mediterranean Sea, Mar. Chem., 85, 169–189, 2004.
Coppola, L., Legendre, L., Lefevre, D., Prieur, L., Taillandier, V., and Riquier, E. D.: Seasonal and inter–annual variations of dissolved oxygen in the northwestern Mediterranean Sea (DYFAMED site), Prog. Oceanogr., 2018.
Dickson, A. G. and Millero, F. J.: A comparison of the equilibrium constants for the dissociation of carbonic acid in seawater media, Deep-Sea Res. Pt. A, 34, 1733–1743 1987.
Enriquez, R. M. and Taylor, J. R: Numerical simulations of the competition between wind-driven mixing and surface heating in triggering spring phytoplankton blooms, ICES J. Mar. Sci. J. Cons., fsv071, 2015.
Globcolour ESA consortium: https://www.globcolour.info, Globcolour [data set], https://hermes.acri.fr/, last access: 18 July 2022.
Golbol, M., Vellucci, V., and Antoine, D.: BOUSSOLE, https://doi.org/10.18142/1, 2000.
Hemming, M. P., Kaiser, J., Heywood, K. J., Bakker, D. C. E., Boutin, J., Shitashima, K., Lee, G., Legge, O., and Onken, R.: Measuring pH variability using an experimental sensor on an underwater glider, Ocean Sci., 13, 427–442, https://doi.org/10.5194/os-13-427-2017, 2017.
Holte, J. and Talley, L.: A new algorithm for finding mixed layer depths with applications to Argo data and Subantarctic Mode Water formation, J. Atmos. Ocean. Technol., 26, 1920–1939, 2009.
Hood, E. M. and Merlivat, L.: Annual and interannual variations of fCO2 in the northwestern Mediterranean Sea: Results from hourly measurements made by CARIOCA buoys, 1995–1997, J. Mar. Res., 59, 113–131, 2001.
Kaiser, J. and Hemming, M. P.: Deployment of UEA Seaglider sg537 (“Fin”) near the Boussole time series site (Mediterranean Sea) with pH p(CO2) ISFET sensor testing, March–April 2016. NERC EDS British Oceanographic Data Centre NOC, https://doi.org/10.5285/e686816f-8bdd-4782-e053-6c86abc07adc, 2022.
Lacour, L., Briggs, N., Claustre, H., Ardyna, M., and Dall'Olmo, G.: The intraseasonal dynamics of the mixed layer pump in the subpolar North Atlantic Ocean: A Biogeochemical-Argo float approach, Global Biogeochem. Cy., 33, 266–281, 2019.
Lee, Z., Weidemann, A., Kindle, J., Arnone, R., Carder, K. L., and Davis, C.: Euphotic zone depth: Its derivation and implication to ocean-color remote sensing, J. Geophys. Res.-Ocean., 112, https://doi.org/10.1029/2006JC003802, 2007.
Mahadevan, A., D'asaro, E., Lee, C., and Perry, M. J. : Eddy-driven stratification initiates North Atlantic spring phytoplankton blooms, Science, 337, 54–58, 2012.
Marty, J.-C. and Chiavérini, J.: Seasonal and interannual variations in phytoplankton production at DYFAMED time-series station, northwestern Mediterranean Sea, Deep-Sea Res. Pt. II, 49, 2017–2030, 2002.
Mehrbach, C., Culberson, C. H., Hawley, J. E., and Pytkowicx, R. M.: Measurement of the apparent dissociation constants of carbonic acid in seawater at atmospheric pressure, Limnol. Oceanogr., 18, 897–907, 1973.
Merlivat, L. and Boutin, J.: Mediterranean Sea surface CO2 partial pressure and temperature data, SEANOE [data set], https://doi.org/10.17882/56709, 2022.
Merlivat, L. and Brault, P.: CARIOCA BUOY, Carbon Dioxide Monitor, Sea Technol., 10, 23–30, 1995.
Merlivat, L., Boutin, J., and Antoine, D.: Roles of biological and physical processes in driving seasonal air–sea CO2 flux in the Southern Ocean: New insights from CARIOCA pCO2, J. Mar. Syst., 147, 9–20, 2015.
Merlivat, L., Boutin, J., Antoine, D., Beaumont, L., Golbol, M., and Vellucci, V.: Increase of dissolved inorganic carbon and decrease in pH in near-surface waters in the Mediterranean Sea during the past two decades, Biogeosciences, 15, 5653–5662, https://doi.org/10.5194/bg-15-5653-2018, 2018.
Millot: Circulation in the Western Mediterranean Sea, J. Mar. Syst., 20, 423–442, 1999.
Morel, A. and Berthon, J. F.: Surface pigments, algal biomass profiles, and potential production of the euphotic layer: relationships reinvestigated in review of remote-sensing applications, Limnol. Oceanogr., 34, 1545–1562, 1989.
Niewiadomska, K., Claustre, H., Prieur, L., and d'Ortenzio, F.: Submesoscale physical-biogeochemical coupling across the Ligurian current (northwestern Mediterranean) using a bio-optical glider, Limnol. Oceanogr., 53, 2210–2225, https://doi.org/10.4319/lo.2008.53.5_part_2.2210, 2008.
Papaioannou, G., Papanikolaou, N., and Retalis, D.: Relationships of photosynthetically active radiation and shortwave irradiance, Theor. Appl. Climatol., 48, 23–27, 1993.
Pasqueron de Fommervault, O., Migon, C., D'Ortenzio, F., Ribera d'Alcalà, M., and Coppola, L.: Temporal variability of nutrient concentrations in the northwestern Mediterranean sea (DYFAMED time-series station), Deep-Sea Res. Pt. I, 100, 1–12, 2015.
Pellichero, V., Boutin, J., Claustre, H., Merlivat, L., Sallée, J.-B., and Blain, S.: Relaxation of wind stress drives the abrupt onset of biological carbon uptake in the Kerguelen bloom: a multisensor approach, Geophys. Res. Lett., 47, e2019GL085992, https://doi.org/10.1029/2019GL085992, 2020.
Rödenbeck, C., Keeling, R. F., Bakker, D. C. E., Metzl, N., Olsen, A., Sabine, C., and Heimann, M.: Global surface-ocean pCO2 and sea–air CO2 flux variability from an observation-driven ocean mixed-layer scheme, Ocean Sci., 9, 193–216, https://doi.org/10.5194/os-9-193-2013, 2013.
Rumyantseva, A., Henson, S., Martin, A., Thompson, A. F., Damerell, G. M., Kaiser, J., and Heywood, K. J.: Phytoplankton spring bloom initiation: The impact of atmospheric forcing and light in the temperate North Atlantic Ocean, Prog. Oceanogr., 178, 102202, https://doi.org/10.1016/j.pocean.2019.102202, 2019.
Siegel, D. A., Doney, S. C., and Yoder, J. A.: The North Atlantic spring phytoplankton bloom and Sverdrup's critical depth hypothesis, Science, 296, 730–733, 2022.
Sverdrup, H. U.: On vernal blooming of phytoplankton, Conseil Exp. Mer, 18, 287–295, 1953.
Takahashi, T., Sutherland, S. C., Wanninkhof, R., Sweeney, C., Feely, R. A., Chipman, D. W., Hales, B., Friederich, G., Chavez, F., Sabine, C., Watson, A., Bakker, D. C. E., Schuster, U., Metzl, N., Yoshikawa-Inoue, H., Ishii, M., Midorikawa, T., Nojiri, Y., Kortzinger, A., Steinhoff, T., Hoppema, M., Olafsson, J., Arnarson, T. S., Tillbrook, B., Johannessen, T., Olsen, A., Bellerby, R., Wong, C. S., Delille, B., Bates, N. R., and de Baar, H. J. W.: Climatological mean and decadal change in surface ocean pCO2 and net sea-air CO2 flux over the global oceans, Deep-Sea Res. Pt. II, 56, 554–577, 2009.
Taylor, J. R. and Ferrari, R.: Shutdown of turbulent convection as a new criterion for the onset of spring phytoplankton blooms, Limnol. Oceanogr., 56, 2293–2307, 2011.
Venables, H. and Moore, C. M.: Phytoplankton and light limitation in the Southern Ocean: Learning from high nutrient, high chlorophyll areas, J. Geophys. Res.-Ocean., 115, https://doi.org/10.1029/2009JC005361, 2010.
Wanninkhof, R.: Relationship between wind speed and gas exchange over the ocean revisited, Limnol. Oceanogr.-Method., 12, 351–362, 2014.
Weiss, R.: Carbon dioxide in water and seawater: the solubility of a non-ideal gas, Mar. Chem., 2, 203–215, 1974