the Creative Commons Attribution 4.0 License.
the Creative Commons Attribution 4.0 License.
 | 04 Nov 2022
Highest methane concentrations in an Arctic river linked to local terrestrial inputs
Karel Castro-Morales
Anna Canning
Sophie Arzberger
Will A. Overholt
Kirsten Küsel
Olaf Kolle
Mathias Göckede
Nikita Zimov
Arne Körtzinger
Large amounts of methane (CH4) could be released as a result of the gradual or abrupt thawing of Arctic permafrost due to global warming. Once available, this potent greenhouse gas is emitted into the atmosphere or transported laterally into aquatic ecosystems via hydrologic connectivity at the surface or via groundwaters. While high northern latitudes contribute up to 5 % of total global CH4 emissions, the specific contribution of Arctic rivers and streams is largely unknown. We analyzed high-resolution continuous CH4 concentrations measured between 15 and 17 June 2019 (late freshet) in a ∼120 km transect of the Kolyma River in northeast Siberia. The average partial pressure of CH4 (pCH4) in tributaries (66.8–206.8 µatm) was 2–7 times higher than in the main river channel (28.3 µatm). In the main channel, CH4 was up to 1600 % supersaturated with respect to atmospheric equilibrium. Key sites along the riverbank and at tributary confluences accounted for 10 % of the navigated transect and had the highest pCH4 (41 ± 7 µatm) and CH4 emissions (0.03 ± 0.004 ) compared to other sites in the main channel, contributing between 14 % to 17 % of the total CH4 flux in the transect. These key sites were characterized by warm waters (T>14.5 ∘C) and low specific conductivities (κ<88 µS cm−1). The distribution of CH4 in the river could be linked statistically to T and κ of the water and to their proximity to the shore z, and these parameters served as predictors of CH4 concentrations in unsampled river areas. The abundance of CH4-consuming bacteria and CH4-producing archaea in the river was similar to those previously detected in nearby soils and was also strongly correlated to T and κ. These findings imply that the source of riverine CH4 is closely related with sites near land. The average total CH4 flux density in the river section was 0.02 ± 0.006 , equivalent to an annual CH4 flux of 1.24×10⁷ g CH4 yr−1 emitted during a 146 d open water season. Our study highlights the importance of high-resolution continuous CH4 measurements in Arctic rivers for identifying spatial and temporal variations, as well as providing a glimpse of the magnitude of riverine CH4 emissions in the Arctic and their potential relevance to regional CH4 budgets.
- Article
(7000 KB) - Full-text XML
-
Supplement
(3449 KB) - BibTeX
- EndNote


Methane (CH4) is a powerful greenhouse gas that absorbs the Earth's infrared radiation more efficiently than CO2, with a global warming potential 28 times that of CO2 over a time horizon of 100 years (Saunois et al., 2020). To date, CH4 has accounted for 16 % to 25 % of the current atmospheric warming (Etminan et al., 2016; IPCC, 2014; Rosentreter et al., 2021). Globally, aquatic ecosystems contribute about half (53 %) of the total CH4 emissions, from both anthropogenic and natural origins (Rosentreter et al., 2021). The total bottom-up (i.e., from process-based models and inventories) updated global CH4 emissions from rivers and streams have a mean of 30.5 ± 17.1 Tg CH4 yr−1 (Rosentreter et al., 2021) and account for ∼17 % of the average inland water CH4 fluxes (Saunois et al., 2020). Especially on regional scales, CH4 emissions from rivers and streams have large impacts on the estimation of local atmospheric emissions (Karlsson et al., 2021). The contribution of CH4 emissions in high northern latitudes (60–90∘ N) to total global CH4 emissions ranges between 4 % to 5 %, but there are significant uncertainties, particularly regarding the contributions from terrestrial permafrost and non-wetland inland waters, i.e., rivers, streams, and lakes (Saunois et al., 2020). The concentration of CH4 in rivers and streams is generally above saturation with respect to the present atmospheric CH4 concentration, emitting annually the equivalent of ∼15 % of the total emissions from wetlands or 40 % of the annual CH4 emissions from lakes (Stanley et al., 2016).
The Arctic Ocean is one of the most river-influenced and land-locked of all the world oceans (Charkin et al., 2017; Shakirov et al., 2020), receiving annually about 10 % of the global runoff (Lammers et al., 2001) through the input from the six main Arctic rivers: Yenisey, Lena, Ob, Mackenzie, Yukon, and Kolyma. These rivers connect the ocean with the land by mediating the transport of CH4 stored in terrestrial surface waters or groundwaters or through soil–water interactions in thawed water tracks (Connolly et al., 2020; Dabrowski et al., 2020; Harms et al., 2020; Saunois et al., 2020). Thus, the riverine transport of soil-derived CH4 from permafrost may influence the CH4 concentrations in the Arctic shelf system.
The atmospheric emissions of CH4 from Arctic inland freshwaters and permafrost have the potential to increase with climate change (Dean et al., 2018). As permafrost thaws, more soil organic carbon is available for the anaerobic degradation of organic matter under warmer conditions, resulting in additional CH4 formation which will add to the positive feedback to climate change (Schuur et al., 2015). Trapped or newly formed CH4 can be emitted directly to the atmosphere after the abrupt or gradual permafrost thaw (Olefeldt et al., 2013; Saunois et al., 2020; Turetsky et al., 2020) or be laterally transported into neighboring inland waters via surface hydraulic connectivity or underground drainage (e.g., Dabrowski et al., 2020). Current and projected changes in the Arctic land surface hydrology, vegetation, landscape, and temperature due to permafrost thaw will modulate CH4 concentrations in Arctic fluvial ecosystems (Harms et al., 2020; Olid et al., 2021).
The magnitude of the fluvial CH4 emissions is subject to strong local environmental controls because CH4 has low solubility in water (Campeau and del Giorgio, 2014; Stanley et al., 2016). At the same time, the abundance and phylogenetic identity of microorganisms in the river water that can be associated with the formation or consumption of CH4 can serve as indicators of the source and fate of CH4 transported from land. Aquatic CH4 is subject to microbial oxidation and photochemical decomposition (Dean et al., 2018; Stanley et al., 2016). Little is known about the magnitude of CH4 concentrations and emissions from flowing Arctic inland waters, as well as how they vary over time and space. Point CH4 measurements in some Arctic rivers and streams have demonstrated supersaturation relative to the atmosphere (e.g., Kling et al., 1992; Mann et al., 2022; Striegl et al., 2012; Vorobyev et al., 2021; Zolkos et al., 2019). However, highly resolved aquatic CH4 measurements are lacking in large portions of the Arctic rivers and streams, and these are needed to better quantify the atmospheric gas fluxes and understand the temporal variations and the environmental indicators. High-resolution measurements of the partial pressure of CH4 (pCH4) were measured in a site in the Ambolikha River, a tributary of the Kolyma River in northeast Siberia, evidencing aquatic CH4 supersaturations on the order of 200 times higher than values at equilibrium with the atmosphere. These measurements allowed identifying temporal variations mostly driven by hydrological changes and air–water exchange, with a consistent decrease in pCH4 of 78 % from the measured concentrations during late freshet to summer (Castro-Morales et al., 2022a).
Here, we present the first high-spatial-resolution measurements of pCH4, as well as other complementary water properties, along a 120 km transect in the Kolyma River during the late freshet (June) in 2019. Additionally, we followed the riverine microbial community structure in the same transect using a 16S-amplicon approach to provide a potential record of water input sources. The objectives of this study are (1) to analyze potential environmental indicators that can be statistically associated with the spatial variations of the pCH4 along the sampled river section, (2) to estimate the flux of CH4 across the atmosphere–river interface, and (3) to investigate a potential link between overall microbial community structure and more specifically the distributions of CH4 oxidizers and CH4 producers with the measured pCH4 during the sampling period.
2.1 Study site and fieldwork description
The Kolyma River is the sixth largest river in the Arctic with a watershed area of 653 000 km2 (Holmes et al., 2012) that is completely underlain by continuous permafrost (Mann et al., 2012). Our area of study was a ∼120 km section in the Kolyma River, bounded by the city of Chersky ( N, E) to the east and at the location known as Duvanny Yar ( N, E) to the west (Fig. 1). Several floodplains are located next to the banks of this section of the Kolyma River. These floodplains connect the river to the land during the snowmelt period (May and June) when they become inundated.
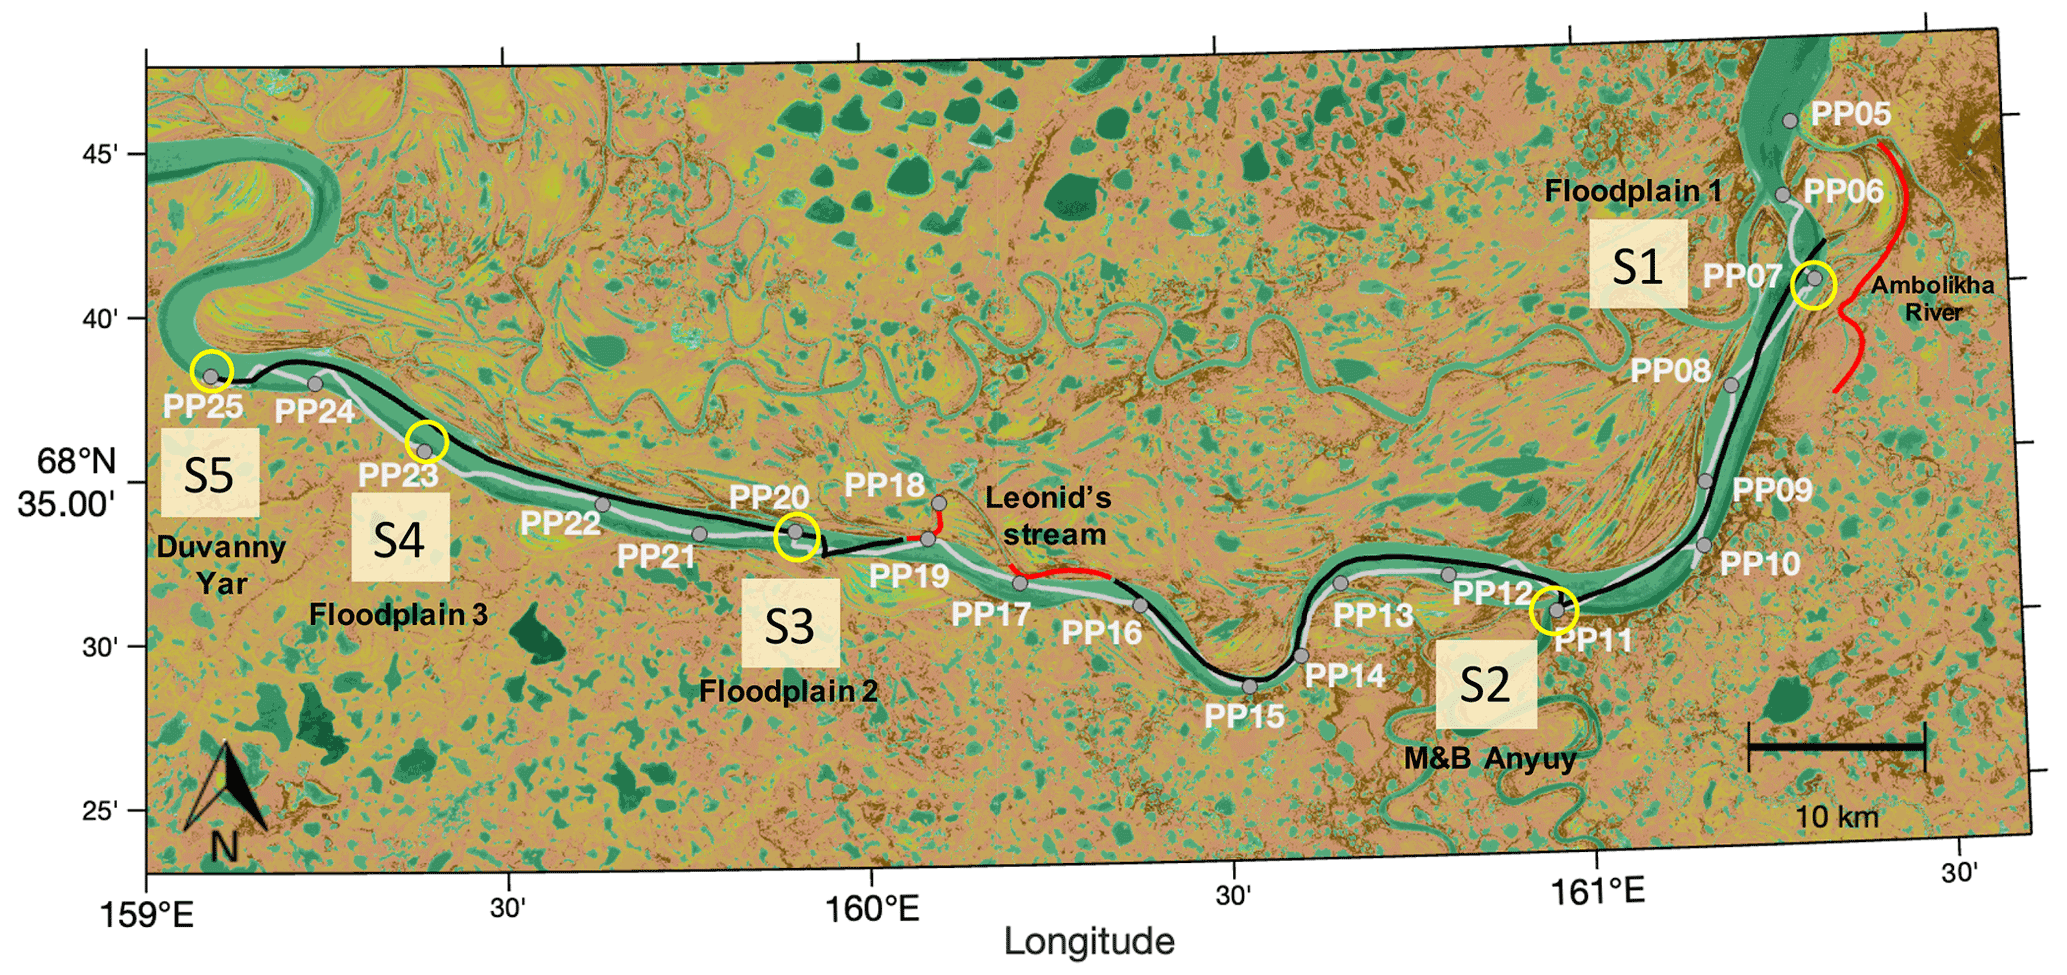
Figure 1Navigated transects in the Kolyma River: upstream (UP) (grey line, sampled between 15 June 2019 at 12:30 LT and 16 June 2019 at 16:59 LT) and downstream (DOWN) (black line, navigated between 16 June 2019 at 17:00 LT and 17 June 2019 at 13:30 LT). Gaps in the continuous UP and DOWN transects are data not considered for the analysis because they involved navigation outside the main river channel (i.e., transects at Leonid's stream and the Ambolikha River indicated in red). Discrete samples were collected at 21 sampling stations (PP05–PP25) during the UP transect (grey markers). Key sites (and stations): S1 (PP07), S2 (PP11), S3 (PP20), S4 (PP23), and S5 (PP25) are circled in yellow. This map was created using MATLAB® with data from a composite image for June, July, and August from 2015–2018 using Sentinel-2 NDVI maps (https://developers.google.com/earth-engine/datasets/catalog/sentinel, last access: 15 May 2019).
We twice navigated the Kolyma River section on board a small vessel (average navigation speed of 2.0 ± 0.4 m s−1), where we collected discrete river water samples at 21 sampling stations named PP05 to PP25 (Sect. 2.2). Additionally, we installed onboard instrumentation for continuous measurements of water properties and the partial pressure of CH4 (pCH4) (Sect. 2.3). The first transect was navigated in the upstream direction (UP) from Chersky to Duvanny Yar (Fig. 1) between 15 June 2019 (12:48 LT; local Chersky time) and 16 June 2019 (16:59 LT) (with an overnight break halfway), covering a length of 127.7 km. The second transect was navigated in the downstream direction (DOWN) from Duvanny Yar to Chersky, and it took place between 16 June 2019 (17:00 LT) and 17 June 2019 (13:27 LT), covering a length of 115.4 km.
In 2019, the ice break-up in the Kolyma River at Chersky started on 1 June, and our sampling took place during the late freshet. Thus, during the sampling campaign the transect navigated was completely ice-free and in the decreasing phase of the freshet peak discharge as shown by the daily records from the Kolymsk-1 gauge station ( N, E) in the Kolyma River (Fig. S1 in the Supplement). During the sampling days, the average width of the Kolyma channel was about 2 km. With the help of the Arctic DEM Explorer (Environmental Systems Research Institute, Polar Geospatial Center; https://livingatlas2.arcgis.com/arcticdemexplorer/, last access: 7 October 2021), we estimated a total area of the sampled Kolyma River section of about 236.3 km2.
The vessel primarily navigated at the center of the Kolyma River main channel during the sampling, particularly in the DOWN transect. During the UP transect, we purposely navigated in the proximity of the confluences of tributaries and in banks adjacent to floodplains to capture the water properties in regions with visually evident and large lateral contributions from land (i.e., runoff from land as evidenced by more turbid and/or differently colored water).
To facilitate the analysis of the high-resolution data and analyze the specific contribution of banks and confluences with tributaries to the measured water properties and pCH4, we defined five key sites (i.e., S1 to S5) that are associated with sampling points along the UP transect. From east to west the location of the “key sites” is as follows: S1, bank of floodplain 1 at the Ambolikha River at station PP07; S2, the confluence of tributaries Maly Anyuy and Bolshoy Anyuy (M&B Anyuy) at station PP11; S3, bank of floodplain 2 (only in DOWN transect) at station PP20; S4, bank of floodplain 3 (only in UP transect) at station PP23; and, S5, bank at Duvanny Yar at station PP25 (Fig. 1). The continuous data were analyzed independently for each transect, and also within each transect they were categorized as representing either “key sites” or “other sites” in the river section on the basis of the measured pCH4, T, and κ.
The UP and DOWN transects were not navigated exactly at the same locations, and the geographical overlap took place only in a few areas (Fig. 1). Therefore, we compare the results between these transects in the context of the temporal variability in the measured parameters, while the spatial variation is done between the key and other sites of the areas for each transect.
2.2 Collection of discrete river water samples and analysis
The discrete water samples collected during the UP transect at 21 sampling stations (PP05–PP25) were distributed regularly along the track (see Fig. 1 for location and Table S1 in the Supplement for sampling times and average water properties measured at each station). For this, a 1.5 L Niskin bottle was lowered to 1 m depth, and water samples were drawn from the sampler on board through silicone tubing. These samples were used for the analysis of total organic carbon (TOC) and the composition of microbial communities.
2.2.1 Analysis of total organic carbon (TOC) in river water samples
For the quantification of TOC, a volume of 250 mL of water was transferred from the Niskin bottle into an acid-washed amber glass flask. The samples were stored at 4 ∘C until pre-treatment at the laboratory of the Northeast Science Station in Chersky after the sampling campaign. The samples were brought to room temperature and manually homogenized. Two aliquots of 10 mL were transferred to acid-washed glass vials and acidified to pH 2.0 with 37 % HCl. The samples were kept cold during storage and transport to Germany for the determination of TOC via high-temperature catalytic combustion (Analytik Jena), with each sample measured three to five times as analytical replicates. Due to the loss of samples, we report results of TOC in water samples from 7 out 21 stations (33 %).
2.2.2 Analysis of microbial communities in river water samples
We determined the distribution and total community composition of microbial communities, including CH4-producing archaea (methanogens) and CH4-oxidizing bacteria (methanotrophs and methylotrophs) in the river water samples. Methanotrophs utilize CH4 as a carbon source, whereas methylotrophs are more versatile and can also use other C1 compounds as carbon sources. In addition, the abundance of bacteria and archaea was determined along the transects. For this, a volume of 500 mL of the surface river water from the Niskin bottle was transferred into a 500 mL glass flask (DURAN® borosilicate glass, SCHOTT). Using a hand pump and filtration system, this sample was immediately filtered on board through a 0.2 µm filter (Supor®). The 500 mL was divided into three aliquots and filtered independently for analytical replication. The filters were stored inside 2 mL sterile Biozym tubes and submerged in DNA/RNA shield solution (Zymo Research). The tubes with the filters remained at room temperature for their subsequent transport and analysis in Germany for DNA isolation, amplicon sequencing, and 16S rRNA gene quantification following protocols specified in Sect. S.1.2 in the Supplement.
2.3 Instrumental setup
Two instruments were installed on board the vessel for continuous measurements of water properties: (1) an EXO2 multiparameter sonde with seven sensors for simultaneous optical and non-optical water measurements (Sect. 2.3.1) and (2) a flow-through (FT) system for continuous measurements of the partial pressure of CH4 (pCH4) (Sect. 2.3.2). The instruments were continuously fed with water pumped from the port side of the vessel from a nominal depth of 1 m below the water surface, hereinafter referred to as “surface water”. The surface water was delivered through a PVC tubing of 2.5 m length and split into two outlets: (1) one to feed the FT system at an approximate flow rate of 0.14 L s−1 and (2) the other to an onboard 20 L FT box where the EXO2 probe was immersed for the continuous surface water measurements.
2.3.1 EXO2 sonde
The EXO2 multiparameter sonde (YSI Inc., Xylem Inc., Yellow Springs, OH, USA) was used to measure optically the turbidity (in formazin nephelometric units, FNUs), dissolved O2 (DO, µmol L−1), and fluorescent dissolved organic matter (fDOM; quinine sulfate units, QSUs) of the incoming surface river water. It also measured temperature-corrected conductivity (specific conductivity, κ in µS cm−1) with conductivity electrodes, water temperature (T, ∘C) with a thermistor, and pH with a glass electrode. The sonde had an internal battery and was mounted inside a metal frame (to provide protection and stability) submerged inside the 20 L FT box that received the incoming water pumped from the surface. The FT box was kept covered with a lid to avoid heating of the water and light exposure of the sensors. Considering the same water flow rate at the FT box as in the FT system, the water retention time in the FT box was on average 2.3 min, which allowed a sufficient time for the sensors of the sonde to stabilize for a reliable measurement.
The sonde was equipped with a wiper brush that routinely cleaned the window of the sensors to avoid interference due to fouling caused by the accumulation of deposits. The wiping periods were registered and removed from the data set. We obtained one measurement every 5 s, and the data were monitored and stored in an onboard computer.
As a result of the travel distance of the pumped water through the pipe, the water within the onboard 20 L box was on average 0.6 ∘C warmer and with 1.2 mg L−1 higher DO content than the in situ water at 1 m depth. Thus, the T and DO measurements of the EXO2 sonde were corrected by these mean values. All the sensors of the sonde were factory-calibrated prior to the measurements. Two-point calibrations were performed on-site to the DO and pH sensors, and no analytical drift was observed before and after the measurements that would have required correction. The measured fDOM was temperature corrected to a reference of 25 ∘C (Downing et al., 2012; Watras et al., 2011), and further corrections due to the turbidity influence in the sensor response to light attenuation were done after Snyder et al. (2018).
2.3.2 Flow-through (FT) system
The FT system is a portable and versatile flow-through sensor setup for continuous direct measurements of pCH4 from surface water. We used a CONTROS HydroC® CH4 FT sensor based on tunable diode laser absorption spectroscopy (TDLAS) (-4H-JENA engineering GmbH, Jena, Germany). This sensor has a working accuracy of ±2 µatm or 3 % of the reading (A. R. Canning et al., 2021) according to the manufacturer standard specifications. A SBE45 thermosalinograph sensor (Sea-Bird Electronics, Bellevue, USA) was used to measure the temperature (T_FT, ∘C) and conductivity of the incoming water. The HydroC® CH4 FT sensor was factory-calibrated before and after the measurement campaign. The calibration and validation of the data were done following A. R. Canning et al. (2021). Drift and response time corrections were not applied because we assume sufficient exposure of the water to the sensor at the low sailing speeds. Because the relatively long response time of the CH4 sensor (of the order of 20 min), the obtained data are significantly smoothed, and therefore, the captured gradients and extreme values might not be precisely geographically located. However, the advantage of the high-spatial-resolution data allowed for a surface coverage that helps identify high-CH4-concentration areas. For more in-depth corrections see A. R. Canning et al. (2021).
Besides the slow navigation speed, the average time spent at each sampling station was 7 ± 13 min (minimum of 2 min and maximum of 8 min), which allowed for further equilibration times of the surface water at the sensors of the instruments, particularly at sites with high CH4 concentration.
We obtained one measurement every 5 s, and the data were monitored and stored on an onboard computer. The EXO2 sonde and FT system data were averaged to 1 min values. During the measurements, we also navigated inside smaller tributaries, one located at halfway along the transect length (named here as Leonid's stream) and another at the end of the DOWN transect, located along the Ambolikha River. Because the water properties measured in these streams are in strong contrast with the properties in the main stem, we removed these sections from the full data but still present the average values measured along those transects.
2.4 CH4 flux calculation
To obtain the gas exchange across the water–air interface (i.e., flux density) it is necessary to calculate the gas transfer velocities k. Here we followed two methods to obtain k: (1) using a hydraulic model as a function of water velocity and discharge, as well as the river configuration (Raymond et al., 2012), and (2) using a parameterization as a function of wind speed (Wanninkhof, 2014). This was done in order to cover a range of values given the large uncertainties of k in rivers.
The first method to calculate k is with a hydraulic model as a function of stream velocity (V, m s−1), river slope (S, unitless), water discharge (Q, m3 s−1), and water depth (D, m) (empirical Eq. 7 in Raymond et al., 2012):
The average stream velocity for the transect (V=1.27 ± 0.1 m s−1) was calculated from the mean daily water discharge from 15 to 17 June 2019 as reported at the Kolymsk-1 gauge station (Q=13 267 ± 950 m3 s−1) divided by the mean cross-sectional area in the channel (A=10 400 ± 9721 m2). A was calculated from the average river depth (D=5.2 ± 4.9 m) times the river width (W fixed at 2000 m) at the sampling times. The slope S for the Kolyma River along the 120 km channel was 0.003 % considering the mean elevation of 4 m, obtained from the slope map in the Arctic DEM Explorer (Environmental Systems Research Institute, Polar Geospatial Center; https://livingatlas2.arcgis.com/arcticdemexplorer/, last access: 7 October 2021). An uncertainty of up to 7.8 % is obtained in this calculation mostly due to the use of an average river depth for the calculation of the cross-sectional area and the stream velocity. The section of the Kolyma River can be in places as shallow as 1.7 m and as deep as 21.6 m, leading to faster water flows as the water column is shallow. However, larger uncertainties are expected due to the variation in Q along the stream, since the values used here are daily averages measured at one single site at the Kolymsk-1 gauge station.
The second method to calculate k is with an empirical wind speed parameterization from Wanninkhof (2014):
where u10 (m s−1) is the wind speed normalized to 10 m above the water surface, following Amorocho and Devries (1980), calculated from the wind velocities measured at a height of 6 m above ground at a nearby eddy tower during the sampling period (Castro-Morales et al., 2022a).
The k_R12 from the hydraulic model and k_W14 from the wind speed parameterization were standardized to a constant temperature using the Schmidt number (Sc) for CO2 and freshwater at 20 ∘C, i.e., (Wanninkhof, 1992), and the Sc of CH4 () (Wanninkhof, 2014) as follows:
The water-to-air flux density of CH4 (F, per amount area per time) was obtained with the following function: , where k∗ is the gas transfer velocity (per length of time) of CH4 at the in situ T (Eq. 3) for R12 or W14 (Eqs. 1 and 2). The water-side equilibrium concentration of CH4 (Ceq, µmol L−1) is subtracted from the measured bulk CH4 concentration in the water (Cw, µmol L−1). Cw was calculated from the Bunsen solubility coefficient (β, ) that is calculated as a function of temperature (Weiss, 1970), while Ceq was calculated following Wiesenburg and Guinasso (1979). The atmospheric pCH4 (atm) was calculated as follows:
where x is the dry air mole fraction of CH4. P is the barometric pressure, and pH2O is the saturation water vapor pressure at in situ water temperature (both in atm). We used the global mean dry air mole fraction of 1858.8 ppb for CH4 during June 2019 according to the Global Monitoring Laboratory, NOAA (Dlugokencky and Tans, 2019), and a standard barometric pressure of 1 atm.
2.5 Data analysis
2.5.1 Correlation between water pCH4 and water parameters
To simplify the analysis for finding the relationship between the multiple water parameters measured along the transect and pCH4, we calculated 1 min averages from the continuous measurements of T, κ, pH, DO, fDOM, and pCH4 at the location of the discrete sampling stations in the UP transect. For this analysis, we also included the TOC concentrations from seven stations (average ±1 standard deviation values are summarized in Table S1), since organic matter can be a source for methanogens. In addition, we calculated the shortest distance from each station (zstas) and of the navigated transects (z) to any of the river banks and considered this distance as another parameter relevant for the distribution of pCH4 in the river. The river banks along the navigated transects were digitized in Google Earth Pro®, and no other property was used to define the geographical location of these limits; hence, the river banks are fixed locations without temporal variation for the period of our sampling. We obtained zstas and z from the shortest physical distance between the geographical positions of the sampling stations and of the UP and DOWN transects to any of the defined river banks. The river banks and limits of the transect define the polygonal area of interest for this study (Fig. S2 in the Supplement).
To find the correlation between the 1 min averages of pCH4 and the water properties, as well as the TOC at the sampling stations and zstas, we performed a Pearson pairwise linear correlation analysis (p<0.1).
2.5.2 Random forest regression analysis for extrapolation of transect pCH4 into a polygonal area of the river section as a function of T, κ, and z
We estimated the pCH4 at the sampling times in the entire river area of a polygon delimited by the river banks and the limits of the navigated transects (Fig. S2). The riverbank-forming polygon of the Kolyma River section covered an area of 236.3 km2. Within this area we constructed a fine grid regularly distributed within the river polygon and with a horizontal spatial resolution of 0.1 km.
We then built a fine grid polygon in the river for T and κ based on their best fit correlations to z at the transect scale for the “key sites” and for the “other sites” (depending on the measured pCH4, T, and κ) at the sampling times during the UP and the DOWN transects. The gridded products were used to extrapolate pCH4 to other areas of the river as defined by the gridded area delimited by the river banks and on the basis of the highly spatially resolved pCH4 measured along the transects.
For this, we obtained a best fit between T, κ, and z to pCH4 by applying a random forest regression analysis. First, for “key sites”, this was done as a function of T and κ, i.e., pCH4_key(Tkey, κkey). Second, for “other sites” it was done as a function of T, κ, and z, i.e., pCH4_other(Tother, κother, z). These models were applied to the gridded polygon to extrapolate pCH4 from the transects to the entire gridded polygon. Once the gridded T and κ were obtained, the corresponding model for pCH4_key and pCH4_other was applied. This procedure was done independently for the UP and DOWN transects.
3.1 Spatial distribution of continuous surface pCH4 and water properties in UP and DOWN transects
The high-resolution continuous measurements of surface pCH4 show significant spatial heterogeneity and temporal variability in both the UP and DOWN transects (Fig. 2). Overall, high pCH4 (up to 46 µatm) was measured in the presence of warm (15.5 ∘C) and less conductive (κ<88 µS cm−1) water and was mostly located closer to the river banks (z<1.0 km) (Figs. 3 and 4).
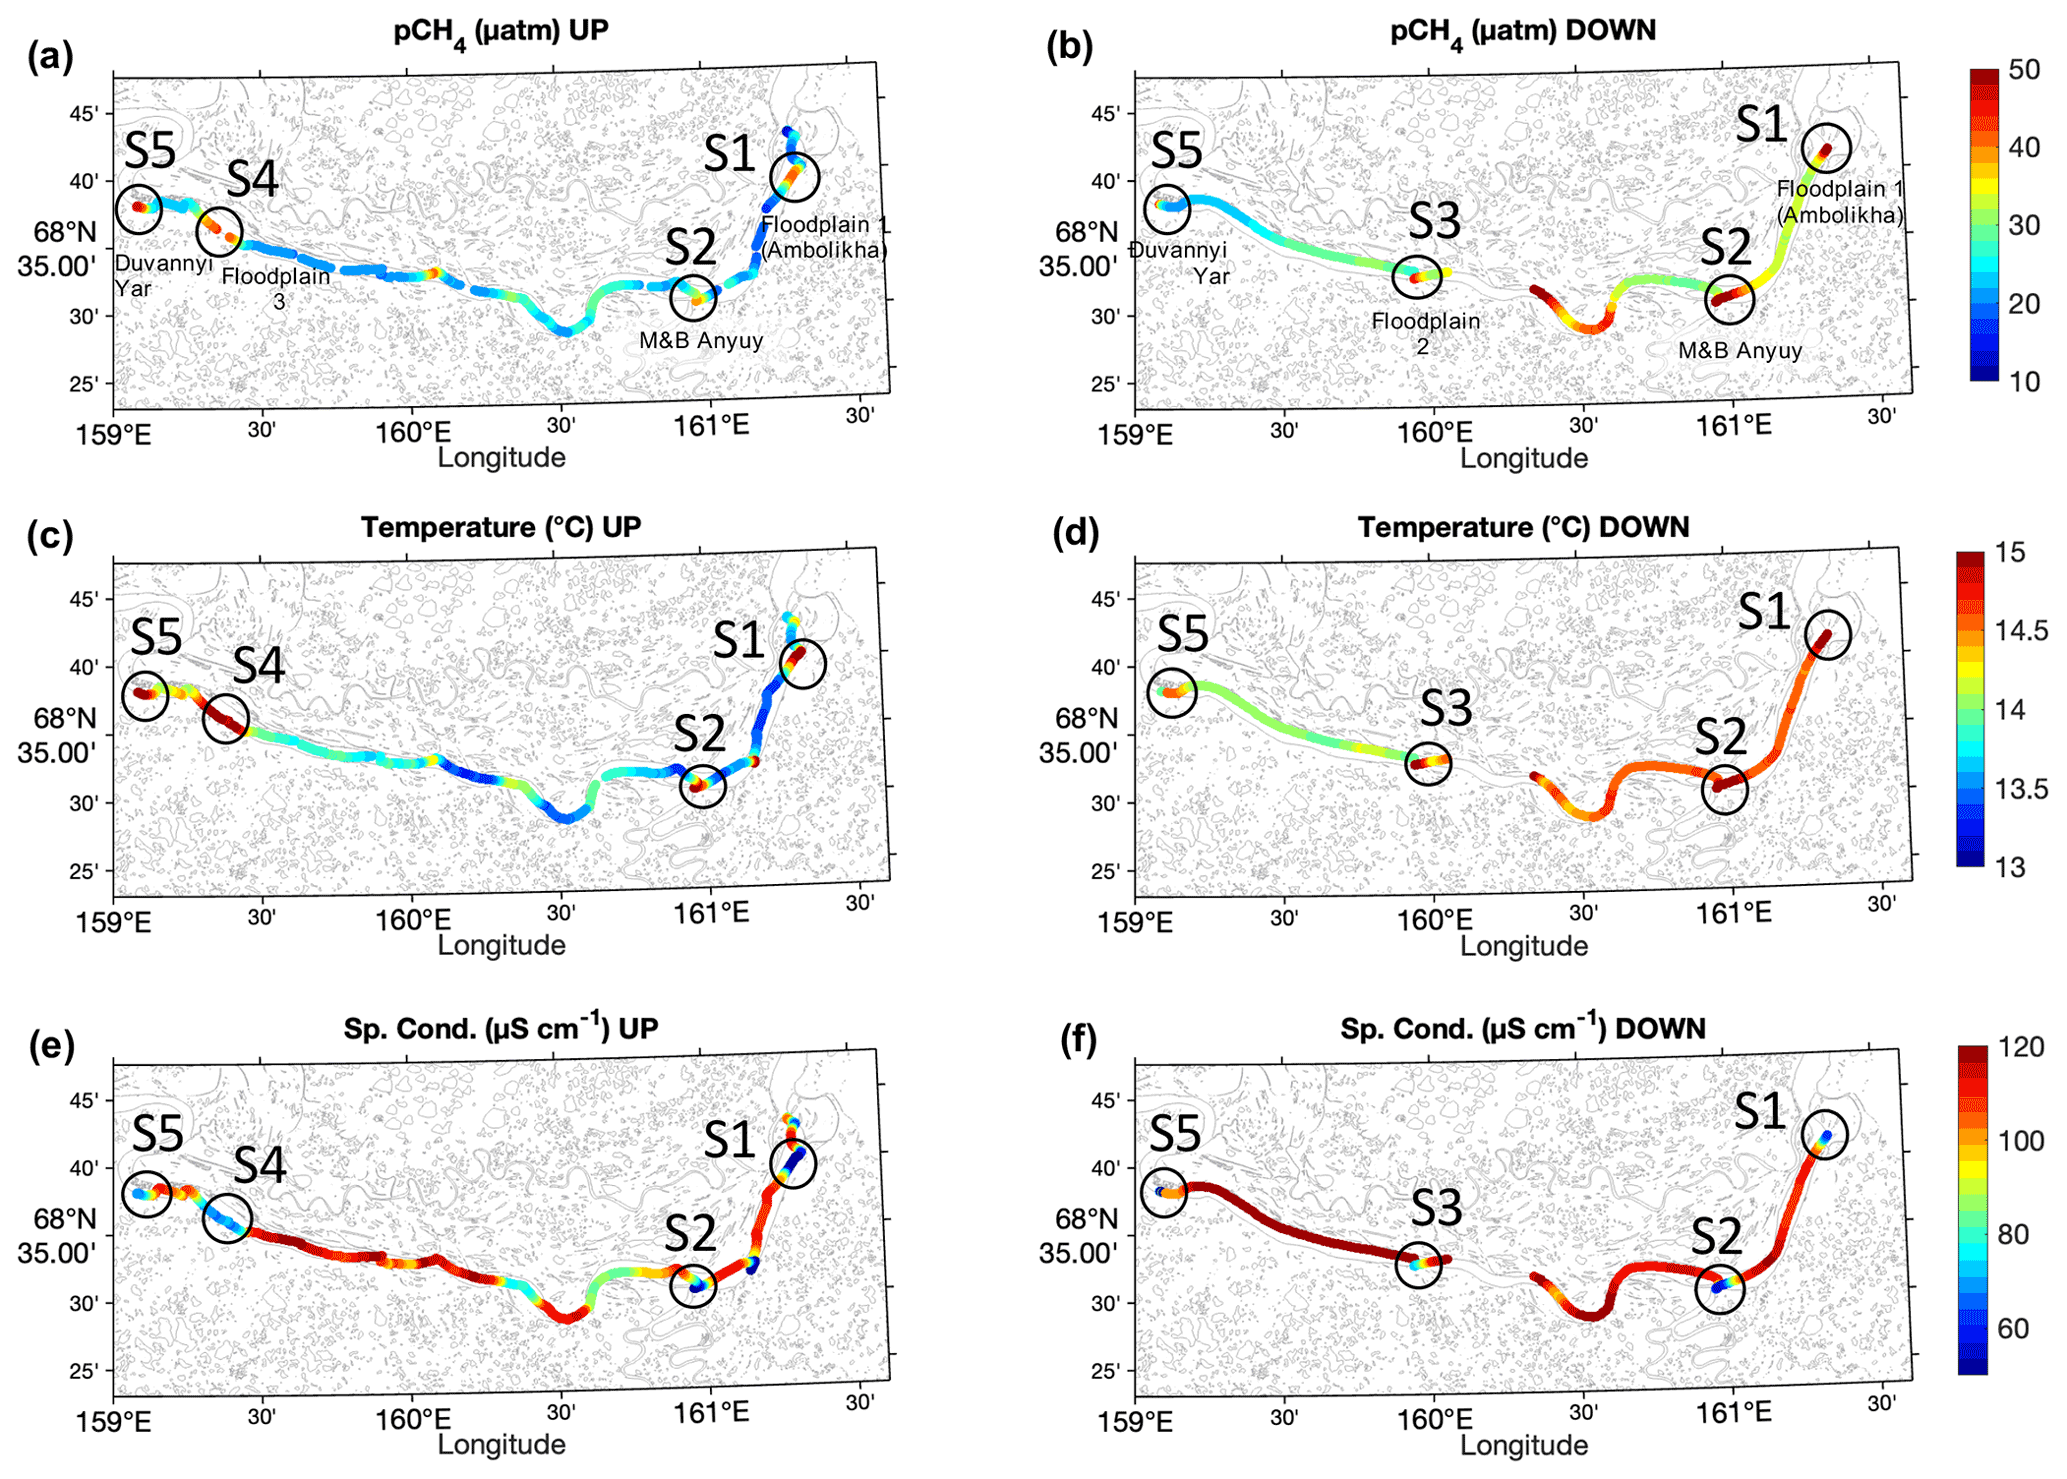
Figure 2Spatial distribution of water properties measured along transects UP (a, c, and e) and DOWN (b, d, and f) along the main stem of the Kolyma River for pCH4 (a and b), T (c and d), and κ (e and f). The location of key sites S1 to S5 are indicated. The data corresponding to the Ambolikha River and Leonid's stream are not shown.
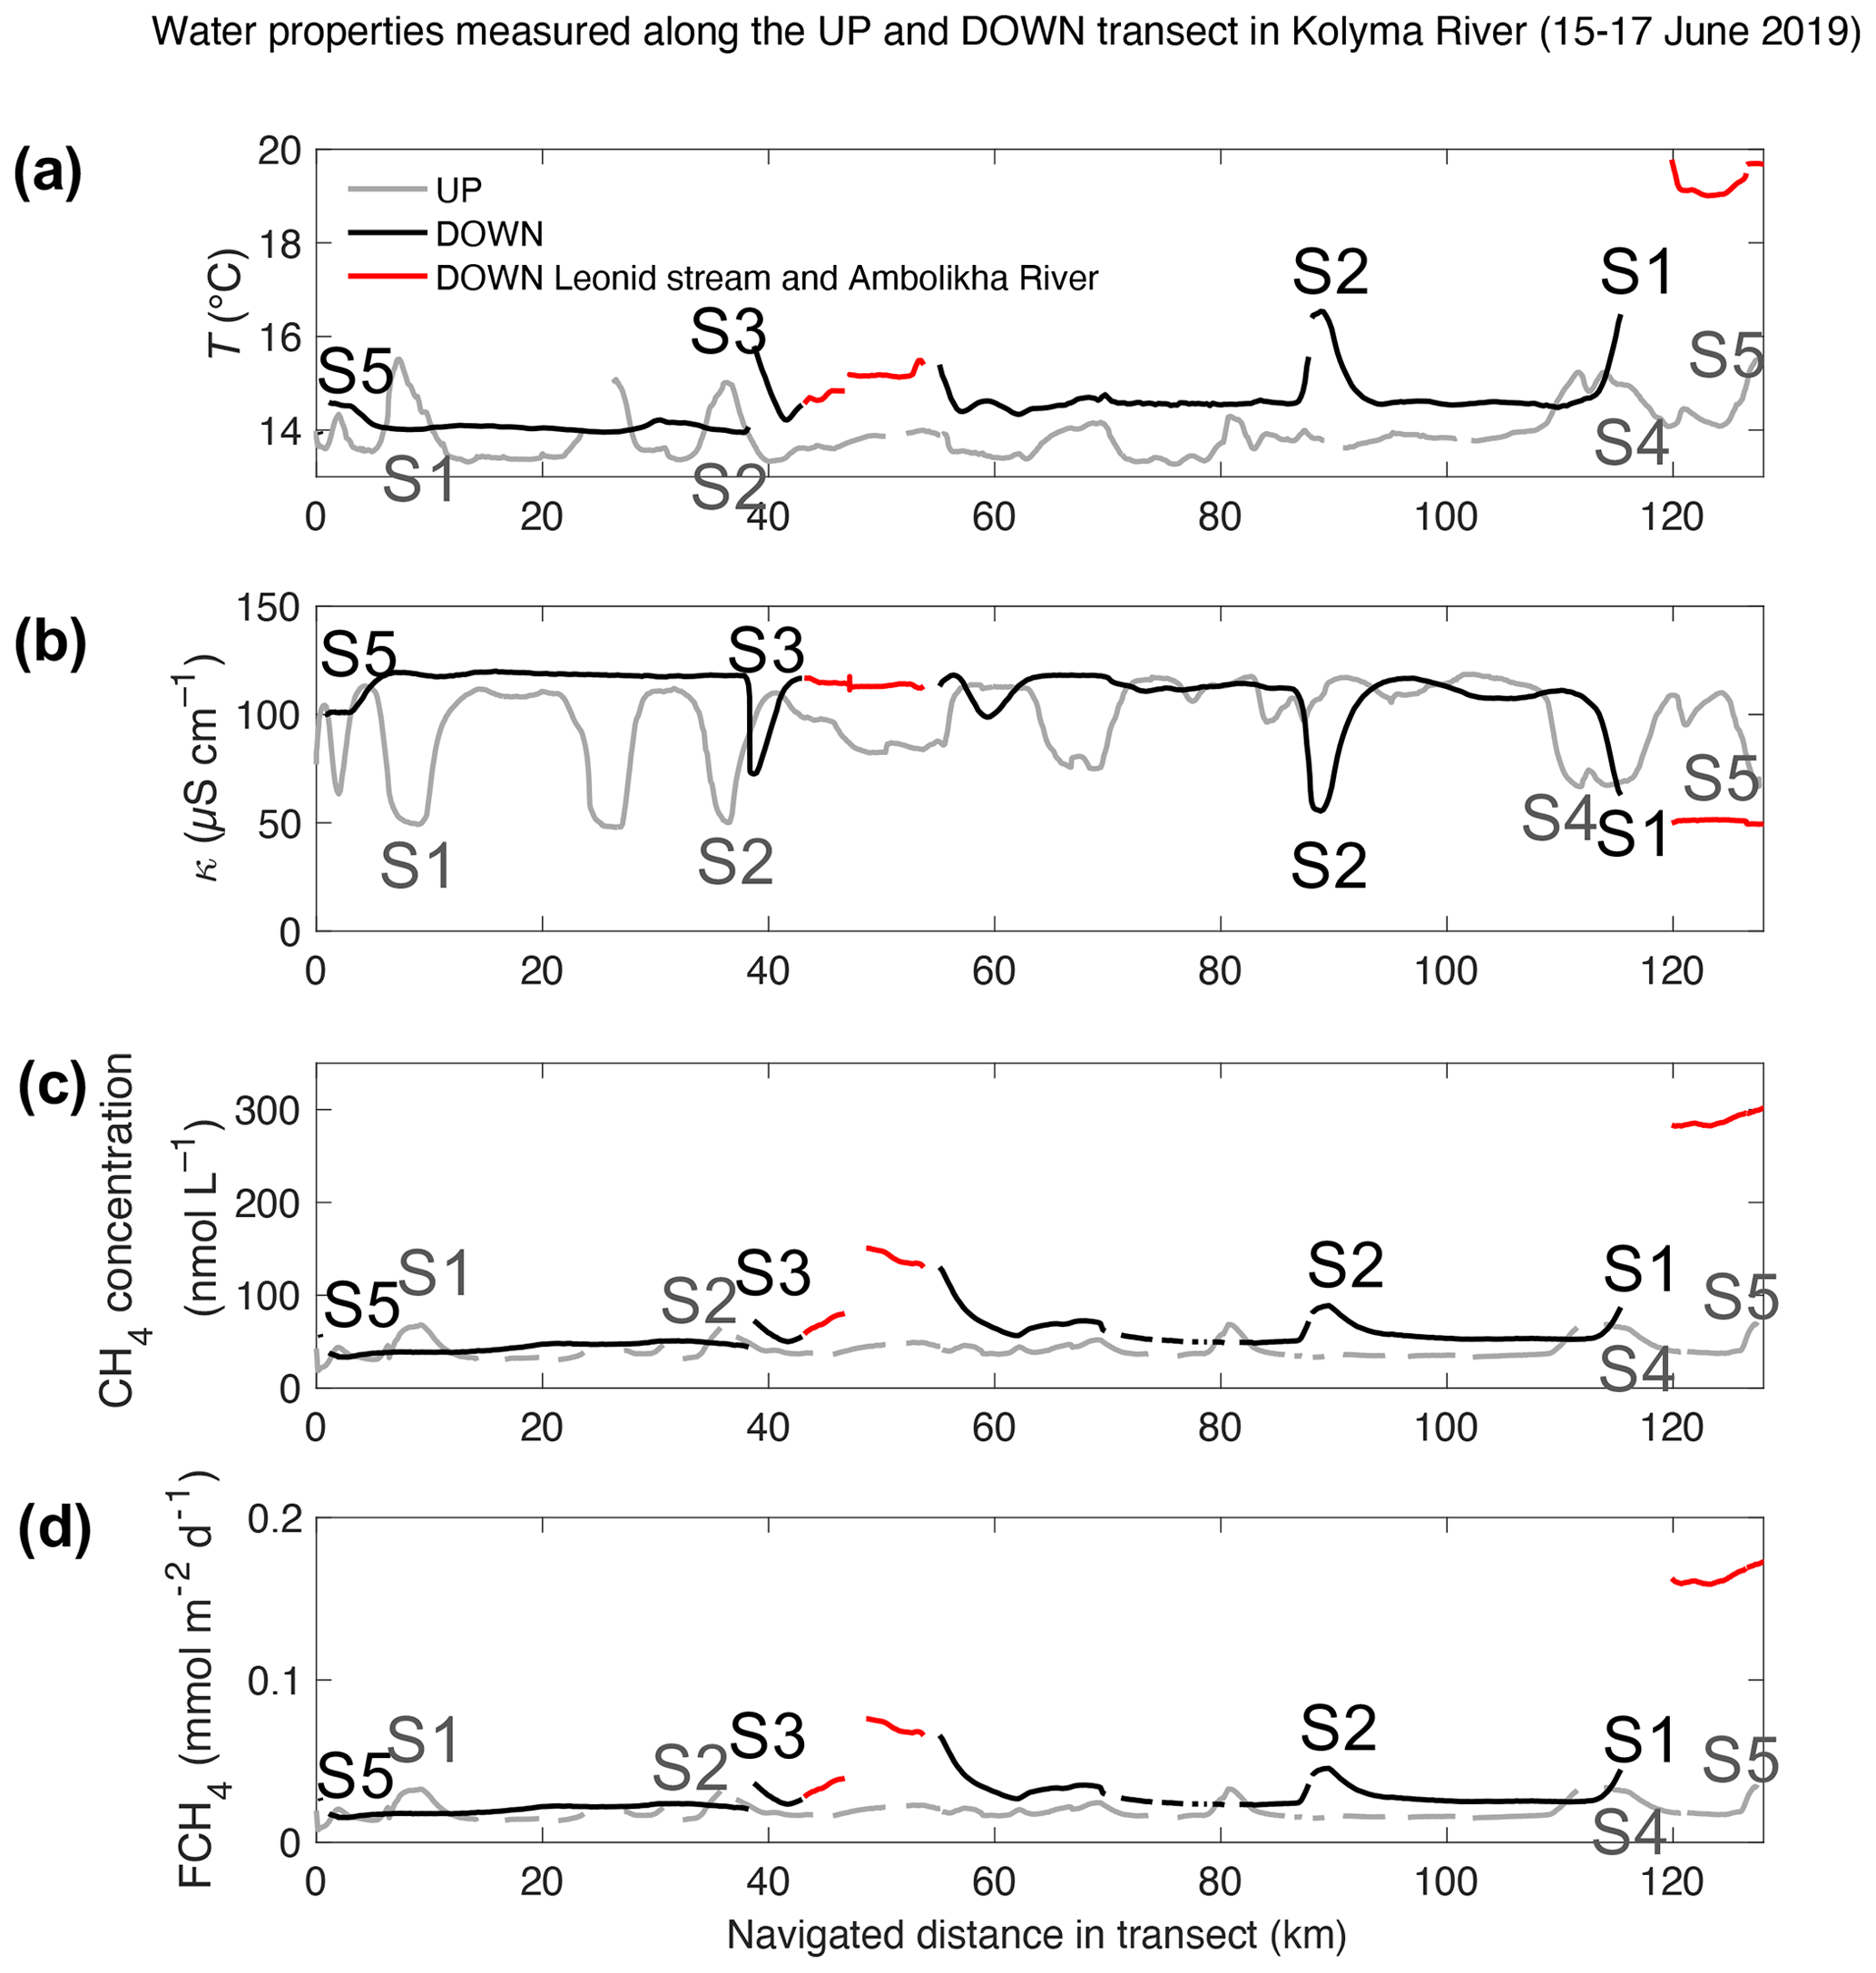
Figure 3Water properties measured in transects UP (grey) and DOWN (black): (a) water temperature, T; (b) water-specific conductivity, κ; (c) CH4 concentration, Cw; and (d) flux density of CH4, FCH4 – all shown as a function of the navigated distance (km) along each transect. The location corresponding to the key sites S1 to S5 are indicated and color-coded in each signal (light grey – UP transect and black – DOWN transect). The Ambolikha River and Leonid's stream are shown in red. Gaps in the data indicate erroneous or not measured data in the transect.
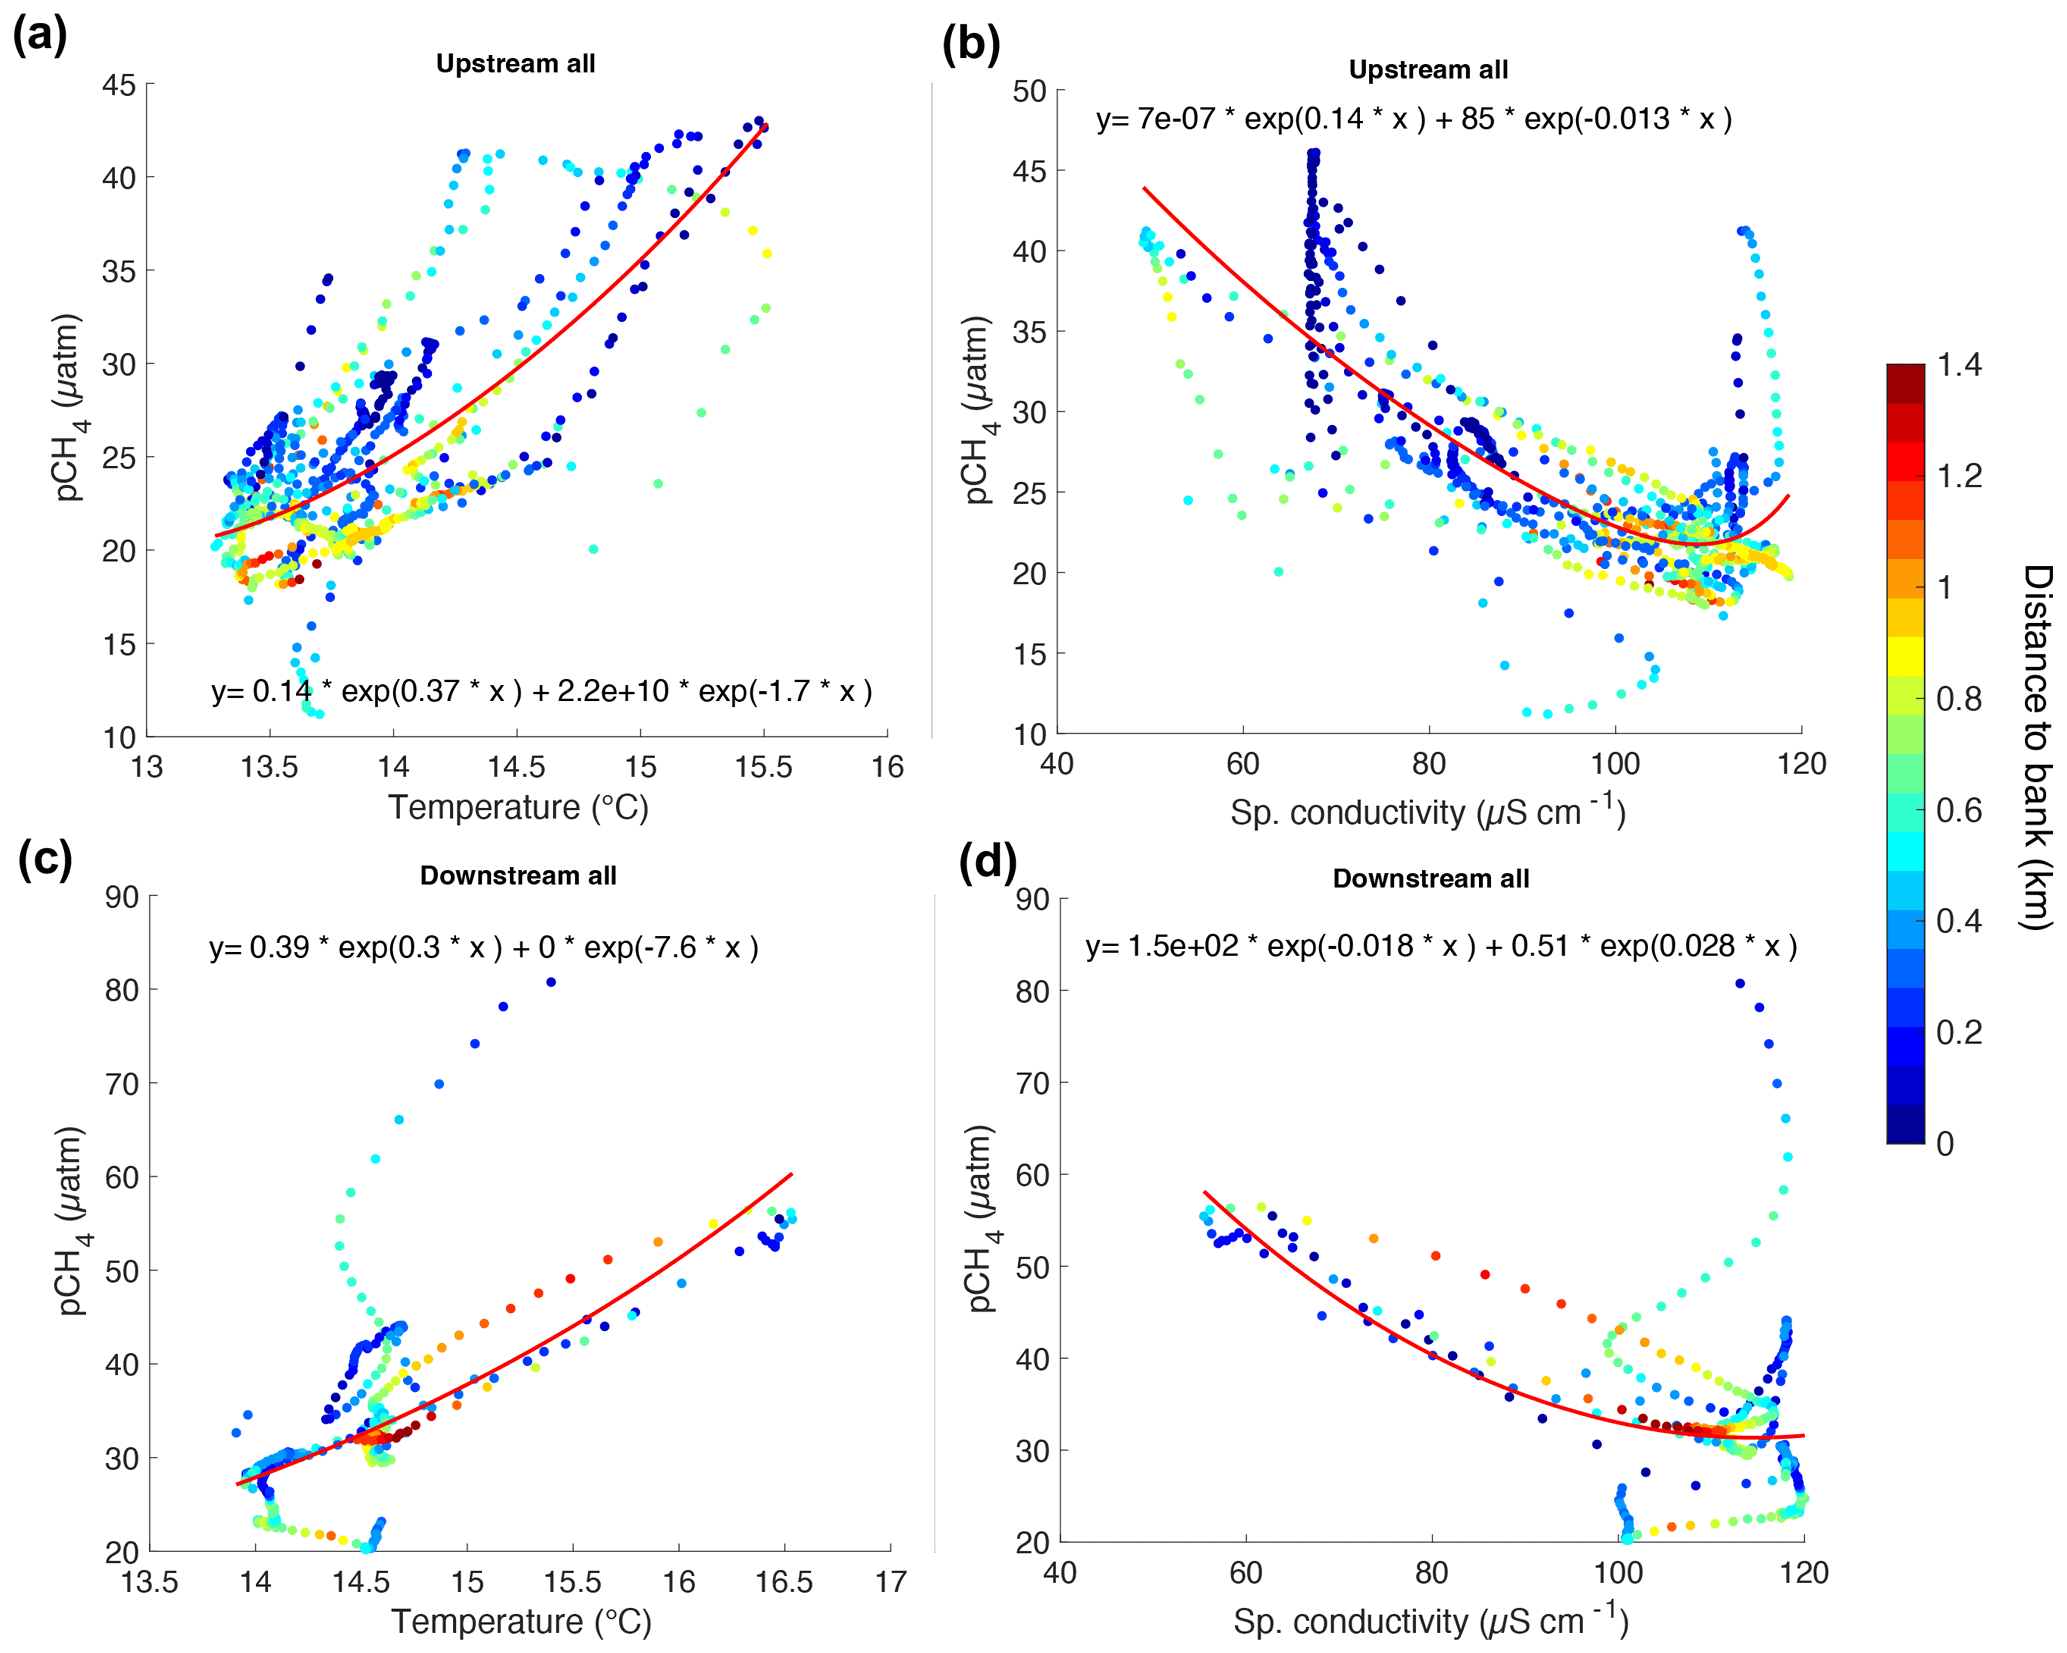
Figure 4Correlation graphs for UP (a and b) and DOWN (c and d) transects between T, κ, and pCH4 as a function of the distance to bank (z in km) indicated in the color scale.
During the UP transect, the average measured pCH4 was 25.8 ± 6.7 µatm (or in terms of CH4 concentration, Cw=41.5 ± 9.2 nmol L−1). These values were measured in colder (by 0.6 ∘C) and less conductive waters (by 16.1 µS cm−1) compared to the DOWN transect that was navigated 2 d later. The DOWN transect had on average 7.4 µatm higher pCH4 (33.2 ± 9.4 µatm or 54.3 ± 14.7 nmol L−1) than the UP transect (Table 1 and Fig. 3). In both transects, the concentration of CH4 remained supersaturated (by 1189 % ± 198 % in the UP transect and 1622 % ± 380 % in the DOWN transect) with respect to the concentration at atmospheric equilibrium (average 3.2 ± 0.04 nmol L−1).
Table 1Average ±1 standard deviation (minimum and maximum values below it) of pCH4, the concentration of CH4 (Cw), T, and κ measured along the UP and DOWN transects in key sites (S1–S5) and in the other sites of each transect. Measurements done in a tributary (Ambolikha River) and a stream (Leonid's stream) as part of the measurements during the DOWN transect are also shown.

The spatial distribution of water properties measured in both transects depicted evident differences between the center of the main stem and the areas at the proximity of banks adjacent to floodplains and at confluences of tributaries with the Kolyma main stem (Fig. 2a and b and S3 in the Supplement). Specifically, hotspots of pCH4 with values >35 µatm were measured in the key sites at the time of the measurements (Figs. 2 and 3).
During the UP transect, the maximum measured pCH4 was 46.1 µatm at site S5 (Duvanny Yar), very similar to the value measured during DOWN at the same location (i.e., 44.6 µatm). The maximum pCH4 measured in the main stem (80.7 µatm) was found at a site halfway along the DOWN transect in a site at the outlet of Leonid's stream (location 68.5281∘ N, 160.3437∘ E). However, the highest pCH4 was measured inside streams or tributaries with up to 222.9 µatm at the Ambolikha River and up to 92.9 µatm inside Leonid's stream, both navigated during the DOWN transect (Table 1). Larger supersaturations with respect to the atmospheric equilibrium were observed at these two transects with 9610 % ± 403 % in the Ambolikha River and 3415 % ± 1051 % in Leonid's stream.
In addition to pCH4, T and κ were considered to distinguish between the key sites S1 to S5 from the other sites in the river. The key sites S1 to S5 were characterized (besides pCH4>35 µatm) by the presence of warmer (T>14.5 ∘C) and less conductive water (κ<88 µS cm−1) at the sampling time. Finally, because the key sites S1 to S5 were evidently located in the proximity of tributary confluences and banks (i.e., z<0.8 km), we also considered z (distance to the river bank; Fig. S2) as a parameter related to high pCH4 in the main stem as shown in Fig. 4. The average, minimum, and maximum values of pCH4, Cw, T, and κ in the UP and DOWN transects at “key sites” and all “other sites” of the transect are summarized in Table 1.
Other areas along the transects where pCH4 was higher than 35 µatm were not included as part of the key sites because their corresponding T or κ did not meet the properties specified above, e.g., at the site of the maximum pCH4 of 80.7 µatm at the outlet of Leonid's stream where T=15.4 ∘C and κ=113.1 µS cm−1 (Figs. 2 and 3).
The pairwise linear correlation analysis (p<0.1) between all the measured parameters showed a statistically significant positive correlation between pCH4 and T (r2=0.51) and a negative correlation to κ (r2=0.22), zstas (r2=0.36), and DO (r2=0.17). No significant correlation was found between pCH4, fDOM, and turbidity.
To analyze if any of the measured water parameters had an influence on the distribution of pCH4, we chose the parameters to which CH4 was significantly correlated: T, κ, and zstas. These conservative parameters are then considered as potential predictors for the presence of dissolved CH4 in the river in contrast to reactive tracers such as DO that can be biologically or chemically altered in the river water. The analysis of environmental indicators was done with the continuous high-resolution data only for the main stem areas.
3.2 Influence of conservative tracers on the distribution of riverine pCH4 along transects and random forest regression as a gap-filling approach
The variations of T and κ in the river are influenced by the proximity to the outlets of tributaries and the riverbanks. This influence is more evident in the UP transect, where T and κ at “key sites” correlated positively with z (r2>0.45, p=0.05) (Fig. S4 in the Supplement). In the data for the “other sites”, the relation between T and κ vs. z followed a semi-logarithmic fit (p=0.05) in both the UP and DOWN transects (Fig. S5 in the Supplement).
To be able to fill gaps and extrapolate the pCH4 measured along the transects into the entire polygonal river area, we employed a random forest regression approach based on the correlations between T, κ, and z. For this, we first built a fine-gridded polygon for T and κ using the linear (for “key sites”) and semi-logarithmic correlations (for “other sites”) observed at the transect level during the sampling times. Once a gridded T and κ were generated, the corresponding random forest model for pCH4_key and pCH4_other at transect level as a function of T, κ, and z was applied. This procedure was done independently for the UP and DOWN transects; hence two polygons representing the modeled pCH4 during 15–16 and 16–17 June 2019 were obtained (Fig. S6 in the Supplement).
To validate the output of the random forest models, we compared the measured and modeled pCH4 along each transect. Results show that the skill of the model for the UP transect better reproduces the pCH4 with an uncertainty of 3.9 µatm than that of the model for the DOWN transect (uncertainty of 9.1 µatm) (Fig. S7 in the Supplement). A larger error is observed in the areas of the key sites mostly during the DOWN transect.
3.3 Microbial composition and TOC analysis in discrete water samples
Similar to the influences of temperature (T) and specific conductivity (κ) on the distribution of pCH4, we found that microbial community composition was significantly related to both T (F=15.5, r2=0.17, p<0.001) and κ (F=12.7, r2=0.14, p<0.001) (Fig. 5), while the distance to the shore (z) was not significant. The pCH4 measurements alone explained a low portion of the community variance (r2=0.06, p<0.03), which, when tested in conjunction with both T and κ, was not a significant contributor to microbial community variance. In this way, microbial community composition can act as a record of pCH4, as microbes (as well as T and κ) are less dynamic than pCH4. Within the context of the strong patterns related to both T and κ, there were spatial patterns that reflected the location within the main stem and the influences of tributaries, with key site S3 (PP20) exhibiting the lowest similarities with the other four key sites and clustering with other water samples collected within the main stem of the river. Conversely, key sites S1 and S2 clustered separately from all other water samples likely due to the heavy influence of tributary outflow and floodplain inputs (Fig. 5).
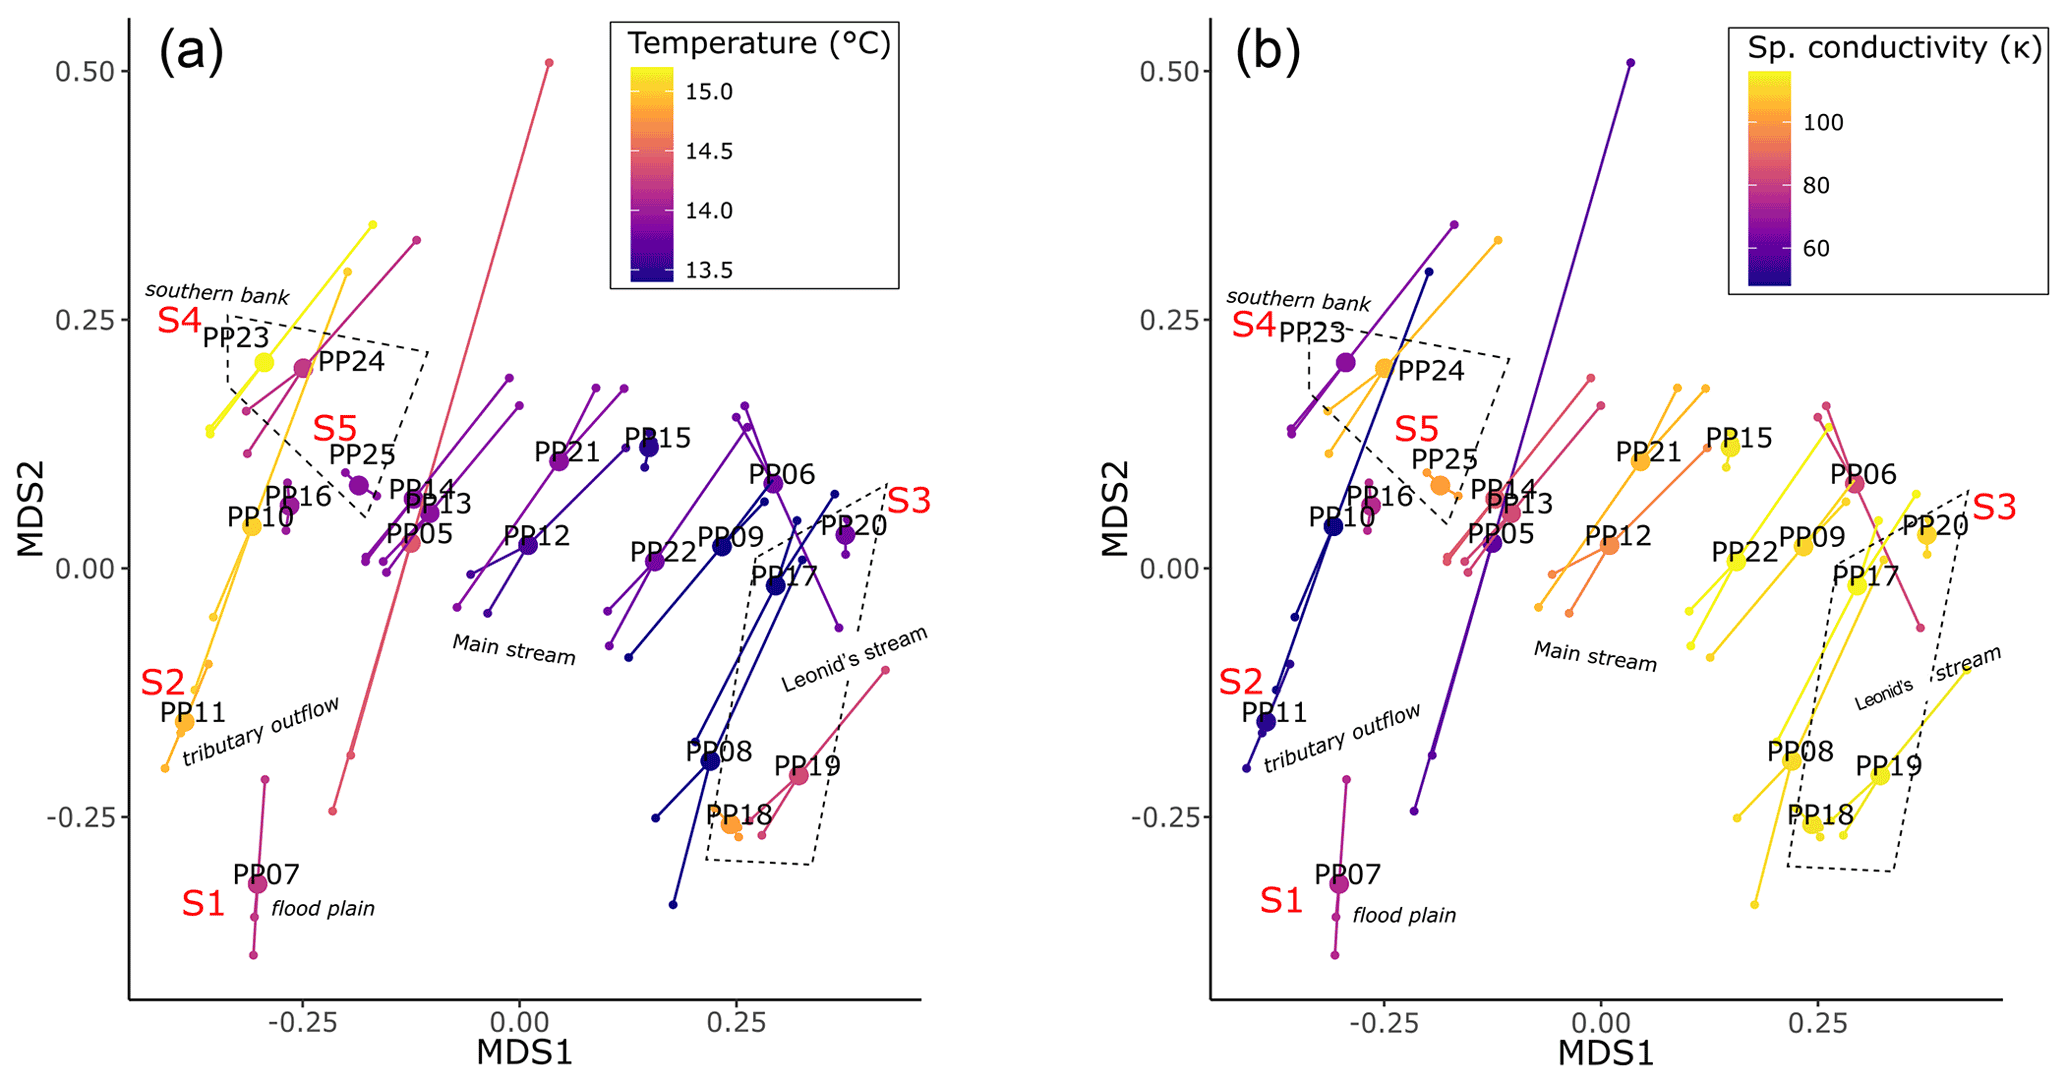
Figure 5Riverine microbial community composition linked to temperature (a) and specific conductivity (b). Both plots represent the same underlying community data, with dissimilarities determined by the Bray–Curtis metric and visualized with non-metric multidimensional scaling plots.
Quantifying the 16S rRNA gene abundances of total archaeal and bacterial populations revealed that archaea were 3 orders of magnitude lower in abundance than their bacterial counterparts across the river transect. However, the abundances of both were found to strongly correlate (Pearson, r2=0.81, ) (Fig. S8 in the Supplement). Within the archaeal 16S sequences detected, we found two putatively methanogenic operational taxonomic units (OTUs), each belonging to a different family/genus (Methanobacteriaceae – Methanobacterium, Methanoregulaceae – Methanoregula). The highest relative abundance of methanogens (0.012 %) occurred at station PP07 (key site S1) (Fig. 6a), and the other key sites with the highest CH4 concentrations did not exhibit particularly elevated methanogen abundances.
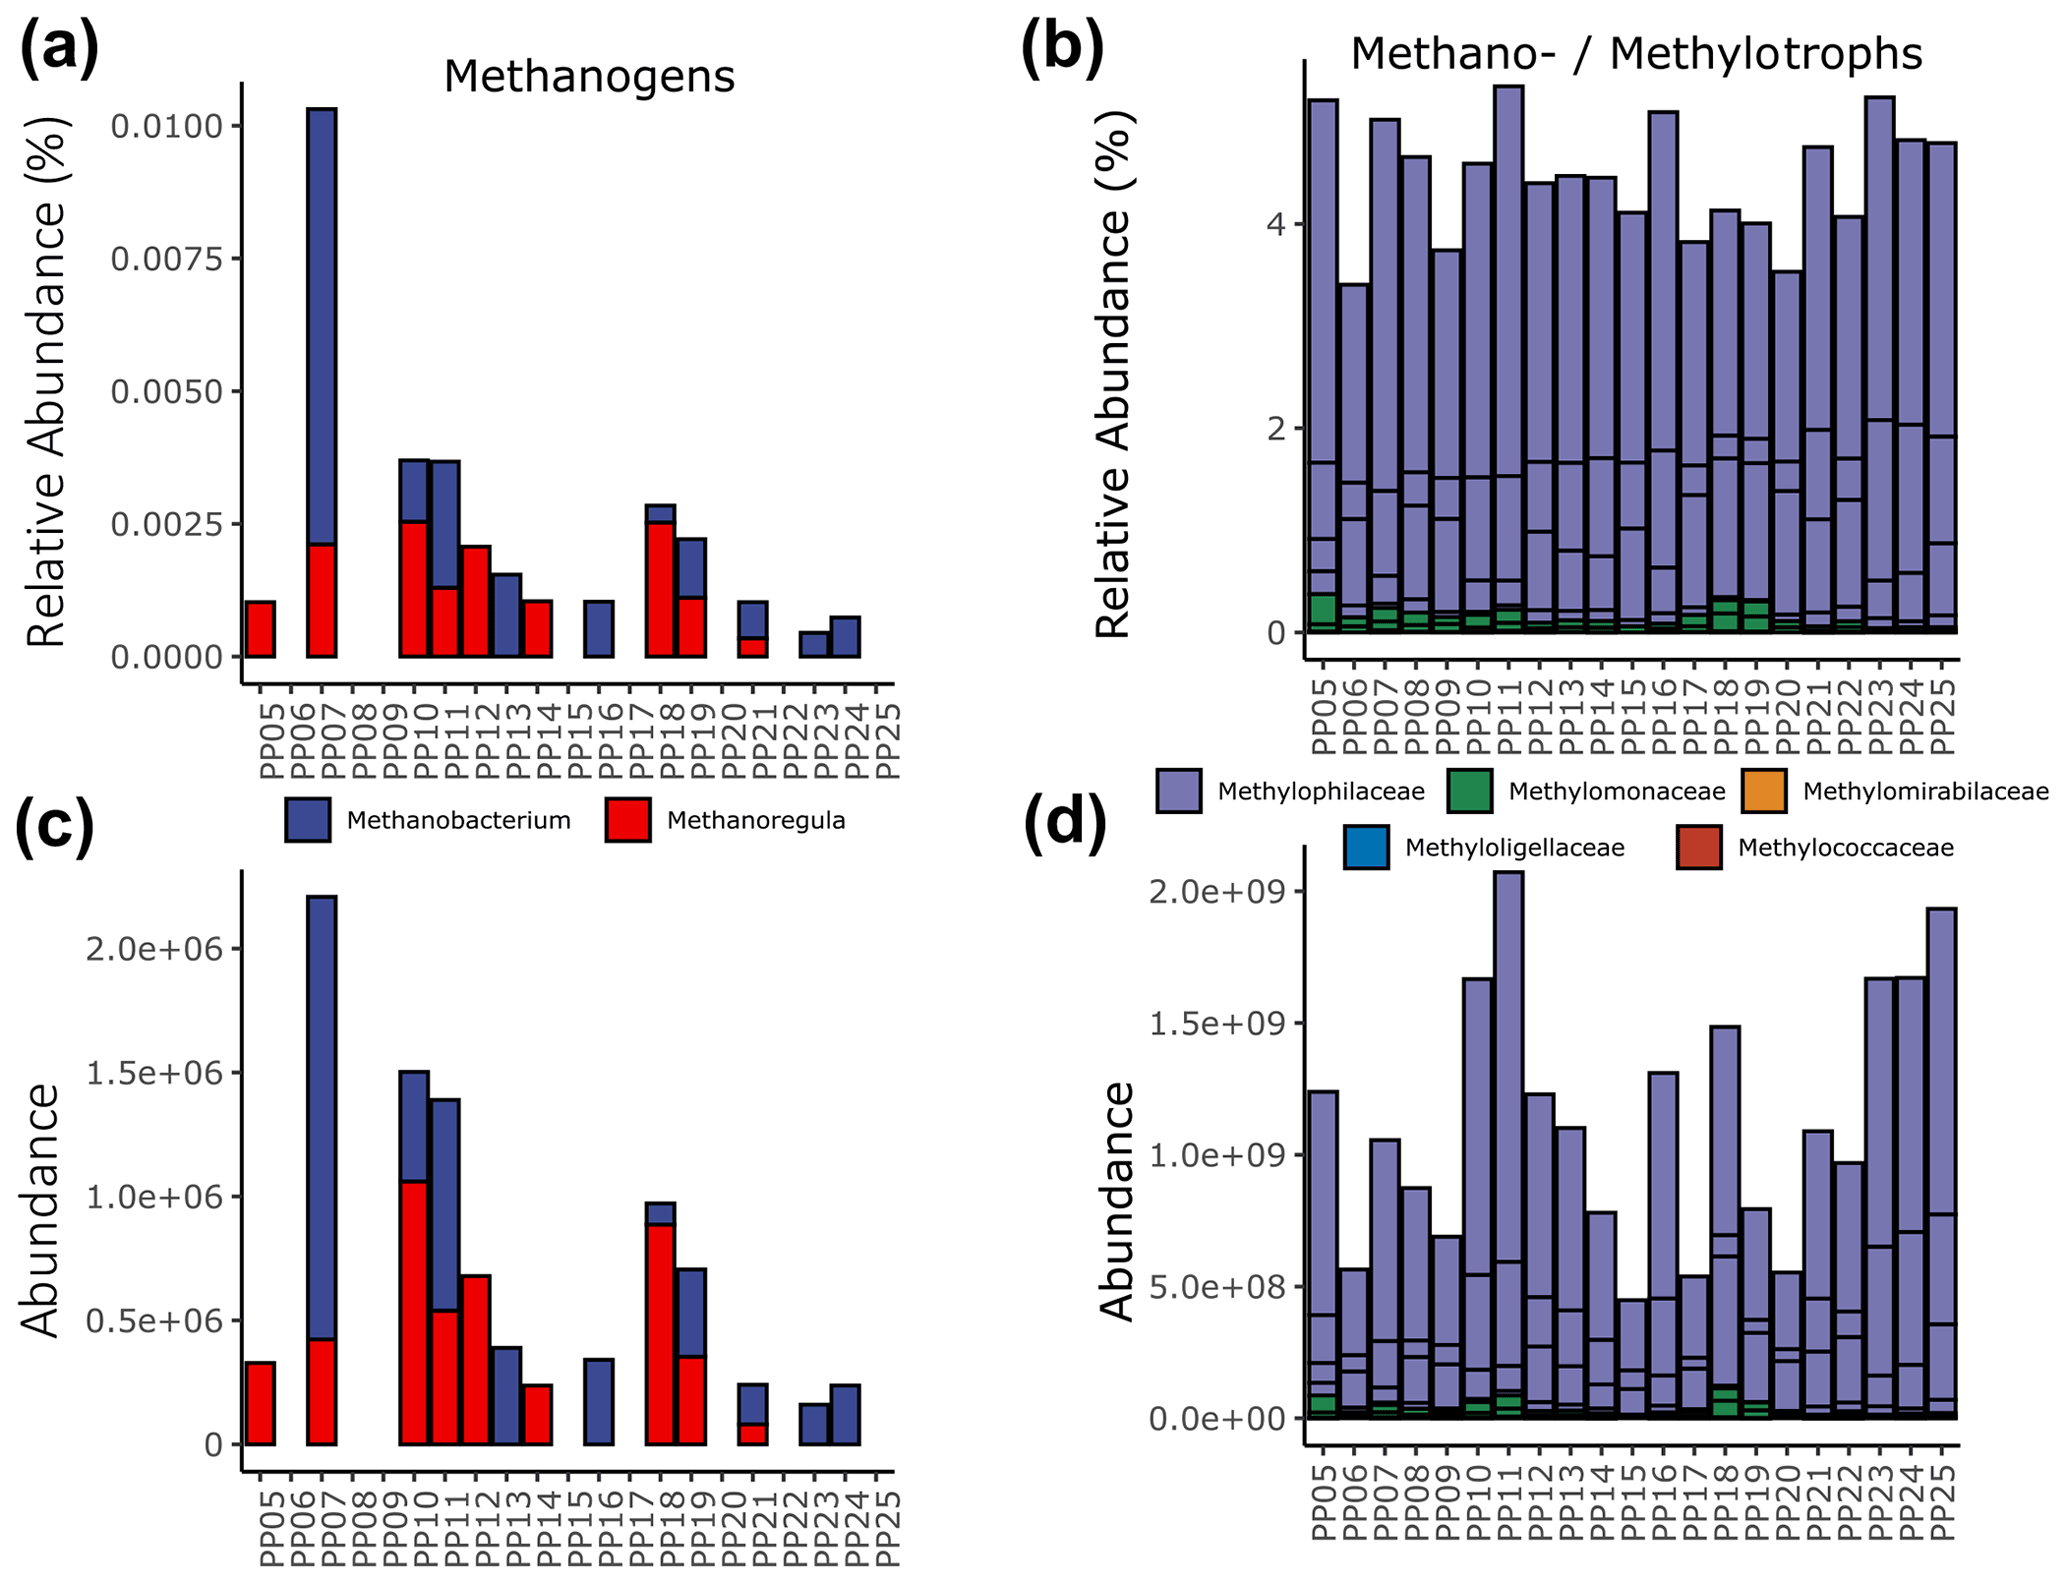
Figure 6Relative (a and b) and pseudo-absolute (c and d) abundances of putatively methanogenic archaeal genera (a and c) and methylotrophic bacterial families (b and d). An expanded version that includes only the methanotrophs is available in the Supplement (Fig. S9).
Conversely, bacterial putative groups associated with methanotrophy/methylotrophy, particularly OTUs within the family Methylophilaceae, were detected at all sites and ranged between 3.5 % to 5.5 % relative abundance (Fig. 6b). Restricting our analysis to genera known to be strict methanotrophs, we find sequences affiliated with Methylobacter that range from 0.01 %–0.3 % relative abundance and only traces of Ca. Methanoperedens (Fig. S9 in the Supplement). The relative abundances of these groups were approximated to pseudo-absolute abundances using the quantitative qPCR results from each sample. Patterns in methanogen abundances were consistent regardless of scale (Fig. 6c), while methano-/methylotrophs exhibited higher abundances at stations PP10, PP11 (key site S2), and PP23–PP25 (including key sites S4 and S5) and lower abundances within PP06, PP09, PP15, PP17, and PP20 (key site S3) (Fig. 6d). As these data are based only on DNA analyses, a distinction between active and dead cells is not possible.
The correlations between the total absolute abundances of archaeal microbial communities against the water properties at stations (Fig. 7) show statistically significant (p<0.05) positive linear correlations between T and the abundance of methanogens (r2=0.35, p=0.005) and methano-/methylotrophs (r2=0.43, p=0.001) (Fig. 7a and b). A statistically significant negative linear correlation was obtained against κ (r2=0.31, p=0.007) for methanogens and for methano-/methylotrophs (r2=0.24, p=0.02) (Fig. 7c and d). The pCH4 at stations is also positively correlated with and statistically significant (at p<0.05) for the abundance of methano-/methylotrophs (r2=0.22, p=0.04) but is not statistically significant when correlated with methanogens (Fig. 7e and f).

Figure 7Linear correlations between the total absolute abundances of archaeal microbial communities (a, c, e, and g, methanogens and b, d, f, and h, methanotrophs and methylotrophs) and the 1 min averages of water properties measured at the 21 sampling stations along the UP transect in the Kolyma River. Red numbers in some of the markers indicate the station number corresponding to the key sites S1 to S5.
The average TOC measured at 7 out of the 21 sampling stations was 7.5 ± 0.7 mg L−1 (Table S1). Since organic matter in suspension can be an important carbon source for methanogens, we correlated TOC vs. pCH4. A negative but not significant correlation at p<0.1 was found between pCH4 and TOC.
3.4 Surface CH4 emissions at transects and polygonal surface area at the Kolyma River section
The average gas transfer velocities during the sampling period that were calculated with a hydraulic model (kR12=0.5 ± 0.02 m d−1) and a wind speed parameterization (kW14=0.4 ± 0.3 m d−1) are in close agreement. Because the magnitude of the flux density of CH4 calculated in both transects with these two k values does not differ considerably (i.e., FR12=0.02 ± 0.007 and FW14=0.01 ± 0.01 ), we chose to present only FR12 calculated using kR12 after the hydraulic model. FR12 will be presented hereinafter as the flux density of CH4, FCH4.
The average FCH4 of CH4 along the UP transect was 0.019 ± 0.005 and along the DOWN transect was 0.026 ± 0.008 . Maximum FCH4 values at key sites were 0.034 for site S5 during the UP transect and 0.045 at the key site S2 during the DOWN transect (Fig. 3d). The average FCH4 in both transects was 1.5 times higher at key sites than in the other sites of the transects (Fig. 8). This is relevant considering that the surface area represented by the key sites is 8 to 12 times smaller than the rest of the transects (calculated considering the navigated distance times a 10 m swath around the travel transect).
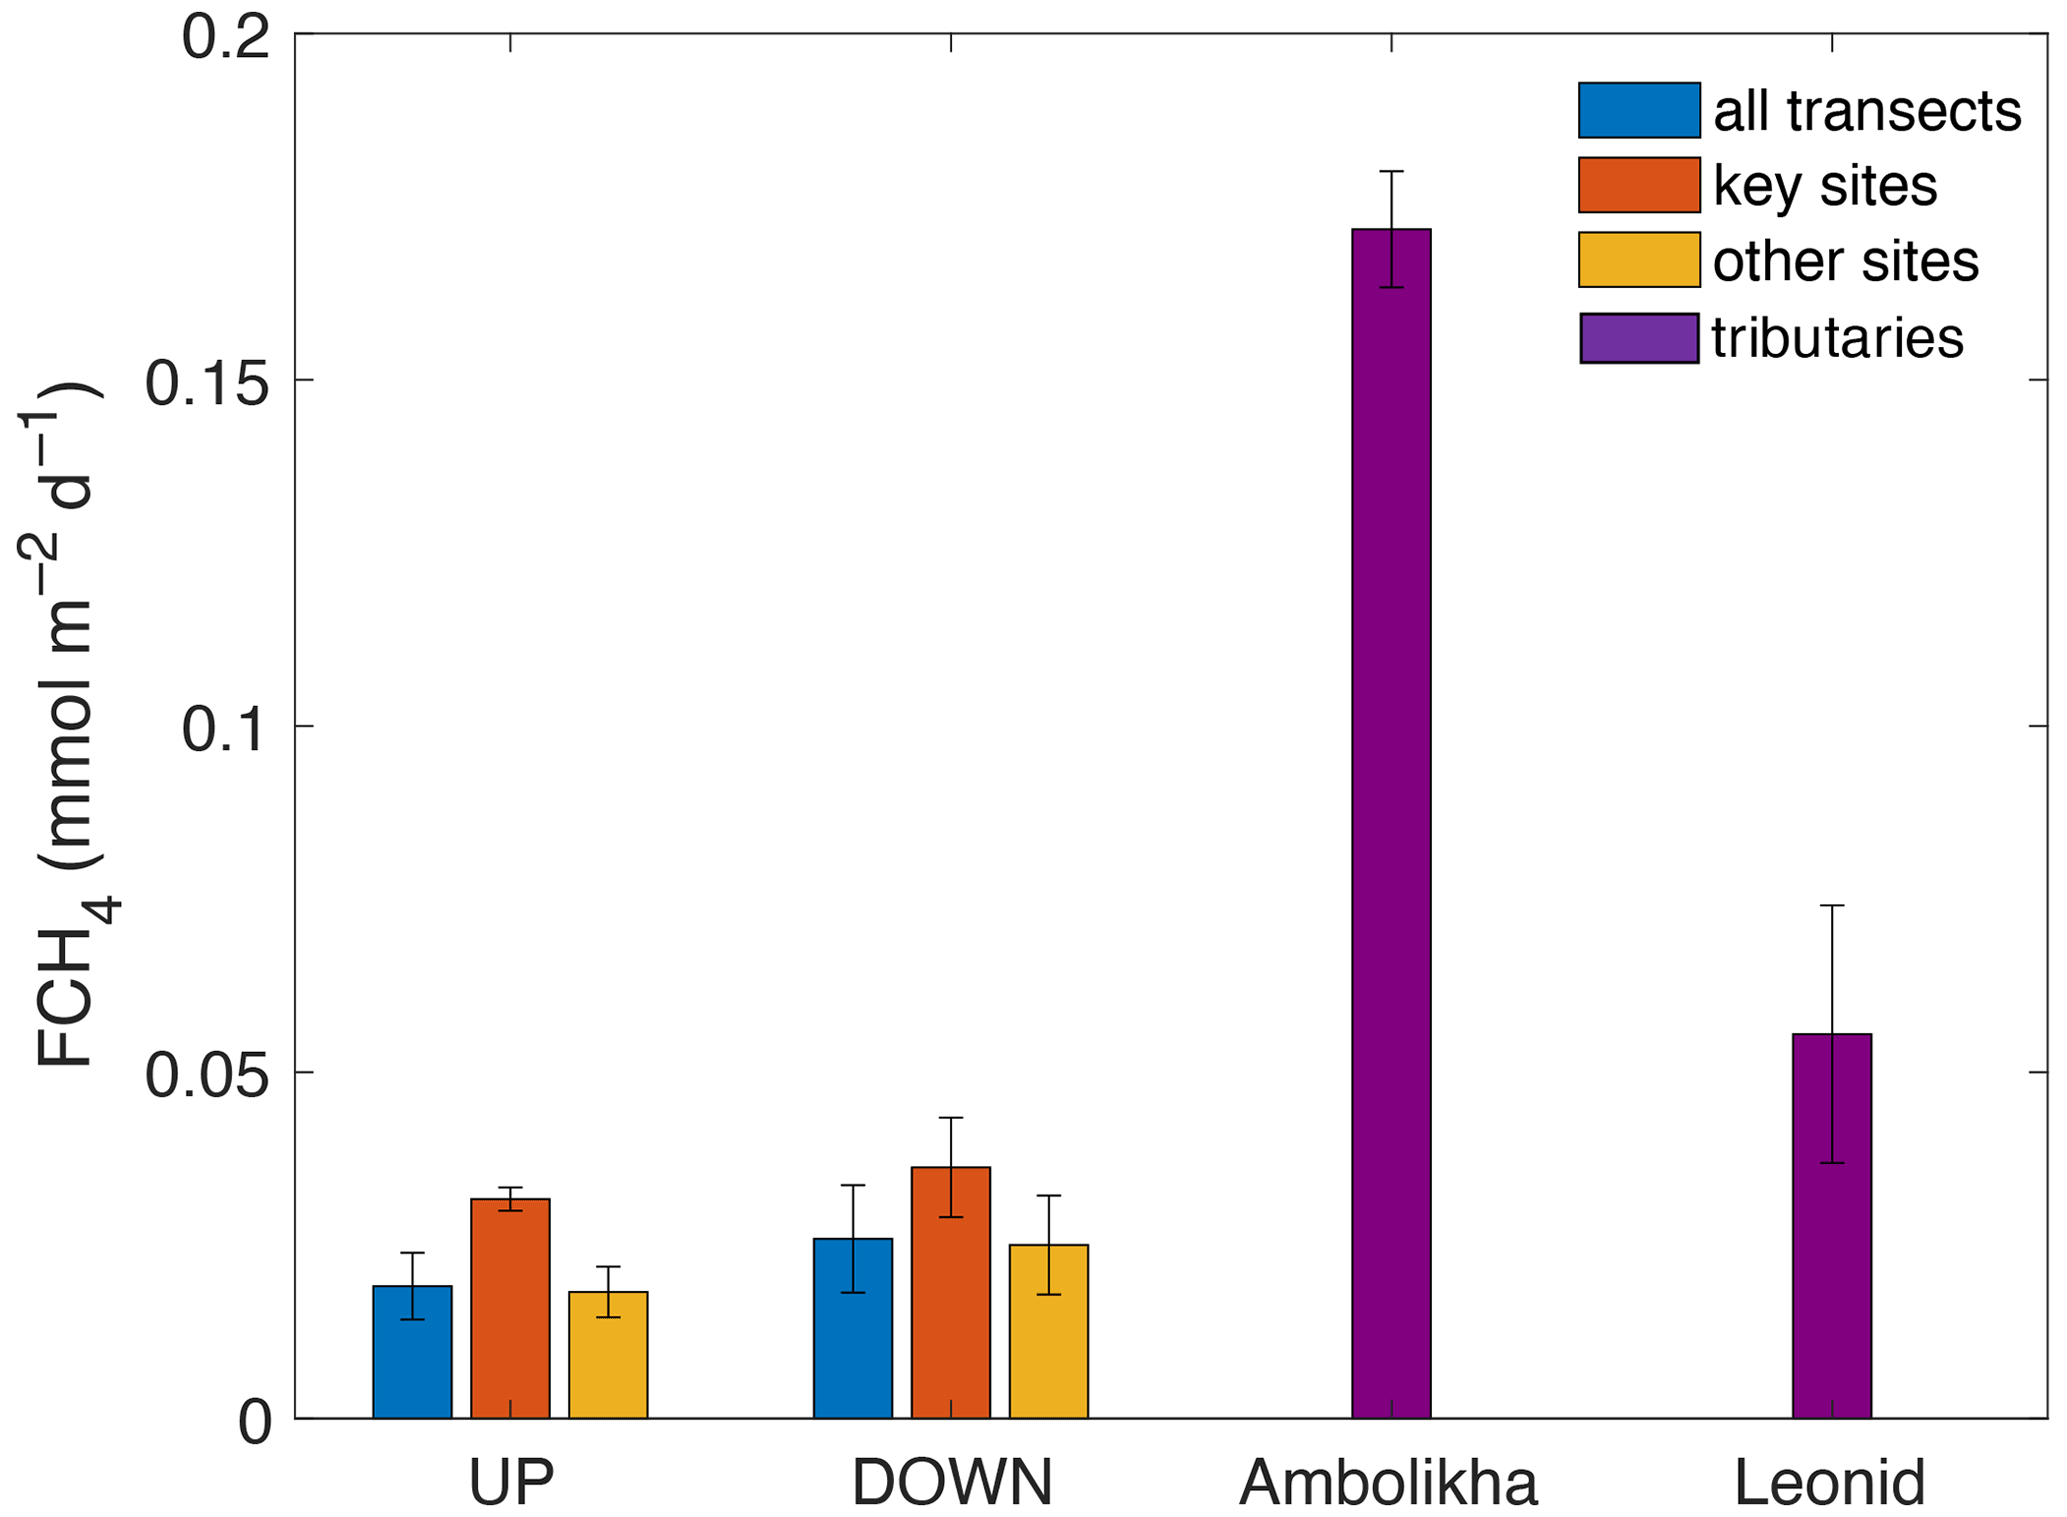
Figure 8Average flux densities of CH4 (FCH4) calculated for the entire UP and DOWN transects and for the key sites and other sites. FCH4 for the Ambolikha River and Leonid stream tributaries are also shown. Error bars denote the standard deviation of the mean.
The area integrated CH4 flux in the UP transect (1.27×10⁶ m2, considering its reach length of 127.7 km times an arbitrary 10 m swath) was 2.4×10⁴ mmol d−1. Taking into account only the area of key sites in the UP transect (1.06×10⁵ m2) and the emissions in these areas (0.032 ), the key sites in the UP transect contributed to 14 % (3392 mmol d−1) of the total area integrated emissions in the entire transect. In the DOWN transect, the integrated CH4 flux was 2.9×10⁴ mmol d−1 (area of 1.15×10⁶ m2, considering 115.4 km of reach length times 10 m). The key sites of the DOWN transect covered an area of 1.37×10⁵ m2, and the CH4 emissions in these areas were 0.036 , resulting in a contribution of 17 % (4932 mmol d−1) of the total area integrated emissions of the entire DOWN transect.
We also calculated FCH4 for a smaller stream (Leonid's stream) and the Ambolikha River (second-order tributary of the Kolyma River) (Fig. 1) that were navigated during the DOWN transect on 17 June 2019. These navigated sections were not included in our estimate for the main channel. The average FCH4 at the Ambolikha River (0.17 ± 0.008 ) and at Leonid's stream (0.05 ± 0.02 ) were nearly 5 and 2 times higher respectively than at the key sites of the main channel during the DOWN transect (Fig. 8).
Based on the modeled pCH4 in the gridded surface area of the Kolyma River section, we calculated the corresponding FCH4 that would have been emitted through the total surface of the river section (236.3 km2) and not only at the transect locations. The total CH4 flux at the surface of the river section during the UP transect is calculated as 4.5×10⁶ mmol d−1 (or 7.2×10⁴ g CH4 d−1) and for the DOWN transect is 6.1×10⁶ mmol d−1 (or 9.8×10⁴ g CH4 d−1), emitted through the surface of the Kolyma River section during the sampling time of both transects (15–17 June 2019).
4.1 Patterns and indicators of the spatial distribution of CH4 in the Kolyma River and associated tributaries and streams
In June 2019, the Kolyma River exhibited large pCH4 values that were up to 1300 % supersaturated (equivalent to 28.3 ± 8.5 µatm) with respect to atmospheric equilibrium. These values are comparable to measurements reported for summer in the main channel of the Lena River, i.e., 18 to 51 µatm, calculated from 30 to 85 nmol L−1 for T=14 ∘C in freshwater (Bussmann, 2013). However, a large range in pCH4 values has been measured in other Arctic rivers such that the average pCH4 in the Kolyma River is 3 times higher than measurements at the main channel of the Yukon River in North America (8.4 µatm) (Striegl et al., 2012) and almost 9 times lower than the mean pCH4 value (236 µatm) in surface waters of Kuparuk River in Alaska (Kling et al., 1992).
Our highly spatially resolved continuous underway measurements of surface dissolved CH4 were pivotal to reveal spatial variabilities and features in the main river channel that cannot be obtained with sparse discrete sampling. The surface distribution of pCH4 measured in a ∼120 km section of the Kolyma River was heterogeneous, with nearly 2-fold higher concentrations observed along riverbanks and near the confluence of tributaries (69 nmol L−1 or pCH4=41.1 µatm) than at the central parts of the river (46 nmol L−1 or pCH4=27.8 µatm) (Fig. 2 and Table 1). Previous studies have demonstrated the influence of land on the distribution of riverine CH4 concentrations, for example along the Danube River (A. Canning et al., 2021) and within the Lena River (Bussmann, 2013). The concentration of dissolved CH4 in Arctic sites with direct contact to adjacent lands, such as in small tributaries, streams, lake channels, or ponds, has been shown to be 2 to 5 times higher than what is observed in the main stems of large rivers (Bussmann, 2013; Dean et al., 2020; Kling et al., 1992; Striegl et al., 2012). In samples from creeks draining from permafrost into the Lena River, CH4 concentrations (1505 nmol L−1 or pCH4 of 900 µatm) were between 20 to 50 times higher than in fluvial waters (Bussmann, 2013). At the Lena Delta, the concentrations of CH4 are higher (212 nmol L−1 or pCH4 of 114.7 µatm, T=9.8 ∘C and S=2.45) because they were directly influenced by bottom soils (Bussmann et al., 2017). In tributaries of the Yukon River, the CH4 concentrations were up to 690 nmol L−1, being 2 times higher than in the main stem of the same river (290 nmol L−1) (Striegl et al., 2012). Similarly, our results show that, besides the in-stream variability, tributary or stream CH4 concentrations measured at the Ambolikha River and Leonid's stream were between 2 to 6 times higher than those in the main channel of the Kolyma River.
The average pCH4 measured at the Ambolikha River (206.8 ± 9.8 µatm) is consistent with the measurements at the Kuparuk River (236 µatm) (Striegl et al., 2012) and the mean pCH4 (292 ± 109 µatm) measured during a 38 d time-series study that started 9 d after the present study (i.e., on 26 June 2019) at a site in the Ambolikha River (Castro-Morales et al., 2022a), whereas the average CH4 concentration measured at Leonid's stream was 67 µatm (111 nM), which is on the same order of magnitude as the maximum value measured at the plume of the Kolyma River at the East Siberian Arctic Shelf in the summer of 2004 (55 µatm, obtained from the reported 110 nM, T=5 ∘C and S=14) (Shakhova and Semiletov, 2007).
We characterized the spatial distribution of riverine pCH4 as a function of temperature (T), specific conductivity (κ), and the distance from the river banks (z) as suitable predictors for the distribution of CH4 during the late spring over larger areas of the Kolyma River (and potentially applicable to other Arctic rivers). We found that the distance to river banks is an indicator of the proximity to potential terrestrial CH4 sources, and hence it can be a useful benchmark for understanding the distribution and fate of CH4 in natural surface waters (Fig. 4). With a statistical approach, we used the selected predictors to fill gaps in areas of the river where no CH4 data were available (Fig. S6). Similar approaches could be used to improve the CH4 data currently available for the global CH4 budget (Saunois et al., 2020) and to aid in forecasting riverine CH4 following the projected increases in warmer river waters, abrupt permafrost thawing, and collapse of riverbanks.
4.2 Identification of microbial communities associated with the riverine CH4 concentrations
Overall patterns in microbial community composition, e.g., the similarities in the relative abundances of bacterial and archaeal groups, were also strongly related to the temperature and specific conductivity of the river water (Fig. 5). Unlike with CH4, distance to shore was not apparent in explaining differences in community composition. Arctic riverine microbial communities track closely with water temperature, flow rate, and biogeochemistry (Campeau and del Giorgio, 2014; Crump et al., 2009) and match patterns in dissolved organic matter (DOM) composition and concentration (Castro-Morales et al., 2022; Kaiser et al., 2017). The strong explanatory power of temperature and specific conductivity we observe in this study fits with the concept of riverine community coalescence, as they approximate the mixing of distinct water sources over a spatially small region, whereby the dynamic community assemblage mechanisms are inextricably linked to transport processes and rapidly changing selective pressures (Mansour et al., 2018). In this sense, spatial patterns in community composition can act as robust bioindicators of the relative inputs of transported metabolic end products derived from terrestrial sources, like CH4 or CO2. To support the relationship between community composition and the originating source of CH4, we examined the distributions of functional microbial groups putatively associated with CH4 production and consumption. The strongest evidence was the overlap in detected methanotrophs and methanogens within our study and a previous study by Kwon et al. (2017) that examined these groups within permafrost soils adjacent to our site (PP09). More specifically, we refer to the highest relative abundances of groups associated with Methanobacterium and Methylobacter in both the surficial soils and our discrete water samples.
Expanding on this, biological CH4 production has traditionally been assumed to occur only in anoxic environments, and methanogens, as strict anaerobes, are unsuited to grow within oxic river waters. Our data show that river water was oxic at all stations with an average O2 saturation of 110 %, which should preclude methanogenesis. However, there is increasing evidence that there is CH4 production in oxic marine and freshwaters, as well as a link between oxic in situ production of CH4 and algal dynamics (i.e., photosynthesis and respiration rates) (Bogard et al., 2014). Oversaturation of CH4 in oxic surface waters of lakes can also result from CH4 release from littoral sediments in combination with horizontal transport to the open water. The relative importance of both processes is under debate (Bogard et al., 2014; Encinas Fernández et al., 2016; Grossart et al., 2011; Peeters and Hofmann, 2021). The second process also explains better the higher CH4 concentrations observed in shallow zones compared to deep waters of lakes (Peeters and Hofmann, 2021). For the Kolyma River, we propose that the oversaturated CH4 concentrations located close to the river bank and at confluences with tributaries, as well as the presence of methanogens, are mainly caused by the lateral release of CH4-rich pore water and soil-borne methanogens. This process might be dominant during permafrost melting and resuspension events rather than in situ net production of CH4 in oxic surface waters by active methanogens. The relative and pseudo-absolute abundances of sequences affiliated with methanogens further act as more specific indicators of sources originating from anoxic, terrestrial CH4 hotspots (Fig. 7). Additionally, we anticipate that the methanogenic archaea exhibit longer residence times than CH4 itself due to its high diffusion and oxidation rates. The presence of soil-derived methanogens in the river water might be indicative of even higher riverine CH4 concentrations, as part of it can be already outgassed or oxidized. The weaker correlation of CH4 to methanogen abundance compared to temperature or specific conductivity (parameters expected to change slower than CH4 concentrations) likely reflects these differences in transport mechanisms. Of the two methanogens we detected, Methanobacterium was recently shown to be the primary methanogen detected in the surface waters of thermokarst ponds and is more typical of acidic and peat-dominated aquatic ecosystems (Vigneron et al., 2019). Methanoregula (within order Methanomicrobiales) have also been shown to be abundant groups within permafrost thaw lakes (Crevecoeur et al., 2016) and were suggested to be more typical of deeper and less acidic water bodies (Vigneron et al., 2019) (Fig. 6).
Conversely, we expected microbial groups that consume CH4 to also be indicative of CH4 sources in the river. Groups affiliated with methylotrophy (e.g., Methylophilaceae – Methylotenera) exhibited 10 times higher relative abundances than groups of strict methanotrophic organisms (Methylobacter) (Fig. 6), suggesting that in addition to CH4, other sources like methanol associated with the degradation of CO2 by methanotrophs (Xin et al., 2007) or by some groups of phytoplankton (Mincer and Aicher, 2016) were sources of carbon in this environment. In support of this finding, aerobic methanotrophs have been found at much higher relative abundances (>25 %) and higher diversity within thermokarst well-stratified subarctic Canadian ponds than the maximum of 0.3 % detected here, where distinct genera (Methylobacter and Methylomonas) within the order Methylococcales were the most abundant (Crevecoeur et al., 2015; Vigneron et al., 2019). This is a realistic finding, as the dynamic river flow enables the diffusive CH4 transport and emissions to the atmosphere compared to the emissions across smaller surface areas in highly stratified, less dynamic, and largely anoxic pond environments. The majority of the CH4 produced in thawing permafrost is first locally oxidized before it can be released to the atmosphere (Olid et al., 2021). Thus, the higher relative abundance of CH4-consuming bacteria compared to CH4-producing archaea in the Kolyma River suggests that a considerable fraction of CH4 is already oxidized within the recently thawed active layer.
4.3 Temporal variability in CH4 in the Kolyma River
Our continuous high-resolution measurements of pCH4 in the Kolyma River allowed us also to identify a large temporal variability in spite of the short timescale of our measurements. The differences in the pCH4 and FCH4 (flux density of CH4) between the UP and DOWN transects might be due to a rapid response to changes in CH4 that are driven by the interactions between the water flow of the river and the continuous contribution of external CH4 inputs resulting from melting rather than by an advective signal traveling down the main channel of the Kolyma River. Still, our measurements cannot represent any mid- to long-term CH4 variation in the river, and the differences between the transects might also be due to different spatial locations.
The Kolyma River basin is the only one in the Arctic completely underlain by continuous permafrost, which could result in even higher soil CH4 production and release into the river network during permafrost thaw compared to other Arctic rivers. During the Arctic melt season (May to June), the surface hydrologic connectivity between the land and rivers is enhanced. As the seasonal progression takes place, deeper water-saturated soil layers are thawed, and substances, microorganisms, and gases, like CH4, are mobilized through the lateral transfer from groundwater discharge into Arctic inland waters, particularly to the fluvial network (Connolly et al., 2020; Harms et al., 2020; Saunois et al., 2020). It has been demonstrated that the majority of the CH4 emitted to the atmosphere from subarctic ponds is sustained by the discharge of CH4 from groundwaters upon the active layer thaw (Olid et al., 2021).
4.4 CH4 emissions in the Kolyma River and comparison to other estimates
The average estimated annual flux in the polygon section at the Kolyma River during our sampling is 1.24×10⁷ g CH4, taking into account a polygon surface area of 236.3 km2 and a 146 d ice-free season (between 20 May and 12 October 2019 obtained from the river discharge curve; Fig. S1). This calculation is far from robust and largely uncertain, considering that our measurements only correspond to a short-term data set during the open water season and that large temporal and spatial variations in relation to, for example, changes in water sources, temperature regime, and lateral carbon inputs throughout the ice-free period are expected. This has been recently demonstrated at the Ambolikha River (tributary of the Kolyma River), where riverine CH4 concentrations decreased over time during the open water season due to persistent emissions to the atmosphere dominating over declining external gas inputs during the summer low flow (Castro-Morales et al., 2022a). Thus, the annual CH4 flux value provided here for the investigated the Kolyma River section provides an upper end of the potential magnitude and relevance of CH4 atmospheric emissions from an Arctic river.
Despite the large uncertainty, our estimated CH4 emissions are 4 orders of magnitude smaller than the annual flux of CH4 at the East Siberian Arctic Shelf estimated to be 0.11×10¹² g CH4 yr−1 (or 0.11 Tg CH4 yr−1 for a 90 d ice-free season) in summer of 2003 and 2004 for a surface area of 1.0×10⁶ km2 (which is orders of magnitude greater than the polygon section of the Kolyma River) (Shakhova and Semiletov, 2007). In Arctic shelves, the concentration of CH4 is strongly influenced by riverine inputs, particularly in bottom layers of shelf waters due to differential water density gradients (Shakhova and Semiletov, 2007). Decreasing flow velocities (i.e., discharge) allow the sedimentation of organic matter in the delta areas, stimulating microbial sedimentary processes that finally lead to the formation of CH4 and CO2. Dropping water levels during summer also facilitate CH4 emissions from riverine sediments to the atmosphere. This has been observed in the Lena River region, where contributions from bottom surface sediments are more significant to the measured CH4 concentrations than riverine lateral exports (Bussmann et al., 2017).
The oxidation rates and the diffusive emissions of CH4 through the water–atmosphere interface are faster processes than the lateral gas transport in the water column. Thus, despite the large CH4 concentrations and emissions identified in the upstream river waters at our site, the surface riverine CH4 measured >100 km upstream of the shelf is locally emitted (or oxidized) and does not influence the surface CH4 concentrations measured at the river plume and at the East Siberian Arctic Shelf.
Morphology and stream size seem to be also key parameters for the amount of gas delivered from land and emitted through the water surface into the atmosphere, as the potential for large gas emissions is higher in smaller streams with shorter water travel distances. Our data support this assumption, as the FCH4 at key sites was 2 to 5 times lower than the average FCH4 at the smaller Leonid's stream and Ambolikha River respectively (Fig. 8). The surface areas of the key sites characterized by elevated FCH4 are between 8 to 12 times smaller than the surface area covered by the rest of the transect. However, the CH4 emissions at key sites were 1.5 times higher than in the other sites and represent between 14 % to 17 % of the total integrated emissions in both transects.
Because the diffusion of CH4 in water is slower than in air, riverbanks can thus act as efficient vectors for the local emissions of CH4 formed and stored in the subsoil. The projected increase in freshwater inputs, deepening of active layers, and increase in soil drainage, as more permafrost is thawing in response to warmer and wetter Arctic summers (AMAP, 2017; Bring et al., 2016; Bussmann et al., 2017; Chiasson-Poirier et al., 2020), will enhance the input of CH4 from external terrestrial sources at hotspots over extended periods during the open water season. Additionally, projected longer ice-free periods in the Arctic, i.e., earlier start of melt periods and longer open water seasons, can therefore lead to an increase in CH4 emissions from inland waters (Wik et al., 2016). This ultimately will have an impact on the current CH4 budget of the Arctic. By not considering the variable aquatic ecosystems and water cycle of the Arctic, the estimated 4 % to 5 % contribution of high latitudes to the total global CH4 emissions (Rosentreter et al., 2021; Saunois et al., 2020) may be underestimated.
The irregular location of CH4 hotspots along the river banks and their potentially continuous elevated CH4 contributions to the river pose a challenge to estimating lateral transport of CH4 from upstream to downstream waters. Elevated CH4 concentrations at the Arctic shelves are thus primarily influenced by local sources (i.e., bottom soils and degrading shelves) (Shakhova and Semiletov, 2007). However, to improve the estimates of riverine CH4 concentrations that can actually reach the ocean in the context of increasing warming and thawing, as well as to improve the knowledge of the contribution of Arctic rivers and streams to the regional and global CH4 budgets, it is necessary to intensify the spatial and temporal resolution of the direct measurements of CH4 in Arctic rivers.
In this study, we report the first continuous high-resolution pCH4 measurements done in a large section of the Kolyma River during the late freshet of 2019. We combined these observations with complementary water properties and microbial community analysis in water samples to investigate the potential source of this gas. The large spatial variability in surface CH4 concentrations in the river channel was associated with hotspots located at the river bank and at confluences with tributaries where CH4 was almost 2 times higher than at the center of the channel. The identified presence of CH4-producing archaea in well-oxygenated river water suggests that most of the CH4 is laterally transported from external terrestrial sources into the river channel rather than produced within the river water. Elevated riverine local CH4 emissions were associated with identified hotspot areas on land suggesting efficient linkages between the land and the aquatic ecosystems. Our analysis does not reveal the reach length of the CH4 measured from our site to downstream waters. We suggest that the CH4 measured in waters 100 km upstream of the Arctic Ocean might not reach shelf waters and instead is locally emitted to the atmosphere or oxidized in the river course. For this specific purpose, future works should include stable isotope studies to trace the sources and pathways of the CH4 in the river water. Without continuous measurements, it will remain unclear how much CH4 is actually transported and emitted at the peak of the melt period at the highest annual river discharge. As rivers and ocean shelves in the Arctic experience more abrupt collapses, erosion, and thawing, this may contribute to the liberation and transport of soil-derived CH4, resulting in the expansion of riverine hotspots with elevated CH4 concentrations and an increase in CH4 emissions into the atmosphere. Our results provide a glimpse of the potential contribution of CH4 emissions from Arctic rivers, adding up to the largely unknown contributions from permafrost and inland waters.
The hydrologic and gas data presented and used for the images contained in this paper are available in the Zenodo EU data repository under the following link: https://doi.org/10.5281/zenodo.7189243 (Castro-Morales et al., 2022b). All sequences of the microbial data have been deposited in GenBank with the reference BioProject no. PRJNA881395.
The supplement related to this article is available online at: https://doi.org/10.5194/bg-19-5059-2022-supplement.
KCM conceived and designed the study. KCM, AC, AK, KK, SA, OK, and NZ contributed to fieldwork and logistics. KCM, AC, MG, SA, and WAO contributed to lab work and sample and data analyses. KCM, AC, and WAO wrote the paper with contributions from all authors in draft versions prior to submission.
The contact author has declared that none of the authors has any competing interests.
Publisher's note: Copernicus Publications remains neutral with regard to jurisdictional claims in published maps and institutional affiliations.
Special thanks to the Northeast Science Station and the Pleistocene Park in Chersky for their invaluable assistance during fieldwork. Thanks to Robert Lehmann for the analysis of TOC samples at the FSU Jena. Many thanks to two anonymous referees for their helpful comments and critical reading throughout the revision of this work.
This work was conceived within the project PROPERAQUA funded by the Deutsche Forschungsgemeinschaft (DFG, grant no. 396657413). The contributions from Anna Canning and Arne Körtzinger were funded by the MOSES program of the Helmholtz Association and the C-CASCADES ITN of the EU (grant no. 643052). Kirsten Küsel and Will A. Overholt were supported by the Collaborative Research Centre 1076 AquaDiva funded by DFG (grant no. ID 218627073). Mathias Göckede and Olaf Kolle were supported by the European Commission (INTAROS project, H2020-BG-09-2016, grant no. 727890, Nunataryuk project, H2020-BG-11-2016/17, grant no. 773421).
This paper was edited by Alexey V. Eliseev and reviewed by two anonymous referees.
AMAP (Eds.): Snow, Water, Ice and Permafrost in the Arctic (SWIPA), Oslo, Norway, ISBN 978-82-7971-101-8, 2017.
Amorocho, J. and Devries, J. J.: A new evaluation of the wind stress coefficient over water surfaces, J. Geophys. Res., 85, 433–442, https://doi.org/10.1029/JC085iC01p00433, 1980.
Bogard, J. M., del Giorgio, P. A., Boutet, L., Garcia Chavez, M. C., Prairie, Y. T., Merante, A., and Derry, A. M.: Oxic water column methanogenesis as major component of aquatic CH4 fluxes, Nat. Commun., 5, 5250, https://doi.org/10.1038/ncomms6350, 2014.
Bring, A., Fedorova, I., Dibike, Y., Hinzman, L., Mård, J., Mernild, S. H., Prowse, T. D., Semenova, O., Stuefer, S. L., and Woo, M.-K.: Arctic terrestrial hydrology: a synthesis of processes, regional effects, and research challenges, J. Geophys. Res.-Biogeo., 121, 621–649, https://doi.org/10.1002/2015JG003131, 2016.
Bussmann, I.: Distribution of methane in the Lena Delta and Buor-Khaya Bay, Russia, Biogeosciences, 10, 4641–4652, https://doi.org/10.5194/bg-10-4641-2013, 2013.
Bussmann, I., Hackbusch, S., Schaal, P., and Wichels, A.: Methane distribution and oxidation around the Lena Delta in summer 2013, Biogeosciences, 14, 4985–5002, https://doi.org/10.5194/bg-14-4985-2017, 2017.
Campeau, A. and del Giorgio, P. A.: Patterns in CH4 and CO2 concentrations across boreal rivers: major drivers and implications for fluvial greenhouse emissions under climate change scenarios, Glob. Change Biol., 20, 1075–1088, https://doi.org/10.1111/gcb.12479, 2014.
Canning, A., Wehrli, B., and Körtzinger, A.: Methane in the Danube Delta: the importance of spatial patterns and diel cycles for atmospheric emission estimates, Biogeosciences, 18, 3961–3979, https://doi.org/10.5194/bg-18-3961-2021, 2021.
Canning, A. R., Fietzek, P., Rehder, G., and Körtzinger, A.: Technical note: Seamless gas measurements across the land–ocean aquatic continuum – corrections and evaluation of sensor data for CO2, CH4 and O2 from field deployments in contrasting environments, Biogeosciences, 18, 1351–1373, https://doi.org/10.5194/bg-18-1351-2021, 2021.
Castro-Morales, K., Canning, A., Körtzinger, A., Göckede, M., Küsel, K., Overholt, W. A., Wichard, T., Redlich, S., Arzberger, S., Kolle, O., and Zimov, N.: Effects of reversal of water flow in an Arctic stream on fluvial emissions of CO2 and CH4, J. Geophys. Res.-Biogeo., 127, e2021JG006485, https://doi.org/10.1029/2021JG006485, 2022a.
Castro-Morales, K., Canning, A., Arzberger, S., Overholt, W. A., Küsel, K., Kolle, O., Göckede, M., Zimov, N., and Körtzinger, A.: Data published in manuscript “Highest methane concentrations in an Arctic River linked to local terrestrial inputs”, Zenodo [data set], https://doi.org/10.5281/zenodo.7189243, 2022b.
Charkin, A. N., Rutgers van der Loeff, M., Shakhova, N. E., Gustafsson, Ö., Dudarev, O. V., Cherepnev, M. S., Salyuk, A. N., Koshurnikov, A. V., Spivak, E. A., Gunar, A. Y., Ruban, A. S., and Semiletov, I. P.: Discovery and characterization of submarine groundwater discharge in the Siberian Arctic seas: a case study in the Buor-Khaya Gulf, Laptev Sea, The Cryosphere, 11, 2305–2327, https://doi.org/10.5194/tc-11-2305-2017, 2017.
Chiasson-Poirier, G., Franssen, J., Lafrenière, M. J., Fortier, D., and Lamoureux, S. F.: Seasonal evolution of active layer thaw depth and hillslope-stream connectivity in a permafrost watershed, Water Resour. Res., 56, e2019WR025828, https://doi.org/10.1029/2019WR025828, 2020.
Connolly, C. T., Cardenas, M. B., Burkart, G. A., Spencer, R. G. M., and McClelland, J. W.: Groundwater as a major source of dissolved organic matter to Arctic coastal waters, Nat. Commun., 11, 1–8, https://doi.org/10.1038/s41467-020-15250-8, 2020.
Crevecoeur, S., Vincent, W. F., Comte, J., and Lovejoy, C.: Bacterial community structure across environmental gradients in perfmafrost thaw ponds: methanotroph-rich ecosystems, Front. Microbiol., 6, 192, https://doi.org/10.3389/fmicb.2015.00192, 2015.
Crevecoeur, S., Vincent, W. F., and Lovejoy, C.: Environmental selection of planktonic methanogens in permafrost thaw ponds, Sci. Rep.-UK, 6, 31312, https://doi.org/10.1038/srep31312, 2016.
Crump, B. C., Peterson, B. J., Raymond, P. A., Amon, R. M. W., Rinehart, A., McClelland, J. W., and Holmes, R. M.: Circumpolar synchrony in big river bacterioplankton, P. Natl. Acad. Sci. USA, 106, 21208–21212, https://doi.org/10.1073/pnas.0906149106, 2009.
Dabrowski, J. S., Charette, M. A., Mann, P. J., Ludwig, S. M., Natali, S. M., Holmes, R. M., Schade, J. D., Powell, M., and Henderson, P. B.: Using radon to quantify groundwater discharge and methane fluxes to a shallow, tundra lake on the Yukon Kuskokwim Delta, Alaska, Biogeochemistry, 148, 69–89, https://doi.org/10.1007/s10533-020-00647-w, 2020.
Dean, J. F., Middelburg, J. J., Röckmann, T., Aerts, R., Blauw, L. G., Egger, M., Jetten, M. S. M., de Jong, A. E. E., Meisel, O. H., Rasigraf, O., Slomp, C. P., in't Zandt, M. H., and Dolman, A. J.: Methane feedbacks to the global climate system in a warmer world, Rev. Geophys., 56, 1–44, https://doi.org/10.1002/2017RG000559, 2018.
Dean, J. F., Meisel, O. H., Martyn, R. M., Belelli, L. M., Garnett, M. H., Lenderink, H., van Logtestijn, R., Borges, A. V., Bouillon, S., Lambert, T., Röckmann, T., Maximov, T., Petrov, R., Karsanaev, S., Aerts, R., van Huissteden, J., Vonk, J. E., and Dolman, A. J.: East Siberian Arctic inland waters emit mostly contemporary carbon, Nat. Commun., 11, 1627, https://doi.org/10.1038/s41467-020-15511-6, 2020.
Dlugokencky, E. and Tans, P. P.: https://www.esrl.noaa.gov/gmd/ccgg/trends/ (last access: 15 January 2020), 2019.
Downing, B. D., Pellerin, B. A., Bergamaschi, B. A., Saraceno, J. F., and Kraus, T. E. C.: Seeing the light: the effects of particles, dissolved materials, and temperature on in situ measurements of DOM fluorescence in rivers and streams, Limnol. Oceanogr.-Meth., 10, 767–775, https://doi.org/10.4319/lom.2012.10.767, 2012.
Encinas Fernández, J., Peeters, F., and Hofmann, H.: On the methane paradox: transport from shallow water zones rather than in situ methanogenesis is the major source of CH4 in the open surace water of lakes, J. Geophys. Res.-Biogeo., 121, 2717–2726, https://doi.org/10.1002/2016JG003586, 2016.
Etminan, M., Myhre, G., Highwood, E. J., and Shine, K. P.: Radiative forcing of carbon dioxide, methane, and nitrous oxide: a significant revision of the methane radiative forcing, Geophys. Res. Lett., 43, 12614–12623, https://doi.org/10.1002/2016GL071930, 2016.
Grossart, H.-P., Frindte, K., Dziallas, C., Eckert, W., and Tang, K. W.: Microbial methane production in oxygenated water column of an oligotrophic lake, P. Natl. Acad. Sci. USA, 108, 19657–19661, https://doi.org/10.1073/pnas.1110716108, 2011.
Harms, T. K., Rocher-Ros, G., and Goodsey, S. E.: Emission of greenhouse gases from water tracks draining Arctic hillslopes, J. Geophys. Res.-Biogeo., 125, e2020JG005889, https://doi.org/10.1029/2020JG005889, 2020.
Holmes, R. M., McClelland, J. W., Peterson, B. J., Tank, S. E., Bulygina, E., Eglinton, T. I., Gordeev, V. V., Gurtovaya, T. Y., Raymond, P. A., Repeta, D. J., Staples, R., Striegl, R. G., Zhulidov, A. V., and Zimov, S.: Seasonal and annual fluxes of nutrients and organic matter from large rivers to the Arctic Ocean and surrounding seas, Estuaries and Coasts, 35, 369–382, https://doi.org/10.1007/s12237-011-9386-6, 2012.
IPCC: Climate Change 2014, Synthesis Report, Contribution of Working Groups I, II and III to the Fifth Assessment Report of the Intergovernmental Panel on Climate Change, Core Writing Team, edited by: Pachauri, R. K. and Meyer, L. A., Geneva, Switzerland, 2014.
Kaiser, K., Canedo-Oropeza, M., McMachon, R., and Amon, R. M. W.: Origins and transformations of dissolved organic matter in large Arctic rivers, Sci. Rep.-UK, 7, 1–11, https://doi.org/10.1038/s41598-017-12729-1, 2017.
Karlsson, J., Serikova, S., Vorobyev, S. N., Rocher-Ros, G., Denfeld, B. A., and Pokrovsky, O. S.: Carbon emission from Western Siberian inland waters, Nat. Commun., 12, 1–8, https://doi.org/10.1038/S41467-021-21054-1, 2021.
Kling, G. W., Kipphut, G. W., and Miller, M. C.: The flux of CO2 and CH4 from lakes and rivers in arctic Alaska, Hydrobiologia, 240, 23–26, https://doi.org/10.1007/BF00013449, 1992.
Kwon, M. J., Beulig, F., Ilie, I., Wildner, M., Küsel, K., Merbold, L., Mahecha, M. D., Zimov, N., Zimov, S., Heimann, M., Schuur, E. A., Kostka, J. E., Kolle, O., Hilke, I., and Göckede, M.: Plants, microorganisms, and soil temperatures contribute to a decrease in methane fluxes on a drained Arctic floodplain, Glob. Change Biol., 23, 2396–2412, https://doi.org/10.1111/gcb.13558, 2017.
Lammers, R. B., Shiklomanov, A. I., Vörösmarty, C. J., Fekete, B. M., and Peterson, B. J.: Assessment of contemporary Arctic river runoff based on observational discharge records, J. Geophys. Res., 106, 3321–3334, https://doi.org/10.1029/2000JD900444, 2001.
Mann, P. J., Davydova, A., Zimov, N., Spencer, R. G. M., Davydov, S., Bulygina, E., Zimov, S., and Holmes, R. M.: Controls on the composition and lability of dissolved organic matter in Siberia's Kolyma River basin, J. Geophys. Res., 117, G01028, https://doi.org/10.1029/2011JG001798, 2012.
Mann, P. J., Strauss, J., Palmtag, J., Dowdy, K., Ogneva, O., Fuchs, M., Bedington, M., Torres, R., Polimene, L., Overduin, P. P., Mollenhauer, G., Grosse, G., Rachold, V., Sobczak, W. V., Spencer, R. G. M., and Juhls, B.: Degrading permafrost river catchments and their impact on Arctic Ocean nearshore processes, Ambio, 51, 439–455, https://doi.org/10.1007/s13280-021-01666-z, 2022.
Mansour, I., Heppell, C. M., Ryo, M., and Rilling, M. C.: Application of the microbial community coalescence concept to riverine networks, Biol. Rev. Camb. Philos., 93, 1832–1845, https://doi.org/10.1111/brv.12422, 2018.
Mincer, T. J. and Aicher, A. C.: Methanol production by a broad phylogenetic array of marine phytoplankton, PLoS ONE, 11, e0150820, https://doi.org/10.1371/journal.pone.0150820, 2016.
Olefeldt, D., Turetsky, M. R., Crill, P. M., and McGuire, A. D.: Environmental and physical controls on northern terrestrial methane emissions across permafrost zones, Glob. Change Biol., 19, 589–603, https://doi.org/10.1111/gcb.12071, 2013.
Olid, C., Zannella, A., and Lau, D. C. P.: The role of methane transport from the active layer in sustaining methane emissions and food chains in subarctic ponds, J. Geophys. Res.-Biogeo., 126, e2020JG005810, https://doi.org/10.1029/2020JG005810, 2021.
Peeters, F. and Hofmann, H.: Oxic methanogenesis is only a minor source of lake-wide diffusive CH4 emissions from lakes, Nat. Commun., 12, 1206, https://doi.org/10.1038/s41467-021-21215-2, 2021.
Raymond, P. A., Zappa, C. J., Butman, D., Bott, T. L., Potter, J. D., Mulholland, P., Laursen, E., McDowell, W. H., and Newbold, D.: Scaling the gas transfer velocity and hydraulic geometry in streams and small rivers, Limnology and Oceanography: Fluids and Environments, 2, 41–53, https://doi.org/10.1215/21573689-1597669, 2012.
Rosentreter, J. A., Borges, A. V., Deemer, B. R., Holgerson, M. A., Liu, S., Song, C., Melack, J. M., Raymond, P. A., Duarte, C. M., Allen, G. H., Olefeldt, D., Poulter, B., Battin, T. I., and Eyre, D.: Half of global methane emissions come from highly variable aquatic ecosystem sources, Nat. Geosci., 14, 225–230, https://doi.org/10.1038/s41561-021-00715-2, 2021.
Saunois, M., Stavert, A. R., Poulter, B., Bousquet, P., Canadell, J. G., Jackson, R. B., Raymond, P. A., Dlugokencky, E. J., Houweling, S., Patra, P. K., Ciais, P., Arora, V. K., Bastviken, D., Bergamaschi, P., Blake, D. R., Brailsford, G., Bruhwiler, L., Carlson, K. M., Carrol, M., Castaldi, S., Chandra, N., Crevoisier, C., Crill, P. M., Covey, K., Curry, C. L., Etiope, G., Frankenberg, C., Gedney, N., Hegglin, M. I., Höglund-Isaksson, L., Hugelius, G., Ishizawa, M., Ito, A., Janssens-Maenhout, G., Jensen, K. M., Joos, F., Kleinen, T., Krummel, P. B., Langenfelds, R. L., Laruelle, G. G., Liu, L., Machida, T., Maksyutov, S., McDonald, K. C., McNorton, J., Miller, P. A., Melton, J. R., Morino, I., Müller, J., Murguia-Flores, F., Naik, V., Niwa, Y., Noce, S., O'Doherty, S., Parker, R. J., Peng, C., Peng, S., Peters, G. P., Prigent, C., Prinn, R., Ramonet, M., Regnier, P., Riley, W. J., Rosentreter, J. A., Segers, A., Simpson, I. J., Shi, H., Smith, S. J., Steele, L. P., Thornton, B. F., Tian, H., Tohjima, Y., Tubiello, F. N., Tsuruta, A., Viovy, N., Voulgarakis, A., Weber, T. S., van Weele, M., van der Werf, G. R., Weiss, R. F., Worthy, D., Wunch, D., Yin, Y., Yoshida, Y., Zhang, W., Zhang, Z., Zhao, Y., Zheng, B., Zhu, Q., Zhu, Q., and Zhuang, Q.: The Global Methane Budget 2000–2017, Earth Syst. Sci. Data, 12, 1561–1623, https://doi.org/10.5194/essd-12-1561-2020, 2020.
Schuur, E. A., McGuire, D., Schädel, C., Grosse, G., Harden, J. W., Hayes, D. J., Hugelius, G., Koven, C. D., Kuhry, P., Lawrence, D. M., Natali, S. M., Olefeldt, D., Romanovsky, V. E., Schaefer, K., Turetsky, M. R., Treat, C. C., and Vonk, J. E.: Climate change and the permafrost carbon feedback, Nature, 520, 171–179, https://doi.org/10.1038/nature14338, 2015.
Shakhova, N. and Semiletov, I. P.: Methane release and coastal environment in the East Siberian Arctic shelf, J. Marine Syst., 66, 227–243, https://doi.org/10.1016/j.jmarsys.2006.06.006, 2007.
Shakirov, R. B., Mau, S., Mishukova, G. I., Obzhirov, A. I., Shakirova, M. V., and Mishukova, O. V.: The features of methane fluxes in the western and eastern Arctic: a review. Part I, Geosystems of Transition Zones, 4, 004–025, https://doi.org/10.30730/2541-8912.2020.4.1.004-025, 2020.
Snyder, L., Potter, J. D., and McDowell, W. H.: An evaluation of nitrate, fDOM, and turbidity sensors in New Hampshire Streams, Water Resour. Res., 54, 2466–2479, https://doi.org/10.1002/2017WR020678, 2018.
Stanley, E. H., Casson, N. J., Christel, S. T., Crawford, J. T., Loken, L. C., and Oliver, S. K.: The ecology of methane in streams and rivers: patterns, controls, and global significance, Ecol. Monogr., 86, 146–171, https://doi.org/10.1890/15-1027, 2016.
Striegl, R. G., Dornblaser, M. M., McDonald, C. P., Rover, J. R., and Stets, E. G.: Carbon dioxide and methane emissions from the Yukon River System, Global Biogeochem. Cy., 26, GB0E05, https://doi.org/10.1029/2012GB004306, 2012.
Turetsky, M. R., Abbott, B. W., Jones, M. C., Walter Anthony, K., Olefeldt, D., Schuur, E. A., Grosse, G., Kuhry, P., Hugelius, G., Koven, C., Lawrence, D. M., Gibson, C., Sannel, A. B., and McGuire, D.: Carbon release through abrupt permafrost thaw, Nat. Geosci., 13, 138–143, https://doi.org/10.1038/s41561-019-0526-0, 2020.
Vigneron, A., Cruaud, P., Bhiry, N., Lovejoy, C., and Vincent, W. F.: Microbial community structure and methane cycling potential along a thermokarst pond-peatland continuum, Microorganisms, 7, 1–15, https://doi.org/10.3390/microorganisms7110486, 2019.
Vorobyev, S. N., Karlsson, J., Kolesnichenko, Y. Y., Korets, M. A., and Pokrovsky, O. S.: Fluvial carbon dioxide emission from the Lena River basin during the spring flood, Biogeosciences, 18, 4919–4936, https://doi.org/10.5194/bg-18-4919-2021, 2021.
Wanninkhof, R.: Relationship between gas exchange and wind speed over the ocean, J. Geophys. Res., 97, 7373–7381, https://doi.org/10.1029/92JC00188, 1992.
Wanninkhof, R.: Relationship between wind speed and gas exchange over the ocean revisited, Limnol. Oceanogr.-Meth., 12, 351–362, https://doi.org/10.4319/lom.2014.12.351, 2014.
Watras, C. J., Hanson, P. C., Stacy, T. L., Morrison, K. M., Mather, J., Hu, Y.-H., and Milewski, P.: A temperature compensation method for CDOM fluorescence sensors in freshwater, Limnol. Oceanogr.-Meth., 9, 296–301, https://doi.org/10.4319/lom.2011.9.296, 2011.
Weiss, R. F.: The solubility of nitrogen, oxygen and argon in water and sea water, Deep-Sea Res., 17, 721–735, https://doi.org/10.1016/0011-7471(70)90037-9, 1970.
Wiesenburg, D. A. and Guinasso, J. N. L.: Equilibrium solubilities of methane, carbon monixide, and hydrogen in water and sea water, J. Chem. Eng. Data, 24, 356–360, https://doi.org/10.1021/cr60306a003, 1979.
Wik, M., Varner, R. K., Walter Anthony, K., MacIntyre, S., and Bastviken, D.: Climate-sensitive northern lakes and ponds are critical components of methane release, Nat. Geosci., 9, 99–106, https://doi.org/10.1038/NGEO2578, 2016.
Xin, J., Zhang, Y., Zhang, S., Xia, C., and Li, S.: Methanol production from CO2 by resting cells of the methanotrophic bacterium Methylosinus trichosporium IMV 3011, J. Basic Microb., 47, 426–435, https://doi.org/10.1002/jobm.200710313, 2007.
Zolkos, S., Tank, S. E., Striegl, R., and Kokelj, S. V.: Thermokarst effects on carbon dioxide and methane fluxes in streams on the Peel Plateau (NWT, Canada), J. Geophys. Res.-Biogeo., 124, 1781–1798, https://doi.org/10.1029/2019JG005038, 2019.