the Creative Commons Attribution 4.0 License.
the Creative Commons Attribution 4.0 License.
 | 08 Dec 2022
Subsurface oxygen maximum in oligotrophic marine ecosystems: mapping the interaction between physical and biogeochemical processes
Valeria Di Biagio
Stefano Salon
Laura Feudale
Gianpiero Cossarini
The subsurface oxygen maximum (SOM) is observed in oligotrophic oceans and is associated with different physical and biological processes. This study characterizes the SOM in the Mediterranean Sea at the basin scale and investigates its driving mechanisms by analysing the output of the ∘ resolution biogeochemical reanalysis provided by the Copernicus Marine Service for the 1999–2019 time period. We validated the model-derived oxygen concentration in the epipelagic layer at different spatial and temporal scales, including novel process comparisons with estimates from in situ observations. Moreover, using Biogeochemical Argo (BGC-Argo) float observations, we estimated the model uncertainty in reproducing the SOM concentration and depth in summer (13 mmol O2 m−3 and 13 m, respectively). The western and eastern Mediterranean Sea depicts different SOM signatures in summer, with higher oxygen values and shallower depths in the western Mediterranean. The concentrations and depths (in the ranges of 230–250 mmol O2 m−3 and 30–100 m, respectively) are in agreement with the estimations from the literature and show mesoscale variability patterns. The western Mediterranean also shows a stronger biological activity, specifically oxygen production and consumption, along the whole epipelagic layer and higher oxygen concentrations at the surface throughout the year, but heavy undersaturated waters are associated with winter deep convection in the northwestern Mediterranean Sea. A 1-year analysis conducted on selected areas that are representative of the heterogeneity of summer SOM highlighted that the SOM can actually be sustained by biological production (as in northwestern Mediterranean areas), or it can be a residual of the confinement of spring production (as in the central Ionian area) and vertical motions influence its depth (as in the Levantine subduction area).
- Article
(6637 KB) - Full-text XML
-
Supplement
(1443 KB) - BibTeX
- EndNote


Oxygen is an essential element for life on Earth, and its production by phytoplankton photosynthesis is a main contributor to the global oxygen budget (Field et al., 1998; Behrenfeld et al., 2001; Bollmann et al., 2010). Parallel to the reduction in marine productivity, which has already been observed in several regions during recent decades (Capuzzo et al., 2018; Roxy et al., 2016; Osman et al., 2019), a general loss of 2 % of the total oxygen content in the global ocean was estimated over the 1960–2008 period (Schmidtko et al., 2017), with a negative trend recently confirmed until 2018 (Stramma and Schmidtko, 2019) and an expansion of the oxygen minimum zones (OMZs; Rabalais et al., 2010; Stramma and Schmidtko, 2019). Model-derived scenarios (e.g. Bopp et al., 2013; Kwiatkowski et al., 2020) also project deoxygenation and a primary production decline in the global ocean for the coming decades as a consequence of climate change.
A significant contribution to global marine productivity comes from oligotrophic regions despite their low chlorophyll contents (<0.1 mg m−3; Antoine et al., 1996), by virtue of their extents, which are 40 %–50 % of the global ocean (Mignot et al., 2014; Polovina et al., 2008). In these areas, vertical chlorophyll and oxygen profiles typically display a subsurface maximum. The deep chlorophyll maximum (DCM) and subsurface oxygen maximum (SOM) are observed at depths of 50–200 m (Furuya, 1990; Mignot et al., 2014) and 40–125 m (Riser and Johnson, 2008; Yasunaka et al., 2022), respectively, either throughout the year or in specific seasons.
The classic view that attributes the high values of subsurface oxygen to a biological origin (e.g. Najjar and Keeling, 1997) is actually supported by several studies using both in situ measurements (e.g. Biogeochemical Argo (BGC-Argo), floats or profiling buoys), and numerical models, both in subtropical gyres (e.g. Fujiki et al., 2020; Richardson and Bendtsen, 2017; Riser and Johnson, 2008) and other areas (e.g. Mathew et al., 2021). In addition, there is evidence of a disentanglement between the accumulation of oxygen under the surface and biological production; e.g. Martz et al. (2008) observed an SOM at 40∘ S in the South Pacific Ocean, which was formed because of the loss of oxygen by heating and solubility-related processes in the above mixed layer and respiration at depths below the SOM. Chen and McKinley (2019) found that a downward isopycnal displacement of oxygen produced during the spring bloom was responsible for oxygen accumulation in May–October in the 50–100 m layer of the oligotrophic subtropical gyre of the North Atlantic. Finally, Smyth et al. (2017) observed an SOM 13–87 m above the DCM in permanently stratified tropical and subtropical areas of the Atlantic Ocean and interpreted this mismatch as a signal of productivity enhanced by high light levels rather than by high values of chlorophyll, with the DCM indicating a community of high chlorophyll : carbon ratio phytoplankton adapted to low light conditions.
In this paper, we investigated the SOM as a key variable for describing the interconnections between physics and biology in the ocean. In fact, this variable is an emergent property of the marine ecosystem (sensu Hipsey et al., 2020) and constitutes the final product of a series of chemical, physical, and biological processes: air–sea interactions, horizontal and vertical transport and mixing and stratification of water masses, and production and consumption by marine organisms. In comparison to apparent oxygen utilization (AOU), which is an estimate of oxygen consumption that is typically used at intermediate and high depths to evaluate water ages (e.g. Karstensen et al., 2008) or decadal variations in ocean ventilation (e.g. Mavropoulou et al., 2020), the SOM variable represents shorter (e.g. seasonal) temporal scales in subsurface layers, i.e. of different dynamics within the water column.
Moreover, since estimates of marine oxygen variability have been extensively derived in recent decades from both in situ measurements (cruises, fixed stations, BGC-Argo floats, and gliders; e.g. Bailey et al., 2019; Claustre et al., 2020; Key et al., 2015; Tanhua et al., 2013, and Testor et al., 2019) and numerical models (e.g. Peña et al., 2010), we propose that the SOM, as the OMZ and AOU are for other aspects, could be a suitable and robust feature in oligotrophic seas to evaluate and monitor the ecosystem state and productivity from both a present variability and future scenario point of view.
In particular, in this work, we mapped the SOM concentration and depth for the first time in the Mediterranean Sea and evaluated the impact of biological and physical processes on its onset and development.
The Mediterranean Sea is an oligotrophic area (Siokou-Frangou et al., 2010) and is considered a “laboratory ocean” for studying marine ecosystems (Malanotte-Rizzoli and Eremeev, 1999), and it has proven to be particularly sensitive to climate change (Giorgi, 2006; Planton et al., 2012). Previous studies focused on recent decades have shown that oxygen variability in the basin is mainly due to multi-decadal shifts rather than to a general trend (Mavropoulou et al., 2020; Schneider et al., 2014). However, slightly weaker ventilation after 2016 was observed in the western basin (Li and Tanhua, 2020), as well as a net decrease in oxygen in the 1200–2000 m layer of the southeastern Mediterranean (Sisma-Ventura et al., 2021), and a negative oxygen trend at the surface was estimated from a biogeochemical reanalysis (Cossarini et al., 2021) covering the last 2 decades. Mediterranean Sea deoxygenation has also been confirmed by climate projections both at the surface and in subsurface layers (Powley et al., 2016; Reale et al., 2022), where the change in solubility related to ocean warming conditions has been estimated as the main driver of the process.
While several studies have focused on the long-term oxygen variability, the oxygen dynamics at the mesoscale, such as the SOM and its relationship with other emerging features, have been poorly investigated. Indeed, few studies have reported the presence of an SOM in the summer season, concurrently with the DCM (Barbieux et al., 2019; Lavigne et al., 2015; Siokou-Frangou et al., 2010), which is located at slightly higher depths (Balbín et al., 2014; Cossarini et al., 2021; Salon et al., 2019). The importance of physical processes for SOM formation has been stressed in some areas (Kress and Herut, 2001). Sparse in situ measurements suggest a depth for the SOM that is approximately equal to 50 m in most of the basin (Manca et al., 2004; Ulses et al., 2021), while local differences are present (e.g. 20–40 m at the DYFAMED site; Copin-Montégut and Bégovic, 2002; 80 m in the southern Levantine Sea; Kress and Herut, 2001).
The use of a coupled hydrodynamic–biogeochemical model is necessary to characterize the SOM across the basin and to evaluate its driving physical and biological processes down to a local scale. In particular, we used the state-of-the-art biogeochemical reanalysis of the Mediterranean Sea at a horizontal resolution of ∘ (Cossarini et al., 2021), which was released as a Copernicus Marine Service (CMEMS) product (Teruzzi et al., 2021a). This reanalysis, which was quantitatively assessed with three different validation levels (sensu Hipsey et al., 2020), has shown good performance in simulating the biogeochemical state of and variability in the Mediterranean Sea down to the mesoscale (estimated at an average of 45 km in the Mediterranean Sea; Amores et al., 2019; Bonaduce et al., 2021), especially in the epipelagic layer (i.e. 0–200 m) that hosts the DCM and SOM, whose characteristics were in good agreement with BGC-Argo float observations (Cossarini et al., 2021). Therefore, we considered this reanalysis to be a suitable tool to investigate the physical and biological processes on the basis of these emergent properties. In this regard, we also present here, for the first time, a validation of biological processes related to oxygen production and consumption, gross primary production (GPP), community respiration (CR), and net community production (NCP) and discuss the model uncertainties and the limits of the comparison process with in situ measurements.
The paper is organized as follows: Sect. 2 describes the setup of the model implemented to perform the biogeochemical reanalysis, with a focus on the oxygen simulation and the data used for the validation of oxygen profiles, concentration and depth of the SOM, and production and respiration processes. Section 3 collects the results based on the validation procedure (Sect. 3.1) and investigated oxygen dynamics (Sect. 3.2). In particular, we first illustrate the main differences in mean oxygen profiles and biological processes (Sect. 3.2.1) between the western and eastern Mediterranean Sea. Then, we focus on the summer SOM features across the basin (Sect. 3.2.2) and on the biological and physical contributions to its onset and development (Sect. 3.2.3). The discussion and conclusions finally follow in Sects. 4 and 5, respectively.
2.1 Reanalysis model system
Oxygen dynamics in the Mediterranean Sea were investigated from the output of the Mediterranean Sea biogeochemical reanalysis covering the period of 1999–2019 at ∘ of horizontal resolution (approximately equal to 4 km), which was released as a CMEMS product (https://marine.copernicus.eu/, last access: 28 October 2022). While the full setup and validation of the Mediterranean Sea biogeochemical reanalysis have been illustrated in detail by Cossarini et al. (2021), the present article briefly introduces the main features of the model system and focuses on oxygen-related aspects.
The Mediterranean biogeochemical reanalysis was produced by means of the Mediterranean Sea Biogeochemical Flux Model system (MedBFM) (Fig. 1), which includes the OGS transport model (OGSTM) (Lazzari et al., 2012, 2016) coupled with the BFM biogeochemical flux model (Vichi et al., 2020) and the 3DVar-Bio variational data assimilation module for surface chlorophyll (Teruzzi et al., 2014, 2018). The ocean dynamic forcing of MedBFM is the CMEMS Mediterranean physical reanalysis driven by the ECMWF–ERA5 atmospheric fields (Escudier et al., 2021), which provides the following daily fields: 3D currents, temperatures, salinities, diffusivities, and 2D wind stress and solar radiation values. The CMEMS ocean colour chlorophyll product (Colella et al., 2021) is assimilated weekly.
Initial conditions for the oxygen concentrations were taken from the EMODnet_int dataset (Cossarini et al., 2021), which consists of the integration of the aggregated EMODnet data collections (Buga et al., 2018) and the datasets listed in Cossarini et al. (2015) and Lazzari et al. (2016). In particular, we initialized the Mediterranean areas corresponding to 16 subbasins (Fig. 2) with vertical climatological profiles obtained by averaging available data selected in the 1997–2007 period.
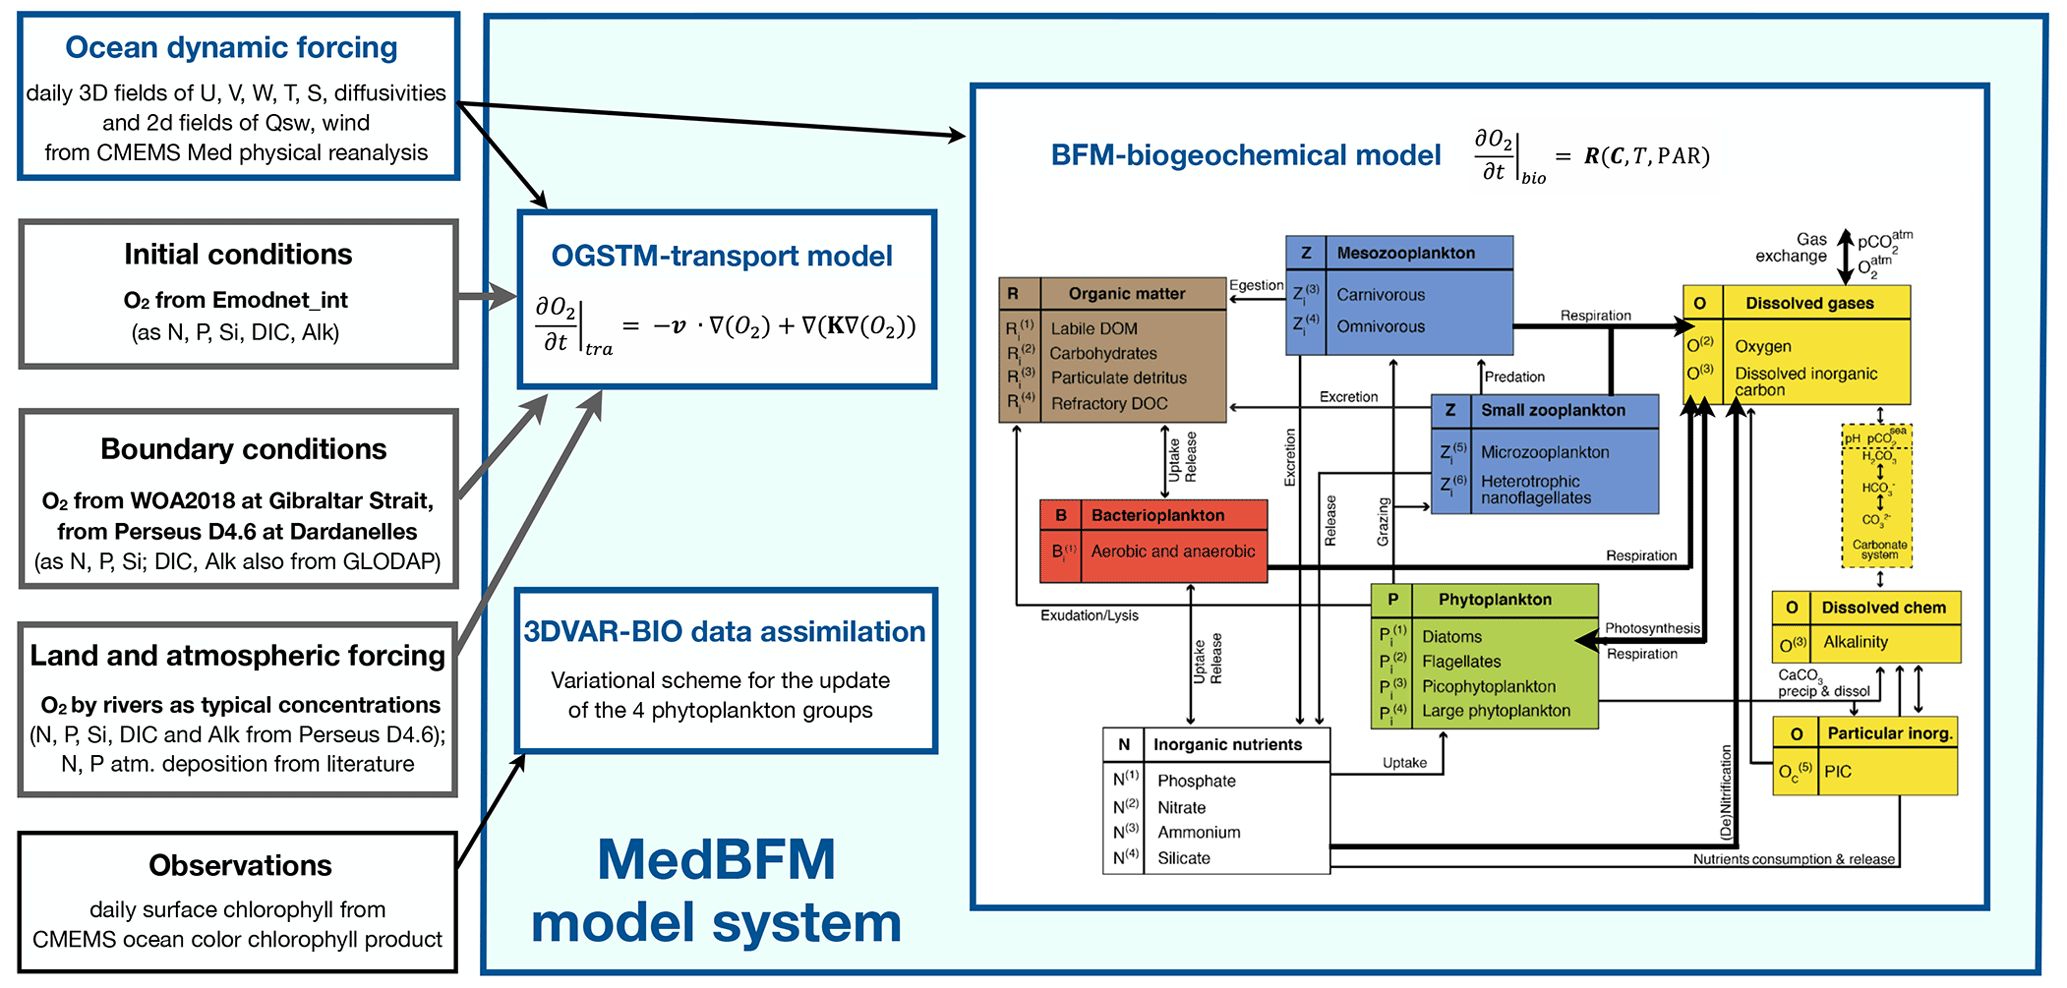
Figure 1MedBFM model system used to simulate oxygen dynamics depicted with its interfaces with other CMEMS system components where sources/references for modelled oxygen are highlighted in bold. Oxygen as a tracer variable is advected and diffused (OGSTM transport model), and its concentration varies with other biogeochemical and environmental variables (BFM biogeochemical model). The main biogeochemical processes that change the oxygen concentration (i.e. photosynthesis, respiration, (de-)nitrification, and air–sea fluxes) within BFM components are highlighted by thick arrows. In the figure, i = C, N, P, Si, and Chl is for phytoplankton and i = C, N, and P for bacteria, zooplankton, and organic matter (but i = C, N, P, and Si is for R(4)). References are given in the text, and further details can be found in Cossarini et al. (2021).
The open boundary conditions for oxygen in the Atlantic Ocean at the longitude of 9∘ W were provided as a climatological profile computed by averaging data from the World Ocean Atlas 2018 (hereafter WOA2018; Garcia et al., 2018; data from https://www.nodc.noaa.gov/OC5/woa18, last access: 28 October 2022) for the following area: lat = 34–37∘ N and long = 8–9∘ W. The oxygen units were converted to millimoles O2 per cubic metre (mmol O2 m−3) by using the seawater density profile computed from temperature and salinity data provided by WOA2018. A nudging scheme was employed in the 7–9∘ W area, and the same profiles were used to avoid numerical instability. Terrestrial inputs of oxygen were supplied by 39 rivers (whose positions are indicated in Fig. 2), where the typical concentration in freshwater was equal to the saturation value at 15 ∘C and 5 PSU.
The dissolved oxygen (also simply referred to as oxygen) concentration is a state variable in the BFM (), and it varies in the model by means of physical and biogeochemical processes, with physical processes including both transport processes and air–sea exchanges (Eq. 1). Transport (first term of the right hand side of Eq. 1) comprises advection and diffusion processes, with v velocities and K diffusivities; air–sea exchanges (second term of Eq. 1) are expressed as the ratio between the surface flux of oxygen and the thickness of the first vertical (near-surface) level hsurf provided by the model grid; biogeochemical reactions (third term of Eq. 1) involve plankton groups (phyto-, zoo-, and bacterioplankton) and some dissolved inorganic components (collected within the set of biogeochemical variable concentrations C), as well as some environmental variables (i.e. the seawater temperature T as a regulating factor and the photosynthetically active radiation PAR):
In particular, the flux of oxygen at the air–sea interface (in the second addend of Eq. (1) is modelled as follows:
where is the oxygen at the surface, is the oxygen at the saturation level, as computed by following Garcia and Gordon (1992), and Kw is the gas transfer velocity (Wanninkhof, 2014).
Biogeochemical processes with varying oxygen concentrations (third addend of Eq. 1) are the gross primary production (GPP) by the four subgroups of phytoplankton P(j) (with j = 1, 2, 3, 4) and three different consumption processes: respiration (rsp) by four phyto-, four zoo-, and one bacterioplankton subgroups (P(j), Z(j), B, respectively), nitrification (nit), and reoxidation (reox), according to the following formula:
in which
-
, , and are constant stoichiometric coefficients used to convert all the rates into oxygen units (e.g. primary production and respiration are computed in terms of the carbon content, as indicated by the “c” subscript of P(j), Z(j), B);
-
is an oxygen regulating factor for the switch between aerobic and anaerobic conditions for bacterioplankton (specified in Eq. S1 in the Supplement);
-
the nitrification rate is parameterized and dependent on ammonium (A) and oxygen concentrations (according to Eqs. S2–S3);
-
the reoxidation process concerns all the reduced chemical species produced as a result of bacterial anoxic respiration, which in the BFM are contained in a unique state variable (i.e. reduction equivalents Req, which are assumed to be chemically equivalent to the HS− sulfide ion) and re-oxidized in the presence of oxygen (according to Eq. S4).
Table S1 in the Supplement summarizes the numerical values of the parameters named in the text.
In terms of community production and respiration, Eq. (3) can be rewritten as
in which
-
NCP is the net community production,
-
GPP is the gross primary production by phytoplankton only,
-
CR is the community respiration, accounting for respiration (rsp) by phyto-, zoo-, and bacterioplankton, plus nitrification (nit) and reoxygenation (reoxy) processes,
and the three quantities are converted from carbon to oxygen units.
2.2 Data for validation procedure
A general validation of the Mediterranean reanalysis presented in Sect. 2.1 has already been conducted by Escudier et al. (2021) for the physical component and by Cossarini et al. (2021) for the biogeochemical component. In Sect. 3.1 of this work, we report the validation of both the oxygen concentration and processes related to oxygen variation in the Mediterranean Sea; this validation was carried out by comparing model outputs with available datasets, literature, and repository data.
In particular, oxygen concentrations provided by the MedBFM reanalysis were validated by using observations taken from the EMODnet_int dataset (i.e. the aggregation of EMODnet data collections from Buga et al., 2018, and the datasets in Lazzari et al., 2016, and Cossarini et al., 2015) in the 1999–2016 period and temporal evolutions of BGC-Argo float profiles retrieved from the Coriolis/Ifremer data centre (Thierry et al., 2018). GPP, CR, and NCP derived from the reanalysis outputs were instead compared with observations from the literature and data repositories (Gazeau et al., 2021; González et al., 2008; Lagaria et al., 2011; Lemee et al., 2012; Regaudie-De-Gioux et al., 2009). Table S2 summarizes the number of profiles of observations used in the validation procedure and the time periods covered by the datasets. The locations of the planktonic metabolism observations are indicated in Fig. 2.
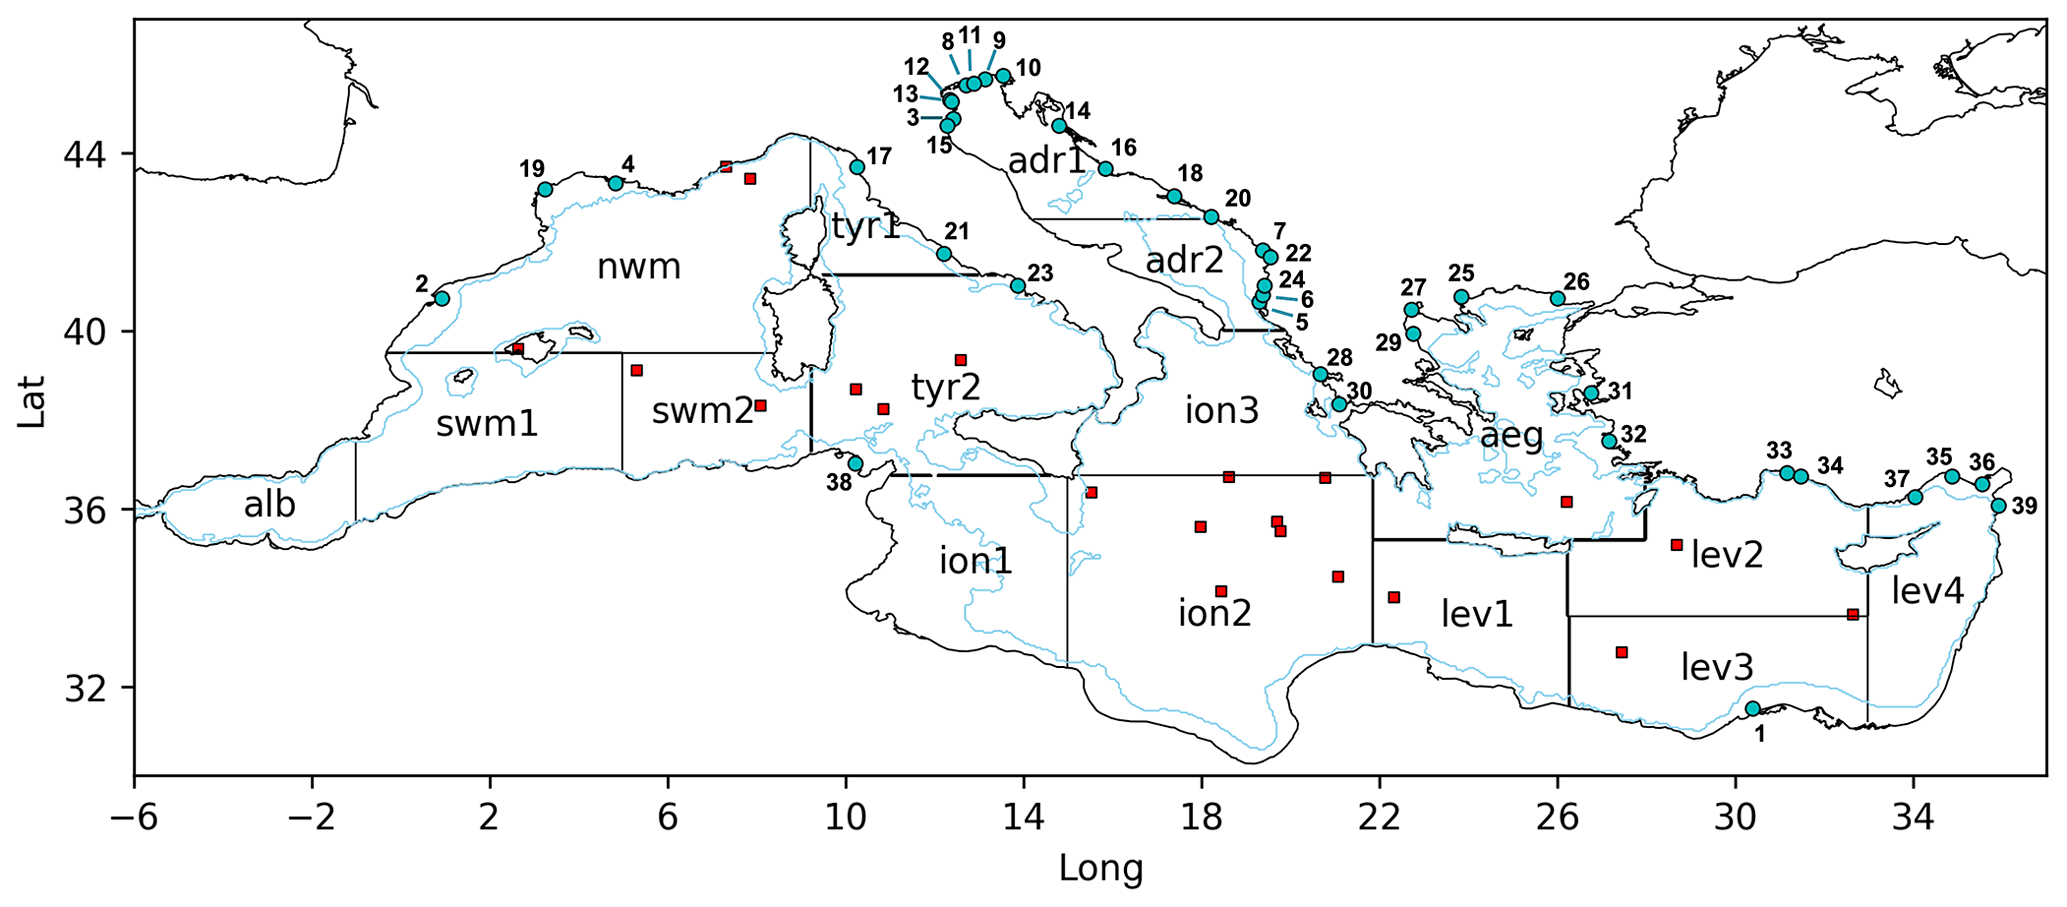
Figure 2Mediterranean Sea domain, with the bathymetric contour at 200 m (light-blue line) and cyan dots with numbers corresponding to the main river mouth positions: Nile (1), Ebro (2), Po (3), Rhone (4), Vjosë (5), Seman (6), Buna/Bojana (7), Piave (8), Tagliamento (9), Soca/Isonzo (10), Livenza (11), Brenta–Bacchiglione (12), Adige (13), Lika (14), Reno (15), Krka (16), Arno (17), Neretva (18), Aude (19), Trebisnjica (20), Tevere (Tiber) (21), Mat (22), Volturno (23), Shkumbin (24), Struma/Strymonas (25), Meric/Evros/Maritsa (26), Axios/Vadar (27), Arachthos (28), Pinios (29), Acheloos (30), Gediz (31), Buyuk Menderes (32), Kopru (33), Manavgat (34), Seyhan (35), Ceyhan (36), Goksu (37), Medjerda (38), and Asi/Orontes (39). Subbasins used in the validation procedure are indicated by black contours and acronyms. According to data availability and to ensure the consistency and robustness of the metrics, aggregated subbasins were also used: swm = swm1 + swm2; tyr = tyr1 + tyr2; adr = adr1 + adr2; ion = ion1 + ion2 + ion3; lev = lev1 + lev2 + lev3 + lev4. Red squares indicate the sampling locations of planktonic metabolism observations.
3.1 Validation procedure
With the three-level validation framework introduced by Hipsey et al. (2020), which has been applied to the MedBFM biogeochemical reanalysis in Cossarini et al. (2021), the validation of oxygen presented in this paper involved different spatial and temporal scales, depending on the availability of observations (Sect. 2.2). In particular, EMODnet_int supported a subbasin scale and a selected vertical discretization evaluation of the model performances for reproducing the mean annual values (i.e. “state validation” sensu Hipsey et al., 2020). On the other hand, BGC-Argo float data served for “match-ups” between observed and model profiles at the daily scale that aimed to (i) assess the temporal evolution of the processes along the vertical direction and (ii) characterize the subsurface oxygen maximum (SOM) as a key property emerging from the ecosystem dynamics at the mesoscale (“system validation” sensu Hipsey et al., 2020). In this case, the concentrations of modelled dissolved oxygen were extracted at the same locations and time as the BGC-Argo observations, the skill performance metrics were computed on the basis of observation–model misfits, and then the overall metrics were obtained by aggregating the partial results for each subbasin (Salon et al., 2019). Finally, the sparse spatial and temporal estimations of GPP, CR, and NCP data allowed a “process validation” (sensu Hipsey et al., 2020) only at the subbasin scale and for selected vertical layers on the climatological (annual or seasonal) scale.
While a general validation of the oxygen concentration in the deeper layers can be found in Cossarini et al. (2021), the present validation focuses on the epipelagic layer given its relevance for SOM characterization.
3.1.1 State and system validation
Modelled oxygen concentrations show decreasing west–east and north–south gradients at the surface, with values in agreement with EMODnet_int climatology (Fig. 3a and e). Towards the bottom of the epipelagic layer (Fig. 3d and h), we notice a higher bias, which is also present in the deeper layers (Cossarini et al., 2021).
In addition, considering a larger dataset for vertical properties (i.e. BGC-Argo float observations), Fig. 4 shows the root mean square difference (RMSD) computed in open-sea aggregated subbasins and vertical layers in the first 300 m of depth with respect to both the EMODnet_int and BGC-Argo data. The reanalysis reproduces the spatial and temporal evolution of the oxygen concentrations in the upper 30 m depth well in both subbasins, with errors lower than 15 mmol O2 m−3. Although oxygen concentrations are typically overestimated by the model at the bottom of the epipelagic layer (Fig. 3 and Cossarini et al., 2021), RMSD values with respect to EMODnet_int remain lower than 20 and 25 mmol O2 m−3 in the eastern subbasins and in the western subbasins, respectively. RMSD values with respect to the BGC-Argo floats are nearly 35 mmol O2 m−3 only in the northwestern Mediterranean Sea (nwm) and southwestern Mediterranean Sea (swm) in this layer. RMSD estimations in the Alboran Sea and Aegean Sea with respect to EMODnet_int (Cossarini et al., 2021) are in agreement with the recognized upper limits of 15 and 25 mmol O2 m−3 in the 0–30 and 150–300 m depth layers, respectively.
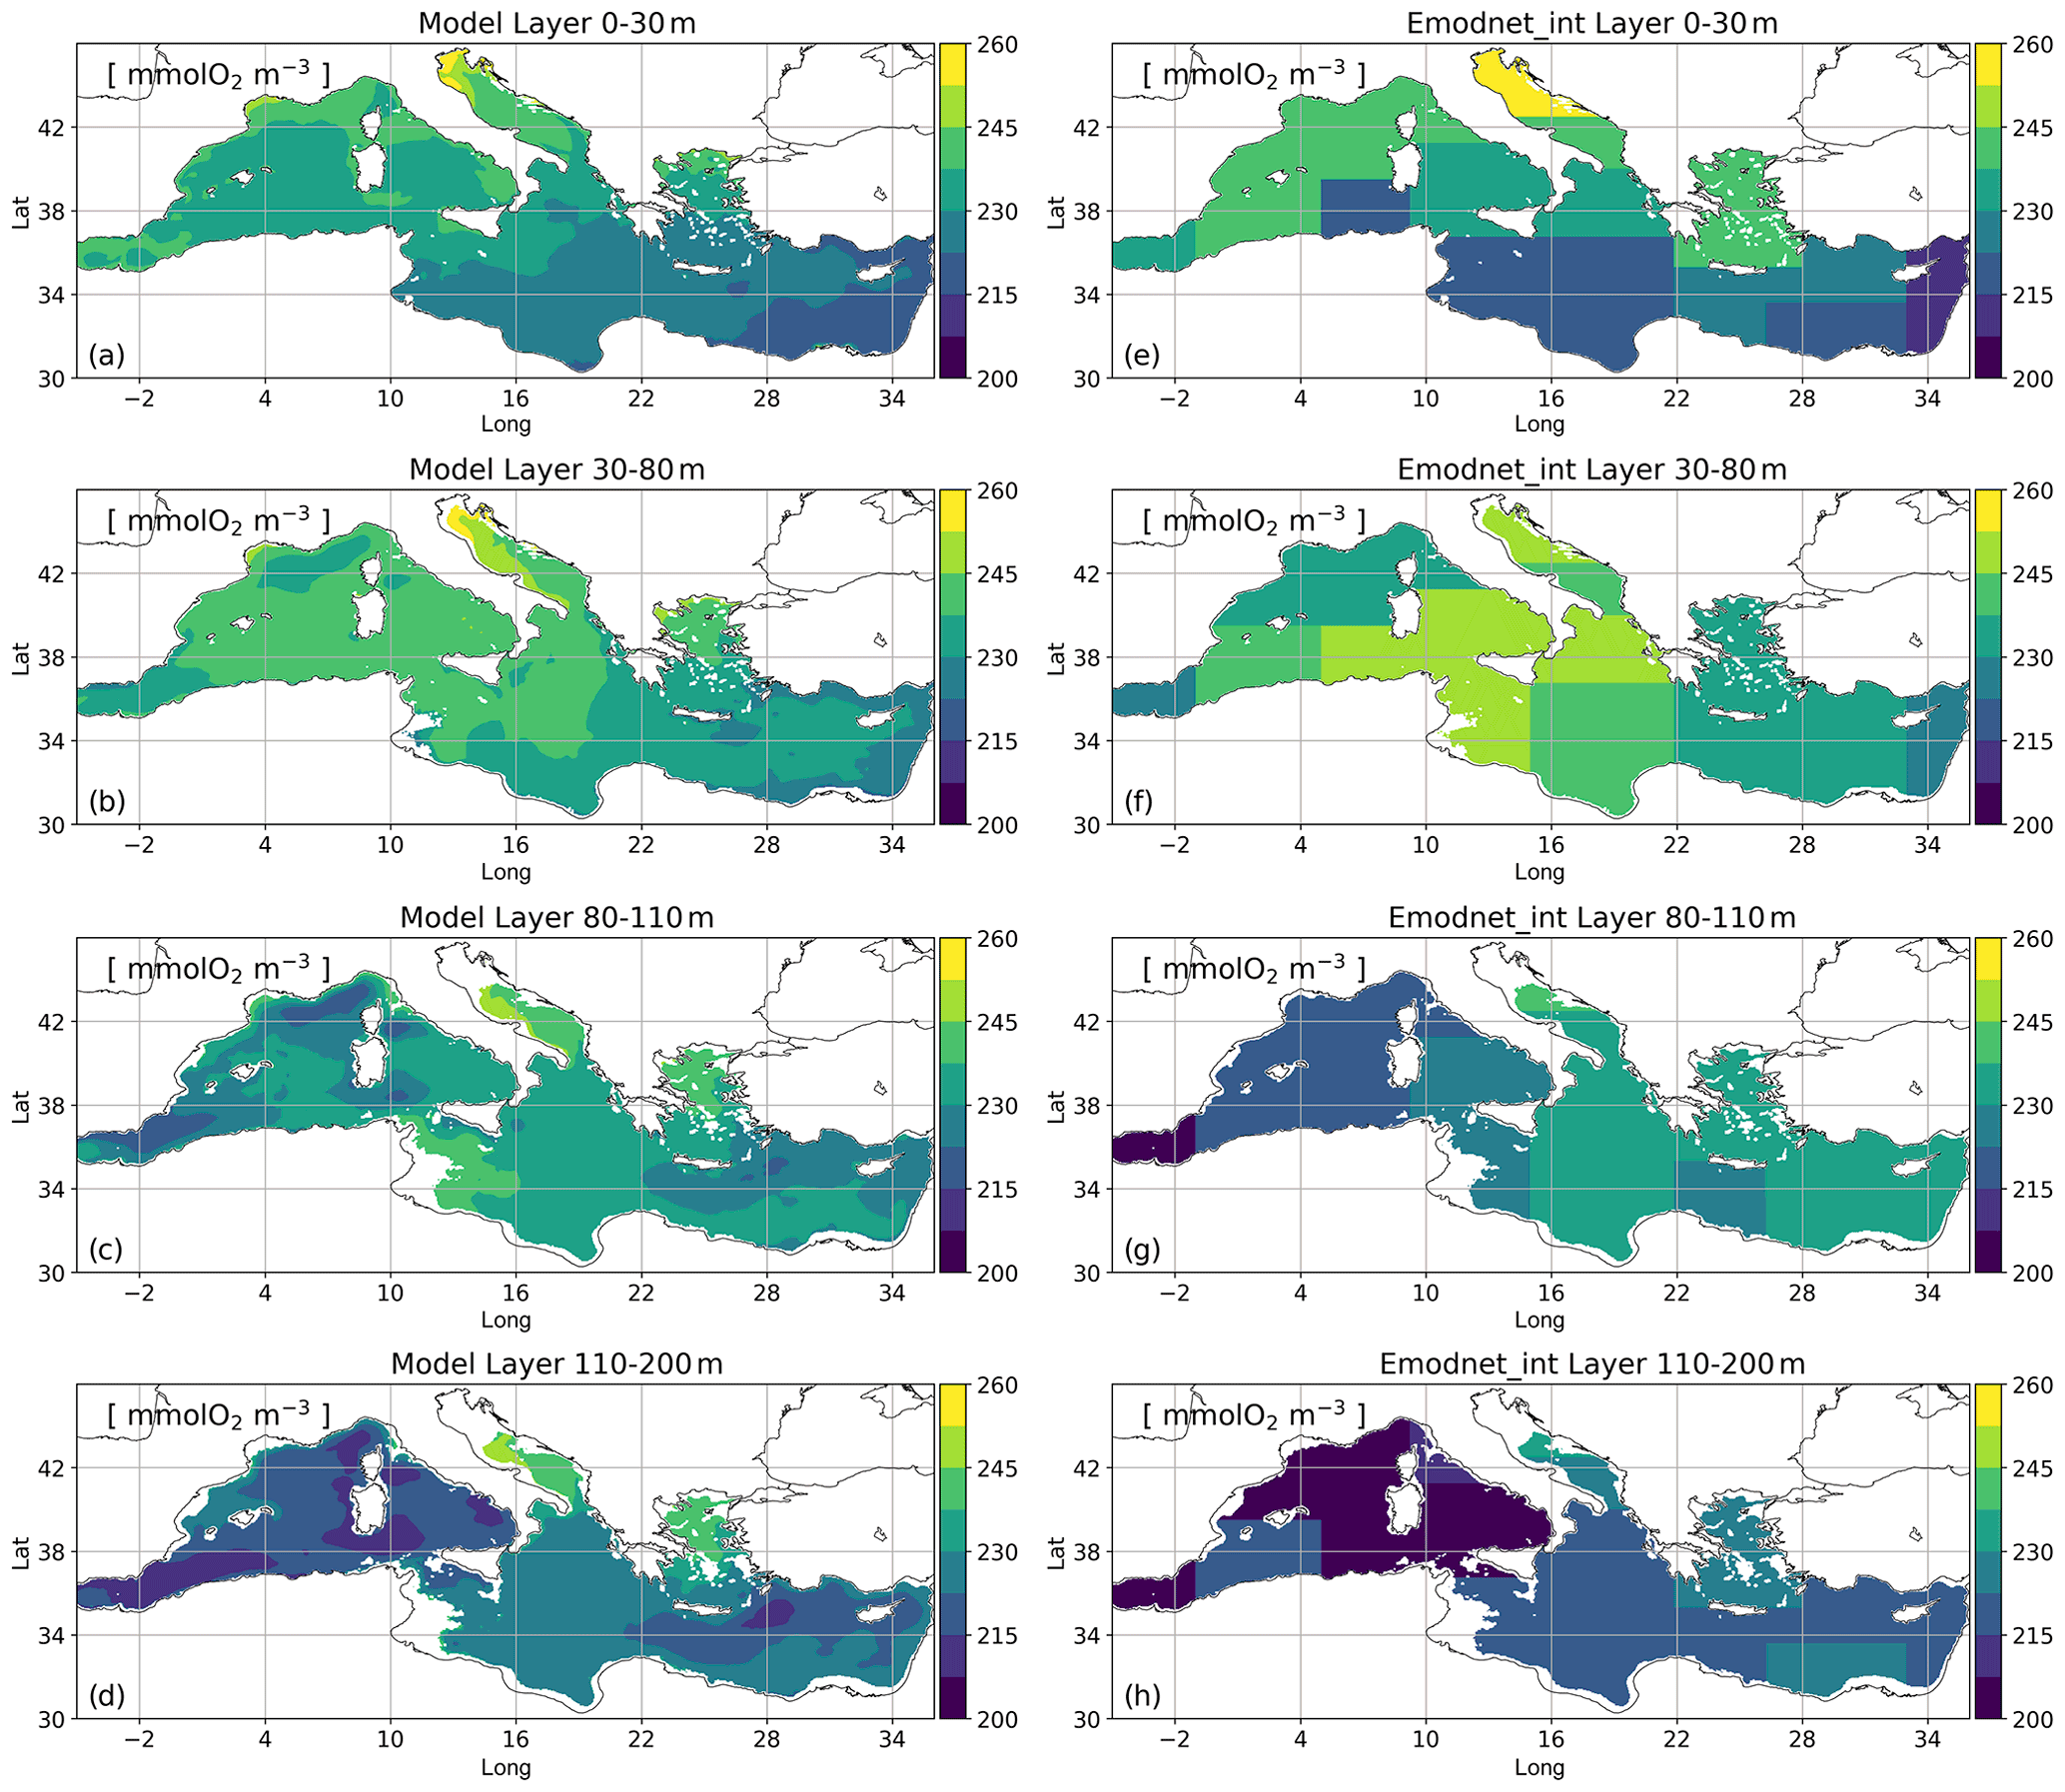
Figure 3Mean maps of modelled oxygen concentrations (a–d) and EMODnet_int observations (e–h) averaged in selected vertical layers (0–30, 30–80, 80–110, and 110–200 m) in the 16 Mediterranean subbasins in the 1999–2019 time period.
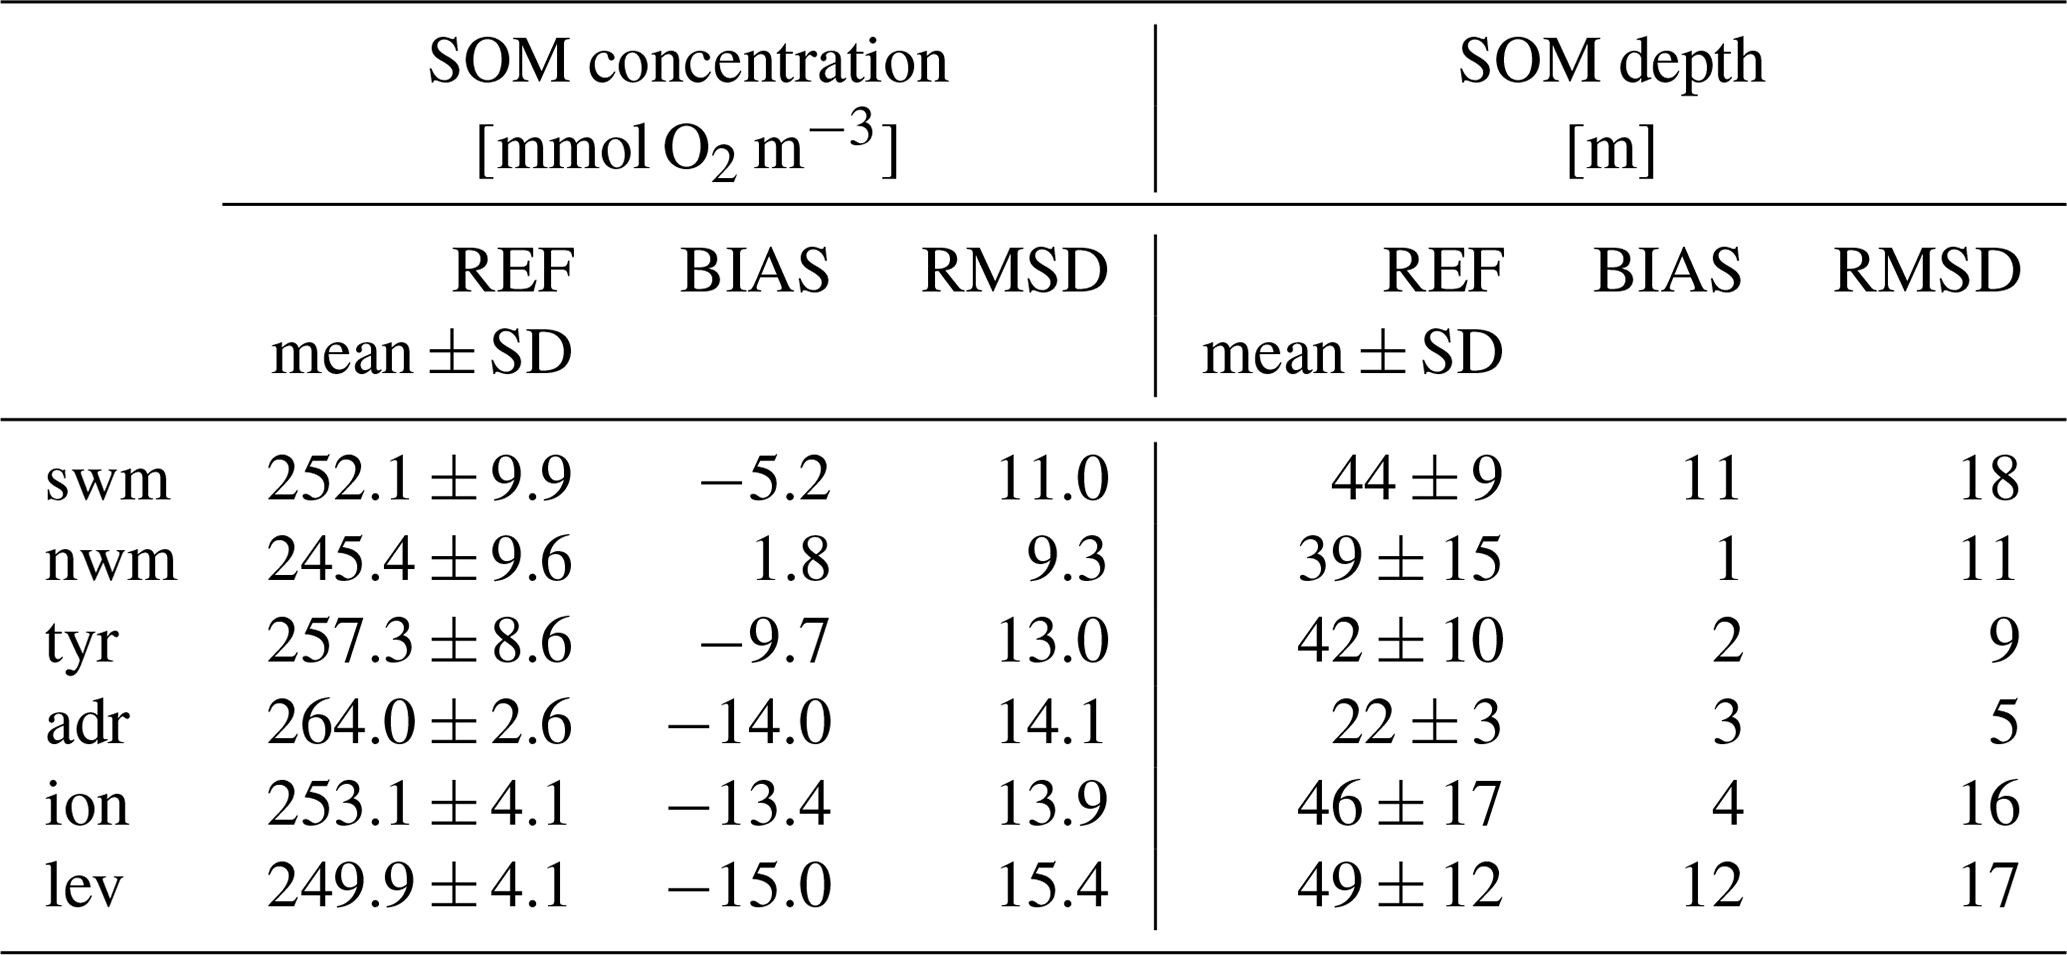
The system validation (Hipsey et al., 2020) evaluates the model's ability to reproduce the subsurface oxygen maximum (SOM) in summer as an emergent property that arises from interconnected physical and biological processes. Table 1 shows the metrics of RMSD and bias between the model and the BGC-Argo float vertical profiles for the SOM concentration and depth in summer, along with their mean values according to the observations. BGC-Argo floats provide SOM concentrations that are approximately equal to 240–260 mmol O2 m−3 and depths in the 20–50 m range. We obtain a high accuracy in reproducing these features since the RMSD of the concentration is lower than 15 mmol O2 m−3 and the RMSD of the depth is approximately equal to 13 m, which is small compared with the vertical resolution of the model (5–10 m at a depth of 50–200 m). Moreover, the reanalysis simulation typically underestimates the maximum concentration values, except in the northwestern Mediterranean Sea, and reproduces an SOM deeper than approximately 6 m.
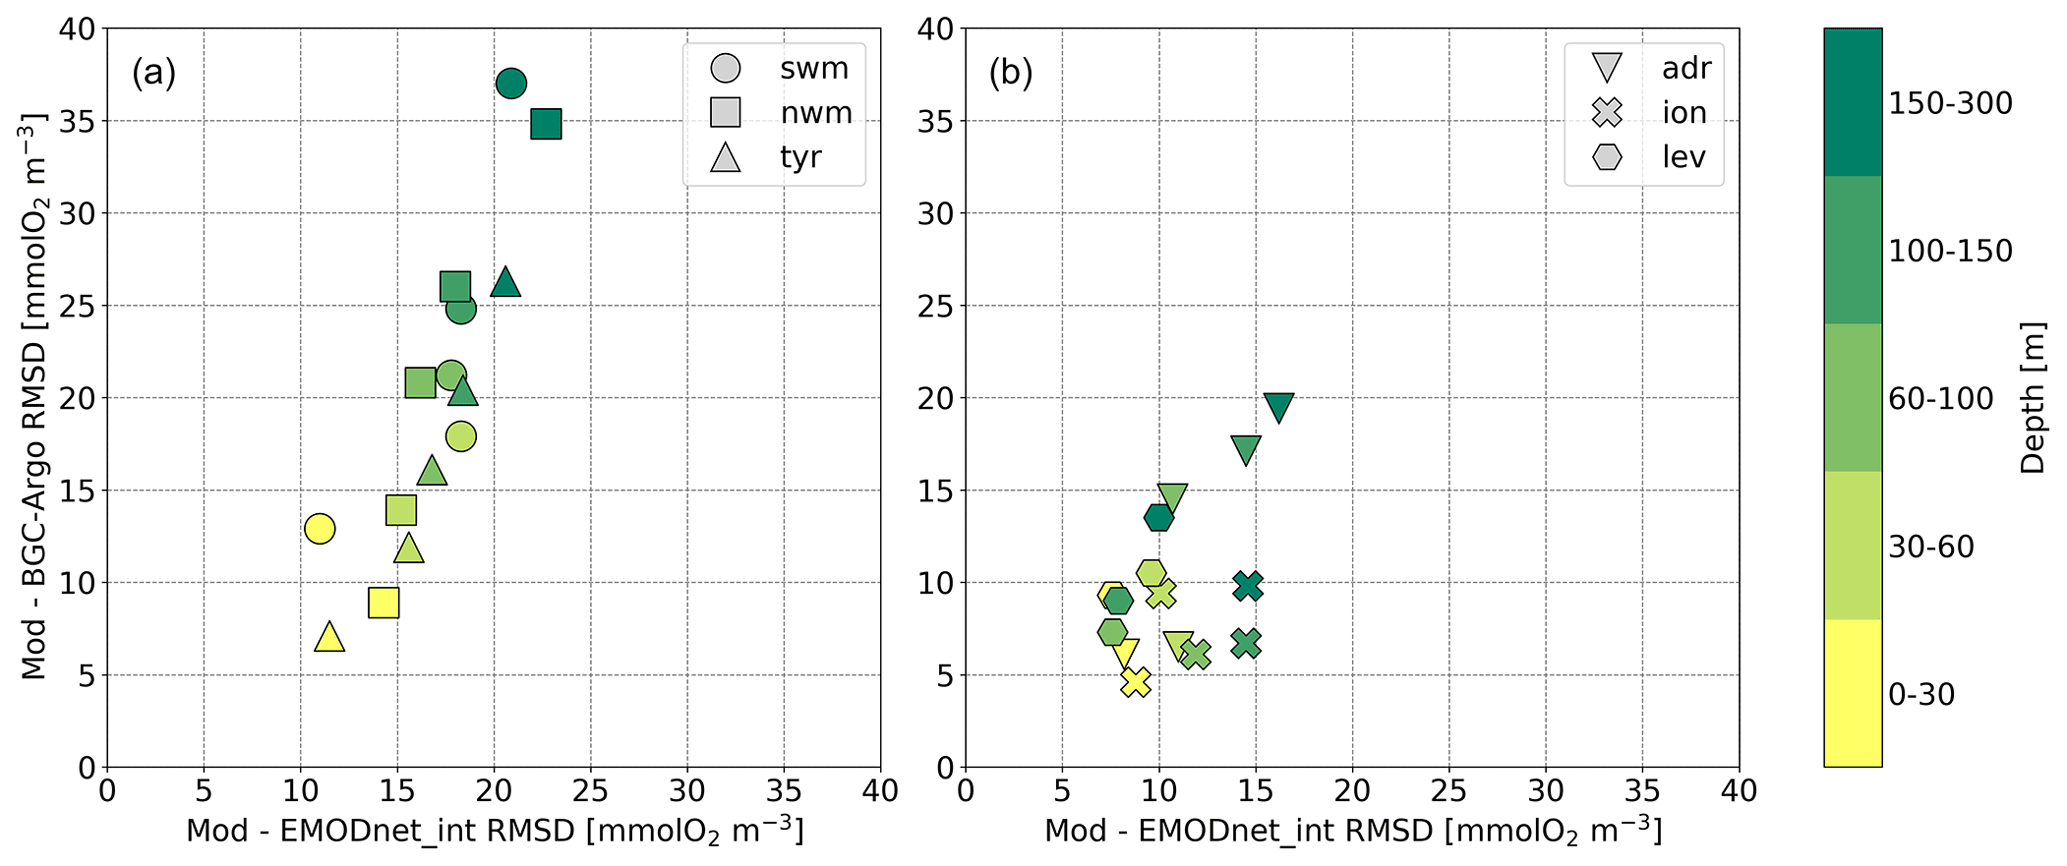
Figure 4Mean RMSD between modelled oxygen outputs and BGC-Argo floats versus mean RMSD of modelled oxygen outputs and the EMODnet_int dataset in open-sea aggregated subbasins in the western (a) and eastern (b) Mediterranean Sea. Metrics are computed for selected layers (0–30, 30–60, 60–100, 100–150, and 150–300 m) and averaged over the 1999–2019 time period.
Table 1SOM concentration and depth in the Mediterranean aggregated subbasins during the July–August–September (JAS) period in January 2013–December 2019: mean and standard deviation of BGC-Argo float observations (REF) and bias (BIAS) and RMSD of the model with respect to observations.
3.1.2 Process validation
To validate the community production and respiration processes, we use the in situ measurements of planktonic metabolism indicated in Fig. 2. These observations can be divided into two groups: (i) seasonally sampled in situ data in the nwm subbasin in coastal areas (González et al., 2008) and at the open-sea DYFAMED site, which are limited to CR measurements (from Lemee et al., 2012); and (ii) measurements collected in late spring–early summer at a variety of sites in the zonal direction and grouped into swm, tyr, aeg, ion, and lev subbasins (Gazeau et al., 2021; Lagaria et al., 2011; Regaudie-De-Gioux et al., 2009). Given the limited number of observations (see Table S2), the assessment aims to evaluate the model's ability to reproduce (i) the seasonal differences in production and respiration rates (Table 2) and (ii) the climatological values across the basin in the early stratification period (Table 3).
Table 2Mean and uncertainty estimation for the daily rate of oxygen concentration associated with gross primary production (GPP), community respiration (CR), and net community production (NCP) in the nwm subbasin in winter (WIN; December–January–February), spring (SPR; March and April, data in May are not available), and summer (SUM; June–July–August), according to in situ observations (OBS) in the coastal areas (COAST; from Gonzàlez et al., 2008) and at the open-sea DYFAMED site (OPEN SEA; from Lemee et al., 2012) and model output (MODEL) in the subbasin and corresponding layers: 0–30 m for the coast and 0–20 (SURF), 30–50 (MID), and 90–130 m (DEEP) for the open sea. The number N of available observations for each vertical layer is indicated in parentheses, and the uncertainties associated with the observations are estimated from the minimum–maximum range of values. For model statistics, the mean is computed by averaging the weekly means in nwm over the vertical levels belonging to the layer, whereas min and max indicate the minimum and maximum weekly means in the layer for the considered season.
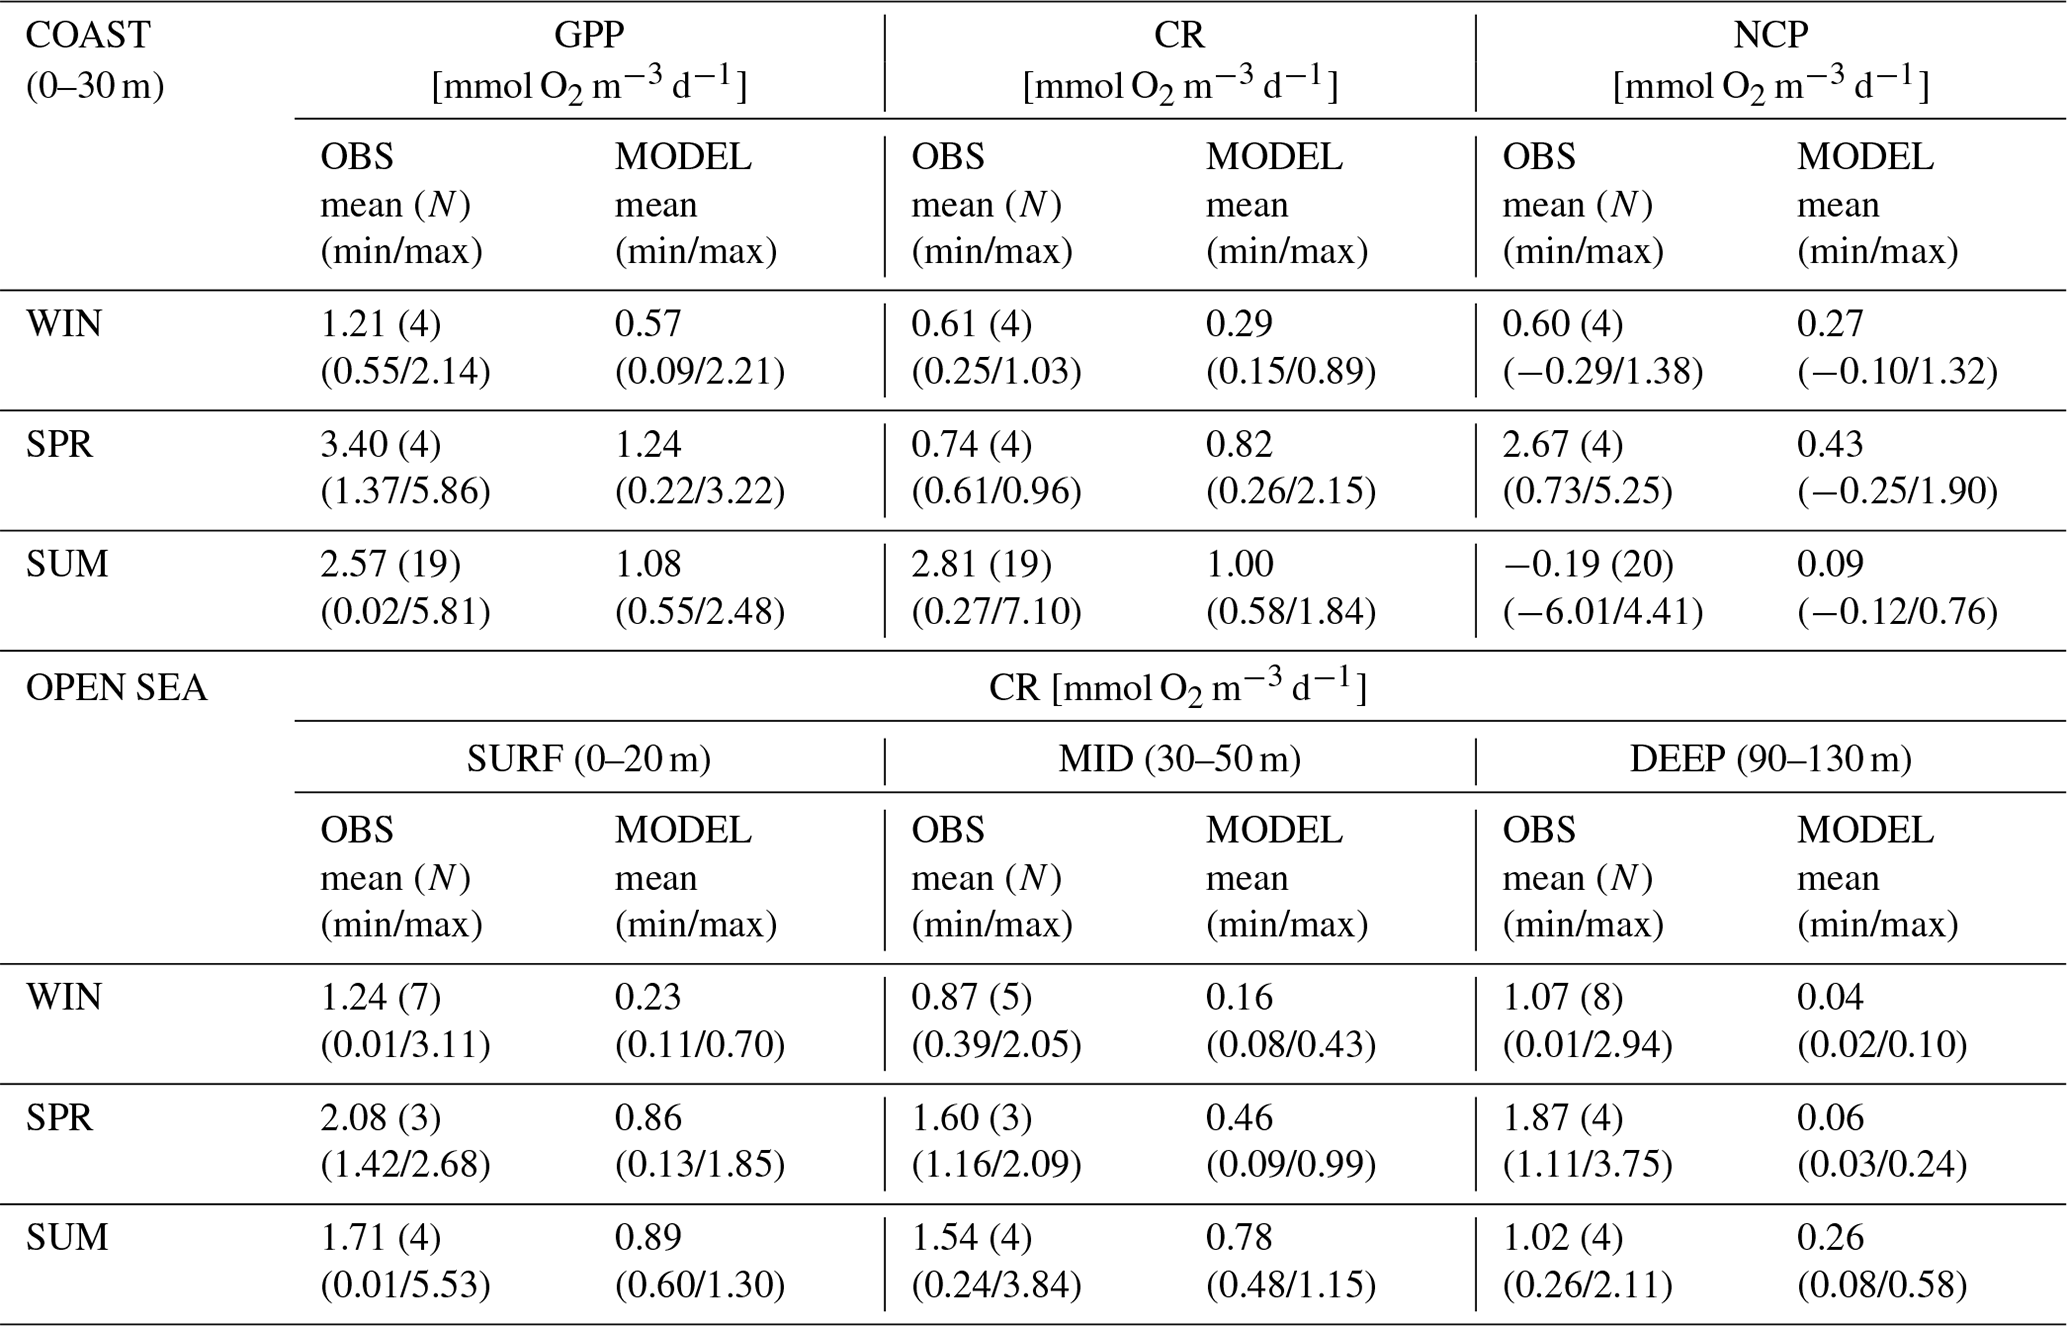
Table 3Mean and uncertainty estimation for the daily rate of oxygen concentration associated with gross primary production (GPP), community respiration (CR, as total plankton respiration plus nitrification and reoxidation), and net community production (NCP = GPP − CR), according to in situ open-sea observations (OBS, from Regaudie-de-Gioux et al., 2009; Lagaria et al., 2011; Gazeau et al., 2021) and model outputs (MODEL), in different vertical layers (SURF: 0–30 m, MID: 30–80 m, and DEEP: 80–110 m) and Mediterranean Sea subbasins (SUB; swm = swm1 + swm2, tyr = tyr2, aeg, ion = ion1 + ion2 + ion3, and lev = lev1 + lev2 + lev3 + lev4 in Fig. 1). We excluded observations close to the coast. The number N of available observations for each subbasin and vertical layer is indicated in parentheses. Uncertainties associated with the observations are estimated from the minimum–maximum range of values, except for the case of one single observation (N=1), for which the reference uncertainty from the literature (as standard error, SE) is indicated when available (otherwise, indicated as not determined, n.d.). Missing data are indicated as ×. Model means are computed in May–June, since 95 % of the observations refer to these months in 1999–2019. For model statistics, the mean is computed by averaging the means of the subbasins belonging to the aggregated subbasins over the vertical levels belonging to the layer, whereas the min and max indicate the minimum and maximum subbasin weekly means in the aggregated subbasin and layer.
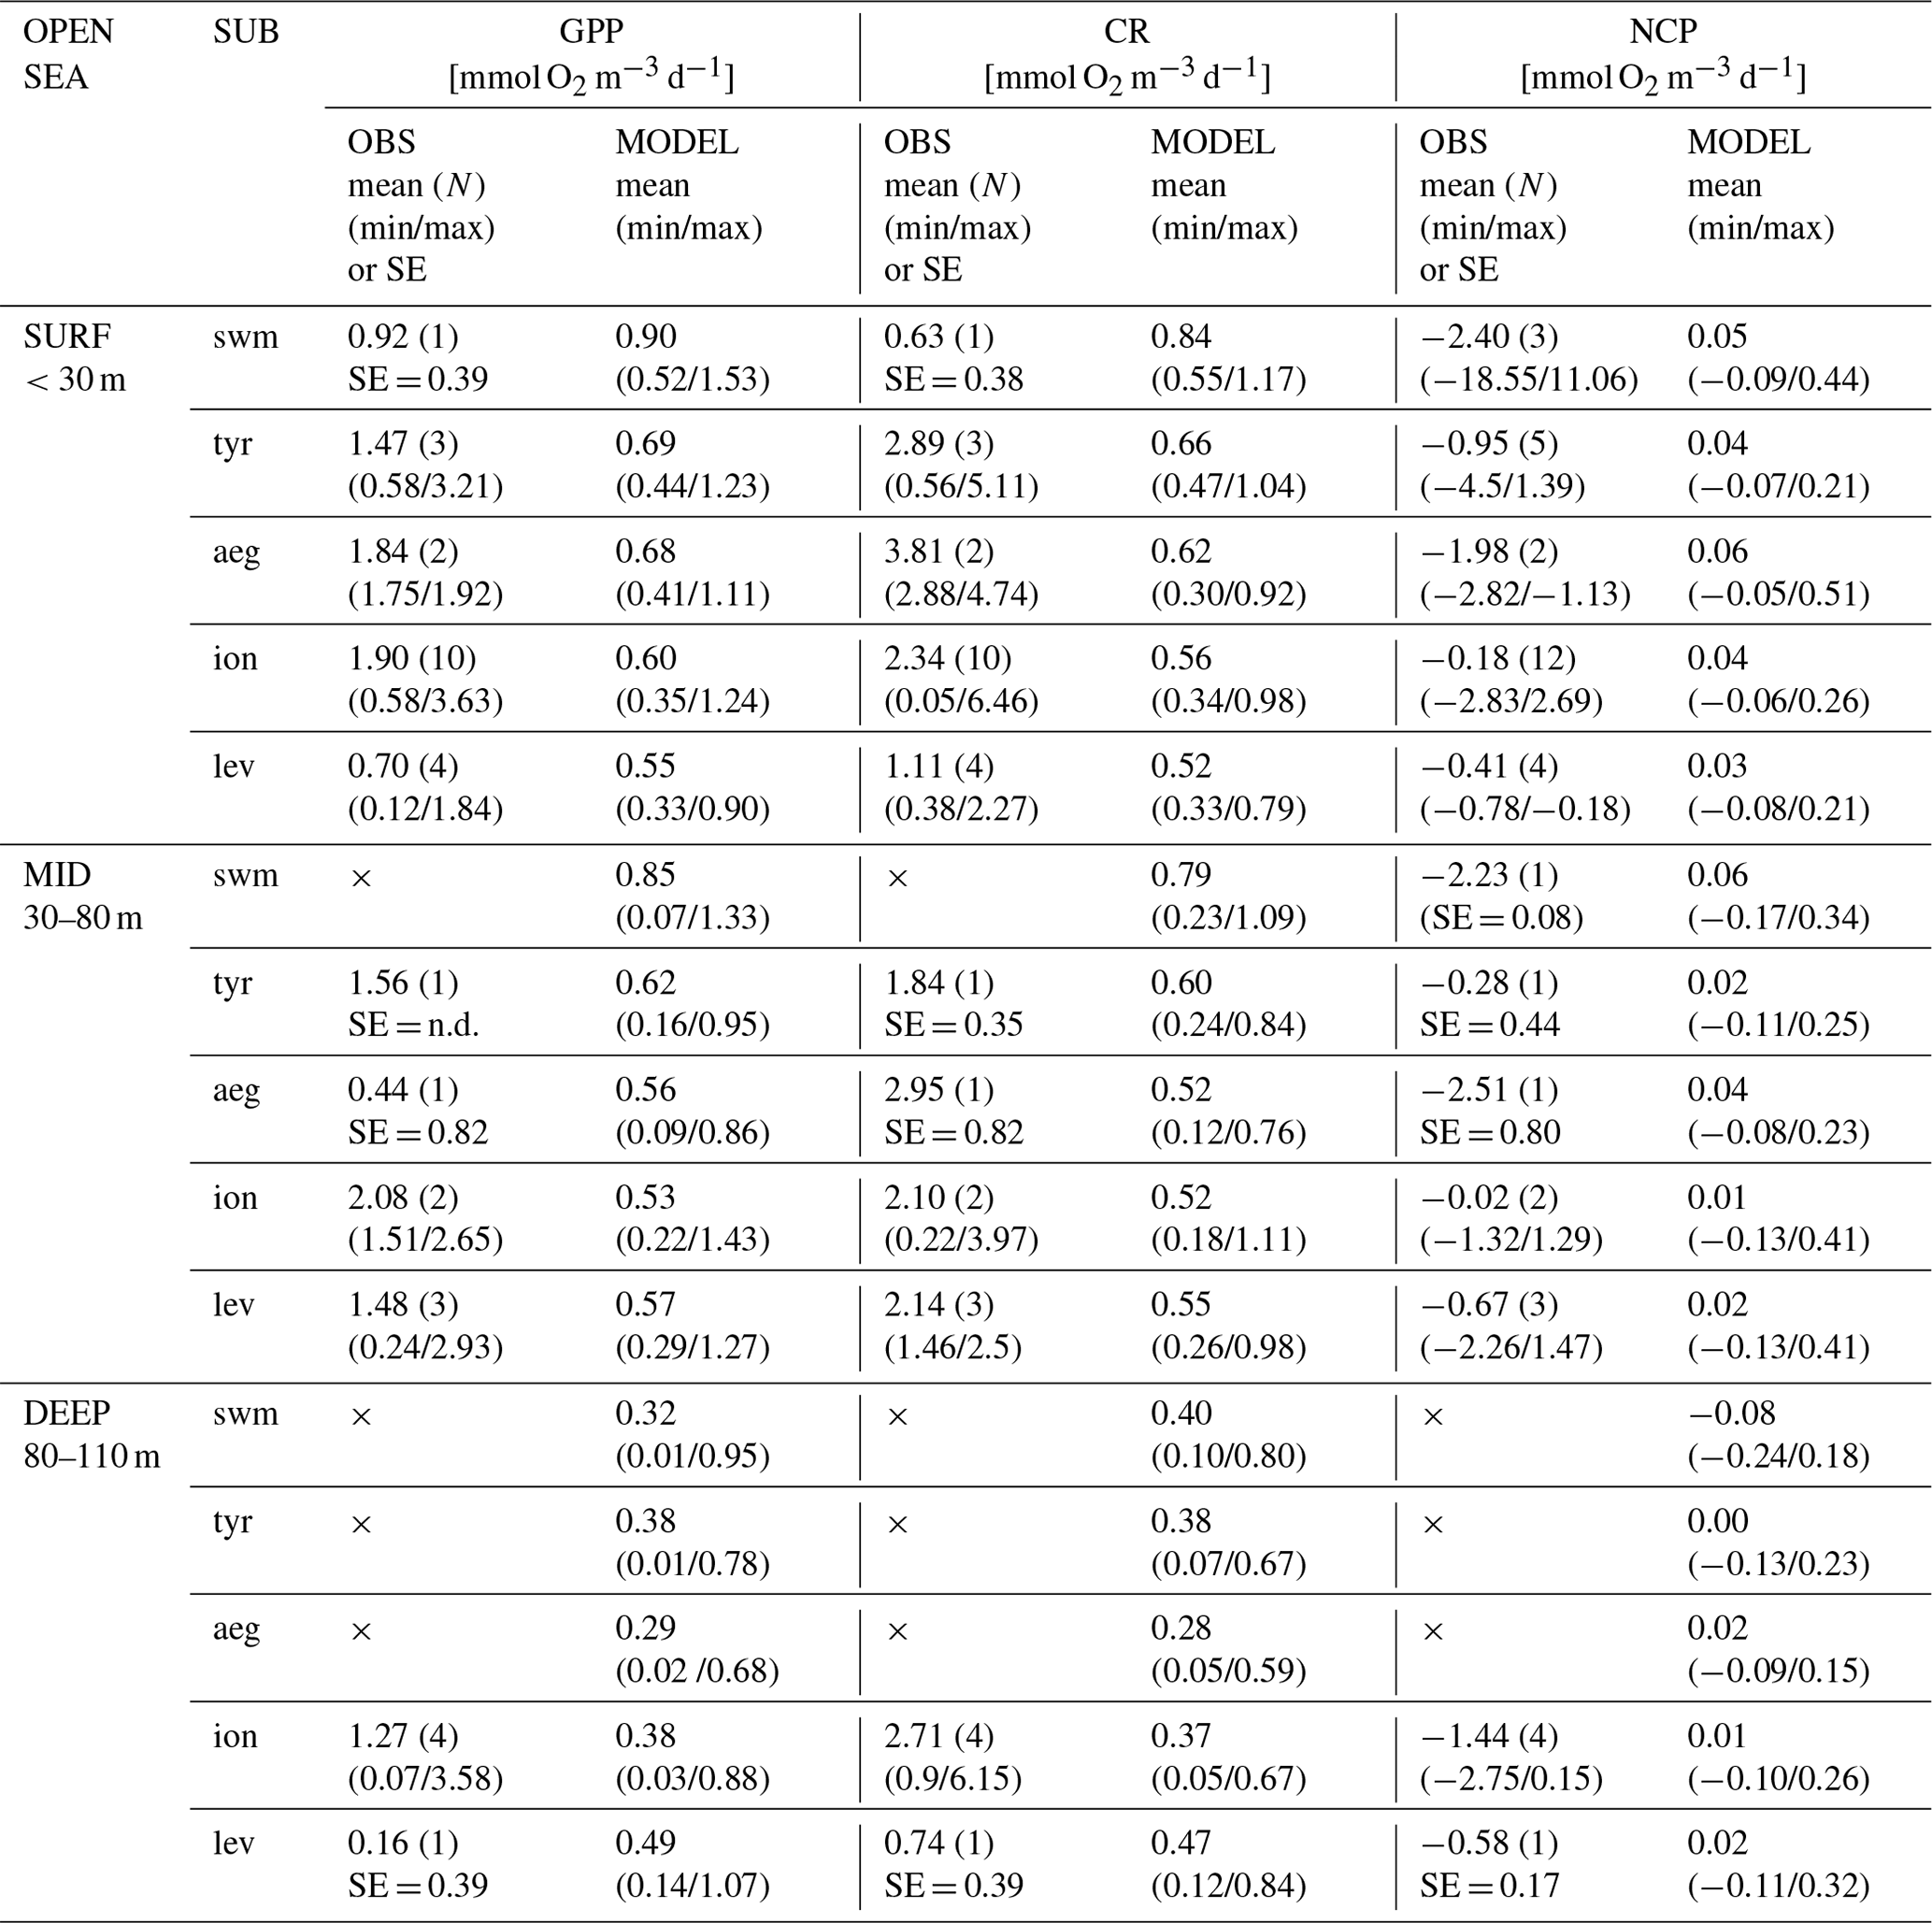
Table 2 shows that the reanalysis captures some features of the seasonal cycle and of the vertical gradient of respiration in the northwestern Mediterranean Sea. In fact, in the coastal zones (0–30 m), the highest values of gross primary production and net community production are recorded in spring, whereas the summer season displays relatively high values of GPP and the maximum CR value, which is in agreement with the observations. Moreover, the highest values of respiration in the open sea are at the surface in all the considered seasons, and there is a high variability in the summer respiration at the surface and in the DCM layer (30–50 m), as in the observations. However, productivity and respiration provided by the reanalysis in the northwestern Mediterranean Sea are typically lower by factors of 2–3 (5 in the open sea in winter) in the first 50 m and factors of 10–20 in the vertical range of 90–130 m, where observations display a large range of values.
Considering the late spring–early summer estimations, the reanalysis provides values of GPP and CR in the open sea that are 2–4 times lower than the in situ values in the swm, tyr, aeg, ion, and lev subbasins (Table 3); however, NCP values are compatible with the equilibrium between production and respiration in the first 110 m. Observations indicate a negative net community production equal to approximately 1 mmol O2 m−3 d−1 but with a range of values that makes the estimate compatible with equilibrium in 50 % of cases. The west–east decreasing gradient of the modelled GPP and CR in the first 80 m does not have a clear correspondence in the in situ data, which are quite scarce and often affected by large range of values.
Regarding the validation of vertically integrated production estimates, the mean annual model-derived NPP (net primary production; Fig. S1 in the Supplement) integrated in the epipelagic layer is in good agreement with both satellite estimations and literature data, as reported in Cossarini et al. (2021).
3.2 Oxygen dynamics in the epipelagic layer
Given the satisfactory results of the reanalysis to describe oxygen variability and dynamics in the epipelagic layer at the meso- and seasonal scales, we use the reanalysis to investigate the SOM (1) by analysing the mean vertical oxygen profiles and the biological processes in the epipelagic layer of the western and eastern Mediterranean Sea (Sect. 3.2.1) and (2) by focusing on the summer season by mapping the SOM in the basin (Sect. 3.2.2) and investigating how different physical processes at the mesoscale can interact with the biological production and consumption of oxygen in the subsurface layer (Sect. 3.2.3).
3.2.1 Oxygen dynamics driven by biological processes
As a first characterization of the oxygen dynamics and the impact of biological processes occurring in the Mediterranean epipelagic layer, Fig. 5 reports the mean seasonal profiles of oxygen and their production and consumption rates (Eq. 3) in the western and eastern Mediterranean Sea (hereafter western Med and eastern Med).
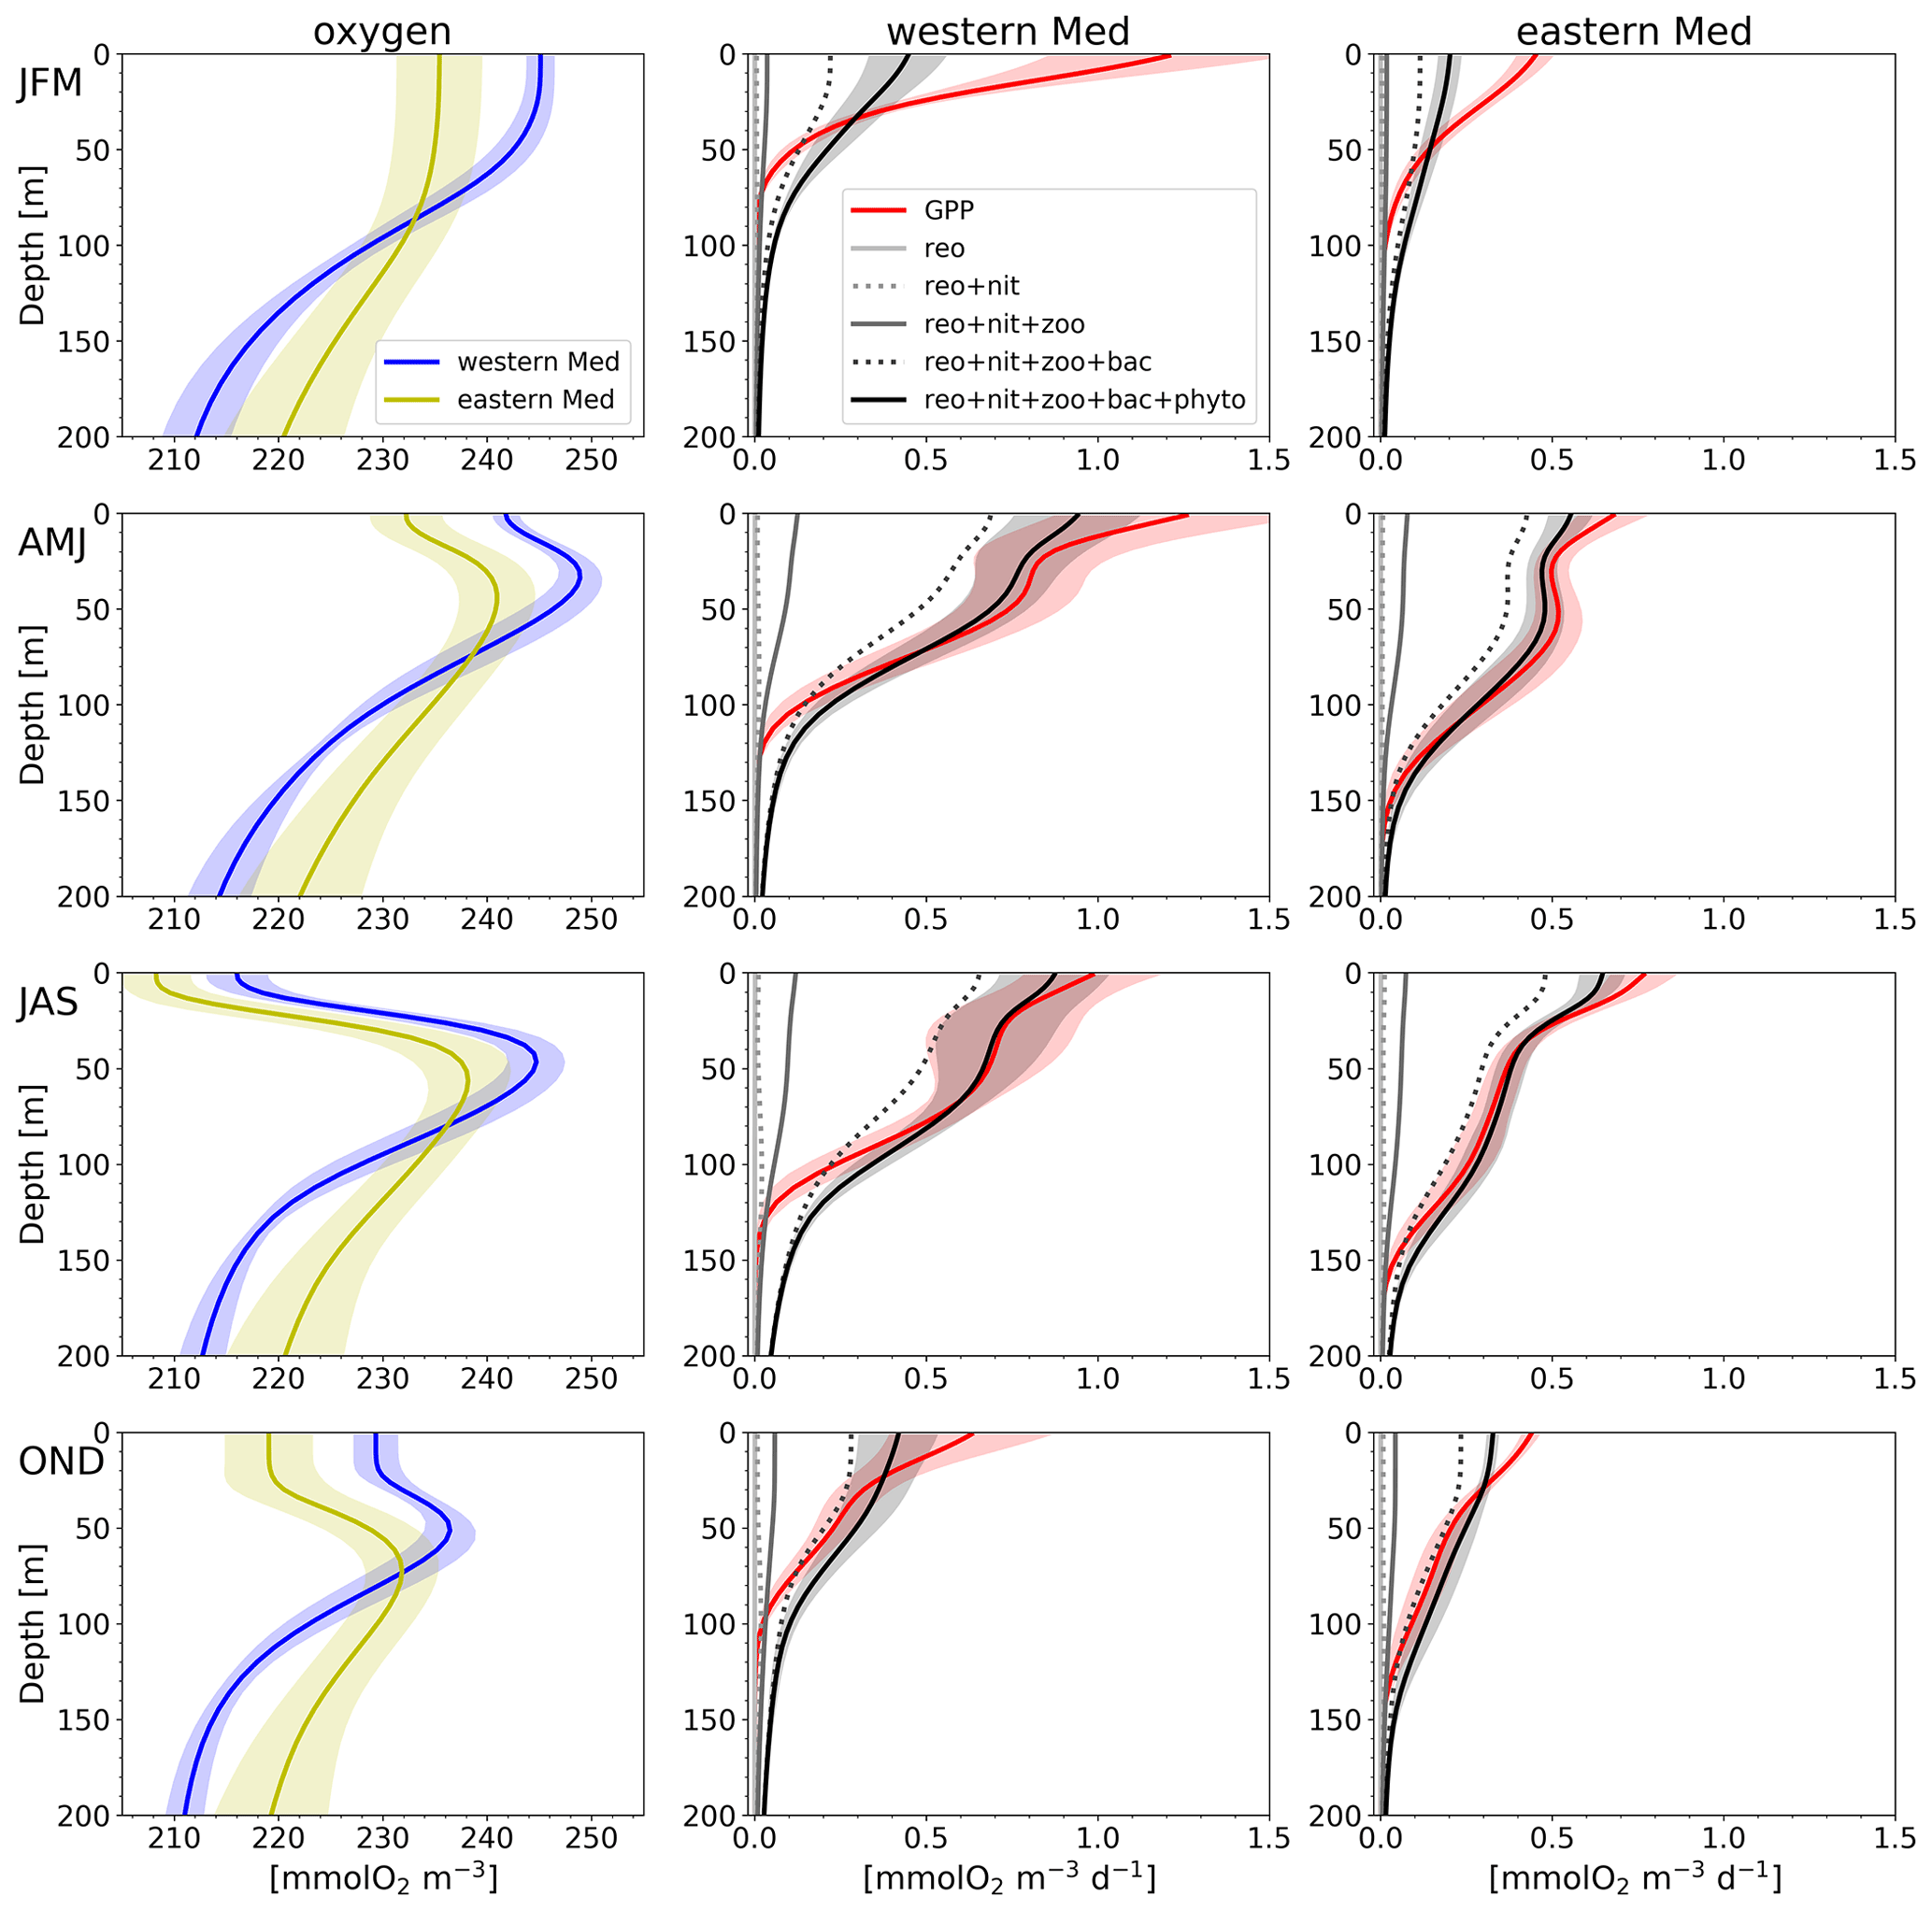
Figure 5Modelled climatological profiles in the epipelagic layer for the oxygen concentration (first column) and daily rate of oxygen concentration associated with biological processes in the western Mediterranean Sea (western Med, second column) and eastern Mediterranean Sea (eastern Med, third column) in the winter (JFM), spring (AMJ), summer (JAS), and autumn (OND) seasons, corresponding to the four rows. Biological processes represented are gross primary production (solid red line) and cumulative consumption (alternating solid and dotted lines, in greyscale): reoxidation of reduction equivalents (reo) and nitrification (nit), as well as zooplankton (zoo), bacterioplankton (bac), and phytoplankton (phyto) respiration. Shaded bands represent the spatial variability computed as the standard deviation of the climatological profiles in the western Med and eastern Med. The northern Adriatic Sea was excluded from the computation since its depth is mostly lower than 200 m.
Oxygen profiles depict a seasonal variability with a surface maximum in winter and the presence of SOM in the other seasons, which is more pronounced in summer. The surface and SOM concentration values are higher in the western Med than in the eastern Med.
At the surface, NCP, estimated as the difference between gross primary production (GPP, red line in Fig. 5) and CR (total consumption, black line), always appears positive during the year in both Mediterranean subdomains. However, the western Med displays a higher biological activity, since both production and respiration are higher than those in the eastern Med in all seasons. The compensation depth, i.e. the depth at which CR is equal to GPP, displays an increasing west–east depth gradient, except in summer, and reaches its maximum in the spring season: close to 80 and 110 m for the western and eastern Med, respectively (Fig. 5).
While GPP is at a maximum at the surface in all seasons, the spring and summer profiles display a second relative subsurface maximum. In spring, the GPP subsurface maximum values are 0.8 and 0.5 mmol O2 m−3 d−1 at 50 m and at 80 m in the western Med and eastern Med, respectively. In summer, we observe relatively lower values of biological activity (e.g. GPP close to 0.7 and 0.3 mmol O2 m−3 d−1, respectively) at higher depths, i.e. at 60 m in the western Med and 90 m in the eastern Med.
Oxygen production and consumption profiles display spatial standard deviations that make them consistent with the equilibrium state in spring and summer, i.e. estimations of the mean values of the profiles and compensation depths in these seasons might have great variability at the climatological subbasin scale.
Finally, we observe that reoxidation and nitrification processes supply a joint contribution lower than 3 % of the total consumption in the epipelagic layer (as obtained by dividing the 0–200 m integration of the values indicated by the dotted line reo + nit and the 0–200 m integration of the values indicated by the thick black line in Fig. 5). Thus, the contribution of these two processes is almost negligible, and the total consumption of oxygen is ascribed to the sum of the three respiration processes by the plankton compartments.
At the surface, the excess net oxygen production (Fig. 5), combined with air–sea interactions (Eqs. 1 and 2) and mixing and stratification processes, yields the seasonal cycle displayed in Fig. A1 (Appendix A).
3.2.2 Subsurface oxygen maximum (SOM)
Besides the well-known case of surface oxygen dynamics (Appendix A), the SOM feature also reflects the interplay of biological and physical processes because, as shown below, it is an emerging property driven by multiple factors. A first characterization of the SOM in the summer season was outlined in the validation phase for Mediterranean areas hosting BGC-Argo floats in specific spatial and temporal subsets (Sect. 3.1.1). Considering the whole basin throughout the simulation period, in Fig. 6, we mapped the mean concentration and mean depth of the SOM at each horizontal point by averaging (in the 1999–2019 period) the annual maximum vertical values of the mean oxygen concentration and their associated depths in the July–August–September (JAS) months (Fig. 6a–b). Moreover, we evaluated both inter-annual variability and possible trends (by Theil–Sen method; Theil, 1950, and Sen, 1968) of SOM concentration and depth in the same period (Fig. 6c–d and e–f, respectively).
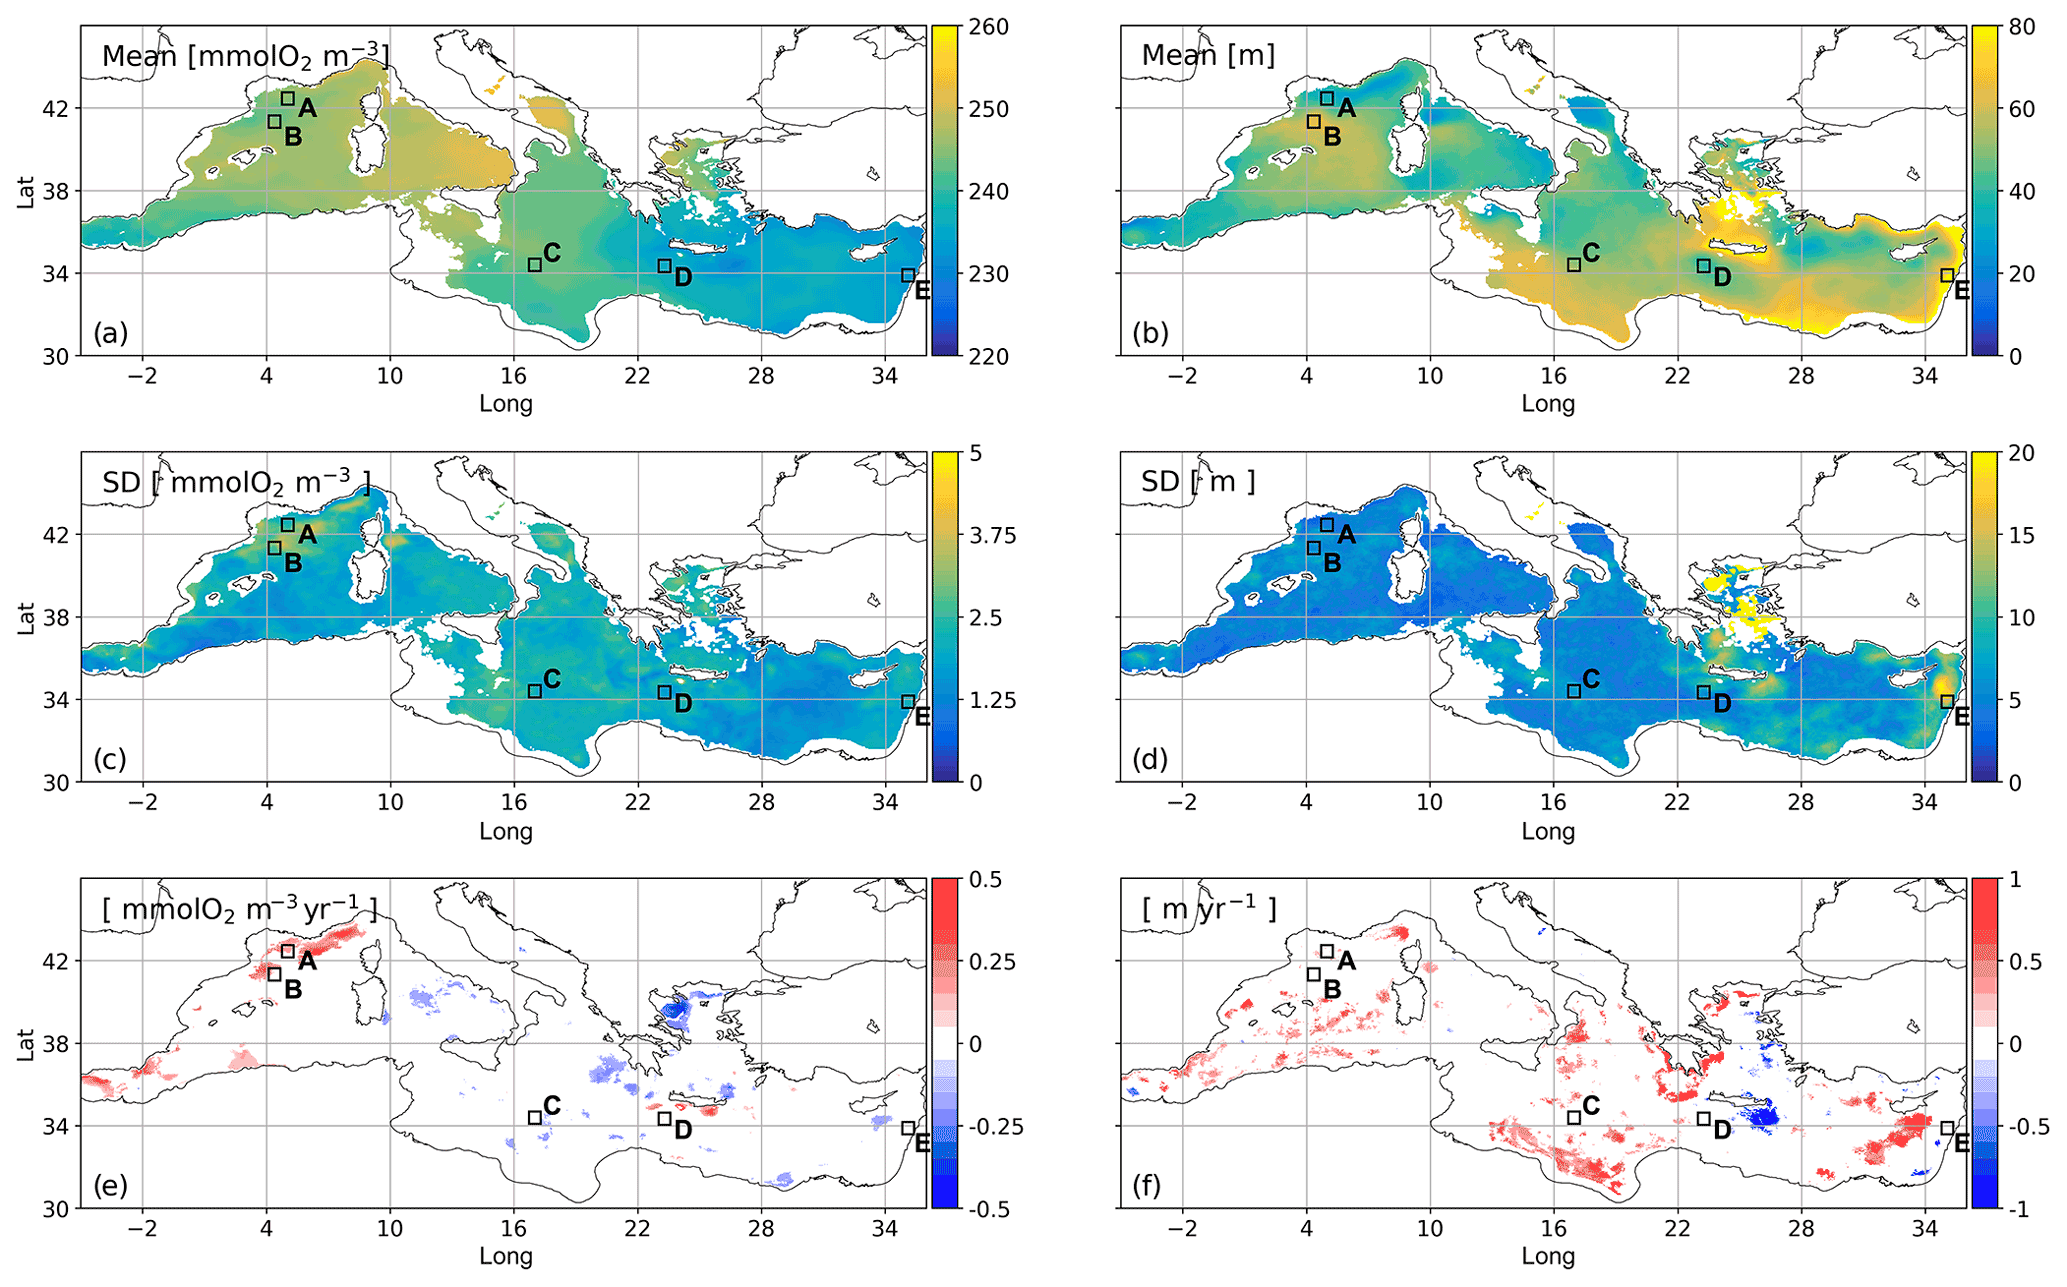
Figure 6Mean concentration (a) and depth (b) for the modelled SOM in summer, computed by averaging the annual maximum vertical values of the mean oxygen concentration in the JAS months and their associated depths, respectively, in the period of 1999–2019; standard deviation of the annual maximum values (c) and their depths (d), in the same period; trends evaluated in concentration (e) and depth (f) by the Theil–Sen method and provided only if significant and obtained from the Mann–Kendall test (p=0.05), in the same period. Areas A–E delimited by black squares are hereafter defined as follows: A = Gulf of Lion; B = Balearic front; C = central Ionian area; D = western Cretan gyre; E = eastern Levantine (area). Coastal areas (i.e. with depths shallower than 200 m) are masked.
The summer SOM shows concentrations between 230 and 250 mmol O2 m−3, with generally higher values in the western Med. However, we also recognize a south–north gradient in the eastern Med and a spatial variability pattern close to 3 % at the mesoscale (Fig. 6a). Inter-annual seasonal variability (Fig. 6c) accounts for a percentage lower than 2 %, and trends are significant (according to the Mann–Kendall test, p=0.05) only in 8 % of the open-sea basin, with positive and negative values covering a similar portion (Fig. 6e) and mean values approximately equal to 0.19 and −0.18 mmol O2 m−3 yr−1.
On average, the SOM is located close to a depth of 40 m in the western Med and 50 m in the eastern Med (Fig. 6b). However, it appears shallower in the most productive areas (e.g. northwestern Alboran Sea, Gulf of Lion and Ligurian Sea, and offshore of southern Sicily) and in some cyclonic gyres (e.g. southern Adriatic gyre, Rhodes gyre, western Cretan gyre, and northern Tyrrhenian gyre) and deeper at the Balearic front, in the southern Ionian Sea, near the Levantine coasts, and in the southern Aegean Sea.
The inter-annual variability associated with the summer SOM depth (Fig. 6d) appears much smaller than the spatial variability (Fig. 6b), especially in the western and central Mediterranean, where the inter-annual standard deviation is lower than 10 m. In some areas of the southern Aegean Sea and Levantine Sea, the standard deviation of the SOM depth can reach 20 m, whereas in other areas of the northern Aegean Sea the SOM is not clearly recognized. In addition, patchy areas covering only 13 % of the open-sea basin display significant trend values in the SOM depth (Fig. 6f); they are mostly positive (12 % coverage), with a mean value approximately equal to 0.49 m yr−1, whereas very sparse (1 % coverage) negative values correspond to a mean value of −0.71 m yr−1.
To highlight the relative importance of the several drivers that are responsible for the SOM variability on the mesoscale and submesoscale, we selected some areas (indicated by the black squares in Fig. 6b) that are approximately 50 km × 50 km wide and representative of different phenomenologies, and then we analysed the seasonal cycle of oxygen during 1 year of simulation (i.e. 2014). Areas A and B are both included in the Liguro–Provencal gyre (Menna et al., 2022), but area A is more influenced by the Northern Current, while area B is affected by the Balearic front (Ruiz et al., 2009). Area C is chosen in the central part of the Mediterranean south of the mid-Ionian jet (Menna et al., 2022), area D is within a smaller cyclonic gyre (i.e. western Cretan gyre; Pinardi et al., 2015) in the oligotrophic eastern Mediterranean basin, and, finally, area E is located in a subduction area within the continental slope of the eastern Levantine Sea. The year 2014 has been chosen because summer SOM depths and concentrations in the selected areas are intermediate when compared to the variability shown in the 1999–2019 period (Fig. S2).
3.2.3 Biological and physical dynamics responsible for the SOM
Figure 7 shows the Hovmöller diagrams of the oxygen concentration and its biological and physical derivatives for the areas selected in Fig. 6. Derivative terms are recomputed in retrospect on a monthly basis, starting from the weekly reanalysis output in a specific year, i.e. 2014. In particular, the central column of Fig. 7 displays the biological component of Eq. (1), computed by following Eq. (3), and the right column displays the sum of the other terms in Eq. (1), computed as the difference between the total derivative and the biological derivative. To clarify the terms in the physical part, in the third column, we used the following symbology: hatched black regions represent vertical diffusive fluxes (i.e. ; Haskell II et al., 2016), with absolute values higher than the 90th percentile of the distribution computed in the five areas; arrows represent vertical velocities, with the orientation indicating upward or downward velocity, thickness linked to intensity, height indicating the involved levels, and position indicating the month (when in-between two months); and dashed yellow rectangles indicate locally high spatial standard deviations (i.e. values higher than 0.15 mmol O2 m−3 d−1) in the derivative computation within the considered area. The mixed layer depth (MLD) and maximum oxygen in summer are also included in the left column of the same figure.
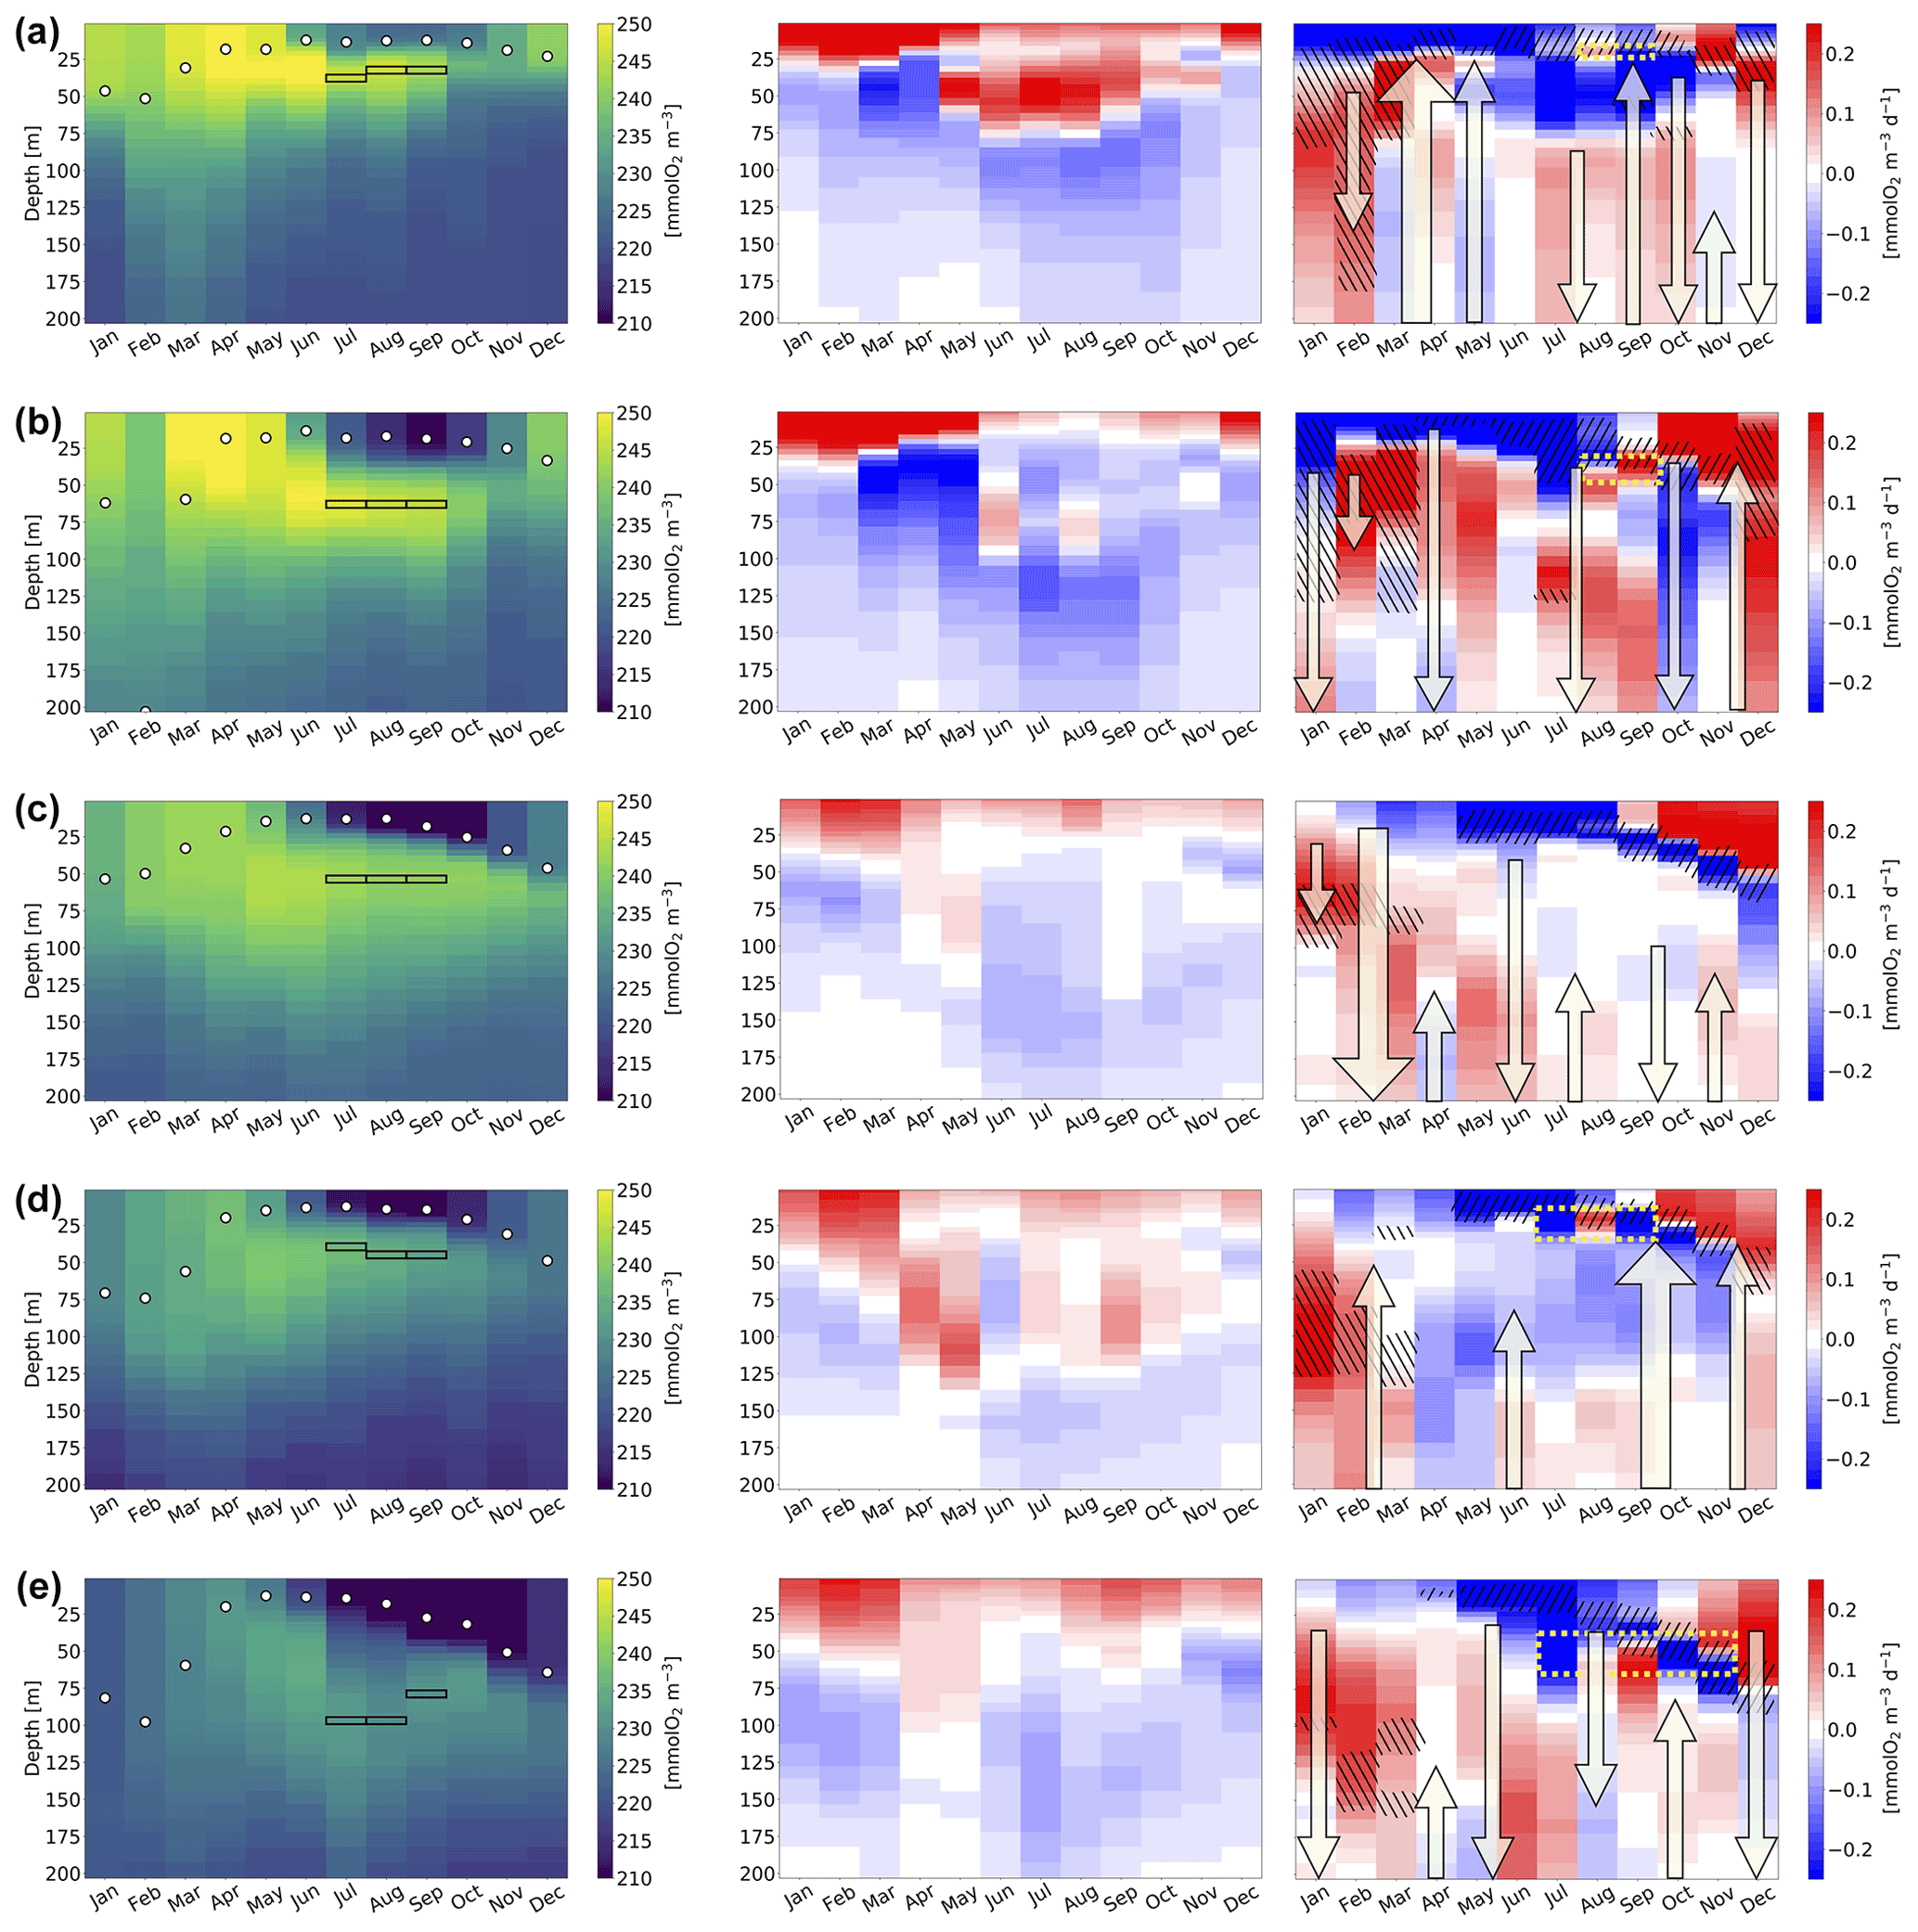
Figure 7Hovmöller plot of monthly variables computed in areas A–E (panels a–e, respectively; Fig. 6) in 2014: oxygen concentration, with the depth of the maximum in summer months indicated by black rectangles and the mixed layer depth by white circles (left column), with the biological derivative in millimoles O2 per cubic metre per day (mmol O2 m−3 d−1) (central column) and the physical derivative in millimoles O2 per cubic metre per day (mmol O2 m−3 d−1) (right column). In the right column, the oxygen transport components are highlighted by symbols when relevant; vertical velocities (upward/downward arrows), eddy diffusivity fluxes (hatched black regions, with pattern lines from top left to bottom right indicating downwards and from bottom left to top right indicating upwards), and contributions from lateral transport (dashed yellow rectangles). Details on the thresholds used to quantify the symbols are given in the text.
Oxygen concentrations in the epipelagic layer (Fig. 7, left column) follow the general decreasing west–east gradient, with higher values in the Gulf of Lion (A) and Balearic front (B) and lower values in the Levantine areas (D–E).
The highest values of biological oxygen production in the first 25 m are found in February and March (Fig. 7, central column). Moreover, oxygen consumption under 150 m is observed in all areas (same figure and column). However, the maximum depth at which oxygen production still overcomes consumption (right above the compensation depth) shows high variability, both during the year and in the considered areas. In particular, summer oxygen production in the subsurface layers is present only in the Gulf of Lion (A), Balearic front (B), and western Cretan gyre (D) areas, and the Gulf of Lion is the only case in which the values of the subsurface oxygen derivative in summer are comparable with late winter–early spring surface values (values higher than 0.2 mmol O2 m−3 d−1 in Fig. 7). The absence of summer oxygen production in areas C and E appears to support a shallower compensation depth in the eastern Med with respect to the western Med, as observed in Fig. 5, whereas the general west–east deepening of the compensation depth appears to hold in the other seasons. However, additional analyses should be conducted in other Mediterranean areas and for additional years of simulation to fully explain the variability associated with the compensation depth in the basin. If we consider the total biological derivative in the epipelagic layer (i.e. the sum of biological derivatives within 0–200 m), oxygen production is dominant in February–May and consumption in June–December in all areas (not shown).
Physical derivatives (Fig. 7, right column) are generally higher than biological derivatives, except for the northwestern Mediterranean areas, which are the most productive. The surface values of the physical derivatives show the highest positive values in October–December and negative values in summer. Vertical diffusive fluxes are generally downwards in January–March and upwards in May–October. Oxygen transport associated with vertical velocities (arrows in Fig. 7, right column) is typically downwards in January–February and site-dependent in the other seasons.
By highlighting the highest values among the derivatives in the surroundings of the SOM, the spatial variability in the SOM reflects the relative and local (mesoscale) interplay and importance of physical and biological processes. Indeed, the depth of the SOM in summer is associated with subsurface biological production in the Gulf of Lion (A) and Balearic front (B). On the other hand, in the case of the Cretan gyre (D), the upward summer velocities seem to be responsible for the rising of low-oxygen waters, which decrease the oxygen within approximately 50–125 m, in contrast to the biological production found in those layers, and increase the concentration below 125 m. In the central Ionian area (C), the SOM in summer (at a depth equal to approximately 50 m) can be associated with the residual oxygen following the production at the 50–80 m depths in May, the effect of the downward velocities in June, and the biological consumption concentrated under 60 m in the following months.
Finally, the downward vertical velocities in May–June explain the oxygen deepening in July in the continental slope area of the eastern Levantine (E), which exhibits a deep SOM (close to a depth of 100 m), with increasing physical derivative values down to 200 m, i.e. well below the layer (i.e. 50–100 m) affected by production in April–May. In this case, an isopycnal downward displacement driven by the temperature from late spring to half summer occurs (top of Fig. S3), similar to the findings by Chen and McKinley (2019). Then, in July and August, low-salinity waters appear at depths of 40–90 m (bottom of Fig. S3) and are associated with low oxygen contents (from the oxygen plot in area E; Fig. 7, left column) and ascribed to lateral fluxes (as inferred from high spatial standard deviations in the physical derivative within the area in the right column of the same figure). Biological production sustains higher oxygen values only at 50 m in September (central column of the same figure), and downward and upward velocities mix waters in the 40–200 m layer in the period from August to October, after which we observe a clear vertical mixing due to cooling (top of Fig. S3).
By means of state-of-the-art physical–biogeochemical reanalysis, we investigated the impact of biological processes, circulation structures, and vertical motions on the intensity and depth of the subsurface oxygen maximum (SOM), which is a feature mapped for the first time in the Mediterranean Sea over a period covering the last 20 years. While the Mediterranean Sea reanalysis has been extensively validated in Escudier et al. (2021), for the physical part, and in Cossarini et al. (2021), for the marine biogeochemistry, we reported dedicated evaluations of basin-wide gradients of the oxygen profiles in the epipelagic layer, plus an additional validation of the SOM features (i.e. concentration and depth) and of biological processes of oxygen production and consumption.
The results confirm the good performance of the model in reproducing the oxygen dynamics in the epipelagic layer by comparing model outputs with BGC-Argo float data in the estimation of the SOM concentration and depth (Table 1). Model uncertainty in reproducing the summer SOM concentration is 13 mmol O2 m−3 on average, i.e. 5 % of the mean concentration of the observations across the basin, with the model typically underestimating the concentration with respect to observations (Table 1). The estimation of the SOM depth is instead characterized by a mean error of 13 m, which is comparable to the error associated with DCM recognition (17 m on average; Cossarini et al., 2021) and close to 30 % of the mean SOM depth according to observations (Table 1).
In the upper 80 m depth, the validation procedure for gross primary production (GPP), community respiration (CR), and net community production (NCP), which has been performed here for the first time, also provided some encouraging results (Tables 2–3). While vertical integrated annual NPP (Lazzari et al., 2012; Cossarini et al., 2021) and vertical gradients and seasonal cycles of GPP and CR are well reproduced (Table 2), modelled values of GPP and CR can be 2–4 times lower than in situ estimations (Tables 2 and 3). We expected some discrepancies with in situ measurements since the direct comparison of in situ estimations of fluxes and modelled fluxes might not be straightforward, and some critical issues should be considered (Hipsey et al., 2020).
First, there are different (operative) definitions of community production and respiration according to the in situ estimations and the model. As highlighted by Ducklow and Doney (2013), studies adopting different measurement techniques may provide evaluations of both net autotrophy and heterotrophy for oligotrophic oceans and the dark-light method used in the observations considered in this work has proven to lead to GPP estimates that are on average 2–7 times higher than those yielded from methods based on 14C or active fluorescence on the global scale (Regaudie et al., 2014). Moreover, while in situ CR estimations are derived by 24 h dark incubation, the BFM model computes oxygen consumption as the timeless sum of the respiration and chemical processes during a daily day/night cycle. Additionally, model processes are formulated by using parameters whose values cannot always be calibrated on the basis of observations or that can lack in standardization procedures. For example, in the BFM, the model production and loss terms are computed in carbon and converted into oxygen using the ratio O2 : C = 1, which is strictly valid for carbohydrates (Fraga et al., 1998). Other studies (e.g. Coppola et al., 2018; Sisma-Ventura et al., 2021) adopt the classic value of 1.3 (Redfield et al., 1963) or later modifications (e.g. 1.34 as in Körtzinger et al., 2001; Kralj et al., 2019). Thus, by adopting a higher O2 : C value, the oxygen production and consumption terms would increase by 30 % without changing the other biogeochemical dynamics (e.g. net integrated primary production).
Second, there is a representativeness error (e.g. Schutgens et al., 2017) associated with the spatial and temporal sampling, since local and time-specific incubation estimations from in situ sampling are compared with the model output where processes are filtered and averaged by the spatial resolution and temporal parameterization.
Thus, when a spatial or temporal mismatch of production and consumption occurs, the importance of the biological processes might have been underestimated in the present work. In this sense, the model underestimation of deep respiration (i.e. 90–130 m) may be one of the causes of the overestimation of oxygen below 100 m that has already been discussed (Cossarini et al., 2021).
By investigating the mean oxygen variability estimated from the 1999–2019 Mediterranean reanalysis, we found that in the epipelagic layer of the basin, 97 % of the total oxygen consumption is due to plankton respiration; i.e. the contribution of nitrification and reoxidation processes in CR is negligible (Fig. 5). The higher biological activity of the western Mediterranean Sea, which was recorded by GPP and CR values that were higher than the eastern Mediterranean, was expected based on numerous studies of Mediterranean productivity and the trophic state (e.g. D'Ortenzio and Ribera d'Alcalà, 2009; Lavigne et al., 2015; Lazzari et al., 2012; von Schuckmann et al., 2020; Siokou-Frangou et al., 2010; Teruzzi et al., 2021b). As assumed for the global ocean by Najjar and Keeling (1997), our results show the consistency between the general deepening of the compensation depth (Fig. 5) and the deepening of the euphotic layer in the eastern Mediterranean (displayed in Fig. S1 and reported in Lamy et al., 2011, and von Schuckmann et al., 2020).
The seasonal cycle of oxygen saturation in the western and eastern subbasins depends mainly on the cycle of the surface temperature and its well-known increasing west–east gradient in the basin (Escudier et al., 2021). Despite the net biological production at the surface in winter and autumn (Fig. 5), we observe a winter decrease in the oxygen concentration with respect to the saturation (Fig. A1) due to physical processes, which both increase solubility by cooling and dilute surface oxygen by downward mixing (e.g. Coppola et al., 2018). In particular, the oxygen temporal evolution in the deep convection areas, which exhibit the highest deviations with respect to the saturation values (i.e. down to 84 % saturation in the nwm subbasin in 2005, shown in the top box in Fig. A1), is in line with findings by Ulses et al. (2021). The spring and summer biological production at the surface (Fig. 5), despite the lower values with respect to those in winter, are instead responsible for the supersaturated values (Fig. A1), along with the limited downward mixing associated with stratification (Copin-Montégut and Bégovic, 2002).
Given the good reanalysis results, we focused our study on the subsurface oxygen maximum, which is a common feature in oligotrophic stratified seas in summer (Smyth et al., 2017; Yasunaka et al., 2022). In the Mediterranean Sea, the summer SOM is a feature that is clearly recognizable in the whole basin (Fig. 6), except in some areas of the northern Aegean Sea. Our analyses (Fig. 6a–b) show that the SOM has a large spatial heterogeneity across the Mediterranean, with the presence of mesoscale structures that allow it to reconcile the sparse and local published observations into a basin-scale view. In particular, our results confirm the shallow depth of the SOM in the western Mediterranean Sea (20–40 m at the DYFAMED site; Copin-Montégut and Bégovic, 2002) and in the southern Adriatic Sea (30 m; Manca et al., 2004) and a deeper SOM in the eastern Mediterranean Sea (80 m in the southern Levantine Sea; Kress and Herut, 2001; 50–100 m in the Cilician Basin; Fach et al., 2021), as well as its high heterogeneity, such as in the Balearic Sea, due to the high mesoscale dynamics (40–80 m around the Balearic Islands; Balbín et al., 2014). Fig. 6a shows a spatial variability in the SOM concentration between 235 and 255 mmol O2 m−3, confirming previous estimations of lower values in the Levantine Sea (Fach et al., 2021; Kress and Herut, 2001) and higher values in the southern Adriatic Sea (Manca et al., 2004) and northwestern Mediterranean Sea (at the DYFAMED site and close to the Balearic Islands; Balbín et al., 2014; Copin-Montégut and Bégovic, 2002).
Since the SOM concentration and depth display a significant spatial variability on the mesoscale (Fig. 7a–b), we assessed that the reanalysis is able to reproduce the effect of processes down to this scale. Moreover, since the inter-annual variability in summer SOM concentrations and depths (Fig. 6c–d) appears lower than the spatial variability and only sparse and patchy areas display significant trends (Fig. 6e–f), we proposed to analyse 1 single year rather than a temporal average, which would have masked the spatial variability in the processes. We selected 2014 since it was characterized by a lack of strong forcing signals (e.g. deep convection, Margirier et al., 2020), and it can be considered exemplary of the mean regimes of the Mediterranean SOM (Figs. 7 and S2). The multiyear analysis showed that the inter-annual variability in the depth and concentration is quite low (Fig. 6c-d), demonstrating that the SOM is a stationary feature of the oligotrophic Mediterranean Sea. On the other hand, the high spatial heterogeneity of the SOM (Fig. 6a–b) appeared to be linked to the Mediterranean mesoscale variability (e.g. Bonaduce et al., 2021). Thus, the oxygen budget has been reconstructed in retrospect by using the reanalysis output inside five areas (Fig. 6) selected as representatives of different circulation structures and biological regimes (Fig. 7). Since the data assimilation procedure does not directly affect the oxygen dynamics, our computation of the budget includes all terms and is consistent. Moreover, the budget of dissolved oxygen has been computed at the monthly frequency, where the average operation further filtered high-frequency signals due to the internal dynamical adjustment of the model after data assimilation (Cossarini et al., 2019). Although the retrospective computation of the budget entails uncertainties, the physics-related processes were clearly dominant in the oxygen dynamics with respect to biological processes (Fig. 7), except for the most biologically active areas (northwestern Mediterranean areas, A and B in Fig. 6). In particular, our results identified some typical specific features.
-
In the most productive areas (i.e. in the northwestern Mediterranean Sea), the summer SOM is stable and develops at the depth of biological production, which has also been observed by Ulses et al. (2021), in the Gulf of Lion (case A), and Balbín et al. (2014), in the Balearic front (case B);
-
In oligotrophic highly stratified areas (central Ionian Sea, case C), the SOM can be a residual of the subsurface production in spring and is not sustained by an active biological production in summer;
-
In cyclonic gyres (Cretan gyre, case D), the SOM depth is located in the upper part of the biologically productive subsurface layer, since vertical velocities erode its lower limit of extension by mixing with less oxygenated water coming from deeper layers;
-
In areas of subduction (eastern Levantine, case E), the SOM is deep and not connected to local summer production but to downward transport, as in Chen and McKinley (2019).
The SOM is thus a variable that strongly highlights the interactions of oxygen production and respiration with mixing and stratification successions, horizontal and vertical motions, and circulation structures.
When the SOM is analysed together with other indicators (such as the deep chlorophyll maximum), synthetic interpretative schemes of ecosystem functioning can be derived (Smyth et al., 2017). The DCM is a well-studied phenomenology in the Mediterranean Sea, and its variability has been investigated in association with the availability of light and nutrients and phytoplankton photo-acclimation/adaptation (Barbieux et al., 2019): Ionian Sea and Levantine Sea behaviour is similar to a tropical system, with a deep and permanent DCM associated with photo-acclimated/photo-adapted communities, whereas the Gulf of Lion is a typical temperate-like system, with a shallower DCM in summer established after the surface spring bloom, which is in turn favoured by nutrient replenishment via winter mixing (Lazzari et al., 2012; Mayot et al., 2017).
The analysis of the discrepancies between the vertical depths of SOM and DCM (Figs. 8 and S4) detects lower vertical displacements in the western Mediterranean (down to 10 m in the Alboran Sea and northwestern Mediterranean Sea) and higher displacements in the Ionian Sea and Levantine Sea (70 m in large portions of the two subbasins). An increasing difference between DCM and SOM depths across an eastward transect in the Mediterranean Sea has been observed also by Pujo-Pay et al. (2011). Moreover, analogous to Smyth et al. (2017), the two Mediterranean regimes can be assimilated to seasonally stratified midlatitude areas of the Atlantic Ocean and permanently stratified tropical/subtropical areas, where there is a higher productivity above the DCM, despite the lower concentrations of chlorophyll, due to the higher light availability.
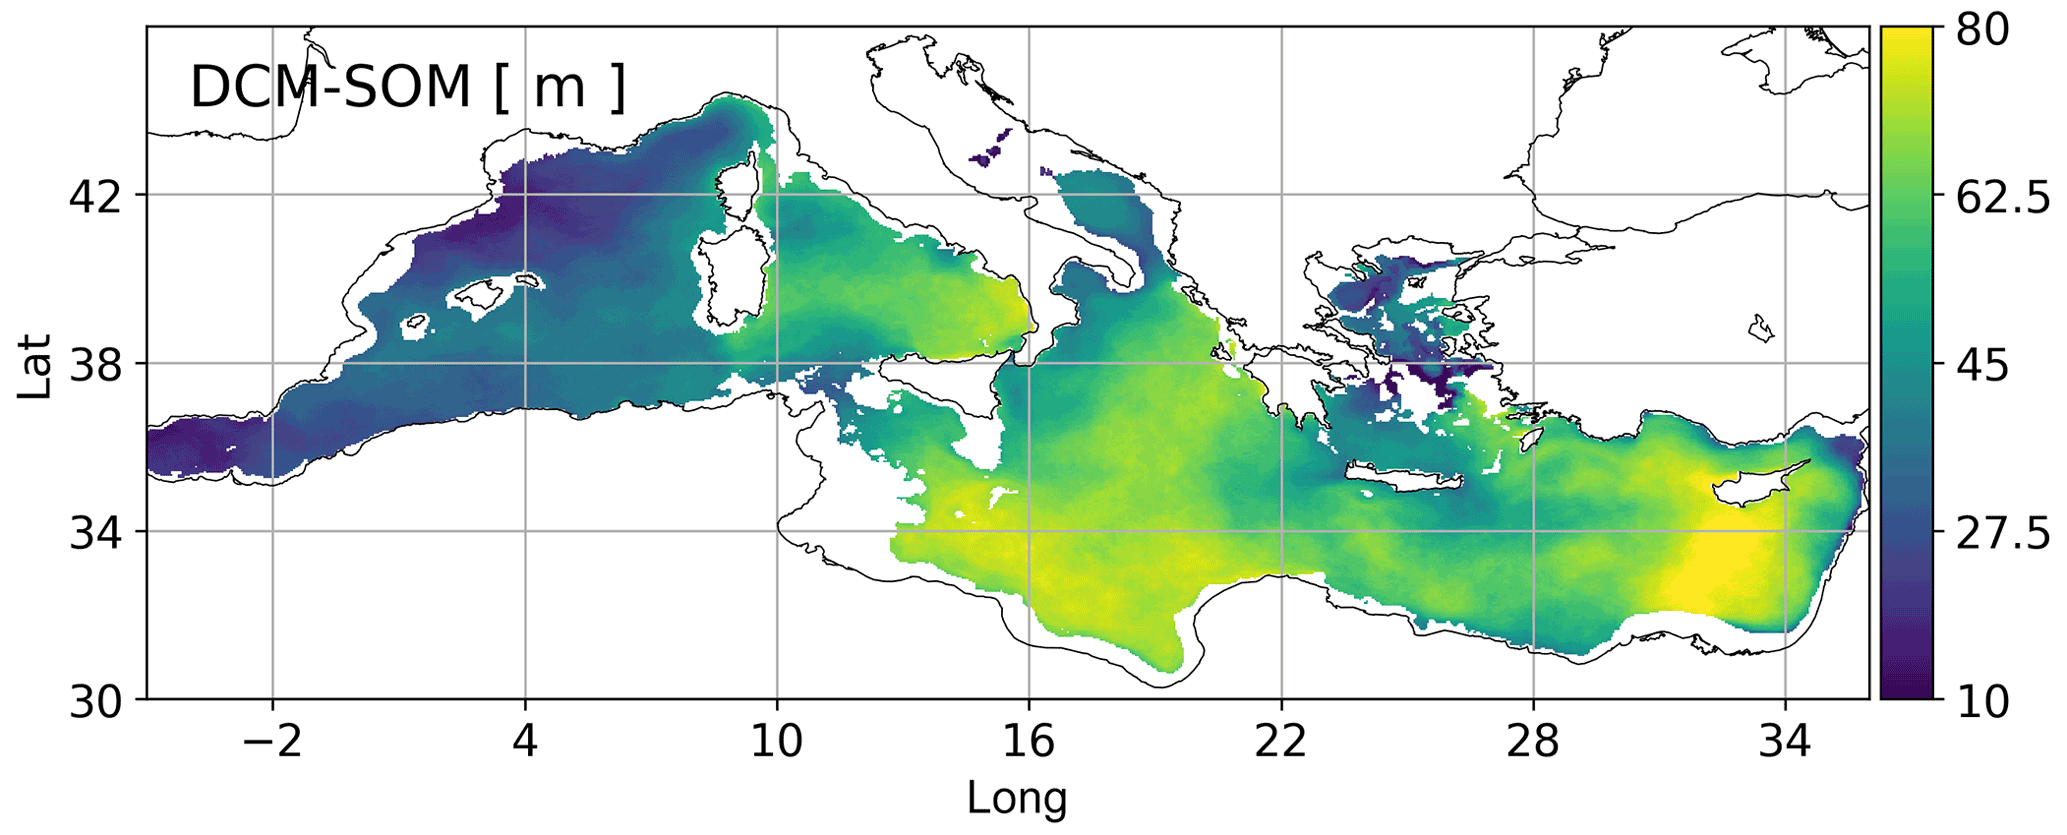
Figure 8Difference between DCM and SOM depths according to the Mediterranean reanalysis in 1999–2019. The DCM was computed by averaging the annual vertical maxima of the mean chlorophyll concentration in the JAS months in 1999–2019. Coastal areas (i.e. with depths shallower than 200 m) are masked.
Moreover, some specific circulation structures appear to strongly differentiate the subsurface dynamics of chlorophyll and oxygen. In particular, the northwestern Mediterranean areas (cases A and B; Fig. 7) are very productive, and in summer the vertical level of their biological oxygen production sustaining SOM is on average 25 m shallower than the DCM (Fig. S4). Our study reveals the existence of additional regimes despite the small size of the basin: the DCM in the central Ionian Sea and eastern Levantine Sea (areas C and E in Fig. 7) is not associated with an actual increase in carbon biomass (as in Barbieux et al., 2019), and the SOM is a residual of the confinement of spring production. While in the open sea the vertical displacement between the SOM and DCM is high (70 m), in the subduction areas within the continental slope of the Levantine Sea (case E; Figs. 7 and S4) it is lower (about 50 m) due to the vertical transport that influences both chlorophyll and oxygen concentrations.
Our results highlight that the analysis of the SOM and its combination with the DCM can provide concise and robust information about physical and biological processes governing the marine ecosystem. In particular, SOM establishment and development also account for mechanisms that do not directly influence phytoplankton dynamics, i.e. air–sea interactions and solubility processes in seawater. This allows us, in principle, to check on changes in the ventilation in the deeper layers and solubility due to global warming; thus, such an indicator would also provide monitoring of the marine ecosystem status from this perspective.
Finally, a model study such as the present one has the added value of estimating biological production via a time derivative (Eq. 3), which lacks possible spurious terms that can instead affect different estimations, e.g. through particulate organic carbon (POC) (Barbieux et al., 2019), and allows us to properly disentangle the physical and biological dynamics of the oxygen concentration.
In this work, we propose the subsurface oxygen maximum (SOM) observed in marine ecosystems as a key variable for describing the interconnections between physics and biology in the marine environment.
The SOM, which has been observed in large areas of the ocean, can be investigated by assessing its drivers in its causes and development and computed in a seamless way up to the basin scale by means of biogeochemical models. Suitable and robust validation procedures for such numerical models can be conducted by using the abundant available datasets of oxygen observations, which have been further enlarged in recent years by the increasing deployment of BGC-Argo floats. In this work, we used the current CMEMS biogeochemical reanalysis for the Mediterranean Sea (Cossarini et al., 2021) at a ∘ horizontal resolution, and we identified the SOM as the maximum of the mean summer profile of the oxygen concentration in the 1999–2019 simulation.
Down to the mesoscale, we highlighted the Mediterranean heterogeneity by recognizing different cases for the SOM in the summer season:
-
relatively high oxygen concentration values (250 mmol O2 m−3) at depths of 30–60 m, which are actively sustained by summer production in the most biologically productive areas (i.e. northwestern Mediterranean areas);
-
intermediate oxygen values (240 mmol O2 m−3) at a depth of 40 m, i.e. in the upper part of a vertical layer hosting summer production and eroded at the bottom by upward low-oxygen waters, in a Levantine cyclonic gyre (i.e. Cretan gyre);
-
intermediate oxygen values at a depth of 50 m, as a residual of subsurface oxygen produced in spring in the central Ionian Sea;
-
low oxygen values (230 mmol O2 m−3) at a depth of 100 m due to downward transport in a subduction area (i.e. eastern Levantine Sea).
In the ecological modelling community, the DCM is a metric that is already in use for displaying the interplay of physical and biological processes in the ocean. However, we showed that SOM and DCM phenomenologies across the Mediterranean Sea are different, especially in the eastern subbasin, and we interpreted their differences in association with the different physical and biological processes occurring in the considered areas. We suggest that adopting the SOM as a further emerging property at the basin scale would allow it to account more directly for processes involving the atmosphere (i.e. air–sea interactions) and the change in sea surface temperature and salinity (i.e. solubility) and to monitor ecosystem functioning and health, also in connection with climate change indicators.
Figure A1 shows the seasonal cycle of the model-derived surface oxygen concentration that accounts for both biological processes (Fig. 5) and physical ones, i.e. air–sea interactions (Eqs. 1 and 2) and mixing and stratification processes.
The surface oxygen generally follows the cycle of oxygen saturation, with higher values in the western subbasins (the seasonal range is approximately equal to 210–255 mmol O2 m−3) compared to the eastern subbasins (200–245 mmol O2 m−3) due to the increasing west–east temperature gradient across the Mediterranean Sea (Escudier et al., 2021). Undersaturated values in winter and autumn indicate that the oxygen production identified by the positive NCP values in Fig. 5 (equal to approximately 0.76 and 0.25 mmol O2 m−3 d−1 at the surface in the western and eastern Med in winter) is actually less relevant with respect to the effect of cooling (which increases the oxygen solubility) and mixing with deeper waters and/or convection events, which are known drivers for the undersaturated surface waters in these seasons (e.g. Copin-Montégut and Bégovic, 2002; Coppola et al., 2018). In particular, the winter deviation from the oxygen saturation and the inter-annual variability in the nwm subbasin are much higher than those exhibited by the other subbasins (Fig. A1), given the impact of some deep convection events that occurred in the area in some years (e.g. 2005, 2013; Smith et al., 2008; Waldman et al., 2016). In particular, the decrease in surface oxygen can reach 16 % with respect to the mean climatological value (box on top of Fig. A1). On the other hand, in both the western and eastern subbasins, we observe supersaturated waters at the surface in the spring–early summer (Fig. A1) despite NCP estimations being lower than the corresponding winter values (Fig. 5).
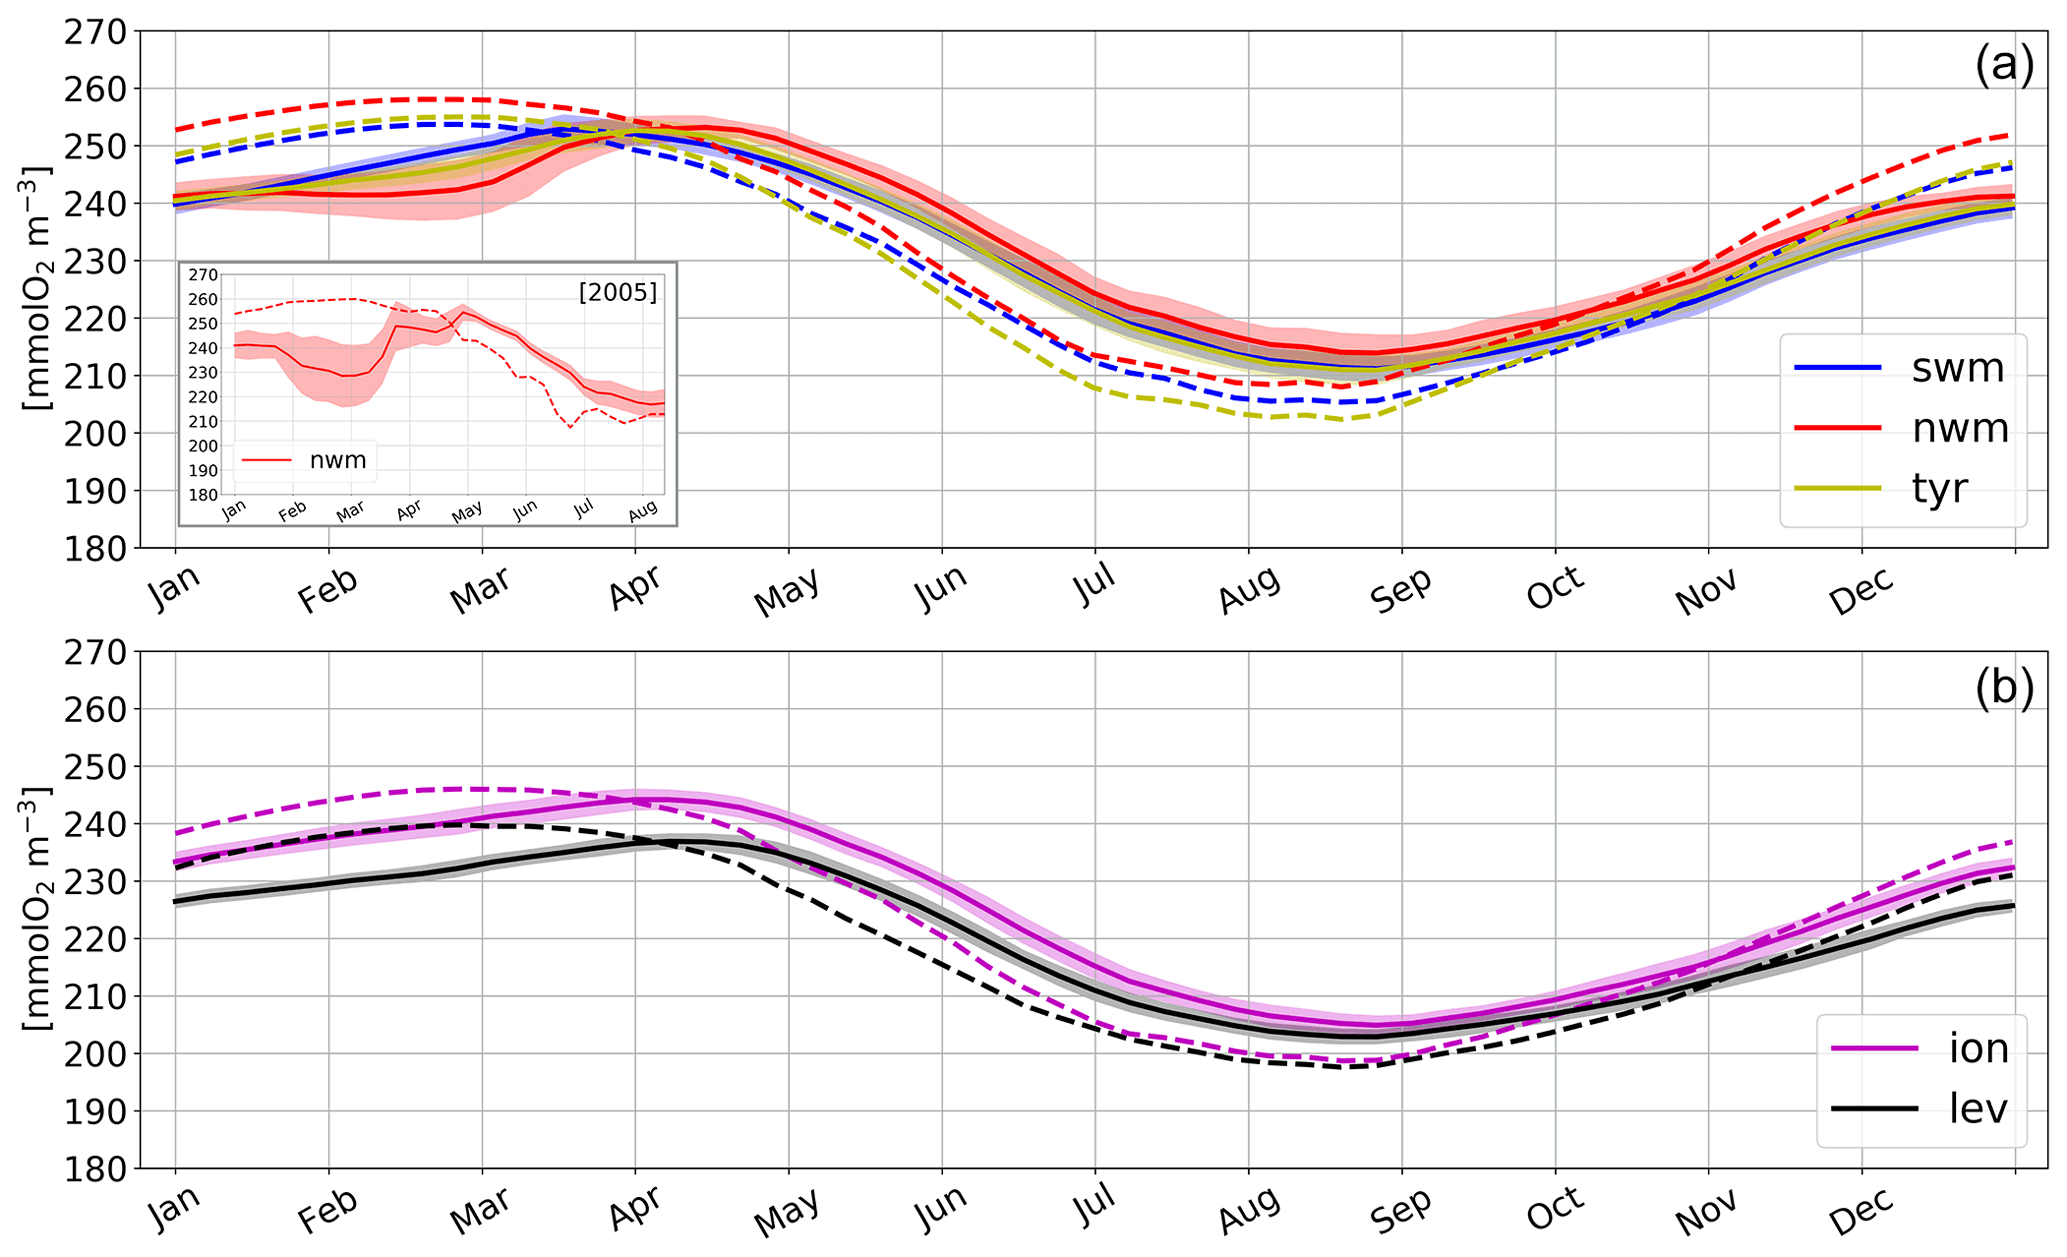
Figure A1Modelled oxygen concentration (solid lines) and oxygen saturation (dashed lines) at the surface in selected open-sea aggregated subbasins in the western (a) and eastern (b) Mediterranean Sea, computed over the climatological year (i.e. by temporally averaging values over the 1999–2019 period). Shaded bands represent the temporal variability in surface oxygen computed as the standard deviation of annual means. The box in the top panel represents the modelled oxygen and its saturation at the surface in the nwm subbasin in 2005, with shaded bands representing the spatial variability in surface oxygen within the subbasin.
Publicly available datasets were analysed in this study. Modelling data can be found at the Copernicus Marine Service: https://doi.org/10.25423/CMCC/MEDSEA_MULTIYEAR_BGC_006_008_MEDBFM3 (Teruzzi et al., 2021a).
The supplement related to this article is available online at: https://doi.org/10.5194/bg-19-5553-2022-supplement.
VDB and GC conceived the study. VDB and LF conducted the analysis. VDB and GC wrote the first draft. GC and SS supervised the study. All the authors discussed and reviewed the submitted manuscript.
The contact author has declared that none of the authors has any competing interests.
Publisher’s note: Copernicus Publications remains neutral with regard to jurisdictional claims in published maps and institutional affiliations.
This study has been conducted using EU Copernicus Marine Service.
This study was supported by CMEMS Med-MFC (Copernicus Marine Environment Monitoring Service Mediterranean Marine Forecasting Centre).
This paper was edited by Yuan Shen and reviewed by two anonymous referees.
Amores, A., Jordà, G., and Monserrat, S.: Ocean Eddies in the Mediterranean Sea From Satellite Altimetry: Sensitivity to Satellite Track Location, Front. Mar. Sci., 6, 703, https://doi.org/10.3389/fmars.2019.00703, 2019.
Antoine, D., André, J., and Morel, A.: Oceanic primary production: 2. Estimation at global scale from satellite (coastal zone color scanner) chlorophyll, Global Biogeochem. Cy., 10, 57–69, 1996.
Bailey, K., Steinberg, C., Davies, C., Galibert, G., Hidas, M., McManus, M. A., Murphy, T., Newton, J., Roughan, M., and Schaeffer, A.: Coastal mooring observing networks and their data products: recommendations for the next decade, Front. Mar. Sci., 6, 180, https://doi.org/10.3389/fmars.2019.00180, 2019.
Balbín, R., López-Jurado, J. L., Aparicio-González, A., and Serra, M.: Seasonal and interannual variability of dissolved oxygen around the Balearic Islands from hydrographic data, J. Marine Syst., 138, 51–62, https://doi.org/10.1016/j.jmarsys.2013.12.007, 2014.
Barbieux, M., Uitz, J., Gentili, B., Pasqueron de Fommervault, O., Mignot, A., Poteau, A., Schmechtig, C., Taillandier, V., Leymarie, E., Penkerc'h, C., D'Ortenzio, F., Claustre, H., and Bricaud, A.: Bio-optical characterization of subsurface chlorophyll maxima in the Mediterranean Sea from a Biogeochemical-Argo float database, Biogeosciences, 16, 1321–1342, https://doi.org/10.5194/bg-16-1321-2019, 2019.
Behrenfeld, M. J., Randerson, J. T., McClain, C. R., Feldman, G. C., Los, S. O., Tucker, C. J., Falkowski, P. G., Field, C. B., Frouin, R., Esaias, W. E., Kolber, D. D., and Pollack, N. H.: Biospheric primary production during an ENSO transition, Science, 291, 2594–2597, https://doi.org/10.1126/science.1055071, 2001.
Bollmann, M., Bosch, T., Colijn, F., et al.: World Ocean Review: Living with the Oceans, Hamburg, Maribus GmbH, http://hdl.handle.net/1834/31403 (last access: 29 November 2022), 2010.
Bonaduce, A., Cipollone, A., Johannessen, J. A., Staneva, J., Raj, R. P., and Aydogdu, A.: Ocean Mesoscale Variability: A Case Study on the Mediterranean Sea From a Re-Analysis Perspective, Front. Earth Sci., 9, 724879, https://doi.org/10.3389/feart.2021.724879, 2021.
Bopp, L., Resplandy, L., Orr, J. C., Doney, S. C., Dunne, J. P., Gehlen, M., Halloran, P., Heinze, C., Ilyina, T., Séférian, R., Tjiputra, J., and Vichi, M.: Multiple stressors of ocean ecosystems in the 21st century: projections with CMIP5 models, Biogeosciences, 10, 6225–6245, https://doi.org/10.5194/bg-10-6225-2013, 2013.
Buga, L., Sarbu, G., Fryberg, L., Magnus, W., Wesslander, K., and Gatti, J.: EMODnet Thematic Lot no. 4/SI2. 749773 EMODnet Chemistry Eutrophication and Acidity Aggregated Datasets, Vol. 2018, https://doi.org/10.6092/EC8207EF-ED81-4EE5-BF48-E26FF16BF02E, 2018.
Capuzzo, E., Lynam, C. P., Barry, J., Stephens, D., Forster, R. M., Greenwood, N., McQuatters-Gollop, A., Silva, T., van Leeuwen, S. M., and Engelhard, G. H.: A decline in primary production in the North Sea over 25 years, associated with reductions in zooplankton abundance and fish stock recruitment, Glob. Change Biol., 24, e352–e364, https://doi.org/10.1111/gcb.13916, 2018.
Chen, H. and McKinley, G. A.: Isopycnal processes allow for summertime heterotrophy despite net oxygen accumulation in the lower euphotic zone of the western North Atlantic subtropical gyre, Global Biogeochem. Cy., 33, 795–809, 2019.
Claustre, H., Johnson, K. S., and Takeshita, Y.: Observing the global ocean with biogeochemical-Argo, Annu. Rev. Mar. Sci., 12, 23–48, 2020.
Colella, S., Brando, V. E., Di Cicco, A., D'Alimonte, D., Forneris, V., Bracaglia, M.: Quality Information Document for the OCEAN COLOUR PRODUCTION CENTRE – Ocean Colour Mediterranean and Black Sea Observation Product, Copernicus Monitoring Environment Marine Service (CMEMS) [data set], https://doi.org/10.48670/moi-00299, 2021.
Copin-Montégut, C. and Bégovic, M.: Distributions of carbonate properties and oxygen along the water column (0–2000 m) in the central part of the NW Mediterranean Sea (dyfamed site): Influence of winter vertical mixing on air-sea CO2 and O2 exchanges, Deep-Sea Res. Pt. II, 49, 2049–2066, https://doi.org/10.1016/S0967-0645(02)00027-9, 2002.
Coppola, L., Legendre, L., Lefevre, D., Prieur, L., Taillandier, V., and Diamond Riquier, E.: Seasonal and inter-annual variations of dissolved oxygen in the northwestern Mediterranean Sea (DYFAMED site), Prog. Oceanogr., 162, 187–201, https://doi.org/10.1016/j.pocean.2018.03.001, 2018.
Cossarini, G., Lazzari, P., and Solidoro, C.: Spatiotemporal variability of alkalinity in the Mediterranean Sea, Biogeosciences, 12, 1647–1658, https://doi.org/10.5194/bg-12-1647-2015, 2015.
Cossarini G., Mariotti, L., Feudale, L., Mignot, A., Salon, S., Taillandier, V., Teruzzi, A., and d'Ortenzio, F.: Towards operational 3D-Var assimilation of chlorophyll Biogeochemical-Argo float data into a biogeochemical model of the Mediterranean Sea, Ocean Model., 133, 112–128, 2019.
Cossarini, G., Feudale, L., Teruzzi, A., Bolzon, G., Coidessa, G., Solidoro, C., Di Biagio, V., Amadio, C., Lazzari, P., Brosich, A., and Salon, S.: High-Resolution Reanalysis of the Mediterranean Sea Biogeochemistry (1999–2019), Front. Mar. Sci., 8, 1537, https://doi.org/10.3389/fmars.2021.741486, 2021.
D'Ortenzio, F. and Ribera d'Alcalà, M.: On the trophic regimes of the Mediterranean Sea: a satellite analysis, Biogeosciences, 6, 139–148, https://doi.org/10.5194/bg-6-139-2009, 2009.
Ducklow, H. W. and Doney, S. C.: What Is the Metabolic State of the Oligotrophic Ocean? A Debate, Annu. Rev. Mar. Sci., 5, 525–533, https://doi.org/10.1146/annurev-marine-121211-172331, 2013.
Escudier, R., Clementi, E., Cipollone, A., Pistoia, J., Drudi, M., Grandi, A., Lyubartsev, V., Lecci, R., Aydogdu, A., Delrosso, D., Omar, M., Masina, S., Coppini, G., and Pinardi, N.: A High Resolution Reanalysis for the Mediterranean Sea, Front. Earth Sci., 9, 702285, https://doi.org/10.3389/feart.2021.702285, 2021.
Fach, B. A., Orek, H., Yilmaz, E., Tezcan, D., Salihoglu, I., Salihoglu, B., and Latif, M. A.: Water Mass Variability and Levantine Intermediate Water Formation in the Eastern Mediterranean Between 2015 and 2017, J. Geophys. Res.-Oceans, 126, e2020JC016472, https://doi.org/10.1029/2020JC016472, 2021.
Field, C. B., Behrenfeld, M. J., Randerson, J. T., and Falkowski, P.: Primary production of the biosphere: Integrating terrestrial and oceanic components, Science, 281, 237–240, https://doi.org/10.1126/science.281.5374.237, 1998.
Fraga, F., Ríos, A. F., Pérez, F. F., and Figueiras, F. G.: Theoretical limits of oxygen:carbon and oxygen : nitrogen ratios during photosynthesis and mineralisation of organic matter in the sea, Sci. Mar., 62, 161–168, https://doi.org/10.3989/scimar.1998.62n1-2161, 1998.
Fujiki, T., Inoue, R., Honda, M. C., Wakita, M., Mino, Y., Sukigara, C., and Abe, O.: Time-series observations of photosynthetic oxygen production in the subtropical western North Pacific by an underwater profiling buoy system, Limnol. Oceanogr., 65, 1072–1084, 2020.
Furuya, K.: Subsurface chlorophyll maximum in the tropical and subtropical western Pacific Ocean: Vertical profiles of phytoplankton biomass and its relationship with chlorophylla and particulate organic carbon, Mar. Biol., 107, 529–539, 1990.
Garcia, H. E. and Gordon, L. I.: Oxygen solubility in seawater: Better fitting equations, Limnol. Oceanogr., 37, 1307–1312, https://doi.org/10.4319/lo.1992.37.6.1307, 1992.
Garcia, H. E., Weathers, K., Paver, C. R., Smolyar, I., Boyer, T. P., Locarnini, R. A., Zweng, M. M., Mishonov, A. V., Baranova, O. K., Seidov, D. and Reagan J. R.: World Ocean Atlas 2018, Volume 3: Dissolved Oxygen, Apparent Oxygen Utilization, and Oxygen Saturation, A. Mishonov Technical Ed., NOAA Atlas NESDIS 83, 38 pp., 2018.
Gazeau, F., Van Wambeke, F., Marañón, E., Pérez-Lorenzo, M., Alliouane, S., Stolpe, C., Blasco, T., Leblond, N., Zäncker, B., Engel, A., Marie, B., Dinasquet, J., and Guieu, C.: Impact of dust addition on the metabolism of Mediterranean plankton communities and carbon export under present and future conditions of pH and temperature, Biogeosciences, 18, 5423–5446, https://doi.org/10.5194/bg-18-5423-2021, 2021.
Giorgi, F.: Climate change hot-spots, Geophys. Res. Lett., 33, L08707, https://doi.org/10.1029/2006GL025734, 2006.
González, N., Gattuso, J. P., and Middelburg, J. J.: Oxygen production and carbon fixation in oligotrophic coastal bays and the relationship with gross and net primary production, Aquat. Microb. Ecol., 52, 119–130, https://doi.org/10.3354/ame01208, 2008.
Haskell II, W. Z., Prokopenko, M. G., Stanley, R. H. R., and Knapp, A. N.: Estimates of vertical turbulent mixing used to determine a vertical gradient in net and gross oxygen production in the oligotrophic South Pacific Gyre, Geophys. Res. Lett., 43, 7590–7599, https://doi.org/10.1002/2016GL069523, 2016.
Hipsey, M. R., Gal, G., Arhonditsis, G. B., Carey, C. C., Elliott, J. A., Frassl, M. A., Janse, J. H., de Mora, L., and Robson, B. J.: A system of metrics for the assessment and improvement of aquatic ecosystem models, Environ. Model. Softw., 128, 104697, https://doi.org/10.1016/j.envsoft.2020.104697, 2020.
Karstensen, J., Stramma, L., and Visbeck, M.: Oxygen minimum zones in the eastern tropical Atlantic and Pacific oceans, Prog. Oceanogr., 77, 331–350, 2008.
Key, R. M., Olsen, A., van Heuven, S., Lauvset, S. K., Velo, A., Lin, X., Schirnick, C., Kozyr, A., Tanhua, T., Hoppema, M., Jutterström, S., Steinfeldt, R., Jeansson, E., Ishi, M., Pérez, F. F., and Suzuki, T.: Global Ocean Data Analysis Project, Version 2 (GLODAPv2), ORNL/CDIAC-162, NDP-093, Carbon Dioxide Information Analysis Center, Oak Ridge National Laboratory, US Department of Energy, Oak Ridge, Tennessee, https://epic.awi.de/id/eprint/39306/ (last access: 2 December 2022), 2015.
Körtzinger, A., Hedges, J. I., and Quay, P. D.: Redfield ratios revisited: Removing the biasing effect of anthropogenic CO2, Limnol. Oceanogr., 46, 964–970, https://doi.org/10.4319/lo.2001.46.4.0964, 2001.
Kralj, M., Lipizer, M., Čermelj, B., Celio, M., Fabbro, C., Brunetti, F., Francé, J., Mozetič, P., and Giani, M.: Hypoxia and dissolved oxygen trends in the northeastern Adriatic Sea (Gulf of Trieste), Deep-Sea Res. Pt. II, 164, 74–88, https://doi.org/10.1016/j.dsr2.2019.06.002, 2019.
Kress, N. and Herut, B.: Spatial and seasonal evolution of dissolved oxygen and nutrients in the Southern Levantine Basin (Eastern Mediterranean Sea): chemical characterization of the water masses and inferences on the N : P ratios, Deep-Sea Res. Pt. I, 48, 2347–2372, https://doi.org/10.1016/S0967-0637(01)00022-X, 2001.
Kwiatkowski, L., Torres, O., Bopp, L., Aumont, O., Chamberlain, M., Christian, J. R., Dunne, J. P., Gehlen, M., Ilyina, T., John, J. G., Lenton, A., Li, H., Lovenduski, N. S., Orr, J. C., Palmieri, J., Santana-Falcón, Y., Schwinger, J., Séférian, R., Stock, C. A., Tagliabue, A., Takano, Y., Tjiputra, J., Toyama, K., Tsujino, H., Watanabe, M., Yamamoto, A., Yool, A., and Ziehn, T.: Twenty-first century ocean warming, acidification, deoxygenation, and upper-ocean nutrient and primary production decline from CMIP6 model projections, Biogeosciences, 17, 3439–3470, https://doi.org/10.5194/bg-17-3439-2020, 2020.
Lagaria, A., Psarra, S., Lefèvre, D., Van Wambeke, F., Courties, C., Pujo-Pay, M., Oriol, L., Tanaka, T., and Christaki, U.: The effects of nutrient additions on particulate and dissolved primary production and metabolic state in surface waters of three Mediterranean eddies, Biogeosciences, 8, 2595–2607, https://doi.org/10.5194/bg-8-2595-2011, 2011.
Lamy, D., Jeanthon, C., Cottrell, M. T., Kirchman, D. L., Van Wambeke, F., Ras, J., Dahan, O., Pujo-Pay, M., Oriol, L., Bariat, L., Catala, P., Cornet-Barthaux, V., and Lebaron, P.: Ecology of aerobic anoxygenic phototrophic bacteria along an oligotrophic gradient in the Mediterranean Sea, Biogeosciences, 8, 973–985, https://doi.org/10.5194/bg-8-973-2011, 2011.
Lavigne, H., D'Ortenzio, F., Ribera D'Alcalà, M., Claustre, H., Sauzède, R., and Gacic, M.: On the vertical distribution of the chlorophyll a concentration in the Mediterranean Sea: a basin-scale and seasonal approach, Biogeosciences, 12, 5021–5039, https://doi.org/10.5194/bg-12-5021-2015, 2015.
Lazzari, P., Solidoro, C., Ibello, V., Salon, S., Teruzzi, A., Béranger, K., Colella, S., and Crise, A.: Seasonal and inter-annual variability of plankton chlorophyll and primary production in the Mediterranean Sea: a modelling approach, Biogeosciences, 9, 217–233, https://doi.org/10.5194/bg-9-217-2012, 2012.
Lazzari, P., Solidoro, C., Salon, S., and Bolzon, G.: Spatial variability of phosphate and nitrate in the Mediterranean Sea: A modeling approach, Deep-Sea Res. Pt. I, 108, 39–52, https://doi.org/10.1016/j.dsr.2015.12.006, 2016.
Lemee, R., Gattuso, J.-P., and Marty, J.-C.: Bacterial production and respiration measured on water bottle samples at time series station DYFAMED, PANGAEA [data set], https://doi.org/10.1594/PANGAEA.803612, 2012.
Li, P. and Tanhua, T.: Recent Changes in Deep Ventilation of the Mediterranean Sea; Evidence From Long-Term Transient Tracer Observations, Front. Mar. Sci., 7, 1–23, https://doi.org/10.3389/fmars.2020.00594, 2020.
Malanotte-Rizzoli, P. and Eremeev, V. N. (Eds.): The Eastern Mediterranean as a laboratory basin for the assessment of contrasting ecosystems, Springer Science & Business Media, https://doi.org/10.1007/978-94-011-4796-5, 1999.
Manca, B., Burca, M., Giorgetti, A., Coatanoan, C., Garcia, M.-J., and Iona, A.: Physical and biochemical averaged vertical profiles in the Mediterranean regions: an important tool to trace the climatology of water masses and to validate incoming data from operational oceanography, J. Marine Syst., 48, 83–116, https://doi.org/10.1016/j.jmarsys.2003.11.025, 2004.
Margirier, F., P. Testor, E. Heslop, K. Mallil, A. Bosse, L. Houpert, L. Mortier, M.-N. Bouin, L. Coppola, F. D'Ortenzio, X. Durrieu de Madron, B. Mourre, L. Prieur, P. Raimbault et V. Taillandier: Abrupt warming and salinification of intermediate waters interplays with decline of deep convection in the Northwestern Mediterranean Sea, Sci. Rep.-UK, 10, 1–11, https://doi.org/10.1038/s41598-020-77859-5, 2020.
Martz, T. R., Johnson, K. S., and Riser, S. C.: Ocean metabolism observed with oxygen sensors on profiling floats in the South Pacific, Limnol. Oceanogr., 53, 2094–2111, 2008.
Mathew, T., Prakash, S., Shenoy, L., Chatterjee, A., Bhaskar, T. V. S. U., and Wojtasiewicz, B.: Observed variability of monsoon blooms in the north-central Arabian Sea and its implication on oxygen concentration: A bio-argo study, Deep-Sea Res. Pt. II, 184, 104935, https://doi.org/10.1016/j.dsr2.2021.104935, 2021.
Mavropoulou, A. M., Vervatis, V., and Sofianos, S.: Dissolved oxygen variability in the Mediterranean Sea, J. Marine Syst., 208, 103348, https://doi.org/10.1016/j.jmarsys.2020.103348, 2020.
Mayot, N., D'Ortenzio, F., Taillandier, V., Prieur, L., de Fommervault, O. P., Claustre, H., Bosse, A., Testor, P., and Conan, P.: Physical and Biogeochemical Controls of the Phytoplankton Blooms in North Western Mediterranean Sea: A Multiplatform Approach Over a Complete Annual Cycle (2012–2013 DEWEX Experiment), J. Geophys. Res.-Oceans, 122, 9999–10019, https://doi.org/10.1002/2016JC012052, 2017.
Menna, M., Gačić, M., Martellucci, R., Notarstefano, G., Fedele, G., Mauri, E., Gerin, R., and Poulain, P.-M.: Climatic, Decadal, and Interannual Variability in the Upper Layer of the Mediterranean Sea Using Remotely Sensed and In-Situ Data, Remote Sensing, 14, 1322, https://doi.org/10.3390/rs14061322, 2022.
Mignot, A., Claustre, H., Uitz, J., Poteau, A., d'Ortenzio, F., and Xing, X.: Understanding the seasonal dynamics of phytoplankton biomass and the deep chlorophyll maximum in oligotrophic environments: A Bio-Argo float investigation, Global Biogeochem. Cy., 28, 856–876, 2014.
Najjar, R. G. and Keeling, R. F.: Analysis of the mean annual cycle of the dissolved oxygen anomaly in the World Ocean, J. Mar. Res., 55, 117–151, https://doi.org/10.1357/0022240973224481, 1997.
Osman, M. B., Das, S. B., Trusel, L. D., Evans, M. J., Fischer, H., Grieman, M. M., Kipfstuhl, S., McConnell, J. R., and Saltzman, E. S.: Industrial-era decline in subarctic Atlantic productivity, Nature, 569, 551–555, https://doi.org/10.1038/s41586-019-1181-8, 2019.
Peña, M. A., Katsev, S., Oguz, T., and Gilbert, D.: Modeling dissolved oxygen dynamics and hypoxia, Biogeosciences, 7, 933–957, https://doi.org/10.5194/bg-7-933-2010, 2010.
Pinardi, N., Zavatarelli, M., Adani, M., Coppini, G., Fratianni, C., Oddo, P., Simoncelli, S., Tonani, M., Lyubartsev, V., Dobricic, S., and Bonaduce, A.: Mediterranean Sea large-scale low-frequency ocean variability and water mass formation rates from 1987 to 2007: A retrospective analysis, Prog. Oceanogr., 132, 318–332, 2015.
Planton, S., Artale, V., Aznar, R., Carrillo, A., Colin, J., Congedi, L., Dubois C., Elizalde, A., Gualdi, S., Hertig, E., Jacobeit, J., Jordà, G., Li, L., Mariotti, A., Piani, C., Ruti, P., Sanchez-Gomez, E., Sannino, G., Sevault, F., Somot, S., and Tsimplis, M.: 8 – the climate of the Mediterranean region in future climate projections, The Climate of the Mediterranean Region, 449–502, https://doi.org/10.1016/B978-0-12-416042-2.00008-2, 2012.
Polovina, J. J., Howell, E. A., and Abecassis, M.: Ocean's least productive waters are expanding, Geophys. Res. Lett., 35, L03618, https://doi.org/10.1029/2007GL031745, 2008.
Powley, H. R., Krom, M. D., and Van Cappellen, P.: Circulation and oxygen cycling in the Mediterranean Sea: Sensitivity to future climate change, J. Geophys. Res.-Oceans, 121, 8230–8247, 2016.
Pujo-Pay, M., Conan, P., Oriol, L., Cornet-Barthaux, V., Falco, C., Ghiglione, J.-F., Goyet, C., Moutin, T., and Prieur, L.: Integrated survey of elemental stoichiometry (C, N, P) from the western to eastern Mediterranean Sea, Biogeosciences, 8, 883–899, https://doi.org/10.5194/bg-8-883-2011, 2011.
Rabalais, N. N., Díaz, R. J., Levin, L. A., Turner, R. E., Gilbert, D., and Zhang, J.: Dynamics and distribution of natural and human-caused hypoxia, Biogeosciences, 7, 585–619, https://doi.org/10.5194/bg-7-585-2010, 2010.
Reale, M., Cossarini, G., Lazzari, P., Lovato, T., Bolzon, G., Masina, S., Solidoro, C., and Salon, S.: Acidification, deoxygenation, and nutrient and biomass declines in a warming Mediterranean Sea, Biogeosciences, 19, 4035–4065, https://doi.org/10.5194/bg-19-4035-2022, 2022.
Redfield, A. C., Ketchum, B. H., and Richards, F. A.: The influence of organisms on the composition of sea-water, in: The Sea, edited by: Hill, M. N., Vol. 2, Interscience Publishers, New York, 26–77, 1963.
Regaudie-de-Gioux, A., Vaquer-Sunyer, R., and Duarte, C. M.: Patterns in planktonic metabolism in the Mediterranean Sea, Biogeosciences, 6, 3081–3089, https://doi.org/10.5194/bg-6-3081-2009, 2009.
Regaudie-de-Gioux, A., Lasternas, S., Agustí, S., and Duarte, C. M.: Comparing marine primary production estimates through different methods and development of conversion equations, Front. Mar. Sci., 1, 19, https://doi.org/10.3389/fmars.2014.00019, 2014.
Richardson, K. and Bendtsen, J.: Photosynthetic oxygen production in a warmer ocean: the Sargasso Sea as a case study, Philos. T. R. Soc. A, 375, 20160329, https://doi.org/10.1098/rsta.2016.0329, 2017.
Riser, S. C. and Johnson, K. S.: Net production of oxygen in the subtropical ocean, Nature, 451, 323–325, https://doi.org/10.1038/nature06441, 2008.
Roxy, M. K., Modi, A., Murtugudde, R., Valsala, V., Panickal, S., Prasanna Kumar, S., Ravichandran, M., Vichi, M., and Lévy, M.: A reduction in marine primary productivity driven by rapid warming over the tropical Indian Ocean, Geophys. Res. Lett., 43, 826–833, https://doi.org/10.1002/2015GL066979, 2016.
Ruiz, S., Pascual, A., Garau, B., Faugère, Y., Alvarez, A., and Tintoré, J.: Mesoscale dynamics of the Balearic Front, integrating glider, ship and satellite data, J. Marine Syst., 78, S3–S16, 2009.
Salon, S., Cossarini, G., Bolzon, G., Feudale, L., Lazzari, P., Teruzzi, A., Solidoro, C., and Crise, A.: Novel metrics based on Biogeochemical Argo data to improve the model uncertainty evaluation of the CMEMS Mediterranean marine ecosystem forecasts, Ocean Sci., 15, 997–1022, https://doi.org/10.5194/os-15-997-2019, 2019.
Schmidtko, S., Stramma, L., and Visbeck, M.: Decline in global oceanic oxygen content during the past five decades, Nature, 542, 335–339, https://doi.org/10.1038/nature21399, 2017.
Schneider, A., Tanhua, T., Roether, W., and Steinfeldt, R.: Changes in ventilation of the Mediterranean Sea during the past 25 year, Ocean Sci., 10, 1–16, https://doi.org/10.5194/os-10-1-2014, 2014.
Schutgens, N., Tsyro, S., Gryspeerdt, E., Goto, D., Weigum, N., Schulz, M., and Stier, P.: On the spatio-temporal representativeness of observations, Atmos. Chem. Phys., 17, 9761–9780, https://doi.org/10.5194/acp-17-9761-2017, 2017.
Sen, P. K.: Estimates of the regression coefficient based on Kendall's tau, J. Am. Stat. Assoc., 63, 1379–1389, https://doi.org/10.1080/01621459.1968.10480934, 1968.
Siokou-Frangou, I., Christaki, U., Mazzocchi, M. G., Montresor, M., Ribera d'Alcalá, M., Vaqué, D., and Zingone, A.: Plankton in the open Mediterranean Sea: a review, Biogeosciences, 7, 1543–1586, https://doi.org/10.5194/bg-7-1543-2010, 2010.
Sisma-Ventura, G., Kress, N., Silverman, J., Gertner, Y., Ozer, T., Biton, E., Lazar, A., Gertman, I., Rahav, E., and Herut, B.: Post-eastern Mediterranean Transient Oxygen Decline in the Deep Waters of the Southeast Mediterranean Sea Supports Weakening of Ventilation Rates, Front. Mar. Sci., 7, 1–10, https://doi.org/10.3389/fmars.2020.598686, 2021.
Smith, R. O., Bryden, H. L., and Stansfield, K.: Observations of new western Mediterranean deep water formation using Argo floats 2004–2006, Ocean Sci., 4, 133–149, https://doi.org/10.5194/os-4-133-2008, 2008.
Smyth, T., Quartly, G., Jackson, T., Tarran, G., Woodward, M., Harris, C., Gallienne, C., Thomas, R., Airs, R., Cummings, D., Brewin, R., Kitidis, V., Stephens, J., Zubkov, M., and Rees, A.: Determining Atlantic Ocean province contrasts and variations, Prog. Oceanogr., 158, 19–40, https://doi.org/10.1016/j.pocean.2016.12.004, 2017.
Stramma, L. and Schmidtko, S.: Global evidence of ocean deoxygenation, in: Ocean Deoxygenation: Everyone's Problem, edited by: Laffoley, D. and Baxter, J., IUCN, 2019.
Tanhua, T., Hainbucher, D., Schroeder, K., Cardin, V., Álvarez, M., and Civitarese, G.: The Mediterranean Sea system: a review and an introduction to the special issue, Ocean Sci., 9, 789–803, https://doi.org/10.5194/os-9-789-2013, 2013.
Teruzzi, A., Dobricic, S., Solidoro, C., and Cossarini, G.: A 3-D variational assimilation scheme in coupled transport-biogeochemical models: Forecast of Mediterranean biogeochemical properties, J. Geophys. Res.-Oceans, 119, 200–217, https://doi.org/10.1002/2013JC009277, 2014.
Teruzzi, A., Bolzon, G., Salon, S., Lazzari, P., Solidoro, C., and Cossarini, G.: Assimilation of coastal and open sea biogeochemical data to improve phytoplankton simulation in the Mediterranean Sea, Ocean Model., 132, 46–60, https://doi.org/10.1016/j.ocemod.2018.09.007, 2018.
Teruzzi, A., Di Biagio, V., Feudale, L., Bolzon, G., Lazzari, P., Salon, S., Coidessa, G., and Cossarini, G.: Mediterranean Sea Biogeochemical Reanalysis (CMEMS MED-Biogeochemistry, MedBFM3 system) (Version 1) Copernicus Monitoring Environment Marine Service (CMEMS) [data set], https://doi.org/10.25423/CMCC/MEDSEA_MULTIYEAR_BGC_006_008_MEDBFM3, 2021a.
Teruzzi, A., Bolzon, G., Feudale, L., and Cossarini, G.: Deep chlorophyll maximum and nutricline in the Mediterranean Sea: emerging properties from a multi-platform assimilated biogeochemical model experiment, Biogeosciences, 18, 6147–6166, https://doi.org/10.5194/bg-18-6147-2021, 2021b.
Testor, P., De Young, B., Rudnick, D. L., Glenn, S., Hayes, D., Lee, C. M., Pattiaratchi, C., Hill, K., Heslop, E., and Turpin, V.: OceanGliders: a component of the integrated GOOS, Front. Mar. Sci., 6, 422, https://doi.org/10.3389/fmars.2019.00422, 2019.
Theil, H.: A rank-invariant method of linear and polynomial regression analysis, 3; confidence regions for the parameters of poly-nomial regression equations, Indagat. Math., 1, 467–482, 1950.
Thierry, V., Bittig, H., Gilbert, D., Kobayashi, T., Kanako, S., and Schmid, C.: Processing Argo oxygen data at the DAC level. Version 2.3.1. Villefranche-sur-Mer, France, IFREMER for Argo Data Management [data set], https://doi.org/10.13155/39795, 2018.
Ulses, C., Estournel, C., Fourrier, M., Coppola, L., Kessouri, F., Lefèvre, D., and Marsaleix, P.: Oxygen budget of the north-western Mediterranean deep- convection region, Biogeosciences, 18, 937–960, https://doi.org/10.5194/bg-18-937-2021, 2021.
Vichi, M., Lovato, T., Butenschön, M., Tedesco, L., Lazzari, P., Cossarini, G., Masina, S., Pinardi, N., Solidoro, C., and Zavatarelli, M.: The Biogeochemical Flux Model (BFM): Equation Description and User Manual, BFM version 5.2, BFM Report series N. 1, Release 1.2, June 2020, Bologna, Italy, 104 pp., http://bfm-community.eu (last access: 29 November 2022), 2020.
von Schuckmann, K., Le Traon, P.-Y., Smith, N., Pascual, A., Djavidnia, S., Gattuso, J.-P., Grégoire, M., Nolan, G., Aaboe, S., Fanjul, E. Á., Aouf, L., Aznar, R., Badewien, T. H., Behrens, A., Berta, M., Bertino, L., Blackford, J., Bolzon, G., Borile, F., Bretagnon, M., Brewin, R. J. W., Canu, D., Cessi, P., Ciavatta, S., Chapron, B., Trang Chau, T. T., Chevallier, F., Chtirkova, B., Ciliberti, S., Clark, J. R., Clementi, E., Combot, C., Comerma, E., Conchon, A., Coppini, G., Corgnati, L., Cossarini, G., Cravatte, S., de Alfonso, M., de Boyer Montégut, C., De Lera Fernández, C., de los Santos, F. J., Denvil-Sommer, A., de Pascual Collar, Á., Dias Nunes, P. A. L., Di Biagio, V., Drudi, M., Embury, O., Falco, P., d'Andon, O. F., Ferrer, L., Ford, D., Freund, H., León, M. G., Sotillo, M. G., García-Valdecasas, J. M., Garnesson, P., Garric, G., Gasparin, F., Gehlen, M., Genua-Olmedo, A., Geyer, G., Ghermandi, A., Good, S. A., Gourrion, J., Greiner, E., Griffa, A., González, M., Griffa, A., Hernández-Carrasco, I., Isoard, S., Kennedy, J. J., Kay, S., Korosov, A., Laanemäe, K., Land, P. E., Lavergne, T., Lazzari, P., Legeais, J.-F., Lemieux, B., Levier, B., Llovel, W., Lyubartsev, V., Le Traon, P.-Y., Lien, V. S., Lima, L., Lorente, P., Mader, J., Magaldi, M. G., Maljutenko, I., Mangin, A., Mantovani, C., Marinova, V., Masina, S., Mauri, E., Meyerjürgens, J., Mignot, A., McEwan, R., Mejia, C., Melet, A., Menna, M., Meyssignac, B., Mouche, A., Mourre, B., Müller, M., Notarstefano G., Orfila A., Pardo, S., Peneva, E., PérezGómez, B., Perruche, C., Peterlin, M., Poulain P.-M., Pinardi, N., Quilfen, Y., Raudsepp, U., Renshaw, R., Révelard, A., Reyes-Reyes, E., Ricker, M., Rodríguez-Rubio, P., Rotllán, P., Royo Gelabert, E., Rubio, A., Ruiz-Parrado, I., Sathyendranath, S., She, J., von Schuckmann, K., Solidoro, C., Stanev, E.V., Staneva, J., Storto, A., Su, J., Tajalli Bakhsh, T., Tilstone, G. H., Tintoré, J., Toledano, C., Tournadre, J., Tranchant, B., Uiboupin, R., Valcarcel, A., Valcheva, N., Verbrugge, N., Vrac, M., Wolff, J.-O., Zambianchi, E., Zielinski, O., Zinck A.-S., and Zunino S.: Copernicus Marine Service Ocean State Report, Issue 4, J. Oper. Oceanogr., 13, S1–S172, https://doi.org/10.1080/1755876X.2020.1785097, 2020.
Waldman, R., Somot, S., Herrmann, M., Testor, P., Estournel, C., Sevault, F., Prieur, L., Mortier, L., Coppola, L., Taillandier, V., Conan, P., and Dausse, D.: Estimating dense water volume and its evolution for the year 2012–2013 in the Northwestern Mediterranean Sea: An observing system simulation experiment approach, J. Geophys. Res.-Oceans, 121, 6696–6716, https://doi.org/10.1002/2016JC011694, 2016.
Wanninkhof, R.: Relationship between wind speed and gas exchange over the ocean revisited, Limnol. Oceanogr.-Meth., 12, 351–362, https://doi.org/10.4319/lom.2014.12.351, 2014.
Yasunaka, S., Ono, T., Sasaoka, K., and Sato, K.: Global distribution and variability of subsurface chlorophyll a concentrations, Ocean Sci., 18, 255–268, https://doi.org/10.5194/os-18-255-2022, 2022.