the Creative Commons Attribution 4.0 License.
the Creative Commons Attribution 4.0 License.
 | 25 Jun 2025
Altered seasonal sensitivity of net ecosystem exchange to controls driven by nutrient balances in a semi-arid savanna
Tarek S. El-Madany
Jacob Nelson
Arnaud Carrara
Gerardo Moreno
Richard Nair
Yunpeng Luo
Anke Hildebrandt
Victor Rolo
Markus Reichstein
Sung-Ching Lee
Semi-arid ecosystems dominate the variability and trend of the terrestrial carbon sink. They are sensitive to environmental changes following anthropogenic influences, such as an altered ratio of nitrogen (N) to phosphorus (P) due to increasing N deposition. Semi-arid savannas with different vegetation compositions have complex carbon flux dynamics, and their responses to environmental change are not yet well understood. We analyzed a long-term (2016–2022/2023) dataset of flux, biometeorological, and vegetation data (satellite and ground measurements) from a manipulated semi-arid savanna to examine how altered nutrient levels and stoichiometric balance affect the seasonal sensitivity of net ecosystem exchange (NEE) to its drivers. We used singular spectrum analysis to extract the seasonal signals of all variables and assessed the key drivers of NEE over the study period as a whole and in different seasons, using Pearson correlation and information theory. We found that the addition of both N and N + P to the ecosystem increased seasonal NEE variability, driven by greenness of the herbaceous layer. Analyzing 7 years of combined data, we found that the water limitation in summer and the energy limitation in winter outcompeted the fertilization effect. We learned that the effects of nutrient addition on NEE–control relationships became clearer through analyzing different phenological seasons. In the summer, N + P addition led to a potential change in species composition and productivity, resulting in a stronger interaction between the herbaceous layer and NEE. During the transitional seasons (i.e., drydown and autumn), which mark the senescence and regreening of the herbaceous layer, we found NEE to be less sensitive towards meteorological drivers like relative humidity, radiation, and air temperature with N addition. In the future, the increasing NEE variability might become even more pronounced with increasing N deposition and a changing climate.
- Article
(4731 KB) - Full-text XML
-
Supplement
(854 KB) - BibTeX
- EndNote


Terrestrial ecosystems play a major role in the global carbon cycle, with the ability to store significant amounts of carbon (Friedlingstein et al., 2022). While forests and wetlands contribute most to the terrestrial carbon sink, semi-arid ecosystems dominate its trend and interannual variability (Ahlström et al., 2015; Poulter et al., 2014; Zhang et al., 2016). Semi-arid ecosystems typically take up carbon from the atmosphere during the wet season and are either dormant or emit carbon during the dry season (Metz et al., 2023). Net ecosystem exchange (NEE) describes this balance between carbon uptake through photosynthesis, typically expressed as gross primary productivity (GPP), and carbon release through ecosystem respiration (Reco). NEE in semi-arid regions varies strongly from year to year, depending on the climatic conditions and water availability (Haverd et al., 2017; Piao et al., 2020).
Despite their important role in the global carbon cycle, semi-arid ecosystems and their dynamics are still not well understood. Long-term in situ measurements from these regions are scarce. Particularly, eddy covariance (EC) measurements, which provide high-frequency and continuous ecosystem trace gas and water flux data (Baldocchi, 2020), are underrepresented in these regions (Jung et al., 2020). Consequently, semi-arid ecosystems remain poorly represented in terrestrial biosphere models (Fawcett et al., 2022; MacBean et al., 2021) due to their complex structure and high spatio-temporal variability, which is difficult to generalize.
Recently, efforts have been made to examine drivers of NEE in semi-arid savannas in order to better understand their role in the global carbon cycle (Baldocchi and Arias Ortiz, 2024; Kannenberg et al., 2024; Ma et al., 2007, 2016; Zhang et al., 2010). Water-related variables like precipitation and soil moisture availability are amongst the main NEE drivers (Archibald et al., 2009; Baldocchi and Arias Ortiz, 2024; Del Grosso et al., 2018; Huang et al., 2016b; Morgan et al., 2016), as they promote plant photosynthesis (Parton et al., 2012) and enhance heterotrophic respiration rates (Ma et al., 2016). Furthermore, photosynthetically active radiation (PAR), vapor pressure deficit (VPD), and air temperatures can strongly impact NEE (Archibald et al., 2009; Baldocchi and Arias Ortiz, 2024; Del Grosso et al., 2018). Other biotic factors, like soil microbial communities and organic matter, also play an important role in the ecosystem carbon cycle and contribute to Reco (Austin and Vivanco, 2006; Bastida et al., 2016; Hu et al., 2014). These drivers can differ for different vegetation types. In semi-arid regions, savannas are a typical ecosystem type. They comprise coexisting vegetation layers (e.g., tree and grass), which interact in complex ways (Higgins et al., 2000; House et al., 2003). The layers differ in their rooting depths (Moreno et al., 2005; Rolo and Moreno, 2012), water use strategies (Cubera and Moreno, 2007; Miller et al., 2010; Steiner et al., 2024), and phenological and life cycle strategies (Whitecross et al., 2017). The herbaceous vegetation in two-layer ecosystems is often underestimated in its importance for the ecosystem water and carbon fluxes (Dubbert et al., 2014). On the Iberian Peninsula, dehesas (or montados in Portuguese) – savanna-like agroecosystems shaped by long-term human management – are widespread (Den Herder et al., 2017). Dehesas are open oak woodlands with an herbaceous layer that consists mainly of annual grasses and sometimes crops. The tree layer is evergreen (Moreno, 2008), whereas the herbaceous layer typically follows an annual cycle of growth, senescence, and regreening (Ma et al., 2007; Perez-Priego et al., 2015). As savannas are typically characterized by changing resource limitations throughout the year (Luo et al., 2020; Ries and Shugart, 2008), limited by water in the dry season and by nutrients and energy in the wet season (Moreno, 2008; Morris et al., 2019; Nair et al., 2019; Whitley et al., 2011), the dominant environmental drivers change with the seasons. The complex interactions between tree and grass layers, the dominant environmental drivers of NEE, which change with the seasons, along with changing limitations, result in highly complex ecosystem carbon flux dynamics, which remain to be fully understood.
Semi-arid ecosystems face numerous human-induced environmental changes, including stoichiometric imbalances between nitrogen (N) and phosphorus (P). These imbalances arise from increasing N inputs into ecosystems due to fertilizer use and the combustion of fossil fuels (Steffen et al., 2015) without a corresponding increase in P inputs (Penuelas et al., 2013). Few studies so far have dealt with the impact of altered nutrient levels on NEE and its drivers in semi-arid regions. The availability and stoichiometric balance of N and P influence ecosystem functioning and plant traits (Reichstein et al., 2014), water use efficiency (El-Madany et al., 2021; Huang et al., 2016a), canopy structure (Migliavacca et al., 2017), composition of species (Sardans et al., 2012), and the seasonality of vegetation activity (Luo et al., 2020). However, different plant types react differently to changes in nutrient availability, due to variations in generation times and buffering capacities (Pardo et al., 2011). Therefore, the understanding of the response of complex tree–grass ecosystems to changes in N and P availability and their stoichiometric balance is still poor.
In this study, we took advantage of the unique long-term dataset collected in a semi-arid dehesa, Majadas de Tiétar, in southwestern Spain. A large-scale nutrient addition experiment has been running here since 2015, providing an exceptional opportunity to study the long-term influence of altered N : P ratios on ecosystem functioning (El-Madany et al., 2021). Three EC flux towers have been set up, with the footprint of one tower receiving N fertilization, another one receiving N + P fertilization, and the third serving as control. Previous studies found that both treatments increased the annual carbon uptake of the ecosystem and that N + P addition increased the water use efficiency of the ecosystem more than N-only addition, which could be attributed to higher transpiration rates and a changed root strategy in the N-only-fertilized plot (El-Madany et al., 2021; Nair et al., 2019). Nutrient addition led to not only a higher seasonal amplitude of maximum GPP and a faster increase in GPP during the regreening period, but also a faster senescence during the drydown period, indicating changes in plant structure and physiology (Luo et al., 2020).
Here, we analyzed a 7-year (2016–2022/23) time series of daily values of environmental and biogenic variables from Majadas de Tiétar, combining flux data, meteorological measurements, digital repeat photography, and satellite data to address the following question: how do altered nutrient levels and stoichiometric balance affect
-
annual NEE and its variability,
-
the relationship between NEE and its key controls,
-
the relationship between NEE and its key controls in different seasons, and
-
the sensitivity of NEE to its controls over time?
The relationships between NEE and its controls vary across different timescales (Mahecha et al., 2007). To disentangle these timescales from the time series and eliminate noise from the high-frequency measurements, we can use decomposition methods (Linscheid et al., 2020). On short timescales, the NEE sensitivity follows the diurnal cycle of the sun, showing a great dependency on radiation. Ecosystem-level responses, in contrast, often develop on scales of months, seasons, or years (Ma et al., 2016). Therefore, we extracted the seasonal signals of all variables from the time series with singular spectrum analysis, a data-driven time series decomposition method. To characterize the relationship between NEE and its environmental and biogenic controls on the seasonal scale, we used a conventional correlation metric: the Person's correlation coefficient. As these relationships can be quite complex and nonlinear, we additionally used information-theory-based methods. These non-parametric metrics, such as mutual information, can identify non-monotonic couplings as well as leading and lagging effects and are therefore particularly suited for driver identification in observational flux data from complex systems (Chamberlain et al., 2020; Knox et al., 2018; Sturtevant et al., 2016). As NEE controls vary in their importance throughout the year due to a high seasonality of the ecosystem, we split the dataset into phenological seasons defined by vegetation responses to different limitations.
2.1 Site description
The Majadas de Tiétar research site is located in western Spain (39°56′25′′ N 5°46′29′′ W) (Fig. 1a). The local ecosystem consists of an herbaceous stratum and scattered evergreen oak trees (98 % Quercus ilex). The tree density is around 20–25 trees per hectare, with a mean diameter at breast height of 46 cm (El-Madany et al., 2018). The fractional canopy cover of trees is 23 % and canopy height is on average 8.7 m (Bogdanovich et al., 2021). The tree leaf area index (LAI) is around 0.35 m2 m−2. Although the grass layer has a peak LAI in spring, it is quite spatially variable with values between 0.5 and 2.5 m2 m−2 due to the seasonal temporal variability (described in detail below) of grass growth (Migliavacca et al., 2017). The site is managed and continuously used for grazing livestock at a low density of 0.3 cows per hectare (El-Madany et al., 2018). In the driest months (July–September), the farmers move the cattle to nearby mountain grasslands (personal communication).
The climate at the site is semi-arid with an annual precipitation of around 650 mm with strong interannual variability. Almost 85 % of the annual precipitation falls in the wet season between October and April, whereas the rest of the year is dry with occasional rains (Fig. 1c) (El-Madany et al., 2021). According to Nair et al. (2024), we defined five different seasons. Spring is the main growing season and usually starts around March and ends in late May. Then the drydown period starts and the grasses start to become senescent due to depletion of soil moisture, increase in temperature, radiation, and vapor pressure deficit. The summer (typically between end of June until end of September) is characterized by long-lasting dryness and a dormant/dead herbaceous layer. With the onset of precipitation (usually in October), the autumn starts and the herbaceous layer regreens (Nair et al., 2024). The winter months (December–February) are energy-limited. The onset and offset of the different seasons vary from year to year, depending on water availability and winter temperature (Luo et al., 2020). The mean annual temperature is 16.7 °C with an average minimum temperature of −4.7 °C and maximum temperature of 41.1 °C (2004–2019) (El-Madany et al., 2021). Dominant wind directions are west-southwest and east-northeast (El-Madany et al., 2018).
Three EC towers at ecosystem level were operated simultaneously at the site (Fig. 1b). The ecosystem is heterogeneous with a high variability in plant species in the herbaceous layer (at a scale of centimeters) and tree cover (at a scale of meters). It becomes homogeneous on the scale of a few hundred meters. The daytime flux footprints of the three towers are homogeneous at the relevant scale and do not overlap with each other under prevailing meteorological conditions (El-Madany et al., 2018). The control tower (Fluxnet ID: ES-LMa) has been operated since 2003; it is hereafter referred to as CT. The north tower (Fluxnet ID: ES-LM1) was set up at a distance of 450 m from CT in the northwestern direction and the south tower (Fluxnet ID: ES-LM2) was located 630 m in the southern direction from CT (El-Madany et al., 2018). Since 2015, a large-scale fertilization experiment has been conducted at the site, where N fertilizer is added in the footprint of the north tower (hereafter referred to as NT) and N and P fertilizer are applied in the footprint of the south tower (hereafter referred to as NPT) (El-Madany et al., 2021). The N and P fertilizations were applied around similar times at the sites each year, with some exceptions due to weather or logistics restrictions (e.g., pandemic). N was added at 100, 20, 50, 24, and 12 kg N ha−1 at both sites by end of winter 2015, 2016, 2017, 2021, and 2023, respectively, and P was added at 50, 10, 25, 6, 6, and 6 kg P ha−1 at NPT in autumn 2014, 2015, 2016, 2019, 2020, and 2022, respectively. This timing of the application of N and P was selected to have maximal possibility for use by vegetation in the next growing season after each addition. Next to each flux tower is a radiometric tower setup measuring radiation components above the tree and grass layers, alternating every 15 min, providing half-hourly measurements for each layer.
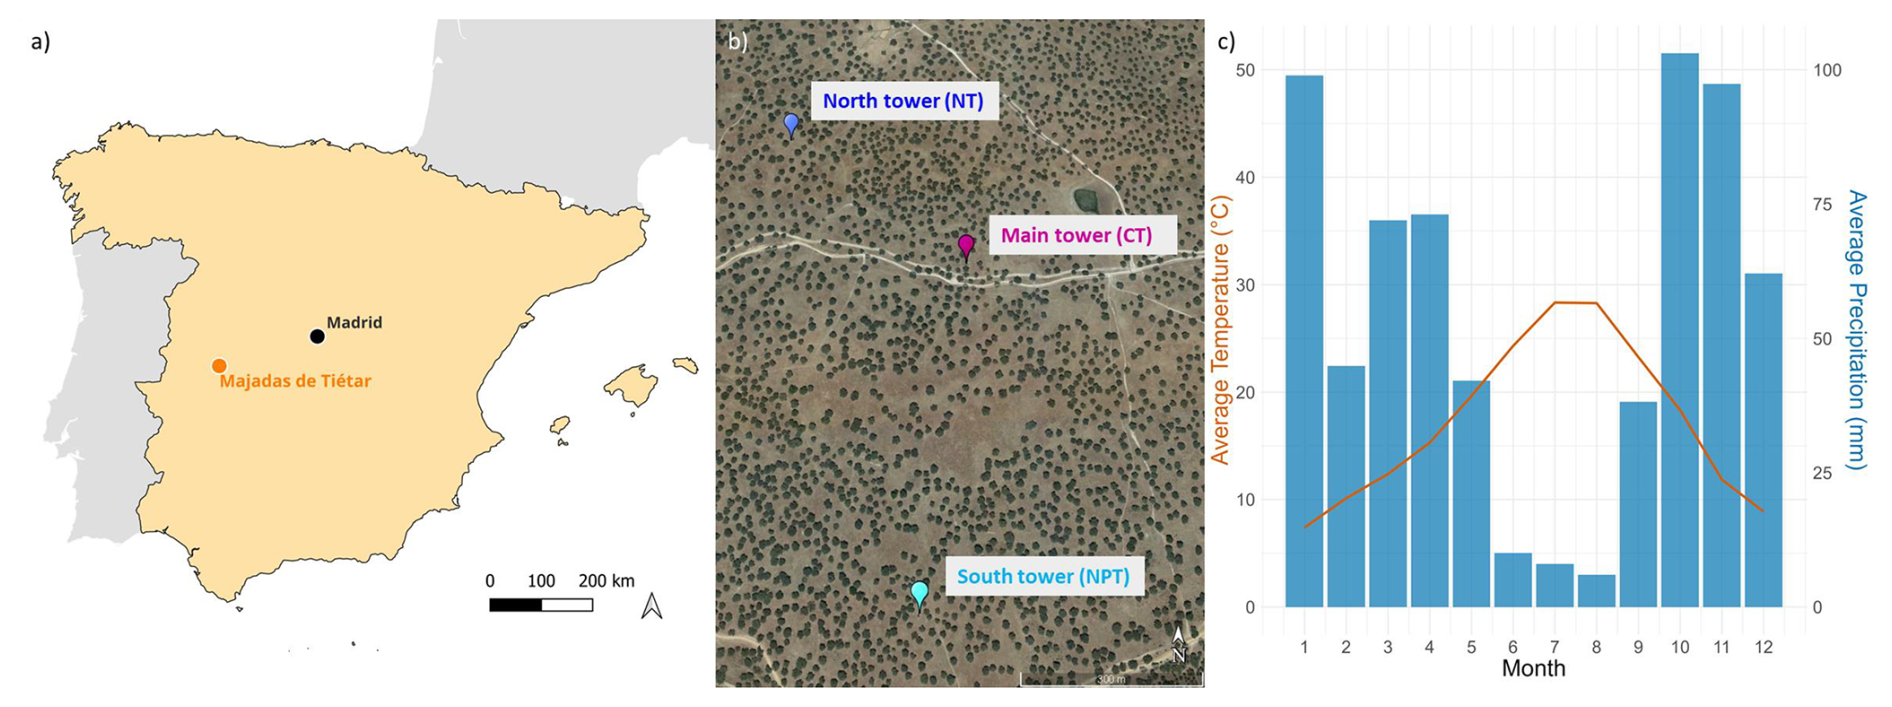
Figure 1(a) Site location on the Iberian Peninsula. (b) Location of the three eddy covariance towers. Nitrogen-added tower (NT) is in blue, control tower (CT) is in purple, and nitrogen + phosphorous-added tower (NPT) is in light blue (base map from Google Earth, 2025). The tower locations were chosen to ensure that, under prevailing wind conditions, their measurement footprints do not overlap. Footprint climatologies can be found in Fig. 1 in El-Madany et al. (2018). (c) Average monthly precipitation total and average temperature measured at 15 m over 2016–2023.
2.2 Eddy covariance and biometeorological data
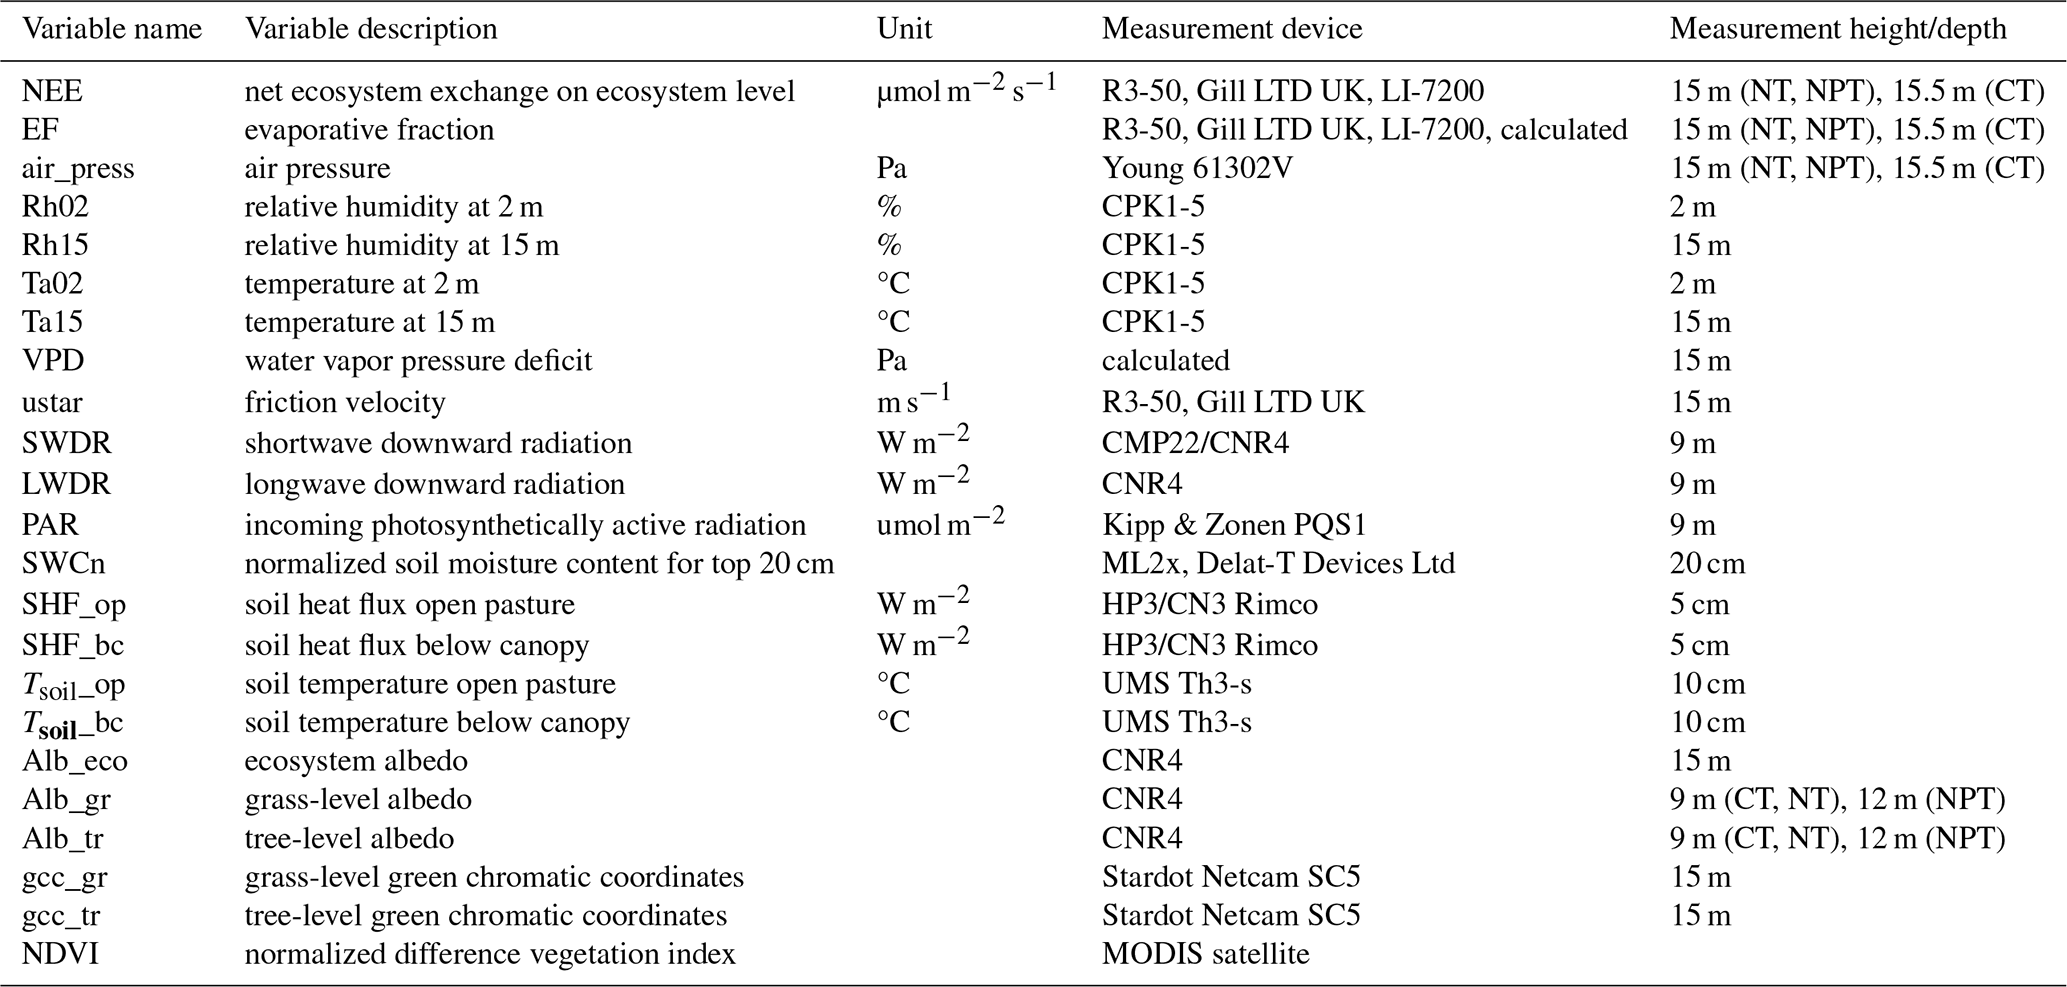
Each of the three EC towers continuously measures sensible heat flux (H), latent heat flux (LE), and CO2 flux. Each system is equipped with an R3-50 sonic anemometer (Gill Instruments Limited, Lymington, UK) to measure three-dimensional wind components and sonic temperature and an LI-7200 infrared gas analyzer (LI-COR Bioscience, Lincoln, Nebraska, USA) to measure CO2 and H2O mixing ratios. The measurement heights are the same at 15 m above ground (El-Madany et al., 2021). The flux and meteorological data were collected as described by El-Madany et al. (2018). The raw high-frequency data were processed with EddyPro v.7.0.9 (Fratini and Mauder, 2014). The post-processing was done in R using the REddyProc package (Wutzler et al., 2018). The storage corrections of the CO2 flux were made with profile measurements from seven points on the EC towers. A friction velocity (ustar) threshold was applied following Papale et al. (2006) and data with ustar values below the defined threshold were removed. Missing and low-quality data were gap-filled (Mauder and Foken, 2011; Reichstein et al., 2005) for calculating the annual budgets. Additional atmospheric variables that we used are air temperature (Ta) and relative humidity (Rh) measured at two heights (2 and 15 m), vapor pressure deficit (VPD), air pressure (air_press), and friction velocity (ustar). Furthermore, we incorporated radiometric components such as longwave downward radiation (LWDR), shortwave downward radiation (SWDR), and photosynthetically active radiation (PAR). Soil measurements were comprised of soil temperature measured from two sensors in open pasture (Tsoil_op) and below oak tree canopy (Tsoil_bc) and soil heat flux from two sensors in open pasture (SHF_op) and below canopy (SHF_bc). We used the average measurements of two sensors when both were available and otherwise the measured values of one sensor. Additionally, to calculate soil water content, we used the different measurements integrated over the top 20 cm of the soil and weighted them by canopy a cover of 20 % to obtain ecosystem soil water content values (SWCn).
Some small data gaps existed in meteorological variables and were filled with the average of the remaining two towers and interpolation. However, the PAR sensor at CT had a long-term malfunction, so we used the PAR time series from NT as a substitute, since the incoming radiation was not expected to differ substantially between the towers (El-Madany et al., 2018). In addition, we calculated evaporative fraction (EF) as the ratio between LE and available energy (EF = LE (LE + H)) (Gentine et al., 2007; Tong et al., 2022). EF is a normalized measure of the surface energy partitioning and can serve as a diagnostic of vegetation water status (Nutini et al., 2014). We calculated it at half-hourly time steps from only positive LE and H values to avoid introducing extreme outliers into the analysis. EF is strongly linked to meteorological variables like soil moisture, VPD, and net radiation (Gentine et al., 2007; Tong et al., 2022), as well as to vegetation cover and LAI (Gentine et al., 2007). A full overview of analyzed variables is shown in Table 1.
2.3 Vegetation indices
We used three different vegetation indices to represent vegetation greenness: green chromatic coordinates and albedo (both indices derived from in situ data) and the normalized difference vegetation index (NDVI) (derived from satellite data). Green chromatic coordinates (GCCs) are an effective measure for describing greenness variation in semi-arid ecosystems (Luo et al., 2018, 2020). We used daily mean GCC values extracted from the images collected every 30 min by digital cameras (Stardot NetCam 5MP) which were installed at the top of each ecosystem EC tower facing north. The cameras were set up according to the protocol of the PhenoCam network (https://phenocam.sr.unh.edu/webcam/tools/, last access: 3 July 2024) and collected red, blue, and green (RGB) images (Luo et al., 2018). GCC was computed by dividing green digital numbers (GDN) by the sum of red (RDN), blue (BDN), and green digital numbers (Richardson et al., 2009):
At each site, we selected two regions of interest in which we calculated GCC, one capturing the grass layer (gcc_gr) and one capturing the trees (gcc_tr). The data derived from RGB images can be found on the website of the PhenoCam network (IDs: ES-LM1, ES_LMa, and ES_LM2 for the NT, CT, and NPT, respectively). At each site we chose the masks GR_1000 for the grass layer and EB_1000 for the tree layer.
We further calculated albedo as the ratio of outgoing shortwave radiation to incoming shortwave radiation, measured at the radiometric tower setup at each site. We distinguished ecosystem albedo (Alb_eco), tree albedo (Alb_tr), and grass albedo (Alb_gr) to account for reflectance and to use as another proxy for vegetation greenness and water status of the plants. We used daily averages from only daytime hours (11:00–15:00 UTC)to guarantee a high solar zenith angle for reliable measurements. Furthermore, cloudy days were filtered out and only time steps where the ratio of downward radiation to extra-terrestrial radiation at the top of the atmosphere was 0.7 or more were kept (Wood et al., 2015).
Finally, we used NDVI from the FluxnetEO dataset as a proxy describing the amount and health of vegetation cover (Tucker, 1979). The dataset complements ground measurements by providing satellite-based vegetation indices, surface reflectance, and land surface temperatures for a 2 km radius around a flux site (Walther et al., 2022). We use NDVI from MODIS (Moderate Resolution Imaging Spectroradiometer) with a daily temporal resolution (Walther et al., 2022). NDVI is calculated from the normalized difference between the reflectance of near-infrared (NIR) and red-light bands (Tucker, 1979).
Table 1Flux, meteorological, and soil variables and vegetation indices used in this study. Soil water content was calculated based on the shadow fraction estimated from the solar zenith angle and a canopy cover of 20 %.
2.4 Data analysis
2.4.1 Aggregation to daily data
To make sure that the driver identification is not confounded by gap-filling techniques based on meteorological measurements, we only use non-gap-filled, measured flux data. To ensure that there are only high-quality measured values, we selected data with quality flag = 0 (flagging policy according to Mauder and Foken, 2004). Consequently, the data coverage of the measured half-hourly time series is quite low (around 30 %) and especially heterogeneous during the nighttime. Therefore, we calculated from the biometeorological and flux data daily mean values by aggregating only daytime measurements to avoid the bias. Daytime includes only values measured after sunrise and before sunset, identified using the suncalc package in R (Thieurmel, 2017). This does not apply to vegetation indices as they were calculated as described above. GPP and Reco were not assessed in this study as partitioning methods depend on other environmental factors that would also confound the analysis of NEE controls.
If not stated differently, the following analyses cover the 7-year period from 2016–2022 because during this time all variables were available. For the assessment of NEE variability and budgets, we utilized data spanning 8 years (2016–2023) because this extended dataset was available and incorporating additional years enhances the robustness of observed trends.
2.4.2 Time series decomposition with singular spectrum analysis
Decomposition methods assume that observed time series are composed of additively superimposed sub-signals, each shaped by different scales of variability (Mahecha et al., 2010). Consequently, the time series represents the sum of a trend, oscillatory components at various scales, and noise (Liu et al., 2022).
Here we used singular spectrum analysis (SSA) for the decomposition. SSA is entirely data-driven and non-parametric and is therefore free of the bias of function selection (Golyandina et al., 2001; Liu et al., 2022; Mahecha et al., 2007). This makes it advantageous compared to other decomposition methods like Fourier and wavelet analysis (Baldocchi et al., 2021). SSA is more flexible in grouping components of similar frequencies than wavelet decomposition (Liu et al., 2022) and able to detect aperiodic or non-harmonic sub-signals from short and noisy signals (Golyandina and Zhigljavsky, 2013; Mahecha et al., 2007). Since it is fully phase–amplitude modulated and relatively robust to instationarities of the signal mean and variance, it is suitable for nonstationary signals (Allen and Smith, 1996; Golyandina and Zhigljavsky, 2013; Yiou et al., 2000). Even fragmented time series can be handled with it, as SSA can be used for filling gaps according to the first reconstructed component, which is a low-frequency signal (Kondrashov and Ghil, 2006). This makes it particularly useful for flux data (Mahecha et al., 2007).
SSA consists of four steps: embedding, decomposition, grouping, and reconstruction. In the first step, a one-dimensional time series y(t) is embedded into a two-dimensional lagged matrix X, by shifting a moving window of a certain window length (L) along the time series. In the second step, a singular value decomposition of X is performed, and it is decomposed into its orthogonal components by determining eigenvalues and eigenvectors corresponding to principal components. The eigenvalues of the covariance matrix are then ordered in decreasing magnitude. In the next step, the components are grouped, as some sub-signals consist of a set of components with complementary oscillatory frequency. In the last step, by inverting the ranked principal components, the reconstructed components of the original time series are computed. These reconstructed components show how much of the variability of the original time series is associated with the different timescales. A more detailed description of the method can be found in Golyandina et al. (2018).
Here we used the Rssa package in R (Golyandina and Korobeynikov, 2014) for our analysis. To support our hypothesis that daily-scale NEE variations are predominantly influenced by radiation, with a neglectable effect of nutrient addition, we conducted a preliminary analysis extracting the daily signals of NEE and all potential driving variables from half-hourly measurements. Detailed procedures and results of this analysis are provided in the Supplement (Text S1, Figs. S1, S2).
For our analysis, we extracted the seasonal signals of the daily time series of all variables shown in Table 1. First, as required by SSA, we gap-filled the time series with the Rssa package's internal function, igapfill, which fills gaps using the low-frequency component of the time series itself (i.e., not based on meteorological measurements). For gap filling, as a window length (L) of is recommended (Mahecha et al., 2007), we selected a gap-filling window length of L = 1000 for 2557 data points from 7 years of daily data. By conducting a sensitivity analysis, we found that adding a 3-month margin at the beginning and end of a time series can help to reduce edge effects during the gap-filling process (details see Text S2).
To extract the seasonal signal, we reconstructed the components of the frequency bin from 15 to 366 (days). We selected L=732 (2 years) based on the criteria that L should be less than and ideally an integer multiple of the period length to be extracted in order to ensure a clear signal (Biriukova et al., 2021; Golyandina and Zhigljavsky, 2013). Frequency contributions of less than 0.2 were defined as noise (Liu et al., 2022). For the grouping, we used the automated method provided by the Rssa package, which identifies groups using a hierarchical clustering algorithm based on the w-correlation matrix. The w-correlation matrix shows the weighted correlations between reconstructed components (von Buttlar, 2014; Golyandina and Korobeynikov, 2014).
For analyzing the changes in seasonal NEE variability and budgets, we used data from 2016–2023. Accordingly, L was set at 1169 (, with n=3105). To account for seasonal variability, we calculated the standard deviation of the reconstructed NEE signal for each year to quantify the variation amplitude.
2.4.3 Pearson correlation coefficient
To identify the key drivers of NEE, we first computed in R the Pearson correlation coefficients (r) between NEE and all the investigated variables (Table 1) from the reconstructed seasonal signal using the daily datasets. It is calculated as follows:
with n as the time series length, xi and yi as the single time step values within the time series, and and as the sample means. We calculated values for each tower and then ranked r according to their absolute value to identify the main drivers of NEE.
2.4.4 Information theory
To consider collinear relationships and potential lagging effects between NEE and its controls, we extended our analysis using information theory. Metrics of mutual information (MI) are powerful tools for understanding nonlinear and feedback-driven relationships in complex ecosystems (Chamberlain et al., 2020; Knox et al., 2018). MI is a non-parametric method that can disentangle interactions on different scales (Chamberlain et al., 2018; Knox et al., 2018; Sturtevant et al., 2016), by describing the average tendency for joint states of two variables X and Y to co-occur (Fraser and Swinney, 1986). This means it quantifies the amount of information that two variables X and Y hold in common, or the reduction of uncertainty of one variable, given the knowledge of the other (Chamberlain et al., 2020; Knox et al., 2021). It is a normalized measure of the statistical dependence of Y on X and no prior knowledge about their relationship is needed (Liu et al., 2022). Larger values indicate either higher dependence or a stronger interaction between the variables. With Shannon entropy (Hx) we can quantify the uncertainty in a system:
with p(x) as the marginal probability distribution of X and Xt as the different states of X in the time series t. Here we discretized the states of continuous variables into 10 fixed-interval histogram bins, as Sturtevant et al. (2016) and Ruddell and Kumar (2009) showed that 10 histogram bins ensure sufficient resolution for a robust estimate. MI was then calculated with both the marginal and joint probability distributions of X and Y, p(x,y):
To make the MI between NEE and different potential drivers comparable, we used a normalized form of MI:
We refer to this relative MI as synchronous MI (MIsync), as it depicts the interaction between X and Y at the concurrent time step. An additional strength of MI lies in its capability to account for the temporal direction (τ) of the interaction between X and Y (Liu et al., 2022):
When τ is positive or negative, the interaction between X and Y is characterized as asynchronous, with τ showing the lead or lag in Y relative to X, respectively. We chose 60 d as the maximum value for τ to check if the potential driving variable (Y) is leading NEE (X) or vice versa (Liu et al., 2022). We then picked the highest MI value (MImax) in this window and the respective day of its occurrence. If MIsync > MImax, the interaction is synchronous. If MIsync < MImax, the interaction is asynchronous. If τ<0, Y lags X. If τ>0, Y leads X and can therefore be characterized as a driver or control of X. Significance thresholds were calculated from the 95th percentile (p<0.05) of 1000 Monte Carlo random walks of the independent variable (Chamberlain et al., 2020; Ruddell and Kumar, 2009). We calculated MI measures and confidence thresholds in R, based on functions by Chamberlain et al. (2020).
We determined MIsync and MImax for the 7-year time series (2016–2022) from the reconstructed seasonal signal. Gap-filled time steps by SSA were removed before the calculation of both r and MI measures. We kept them only for NDVI, as the gap filling is based on the original time series and does not depend on other variables (Walther et al., 2022). Gap filling therefore does not confound the analysis of potential drivers.
2.4.5 Phenological seasons
As the NEE controls vary in their importance in different seasons (Baldocchi and Arias Ortiz, 2024), we calculated MIsync for each season to better capture how the nutrient addition and stoichiometric balance change the importance of different drivers over the study period. As this ecosystem's strong seasonality is reflected in vegetation activity, we assigned seasons using PhenoCam imagery. We defined phenological seasons following Nair et al. (2024). Phenological transition dates were extracted using GCC at all three sites according to changes between stationary and rising or declining greenness (Luo et al., 2018). Then, phenological transition dates averaged across the three sites for each year were calculated. According to these dates, each day of the 7-year time series was assigned to one season, describing different phases of net vegetation activity (i.e., spring, drydown, summer, autumn, and winter). Figure 2 illustrates a typical annual cycle of the seasons at Majadas de Tiétar.
We calculated MIsync values for each pair (NEE and potential driving variable) of interest in each season across all 7 years. In addition, we estimated yearly MIsync for each single season (35 data points) to evaluate how sensitivity of NEE to drivers developed over time. To isolate the fertilization effect on the importance of different drivers for NEE, we calculated the differences in the MIsync values of each season in each year between the fertilized plots and the control plot, i.e., NT–CT and NPT–CT, referred to as MIdiff. We plotted the MIdiff values for each season along the 7-year period and calculated linear regressions to confirm whether there are significant trends in the importance of drivers. The significance level was set at p<0.05. Variables with MImax<0.2 were discarded.
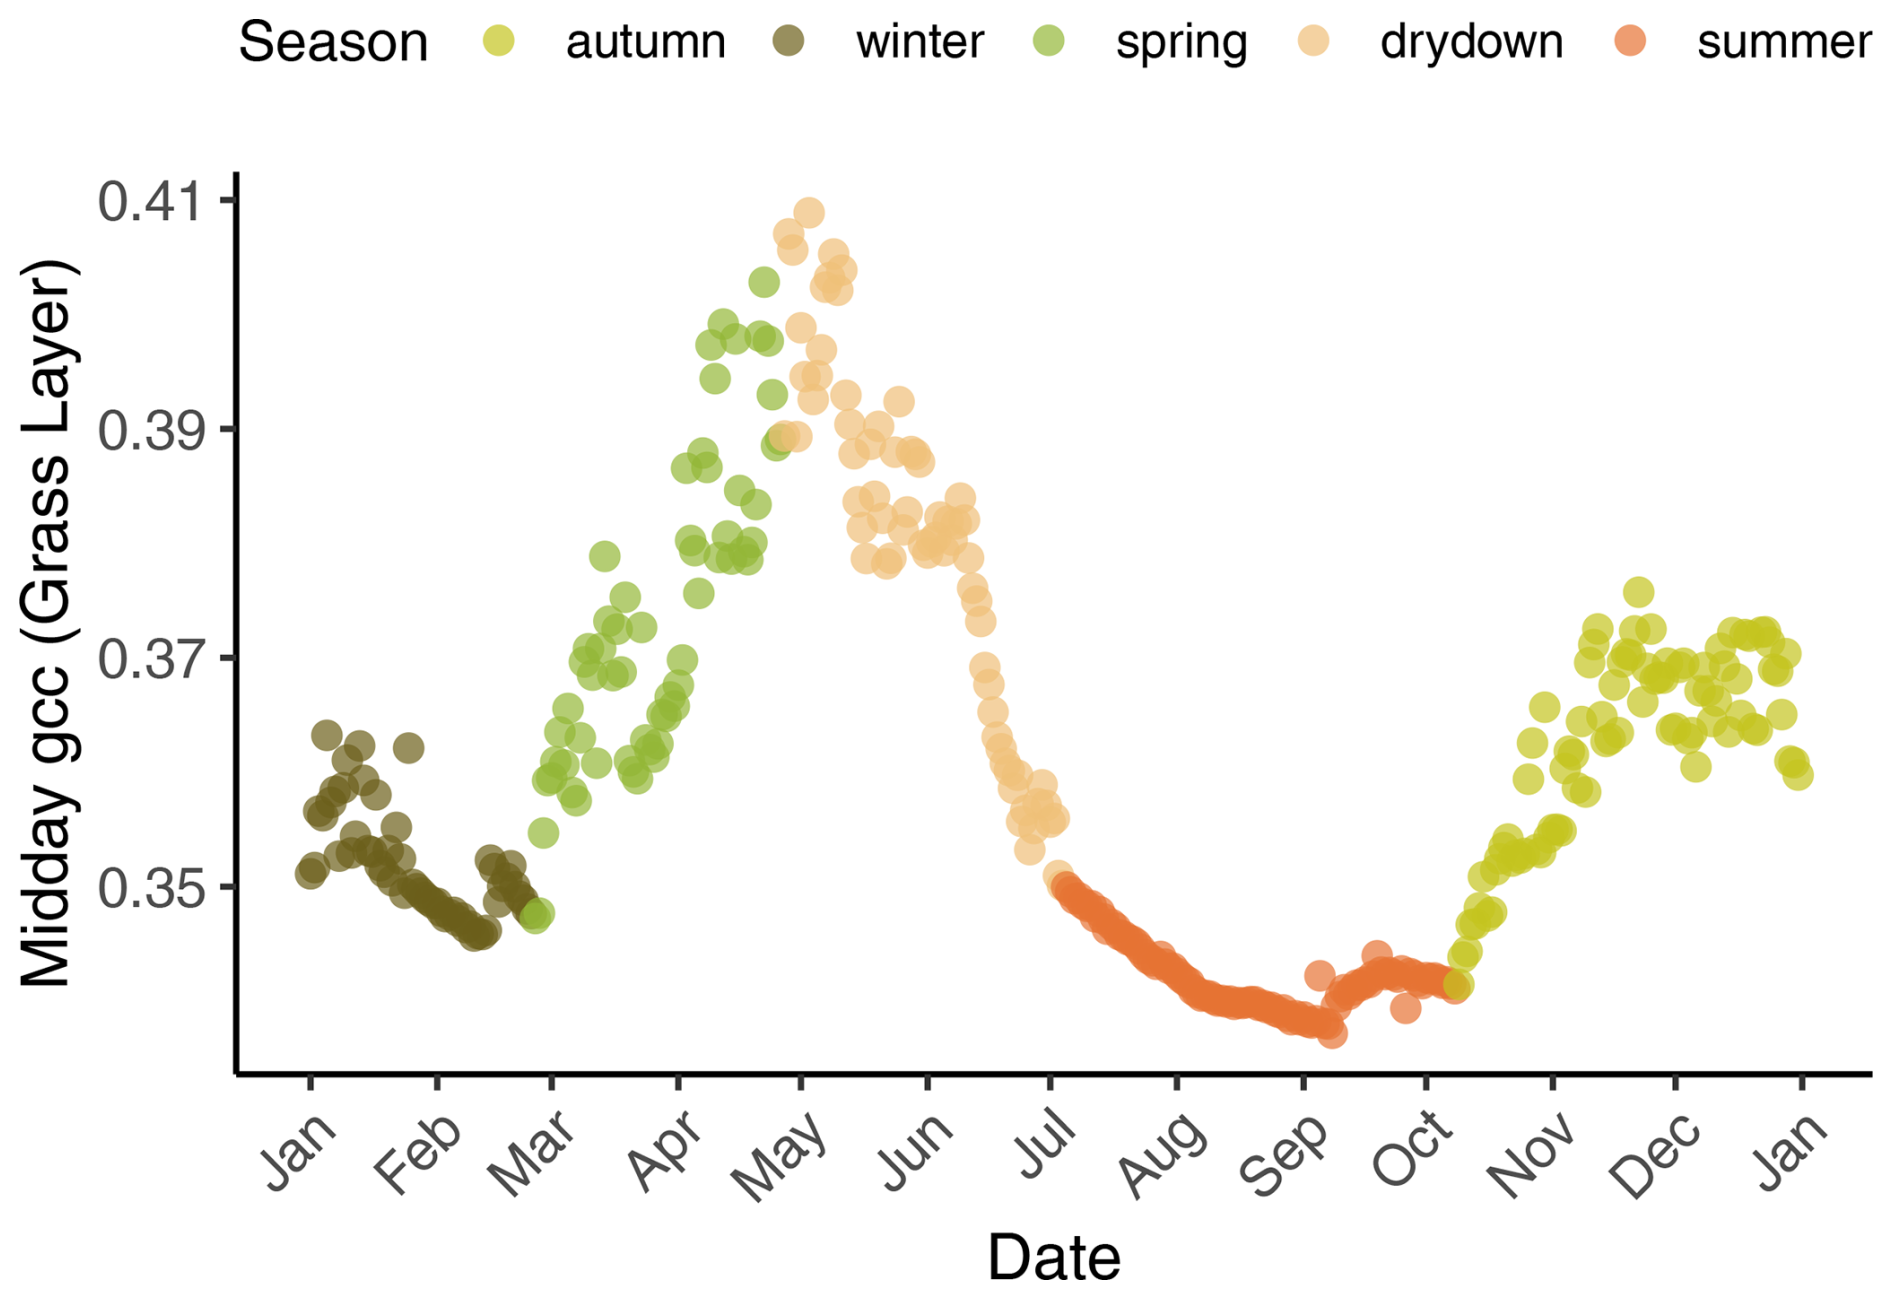
Figure 2A typical annual cycle of midday green chromatic coordinates (GCCs) derived from the grass layer at the control plot in 2018, showing the five phenological seasons – winter, spring, drydown, summer, and autumn. Spring is the main growing season (first peak in May), the grasses become senescent during drydown and dormant in summer, regreening starts in autumn (second peak around November) with the onset of rains, and winter is radiation and temperature limited.
3.1 Seasonal NEE variability
At CT, the tower not experiencing any manipulation, the annual ecosystem NEE derived from EC measurements was positive for the 2016–2023 period, with an average annual NEE budget of 90.8 ± 48.0 gC m−2 yr−1. This indicates that the ecosystem acted as a CO2 source. With fertilization treatment, the measured ecosystem NEE shifted towards CO2 neutrality, with annual averages of 34.1 ± 66.7 and 23.1 ± 69.5 gC m−2 yr−1 at NPT and NT, respectively. Annual NEE budgets fluctuated between positive and negative values at the fertilized plots, while CT consistently showed positive NEE every year. In 2017, 2022, and 2023, we observed high positive NEE values (i.e., stronger CO2 source) at all three plots. Conversely, in 2016, 2018, and 2021, fertilized areas exhibited higher CO2 uptake, acting as stronger CO2 sinks (Fig. 3). This illustrates the high interannual variability of the CO2 fluxes in this ecosystem and the substantial impact of fertilization. The nutrient addition led to higher seasonal variability of NEE, as shown by the greater yearly standard deviation of the seasonally reconstructed signals. The variability at NT and NPT further exhibited an increasing pattern over time (Fig. 3). In 2017, NEE had comparatively low seasonal variability at all three sites, which might be attributed to the extraordinary dryness in that year.
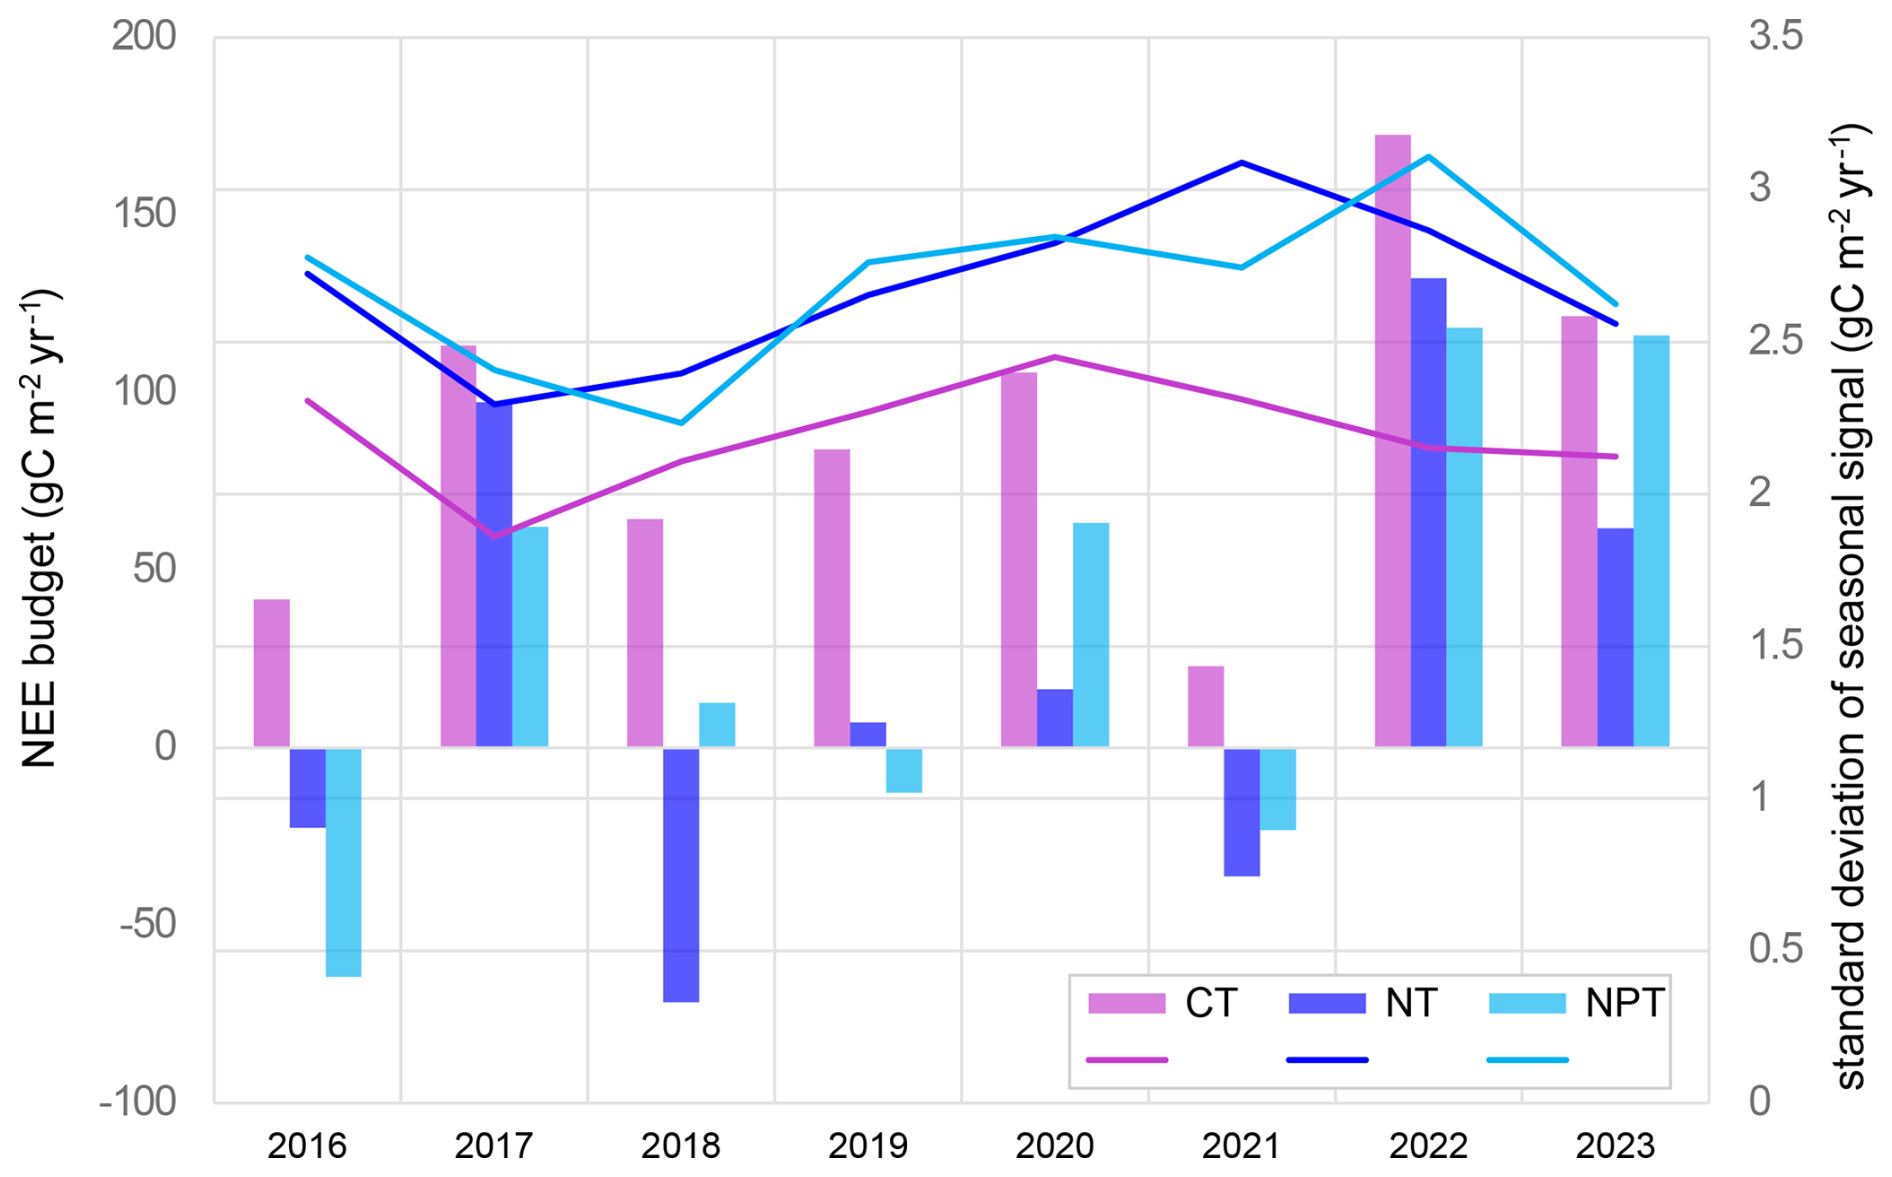
Figure 3Annual net ecosystem exchange (NEE) budgets (gC m−2 yr−1) and yearly standard deviations calculated using the seasonally reconstructed signals at the three sites for the 2016–2023 period. CT – control site, NT – nitrogen-fertilized site, and NPT – nitrogen and phosphorus-fertilized site.
3.2 Key NEE controls
We identified key controls of NEE at the three plots, comparing the results of two different statistical methods: Pearson correlation coefficient r considers only linear relationships between variables; mutual information (MI) accounts for collinear relationships. MIsync and r values show synchronous relationships. MImax values can account for leading and lagging interactions by identifying the day of the highest interaction between the potential driver and NEE within a 60 d window.
For all plots, grass-layer GCC and NDVI (at ecosystem level) were the most important predictors of NEE (Fig. 4). Both r and MI identified these proxies representing vegetation greenness as the most significant drivers. They were followed by EF (i.e., the fraction of heat transport that is done by LE), which is influenced by meteorological variables (such as soil moisture, net radiation, and VPD) as well as vegetation properties, like LAI.
At CT, Tsoil_bc and Ta15 further exhibited strong interactions with NEE using both r and MIsync (Fig. 4a, b). Variables describing water availability (VPD, SWCn, and Rh) were ranked in the middle ranges by MIsync. The MI analysis provided deeper insights into the interactions between the environment and NEE by considering leading and lagging effects, as shown by MImax (Fig. 4c). NDVI showed the highest interaction with NEE at a time lag of 16 d, and gcc_gr had a lag of 7 d. When considering leading and lagging effects, EF became relatively less important. Soil temperatures were identified amongst the five most important controls. SWCn was also important with a 20 d lag. Air temperature and VPD showed the highest interactions with lags of around a month. Radiation-related variables like PAR and SWDR exhibited long lag times in their highest interaction with NEE (60 d and 53 d, respectively). All MI values can be found in the Supplement (Table S1).
At NT, soil temperatures, VPD, SWCn, and air temperatures were among the most significant controls identified by both synchronous methods, following the primary drivers vegetation greenness and EF. NDVI showed the highest interaction with NEE with a lag of 12 d, followed by gcc_gr with a lag of 6 d. Soil temperatures exhibited the highest interactions with lags of around a month, while air temperatures showed the highest interaction at a lag of 26 d. Moisture-related variables all showed similar time lags (16–20 d). EF had the highest interaction with NEE at a lag of 2 weeks. Shortwave-radiation-related variables showed a strongly lagged effect (i.e., PAR 59 d, SWDR 57 d) (Fig. 4f).
At NPT, both r and MIsync detected soil temperatures, air temperatures, and VPD as the most important NEE controls behind gcc_gr and NDVI (Fig. 4g, h). NDVI and gcc_gr led NEE interactions with the strongest interactions at lags of 2 weeks and 10 d, respectively, followed by soil temperatures and air temperatures with the highest interactions at lags of around a month (Fig. 4i). EF showed the highest interaction at a lag of 12 d. Other moisture-related variables like VPD, SWCn, and Rh were also detected to be in the middle ranks by MImax, with time lags of 20–26 d. PAR and SWDR showed the highest interactions with NEE at time lags of around 50 d (Fig. 4i).
MI and r agreed in the detection of the most important drivers, thereby proving that information theory is applicable to our case. Therefore, in the remainder of this paper, we focus on values obtained using MI, as MI is able to detect collinear relationships as well as leading and lagging effects. We discuss variables with MImax>0.2 in the following sections to concentrate on the information provided by variables with greater explanatory value.
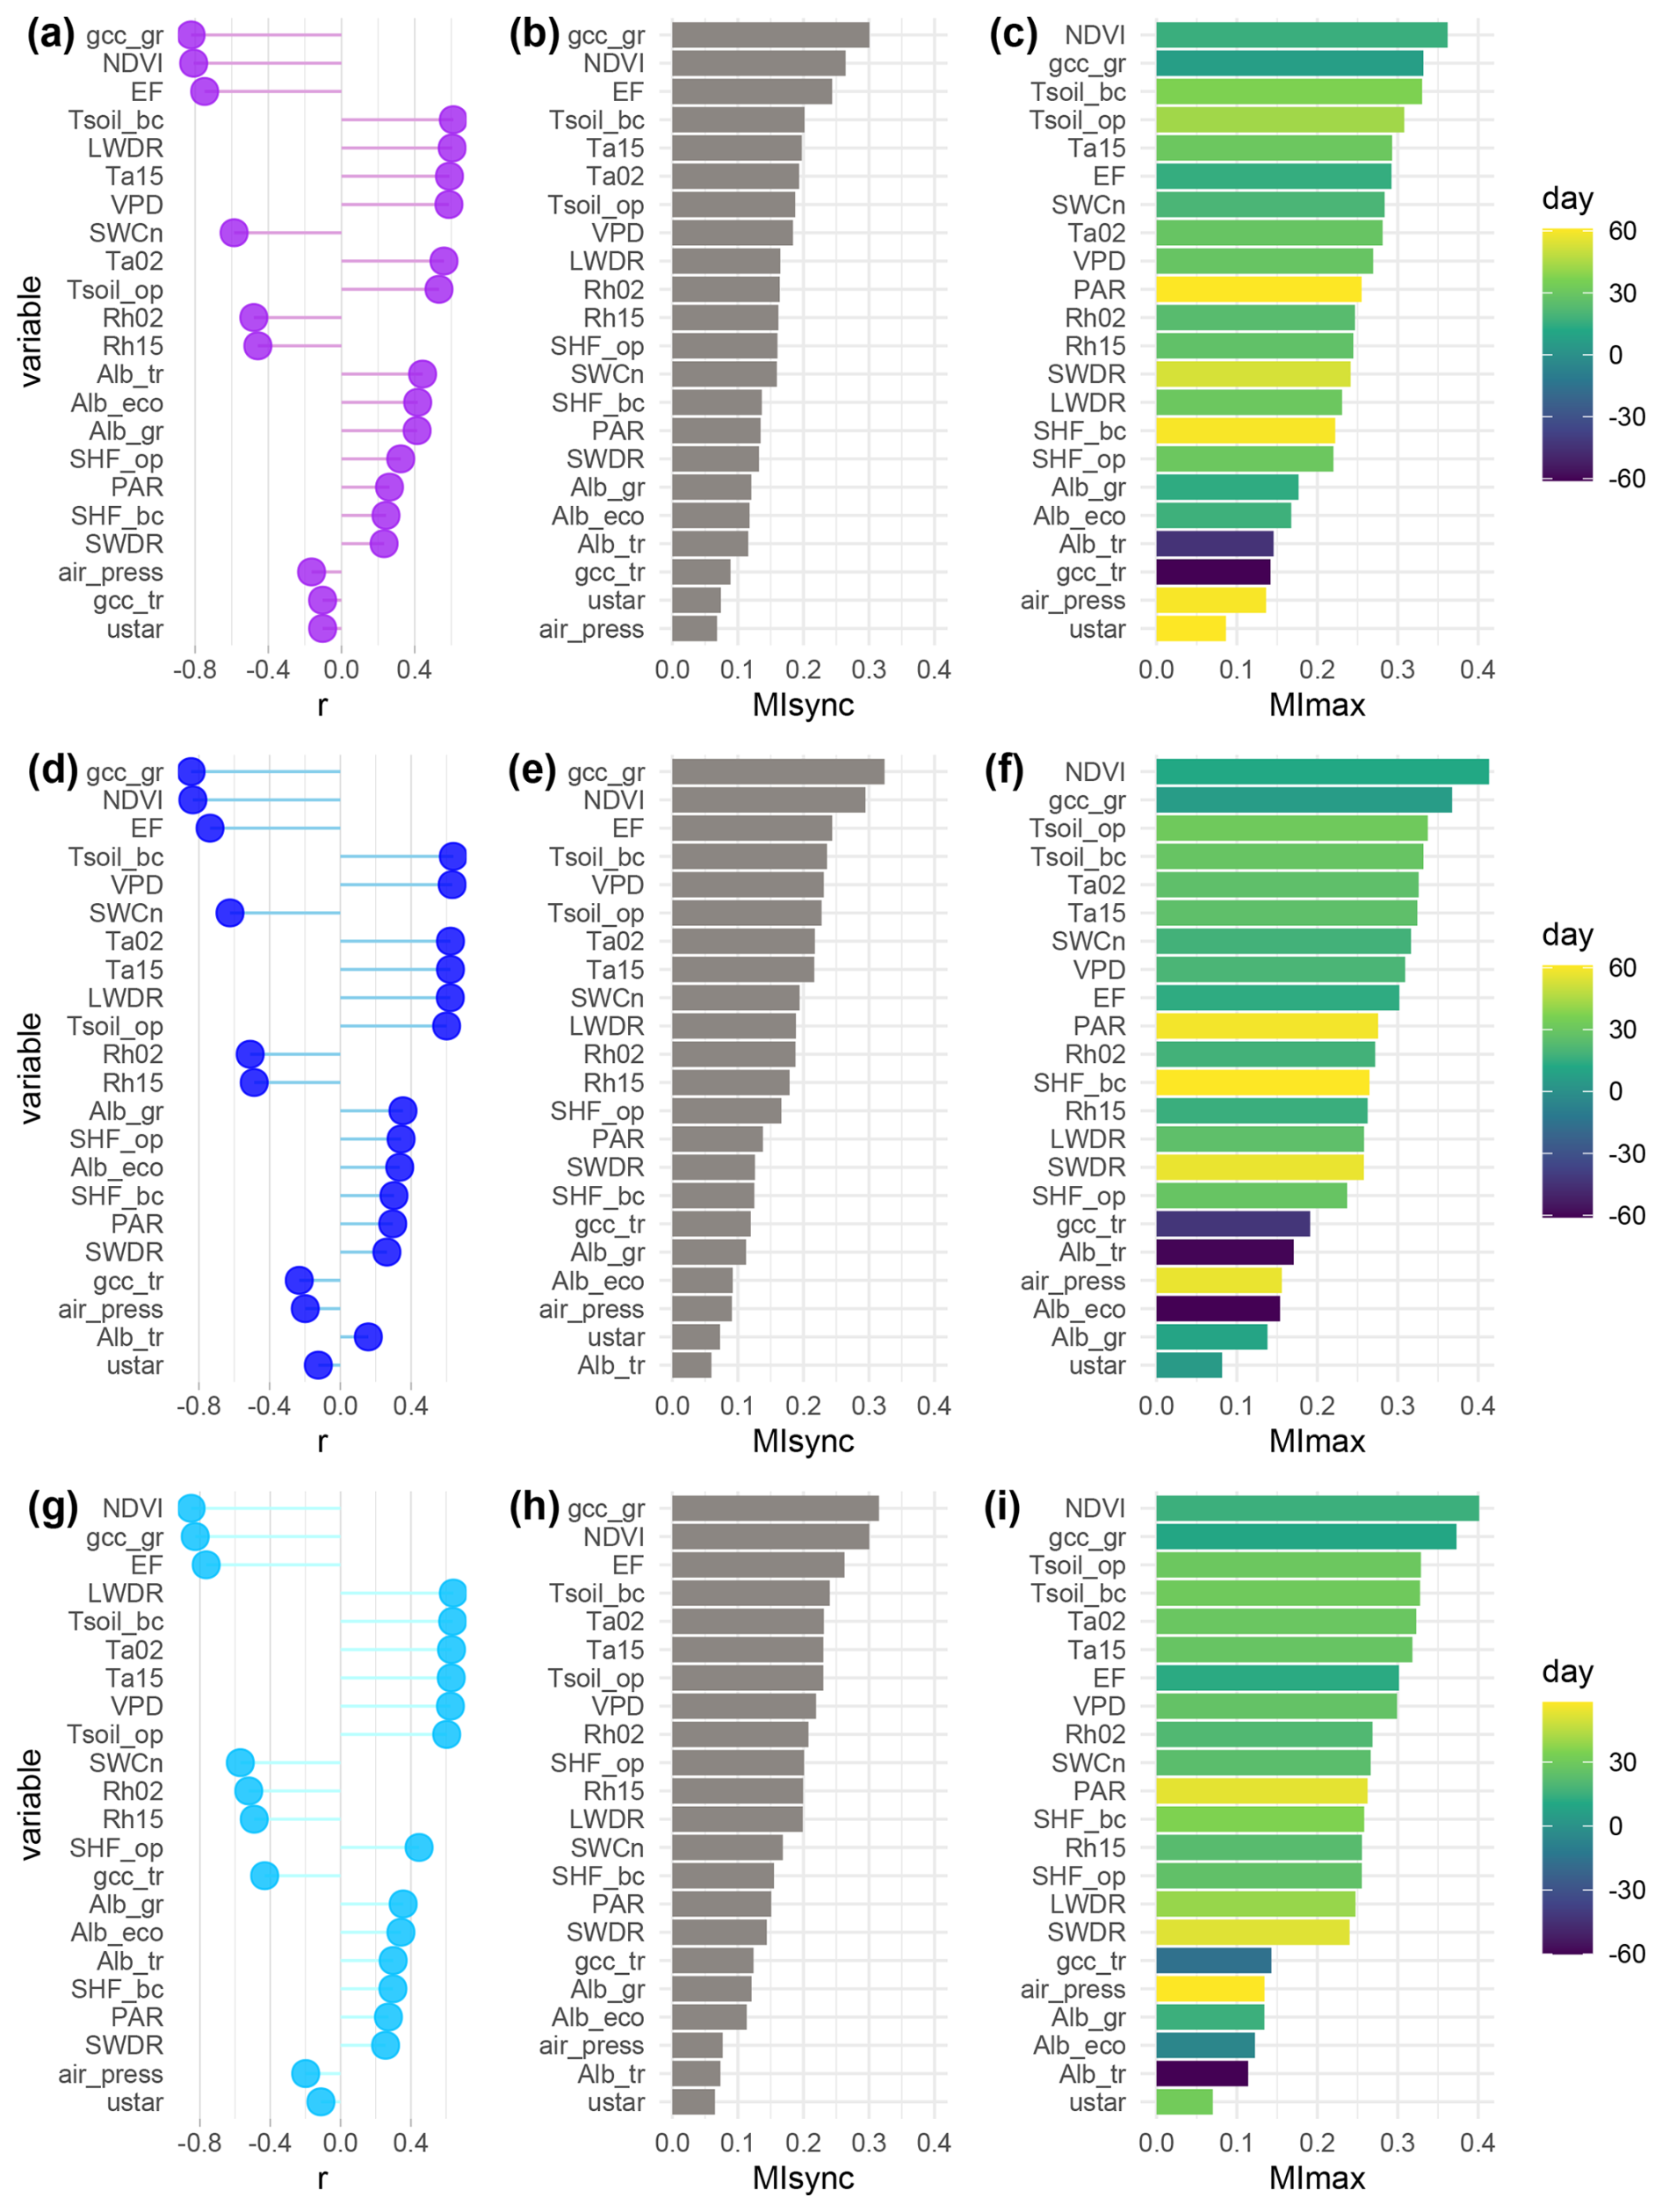
Figure 4Pearson correlation coefficient (r) (a, d, g), synchronous mutual information (MIsync) (b, e, h), and maximum mutual information within a 60 d window (MImax) (c, f, i) between net ecosystem exchange (NEE) and potential drivers over the 7-year period (2016–2022) at the control plot CT (a–c), the nitrogen-fertilized plot NT (d–f), and the nitrogen- and phosphorus-fertilized plot NPT (g–i). The color scale in the MImax plots indicates the day when MImax occurs; positive values indicate that the variable leads NEE, negative values vice versa.
3.3 Effect of fertilization on NEE sensitivity to its controls
The relationships between NEE, biogenic, and environmental variables were asynchronous, as indicated by MIsync < MImax for all variables. Therefore, we focused on MImax to describe the differences in NEE sensitivity to various controls across towers.
N fertilization appeared to shorten the reaction time of NEE to changes in NDVI. GCC at the grass level showed higher explanatory value for NEE at NPT and NT (MImax=0.37) compared to CT (MImax=0.33). EF showed only slight differences in interaction strengths among the sites (Fig. 5, Table S1). Relative humidity at two heights showed the lowest interaction with NEE at CT (MImax=0.24), while the fertilized sites had slightly higher values (0.26–0.27). The reaction time of NEE to relative humidity appeared to decrease with fertilization. VPD appeared to have the higher explanatory value for NEE at NT and NPT and slightly less at CT (MImax=0.27). The interaction between NEE and air temperatures was slightly higher at the fertilized plots compared to the control.
Regarding radiation variables, PAR seemed to have a higher interaction with NEE at NT than at NPT and CT. Similarly, SWDR showed slightly higher interaction with NEE at NT, while at NPT and CT it was equally strong.
In terms of soil variables, soil temperatures exhibited the strongest interaction with NEE. While soil temperatures below canopy (Tsoil_bc) were almost the same across sites (MImax = 0.33), the importance of soil temperatures under open air conditions was lower at CT than at the fertilized plots. SWCn showed the highest explanatory value for NEE at NT (Fig. 5, Table S1). An overview plot with all variables including the ones with MImax<0.2 is provided in the Supplement (Fig. S3).
Nutrient addition did not show a substantial effect on the sensitivity of ecosystem NEE to different drivers over the 7-year scale when considering the whole time series together. In the next step, we examine the different seasons in greater detail.
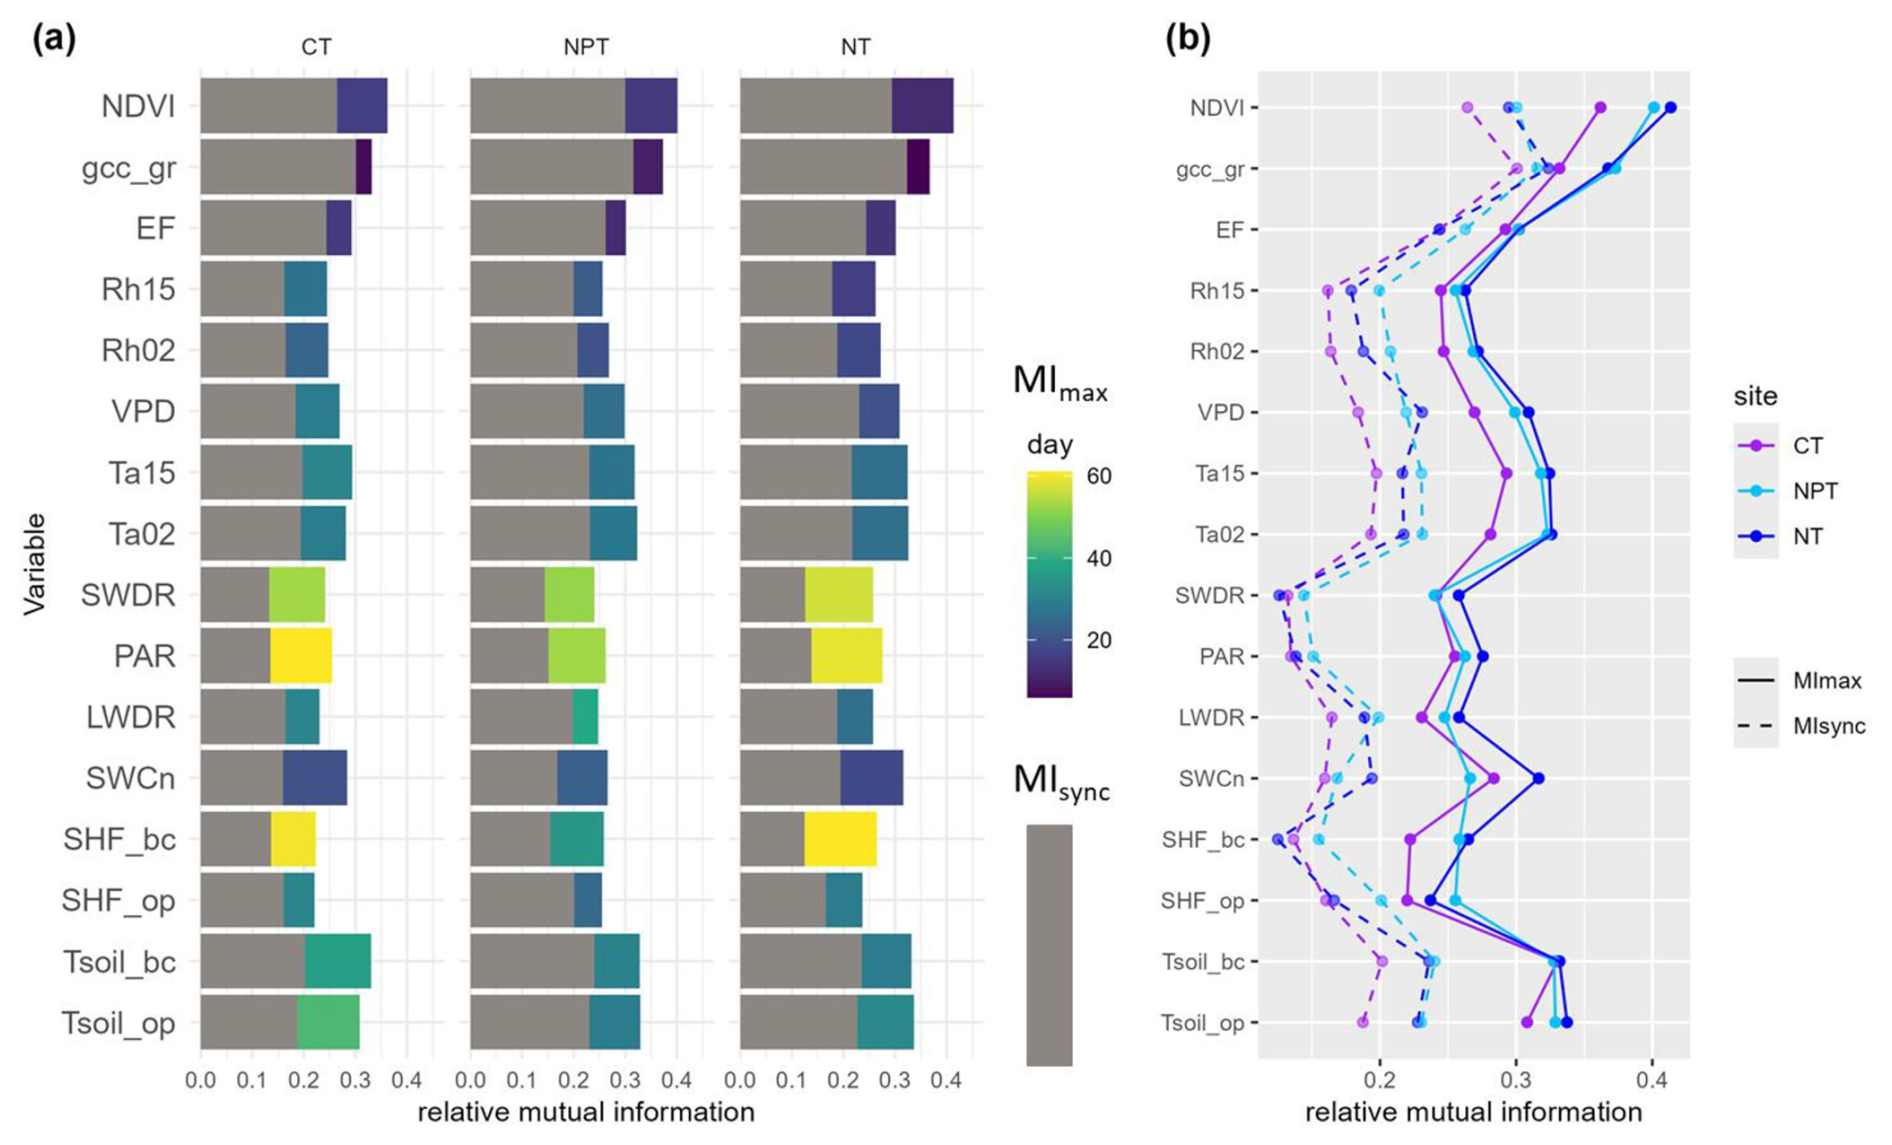
Figure 5(a) Synchronous (MIsync, grey) and maximum (MImax, colors) mutual information at the control site (CT), the nitrogen-fertilized site (NT), and the nitrogen- and phosphorus-fertilized site (NPT) at the seasonal scale. The color scale indicates the day when MImax occurs, with positive values indicating that the variable leads net ecosystem exchange (NEE) and vice versa. (b) MIsync (dotted lines) and MImax (solid lines) values at the three sites. Variables with MImax < 0.2 are not shown here.
3.4 Identifying driver importance in different phenological seasons
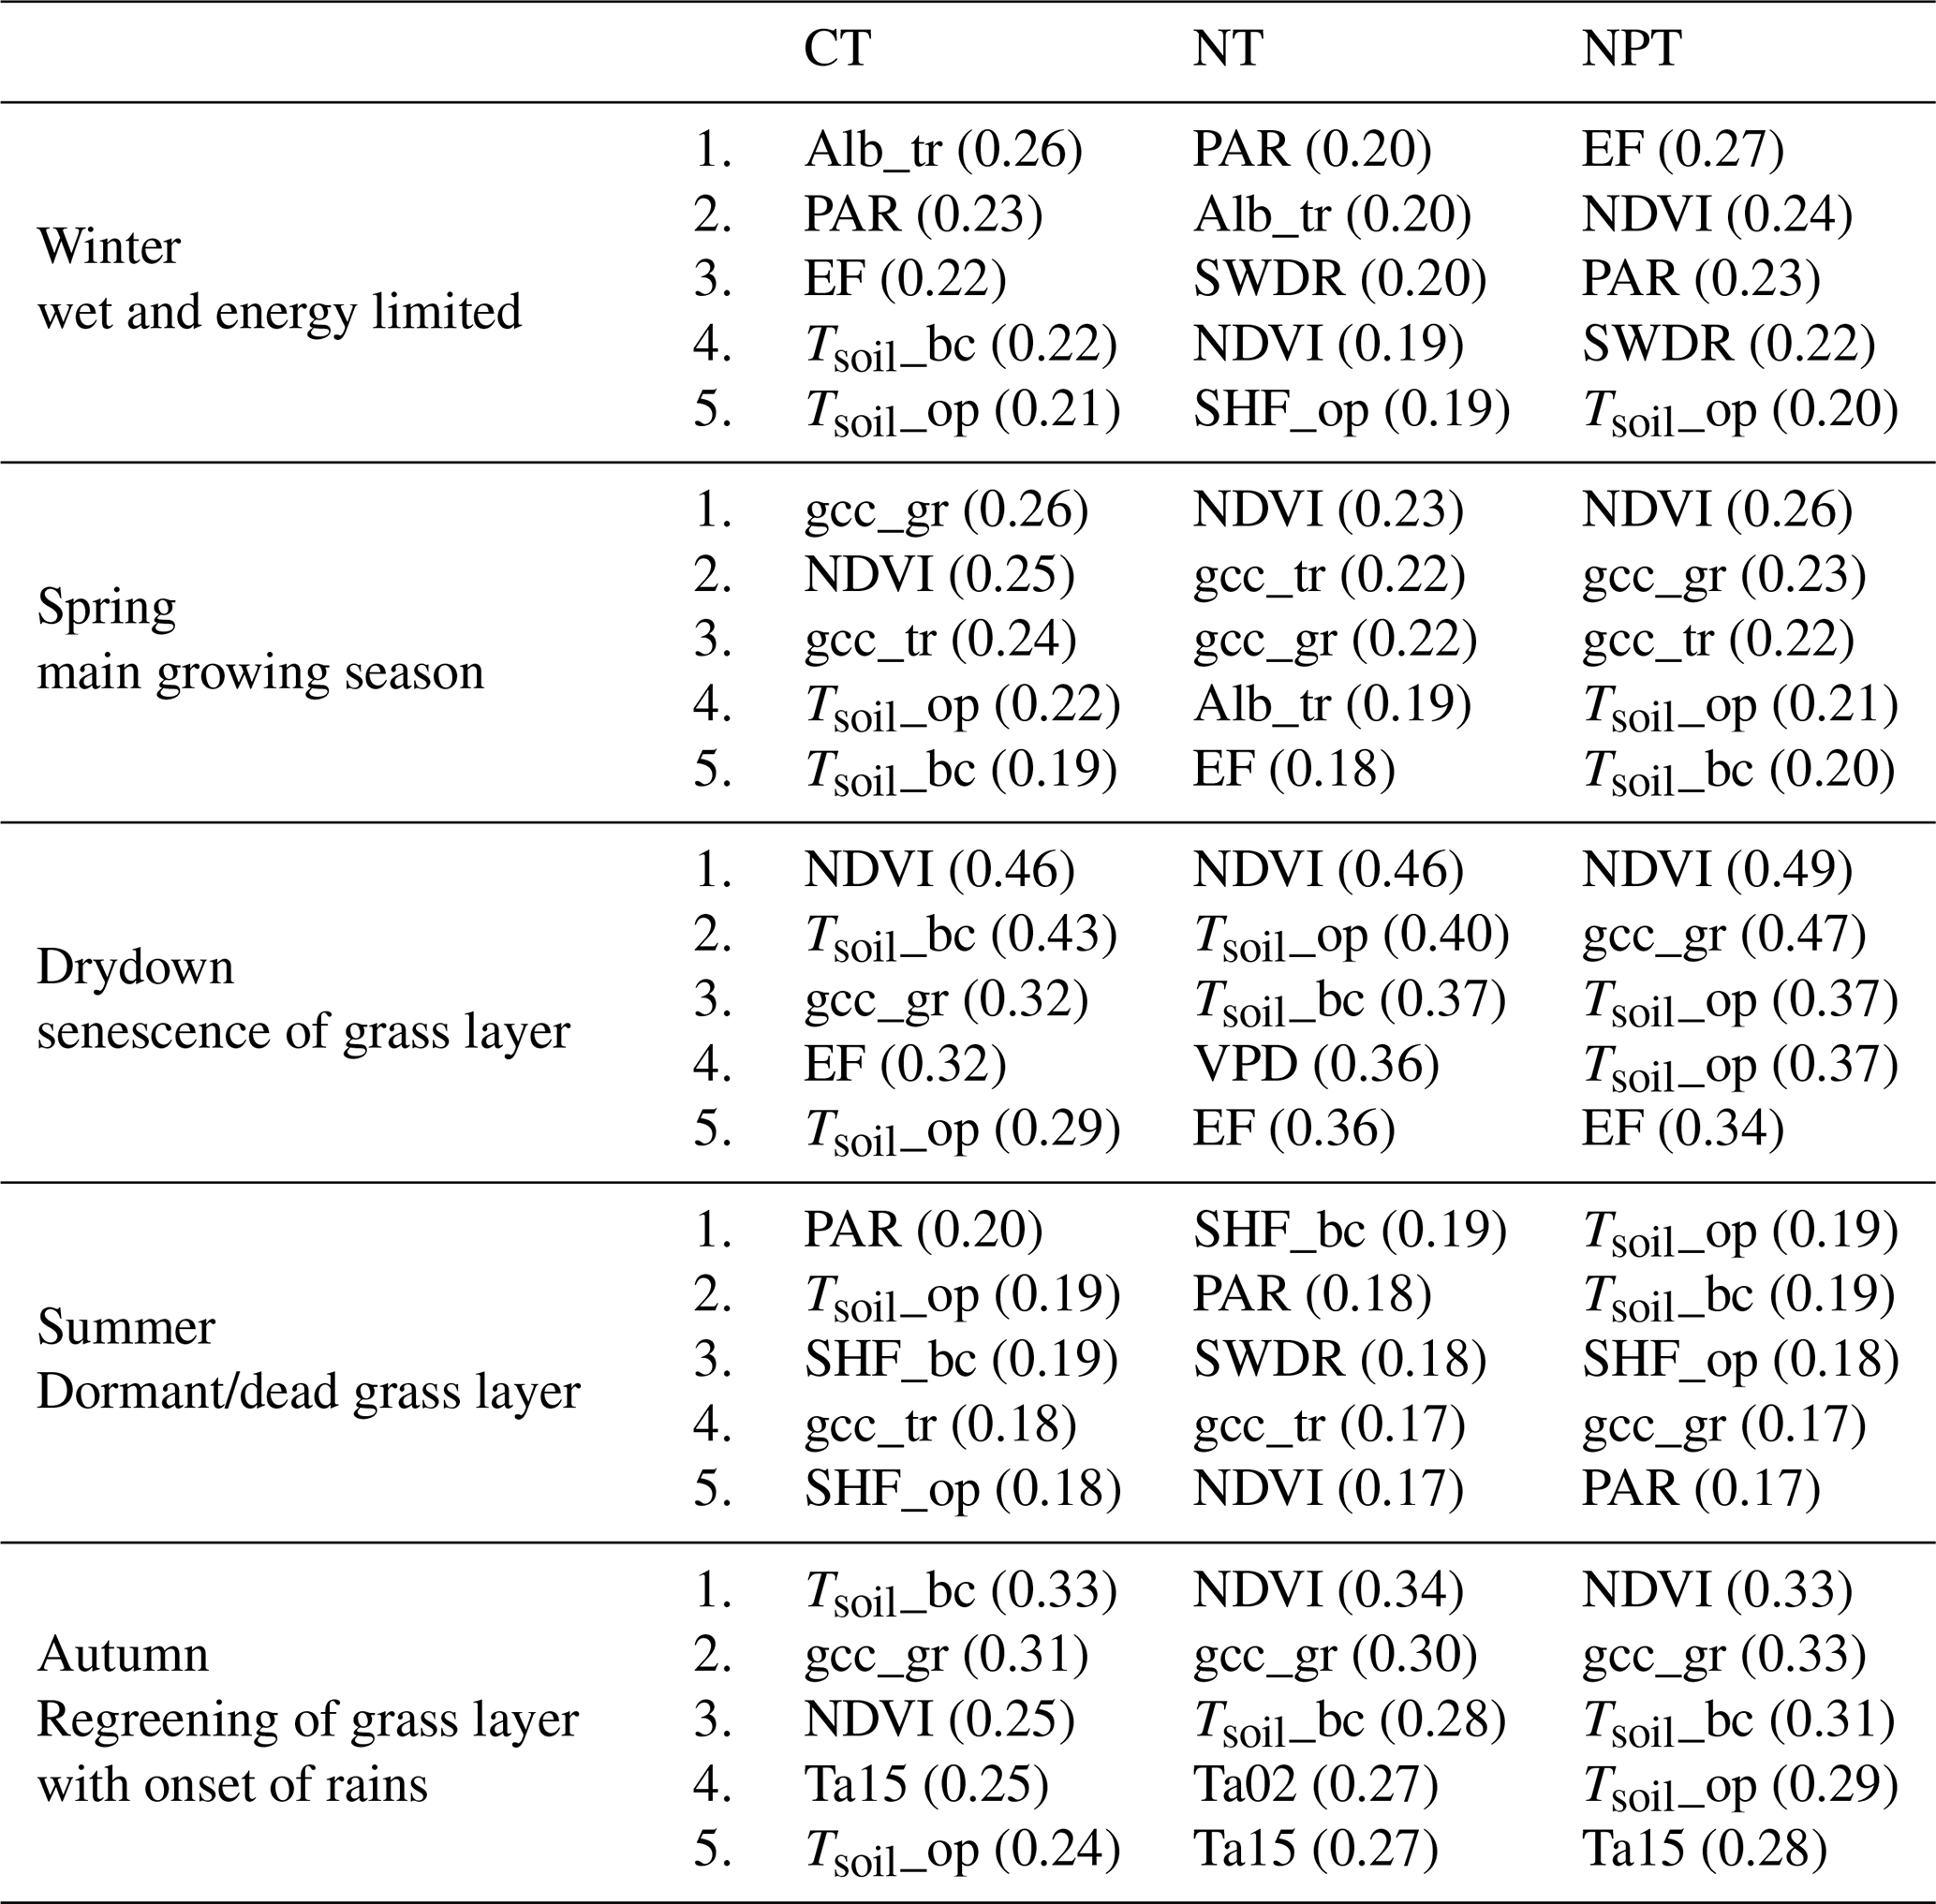
We split the 7-year dataset into five different phenological seasons based on the grass-layer GCC and calculated MIsync between NEE and each of the drivers. This analysis showed that the most important drivers differed between seasons and treatments (Table 2).
In winter, the water vapor transfers of available energy, represented by EF, show a strong interaction with NEE at NPT and CT. Furthermore, NDVI and tree-layer albedo, as well as radiation parameters PAR and SWDR, were important in explaining NEE variations.
In spring (i.e., the main growing season), NDVI and GCC at grass and tree levels showed the strongest interactions with NEE, indicating that NEE was dominated by photosynthetic activity (GPP) during this season. Furthermore, soil temperatures showed strong interactions with NEE at CT and NPT, but not at NT.
During the drydown phase, NEE was dominated by NDVI across treatments, with gcc_gr also showing strong interactions with NEE at CT and NPT. At NT, VPD exhibited a strong link with NEE, which was not as dominant at the other plots.
In summer, soil temperatures showed high interactions with NEE, possibly relating to soil respiration. Additionally, SWDR and PAR were important in explaining NEE variations during this season. At CT and NT, gcc_tr became important, which was logical as the grass layer becomes senescent in the summer and is dormant in terms of ecosystem carbon flux. At NPT, gcc_gr showed a higher interaction with ecosystem NEE than gcc_tr.
In autumn, regreening starts with the onset of rains, and NDVI and gcc_gr showed strong interactions with NEE, as GPP starts to dominate NEE again, driven by photosynthetic activity. Additionally, soil temperatures and air temperatures show a strong link with NEE in autumn. The strongest link between soil temperatures and NEE is found at CT.
Table 2The five most important drivers in each phenological season at each tower derived using synchronous mutual information. CT: control site, NT: nitrogen-fertilized site, NPT: nitrogen + phosphorus-fertilized site.
3.5 Changes in NEE sensitivity over time
Using yearly MIsync for each single season, we observed that with N addition, NEE became less sensitive to certain variables during autumn (i.e., the regreening phase), the drydown phase, and winter over time (Fig. 6). Specifically, in autumn the sensitivity of ecosystem NEE to changes in air temperature (Ta15), shortwave radiation (SWDR and PAR), and NDVI decreased significantly over the 7-year period. In the drydown phase, the sensitivity of ecosystem NEE to changes in relative humidity (Rh02 and Rh15) and soil heat flux (SHF_op) also decreased significantly. In winter, however, we observed a significant increase in the sensitivity of NEE to variations in PAR, SWDR, and grass-layer GCC.
With the addition of N + P, significant changes in NEE sensitivity over time were observed in all seasons except the drydown phase (Fig. 6). In autumn, the fertilization with N and P led to a significant decrease in NEE sensitivity to air and soil temperatures (Ta02 and Tsoil_op), PAR, and VPD. In spring, which is the main growing season, NEE sensitivity to variations in PAR increased significantly. In summer, NEE became significantly more sensitive to changes in grass-layer GCC. In winter, NEE shows a significant increase in sensitivity to changes in both gcc_gr and SWCn.
4.1 Nutrient addition increases seasonal NEE variability, driven by grass layer
The annual NEE average from EC measurements is about 91 ± 45 gC m−2 yr−1, suggesting the unfertilized site acts as a carbon source with a high interannual variability. Similar mean and variability were found in other semi-arid savannas, such as in Kruger National Park in South Africa (75 ± 105 gC m−2 yr−1) (Archibald et al., 2009). However, semi-arid savannas can also act as carbon sinks. In California, a similar oak savanna (i.e., Tonzi Ranch) was observed to be a carbon sink (values from −144 to −35 gC m−2 yr−1), while the neighboring grassland (i.e., Vaira Ranch) was found to be a carbon source (−88 to 189 gC m−2 yr−1) (Ma et al., 2007). In Dakar, Senegal, a Sahelian savanna ecosystem acted as a carbon sink with an average annual NEE budget of −180 ± 29 gC m−2 yr−1 (Wieckowski et al., 2024). Another natural West African savanna in the south of Burkina Faso has been found to be a strong sink of CO2 (−864 to −1299 g CO2 m−2 yr−1), while two degraded sites nearby were CO2 sources (118 to 605 g CO2 m−2 yr−1) (Berger et al., 2019). Our results indicate that both nutrient addition cases enhance seasonal NEE variability compared to the control. Additionally, seasonal variability increases over time at the fertilized plots. Looking at the difference between annual NEE maximum and annual NEE minimum, we notice substantially increasing trends at both sites, with a significant trend at the NPT plot (Fig. 7). These trends are slightly more driven by increasing maximum values. We argue that this nutrient effect is dominated by grass layer, which substantially controls the NEE dynamics in this system. Our analysis supports the fact that grass-layer GCC and NDVI are most important in explaining NEE variations across treatments (Figs. 4, 5). Both indices represent grass-layer greenness, as the larger fraction of the surface consists of annual grasses (Bogdanovich et al., 2021) and remotely sensed NDVI is dominated by the herbaceous layer.
At the study sites, the added nutrients mostly stay in the herbaceous layer (El-Madany et al., 2021), and it is therefore more affected by the nutrient manipulation than the tree layer. Nutrient addition has been found to increase root biomass and root length density (Nair et al., 2019) and to enable greater absorption for and allocation to leaves. In the leaves, N enhances the photosynthetic capacity (Fleischer et al., 2013), which supports the faster increase in maximum GPP and biomass in the fertilized plots, as confirmed by Luo et al. (2020). NT and NPT show higher productivity and therefore higher biomass compared to CT (Luo et al., 2020). As the grass layer is senescent in summer, the higher biomass results in a greater amount of dead biomass, which will then be respirated by soil microbes (Manzoni et al., 2020; Moyano et al., 2013) as soon as there is sufficient water available (Huxman et al., 2004). This indicates that there is a higher carbon turnover at the fertilized plots, leading to an increased range of NEE within a year (Fig. 7). It agrees with findings from Ma et al. (2016), which, at a Californian oak grass savanna, found that the amount of grass litter determines the size of the fast carbon pool in consecutive seasons.
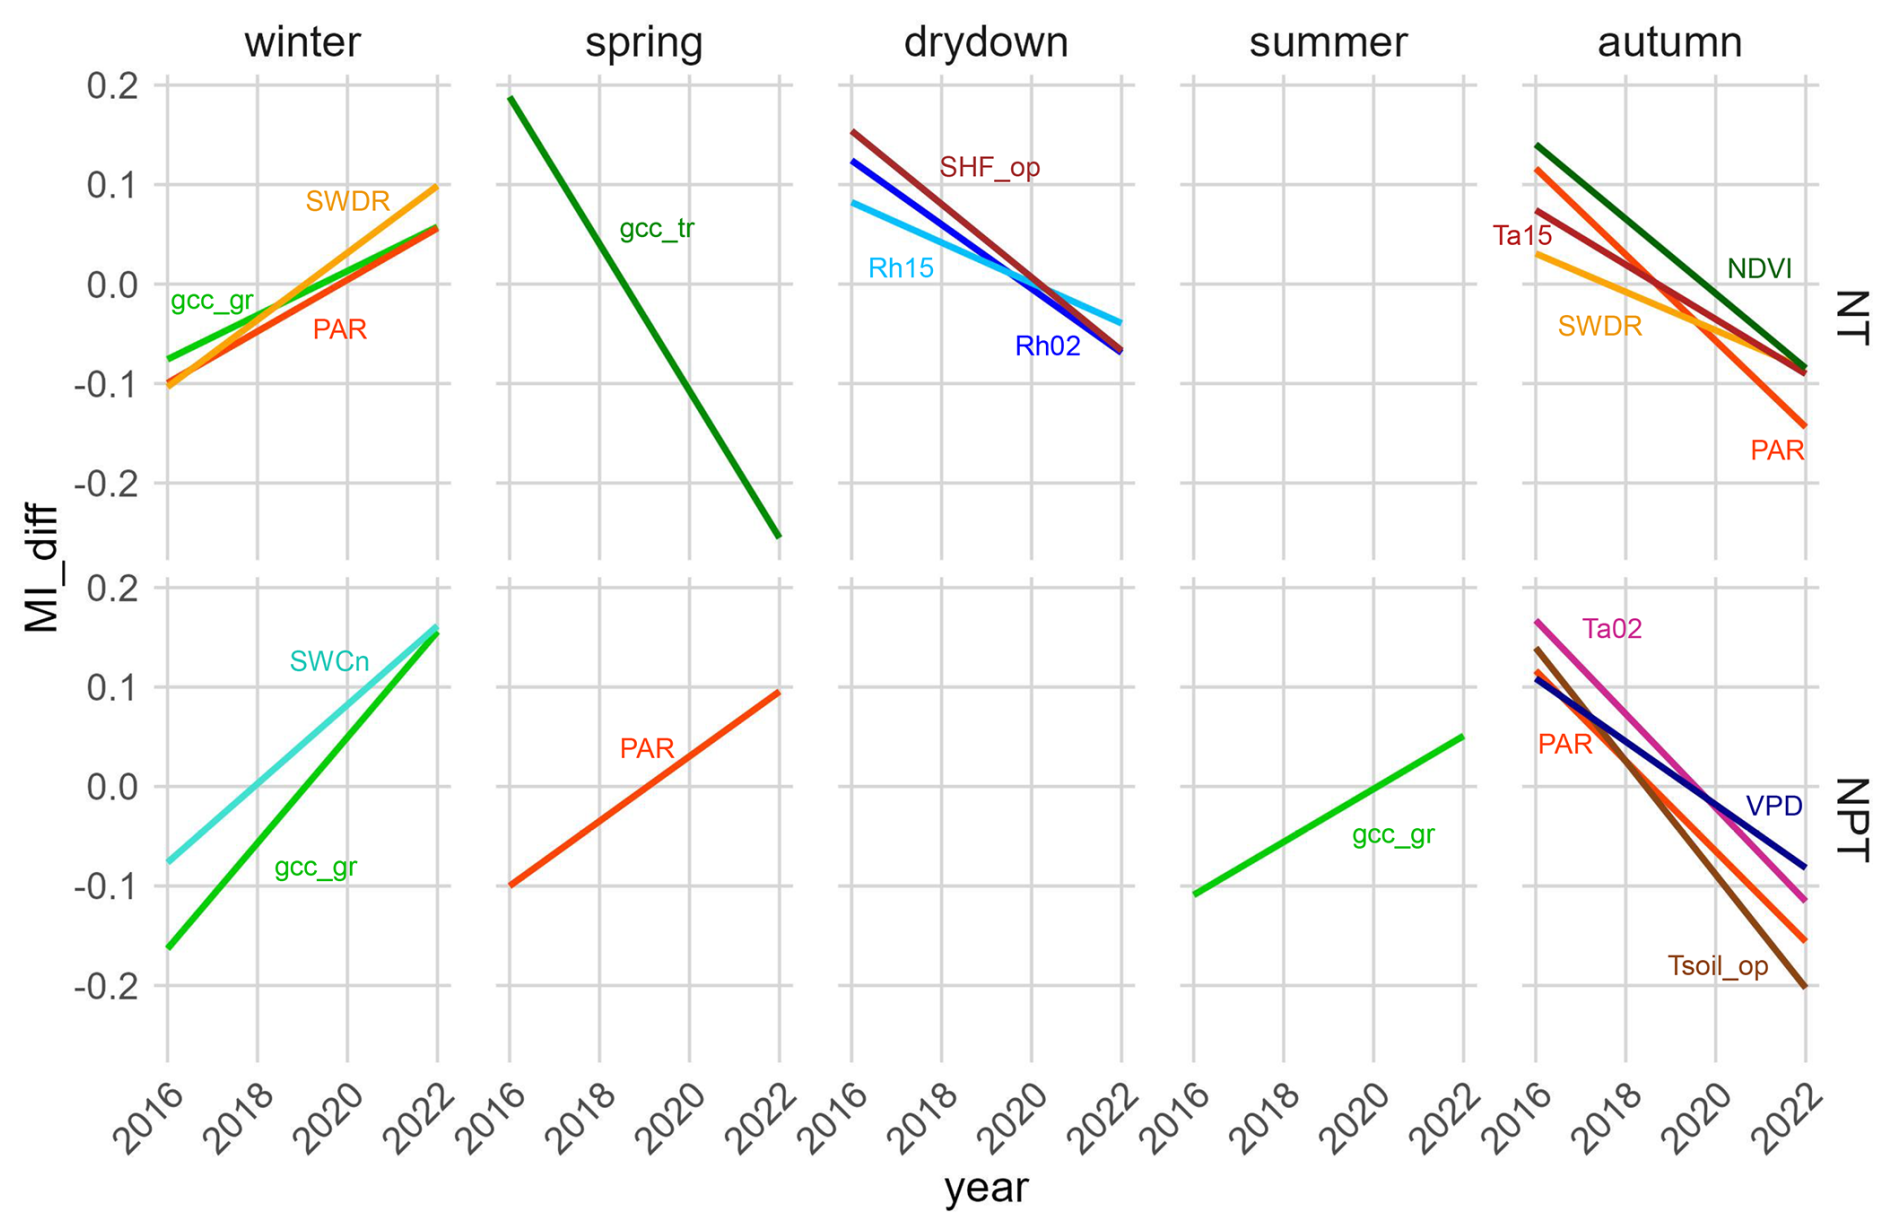
Figure 6Linear regressions of the seasonal synchronous mutual information difference (MIdiff) between NT and CT (top four panels) and between NPT and CT (bottom four panels) in different phenological seasons. CT refers to the control site, NT to the nitrogen-fertilized site, and NPT to the nitrogen + phosphorus-fertilized site. Find variable definitions in Table 1. Only the relationships with significant trends are shown. Significance level is set at p<0.05. Variables with overall MI < 0.2 at all towers are not shown.
Evergreen tree species have relatively constant foliage amount throughout the year and are able to use their deeper roots to access lower water resources in the soil (Baldocchi et al., 2004; Rolo and Moreno, 2012). The herbaceous layer is strongly dependent on rainfall variations as it accesses water from the topsoil with a dense near-surface root system (Ward et al., 2013). This layer is therefore much more sensitive to intra- and inter-annual climate variations (Luo et al., 2020). This is probably the reason why the seasonal NEE variability was very low at all sites in 2017. We attribute this to extraordinary dryness in that year, as dryness can lead to severe decreases in both GPP and Reco in this type of ecosystem (Ma et al., 2007).
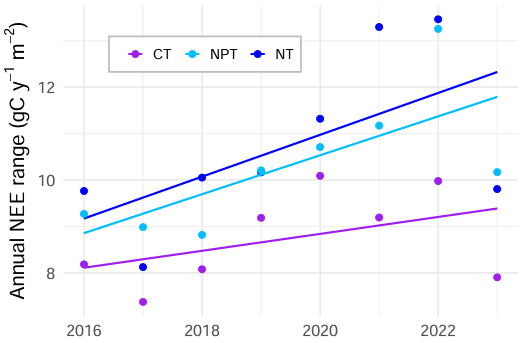
Figure 7Annual range of net ecosystem exchange (NEE) (i.e., maximum NEE minus minimum NEE) in gC m−2 yr−1 calculated using the seasonally reconstructed signals at the control site (CT), the nitrogen-fertilized site (NT), and the nitrogen + phosphorus-fertilized site (NPT). The range at NPT (p value = 0.049) significantly increased over 8 years. The ranges at NT (p value = 0.116) and CT (p value = 0.270) did not significantly increase.
4.2 Key controls of seasonal NEE
Our results indicate that proxies for vegetation greenness (NDVI and GCC at the grass layer derived from satellite and PhenoCam data, respectively) are the primary factors influencing the seasonal NEE signal in this ecosystem across treatments (Fig. 4). However, depending on the season, other variables such as air temperatures, VPD, moisture-related variables, and soil temperatures can also be important.
Many studies identify NDVI, a proxy for vegetation greenness and photosynthesis, as a primary predictor of NEE (Del Grosso et al., 2018; Hermance et al., 2015; Morgan et al., 2016). NDVI, generally derived from satellite data, represents ecosystem greenness, and its connection with ecosystem CO2 fluxes has been intensively studied (Barnes et al., 2016; Hermance et al., 2015; Morgan et al., 2016; Running and Nemani, 1988). However, quantifying the importance of coexisting vegetation layers is more complex and less understood. Digital repeat cameras and the vegetation greenness indices derived from them provide a powerful tool for analyzing the greenness of different plant types (Migliavacca et al., 2011; Petach et al., 2014; Richardson et al., 2009; Yan et al., 2019) and their influence on ecosystem fluxes (Luo et al., 2018; Moore et al., 2016, 2017; Wingate et al., 2015). Our analysis confirms that grass-layer dynamics are dominant in controlling seasonal ecosystem NEE at this site. Furthermore, we suggest that alternatively to NDVI, the enhanced vegetation index (EVI) can be considered as a representation of vegetation greenness, as it is found to covary closely with carbon flux in semi-arid ecosystems (Maluleke et al., 2024).
In situ measurements of vegetation greenness, however, are not available at all EC sites. We found that EF (i.e., evaporative fraction), representing the fraction of available energy transported by LE, is the third most important driver across treatments and methods on the synchronous scale. EF is strongly influenced by net radiation and water-related variables like soil moisture and VPD (Gentine et al., 2007; Tong et al., 2022). Since it depends on the portion of LE that is transpired by plants, it is also impacted by LAI (Gentine et al., 2007). EF therefore serves as a bridge between meteorological and vegetation controls. We suggest that at semi-arid sites where GCC measurements are not available, EF, calculated from measured LE and H, can serve as an important predictor of NEE.
In water-limited semi-arid ecosystems, NEE variations are typically dominated by soil-water-related variables such as SWCn and precipitation (Archibald et al., 2009; Baldocchi and Arias Ortiz, 2024; Huang et al., 2016b; Morgan et al., 2016). These variables usually exert a greater influence than radiation and temperature (Del Grosso et al., 2018; Kannenberg et al., 2024). Water availability promotes plant photosynthesis (Parton et al., 2012), but rain pulses can also enhance heterotrophic respiration rates (Morgan et al., 2016). While we do not use precipitation data for the MI analysis, as the measurements tend to be zero on many days and cannot be used in MI (Gong et al., 2014), SWCn can capture topsoil moisture and indicate precipitation pulses. Additionally, EF can serve as a proxy for these pulses. In our analysis we identify EF as one of the most important NEE drivers, while other moisture-related variables (e.g., SWCn, VPD, Rh) are generally ranked lower in importance compared to air and soil temperatures (Fig. 4). This might point to the relationship of EF with LAI being the dominant one in this context, as the vegetation indices showed greater importance than other water-related variables.
Air temperature can directly affect the speed of the enzyme responsible for carbon fixation and the rate of photosynthetic electron transport (Leuning, 2002; Xu and Baldocchi, 2003). Additionally, air temperature impacts the availability of photosynthetic enzymes, membrane fluidity, and the expression of associated proteins (Yamori et al., 2014). However, our results show that soil temperatures, both under oak trees and in open areas, play a significant role in explaining seasonal ecosystem NEE variations (Fig. 4), exceeding the importance of air temperatures. Soil respiration, one of the components in Reco, is highly sensitive to soil temperature (Conant et al., 2000), and elevated soil temperatures are associated with increased soil respiration in semi-arid ecosystems (Richardson et al., 2012). Soil temperatures influence heterotrophic respiration, which constitutes a substantial part of ecosystem NEE at our site (Casals et al., 2011). The high importance of soil temperatures suggests that Reco dominates ecosystem processes. This is especially relevant as the trend of increasing soil temperatures is stronger than that of air temperatures in the Mediterranean, particularly in grasslands with low soil moisture availability (Wang et al., 2024).
Radiation parameters, in particular PAR, do not appear to play a crucial role at the seasonal scale. While other studies have identified it as a major control of NEE in semi-arid ecosystems (Baldocchi and Arias Ortiz, 2024), we argue that PAR predominantly influences the daily NEE signal (Fig. S2), but its importance diminishes on seasonal timescales.
Overall, we observe only marginal differences between the treatments when considering the 7-year period (2016–2022) together. The added nutrients, particularly N, are primarily absorbed by the herbaceous layer (El-Madany et al., 2021) that senesces annually. Consequently, some of the added nutrients may be lost from the system, diminishing the long-term effect of the fertilization. By calculating MIsync and MImax for 1 year post-fertilization (March 2016–February 2017), we observe greater differences between the three plots in MI values and lag times (Fig. S4). Additionally, the ecosystem is strongly water-limited in the summer and energy-limited in the winter (Luo et al., 2018; Nair et al., 2019). These limitations can be more pronounced than nutrient limitations in the respective seasons, overshadowing the effects of added nutrients when analyzing the entire dataset together. Therefore, we divided the dataset into five phenological seasons to gain deeper insights into how added nutrients and altered stoichiometric balance affect seasonal NEE.
4.3 Fertilization effects in different phenological seasons
Looking into phenological seasons gives a deeper insight into how environmental variables influence seasonal NEE and how N : P levels affect this relationship. We find that nutrient addition has an effect on NEE–control relationships when other limitations are not too strong.
In winter, the ecosystem is energy-limited (Luo et al., 2018); therefore radiation components (i.e., PAR and SWDR) are important predictors for NEE. Tree albedo shows strong interactions with NEE at CT and NT, and NDVI shows strong interactions with NEE at both fertilized plots. Plant growth is enhanced by added nutrients (Luo et al., 2020) and flourishes due to abundant water availability (Lee et al., 2010) in this season. Also, N + P addition can lead to increased species diversity due to diminished nutrient limitation, facilitating the coexistence of multiple species (Köbel et al., 2024). Additionally, EF shares high mutual information with NEE variations. This is likely because respiration does not change significantly during this period and VPD is relatively low, leading to a strong coupling between NEE and LE. The stomatal conductance of tree transpiration is not too strong in winter, as soil water is abundant (Klein et al., 2013).
In the primary growing season, spring, NEE is typically dominated by GPP. The key drivers during this season across sites are the NDVI and the GCC of both the herbaceous and tree layers (Table 2). Water is usually abundant promoting plant photosynthesis during moderate temperatures in this time (Baldocchi and Arias Ortiz, 2024). These conditions are further supported by increased day length and higher radiation levels (Luo et al., 2018). The rise in incoming radiation, extended daylight hours, and elevated temperatures, coupled with the increased atmospheric evaporative demand (i.e., higher VPD), lead to a strong correlation between precipitation and both GCC and GPP, as observed in various Mediterranean ecosystems (Diodato and Bellocchi, 2008; Luo et al., 2018; Ma et al., 2007).
In the water-limited seasons, the nutrient effect is minimal as the grass layer is dormant and nutrients are not available due to lack of water. During the drydown period, soil moisture (i.e., SWCn) decreases drastically due to increasing air temperatures and scarce rainfall (Battista et al., 2018; Luo et al., 2018). This induces annual grasses to become senescent, leading to a loss of chlorophyll content (Luo et al., 2018). The rate of this senescence can determine whether NEE becomes positive or negative during this time. NDVI and grass-layer GCC, the most important predictors of NEE in this season across sites, can provide insights into the drydown rate. At NT grass-layer GCC is less important, which we attribute to a more rapid drydown, causing the grass layer to enter dormancy earlier than at other sites (Luo et al., 2020). This is because N addition promotes faster water usage (Luo et al., 2020), accelerating the decrease in SWCn and thereby hampering photosynthesis. It leads to a higher transpiration at NT compared to the other sites, potentially due to rhizosphere priming to increase P mobilization through microbes, as adding only N to the system leads to a P deficiency (El-Madany et al., 2021). In addition, N fertilization can alter species diversity and composition, likely selecting for species that senesce early (Wang and Tang, 2019). The higher interaction of soil temperatures with NEE in this season compared to the wetter seasons shows that Reco starts dominating NEE, as Reco is strongly connected to soil temperatures (Metz et al., 2023). VPD is a stronger control of NEE at NT compared to the other two plots. Transpiration is highest at NT, as plants transpire more to obtain limited P from the soil (El-Madany et al., 2021; Pang et al., 2018; Rose et al., 2018). It is therefore more sensitive to changes in VPD.
In summer, the driest period in the ecosystem, Reco dominates NEE and thus we find a strong interaction between NEE, soil temperature, and soil heat flux (i.e., SHF_op and SHF_bc). PAR is important for predicting seasonal NEE, showing the strongest interaction at CT. The importance of PAR is lower at NT and lowest at NPT. N + P addition increases the light-use efficiency most because P has a positive effect on photochemical quenching in leaves and on active fluorescence measurements (Martini et al., 2019; Singh and Reddy, 2014), leading to less dependence of NEE on radiation parameters at that site. At CT and NT, tree-layer GCC is important as the grass layer becomes senescent in the summer and is dormant in terms of ecosystem carbon flux. Since the greenness of the oak trees is relatively constant throughout the year, GPP is mainly determined by the tree layer in the summer months (Luo et al., 2018). However, gcc_gr shows a higher interaction with NEE than gcc_tr at NPT. Even though the majority of the grass layer is mostly dead in this season, there are some perennial species (e.g., Cynodon dactylon) remaining green for longer in summer that can regreen after rain events (personal communication with local collaborators). Therefore, N + P addition very likely leads to a consequential change in species composition (Köbel et al., 2024) with an increase in perennial species or an increase in their productivity. So far, it has been found that N + P addition can lead to an increasing number of forbs (Köbel et al., 2024), which tend to senesce later than other herbaceous species at the site (Luo et al., 2020). Nevertheless, the occurrence of summer-green species following nutrient addition will have to be investigated further.
During the regreening of the herbaceous layer starting in autumn, NDVI shows the strongest interaction with NEE at the fertilized plots – but not at the control plot. This aligns with previous studies showing that the green-up happens faster and the maximum GPP is higher at the fertilized plots, resulting from larger resource utilization at NT and/or improved resource-use efficiency at NPT (Luo et al., 2020). With the increase in soil moisture in early autumn, a greater quantity of organic and inorganic nutrients becomes available to plants (Agehara and Warncke, 2005; Luo et al., 2020). N availability in the soil is expected to be highest at this time (Morris et al., 2019), leading to higher net carbon uptake rates (El-Madany et al., 2021). Leaves quickly expand and pigments rapidly increase during this green-up period (Croft et al., 2015). At CT, the green-up happens later than at the fertilized plots, and NEE is dominated for a longer time by Reco rather than photosynthetic activity (Luo et al., 2020). Our results indicate that soil temperatures below oak trees are more important than those in open areas during this season (Table 2). The carbon pools under oak trees are the largest, providing substantial material for heterotrophic decomposition (Casals et al., 2009). During autumn, after a prolonged dry season in which a significant amount of litter and organic material has already been decomposed by microbes, litter remains available for further heterotrophic decomposition mainly below the trees. This ongoing decomposition under oak trees contributes to Reco, especially as the onset of rains enhances microbial activity due to increased water availability (Borken and Matzner, 2009). Additionally, the topsoil remains wet for longer after rain pulses under oak trees compared to open areas, as soil moisture during this season is primarily influenced by evaporation from the relatively bare soil. Therefore, differences in soil respiration between open and shaded pastures can also be attributed to variations in soil moisture.
The analysis of driver importance in different phenological seasons provides significant insights into ecosystem processes. However, some variables must be interpreted with caution. The soil properties at this site are highly heterogeneous, which affects the representativity of variables like soil temperature, soil water content, and soil heat flux in the EC flux footprint (Luo et al., 2018; Paulus et al., 2022). This is particularly relevant given the substantial differences between below-canopy and open-air soil conditions. To address this, we have separated the measurements into areas under the oak tree canopy and sunlit areas (Tsoil_bc and SHF_bc; Tsoil_op and SHF_op). Despite this effort, the local soil heterogeneity remains complex, influenced by varying proportions of sand, clay, and soil organic carbon (Casals et al., 2011; Weiner et al., 2018). Therefore, it is important to consider that these measures may not fully capture the sensitivity differences in the ecosystem.
4.4 Future implications
In winter, the ecosystem has abundant water availability, and energy becomes the primary limiting factor after nutrients were added. With the N-only addition, we observe that NEE becomes significantly more sensitive to changes in the radiation components, PAR and SWDR (Fig. 6). However, the addition of N + P results in a significant increase in sensitivity to changes in soil water content rather than to radiation components. N + P addition enhances water-use efficiency in the ecosystem (El-Madany et al., 2021; Martini et al., 2019), and consequently, water can be used more efficiently for photosynthesis – with similarly low radiation levels – and increased water availability could lead to higher GPP. N fertilization primarily affects the herbaceous layer (El-Madany et al., 2021), and our results agree with this, showing a significantly increased sensitivity of NEE to grass-layer greenness in winter at NT and an even steeper increase at NPT (Fig. 6). At the N + P plot there are more nutrients available at a higher N : P stoichiometric balance.
In spring, the sensitivity to tree-layer greenness decreases with N fertilization. An experimental study by Biro et al. (2024) supports these findings, demonstrating that N addition results in decreased tree growth due to competition with grass, which also intensively forages for P. The study suggests that grasses likely prevail in belowground competition, primarily due to their substantial root biomass allocation and investment in nutrient-acquiring enzymes, such as phosphatase. These adaptations enable grasses to efficiently sequester both N and P from the soil, thereby outcompeting trees for these essential nutrients (Biro et al., 2024; Rolo and Moreno, 2012). With the addition of N + P, we observe that the NEE sensitivity to PAR increases significantly in spring (Fig. 6). Water and nutrients are abundant in this season at NPT, making the availability of energy more crucial.
In water-limited seasons, ecosystem processes behave quite differently, and we observe less effect of nutrient addition. With N + P addition, there is no significant trend in NEE sensitivity to its drivers, except for a significantly increased sensitivity to grass-layer greenness in summer. This agrees with our previous findings that in summer gcc_gr is amongst the most important drivers at NPT (Table 2). This reflects changes in the species composition with N + P fertilization, particularly enhancing the growth and diversity of forbs and perennial species. We argue that long-term N + P addition could even lead to an increased productivity, resulting in an increasing importance of grass-layer greenness for ecosystem NEE.
The significant increase of the yearly NEE range at NPT over time (Fig. 7) is very likely caused by the increased NEE sensitivity to drivers in spring and summer, as the minimum NEE (usually occurring in spring) becomes more negative and maximum NEE (usually occurring in summer) becomes more positive. Consequently, the increased NEE sensitivity to changes in PAR in spring and increased sensitivity to gcc_gr in summer might enhance the size of this annual range.
In the drydown phase, we observe that with N addition, the sensitivity of ecosystem NEE to changes in relative humidity (i.e., Rh02 and Rh15) and SHF_op decreases significantly. This indicates that the ecosystem might become more resistant to variations in these variables in the future.
In autumn, both fertilized sites become less sensitive to changes in atmospheric variables such as the radiation components PAR and SWDR, air temperatures, and VPD, compared to the control plot. This indicates that water availability is predominantly important for NEE with added nutrients, while sensitivity to other variables decreases. It is possible that either the vegetation or the microbes become less restricted by these variables.
We conclude that with more N input from human activities entering terrestrial ecosystems (Peñuelas et al., 2013), savannas may become less sensitive to environmental factors like humidity, radiation, and temperature during the transitional seasons (i.e., drydown and regreening). These seasons determine the start and end of an active grass layer and therefore dominate the annual carbon balance of the ecosystem. In addition, we expect the NEE variability to increase even more in the future with more N deposition and a changing climate. To note, the results of this study cannot explain how long-term nutrient addition affects the ecosystem's resistance to extreme events. As the timing of the application of N and P was chosen to increase the possibility that the sites could be used by vegetation in the next growing season, the observed changes in NEE and driver importance at NT and NPT might have been smaller if fertilization had been applied at different timing.
We analyzed a long-term (2016–2022/23) dataset of flux, biometeorological, satellite, and PhenoCam data from the semi-arid experimental site, Majadas de Tiétar, to evaluate the importance of different drivers for NEE across different nutrient levels and balances. To detect the most important drivers, we used only daytime daily values of observed data in order to extract the seasonal signals of all variables using singular spectrum analysis.
With both Pearson correlation and mutual information analysis, we show that the grass-layer greenness drives seasonal variations in NEE across all treatments and that the addition of both N and N + P increases the seasonal NEE variability. We find that soil temperatures are more important in explaining NEE variations than previously expected. When looking into the 7-year data, the water–energy limitation cycles overshadow the nutrient addition effect. Dividing the dataset into phenological seasons reveals how environmental variables and nutrient manipulation influenced NEE on a seasonal scale. Altered nutrient levels affect NEE–control relationships when water and energy limitations are not too strong, particularly during the primary growing season in spring, where NDVI and grass-layer GCC are key drivers. In autumn, NDVI shows the strongest interaction with NEE at fertilized plots, indicating faster green-up and higher GPP due to enhanced nutrient availability. During drier seasons, nutrient effects are less pronounced as the grass layer becomes dormant.
N and N + P additions significantly alter the sensitivity of NEE to environmental controls over time. In winter, N addition increases NEE sensitivity to radiation, while N + P addition increases its sensitivity to changes in soil water content. In spring, N + P addition increases sensitivity to PAR. The herbaceous layer primarily benefits from nutrient additions, leading to increased sensitivity of NEE to grass-layer greenness and decreased sensitivity to tree-layer greenness. During water-limited seasons, nutrient effects were minimal, except for increased importance of grass-layer GCC in summer at NPT, indicating an increase in abundance and/or productivity with N + P treatment due to changed species composition and higher biodiversity. We conclude that with increasing anthropogenic N deposition, the carbon dynamics of savannas might become even more variable in the future and might also become more resistant to variations in some atmospheric variables in the transitional seasons, which are important periods in determining the annual carbon balance of the ecosystem. However, their responses to extreme events in the future remain to be explored.
Ecosystem-level data are available on the European Fluxes Database (https://www.europe-fluxdata.eu/, last access: 3 July 2024) and PhenoCam (https://phenocam.nau.edu/webcam/, last access: 15 July 2024). To find the data on both the European Fluxes Database Cluster and the Phenocam network, site IDs are sufficient. The site IDs are: ES-Lma (for the control tower, CT), ES-Lm1 (for the north tower, NT), and ES-Lm2 (for the south tower, NPT). The FluxnetEO dataset can be found on the ICOS Carbon Portal.
The supplement related to this article is available online at https://doi.org/10.5194/bg-22-2935-2025-supplement.
LN: conceptualization, data curation, methodology, formal analysis, and writing (original draft preparation). TSE: data curation and writing (review and editing). JN: writing (review and editing). AC: data curation and writing (review and editing). GM: data curation and writing (review and editing). RN: software and writing (review and editing). YL: software and writing (review and editing). AH: supervision and writing (review and editing). VR: data curation and writing (review and editing). MR: resources, funding acquisition, and writing (review and editing). SL: conceptualization, methodology, supervision, and writing (review and editing).
The contact author has declared that none of the authors has any competing interests.
Publisher's note: Copernicus Publications remains neutral with regard to jurisdictional claims made in the text, published maps, institutional affiliations, or any other geographical representation in this paper. While Copernicus Publications makes every effort to include appropriate place names, the final responsibility lies with the authors.
We thank Mirco Migliavacca (European Commission, Joint Research Centre, Ispra, Varese, Italy) for sharing advice and expertise, the Freiland Group at Max Planck Institute for Biogeochemistry in Jena for maintaining and calibrating sites and sensors, and Ramón López for daily data collection and site maintenance.
Laura Nadolski received financial support from the International Max Planck Research School for Biogeochemical Cycles (IMPRS-gBGC).
The GCC data used in this study were provided by the PhenoCam Network, which has been supported by the National Science Foundation, the Long-Term Agroecosystem Research (LTAR) network which is supported by the United States Department of Agriculture (USDA), the U.S. Department of Energy, the U.S. Geological Survey, the Northeastern States Research Cooperative, and the USA National Phenology Network. We thank the PhenoCam Network collaborators, including site PIs and technicians, for publicly sharing the data that were used in this paper.
This research has been supported by the Alexander von Humboldt-Stiftung.
The article processing charges for this open-access publication were covered by the Max Planck Society.
This paper was edited by Marijn Bauters and reviewed by two anonymous referees.
Agehara, S. and Warncke, D. D.: Soil Moisture and Temperature Effects on Nitrogen Release from Organic Nitrogen Sources, Soil Sci. Soc. Amer. J., 69, 1844–1855, https://doi.org/10.2136/sssaj2004.0361, 2005.
Ahlström, A., Raupach, M. R., Schurgers, G., Smith, B., Arneth, A., Jung, M., Reichstein, M., Canadell, J. G., Friedlingstein, P., Jain, A. K., Kato, E., Poulter, B., Sitch, S., Stocker, B. D., Viovy, N., Wang, Y. P., Wiltshire, A., Zaehle, S., and Zeng, N.: The dominant role of semi-arid ecosystems in the trend and variability of the land CO2 sink, Science, 348, 895–899, https://doi.org/10.1126/science.aaa1668, 2015.
Allen, M. R. and Smith, L. A.: Monte Carlo SSA: Detecting irregular oscillations in the Presence of Colored Noise, J. Clim., 9, 3373–3404, https://doi.org/10.1175/1520-0442(1996)009<3373:MCSDIO>2.0.CO;2, 1996.
Archibald, S. A., Kirton, A., van der Merwe, M. R., Scholes, R. J., Williams, C. A., and Hanan, N.: Drivers of inter-annual variability in Net Ecosystem Exchange in a semi-arid savanna ecosystem, South Africa, Biogeosciences, 6, 251–266, https://doi.org/10.5194/bg-6-251-2009, 2009.
Austin, A. T. and Vivanco, L.: Plant litter decomposition in a semi-arid ecosystem controlled by photodegradation, Nature, 442, 555–558, https://doi.org/10.1038/nature05038, 2006.
Baldocchi, D. D.: How eddy covariance flux measurements have contributed to our understanding of Global Change Biology, Glob. Change Biol., 26, 242–260, https://doi.org/10.1111/gcb.14807, 2020.
Baldocchi, D. D. and Arias Ortiz, A.: Alternating Conditional Expectations: Introducing a Non-Parametric Statistical Method to Interpret Long-Term Greenhouse Gas Flux Measurements Over Semi-Arid and Wetland Ecosystems, J. Geophys. Res.-Biogeo., 129, e2023JG007818, https://doi.org/10.1029/2023JG007818, 2024.
Baldocchi, D. D., Ma, S. Y., and Verfaillie, J.: On the inter- and intra-annual variability of ecosystem evapotranspiration and water use efficiency of an oak savanna and annual grassland subjected to booms and busts in rainfall, Glob. Change Biol., 27, 359–375, https://doi.org/10.1111/gcb.15414, 2021.
Baldocchi, D. D., Xu, L., and Kiang, N.: How plant functional-type, weather, seasonal drought, and soil physical properties alter water and energy fluxes of an oak–grass savanna and an annual grassland, Agr. Forest Meteorol., 123, 13–39, https://doi.org/10.1016/j.agrformet.2003.11.006, 2004.
Barnes, M. L., Moran, M. S., Scott, R. L., Kolb, T. E., Ponce-Campos, G. E., Moore, D. J. P., Ross, M. A., Mitra, B., and Dore, S.: Vegetation productivity responds to sub-annual climate conditions across semiarid biomes, Ecosphere, 7, e01339, https://doi.org/10.1002/ecs2.1339, 2016.
Bastida, F., Torres, I. F., Moreno, J. L., Baldrian, P., Ondoño, S., Ruiz‐Navarro, A., Hernández, T., Richnow, H. H., Starke, R., García, C., and Jehmlich, N.: The active microbial diversity drives ecosystem multifunctionality and is physiologically related to carbon availability in Mediterranean semi‐arid soils, Mol. Ecol., 25, 4660–4673, https://doi.org/10.1111/mec.13783, 2016.
Battista, P., Chiesi, M., Fibbi, L., Gardin, L., Rapi, B., Romanelli, S., Romani, M., Sabatini, F., Salerni, E., Perini, C., and Maselli, F.: Simulation of Soil Water Content in Mediterranean Ecosystems by Biogeochemical and Remote Sensing Models, Water, 10, 665, https://doi.org/10.3390/w10050665, 2018.
Berger, S., Bliefernicht, J., Linstadter, A., Canak, K., Guug, S., Heinzeller, D., Hingerl, L., Mauder, M., Neidl, F., Quansah, E., Salack, S., Steinbrecher, R., and Kunstmann, H.: The impact of rain events on CO2 emissions from contrasting land use systems in semi-arid West African savannas, Sci. Total Environ., 647, 1478–1489, https://doi.org/10.1016/j.scitotenv.2018.07.397, 2019.
Biriukova, K., Pacheco-Labrador, J., Migliavacca, M., Mahecha, M. D., Gonzalez-Cascon, R., Martin, M. P., and Rossini, M.: Performance of Singular Spectrum Analysis in Separating Seasonal and Fast Physiological Dynamics of Solar-Induced Chlorophyll Fluorescence and PRI Optical Signals, J. Geophys. Res.-Biogeo., 126, e2020JG006158, https://doi.org/10.1029/2020JG006158, 2021.
Biro, A., Wong, M. Y., Zhou, Y., Batterman, S. A., and Staver, A. C.: Nitrogen and phosphorus availability alters tree-grass competition intensity in savannas, J. Ecol., 112, 1026–1038, https://doi.org/10.1111/1365-2745.14284, 2024.
Bogdanovich, E., Perez-Priego, O., El-Madany, T. S., Guderle, M., Pacheco-Labrador, J., Levick, S. R., Moreno, G., Carrara, A., Martin, M. P., and Migliavacca, M.: Using terrestrial laser scanning for characterizing tree structural parameters and their changes under different management in a Mediterranean open woodland, Forest Ecol. Manag., 486, 118945, https://doi.org/10.1016/j.foreco.2021.118945, 2021.
Borken, W. and Matzner, E.: Reappraisal of drying and wetting effects on C and N mineralization and fluxes in soils, Glob. Change Biol., 15, 808–824, https://doi.org/10.1111/j.1365-2486.2008.01681.x, 2009.
Casals, P., Gimeno, C., Carrara, A., Lopez-Sangil, L., and Sanz, M. J.: Soil CO2 efflux and extractable organic carbon fractions under simulated precipitation events in a Mediterranean Dehesa, Soil Biol. Biochem., 41, 1915–1922, https://doi.org/10.1016/j.soilbio.2009.06.015, 2009.
Casals, P., Lopez-Sangil, L., Carrara, A., Gimeno, C., and Nogues, S.: Autotrophic and heterotrophic contributions to short-term soil CO2 efflux following simulated summer precipitation pulses in a Mediterranean dehesa, Global Biogeochem. Cy., 25, GB3012, https://doi.org/10.1029/2010gb003973, 2011.
Chamberlain, S. D., Anthony, T. L., Silver, W. L., Eichelmann, E., Hemes, K. S., Oikawa, P. Y., Sturtevant, C., Szutu, D. J., Verfaillie, J. G., and Baldocchi, D. D.: Soil properties and sediment accretion modulate methane fluxes from restored wetlands, Glob. Change Biol., 24, 4107–4121, https://doi.org/10.1111/gcb.14124, 2018.
Chamberlain, S. D., Hemes, K. S., Eichelmann, E., Szutu, D. J., Verfaillie, J. G., and Baldocchi, D. D.: Effect of Drought-Induced Salinization on Wetland Methane Emissions, Gross Ecosystem Productivity, and Their Interactions, Ecosystems, 23, 675–688, https://doi.org/10.1007/s10021-019-00430-5, 2020.
Conant, R. T., Klopatek, J. M., and Klopatek, C. C.: Environmental Factors Controlling Soil Respiration in Three Semiarid Ecosystems, Soil Sci. Soc. Amer. J., 64, 383–390, https://doi.org/10.2136/sssaj2000.641383x, 2000.
Croft, H., Chen, J. M., Froelich, N. J., Chen, B., and Staebler, R. M.: Seasonal controls of canopy chlorophyll content on forest carbon uptake: Implications for GPP modeling, J. Geophys. Res.-Biogeo., 120, 1576–1586, https://doi.org/10.1002/2015JG002980, 2015.
Cubera, E. and Moreno, G.: Effect of land-use on soil water dynamic in dehesas of Central–Western Spain, CATENA, 71, 298–308, https://doi.org/10.1016/j.catena.2007.01.005, 2007.
Del Grosso, S. J., Parton, W. J., Derner, J. D., Chen, M. S., and Tucker, C. J.: Simple models to predict grassland ecosystem C exchange and actual evapotranspiration using NDVI and environmental variables, Agr. Forest Meteorol., 249, 1–10, https://doi.org/10.1016/j.agrformet.2017.11.007, 2018.
Den Herder, M., Moreno, G., Mosquera-Losada, R. M., Palma, J. H. N., Sidiropoulou, A., Santiago Freijanes, J. J., Crous-Duran, J., Paulo, J. A., Tomé, M., Pantera, A., Papanastasis, V. P., Mantzanas, K., Pachana, P., Papadopoulos, A., Plieninger, T., and Burgess, P. J.: Current extent and stratification of agroforestry in the European Union, Agr. Ecosyst. Environ., 241, 121–132, https://doi.org/10.1016/j.agee.2017.03.005, 2017.
Diodato, N. and Bellocchi, G.: Modelling vegetation greenness responses to climate variability in a Mediterranean terrestrial ecosystem, Environ. Monit. Assess., 143, 147–159, https://doi.org/10.1007/s10661-007-9964-z, 2008.
Dubbert, M., Piayda, A., Cuntz, M., Correia, A. C., Silva, F. C. E., Pereira, J. S., and Werner, C.: Stable oxygen isotope and flux partitioning demonstrates understory of an oak savanna contributes up to half of ecosystem carbon and water exchange, Front. Plant Sci., 5, 530, https://doi.org/10.3389/fpls.2014.00530, 2014.
El-Madany, T. S., Reichstein, M., Perez-Priego, O., Carrara, A., Moreno, G., Martin, M. P., Pacheco-Labrador, J., Wohlfahrt, G., Nieto, H., Weber, U., Kolle, O., Luo, Y. P., Carvalhais, N., and Migliavacca, M.: Drivers of spatio-temporal variability of carbon dioxide and energy fluxes in a Mediterranean savanna ecosystem, Agr. Forest Meteorol., 262, 258–278, https://doi.org/10.1016/j.agrformet.2018.07.010, 2018.
El-Madany, T. S., Reichstein, M., Carrara, A., Martin, M. P., Moreno, G., Gonzalez-Cascon, R., Penuelas, J., Ellsworth, D. S., Burchard-Levine, V., Hammer, T. W., Knauer, J., Kolle, O., Luo, Y. P., Pacheco-Labrador, J., Nelson, J. A., Perez-Priego, O., Rolo, V., Wutzler, T., and Migliavacca, M.: How Nitrogen and Phosphorus Availability Change Water Use Efficiency in a Mediterranean Savanna Ecosystem, J. Geophys. Res.-Biogeo., 126, e2020JG006005, https://doi.org/10.1029/2020JG006005, 2021.
Fawcett, D., Cunliffe, A. M., Sitch, S., O'Sullivan, M., Anderson, K., Brazier, R. E., Hill, T. C., Anthoni, P., Arneth, A., Arora, V. K., Briggs, P. R., Goll, D. S., Jain, A. K., Li, X., Lombardozzi, D., Nabel, J. E. M. S., Poulter, B., Séférian, R., Tian, H., Viovy, N., Wigneron, J.-P., Wiltshire, A., and Zaehle, S.: Assessing Model Predictions of Carbon Dynamics in Global Drylands, Front. Environ. Sci., 10, 790200, https://doi.org/10.3389/fenvs.2022.790200, 2022.
Fleischer, K., Rebel, K. T., Van Der Molen, M. K., Erisman, J. W., Wassen, M. J., Van Loon, E. E., Montagnani, L., Gough, C. M., Herbst, M., Janssens, I. A., Gianelle, D., and Dolman, A. J.: The contribution of nitrogen deposition to the photosynthetic capacity of forests, Global Biogeochem. Cy., 27, 187–199, https://doi.org/10.1002/gbc.20026, 2013.
Fraser, A. M. and Swinney, H. L.: Independent coordinates for strange attractors from mutual information, Phys. Rev. A, 33, 1134–1140, https://doi.org/10.1103/PhysRevA.33.1134, 1986.
Fratini, G. and Mauder, M.: Towards a consistent eddy-covariance processing: an intercomparison of EddyPro and TK3, Atmos. Meas. Tech., 7, 2273–2281, https://doi.org/10.5194/amt-7-2273-2014, 2014.
Friedlingstein, P., O'Sullivan, M., Jones, M. W., Andrew, R. M., Gregor, L., Hauck, J., Le Quéré, C., Luijkx, I. T., Olsen, A., Peters, G. P., Peters, W., Pongratz, J., Schwingshackl, C., Sitch, S., Canadell, J. G., Ciais, P., Jackson, R. B., Alin, S. R., Alkama, R., Arneth, A., Arora, V. K., Bates, N. R., Becker, M., Bellouin, N., Bittig, H. C., Bopp, L., Chevallier, F., Chini, L. P., Cronin, M., Evans, W., Falk, S., Feely, R. A., Gasser, T., Gehlen, M., Gkritzalis, T., Gloege, L., Grassi, G., Gruber, N., Gürses, Ö., Harris, I., Hefner, M., Houghton, R. A., Hurtt, G. C., Iida, Y., Ilyina, T., Jain, A. K., Jersild, A., Kadono, K., Kato, E., Kennedy, D., Klein Goldewijk, K., Knauer, J., Korsbakken, J. I., Landschützer, P., Lefèvre, N., Lindsay, K., Liu, J., Liu, Z., Marland, G., Mayot, N., McGrath, M. J., Metzl, N., Monacci, N. M., Munro, D. R., Nakaoka, S.-I., Niwa, Y., O'Brien, K., Ono, T., Palmer, P. I., Pan, N., Pierrot, D., Pocock, K., Poulter, B., Resplandy, L., Robertson, E., Rödenbeck, C., Rodriguez, C., Rosan, T. M., Schwinger, J., Séférian, R., Shutler, J. D., Skjelvan, I., Steinhoff, T., Sun, Q., Sutton, A. J., Sweeney, C., Takao, S., Tanhua, T., Tans, P. P., Tian, X., Tian, H., Tilbrook, B., Tsujino, H., Tubiello, F., van der Werf, G. R., Walker, A. P., Wanninkhof, R., Whitehead, C., Willstrand Wranne, A., Wright, R., Yuan, W., Yue, C., Yue, X., Zaehle, S., Zeng, J., and Zheng, B.: Global Carbon Budget 2022, Earth Syst. Sci. Data, 14, 4811–4900, https://doi.org/10.5194/essd-14-4811-2022, 2022.
Gentine, P., Entekhabi, D., Chehbouni, A., Boulet, G., and Duchemin, B.: Analysis of evaporative fraction diurnal behaviour, Agr. Forest Meteorol., 143, 13–29, https://doi.org/10.1016/j.agrformet.2006.11.002, 2007.
Golyandina, N. and Korobeynikov, A.: Basic Singular Spectrum Analysis and forecasting with R, Comput. Stat. Data An., 71, 934–954, https://doi.org/10.1016/j.csda.2013.04.009, 2014.
Golyandina, N. and Zhigljavsky, A.: Singular Spectrum Analysis for Time Series, Springer Berlin Heidelberg, Berlin, Heidelberg, https://doi.org/10.1007/978-3-642-34913-3, 2013.
Golyandina, N., Nekrutin, V., and Zhigaljavsky, A.: Analysis of Time Series Structure. SSA and Related Techniques, Chapman and Hall/CRC, Boca Raton, London, New York, Washington D.C., https://doi.org/10.1201/9780367801687, 2001.
Golyandina, N., Korobeynikov, A., and Zhigljavsky, A.: Singular Spectrum Analysis, Springer-Verlag Berlin Heidelberg, Berlin, Germany, https://doi.org/10.1007/978-3-662-57380-8, 2018.
Gong, W., Yang, D., Gupta, H. V., and Nearing, G.: Estimating information entropy for hydrological data: One-dimensional case, Water Resour. Res., 50, 5003–5018, https://doi.org/10.1002/2014WR015874, 2014.
Haverd, V., Ahlstrom, A., Smith, B., and Canadell, J. G.: Carbon cycle responses of semi-arid ecosystems to positive asymmetry in rainfall, Glob. Change Biol., 23, 793–800, https://doi.org/10.1111/gcb.13412, 2017.
Hermance, J. F., Augustine, D. J., and Derner, J. D.: Quantifying characteristic growth dynamics in a semi-arid grassland ecosystem by predicting short-term NDVI phenology from daily rainfall: a simple four parameter coupled-reservoir model, Int. J. Remote Sens., 36, 5637–5663, https://doi.org/10.1080/01431161.2015.1103916, 2015.
Higgins, S. I., Bond, W. J., and Trollope, W. S. W.: Fire, resprouting and variability: a recipe for grass–tree coexistence in savanna, J. Ecol., 88, 213–229, https://doi.org/10.1046/j.1365-2745.2000.00435.x, 2000.
House, J. I., Archer, S., Breshears, D. D., Scholes, R. J., and NCEAS: Tree–Grass Interactions Participants: Conundrums in mixed woody–herbaceous plant systems, J. Biogeogr., 30, 1763–1777, https://doi.org/10.1046/j.1365-2699.2003.00873.x, 2003.
Hu, Y., Xiang, D., Veresoglou, S. D., Chen, F., Chen, Y., Hao, Z., Zhang, X., and Chen, B.: Soil organic carbon and soil structure are driving microbial abundance and community composition across the arid and semi-arid grasslands in northern China, Soil Biol. Biochem., 77, 51–57, https://doi.org/10.1016/j.soilbio.2014.06.014, 2014.
Huang, Z., Liu, B., Davis, M., Sardans, J., Penuelas, J., and Billings, S.: Long-term nitrogen deposition linked to reduced water use efficiency in forests with low phosphorus availability, New Phytol., 210, 431–442, https://doi.org/10.1111/nph.13785, 2016a.
Huang, L., He, B., Chen, A., Wang, H., Liu, J., Lű, A., and Chen, Z.: Drought dominates the interannual variability in global terrestrial net primary production by controlling semi-arid ecosystems, Sci. Rep., 6, 24639, https://doi.org/10.1038/srep24639, 2016b.
Huxman, T. E., Snyder, K. A., Tissue, D., Leffler, A. J., Ogle, K., Pockman, W. T., Sandquist, D. R., Potts, D. L., and Schwinning, S.: Precipitation pulses and carbon fluxes in semiarid and arid ecosystems, Oecologia, 141, 254–268, https://doi.org/10.1007/s00442-004-1682-4, 2004.
Jung, M., Schwalm, C., Migliavacca, M., Walther, S., Camps-Valls, G., Koirala, S., Anthoni, P., Besnard, S., Bodesheim, P., Carvalhais, N., Chevallier, F., Gans, F., Goll, D. S., Haverd, V., Köhler, P., Ichii, K., Jain, A. K., Liu, J., Lombardozzi, D., Nabel, J. E. M. S., Nelson, J. A., O'Sullivan, M., Pallandt, M., Papale, D., Peters, W., Pongratz, J., Rödenbeck, C., Sitch, S., Tramontana, G., Walker, A., Weber, U., and Reichstein, M.: Scaling carbon fluxes from eddy covariance sites to globe: synthesis and evaluation of the FLUXCOM approach, Biogeosciences, 17, 1343–1365, https://doi.org/10.5194/bg-17-1343-2020, 2020.
Kannenberg, S. A., Anderegg, W. R. L., Barnes, M. L., Dannenberg, M. P., and Knapp, A. K.: Dominant role of soil moisture in mediating carbon and water fluxes in dryland ecosystems, Nat. Geosci., 17, 38–43, https://doi.org/10.1038/s41561-023-01351-8, 2024.
Klein, T., Shpringer, I., Fikler, B., Elbaz, G., Cohen, S., and Yakir, D.: Relationships between stomatal regulation, water-use, and water-use efficiency of two coexisting key Mediterranean tree species, Forest Ecol. Manag., 302, 34–42, https://doi.org/10.1016/j.foreco.2013.03.044, 2013.
Knox, S. H., Windham-Myers, L., Anderson, F., Sturtevant, C., and Bergamaschi, B.: Direct and Indirect Effects of Tides on Ecosystem-Scale CO2 Exchange in a Brackish Tidal Marsh in Northern California, J. Geophys. Res.-Biogeo., 123, 787–806, https://doi.org/10.1002/2017jg004048, 2018.
Knox, S. H., Bansal, S., McNicol, G., Schafer, K., Sturtevant, C., Ueyama, M., Valach, A. C., Baldocchi, D., Delwiche, K., Desai, A. R., Euskirchen, E., Liu, J. X., Lohila, A., Malhotra, A., Melling, L., Riley, W., Runkle, B. R. K., Turner, J., Vargas, R., Zhu, Q., Alto, T., Fluet-Chouinard, E., Goeckede, M., Melton, J. R., Sonnentag, O., Vesala, T., Ward, E., Zhang, Z., Feron, S., Ouyang, Z. T., Alekseychik, P., Aurela, M., Bohrer, G., Campbell, D. I., Chen, J. Q., Chu, H. S., Dalmagro, H. J., Goodrich, J. P., Gottschalk, P., Hirano, T., Iwata, H., Jurasinski, G., Kang, M., Koebsch, F., Mammarella, I., Nilsson, M. B., Ono, K., Peichl, M., Peltola, O., Ryu, Y., Sachs, T., Sakabe, A., Sparks, J. P., Tuittila, E. S., Vourlitis, G. L., Wong, G. X., Windham-Myers, L., Poulter, B., and Jackson, R. B.: Identifying dominant environmental predictors of freshwater wetland methane fluxes across diurnal to seasonal time scales, Glob. Change Biol., 27, 3582–3604, https://doi.org/10.1111/gcb.15661, 2021.
Köbel, M., Chozas, S., Moreno, G., Migliavacca, M., Branquinho, C., and Nunes, A.: Grasses don't always win: Short-term effects of fertilization on taxonomic and functional diversity of a Mediterranean annual grassland, Agr. Ecosyst. Environ., 373, 109125, https://doi.org/10.1016/j.agee.2024.109125, 2024.
Kondrashov, D. and Ghil, M.: Spatio-temporal filling of missing points in geophysical data sets, Nonl. Process. Geophys., 13, 151–159, https://doi.org/10.5194/npg-13-151-2006, 2006.
Lee, M., Manning, P., Rist, J., Power, S. A., and Marsh, C.: A global comparison of grassland biomass responses to CO 2 and nitrogen enrichment, Philos. T. R. Soc. B, 365, 2047–2056, https://doi.org/10.1098/rstb.2010.0028, 2010.
Leuning, R.: Temperature dependence of two parameters in a photosynthesis model, Plant Cell Environ., 25, 1205–1210, https://doi.org/10.1046/j.1365-3040.2002.00898.x, 2002.
Linscheid, N., Estupinan-Suarez, L. M., Brenning, A., Caryalhais, N., Cremer, F., Gans, F., Rammig, A., Reichstein, M., Sierra, C. A., and Mahecha, M. D.: Towards a global understanding of vegetation-climate dynamics at multiple timescales, Biogeosciences, 17, 945–962, https://doi.org/10.5194/bg-17-945-2020, 2020.
Liu, J. G., Valach, A., Baldocchi, D., and Lai, D. Y. F.: Biophysical Controls of Ecosystem-Scale Methane Fluxes From a Subtropical Estuarine Mangrove: Multiscale, Nonlinearity, Asynchrony and Causality, Global Biogeochem. Cy., 36, e2021GB007179, https://doi.org/10.1029/2021GB007179, 2022.
Luo, Y., El-Madany, T. S., Filippa, G., Ma, X. L., Ahrens, B., Carrara, A., Gonzalez-Cascon, R., Cremonese, E., Galvagno, M., Hammer, T. W., Pacheco-Labrador, J., Martin, M. P., Moreno, G., Perez-Priego, O., Reichstein, M., Richardson, A. D., Romermann, C., and Migliavacca, M.: Using Near-Infrared-Enabled Digital Repeat Photography to Track Structural and Physiological Phenology in Mediterranean Tree-Grass Ecosystems, Remote Sens.-Basel, 10, 1293, https://doi.org/10.3390/rs10081293, 2018.
Luo, Y., El-Madany, T., Ma, X. L., Nair, R., Jung, M., Weber, U., Filippa, G., Bucher, S. F., Moreno, G., Cremonese, E., Carrara, A., Gonzalez-Cascon, R., Escudero, Y. C., Galvagno, M., Pacheco-Labrador, J., Martin, M. P., Perez-Priego, O., Reichstein, M., Richardson, A. D., Menzel, A., Romermann, C., and Migliavacca, M.: Nutrients and water availability constrain the seasonality of vegetation activity in a Mediterranean ecosystem, Glob. Change Biol., 26, 4379–4400, https://doi.org/10.1111/gcb.15138, 2020.
Ma, Baldocchi, D. D., Xu, L. K., and Hehn, T.: Inter-annual variability in carbon dioxide exchange of an oak/grass savanna and open grassland in California, Agr. Forest Meteorol., 147, 157–171, https://doi.org/10.1016/j.agrformet.2007.07.008, 2007.
Ma, S., Baldocchi, D., Wolf, S., and Verfaillie, J.: Slow ecosystem responses conditionally regulate annual carbon balance over 15 years in Californian oak-grass savanna, Agr. Forest Meteorol., 228/229, 252–264, https://doi.org/10.1016/j.agrformet.2016.07.016, 2016.
MacBean, N., Scott, R. L., Biederman, J. A., Peylin, P., Kolb, T., Litvak, M. E., Krishnan, P., Meyers, T. P., Arora, V. K., Bastrikov, V., Goll, D., Lombardozzi, D. L., Nabel, J. E. M. S., Pongratz, J., Sitch, S., Walker, A. P., Zaehle, S., and Moore, D. J. P.: Dynamic global vegetation models underestimate net CO2 flux mean and inter-annual variability in dryland ecosystems, Environ. Res. Lett., 16, 094023, https://doi.org/10.1088/1748-9326/ac1a38, 2021.
Mahecha, Reichstein, M., Lange, H., Carvalhais, N., Bernhofer, C., Grunwald, T., Papale, D., and Seufert, G.: Characterizing ecosystem-atmosphere interactions from short to interannual time scales, Biogeosciences, 4, 743–758, https://doi.org/10.5194/bg-4-743-2007, 2007.
Mahecha, M. D., Reichstein, M., Carvalhais, N., Lasslop, G., Lange, H., Seneviratne, S. I., Vargas, R., Ammann, C., Arain, M. A., Cescatti, A., Janssens, I. A., Migliavacca, M., Montagnani, L., and Richardson, A. D.: Global Convergence in the Temperature Sensitivity of Respiration at Ecosystem Level, Science, 329, 838–840, https://doi.org/10.1126/science.1189587, 2010.
Maluleke, A., Feig, G., Brümmer, C., Rybchak, O., and Midgley, G.: Evaluation of Selected Sentinel‐2 Remotely Sensed Vegetation Indices and MODIS GPP in Representing Productivity in Semi‐Arid South African Ecosystems, J. Geophys. Res.-Biogeo, 129, e2023JG007728, https://doi.org/10.1029/2023JG007728, 2024.
Manzoni, S., Chakrawal, A., Fischer, T., Schimel, J. P., Porporato, A., and Vico, G.: Rainfall intensification increases the contribution of rewetting pulses to soil heterotrophic respiration, Biogeosciences, 17, 4007–4023, https://doi.org/10.5194/bg-17-4007-2020, 2020.
Martini, D., Pacheco-Labrador, J., Perez-Priego, O., van der Tol, C., El-Madany, T. S., Julitta, T., Rossini, M., Reichstein, M., Christiansen, R., Rascher, U., Moreno, G., Martin, M. P., Yang, P. Q., Carrara, A., Guan, J. H., Gonzalez-Cascon, R., and Migliavacca, M.: Nitrogen and Phosphorus Effect on Sun-Induced Fluorescence and Gross Primary Productivity in Mediterranean Grassland, Remote Sens.-Basel, 11, 2562, https://doi.org/10.3390/rs11212562, 2019.
Mauder, M. and Foken, T.: Documentation and instruction manual of the eddy covariance software package TK2, Universität Bayreuth, Abt. Mikrometeorologie, Arbeitsergebnisse, Vol. 26, 44 pp., 2004.
Mauder, M. and Foken, T.: Documentation and Instruction Manual of the Eddy-Covariance Software Package TK3, Arbeitsergebnisse, Vol. 46, p. 60, 2011.
Metz, E.-M., Vardag, S. N., Basu, S., Jung, M., Ahrens, B., El-Madany, T., Sitch, S., Arora, V. K., Briggs, P. R., Friedlingstein, P., Goll, D. S., Jain, A. K., Kato, E., Lombardozzi, D., Nabel, J. E. M. S., Poulter, B., Séférian, R., Tian, H., Wiltshire, A., Yuan, W., Yue, X., Zaehle, S., Deutscher, N. M., Griffith, D. W. T., and Butz, A.: Soil respiration–driven CO2 pulses dominate Australia's flux variability, Science, 379, 1332–1335, https://doi.org/10.1126/science.add7833, 2023.
Migliavacca, Perez-Priego, O., Rossini, M., El-Madany, T. S., Moreno, G., van der Tol, C., Rascher, U., Berninger, A., Bessenbacher, V., Burkart, A., Carrara, A., Fava, F., Guan, J. H., Hammer, T. W., Henkel, K., Juarez-Alcalde, E., Julitta, T., Kolle, O., Martin, M. P., Musavi, T., Pacheco-Labrador, J., Perez-Burgueno, A., Wutzler, T., Zaehle, S., and Reichstein, M.: Plant functional traits and canopy structure control the relationship between photosynthetic CO2 uptake and far-red sun-induced fluorescence in a Mediterranean grassland under different nutrient availability, New Phytol., 214, 1078–1091, https://doi.org/10.1111/nph.14437, 2017.
Migliavacca, M., Galvagno, M., Cremonese, E., Rossini, M., Meroni, M., Sonnentag, O., Cogliati, S., Manca, G., Diotri, F., Busetto, L., Cescatti, A., Colombo, R., Fava, F., Morra Di Cella, U., Pari, E., Siniscalco, C., and Richardson, A. D.: Using digital repeat photography and eddy covariance data to model grassland phenology and photosynthetic CO2 uptake, Agr. Forest Meteorol., 151, 1325–1337, https://doi.org/10.1016/j.agrformet.2011.05.012, 2011.
Miller, G. R., Chen, X., Rubin, Y., Ma, S., and Baldocchi, D. D.: Groundwater uptake by woody vegetation in a semiarid oak savanna, Water Resour. Res., 46, 2009WR008902, https://doi.org/10.1029/2009WR008902, 2010.
Moore, C. E., Beringer, J., Evans, B., Hutley, L. B., McHugh, I., and Tapper, N. J.: The contribution of trees and grasses to productivity of an Australian tropical savanna, Biogeosciences, 13, 2387–2403, https://doi.org/10.5194/bg-13-2387-2016, 2016.
Moore, C. E., Beringer, J., Evans, B., Hutley, L. B., and Tapper, N. J.: Tree–grass phenology information improves light use efficiency modelling of gross primary productivity for an Australian tropical savanna, Biogeosciences, 14, 111–129, https://doi.org/10.5194/bg-14-111-2017, 2017.
Moreno, G., Obrador, J. J., Cubera, E., and Dupraz, C.: Fine Root Distribution in Dehesas of Central-Western Spain, Plant Soil, 277, 153–162, https://doi.org/10.1007/s11104-005-6805-0, 2005.
Moreno, G.: Response of understorey forage to multiple tree effects in Iberian dehesas, Agr. Ecosyst. Environ., 123, 239–244, https://doi.org/10.1016/j.agee.2007.04.006, 2008.
Morgan, J. A., Parton, W., Derner, J. D., Gilmanov, T. G., and Smith, D. P.: Importance of Early Season Conditions and Grazing on Carbon Dioxide Fluxes in Colorado Shortgrass Steppe, Rangeland Ecol. Manag., 69, 342–350, https://doi.org/10.1016/j.rama.2016.05.002, 2016.
Morris, K. A., Nair, R. K. F., Moreno, G., Schrumpf, M., and Migliavacca, M.: Fate of N additions in a multiple resource-limited Mediterranean oak savanna, Ecosphere, 10, e02921, https://doi.org/10.1002/ecs2.2921, 2019.
Moyano, F. E., Manzoni, S., and Chenu, C.: Responses of soil heterotrophic respiration to moisture availability: An exploration of processes and models, Soil Biol. Biochem., 59, 72–85, https://doi.org/10.1016/j.soilbio.2013.01.002, 2013.
Nair, R. K. F., Morris, K. A., Hertel, M., Luo, Y. P., Moreno, G., Reichstein, M., Schrumpf, M., and Migliavacca, M. N: P stoichiometry and habitat effects on Mediterranean savanna seasonal root dynamics, Biogeosciences, 16, 1883–1901, https://doi.org/10.5194/bg-16-1883-2019, 2019.
Nair, R., Luo, Y., El‐Madany, T., Rolo, V., Pacheco‐Labrador, J., Caldararu, S., Morris, K. A., Schrumpf, M., Carrara, A., Moreno, G., Reichstein, M., and Migliavacca, M.: Nitrogen availability and summer drought, but not N : P imbalance, drive carbon use efficiency of a Mediterranean tree‐grass ecosystem, Glob. Change Biol., 30, e17486, https://doi.org/10.1111/gcb.17486, 2024.
Nutini, F., Boschetti, M., Candiani, G., Bocchi, S., and Brivio, P.: Evaporative Fraction as an Indicator of Moisture Condition and Water Stress Status in Semi-Arid Rangeland Ecosystems, Remote Sens., 6, 6300–6323, https://doi.org/10.3390/rs6076300, 2014.
Pang, J., Zhao, H., Bansal, R., Bohuon, E., Lambers, H., Ryan, M. H., and Siddique, K. H. M.: Leaf transpiration plays a role in phosphorus acquisition among a large set of chickpea genotypes: Leaf transpiration and P acquisition in chickpea, Plant Cell Environ., 41, 2069–2079, https://doi.org/10.1111/pce.13139, 2018.
Papale, D., Reichstein, M., Aubinet, M., Canfora, E., Bernhofer, C., Kutsch, W., Longdoz, B., Rambal, S., Valentini, R., Vesala, T., and Yakir, D.: Towards a standardized processing of Net Ecosystem Exchange measured with eddy covariance technique: algorithms and uncertainty estimation, Biogeosciences, 3, 571–583, https://doi.org/10.5194/bg-3-571-2006, 2006.
Pardo, L. H., Fenn, M. E., Goodale, C. L., Geiser, L. H., Driscoll, C. T., Allen, E. B., Baron, J. S., Bobbink, R., Bowman, W. D., Clark, C. M., Emmett, B., Gilliam, F. S., Greaver, T. L., Hall, S. J., Lilleskov, E. A., Liu, L., Lynch, J. A., Nadelhoffer, K. J., Perakis, S. S., Robin-Abbott, M. J., Stoddard, J. L., Weathers, K. C., and Dennis, R. L.: Effects of nitrogen deposition and empirical nitrogen critical loads for ecoregions of the United States, Ecol. Appl., 21, 3049–3082, https://doi.org/10.1890/10-2341.1, 2011.
Parton, W., Morgan, J., Smith, D., Del Grosso, S., Prihodko, L., Lecain, D., Kelly, R., and Lutz, S.: Impact of precipitation dynamics on net ecosystem productivity, Glob. Change Biol., 18, 915–927, https://doi.org/10.1111/j.1365-2486.2011.02611.x, 2012.
Paulus, S. J., El-Madany, T. S., Orth, R., Hildebrandt, A., Wutzler, T., Carrara, A., Moreno, G., Perez-Priego, O., Kolle, O., Reichstein, M., and Migliavacca, M.: Resolving seasonal and diel dynamics of non-rainfall water inputs in a Mediterranean ecosystem using lysimeters, Hydrol. Earth Syst. Sci., 26, 6263–6287, https://doi.org/10.5194/hess-26-6263-2022, 2022.
Peñuelas, J., Poulter, B., Sardans, J., Ciais, P., van der Velde, M., Bopp, L., Boucher, O., Godderis, Y., Hinsinger, P., Llusia, J., Nardin, E., Vicca, S., Obersteiner, M., and Janssens, I. A.: Human-induced nitrogen-phosphorus imbalances alter natural and managed ecosystems across the globe, Nat. Commun., 4, 2934, https://doi.org/10.1038/ncomms3934, 2013.
Perez-Priego, O., Guan, J., Rossini, M., Fava, F., Wutzler, T., Moreno, G., Carvalhais, N., Carrara, A., Kolle, O., Julitta, T., Schrumpf, M., Reichstein, M., and Migliavacca, M.: Sun-induced chlorophyll fluorescence and photochemical reflectance index improve remote-sensing gross primary production estimates under varying nutrient availability in a typical Mediterranean savanna ecosystem, Biogeosciences, 12, 6351–6367, https://doi.org/10.5194/bg-12-6351-2015, 2015.
Petach, A. R., Toomey, M., Aubrecht, D. M., and Richardson, A. D.: Monitoring vegetation phenology using an infrared-enabled security camera, Agr. Forest Meteorol., 195/196, 143–151, https://doi.org/10.1016/j.agrformet.2014.05.008, 2014.
Piao, S., Wang, X., Wang, K., Li, X., Bastos, A., Canadell, J. G., Ciais, P., Friedlingstein, P., and Sitch, S.: Interannual variation of terrestrial carbon cycle: Issues and perspectives, Glob. Change Biol., 26, 300–318, https://doi.org/10.1111/gcb.14884, 2020.
Poulter, B., Frank, D., Ciais, P., Myneni, R. B., Andela, N., Bi, J., Broquet, G., Canadell, J. G., Chevallier, F., Liu, Y. Y., Running, S. W., Sitch, S., and van der Werf, G. R.: Contribution of semi-arid ecosystems to interannual variability of the global carbon cycle, Nature, 509, 600–603, https://doi.org/10.1038/nature13376, 2014.
Reichstein, M., Falge, E., Baldocchi, D., Papale, D., Aubinet, M., Berbigier, P., Bernhofer, C., Buchmann, N., Gilmanov, T., Granier, A., Grunwald, T., Havrankova, K., Ilvesniemi, H., Janous, D., Knohl, A., Laurila, T., Lohila, A., Loustau, D., Matteucci, G., Meyers, T., Miglietta, F., Ourcival, J. M., Pumpanen, J., Rambal, S., Rotenberg, E., Sanz, M., Tenhunen, J., Seufert, G., Vaccari, F., Vesala, T., Yakir, D., and Valentini, R.: On the separation of net ecosystem exchange into assimilation and ecosystem respiration: review and improved algorithm, Glob. Change Biol., 11, 1424–1439, https://doi.org/10.1111/j.1365-2486.2005.001002.x, 2005.
Reichstein, M., Bahn, M., Mahecha, M. D., Kattge, J., and Baldocchi, D. D.: Linking plant and ecosystem functional biogeography, P. Natl. Acad. Sci. USA, 111, 13697–13702, https://doi.org/10.1073/pnas.1216065111, 2014.
Richardson, A. D., Braswell, B. H., Hollinger, D. Y., Jenkins, J. P., and Ollinger, S. V.: Near-surface remote sensing of spatial and temporal variation in canopy phenology, Ecol. Appl., 19, 1417–1428, https://doi.org/10.1890/08-2022.1, 2009.
Richardson, J., Chatterjee, A., and Darrel Jenerette, G.: Optimum temperatures for soil respiration along a semi-arid elevation gradient in southern California, Soil Biol. Biochem., 46, 89–95, https://doi.org/10.1016/j.soilbio.2011.11.008, 2012.
Ries, L. P. and Shugart, H. H.: Nutrient limitations on understory grass productivity and carbon assimilation in an African woodland savanna, J. Arid Environ., 72, 1423–1430, https://doi.org/10.1016/j.jaridenv.2008.02.013, 2008.
Rolo, V. and Moreno, G.: Interspecific competition induces asymmetrical rooting profile adjustments in shrub-encroached open oak woodlands, Trees, 26, 997–1006, https://doi.org/10.1007/s00468-012-0677-8, 2012.
Rose, L., Buitenwerf, R., Cramer, M., February, E. C., and Higgins, S. I.: Effects of nutrient supply on carbon and water economies of C4 grasses, Funct. Plant Biol., 45, 935, https://doi.org/10.1071/FP17359, 2018.
Ruddell, B. L. and Kumar, P.: Ecohydrologic process networks: 1. Identification, Water Resour. Res., 45, W03419, https://doi.org/10.1029/2008wr007279, 2009.
Running, S. W. and Nemani, R. R.: Relating seasonal patterns of the AVHRR vegetation index to simulated photosynthesis and transpiration of forests in different climates, Remote Sens. Environ., 24, 347–367, https://doi.org/10.1016/0034-4257(88)90034-X, 1988.
Sardans, J., Rivas-Ubach, A., and Peñuelas, J.: The C:N:P stoichiometry of organisms and ecosystems in a changing world: A review and perspectives, Perspect. Plant Ecol., 14, 33–47, https://doi.org/10.1016/j.ppees.2011.08.002, 2012.
Singh, S. K. and Reddy, V. R.: Combined effects of phosphorus nutrition and elevated carbon dioxide concentration on chlorophyll fluorescence, photosynthesis, and nutrient efficiency of cotton, J. Plant Nutr. Soil Sci., 177, 892–902, https://doi.org/10.1002/jpln.201400117, 2014.
Steffen, W., Richardson, K., Rockström, J., Cornell, S. E., Fetzer, I., Bennett, E. M., Biggs, R., Carpenter, S. R., De Vries, W., De Wit, C. A., Folke, C., Gerten, D., Heinke, J., Mace, G. M., Persson, L. M., Ramanathan, V., Reyers, B., and Sörlin, S.: Planetary boundaries: Guiding human development on a changing planet, Science, 347, 1259855, https://doi.org/10.1126/science.1259855, 2015.
Steiner, B., Scott, R. L., Hu, J., MacBean, N., Richardson, A., and Moore, D. J. P.: Using phenology to unravel differential soil water use and productivity in a semiarid savanna, Ecosphere, 15, e4762, https://doi.org/10.1002/ecs2.4762, 2024.
Sturtevant, C., Ruddell, B. L., Knox, S. H., Verfaillie, J., Matthes, J. H., Oikawa, P. Y., and Baldocchi, D.: Identifying scale-emergent, nonlinear, asynchronous processes of wetland methane exchange, J. Geophys. Res.-Biogeo., 121, 188–204, https://doi.org/10.1002/2015jg003054, 2016.
Thieurmel, B.: suncalc: Compute Sun Position, Sunlight Phases, Moon Position and Lunar Phase, https://doi.org/10.32614/CRAN.package.suncalc, 2017.
Tong, B., Guo, J., Xu, H., Wang, Y., Li, H., Bian, L., Zhang, J., and Zhou, S.: Effects of soil moisture, net radiation, and atmospheric vapor pressure deficit on surface evaporation fraction at a semi-arid grass site, Sci. Total Environ., 849, 157890, https://doi.org/10.1016/j.scitotenv.2022.157890, 2022.
Tucker, C. J.: Red and photographic infrared linear combinations for monitoring vegetation, Remote Sens. Environ., 8, 127–150, https://doi.org/10.1016/0034-4257(79)90013-0, 1979.
von Buttlar, J.: An extended approach for spatiotemporal gapfilling: dealing with large and systematic gaps in geoscientific datasets, Nonl. Proc. Geophys., 21, 203–215, https://doi.org/10.5194/npg-21-203-2014, 2014.
Walther, S., Besnard, S., Nelson, J. A., El-Madany, T. S., Migliavacca, M., Weber, U., Carvalhais, N., Ermida, S. L., Brümmer, C., Schrader, F., Prokushkin, A. S., Panov, A. V., and Jung, M.: Technical note: A view from space on global flux towers by MODIS and Landsat: the FluxnetEO data set, Biogeosciences, 19, 2805–2840, https://doi.org/10.5194/bg-19-2805-2022, 2022.
Wang, C. and Tang, Y.: Responses of plant phenology to nitrogen addition: a meta-analysis, Oikos, 128, 1243–1253, https://doi.org/10.1111/oik.06099, 2019.
Wang, R., Lu, J., Gentine, P., and Chen, H.: Global pattern of soil temperature exceeding air temperature and its linkages with surface energy fluxes, Environ. Res. Lett., 19, 104029, https://doi.org/10.1088/1748-9326/ad7279, 2024.
Ward, D., Wiegand, K., and Getzin, S.: Walter's two-layer hypothesis revisited: back to the roots!, Oecologia, 172, 617–630, https://doi.org/10.1007/s00442-012-2538-y, 2013.
Weiner, T., Gross, A., Moreno, G., Migliavacca, M., Schrumpf, M., Reichstein, M., Hilman, B., Carrara, A., and Angert, A.: Following the Turnover of Soil Bioavailable Phosphate in Mediterranean Savanna by Oxygen Stable Isotopes, J. Geophys. Res.-Biogeo., 123, 1850–1862, https://doi.org/10.1029/2017JG004086, 2018.
Wieckowski, A., Vestin, P., Ardö, J., Roupsard, O., Ndiaye, O., Diatta, O., Ba, S., Agbohessou, Y., Fensholt, R., Verbruggen, W., Gebremedhn, H. H., and Tagesson, T.: Eddy covariance measurements reveal a decreased carbon sequestration strength 2010–2022 in an African semiarid savanna, Glob. Change Biol., 30, e17509, https://doi.org/10.1111/gcb.17509, 2024.
Whitecross, M. A., Witkowski, E. T. F., and Archibald, S.: Savanna tree-grass interactions: A phenological investigation of green-up in relation to water availability over three seasons, South Afr. J. Bot., 108, 29–40, https://doi.org/10.1016/j.sajb.2016.09.003, 2017.
Whitley, R. J., Macinnis‐Ng, C. M. O., Hutley, L. B., Beringer, J., Zeppel, M., Williams, M., Taylor, D., and Eamus, D.: Is productivity of mesic savannas light limited or water limited? Results of a simulation study, Glob. Change Biol., 17, 3130–3149, https://doi.org/10.1111/j.1365-2486.2011.02425.x, 2011.
Wingate, L., Ogée, J., Cremonese, E., Filippa, G., Mizunuma, T., Migliavacca, M., Moisy, C., Wilkinson, M., Moureaux, C., Wohlfahrt, G., Hammerle, A., Hörtnagl, L., Gimeno, C., Porcar-Castell, A., Galvagno, M., Nakaji, T., Morison, J., Kolle, O., Knohl, A., Kutsch, W., Kolari, P., Nikinmaa, E., Ibrom, A., Gielen, B., Eugster, W., Balzarolo, M., Papale, D., Klumpp, K., Köstner, B., Grünwald, T., Joffre, R., Ourcival, J.-M., Hellstrom, M., Lindroth, A., George, C., Longdoz, B., Genty, B., Levula, J., Heinesch, B., Sprintsin, M., Yakir, D., Manise, T., Guyon, D., Ahrends, H., Plaza-Aguilar, A., Guan, J. H., and Grace, J.: Interpreting canopy development and physiology using a European phenology camera network at flux sites, Biogeosciences, 12, 5995–6015, https://doi.org/10.5194/bg-12-5995-2015, 2015.
Wood, J. D., Griffis, T. J., and Baker, J. M.: Detecting drift bias and exposure errors in solar and photosynthetically active radiation data, Agr. Forest Meteorol., 206, 33–44, https://doi.org/10.1016/j.agrformet.2015.02.015, 2015.
Wutzler, T., Lucas-Moffat, A., Migliavacca, M., Knauer, J., Sickel, K., Sigut, L., Menzer, O., and Reichstein, M.: Basic and extensible post-processing of eddy covariance flux data with REddyProc, Biogeosciences, 15, 5015–5030, https://doi.org/10.5194/bg-15-5015-2018, 2018.
Xu, L. and Baldocchi, D. D.: Seasonal trends in photosynthetic parameters and stomatal conductance of blue oak (Quercus douglasii) under prolonged summer drought and high temperature, Tree Physiol., 23, 865–877, https://doi.org/10.1093/treephys/23.13.865, 2003.
Yamori, W., Hikosaka, K., and Way, D. A.: Temperature response of photosynthesis in C3, C4, and CAM plants: temperature acclimation and temperature adaptation, Photosynth. Res., 119, 101–117, https://doi.org/10.1007/s11120-013-9874-6, 2014.
Yan, D., Scott, R. L., Moore, D. J. P., Biederman, J. A., and Smith, W. K.: Understanding the relationship between vegetation greenness and productivity across dryland ecosystems through the integration of PhenoCam, satellite, and eddy covariance data, Remote Sens. Environ., 223, 50–62, https://doi.org/10.1016/j.rse.2018.12.029, 2019.
Yiou, P., Sornette, D., and Ghil, M.: Data-adaptive wavelets and multi-scale singular-spectrum analysis, Physica D, 142, 254–290, https://doi.org/10.1016/S0167-2789(00)00045-2, 2000.
Zhang, L., Wylie, B. K., Ji, L., Gilmanov, T. G., and Tieszen, L. L.: Climate-Driven Interannual Variability in Net Ecosystem Exchange in the Northern Great Plains Grasslands, Rangeland Ecol. Manag., 63, 40–50, https://doi.org/10.2111/08-232.1, 2010.
Zhang, Y., Xiao, X., Guanter, L., Zhou, S., Ciais, P., Joiner, J., Sitch, S., Wu, X., Nabel, J., Dong, J., Kato, E., Jain, A. K., Wiltshire, A., and Stocker, B. D.: Precipitation and carbon-water coupling jointly control the interannual variability of global land gross primary production, Sci. Rep., 6, 39748, https://doi.org/10.1038/srep39748, 2016.