the Creative Commons Attribution 4.0 License.
the Creative Commons Attribution 4.0 License.
 | 25 Jul 2025
Uncertainties in carbon emissions from land use and land cover change in Indonesia
Ida Bagus Mandhara Brasika
Pierre Friedlingstein
Stephen Sitch
Michael O'Sullivan
Maria Carolina Duran-Rojas
Thais Michele Rosan
Kees Klein Goldewijk
Julia Pongratz
Clemens Schwingshackl
Louise P. Chini
George C. Hurtt
Indonesia is currently one of the three largest contributors of carbon emissions from land use and land cover change (LULCC) globally, together with Brazil and the Democratic Republic of the Congo. However, until recently, there were only limited reliable data available on LULCC across Indonesia, leading to a lack of agreement on the drivers, magnitudes, and trends of carbon emissions between different estimates. Accurate LULCC should improve robustness and reduce the uncertainties of carbon dioxide (CO2) emissions from land use change (ELUC) estimation. Here, we assess several cropland datasets that are used to estimate ELUC in dynamic global vegetation models (DGVMs) and bookkeeping models (BKMs). Available cropland datasets are generally categorized as either statistics-based, such as the Food and Agricultural Organization (FAO) annual statistical dataset, or satellite-based, such as the Mapbiomas dataset, which is derived from Landsat satellite images. Our results show that national-statistics-based and satellite-based estimates have little agreement on temporal variability and cropland area changes. On some islands, they show spatial similarity, but differences appear on the main islands such as Kalimantan, Sumatra, and Java. These differences lead to spatiotemporal uncertainty in carbon emissions. The different land cover forcings (national-statistics-based and satellite-based) in a single model (JULES-ES) result in ELUC uncertainties of about 0.08 [0.06 to 0.11] PgC yr−1. Furthermore, we found that uncertainties in ELUC estimates are also due to differences in the carbon cycle models in DGVMs, as DGVMs driven by the same land cover dataset show differences in ELUC estimates of 0.12 ± 0.02 PgC yr−1 with a 95 % confidence level and range [−0.04 to 0.35] PgC yr−1. This is consistent with other products such as BKMs that estimate 0.14 [0.12 to 0.15] PgC yr−1, with both having steady trends. We also compare the emissions with those from the National Greenhouse Gas Inventory (NGHGI) product. The NGHGI estimates (based on BUR3, the periodic official government report on greenhouses gases to UNFCCC) have much lower carbon emissions (0.06 ± 0.06 PgC yr−1), though with an increasing trend. These numbers double when we include emissions from peat fire and peat drainage: the DGVM ensemble indicates emissions of 0.23 ± 0.05 PgC yr−1, and BKMs indicate emissions of 0.24 ± 0.01 PgC yr−1. In contrast, emissions based on the Indonesian NGHGI remain much lower (BUR2: 0.18 ± 0.07 PgC yr−1; BUR3: 0.13 ± 0.10 PgC yr−1). Furthermore, emission peaks occur in years of moderate to strong El Niño events. Several improvements might reduce uncertainties in carbon emissions from LULCC in Indonesia, such as a combination of a satellite-based dataset with a national-statistics-based dataset, inclusion of peat-related emissions in DGVMs, and potentially explicit inclusion of palm oil in models, as this is a major crop in Indonesia. Overall, the analysis shows that carbon emissions have no decreasing trend in Indonesia. Therefore, deforestation and forest fire prevention remain vital for Indonesia.
- Article
(2846 KB) - Full-text XML
-
Supplement
(444 KB) - BibTeX
- EndNote


Indonesia plays a significant role in the global carbon cycle through carbon emissions from land use and land cover change (LULCC) (Friedlingstein et al., 2023). Together with Brazil and the Democratic Republic of Congo, these three countries are the highest carbon emitters in the world from land use change. Their emissions combined are more than half of the global total land use emissions (0.75 [0.59–0.87] PgC yr−1 or 56 [44–68] %) (Friedlingstein et al., 2023).
Indonesian forests are spread across several islands. The major islands are Sumatra, Kalimantan, Sulawesi, and Papua (Gaveau et al., 2021). In recent decades, two islands, Sumatra and Kalimantan, have experienced extensive land use changes (Gaveau et al., 2014, 2016; Margono et al., 2012). There were many forested areas that have now been converted into agricultural lands, predominantly palm oil plantations. Forest area declined by 9.79 million hectares (Mha) or 11 % between 2001 and 2019, with near-equal expansion of oil palm plantations of 8.48 Mha (Gaveau et al., 2022). This forest loss is also confirmed by the Food and Agricultural Organization (FAO), which shows the decline from 101.12 to 92.13 Mha for the last 2 decades, or 9.14 Mha lost (FAO, 2022).
These high rates of land conversion in regions of carbon-dense and often pristine natural forests result in high carbon emissions (Hong et al., 2021). Furthermore, there are large peat and forest fires during extreme dry seasons in Indonesia (Fernandes et al., 2017; Nechita-Banda et al., 2018). This has added to the carbon released into the atmosphere from Indonesia, together with fires induced by humans (Brasika, 2023; FAO, 2023; van der Werf et al., 2017). Although there is a declining trend in reported forest fires between 2003 and 2018 (van Wees et al., 2021), fires continue to contribute significant emissions. For example, in 2019–2020, deforestation fires in Indonesia continued contributing to high greenhouse gas (GHG) emissions, i.e. about 3.7 ± 0.4 Gt CO2 eq., and half of this can be attributed to emissions from peatland fires (Datta and Krishnamoorti, 2022).
The emission of carbon from LULCC caused by deliberate human activities is represented as emissions from land use change (ELUC) (PgC yr−1) in the Global Carbon Budget (GCB) calculated using a set of bookkeeping models (Friedlingstein et al., 2023). This includes CO2 fluxes from deforestation, afforestation, logging, forest degradation, shifting cultivation, and regrowth of forests. ELUC can also be calculated using dynamic global vegetation models (DGVMs), which are part of the Trends in Net Carbon Exchange (TRENDY) project (Friedlingstein et al., 2019; Sitch et al., 2015), which supplies ensemble DGVM results each year to the GCB. The LULCC input for the GCB is from the Land Use Harmonization (LUH2) dataset (Chini et al., 2021; Hurtt et al., 2020), which has temporal and spatial challenges (Rosan et al., 2021) when employed for national-scale analysis.
With the development of multi-year land cover datasets from Earth observations, there is potential to reduce the uncertainty in carbon emissions from LULCC. This was previously applied in the GCB 2022 (Friedlingstein et al., 2022), where the authors replaced the FAO land use data with satellite-based Mapbiomas data for Brazil (Rosan et al., 2021). This resulted in improvements in LULCC datasets that gave consistent estimates of ELUC trends using different methodologies for Brazil.
In this research, we apply a similar approach to improve our understanding of carbon emissions from LULCC in Indonesia over the last 2 decades (2000–2022). However, we focus more on the uncertainties, i.e. not only the causes by the input, but also the different approaches of models and/or inventories. We used LUH2-GCB2022, which is the harmonization of several datasets, including satellite data with FAO land use data and satellite-based cropland (Mapbiomas Indonesia 1.0 – MB1 – and Mapbiomas Indonesia 2.0 – MB2) datasets, as input to JULES-ES. First, we compare the temporal and spatial variability of cropland from these datasets. Second, we simulate ELUC with two approaches: various LULCC driver datasets (LUH2-GCB2022, MB1, and MB2) in one model (JULES-ES) and comparison with results using one LULCC driver (MB1) in various models in TRENDY v12. Last, we compare our estimates with other models or products, i.e. bookkeeping models (BKMs), the National Greenhouse Gas Inventory (NGHGI), and FAO GHG for Indonesia.
Despite addressing many uncertainties caused by the input data, model structure, and different products, we emphasize the agreement between those models and products that do appear. This includes the similarity of the trends, their variability, their magnitudes, and their potential connection to interannual variability. This might result in more robust understanding of carbon emissions from Indonesia as these agreements appear in the uncertainties. This is essential as the Indonesian contribution to global carbon emissions from land use change is massive, but this multi-dataset assessment has not been done before.
2.1 Land use dataset
2.1.1 Mapbiomas Indonesia dataset
Mapbiomas is an initiative aimed at mapping LULCC using a fast, reliable, and cost-effective methodology. Initially launched in Brazil in 2015, it has since been applied to other countries. Indonesia became the first country not in Latin America to adopt the method, receiving training from experts in Brazil (experts from the Asian country were trained by the Brazilian Mapbiomas team to launch the land use mapping platform; Silva et al., 2022). Mapbiomas utilizes Landsat images and employs a pixel-based approach. Machine learning algorithms have been developed to analyse these images, leveraging the powerful cloud processing capabilities provided by Google Earth Engine (GEE).
The resulting dataset, MB1, classifies the LULCC from 2000 to 2019 (Mapbiomas Indonesia, 2022). While the classification scheme is adapted from Mapbiomas Brazil, it also includes specific characteristics relevant to Indonesia. For instance, agriculture in Mapbiomas Indonesia includes a palm oil category, reflecting the significant impact of palm oil production on LULCC in Indonesia (Mapbiomas Indonesia, 2022). However, there is no specific grazing land category in Mapbiomas Indonesia, as grazing land is considerably small and steady in Indonesia. Nevertheless, we still use the grazing land from LUH2-GCB2022 for completeness (Fig. 1). In case the total combination of the Mapbiomas agriculture fraction and the LUH2-GCB2022 grazing land fraction is higher than 1 in a given grid cell, we reduce the grazing land fraction accordingly. So, the total area of cropland + grazing land will be equal to or less than 1.
Mapbiomas has a high spatial resolution of 30 m, which is significantly higher than other products such as ESA CCI LC at 300 m. The Mapbiomas dataset has the potential to detect even small changes in LULCC. This dataset finds various applications, including the calculation of CO2 emissions resulting from land use change (Garofalo et al., 2022). Currently, Mapbiomas Indonesia is on its Collection 2.0 version (MB2). This recent dataset has completed an accuracy assessment and validation process (using ∼ 12 967 samples), with a resulting overall accuracy of 77.2 %. This MB2 covers a longer period, 2000–2022, with some improvement in land use classification. The agriculture is divided into more categories: palm oil, rice paddy, pulpwood plantation, and mosaic agriculture.
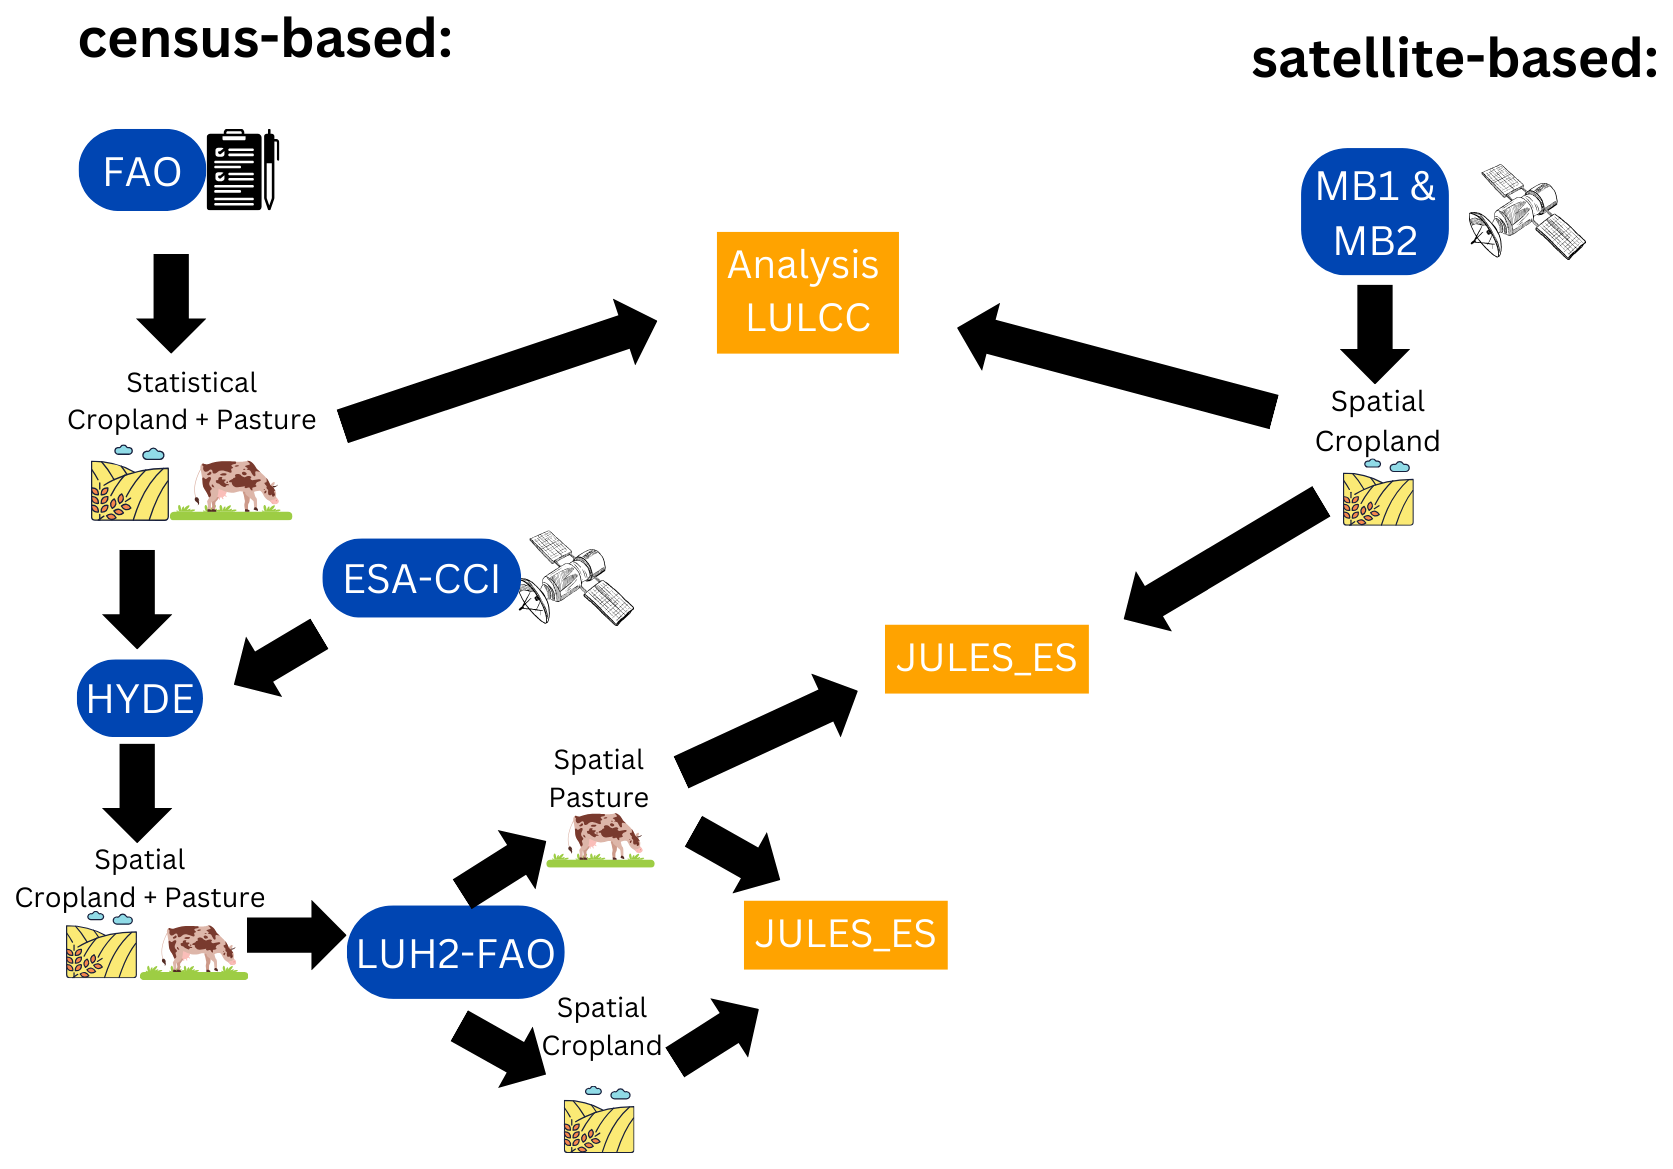
Figure 1Diagram of the different LULCC driver datasets that are used as input for JULES-ES simulation.
2.1.2 Integration of multiple datasets (FAO, HYDE, LUH2, and Mapbiomas)
The LUH2 dataset employs an accounting-based method to provide global annual gridded land use states and transitions for the historical period from 850 to 2023 (Chini et al., 2021; Hurtt et al., 2019, 2020). LUH2 considers each grid cell to be naturally forested or non-forested. This potential vegetation area is adjusted based on information about land use activities, such as agricultural expansion and abandonment, wood harvesting, urban development, and shifting cultivation.
LUH2 received the input of the land fractions in agriculture from the HYDE database (Goldewijk et al., 2017). This is a land use dataset that combines historical population estimates and allocation algorithms with time-dependent weighting maps to ensure internal consistency (Goldewijk et al., 2017). The cropland and grazing data in HYDE are obtained from the country-level statistical data provided by FAO as shown in Fig. 1. The cropland in HYDE is from FAO arable land and permanent land, while the grazing in HYDE is from FAO permanent meadows and pastures.
FAO utilized a national statistics approach provided by each country (Ricciardi et al., 2018). The national data are provided to FAO annually via questionnaires completed by each country; however, they may be based on less frequent census periods, which can vary among countries. In Indonesia, FAO has sent out questionnaires since the 1960s. It revised the land use questionnaire in 2016 (FAO, 2022). The data before that year are from the Indonesia Statistic Agency (BPS), which conducted agriculture surveys every 10 years (Badan Pusat Statistik, 2023). The years in between are interpolated. To spatially allocate the FAO data, HYDE uses maps from the ESA Land Cover Consortium (Fig. 1).
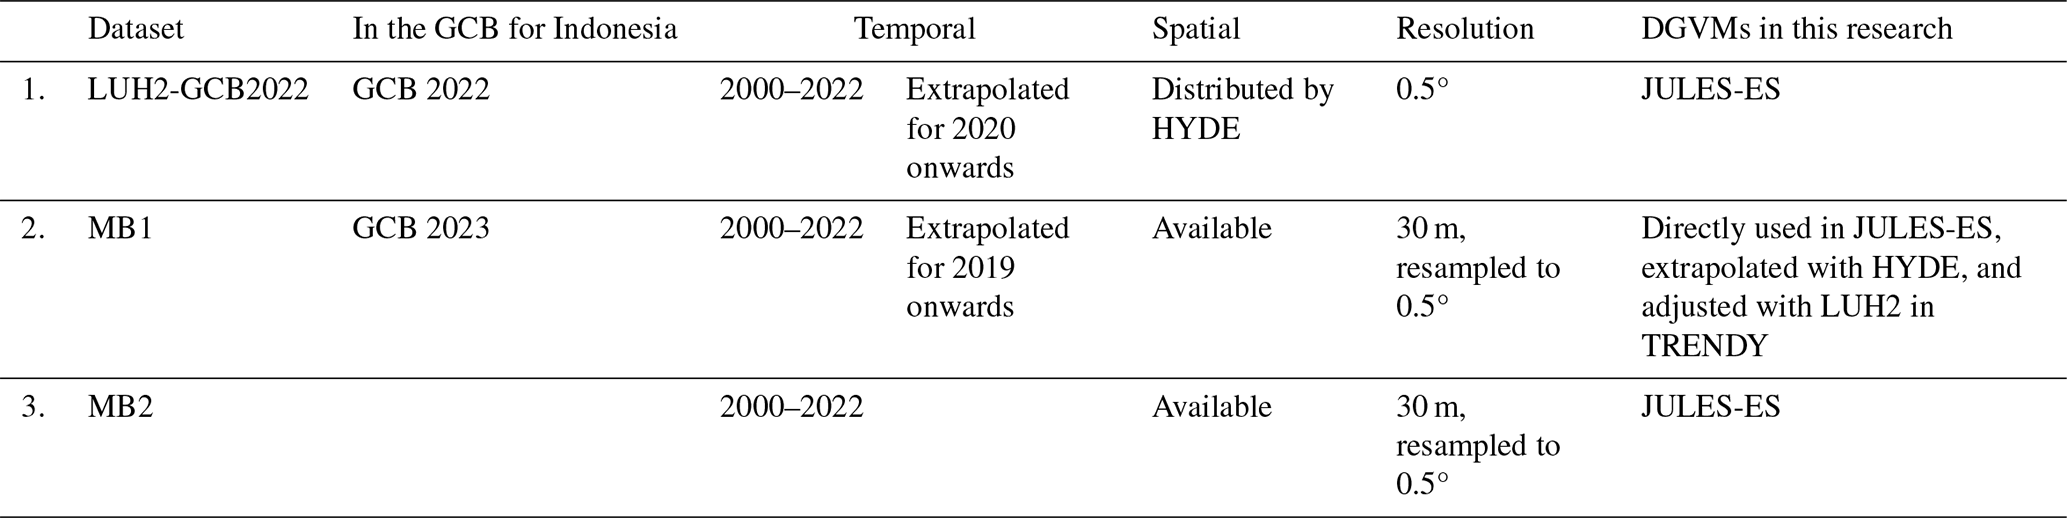
This version of LUH2 with cropland areas based on HYDE or FAO (except for Brazil, which started to use Mapbiomas in 2022) was utilized by the Global Carbon Budget until the 2022 version (GCB22) (Chini and Hurtt, 2025). As the FAO dataset is only available until 2020 for GCB22, the years 2021 and 2022 are extrapolated from HYDE using the trend over the previous 5 years (2016–2020). Then, specifically for Indonesia, in the Global Carbon Budget 2023 (GCB23), FAO data for Indonesia were replaced (while other countries except for Brazil continued to be based on HYDE or FAO) with the satellite-based MB1 dataset as input for HYDE and then used by LUH2 for the period 2000–2019, with extrapolation from HYDE until 2022. Recently, Mapbiomas launched the new version, MB2, which is claimed to have higher accuracy. This dataset is currently being proposed for the future GCB. Thus, in this research we differentiate between LUH2-GCB2022, MB1, and MB2. The details of all of the LULCC datasets assessed in this research are given in Table 1.
2.2 ELUC model and product comparison
This study utilizes the JULES-ES model (Sellar et al., 2019). JULES-ES was developed from the Met Office's Surface Exchange Scheme (MOSES). It can be used as a stand-alone land surface model driven by observed forcing data or coupled to an atmospheric global circulation model, such as the Met Office's Unified Model (UM) (Best et al., 2011). As JULES-ES is a process-based model that simulates the fluxes of carbon, water, energy, and momentum between the land surface and the atmosphere (Clark et al., 2011), it can used to analyse the important role of the land surface in the functioning of the Earth system.
JULES-ES has a detailed representation of land surface processes and includes recent developments in surface physical processes (Wiltshire et al., 2020), wood products (Jones et al., 2011), fire representation (Burton et al., 2019), dynamic vegetation (Cox, 2001; Harper et al., 2018), land use and the nitrogen cycle (Wiltshire et al., 2021), plant physiology, and plant functional types. It can simulate the historical evolution of the land carbon cycle under increasing atmospheric CO2 concentrations and climate change (Harper et al., 2016, 2018). Moreover, it can simulate the effect of land use change when forced with external LULCC datasets. The model description of JULES-ES regarding the impact of land use change on the carbon cycle can be seen in Supplement Sect. S1 (Eqs. S1, S2, and S3). For this study, we use the same setting of JULES-ES as in TRENDY v12 for GCB23 but vary the fraction of agriculture with several datasets as presented in Table 1. The detailed PFT setting of JULES-ES (Hurtt et al., 2019; Chini and Hurtt, 2025) can be checked in Supplement Table S1.
Apart from looking at the effects of various LULCC datasets on ELUC estimates, we also investigate the ELUC uncertainties using different DGVMs. We analyse 18 DGVMs from TRENDY v12 and GCB23, all driven with the LULCC forcing MB1, which has been extrapolated and adjusted with HYDE and LUH2.
In addition to the DGVMs, we use ELUC estimates for Indonesia from three BKMs that contributed to GCB23: H&C (Houghton and Castanho, 2023; Houghton and Nassikas, 2017), OSCAR (Gasser et al., 2020), and BLUE (Hansis et al., 2015). Although the DGVMs and the BKMs BLUE and OSCAR used the LULCC forcing MB1, this results in a different estimation. Furthermore, these two model types have different approaches and parameterizations. BKM methods track the variations in carbon storage within vegetation, soils, and wood products both pre-LULCC and post-LULCC by employing established growth and carbon decay rates over time. Unlike DGVMs, BKMs do not account for the influence of changing environmental factors on vegetation growth rates. Instead of simulating carbon stocks, BKMs rely on direct observational data for carbon densities, which are derived from biome-level values found in the literature and inventory data (Houghton et al., 1983).
We also compare the ELUC estimates from DGVMs and BKMs with the NGHGI of Indonesia, a comprehensive report on GHG emissions and removals compiled by the Indonesian government. The Indonesian NGHGI follows the IPCC (Intergovernmental Panel on Climate Change) definition of land use emissions, which differs from the ELUC definition used by the GCB, as the NGHGI uses terrestrial fluxes occurring on all land that countries define as “managed”. We specifically use data from NGHGI Biennial Update Reports 2 and 3 (BUR2 and BUR3) (Anwar et al., 2021), which cover the time periods relevant for our study, i.e. 2000–2016 and 2000–2019, respectively. Then, we also investigate the FAO GHG dataset for comparison (FAO, 2023; Francesco Tubiello, 2020; Tubiello et al., 2021).
BUR is a periodic national report that follows UNFCCC (United Nations Framework Convention on Climate Change) guidelines for non-Annex-I countries. The GHG inventory quantifies LULCC emissions using Tier-1 and Tier-2 methods according to the 2006 IPCC Reporting Guidelines: emissions are calculated by multiplying the areas of land cover change by specific emission factors for each land cover conversion. The data collections and calculations are done by ministries, bureaus, or agencies. The data are collected by each relevant government organization and then compiled by the Ministry of Environment and Forestry (Anwar et al., 2021). Indonesia released BUR2 in 2018 (Agung Sugardiman et al., 2018) and BUR3 in 2021 (Anwar et al., 2021). BUR3 uses an improved land cover map by reinterpreting land use based on Landsat imagery and revision of relevant sector data. This creates different estimates for LULCC emissions between BUR2 and BUR3 (Anwar et al., 2021).
The FAO GHG inventory summarizes the greenhouse gas emission dissemination. It follows the Tier-1 methods of the IPCC Guidelines for National GHG Inventories (FAO, 2022, 2023). We use the total CO2 emissions from land use change for comparison with models and other products. Then, CO2 emissions from “Drained organic soils” and “Fire in organic soils” are added to represent the peat fire emissions and peat drainage. We convert the data from kilotons CO2 into pentagrams carbon (PgC).
2.3 Analysis
2.3.1 Annual and spatial LULCC
Quantifying the difference in products of LULCC is the first step of the analysis in this research. We compare the temporal changes in LULCC from the datasets LUH2-GCB2022, MB1, and MB2. MB1 classifies agriculture as a combination of oil palm and other agriculture. MB2 has two additional classifications, i.e. rice paddy and pulpwood plantation. The FAO classifies cropland as arable land and land under permanent crops (including oil palms). In the following, we refer to the Mapbiomas category “agriculture” as “cropland” to simplify the comparison across datasets.
The spatial maps of cropland areas are plotted and analysed in order to assess the differences between LULCC datasets. We plot LUH2-GCB2022, whose cropland and grazing land areas are from HYDE based on FAO country statistics. The Mapbiomas dataset is satellite-based; thus, it is already spatially distributed. However, the MB1 and MB2 datasets need to be processed as follows: first reclassify – palm oil, rice paddy, pulpwood plantation, and other agriculture are defined as 100 % crop, while other classifications (forest, non-vegetated areas, and water bodies) are considered 0 % crops. The spatial resolution of Mapbiomas is 30 m, while LUH2 (used as GCB input) has a spatial resolution of 0.5°. We thus regridded the land cover fractions of MB1 and MB2 to 0.5° resolution. This approach has a small impact on the total cropland area, as illustrated in Fig. S1 in Supplement Sect. S2.
2.3.2 ELUC simulations
The LUH2-GCB2022, MB1, and MB2 datasets are used as input to JULES-ES, which is run at 0.5° resolution (Brasika, 2025a, b). This resolution allows us to capture the geographical conditions of Indonesia, which is an archipelago consisting of many islands with considerable topographic variability. To calculate ELUC, we perform three sets of simulations with JULES-ES using cropland areas from the three LULCC datasets. The simulations are performed according to the TRENDY v12 configuration, using a time-varying climate, CO2, and nitrogen deposition following the TRENDY protocol (Sitch et al., 2024). The first simulation uses LUH2-GCB2022 over the period 1700–2022. The second and third simulations use LUH2-GCB2022 from 1700–1999 and Mapbiomas (MB1 and MB2) that from 2000–2022. JULES-ES is spun up to steady-state conditions by running 50 spin-up cycles of 20 years starting in 1700, and then each set of simulations follows two scenarios, S2 and S3. Scenario S2 uses time-varying CO2 and climate forcing but constant present-day land use (from the year 2000). Scenario S3 uses time-varying CO2, climate forcing, and land use varying from 1700 to 2022 (but uses three different datasets (LUH2-GCB2022, MB1, and MB2) from 2000). ELUC is calculated as the difference in net biome productivity at a grid cell level between these two simulations. The ELUC values from these simulations are compared to understand how differences in LULCC from LUH2-GCB2022, MB1, and MB2 impact the emission of carbon.
We also plot annual time series of all the available results from DGVMs, BKMs, and the NGHGI. We use the ensemble mean of TRENDY v12 for the DGVMs, the model BLUE for BKMs, NGHGI data from BUR3, and the FAO GHG inventory. We plot the net carbon emissions to analyse their trends, magnitudes, and patterns. Then, we re-plot the ensemble DGVMs, BKMs (BLUE, H&C, and OSCAR) and NGHGI (BUR2, BUR3, and FAO GHG) by including the peat fire emissions and peat drainage emissions. The NGHGI reports data on peat fire emissions and peat drainage emissions, whereas for DGVMs and BKMs peat fire emissions and peat drainage emissions are added from an external dataset. Peat fire emissions are taken from the Global Fire Emission Database (GFED4s; van der Werf et al., 2017), while peat drainage emissions are a combination of three spatially explicit datasets (FAO peat drainage emissions for 1990–2020, Conchedda and Tubiello, 2020; peat drainage emissions for 1700–2010 from simulations with the DGVM ORCHIDEE-PEAT, Qiu et al., 2021; and peat drainage emissions for 1701–2021 from simulations with the DGVM LPX-Bern v1.5, Lienert and Joos, 2018). We investigate their ELUC trend with linear regressions, magnitude, and variability with the mean and standard deviation, under conditions with or without peat emissions.
3.1 Annual land use changes in Indonesia
In this section, we analyse the cropland dynamics over Indonesia for the last 2 decades. There are three datasets, i.e. LUH2-GCB2022, MB1, and MB2. All of the datasets show that cropland increased between 2000 and 2022, but the total change varied between 10 and 20 Mha (Fig. 2a). The highest increase, in LUH2-GCB2022, was mainly in 2016–2022, when it grew by 10 Mha. The difference between the datasets can be seen clearly from the dynamics of the cropland change (Fig. 2b). LUH2-GCB2022 shows higher cropland changes than MB1 or MB2. In certain years, it shows a gain of nearly 3 Mha, such as in 2003 and 2016, while it shows a significant loss of over 1 Mha in 2005, for which we could not find any independent evidence supporting such a large decline in cropland during that year. Furthermore, the order 2010, 2012, and 2014, when the change in LUH2-GCB2022 cropland is exactly zero, seems unlikely as Indonesia has experienced continuous increased development in agriculture during recent decades (Gandharum et al., 2022; Maheng et al., 2021). Other than that, MB1 shows a decrease in cropland area in 2019, but this year has low confidence for MB1, as 2019 is the final year of the dataset and the Mapbiomas methodology needs validation from 1 year before and 1 year after (Mapbiomas Indonesia, 2022). This is confirmed in MB2, which shows no decrease in cropland in 2019. Annual cropland changes in MB2 increased from 2000 to 2011/2012, with a peak of about 1.2 Mha cropland expansion and a slow decrease thereafter.
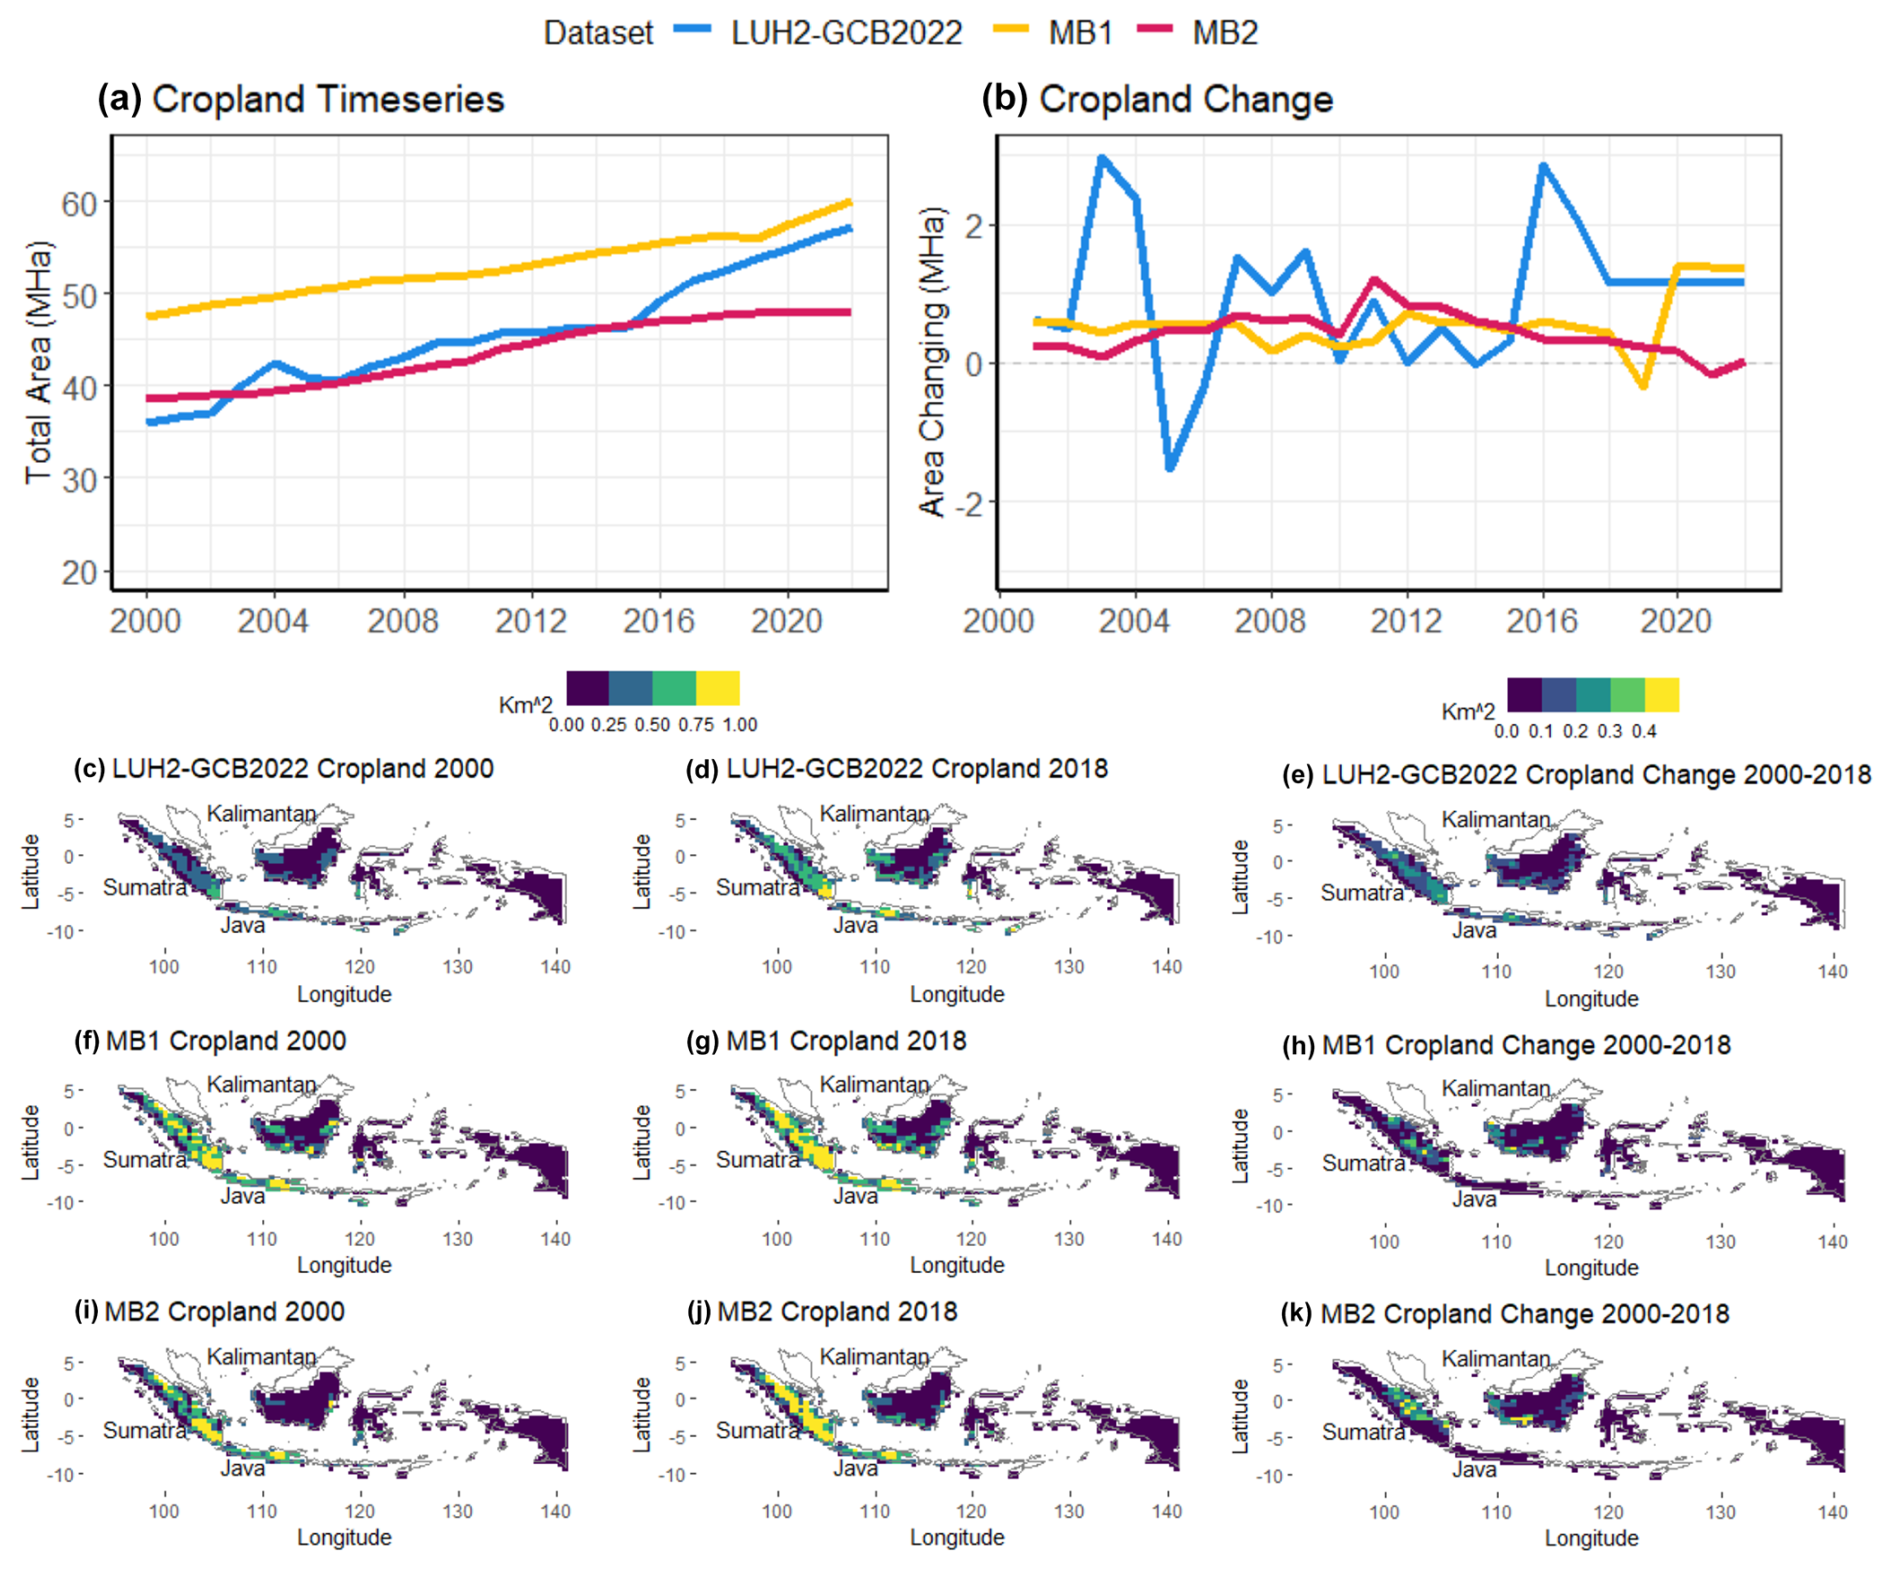
Figure 2The comparison of data driver time series of (a) cropland areas (Mha) and (b) annual cropland area change (Mha) as well as the spatial distributions of cropland fractions in (c) LUH2-GCB2022 in 2000, (d) LUH2-GCB2022 in 2018, (e) LUH2-GCB2022 between 2000 and 2018 (2018 fraction minus the 2000 fraction), (f) MB1 in 2000, (g) MB1 in 2018, (h) MB1 between 2000 and 2018 (2018 fraction minus the 2000 fraction), (i) MB2 in 2000, (j) MB2 in 2018, and (k) MB2 between 2000 and 2018 (2018 fraction minus the 2000 fraction).
The differences in cropland change in Indonesia across the datasets can also be observed from their spatial distribution. All three datasets, LUH2-GCB2022, MB1, and MB2, agree that most cropland areas are concentrated on the three main islands of Sumatra, Kalimantan, and Java, with smaller areas found in Bali, Nusa Tenggara, Sulawesi, Papua, and Maluku (Fig. 2c–k). When examining the spatial distribution of the cropland total, MB1 and MB2 show higher cropland fractions in Sumatra, Kalimantan, and Java compared to the LUH2-GCB2022 dataset in 2000 and 2018 (Fig. 2c, d, f, g, i, and j). The LUH2-GCB2022 dataset shows a significantly larger increase in cropland fractions compared to Mapbiomas in Sumatra and Java over the 2 decades (Fig. 2e, h, and k).
However, this does not mean that Mapbiomas is less uncertain than LUH2-GCB2022. For instance, MB1 and MB2 have different spatial distributions to some extent, although they both come from the same source with different versions. For example, in Sumatra in 2000, MB1 shows that a high cropland fraction is distributed across the island (Fig 2f), while MB2 is more concentrated on the southern part of the island (Fig. 2i). This is also seen clearly in Kalimantan (Fig. 2h and k).
3.2 Annual model ELUC estimation
There are two sources of uncertainty in determining the ELUC magnitude and trend in Indonesia: first the driving LULCC datasets and second the fate of the different carbon reservoirs (vegetation, litter, and soils) after LULCC. We first investigate the uncertainty from LULCC by performing simulations with the different cropland datasets (LUH2-GCB2022, MB1, and MB2) in the same DGVM, JULES-ES (Fig. 3a).
Unsurprisingly, JULES-ES driven by LUH2-GCB2022 shows the largest interannual variability in ELUC, consistent with the changes in cropland areas in that forcing (Fig. 2b), showing higher emissions of more than 0.15 PgC yr−1 in 2004 and 2017, and following the largest cropland changes that happened the year before in the LUH2-GCB2022 dataset. The ELUC mean and internal variability from LUH2-GCB2022 is 0.11 ± 0.03 PgC yr−1. These patterns do not appear in JULES-ES when forced by either MB1 or MB2, with the simulated ELUC showing less year-to-year variability and being 0.08 ± 0.01 and 0.06 ± 0.01 PgC yr−1, respectively, for the last 2 decades. However, notable differences also exist between ELUC driven by MB1 and MB2, following the cropland patterns shown in Fig. 2. The MB2 ELUC is lower than the MB1 ELUC, as cropland expansion is generally lower in MB2 (Fig. 2b). The average estimation of the Indonesian ELUC of JULES-ES from different driving LULCC is 0.08 [0.06–0.11] PgC yr−1.
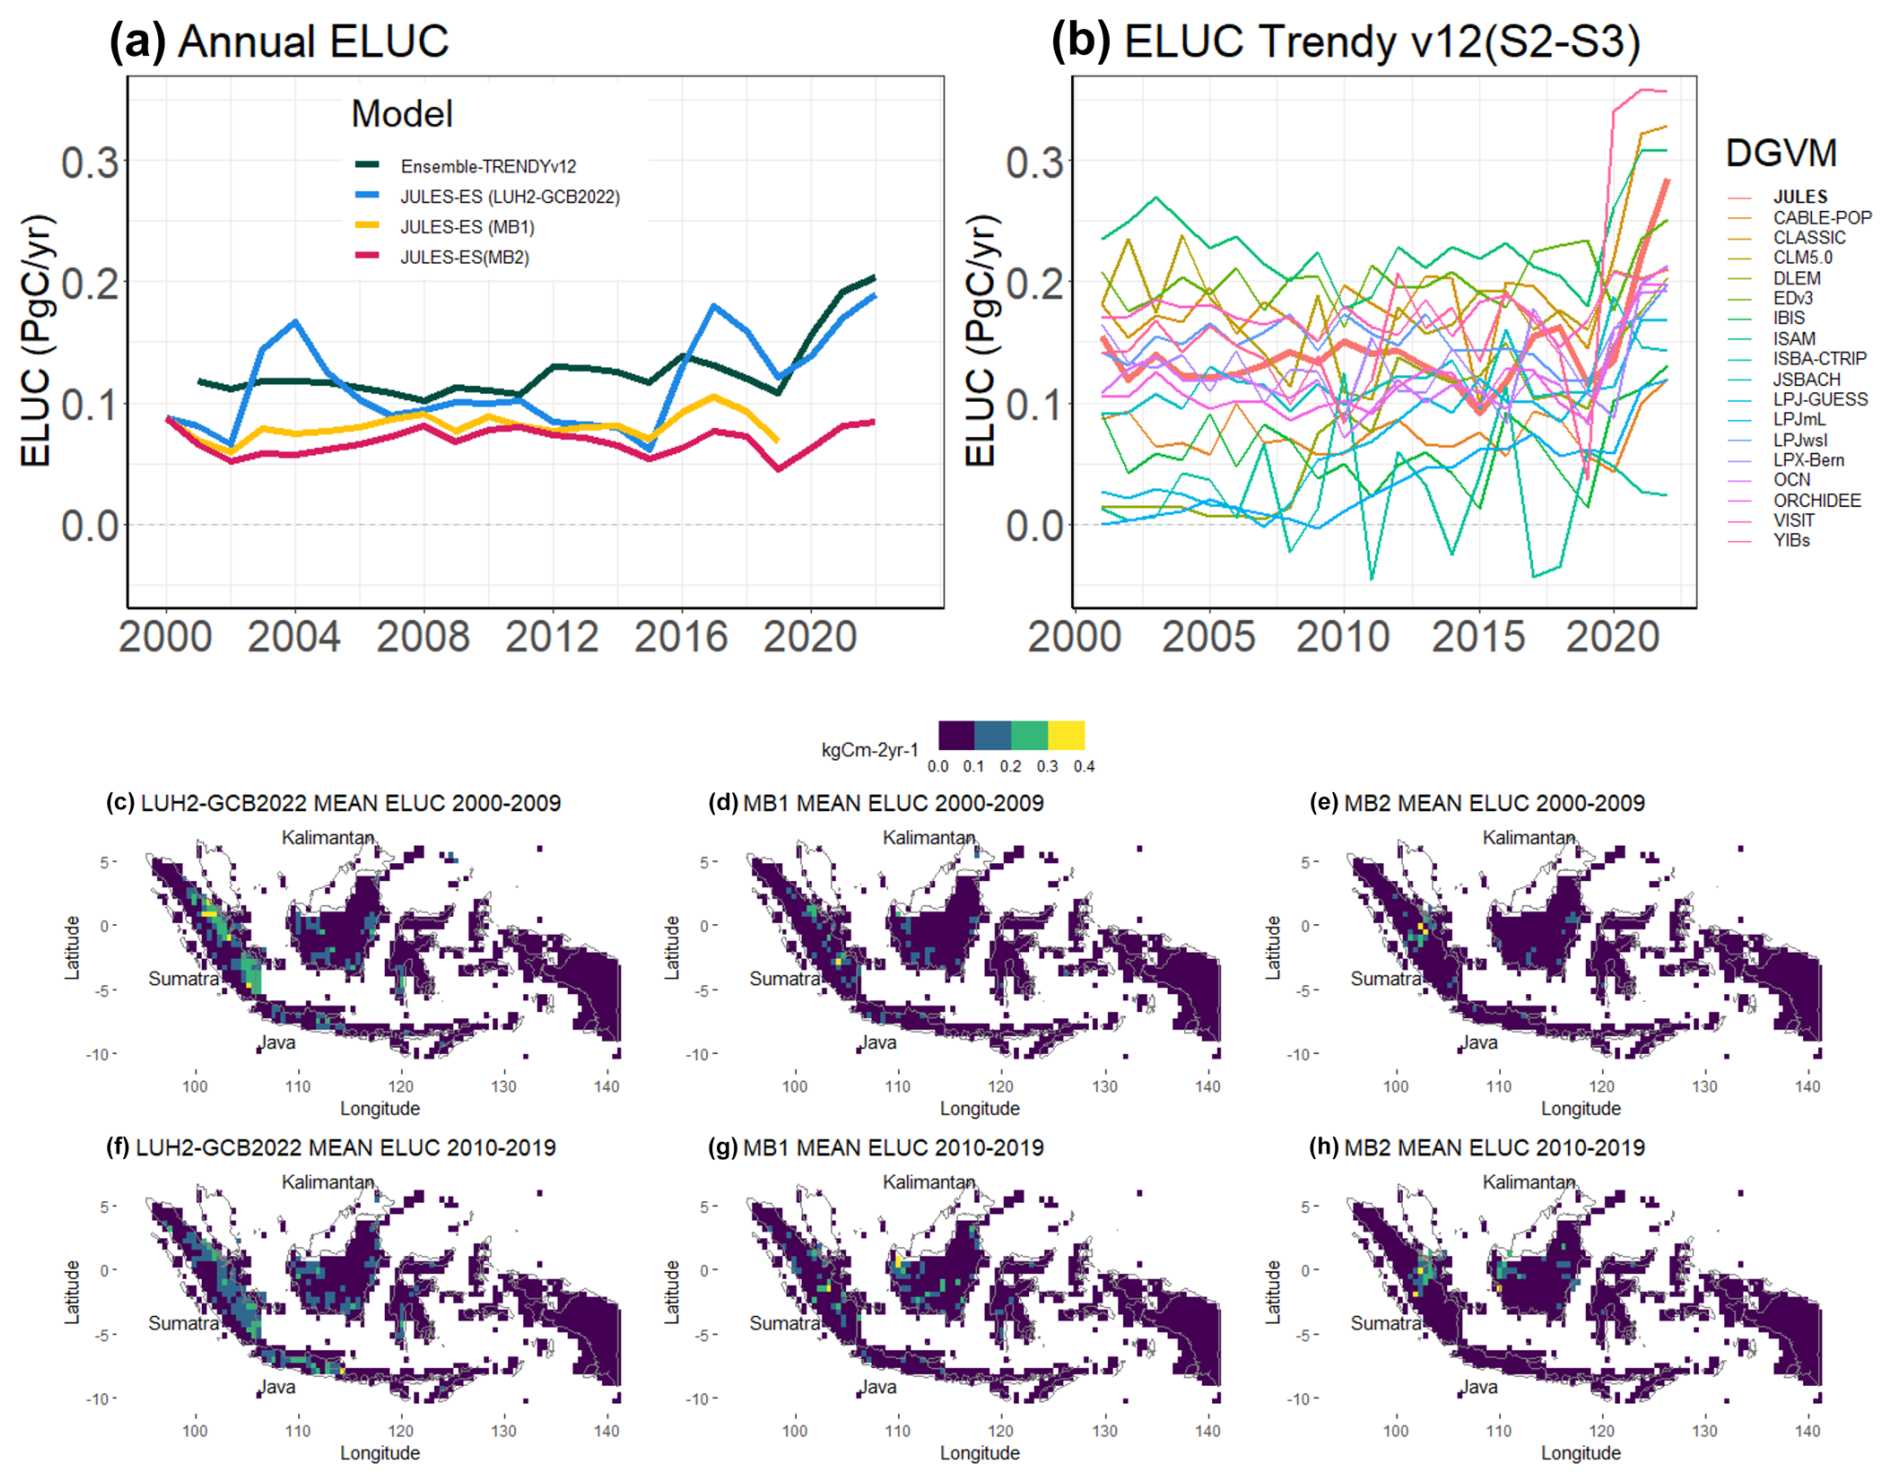
Figure 3The ELUC model comparison: (a) JULES-ES with various drivers + ensemble in TRENDY v12 and (b) various DGVMs in TRENDY v12 using MB1 as the driver. Spatial and decadal changes of (c) JULES-ES (LUH2-GCB2022) for 2000–2009, (d) JULES-ES (MB1) for 2000–2009, (e) JULES-ES (MB2) for 2000–2009, (f) JULES-ES (LUH2-GCB2022) for 2010–2019, (g) JULES-ES (MB1) for 2010–2019, and (h) JULES-ES (MB2) for 2010–2019.
We now turn to the second source of uncertainty which comes from the representation of ELUC dynamics in models. This is illustrated in Fig. 3b, which shows 18 DGVMs (including JULES-ES) from GCB 2023. All of the DGVMs have the same cropland input MB1, similar to GCB 2023. The result shows that there is little agreement on the magnitude and year-to-year variability of ELUC across the models. The ELUC estimates from various carbon reservoir models in TRENDY v12 are 0.12 ± 0.02 PgC yr−1 (α=0.05). Moreover, there is a large range from −0.04 to 0.35 PgC yr−1, much larger than the range of ELUC estimates from various drivers.
In addition, we can see the impact of different driver data from their spatial distribution. The higher cropland change in LUH2-GCB2022 (Fig. 2e) results in a higher estimation of ELUC, mainly in Kalimantan, Sumatra, and Java (Fig. 3c and f). The JULES-ES simulations based on input from MB1 and MB2 are more similar but still show some differences in the fine spatial details (Fig. 3d, e, g, and h). For example, in Sumatra, JULES-ES (MB2) shows higher carbon emissions in the centre of the island, while the JULES-ES (MB1) simulation has emissions spread more evenly across the island.
3.3 Comparison of ELUC with other products
In addition to analysing the uncertainties caused by land use change drivers and the land cover change dynamics in DGVMs, we compare our findings with other estimates such as those from BKMs and those from the NGHGI. From the Global Carbon Budget 2023, there are three BKMs, which is comparable to the DGVMs analysed above. For the NGHGI, there are BUR2 and BUR3, released by the Ministry of Environment and Forestry of the Republic of Indonesia and covering the 2000–2016 and 2000–2019 periods, respectively. Then the FAO GHG inventory (FAO, 2023; Francesco Tubiello, 2020; Tubiello et al., 2021) is also compared.
The result shows that the ensemble of the TRENDY v12 ELUC mean and internal variability is similar to the bookkeeping model BLUE's ELUC estimation, with 0.12 ± 0.02 and 0.12 ± 0.02 PgC yr−1, respectively, both showing a steady trend (Fig. 4a). The other BKMs H&C and OSCAR result in 0.14 ± 0.05 and 0.15 ± 0.03 PgC yr−1. The BKM mean is 0.14 [0.12 to 0.15] PgC yr−1. The FAO GHG estimates lower carbon emissions of 0.10 ± 0.06 PgC yr−1. The NGHGI's BUR3 estimates the lowest carbon emission mean and internal variability of 0.06 ± 0.06 PgC yr−1, with an increasing trend. Furthermore, BUR3 and the FAO GHG have different annual patterns.
These emissions are much higher when the peat emissions are included. The carbon emissions are doubled: TRENDY v12 = 0.23 ± 0.05, BLUE = 0.22 ± 0.06, and BUR3 = 0.13 ± 0.10 PgC yr−1. This is consistent with other BKMs such as H&C and OSCAR with estimations of 0.25 ± 0.07 and 0.25 ± 0.06 PgC yr−1. The FAO GHG with peat emissions estimates 0.20 ± 0.09 PgC yr−1. Also, another NGHGI, BUR2, estimates 0.18 ± 0.07 PgC yr−1 of the carbon emission total with peat. A distinct difference is also shown by all DGVMs and BKMs having a steady trend, while the NGHGI tends to have an increasing trend and higher variability. We also found that all of the models and products show the same peaks in the years 2002, 2006, 2009, 2015, and 2019 (Fig. 4b). This does not appear in the emissions without peat (Fig. 4a), except for the FAO GHG inventory. This is the exact same year of moderate to high El Niño.
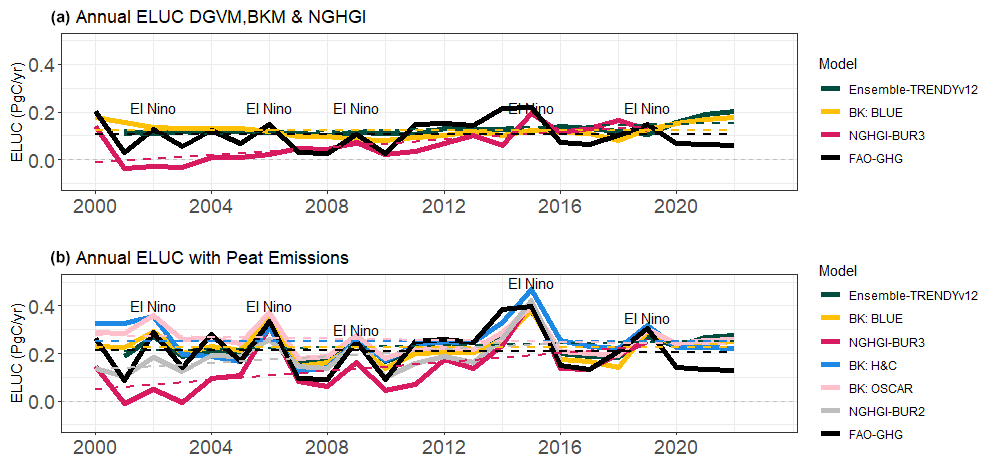
Figure 4ELUC comparison of different models over the period 2000–2022. (a) Annual ELUC from the DGVMs, BKMs, and NGHGI. (b) Annual ELUC from the BLUE and BUR3 models with and without peat emissions + ensemble TRENDY v12.
This research analyses land cover products that are used to estimate Indonesian ELUC fluxes. The LULCC driving dataset is one of the main sources of uncertainty in ELUC trends in Indonesia (Bastos et al., 2020; Gasser et al., 2020). Thus, we compare LUH2-GCB22, which is derived from a national-statistics-based dataset of FAO and which is used widely for ELUC, including for the Global Carbon Budget until its 2022 version, with the new satellite-based dataset Mapbiomas Indonesia 1.0, which is utilized as a driver dataset in GCB 2023. In addition, we investigate the latest version of Mapbiomas Indonesia 2.0, which has not yet been used in any GCB assessments. Results show that all of the datasets have an increase in cropland area over the period 2000–2022, but the magnitude and year-to-year change show limited agreement across the datasets. This greatly impacts the simulated annual emissions of ELUC using our carbon cycle model, JULES-ES.
Many models and simulations use changes in agricultural areas based on statistical data reported by countries to FAO as a forcing for tree cover loss. They show that FAO agricultural statistics have high uncertainties (Ajaz, 2016; Desiere et al., 2016). However, the FAO dataset has the capability to be used for net deforestation (Tubiello et al., 2021). On the other hand, the use of satellite-based estimates of land cover changes for land use changes has some limitations and uncertainties (Tubiello et al., 2023). This means that both national-statistics-based and satellite-based datasets have their own advantages and disadvantages, which should be treated with caution in order to improve our understanding of carbon emissions from LULCC.
Cropland transition is essential. For example, in southern Sumatra, where the national-statistics-based (LUH2-GCB2022) and satellite-based (MB1 and MB2) datasets show distinct differences, LUH2-GCB2022 shows a much smaller cropland area compared to Mapbiomas in 2000 (Fig. 2c, g, and i). In this region, forest cover shrank rapidly between 1996 and 2000 (Purnomo et al., 2023). However, this was not directly converted into cropland: it became shrubland in 2000 and was then converted into pulpwood plantation and oil palm from 2000 onwards (Gaveau et al., 2007; Purnomo et al., 2023). This process might have caused different classifications between satellite and national statistics. Furthermore, it can be seen in Java, where a national-statistics-based dataset shows a higher increase in cropland change. Meanwhile, Java has been experiencing massive infrastructure development that limits the potential expansion of agriculture in this period (Gandharum et al., 2022; Maheng et al., 2021).
This Mapbiomas difference with LUH2-GCB2022 aligns with other research that shows Kalimantan and Sumatra having the highest rate of deforestation before 2000 (since 1950) (Gaveau et al., 2022; Santoro et al., 2023). Deforestation in Java and Bali already occurred before 1950 (Gaveau et al., 2022; Santoro et al., 2023). This means that all three of the main islands already had large cropland areas before 2000. There are also large differences in the border regions of Kalimantan and Sumatra. These areas are known for their dense forests and have experienced major forest fires during El Niño events in the last 2 decades (2000–2020) (Brasika, 2023; Fanin and van der Werf, 2017).
The satellite-based dataset has more consistency with cropland expansion in Indonesia, which is related to other LULCC like deforestation and urbanization. This aligns with other research (Gaveau et al., 2022) that shows that forest conversion to agriculture (specifically oil palm) increased during the 2000s, peaked around 2009–2012, and steadily declined thereafter. Also, MB2 does not show peculiar years when cropland area changes would be exactly zero. Overall, we expect MB2 to be the most accurate representation of the croplands we assess in this study.
In our current model, we use grazing lands from the LUH2-GCB2022 dataset as input for all simulations in JULES-ES. This might cause some double accounting of grazing land in our satellite-based simulations, where grazing land might be counted as both cropland and grazing land. However, this effect should be very small as grazing land covers a small area in Indonesia (around 3 Mha) and has been considerably steady for the last 2 decades (FAO, 2022; Mapbiomas Indonesia, 2022). Also, in the JULES-ES simulation, there is no large difference in the carbon emissions caused by forest conversion to cropland or grazing land (Burton et al., 2019).
Furthermore, another potential misrepresentation in our model is ELUC from palm oil. As palm oil makes significant contributions to the forest–agricultural dynamic in Indonesia (Cisneros et al., 2021; FAO, 2023; Gaveau et al., 2021; Tsujino et al., 2016), it should be represented in the model as a specific plant functional type (PFT). Unfortunately, we currently follow the Mapbiomas Indonesia definition of agriculture, which categorizes palm oil (together with rice paddy, pulpwood plantation, and other agriculture) as cropland, because there is no PFT for palm oil in our model. The lack of a palm oil vegetation type is likely to cause an inaccuracy of ELUC. As Mapbiomas Indonesia has palm oil in Indonesian land cover (Mapbiomas Indonesia, 2022), future model simulations should consider this separation.
Another interesting aspect is how these products might reveal the connection between carbon emissions and climate dynamics. All DGVMs, BKMs, and the NGHGI with peat emissions show a strong relation to climate events, which shows that the peak in carbon emissions is in exactly the same year of moderate to strong El Niño. This appears in 2002, 2006, 2009, 2015, and 2019. It is mainly contributed by the carbon emissions from peat fire and peat drainage. During the El Niño year, Indonesia experiences drier and hotter climate conditions, especially in Sumatra and Kalimantan (Brasika, 2021; Nurdiati et al., 2022). This condition is favourable for fire regimes in the area that burn not only the above-ground biomass, but also the peat soil below the ground (Brasika et al., 2021; Fanin and van der Werf, 2017). As peat contains a lot of carbon and peat fire is hardly detected and managed (Indradjad et al., 2024), this results in the massive peat fire release of carbon during the hot and dry El Niño year (Stockwell et al., 2016). However, ELUC without peat emissions has almost zero connection to these El Niño dynamics. This is confirmed by all of the products of the DGVMs, BKMs, and NGHGI. The carbon emissions from peat play a key role in Indonesia, with fluxes 1–3 times higher than ELUC and stronger in El Niño years. This should not be neglected in future simulations.
Both the national-statistics-based and satellite-based datasets have their own strengths and weaknesses. The national-statistics-based dataset has lower confidence as it has no spatial distribution, while the satellite-based dataset has limited temporal availability. Addressing these differences might improve our understanding of uncertainties in carbon emission estimates caused by the drivers. However, improving the driver dataset is not the only issue: the model itself has potential uncertainties as each of them is created with different approaches. This can be seen in how all of the DGVMs in TRENDY v12 have the same input drivers but result in different patterns and magnitudes of carbon emission simulations. Our best estimation of Indonesian ELUC for the last 2 decades is 0.12 ± 0.02 PgC yr−1. As this is the mean of all of the DGVMs, it is also consistent with BKMs. This emission is doubled to 0.23 ± 0.05 PgC yr−1 if we include the peat fire and peat drainage emissions.
We find some important issues that should be addressed carefully in order to reduce these uncertainties in the future. First, the combination of the national-statistics-based and satellite-based datasets improves our understanding of the uncertainties of carbon emissions. Second, the inclusion of peat emissions and the climate effect (El Niño) in the models makes major contributions to the carbon emissions in Indonesia. Third, palm oil representations, which are dominant in Indonesia's agriculture with a distinct carbon cycle, have been simplified here.
Apart from the many uncertainties created by the drivers and models and some representations such as peat emissions, palm oil, and climate dynamics, we found several robust agreements between these models and products. First, all of the products agree that Indonesian carbon emissions from LULCC have had no decreasing trend for the last 2 decades. Second, the peat fire and peat drainage have doubled the carbon emissions. Third, it is highly confident that carbon emissions of peat have a strong relation to El Niño but not carbon emissions from land use change. Fourth, Sumatra, Kalimantan, and Java are the main islands which contribute to Indonesian carbon emissions. Last, it seems that prevention of deforestation and fire had a low effect in Indonesia in reducing carbon emissions when addressing climate change.
The JULES-ES code used in these simulations is available from the Met Office's Science Repository Service with suite u-db861 at https://code.metoffice.gov.uk/trac/roses-u/browser/d/b/8/6/1/trunk?rev=304290 (Brasika et al., 2025b).
The JULES-ES output can be accessed at https://doi.org/10.5281/zenodo.15552386 (Brasika, 2025a). The Mapbiomas data are freely available at https://mapbiomas.nusantara.earth, last access: 11 December 2022. LUH2 can be accessed at https://luh.umd.edu (Hurtt et al., 2019). The historical dataset is available at https://doi.org/10.22033/ESGF/input4MIPs.10454 (Chini and Hurtt, 2025) and specifically for LUH2-GCB2022 at https://doi.org/10.5281/zenodo.15556812 (Chini and Hurtt, 2025). All of the TRENDY and bookkeeping (BLUE, H&C, and OSCAR) data are freely available from the following website: https://globalcarbonbudgetdata.org/ (Friedlingstein et al., 2023).
The supplement related to this article is available online at https://doi.org/10.5194/bg-22-3547-2025-supplement.
IBMB, PF, and SS designed the ideas and methodology. MO'S developed the ELUC simulation in JULES-ES and its analysis tools. TMR developed the approach to Mapbiomas data gathering and pre-processing. MCDR set up JULES-ES. KKG prepared HYDE and included the extrapolation of Mapbiomas. JP and CS prepared the bookkeeping models and their analysis. GCH and LPC created LUH2-GCB2022 and LUH2 for the TRENDY v12 simulations. IBMB analysed the data and discussed the results with all of the authors. IBMB and PF led the writing of the manuscript, to which all of the authors contributed.
The contact author has declared that none of the authors has any competing interests.
Publisher’s note: Copernicus Publications remains neutral with regard to jurisdictional claims made in the text, published maps, institutional affiliations, or any other geographical representation in this paper. While Copernicus Publications makes every effort to include appropriate place names, the final responsibility lies with the authors.
Ida Bagus Mandhara Brasika thanks Indonesian Endowment Fund, also knows as LPDP (Lembaga Pengelola Dana Pendidikan) for the PhD scholarship. George C. Hurtt and Louise P. Chini were supported by the NASA Carbon Monitoring System under grant nos. 80NSSC21K1059 and 80NSSC25K7221. This research was supported by the University of Exeter through central OA funds. Maria Carolina Duran-Rojas is partially supported by the UK Research and Innovation “AI for Net Zero” programme: ADD-TREES (grant no. EP/Y005597/1), NetZeroPlus (NZ+) funded by UKRI-BBSRC grant no. BB/v011588/1, and ESM2025 project no. 866874.
This research has been supported by the Lembaga Pengelola Dana Pendidikan (grant no. 0003259/ATM/D/ASN-2021).
This paper was edited by Akihiko Ito and reviewed by two anonymous referees.
Agung Sugardiman, R., Lead Authors Joko Prihatno, C., Rachmawaty, E., Marjaka Lead Authors Rizaldi Boer, W., Gumilang Dewi, R., Ardiansyah, M., Siagian, U. W., Gunawan, A., Yeni Masri, A., Rosehan, A., Purbo, A., Darmawan, A., Wijaya, A., Arunarwati Margono, B., Martinus, D., Tri Kurniawaty, E., Pratiwi, E., Novitri, F., Zamzani, F., Nur Merrillia Sularso, G., Setiawan, G., Immanuel, G., Sutiyono, G., Wibowo, H., Krisnawati, H., Purnomo, H., Hendrawan, I., Wayan Susi Darmawan, I., Purwanto, J., Utama, K., Kartikasari, L., Sofitri, L., Widyaningtyas, N., Bagiyono, R., Parinderati, R., Rakhmana, R., Dhora Sirait, R., Asmani, R., Lathif, S., Andini, S., Manuri, S., Rusolono, T., Precilia, V., Gunawan, W., Murti, W., and Suryanti, Y.: INDONESIA Second Biennial Update Report Under the United Nations Framework Convention on Climate Change REPUBLIC OF INDONESIA, https://unfccc.int/documents/192165 (last access: 18 May 2025), 2018.
Ajaz, A.: National and Global censuses or Satellite-based Estimates? Asia's Irrigated Areas: in a Muddle, Chiang Mai, 2nd World Irrigation Forum (WIF2), 6-8 November 2016, Chiang Mai, Thailand, https://www.researchgate.net/profile/Ali-Ajaz-2/publication/ (last access: 18 May 2025), 2016.
Anwar, S., Rachmawaty, E., Marjaka, W., Arunarwati Margono Lead Authors Rizaldi Boer, B., Gumilang Dewi, R., Siagian, U. W., Ardiansyah, M., Sunkar, A., Yeni Masri, A., Rosehan, A., Tosiani, A., Rossita, A., Darmawan, A., Yusara, A., Marthinus, D., Riana, E., Pratiwi, E., Novitri, F., Zamzani, F., Nur Merrillia Sularso, G., Immanuel, G., Wibowo, H., Krisnawati, H., Purnomo, H., Assad, I., Albar, I., Hendrawan, I., Prihatno, J., Purwanto, J., Utama, K., Ratnasari, L., Novita, N., Bagiyono, R., Parinderati, R., Rakhmana, R., Dhora Sirait, R., Asmani, R., Lathif, S., Manuri, S., Tiyanti, S., Rusolono, T., Precilia, V., Gunawan, W., and Suryanti, Y.: INDONESIA Third Biennial Update Report Under the United Nations Framework Convention on Climate Change REPUBLIC OF INDONESIA, 2021.
Badan Pusat Statistik: Hasil pencacahan lengkap sensus pertanian 2023 Complete Enumeration Results of the 2023 Census of Agriculture, Indonesian government, National Statistic Agency, https://www.bps.go.id/en/publication/2024/ (last access: 18 May 2025), 2023.
Bastos, A., O'Sullivan, M., Ciais, P., Makowski, D., Sitch, S., Friedlingstein, P., Chevallier, F., Rödenbeck, C., Pongratz, J., Luijkx, I. T., Patra, P. K., Peylin, P., Canadell, J. G., Lauerwald, R., Li, W., Smith, N. E., Peters, W., Goll, D. S., Jain, A. K., Kato, E., Lienert, S., Lombardozzi, D. L., Haverd, V., Nabel, J. E. M. S., Poulter, B., Tian, H., Walker, A. P., and Zaehle, S.: Sources of Uncertainty in Regional and Global Terrestrial CO2 Exchange Estimates, Global Biogeochem. Cy., 34, e2019GB006393, https://doi.org/10.1029/2019GB006393, 2020.
Best, M. J., Pryor, M., Clark, D. B., Rooney, G. G., Essery, R. L. H., Ménard, C. B., Edwards, J. M., Hendry, M. A., Porson, A., Gedney, N., Mercado, L. M., Sitch, S., Blyth, E., Boucher, O., Cox, P. M., Grimmond, C. S. B., and Harding, R. J.: The Joint UK Land Environment Simulator (JULES), model description – Part 1: Energy and water fluxes, Geosci. Model Dev., 4, 677–699, https://doi.org/10.5194/gmd-4-677-2011, 2011.
Brasika, I. B. M.: Ensemble Model of Precipitation Change Over Indonesia Caused by El Nino Modoki, JMRT, 72–76, ISSN: 2621-0096, 2021.
Brasika, I. B. M.: Forest Fire Emissions in Equatorial Asia and Their Recent Delay Anomaly in the Dry Season, in: Vegetation Fires and Pollution in Asia, Springer International Publishing, Cham, 447–462, https://doi.org/10.1007/978-3-031-29916-2_26, 2023.
Brasika, I. B. M.: JULES-ES of carbon emissions from land use change (ELUC) in Indonesia, Zenodo [data set], https://doi.org/10.5281/zenodo.15552387, 2025a.
Brasika, I. B. M.: JULES-ES code for carbon emissions from land use change (ELUC) in Indonesia: u-db861, Met Office [code], https://code.metoffice.gov.uk/trac/roses-u/browser/d/b/8/6/1/trunk?rev=304290 (last access: 18 May 2025), 2025b.
Brasika, I. B. M., Antara, I. M. O. G., and Karang, I. W. G. A.: Investigating El Nino Southern Oscillation as the main driver of forest fire in Kalimantan, Malays. J. Soc. Space, 17, 4, https://doi.org/10.17576/geo-2021-1704-21, 2021.
Burton, C., Betts, R., Cardoso, M., Feldpausch, R. T., Harper, A., Jones, C. D., Kelley, D. I., Robertson, E., and Wiltshire, A.: Representation of fire, land-use change and vegetation dynamics in the Joint UK Land Environment Simulator vn4.9 (JULES), Geosci. Model Dev., 12, 179–193, https://doi.org/10.5194/gmd-12-179-2019, 2019.
Chini, L. and Hurtt, G.: Land-Use Harmonization 2 for Global Carbon Budget 2022 (LUH2-GCB2022), Zenodo [data set], https://doi.org/10.5281/zenodo.15556812, 2025.
Chini, L., Hurtt, G., Sahajpal, R., Frolking, S., Klein Goldewijk, K., Sitch, S., Ganzenmüller, R., Ma, L., Ott, L., Pongratz, J., and Poulter, B.: Land-use harmonization datasets for annual global carbon budgets, Earth Syst. Sci. Data, 13, 4175–4189, https://doi.org/10.5194/essd-13-4175-2021, 2021.
Cisneros, E., Kis-Katos, K., and Nuryartono, N.: Palm oil and the politics of deforestation in Indonesia, J. Environ. Econ. Manag., 108, 102453, https://doi.org/10.1016/j.jeem.2021.102453, 2021.
Clark, D. B., Mercado, L. M., Sitch, S., Jones, C. D., Gedney, N., Best, M. J., Pryor, M., Rooney, G. G., Essery, R. L. H., Blyth, E., Boucher, O., Harding, R. J., Huntingford, C., and Cox, P. M.: The Joint UK Land Environment Simulator (JULES), model description – Part 2: Carbon fluxes and vegetation dynamics, Geosci. Model Dev., 4, 701–722, https://doi.org/10.5194/gmd-4-701-2011, 2011.
Conchedda, G. and Tubiello, F. N.: Drainage of organic soils and GHG emissions: Validation with country data, Earth Syst. Sci. Data, 12, 3113–3137, https://doi.org/10.5194/essd-12-3113-2020, 2020.
Cox, P. M.: Description of the “TRIFFID” Dynamic Global Vegetation Model, Hadley Centre, Met Office, 2001.
Datta, A. and Krishnamoorti, R.: Understanding the Greenhouse Gas Impact of Deforestation Fires in Indonesia and Brazil in 2019 and 2020, Front. Clim., 4, 799632, https://doi.org/10.3389/fclim.2022.799632, 2022.
Desiere, S., Staelens, L., and D'Haese, M.: When the Data Source Writes the Conclusion: Evaluating Agricultural Policies, J. Dev. Stud., 52, 1372–1387, https://doi.org/10.1080/00220388.2016.1146703, 2016.
Fanin, T. and van der Werf, G. R.: Precipitation-fire linkages in Indonesia (1997–2015), Biogeosciences, 14, 3995–4008, https://doi.org/10.5194/bg-14-3995-2017, 2017.
FAO: Country Notes-FAOSTAT Land Use database, Jun 2022 COUNTRY NOTES, https://www.fao.org/faostat/en/#data/RL (last access: 18 May 2025), 2022.
FAO: Agrifood systems and land-related emissions Global, regional and country trends, FAO, ISSN 2709-006X (print), ISSN 2709-0078, https://doi.org/10.4060/cc8543en, 2023.
Fernandes, K., Verchot, L., Baethgen, W., Gutierrez-Velez, V., Pinedo-Vasquez, M., and Martius, C.: Heightened fire probability in Indonesia in non-drought conditions: the effect of increasing temperatures, Environ. Res. Lett., 12, 054002, https://doi.org/10.1088/1748-9326/aa6884, 2017.
Friedlingstein, P., Jones, M. W., O'Sullivan, M., Andrew, R. M., Hauck, J., Peters, G. P., Peters, W., Pongratz, J., Sitch, S., Le Quéré, C., Bakker, D. C. E., Canadell, J. G., Ciais, P., Jackson, R. B., Anthoni, P., Barbero, L., Bastos, A., Bastrikov, V., Becker, M., Bopp, L., Buitenhuis, E., Chandra, N., Chevallier, F., Chini, L. P., Currie, K. I., Feely, R. A., Gehlen, M., Gilfillan, D., Gkritzalis, T., Goll, D. S., Gruber, N., Gutekunst, S., Harris, I., Haverd, V., Houghton, R. A., Hurtt, G., Ilyina, T., Jain, A. K., Joetzjer, E., Kaplan, J. O., Kato, E., Klein Goldewijk, K., Korsbakken, J. I., Landschützer, P., Lauvset, S. K., Lefèvre, N., Lenton, A., Lienert, S., Lombardozzi, D., Marland, G., McGuire, P. C., Melton, J. R., Metzl, N., Munro, D. R., Nabel, J. E. M. S., Nakaoka, S.-I., Neill, C., Omar, A. M., Ono, T., Peregon, A., Pierrot, D., Poulter, B., Rehder, G., Resplandy, L., Robertson, E., Rödenbeck, C., Séférian, R., Schwinger, J., Smith, N., Tans, P. P., Tian, H., Tilbrook, B., Tubiello, F. N., van der Werf, G. R., Wiltshire, A. J., and Zaehle, S.: Global Carbon Budget 2019, Earth Syst. Sci. Data, 11, 1783–1838, https://doi.org/10.5194/essd-11-1783-2019, 2019.
Friedlingstein, P., O'Sullivan, M., Jones, M. W., Andrew, R. M., Gregor, L., Hauck, J., Le Quéré, C., Luijkx, I. T., Olsen, A., Peters, G. P., Peters, W., Pongratz, J., Schwingshackl, C., Sitch, S., Canadell, J. G., Ciais, P., Jackson, R. B., Alin, S. R., Alkama, R., Arneth, A., Arora, V. K., Bates, N. R., Becker, M., Bellouin, N., Bittig, H. C., Bopp, L., Chevallier, F., Chini, L. P., Cronin, M., Evans, W., Falk, S., Feely, R. A., Gasser, T., Gehlen, M., Gkritzalis, T., Gloege, L., Grassi, G., Gruber, N., Gürses, Ö., Harris, I., Hefner, M., Houghton, R. A., Hurtt, G. C., Iida, Y., Ilyina, T., Jain, A. K., Jersild, A., Kadono, K., Kato, E., Kennedy, D., Klein Goldewijk, K., Knauer, J., Korsbakken, J. I., Landschützer, P., Lefèvre, N., Lindsay, K., Liu, J., Liu, Z., Marland, G., Mayot, N., McGrath, M. J., Metzl, N., Monacci, N. M., Munro, D. R., Nakaoka, S.-I., Niwa, Y., O'Brien, K., Ono, T., Palmer, P. I., Pan, N., Pierrot, D., Pocock, K., Poulter, B., Resplandy, L., Robertson, E., Rödenbeck, C., Rodriguez, C., Rosan, T. M., Schwinger, J., Séférian, R., Shutler, J. D., Skjelvan, I., Steinhoff, T., Sun, Q., Sutton, A. J., Sweeney, C., Takao, S., Tanhua, T., Tans, P. P., Tian, X., Tian, H., Tilbrook, B., Tsujino, H., Tubiello, F., van der Werf, G. R., Walker, A. P., Wanninkhof, R., Whitehead, C., Willstrand Wranne, A., Wright, R., Yuan, W., Yue, C., Yue, X., Zaehle, S., Zeng, J., and Zheng, B.: Global Carbon Budget 2022, Earth Syst. Sci. Data, 14, 4811–4900, https://doi.org/10.5194/essd-14-4811-2022, 2022.
Friedlingstein, P., O'Sullivan, M., Jones, M. W., Andrew, R. M., Bakker, D. C. E., Hauck, J., Landschützer, P., Le Quéré, C., Luijkx, I. T., Peters, G. P., Peters, W., Pongratz, J., Schwingshackl, C., Sitch, S., Canadell, J. G., Ciais, P., Jackson, R. B., Alin, S. R., Anthoni, P., Barbero, L., Bates, N. R., Becker, M., Bellouin, N., Decharme, B., Bopp, L., Brasika, I. B. M., Cadule, P., Chamberlain, M. A., Chandra, N., Chau, T.-T.-T., Chevallier, F., Chini, L. P., Cronin, M., Dou, X., Enyo, K., Evans, W., Falk, S., Feely, R. A., Feng, L., Ford, D. J., Gasser, T., Ghattas, J., Gkritzalis, T., Grassi, G., Gregor, L., Gruber, N., Gürses, Ö., Harris, I., Hefner, M., Heinke, J., Houghton, R. A., Hurtt, G. C., Iida, Y., Ilyina, T., Jacobson, A. R., Jain, A., Jarníková, T., Jersild, A., Jiang, F., Jin, Z., Joos, F., Kato, E., Keeling, R. F., Kennedy, D., Klein Goldewijk, K., Knauer, J., Korsbakken, J. I., Körtzinger, A., Lan, X., Lefèvre, N., Li, H., Liu, J., Liu, Z., Ma, L., Marland, G., Mayot, N., McGuire, P. C., McKinley, G. A., Meyer, G., Morgan, E. J., Munro, D. R., Nakaoka, S.-I., Niwa, Y., O'Brien, K. M., Olsen, A., Omar, A. M., Ono, T., Paulsen, M., Pierrot, D., Pocock, K., Poulter, B., Powis, C. M., Rehder, G., Resplandy, L., Robertson, E., Rödenbeck, C., Rosan, T. M., Schwinger, J., Séférian, R., Smallman, T. L., Smith, S. M., Sospedra-Alfonso, R., Sun, Q., Sutton, A. J., Sweeney, C., Takao, S., Tans, P. P., Tian, H., Tilbrook, B., Tsujino, H., Tubiello, F., van der Werf, G. R., van Ooijen, E., Wanninkhof, R., Watanabe, M., Wimart-Rousseau, C., Yang, D., Yang, X., Yuan, W., Yue, X., Zaehle, S., Zeng, J., and Zheng, B.: Global Carbon Budget 2023, Earth Syst. Sci. Data, 15, 5301–5369, https://doi.org/10.5194/essd-15-5301-2023, 2023.
Gandharum, L., Hartono, D. M., Karsidi, A., and Ahmad, M.: Monitoring Urban Expansion and Loss of Agriculture on the North Coast of West Java Province, Indonesia, Using Google Earth Engine and Intensity Analysis, Sci. World J., 2022, 3123788, https://doi.org/10.1155/2022/3123788, 2022.
Garofalo, D. F. T., Novaes, R. M. L., Pazianotto, R. A. A., Maciel, V. G., Brandão, M., Shimbo, J. Z., and Folegatti-Matsuura, M. I. S.: Land-use change CO2 emissions associated with agricultural products at municipal level in Brazil, J. Clean. Prod., 364, 132549, https://doi.org/10.1016/j.jclepro.2022.132549, 2022.
Gasser, T., Crepin, L., Quilcaille, Y., Houghton, R. A., Ciais, P., and Obersteiner, M.: Historical CO2 emissions from land use and land cover change and their uncertainty, Biogeosciences, 17, 4075–4101, https://doi.org/10.5194/bg-17-4075-2020, 2020.
Gaveau, D. L. A., Wandono, H., and Setiabudi, F.: Three decades of deforestation in southwest Sumatra: Have protected areas halted forest loss and logging, and promoted re-growth?, Biol. Conserv., 134, 495–504, https://doi.org/10.1016/j.biocon.2006.08.035, 2007.
Gaveau, D. L. A., Sloan, S., Molidena, E., Yaen, H., Sheil, D., Abram, N. K., Ancrenaz, M., Nasi, R., Quinones, M., Wielaard, N., and Meijaard, E.: Four decades of forest persistence, clearance and logging on Borneo, PLoS One, 9, e101654, https://doi.org/10.1371/journal.pone.0101654, 2014.
Gaveau, D. L. A., Sheil, D., Husnayaen, Salim, M. A., Arjasakusuma, S., Ancrenaz, M., Pacheco, P., and Meijaard, E.: Rapid conversions and avoided deforestation: Examining four decades of industrial plantation expansion in Borneo, Sci. Rep., 6, 32017, https://doi.org/10.1038/srep32017, 2016.
Gaveau, D. L. A., Santos, L., Locatelli, B., Salim, M. A., Husnayaen, H., Meijaard, E., Heatubun, C., and Sheil, D.: Forest loss in Indonesian New Guinea (2001–2019): Trends, drivers and outlook, Biol. Conserv., 261, 109225, https://doi.org/10.1016/j.biocon.2021.109225, 2021.
Gaveau, D. L. A., Locatelli, B., Salim, M. A., Husnayaen, Manurung, T., Descals, A., Angelsen, A., Meijaard, E., and Sheil, D.: Slowing deforestation in Indonesia follows declining oil palm expansion and lower oil prices, PLoS One, 17, e0266178, https://doi.org/10.1371/journal.pone.0266178, 2022.
Goldewijk, K. K., Beusen, A., Doelman, J., and Stehfest, E.: Anthropogenic land use estimates for the Holocene – HYDE 3.2, Earth Syst. Sci. Data, 9, 927–953, https://doi.org/10.5194/essd-9-927-2017, 2017.
Hansis, E., Davis, S. J., and Pongratz, J.: Relevance of methodological choices for accounting of land use change carbon fluxes, Global Biogeochem. Cy., 29, 1230–1246, https://doi.org/10.1002/2014GB004997, 2015.
Harper, A. B., Cox, P. M., Friedlingstein, P., Wiltshire, A. J., Jones, C. D., Sitch, S., Mercado, L. M., Groenendijk, M., Robertson, E., Kattge, J., Bönisch, G., Atkin, O. K., Bahn, M., Cornelissen, J., Niinemets, Ü., Onipchenko, V., Peñuelas, J., Poorter, L., Reich, P. B., Soudzilovskaia, N. A., and van Bodegom, P.: Improved representation of plant functional types and physiology in the Joint UK Land Environment Simulator (JULES v4.2) using plant trait information, Geosci. Model Dev., 9, 2415–2440, https://doi.org/10.5194/gmd-9-2415-2016, 2016.
Harper, A. B., Wiltshire, A. J., Cox, P. M., Friedlingstein, P., Jones, C. D., Mercado, L. M., Sitch, S., Williams, K., and Duran-Rojas, C.: Vegetation distribution and terrestrial carbon cycle in a carbon cycle configuration of JULES4.6 with new plant functional types, Geosci. Model Dev., 11, 2857–2873, https://doi.org/10.5194/gmd-11-2857-2018, 2018.
Hong, C., Burney, J. A., Pongratz, J., Nabel, J. E. M. S., Mueller, N. D., Jackson, R. B., and Davis, S. J.: Global and regional drivers of land-use emissions in 1961–2017, Nature, 589, 554–561, https://doi.org/10.1038/s41586-020-03138-y, 2021.
Houghton, R. A. and Castanho, A.: Annual emissions of carbon from land use, land-use change, and forestry from 1850 to 2020, Earth Syst. Sci. Data, 15, 2025–2054, https://doi.org/10.5194/essd-15-2025-2023, 2023.
Houghton, R. A. and Nassikas, A. A.: Global and regional fluxes of carbon from land use and land cover change 1850–2015, Global Biogeochem. Cy., 31, 456–472, https://doi.org/10.1002/2016GB005546, 2017.
Houghton, R. A., Hobbie, J. E., Melillo, J. M., Moore, B., Peterson, B. J., Shaver, G. R., and Woodwell, G. M.: Changes in the Carbon Content of Terrestrial Biota and Soils between 1860 and 1980: A Net Release of CO2 to the Atmosphere, Ecological Monographs, 235–262, ESA (Ecological Society of America), https://doi.org/10.2307/1942531, 1983.
Hurtt, G., Chini, L., Sahajpal, R., Frolking, S., Bodirsky, B. L., Calvin, K., Doelman, J., Fisk, J., Fujimori, S., Goldewijk, K., Hasegawa, T., Havlik, P., Heinimann, A., Humpenöder, F., Jungclaus, J., Kaplan, J., Krisztin, T., Lawrence, D., Lawrence, P., Mertz, O., Pongratz, J., Popp, A., Riahi, K., Shevliakova, E., Stehfest, E., Thornton, P., van Vuuren, D., and Zhang, X.: Harmonization of Global Land Use Change and Management for the Period 850-2015, Earth System Grid Federation [data set], https://doi.org/10.22033/ESGF/input4MIPs.10454, 2019.
Hurtt, G. C., Chini, L., Sahajpal, R., Frolking, S., Bodirsky, B. L., Calvin, K., Doelman, J. C., Fisk, J., Fujimori, S., Goldewijk, K. K., Hasegawa, T., Havlik, P., Heinimann, A., Humpenöder, F., Jungclaus, J., Kaplan, J. O., Kennedy, J., Krisztin, T., Lawrence, D., Lawrence, P., Ma, L., Mertz, O., Pongratz, J., Popp, A., Poulter, B., Riahi, K., Shevliakova, E., Stehfest, E., Thornton, P., Tubiello, F. N., van Vuuren, D. P., and Zhang, X.: Harmonization of global land use change and management for the period 850-2100 (LUH2) for CMIP6, Geosci. Model Dev., 13, 5425–5464, https://doi.org/10.5194/gmd-13-5425-2020, 2020.
Indradjad, A., Dimyati, M., Vetrita, Y., Adiningsih, E. S., and Rokhmatuloh, R.: Enhancing Fire Monitoring Method over Peatlands and Non-Peatlands in Indonesia Using Visible Infrared Imaging Radiometer Suite Data, Fire, 7, 9, https://doi.org/10.3390/fire7010009, 2024.
Jones, C. D., Hughes, J. K., Bellouin, N., Hardiman, S. C., Jones, G. S., Knight, J., Liddicoat, S., O'Connor, F. M., Andres, R. J., Bell, C., Boo, K.-O., Bozzo, A., Butchart, N., Cadule, P., Corbin, K. D., Doutriaux-Boucher, M., Friedlingstein, P., Gornall, J., Gray, L., Halloran, P. R., Hurtt, G., Ingram, W. J., Lamarque, J.-F., Law, R. M., Meinshausen, M., Osprey, S., Palin, E. J., Parsons Chini, L., Raddatz, T., Sanderson, M. G., Sellar, A. A., Schurer, A., Valdes, P., Wood, N., Woodward, S., Yoshioka, M., and Zerroukat, M.: The HadGEM2-ES implementation of CMIP5 centennial simulations, Geosci. Model Dev., 4, 543–570, https://doi.org/10.5194/gmd-4-543-2011, 2011.
Lienert, S. and Joos, F.: A Bayesian ensemble data assimilation to constrain model parameters and land-use carbon emissions, Biogeosciences, 15, 2909–2930, https://doi.org/10.5194/bg-15-2909-2018, 2018.
Maheng, D., Pathirana, A., and Zevenbergen, C.: A preliminary study on the impact of landscape pattern changes due to urbanization: Case study of Jakarta, Indonesia, Land, 10, 1–27, https://doi.org/10.3390/land10020218, 2021.
Mapbiomas Indonesia: Mapbiomas Indonesia Land Cover and Land Use Collection 2, http://platform-map.nusantara.earth/, last access: 11 December 2022.
Margono, B. A., Turubanova, S., Zhuravleva, I., Potapov, P., Tyukavina, A., Baccini, A., Goetz, S., and Hansen, M. C.: Mapping and monitoring deforestation and forest degradation in Sumatra (Indonesia) using Landsat time series data sets from 1990 to 2010, Environ. Res. Lett., 7, 034010, https://doi.org/10.1088/1748-9326/7/3/034010, 2012.
Nechita-Banda, N., Krol, M., Van Der Werf, G. R., Kaiser, J. W., Pandey, S., Huijnen, V., Clerbaux, C., Coheur, P., Deeter, M. N., and Röckmann, T.: Monitoring emissions from the 2015 Indonesian fires using CO satellite data, Philos. T. R. Soc. B, 373, 20170307, https://doi.org/10.1098/rstb.2017.0307, 2018.
Nurdiati, S., Bukhari, F., Julianto, M. T., Sopaheluwakan, A., Aprilia, M., Fajar, I., Septiawan, P., and Najib, M. K.: The impact of El Niño southern oscillation and Indian Ocean Dipole on the burned area in Indonesia, Terrestrial, Atmos. Ocean. Sci., 33, 16, https://doi.org/10.1007/S44195-022-00016-0, 2022.
Purnomo, H., Okarda, B., Puspitaloka, D., Ristiana, N., Sanjaya, M., Komarudin, H., Dermawan, A., Andrianto, A., Kusumadewi, S. D., and Brady, M. A.: Public and private sector zero-deforestation commitments and their impacts: A case study from South Sumatra Province, Indonesia, Land Use Policy, 134, 106818, https://doi.org/10.1016/j.landusepol.2023.106818, 2023.
Qiu, C., Ciais, P., Zhu, D., Guenet, B., Peng, S., Maria, A., Petrescu, R., Lauerwald, R., Makowski, D., Gallego-Sala, A. V, Charman, D. J., and Brewer, S. C.: Large historical carbon emissions from cultivated northern peatlands, Sci. Adv, 7, eabf1332, https://doi.org/10.1126/sciadv.abf1332, 2021.
Ricciardi, V., Ramankutty, N., Mehrabi, Z., Jarvis, L., and Chookolingo, B.: An open-access dataset of crop production by farm size from agricultural censuses and surveys, Data in Brief, 19, 1970–1988, https://doi.org/10.1016/j.dib.2018.06.057, 2018.
Rosan, T. M., Klein Goldewijk, K., Ganzenmüller, R., O'Sullivan, M., Pongratz, J., Mercado, L. M., Aragao, L. E. O. C., Heinrich, V., Von Randow, C., Wiltshire, A., Tubiello, F. N., Bastos, A., Friedlingstein, P., and Sitch, S.: A multi-data assessment of land use and land cover emissions from Brazil during 2000–2019, Environ. Res. Lett., 16, 074004, https://doi.org/10.1088/1748-9326/ac08c3, 2021.
Santoro, A., Piras, F., and Yu, Q.: Spatial analysis of deforestation in Indonesia in the period 1950–2017 and the role of protected areas, Biodivers. Conserv., 1–27, https://doi.org/10.1007/s10531-023-02679-8, 2023.
Sellar, A. A., Jones, C. G., Mulcahy, J. P., Tang, Y., Yool, A., Wiltshire, A., O'Connor, F. M., Stringer, M., Hill, R., Palmieri, J., Woodward, S., de Mora, L., Kuhlbrodt, T., Rumbold, S. T., Kelley, D. I., Ellis, R., Johnson, C. E., Walton, J., Abraham, N. L., Andrews, M. B., Andrews, T., Archibald, A. T., Berthou, S., Burke, E., Blockley, E., Carslaw, K., Dalvi, M., Edwards, J., Folberth, G. A., Gedney, N., Griffiths, P. T., Harper, A. B., Hendry, M. A., Hewitt, A. J., Johnson, B., Jones, A., Jones, C. D., Keeble, J., Liddicoat, S., Morgenstern, O., Parker, R. J., Predoi, V., Robertson, E., Siahaan, A., Smith, R. S., Swaminathan, R., Woodhouse, M. T., Zeng, G., and Zerroukat, M.: UKESM1: Description and Evaluation of the U.K. Earth System Model, J. Adv. Model Earth Syst., 11, 4513–4558, https://doi.org/10.1029/2019MS001739, 2019.
Silva, C. A., Guerrisi, G., Del Frate, F., and Sano, E. E.: Near-real time deforestation detection in the Brazilian Amazon with Sentinel-1 and neural networks, Eur. J. Remote Sens., 55, 129–149, https://doi.org/10.1080/22797254.2021.2025154, 2022.
Sitch, S., Friedlingstein, P., Gruber, N., Jones, S. D., Murray-Tortarolo, G., Ahlström, A., Doney, S. C., Graven, H., Heinze, C., Huntingford, C., Levis, S., Levy, P. E., Lomas, M., Poulter, B., Viovy, N., Zaehle, S., Zeng, N., Arneth, A., Bonan, G., Bopp, L., Canadell, J. G., Chevallier, F., Ciais, P., Ellis, R., Gloor, M., Peylin, P., Piao, S. L., Le Quéré, C., Smith, B., Zhu, Z., and Myneni, R.: Recent trends and drivers of regional sources and sinks of carbon dioxide, Biogeosciences, 12, 653–679, https://doi.org/10.5194/bg-12-653-2015, 2015.
Sitch, S., O'Sullivan, M., Robertson, E., Friedlingstein, P., Albergel, C., Anthoni, P., Arneth, A., Arora, V. K., Bastos, A., Bastrikov, V., Bellouin, N., Canadell, J. G., Chini, L., Ciais, P., Falk, S., Harris, I., Hurtt, G., Ito, A., Jain, A. K., Jones, M. W., Joos, F., Kato, E., Kennedy, D., Klein Goldewijk, K., Kluzek, E., Knauer, J., Lawrence, P. J., Lombardozzi, D., Melton, J. R., Nabel, J. E. M. S., Pan, N., Peylin, P., Pongratz, J., Poulter, B., Rosan, T. M., Sun, Q., Tian, H., Walker, A. P., Weber, U., Yuan, W., Yue, X., and Zaehle, S.: Trends and Drivers of Terrestrial Sources and Sinks of Carbon Dioxide: An Overview of the TRENDY Project, Global Biogeochem. Cy., 38, e2024GB008102, https://doi.org/10.1029/2024GB008102, 2024.
Stockwell, C. E., Jayarathne, T., Cochrane, M. A., Ryan, K. C., Putra, E. I., Saharjo, B. H., Nurhayati, A. D., Albar, I., Blake, D. R., Simpson, I. J., Stone, E. A., and Yokelson, R. J.: Field measurements of trace gases and aerosols emitted by peat fires in Central Kalimantan, Indonesia, during the 2015 El Niño, Atmos. Chem. Phys., 16, 11711–11732, https://doi.org/10.5194/acp-16-11711-2016, 2016.
Tsujino, R., Yumoto, T., Kitamura, S., Djamaluddin, I., and Darnaedi, D.: History of forest loss and degradation in Indonesia, Land Use Policy, 57, 335–347, https://doi.org/10.1016/j.landusepol.2016.05.034, 2016.
Tubiello, F. N., Conchedda, G., Wanner, N., Federici, S., Rossi, S., and Grassi, G.: Carbon emissions and removals from forests: New estimates, 1990–2020, Earth Syst. Sci. Data, 13, 1681–1691, https://doi.org/10.5194/essd-13-1681-2021, 2021.
Tubiello, F. N., Conchedda, G., Casse, L., Hao, P., De Santis, G., and Chen, Z.: A new cropland area database by country circa 2020, Earth Syst. Sci. Data, 15, 4997–5015, https://doi.org/10.5194/essd-15-4997-2023, 2023.
van Wees, D., van der Werf, G. R., Randerson, J. T., Andela, N., Chen, Y., and Morton, D. C.: The role of fire in global forest loss dynamics, Glob. Change Biol., 27, 2377–2391, https://doi.org/10.1111/gcb.15591, 2021.
van der Werf, G. R., Randerson, J. T., Giglio, L., van Leeuwen, T. T., Chen, Y., Rogers, B. M., Mu, M., van Marle, M. J. E., Morton, D. C., Collatz, G. J., Yokelson, R. J., and Kasibhatla, P. S.: Global fire emissions estimates during 1997–2016, Earth Syst. Sci. Data, 9, 697–720, https://doi.org/10.5194/essd-9-697-2017, 2017.
Wiltshire, A. J., Duran Rojas, M. C., Edwards, J. M., Gedney, N., Harper, A. B., Hartley, A. J., Hendry, M. A., Robertson, E., and Smout-Day, K.: JULES-GL7: the Global Land configuration of the Joint UK Land Environment Simulator version 7.0 and 7.2, Geosci. Model Dev., 13, 483–505, https://doi.org/10.5194/gmd-13-483-2020, 2020.
Wiltshire, A. J., Burke, E. J., Chadburn, S. E., Jones, C. D., Cox, P. M., Davies-Barnard, T., Friedlingstein, P., Harper, A. B., Liddicoat, S., Sitch, S., and Zaehle, S.: JULES-CN: a coupled terrestrial carbon–nitrogen scheme (JULES vn5.1), Geosci. Model Dev., 14, 2161–2186, https://doi.org/10.5194/gmd-14-2161-2021, 2021.