the Creative Commons Attribution 4.0 License.
the Creative Commons Attribution 4.0 License.
 | 10 Dec 2025
The evolution of methane production rates from young to mature thermokarst lakes
Yarden Gerera
André Pellerin
Efrat Eliani Russak
Katey Walter Anthony
Nicholas Hasson
Yoav Oved Rosenberg
Orit Sivan
Thermokarst lakes, formed by permafrost thaw in the Arctic, are hotspots for methane (CH4) and carbon dioxide (CO2) emissions and are expected to double permafrost carbon emissions by the end of the century. While the implications of ongoing permafrost thaw on CH4 dynamics in these lakes have been modeled, here we provide empirical data on CH4 production dynamics as lakes evolve from young recently formed lakes to older lakes that have been present for hundreds of years. Sediment cores (up to 4 m long) were collected from the centers and thermokarst margins of a new thermokarst lake (Big Trail Lake (BTL), < 70 years old) and from an older thermokarst lake (Goldstream Lake (GSL), ∼ 900 years old) from the same interior Alaskan watershed. The highest CH4 production rates were observed in the uppermost sediments near the sediment–water interface at the thermokarst margins of both lakes, with a steep decrease with sediment depth into the talik. BTL exhibited elevated CH4 production rates, correlated with higher carbon lability for thermal-induced reactions measured by Rock-Eval analyses, suggesting its potential use as a proxy for organic carbon breakdown by methanogenesis. In contrast, GSL displayed lower CH4 production rates, likely due to a longer period of organic carbon degradation and reduced carbon lability. The integrated sediment-column CH4 production rates were similar (around 7 to 10 mol m−2 yr−1), primarily due to the thinner talik at BTL. Our data support the predictions that the formation and expansion of thermokarst lakes over the next centuries will increase CH4 production in newly thawed Yedoma permafrost sediments, while CH4 production will decrease as taliks mature and labile organic carbon is used up.
- Article
(3679 KB) - Full-text XML
-
Supplement
(1633 KB) - BibTeX
- EndNote


Permafrost covers one-quarter of the Northern Hemisphere (Obu, 2021; Zhang et al., 2008). Significant warming of the Arctic and subarctic regions, with temperature increases of 2 to 5 °C relative to pre-industrial levels (Post et al., 2019), exacerbates the thawing of this permafrost. In turn, Arctic soils, which are currently a store of carbon, become a source of carbon to the atmosphere by emitting greenhouse gases (Schuur et al., 2015). It is estimated that until the end of this century thaw, rapidly thawed permafrost will become an important source of greenhouse gases (Turetsky et al., 2020). Among these gases, methane (CH4) is expected to be a dominant driver of the circumpolar permafrost carbon radiative, responsible for up to 70 % of this effect (Walter Anthony et al., 2018).
Methane release is expected to increase in rapidly thawing permafrost beneath thermokarst lakes, which are CH4 “hotspots” on the landscape, and they are expected to double permafrost carbon emissions and increase associated radiative forcing effects by 130 % by the end of the century (Elder et al., 2021; Hugelius et al., 2014; Olefeldt et al., 2016). Thermokarst lakes are formed when ground ice melts and water accumulates in subsidence areas (Hopkins, 1949). As thaw continues beneath the lake, previously frozen organic carbon in the thawed permafrost soils, called taberites (Farquharson et al., 2016; Strauss et al., 2013), becomes available for microbial degradation, which produces CO2 and CH4 (Freitas et al., 2025; Heslop et al., 2015; Walter Anthony et al., 2020). In particular, the organic-rich permafrost Yedoma soils of Alaska and Siberia are noteworthy reservoirs of old 14C-depleted labile soil carbon that is quickly degraded into greenhouse gases upon thawing (Dutta et al., 2006; Estop-Aragonés et al., 2020; Knoblauch et al., 2018; Zimov et al., 1997).
Models have simulated the changes in methane production as thermokarst lakes evolve (Kessler et al., 2012). These models show that while older lakes may have lower surface production rates, their taliks can still contribute significantly to total methane flux. Over centuries, the talik deepens through the Yedoma and into the bedrock, while intra-talik organic carbon in the in situ thawed Yedoma sediments (taberites) gradually becomes refractory. At later stages, thawed permafrost organic carbon is no longer available for CH4 production, and the lake is no longer a significant source of permafrost-derived CH4 to the atmosphere, unless permafrost soil carbon is re-transported from lake margins or the watershed to surface lake sediments (Walter Anthony et al., 2014).
However, while the implications of ongoing permafrost thaw on CH4 dynamics in these lakes have been modeled, few empirical data exist on changes in CH4 production in relation to the stages of thermokarst lake evolution. The limited studies on CH4 production rates in the talik of thermokarst lakes in the Arctic exhibit substantial variability, with fluctuations of 3 to 4 orders of magnitude observed across different environments and studies. For example, the top sediment layer of a non-Yedoma lake on the North Slope of Alaska shows CH4 production levels of 1000 nmol cm−3 d−1 (de Jong et al., 2018). CH4 production rates range from 2 to 35 nmol cm−3 d−1 in the Doughnut and Vault lakes in discontinuous Yedoma permafrost in Alaska (Martinez-Cruz et al., 2018), while values as high as 350 nmol cm−3 d−1 have been reported in Vault Lake, with the lowest in Goldstream Lake (Sepulveda-Jauregui et al., 2015). Our recent study in this region on short sediment cores (up to 1 m depth) constrained CH4 production rates in the upper sediments, similar to Martinez-Cruz et al. (2018), based on radiocarbon and CH4 accumulation incubations (Pellerin et al., 2022). Freitas et al. (2025) showed – by using radiocarbon dating, sediment incubations and sediment facies classifications – that CH4 production can also occur deep (∼ 20 m) beneath Yedoma thermokarst lakes in sand and gravel layers. Altogether, the data raised several questions about the evolution of CH4 production rates throughout the talik, the role of CH4 oxidation and the lability of organic carbon in thermokarst lake systems, warranting further investigation.
In this study, Yedoma thermokarst lake sediment cores were retrieved up to 4 m in depth to measure, calculate and compare CH4 production rates along the talik between two distinct lake systems. Then, the CH4 production rates, indicating the susceptibility of the organic carbon to microbial degradation, were compared to the total organic carbon (TOC) and its lability based on thermally induced breakdown. The thermal lability was deduced from a Rock-Eval analysis, which involves gradual heating under pyrolysis conditions, followed by combustion of the residual sample (Behar et al., 2001). With the gradual heating, the generation of hydrocarbon, CO and CO2 are monitored. Following pyrolysis, the residual organic matter is lean in hydrogen and structural changes, making it more aromatic and refractory. The long cores enabled a direct comparison of CH4 production rates, porewater geochemistry and organic carbon lability along geographically proximate yet geomorphologically distinct lakes – a young lake (< 70 years) and an old lake (∼ 900 years) (Fig. 1). These lakes also improved our understanding of how CH4 production rates and carbon lability are expected to change over time, providing the first empirical data for comparison to model predictions.
2.1 Region of study
The Goldstream Valley watershed is located about 10 km northeast of Fairbanks, Alaska (Fig. 1). This area has a subarctic continental climate with an average annual temperature of −3.3 °C and annual precipitation of 280 mm (Douglas et al., 2020). The vegetation is primarily composed of boreal lowland species. The emergent lake and nearby thermokarst environments have been described by Elder et al. (2021). Recent studies (Hasson et al., 2022) show that the mean annual ground temperature of permafrost is −0.26 °C at a depth of 7.2 m. The Goldstream Valley features discontinuous ice-rich Yedoma-type permafrost, originating from Late Pleistocene loess deposits that were remobilized during the Holocene. These deposits form thick layers over relic Goldstream formations, altering the soil chemistry and ice volume distribution (Péwé, 1975). Between 1949 and 2009, the number of thermokarst lakes in the valley has doubled and their total area increased by about 40 % (Walter Anthony et al., 2020). These lakes are interconnected by a shifting watershed that feeds into the Tanana River, which is part of the Yukon River basin.
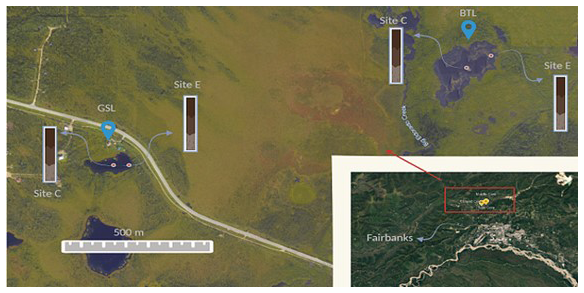
Figure 1Study sites: the young (∼ 70 years old) Big Trail Lake (BTL) and the old (850–900 years old in its center) Goldstream Lake (GSL) in the Goldstream Valley (© Google Earth), including the locations of the collected cores in both lakes (edge (E), center (C)).
In this study, two markedly different thermokarst lakes were studied. Big Trail Lake (BTL) (64.9189° N, 147.8212° W, 609 m2 in 2009) is an actively expanding lake formed from a wetland and possibly a migrating fluvial channel sometime between 1949 and 1967 (Walter Anthony et al., 2020). Extensive geophysical surveys at BTL showed massive ice (e.g., foliated ice wedges) starting roughly at 10 to 15 m below the irregular talik shape (Walter Anthony et al., 2020). Permafrost and valley hydrology were investigated on the valley scale (Emond et al., 2018). BTL is surrounded by valley-bottom creeks and streams; some supply water to the lake by draining the surrounding upland fens and the historical channel. These tributaries sometimes run dry and isolate the lake hydrologically at the surface. The outlet of the lake feeds into Eldorado Creek.
Goldstream Lake (GSL) (64.9156° N, 147.8495° E, 1278 m2), located about 1.5 km from BTL, is actively eroding into relic Yedoma permafrost with likely much less reworked Yedoma, due to its location at the base toe slope of Goldstream Valley and slightly elevated above the Goldstream Creek watershed at 196 m. Geophysical surveys estimated a talik thickness range of 30 to 40 m (Emond et al., 2018; Péwé, 1975). A previous study cored 20 m of Goldstream Lake sediments and found ice-free sand and gravels beneath 16 m of thawed silt (Walter Anthony et al., 2020). Radiocarbon dates suggest that the oldest part of the basin is around 850 to 900 years old; however, rapid expansion of the eastern margin into Yedoma permafrost has occurred since 1949.
2.2 Sampling and profiles
We collected sediment cores using a vibro-corer deployed directly from the lake ice in March 2022. In each lake, one core was collected from the center of the lake and from the edge within the water-saturated zone with an aluminum liner. It was winched out of the sediment, tilted on its side and cut into ∼ 1 m sections (marked in Table S1 in the Supplement). These were quickly capped and transported by a snow machine and vehicle to the University of Alaska Fairbanks for further analysis. In the lab, each section was cut lengthwise, and one half was sampled horizontally at intervals of 15 to 25 cm. First, a subsample of sediment was taken immediately after slicing the core liner for CH4 concentrations, and the stable carbon isotope composition (δ13C and δ13C), about 3 mL of sediment, was taken in a cut-off 3 mL syringe and inserted directly into 20 mL vials fully saturated with an anoxic 5 M sodium chloride solution. Another cut-out 3 mL syringe was inserted into the sediment at each depth to extract sediment for incubation. For density measurements, samples were taken into 10 mL vials, weighed and then re-weighed after drying an aliquot of sediment at 60 °C for 4 d. Total organic carbon (TOC) concentration, the carbon stable isotope composition (δ13CTOC) and Rock-Eval analyses were performed on a sediment subsample was freeze-dried. Porewater was extracted by Rhizons (Dickens et al., 2007). The Rhizons were inserted into the sediment, and a vacuum was created with a 10 mL syringe, which accumulated the extracted porewater after filtration through 0.22 µm. The filtrated porewater was then stored at 4 °C in 2 mL amber glass vials without headspace for the measurement of dissolved inorganic carbon (DIC) concentrations and its stable carbon isotope composition (δ13CDIC) within a week from sampling.
2.3 Production rate experiments
A 3 mL cut-out syringe was inserted into the sediment in each core at 20 to 30 cm intervals to retrieve about 2 mL of sediment. The sediment was added to a 20 mL serum bottle, which was sealed with a butyl rubber stopper and crimped with an aluminum cap. The bottles were immediately vigorously shaken and purged with 99.999 % N2 gas for 15 min to remove oxygen and other gases. Three serum bottles were taken at each depth. After weighing, the samples were stored in the dark at 4 °C. The increase in CH4 concentrations in the headspace was recorded after 80, 130 and 160 d by GC-FID (see below), allowing the back-calculation of CH4 production rates.
Methane production rates were measured at each time point (80, 130 and 160 d) using a small (100 µL) aliquot of gas from the headspace of the serum bottles. The headspace CH4 concentration was converted to total CH4 in the bottle based on the concentration, the volume of sediment and the volume of headspace in each serum bottle. The CH4 production rate was then taken as the increase in CH4 concentration over time. Since each depth had three serum bottles, the average CH4 production rate was reported for each depth and the uncertainty of the CH4 production rate was reported as the standard deviation of the mean. After 160 d, δ13C was also measured. Since any CH4 dissolved in the porewater at the time of sampling had been removed during the N2 purge, the δ13C values represented the newly accumulated CH4 during the incubation.
Total profile CH4 production rates, reported in mol m−2 yr−1, were calculated using the CH4 production rates obtained from the incubation experiments and depth integration throughout the thawed talik. The inferred talik thickness was based on geophysical surveys and measurements of the taberite depth (Freitas et al., 2025; Walter Anthony et al., 2020).
2.4 Analytical methods
The headspace of the serum bottles of the CH4 rate incubations was measured for CH4 concentrations at each time point using the procedure described by Pellerin et al. (2022). In general, 250 µL aliquot of gas from the headspace was inserted into a gas chromatograph (GC, Thermo) equipped with a flame ionization detector (FID) and a packed ShinCarbon ST column (Restek) at 120 °C. The GC-FID was calibrated with a standard curve prepared with a CH4 concentration of 1 %. CH4 concentrations in the profiles were measured by injecting 3 mL of 99.999 % N2, while simultaneously removing 3 mL of the saturated 5 M sodium chloride solution. After equilibrating for 2 weeks upside down, bottles were vigorously shaken and analyzed for CH4, as described above. This method had a precision of ±2 µM. The δ13C and δ13C values were measured together by PreCon and GasBench II, interfaced with a Delta-V gas source isotope ratio mass spectrometer (GS-IRMS, Thermo). Internal standards of Tiso-2 (isometric instruments, 2.5 % CH4) δ13C −38.3 ‰ and in-house (99.8 % CH4) δ13C −48.6 ‰ were used, with an analytical error of 0.2 ‰. For δ13C determination, a 99.8 % CO2 lecture bottle (Scott Mini-Mix) with δ13C of −25.5 ‰ was used, and the results were reported with an analytical error of 0.3 ‰. All δ13C results were reported compared to Vienna Pee Dee Belemnite (VPDB).
The TOC in the freeze-dried sediment was measured after the removal of carbonates by the addition of 1 % H3PO4 and drying at 40 °C in silver cups until the sample stopped reacting with the acid. Triplicate samples and internal standards were then packed in tin cups and measured on an elemental analyzer and HS2022 IRMS (Sercon). TOC concentrations were measured using concentration calibration and peak heights, and δ13CTOC was reported vs. VPDB with the reference materials IAEA-600 (δ13C −27.7 ‰ VPDB), USGS62 (δ13C −14.8 ‰ VPDB) and USGS63 (δ13C −1.2 ‰ VPDB). The precision was ±0.3 ‰.
Organic carbon lability for thermally induced chemical reactions was characterized by a Rock-Eval analysis (Rock-Eval 6, Vinci Technologies). The technique determines the proportion of pyrolyzable C (PC) and residual carbon (RC). PC is composed of the sum of three pyrolysates: S1, composed mostly of small volatile molecules; S2, larger hydrocarbon molecules thermally cracking like algal cell walls; and S3, derived from oxygen-containing molecules. The residual carbon (RC) is released from the sample during the combustion cycle (Carrie et al., 2012). The indices used as proxies to the organic lability are (1) hydrogen index, which is calculated as HI = S2/TOC × 100 (Behar et al., 2001). Higher HI values indicate greater hydrogen-rich organic compounds, implying lability. (2) The ratio between PC and RC – a higher ratio indicates that the OM is richer in hydrogen and is more aliphatic; hence, it might be more available to microbial respiration. About 20 mg of the prepared samples were placed in the RE6, which was then ramped at a predetermined rate (25 °C min−1) from 200 to 650 °C in the pyrolysis oven. The oven was cooled down, and the sample was transferred to the combustion oven, where it was ramped from 200 °C up to 850 °C at a rate of 25 °C min−1.
The DIC and δ13CDIC were analyzed after acidification of the porewater sample to convert DIC to CO2. The δ13CDIC was measured with GS-IRMS (Thermo) interfaced to GasBench II. Values were reported relative to VPDB with a precision of ±0.1‰. DIC concentrations were measured by integrating the signal of the sample on the IRMS. The signal was calibrated using peak heights NaHCO3 solutions, prepared at concentrations of 3 to 10 mM. The precision was ±0.2 mM.
The comparison of δ13C between the CH4 in the profiles and the CH4 produced in the rate incubations was used to quantify the contributions of CH4 in the shallow sediments relative to the transport of CH4 migrating or diffusing from deeper in the talik. This is assuming that the CH4 measured in the profiles represents CH4 that is produced in situ, plus CH4 that is produced in greater depths and migrates upward, while that in the incubations (after purging) represents only the in situ CH4 production. The bubble composition was assumed to be the most negative δ13CCH4 value measured in the profiles because it migrates from deeper in the sediment, as was shown previously (Pellerin et al., 2022).
Equation (1):
3.1 Methane production characteristics from porewater profiles
Microbial respiration was intensive in general, as indicated by the high DIC concentrations in all sites. In the center of BTL, DIC concentrations increase linearly from the surface towards 150 cm depth, with a peak of 37 mM at 200 cm, followed by a subsequent decrease back to 25 mM (Fig. 2a). On the other hand, at the edge of BTL, DIC concentrations ranged from 10 to 15 mM (Fig. 2b). Along the talik in the center of the lake, the δ13CDIC values increased from 3 ‰ to 16 ‰ (Fig. 2a). On the edge of the lake, the δ13CDIC values increased in the upper 50 cm from 5 ‰ to 17 ‰ and then remained similar (Fig. 2b).
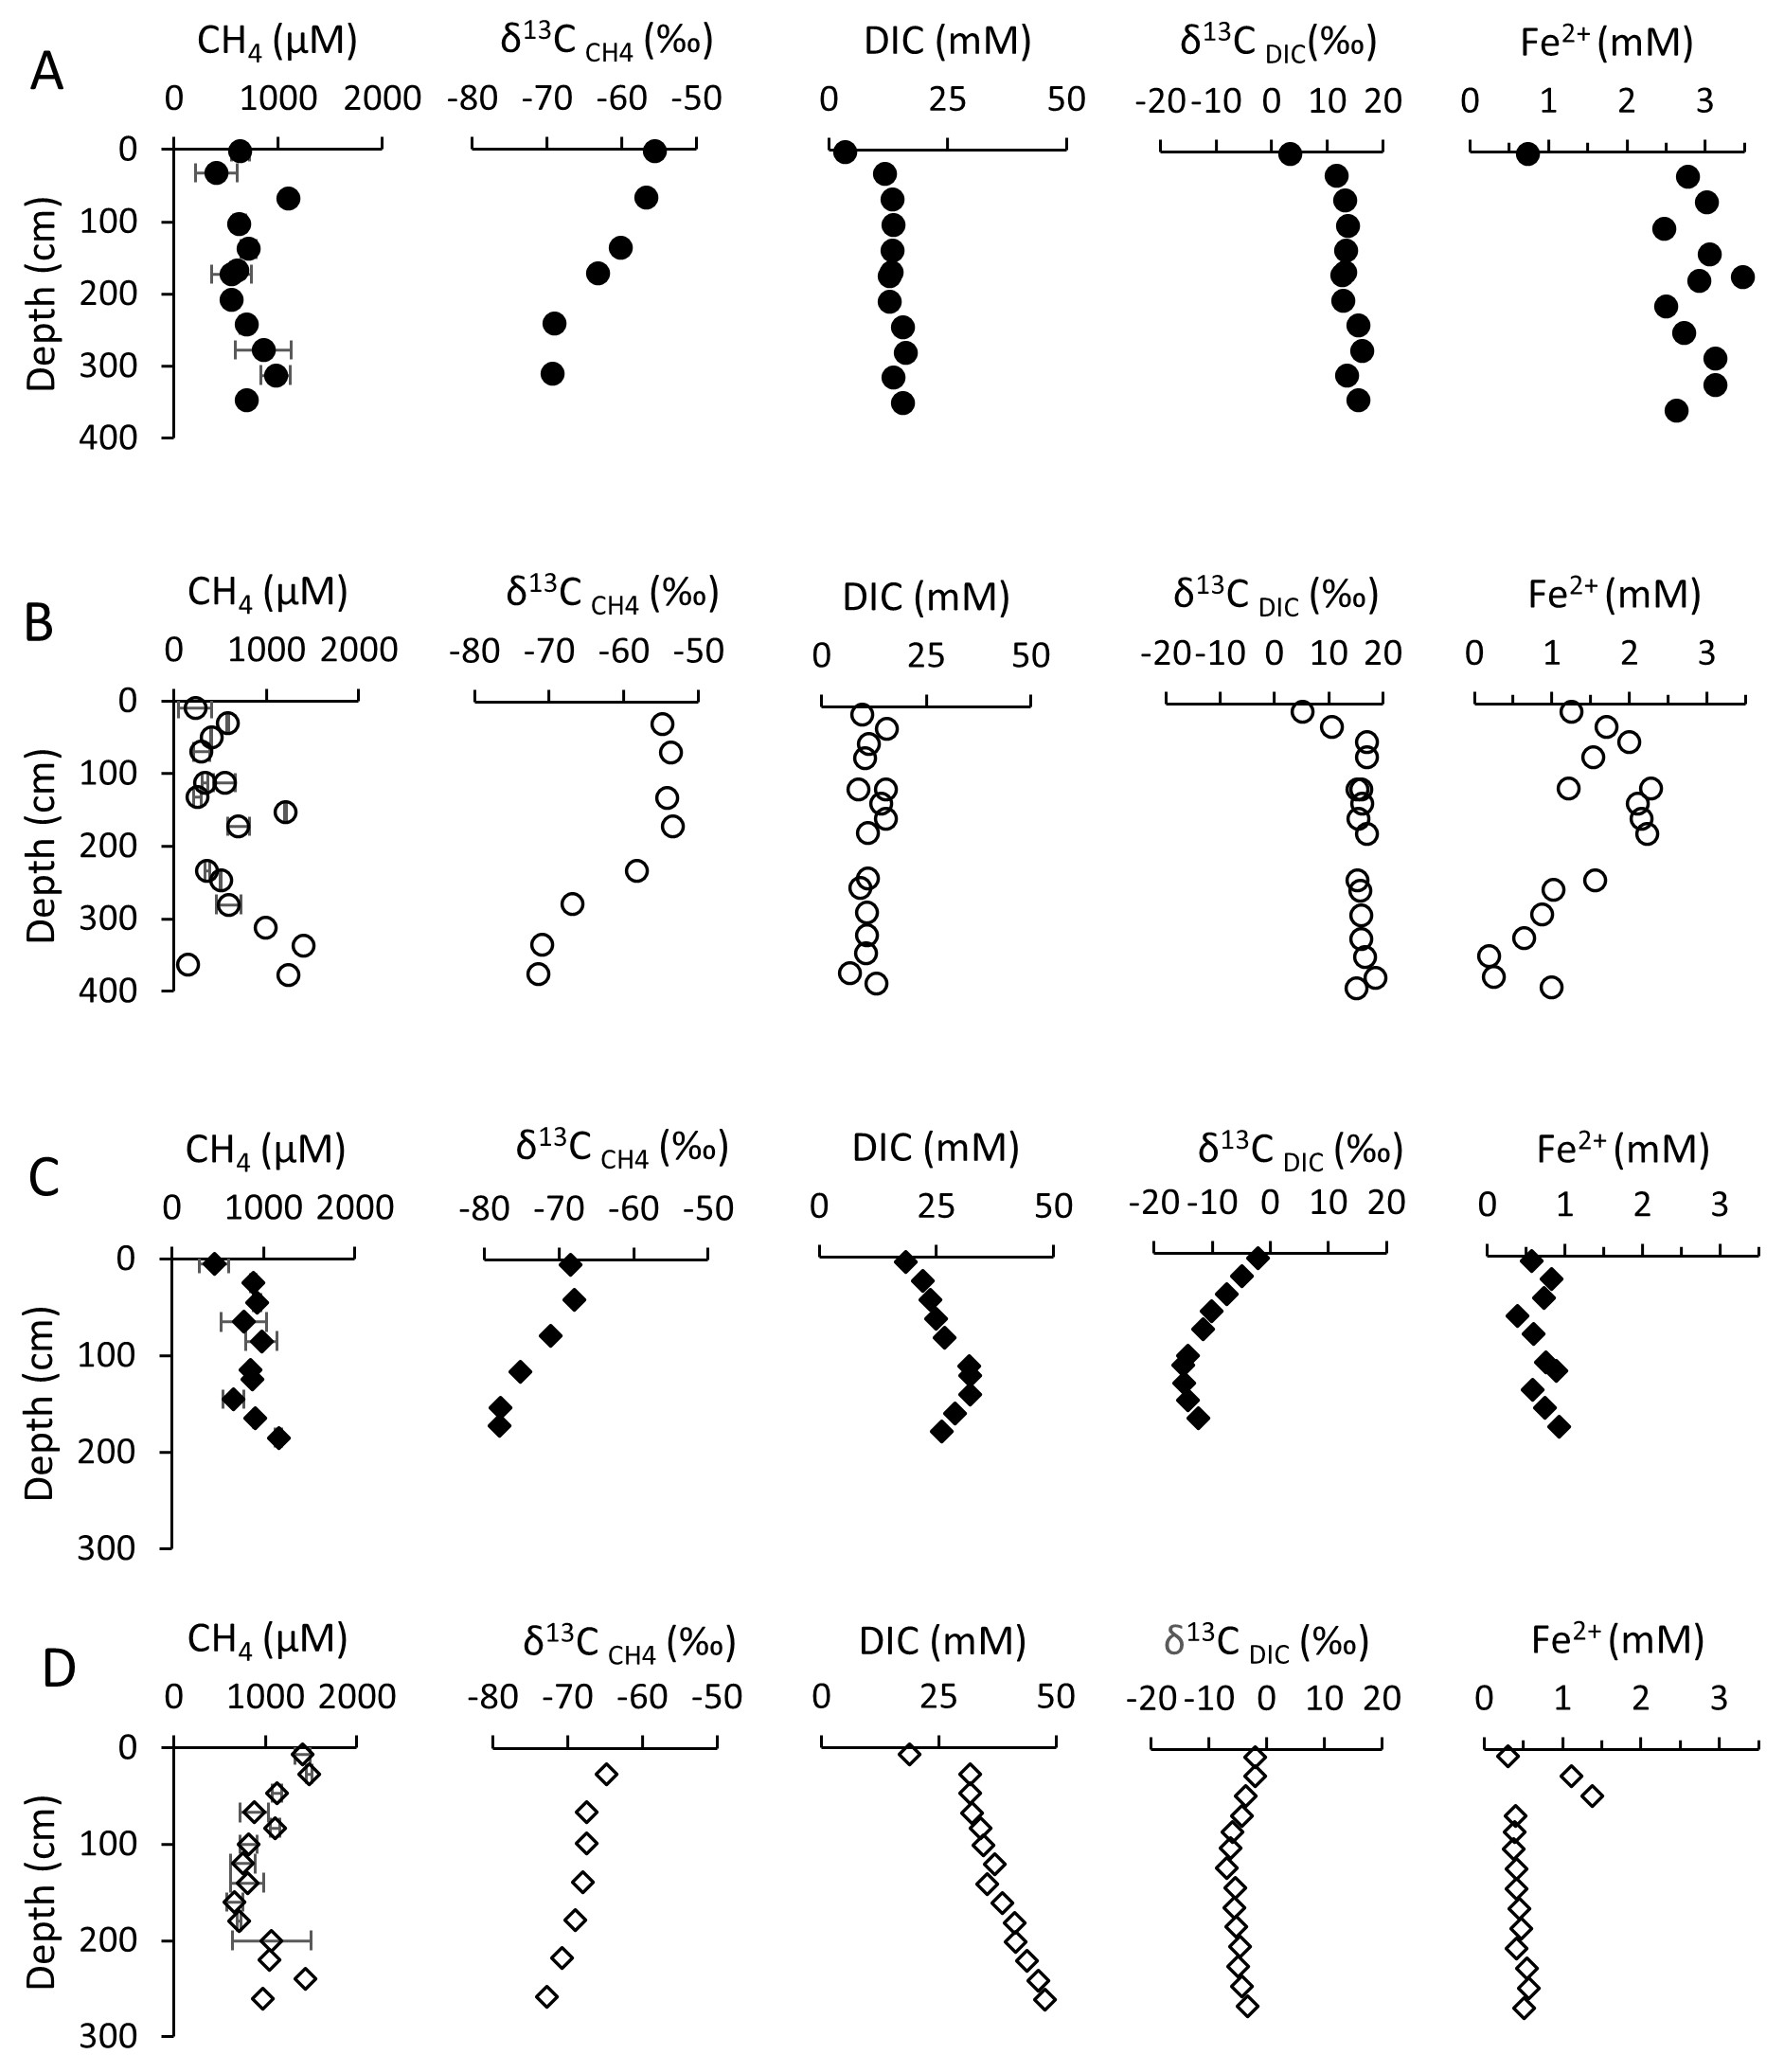
Figure 2Pore water profiles of GSL (circles) and BTL (diamonds) cores. Panels (A) and (B) correspond to the BTL center (full) and the edge (empty), respectively, while panels (C) and (D) correspond to the GSL center and the edge, respectively. Uncertainty on the measurement is smaller than the symbol, unless indicated.
The BTL center exhibited CH4 concentration peaks of 70 and 300 cm (about 1 mM), while CH4 concentrations in the remaining core sections ranged from 0.3 to 0.5 mM. The δ13C values ranged from −55.6 ‰ to −69 ‰ in the deeper section (Fig. 2a). CH4 concentrations at the BTL edge (Fig. 2b) exhibited values of 0.2 to 0.5 mM at depths of 0 to 150 and 200 to 300 cm, with peak values of up to 1.4 mM observed at depths of 150 and 350 cm. The shallow part exhibited δ13C values of −55 ‰, which became more negative, with −71.5 ‰ in the deeper section.
At the GSL center, DIC concentrations remained at around 20 mM, with a maximum of 32 mM observed at a depth of 100 to 150 cm (Fig. 2c). The δ13CDIC values decreased in the upper 100 cm, from −2 ‰ to −15 ‰, followed by a slight increase to −12 ‰ (Fig. 2c). At the edge of GSL, DIC concentrations exhibited a linear increase with depth, from 20 to 46 mM (Fig. 2d). The δ13CDIC values (Fig. 2d) exhibited different trends to BTL, with negative values, decreasing from approximately −2 ‰ to −6 ‰ within the first 100 cm. Below this depth, there was a slight increase in δ13CDIC values to −3 ‰.
Methane concentrations in GSL remained relatively steady at the center (1 mM), with a slight decrease at 150 cm to 0.7 mM (Fig. 2c). The CH4 concentrations edge exhibited a varied range of 0.5 to 1.5 mM (Fig. 2d). The highest CH4 concentration was observed in the deepest and shallowest parts of the core (close to 1.5 mM). The lowest concentration was found at a depth of 150 cm. The δ13C values at the center of GSL ranged from −68.4 ‰ in the shallow part to −78 ‰ in the deeper part (Fig. 2c). At the edge, they ranged from −65 ‰ in the shallow part to −73 ‰ in the deepest section (Fig. 2d).
The surficial sediments of the lakes' edges were organic rich (TOC ∼ 10 %), with relatively low δ13CTOC (Table S1 in the Supplement) and low CH4 and DIC concentrations. The TOC content decreased significantly with depth on the edge, while the center of the lakes had low TOC content. In BTL in both the edge and center, the δ13CDIC increased significantly with depth, with values typical of methanogenesis. In GSL, on the other hand, there was a significant decrease in δ13CDIC with depth but relatively constant DIC and CH4 concentrations and isotopes in the rate incubations, which suggest a small role of CH4-related processes with some signature of methane oxidation in the upper sediments.
3.2 Methane production rates in sediment incubations
Methane production rates were measured by sediment incubation batch experiments. The sediment from BTL and GSL had the highest CH4 production rates near the sediment–water interface. In BTL, the rates within the upper meter ranged from 2 to 20 nmol cm−3 d−1 in the core taken from the center of the lake (Fig. 3a) and 7 to 35 nmol cm−3 d−1 in the core taken from the edge of the lake (Fig. 3b). In the deeper sediments, the rates decreased to about 1 nmol cm−3 d−1 in both sites.
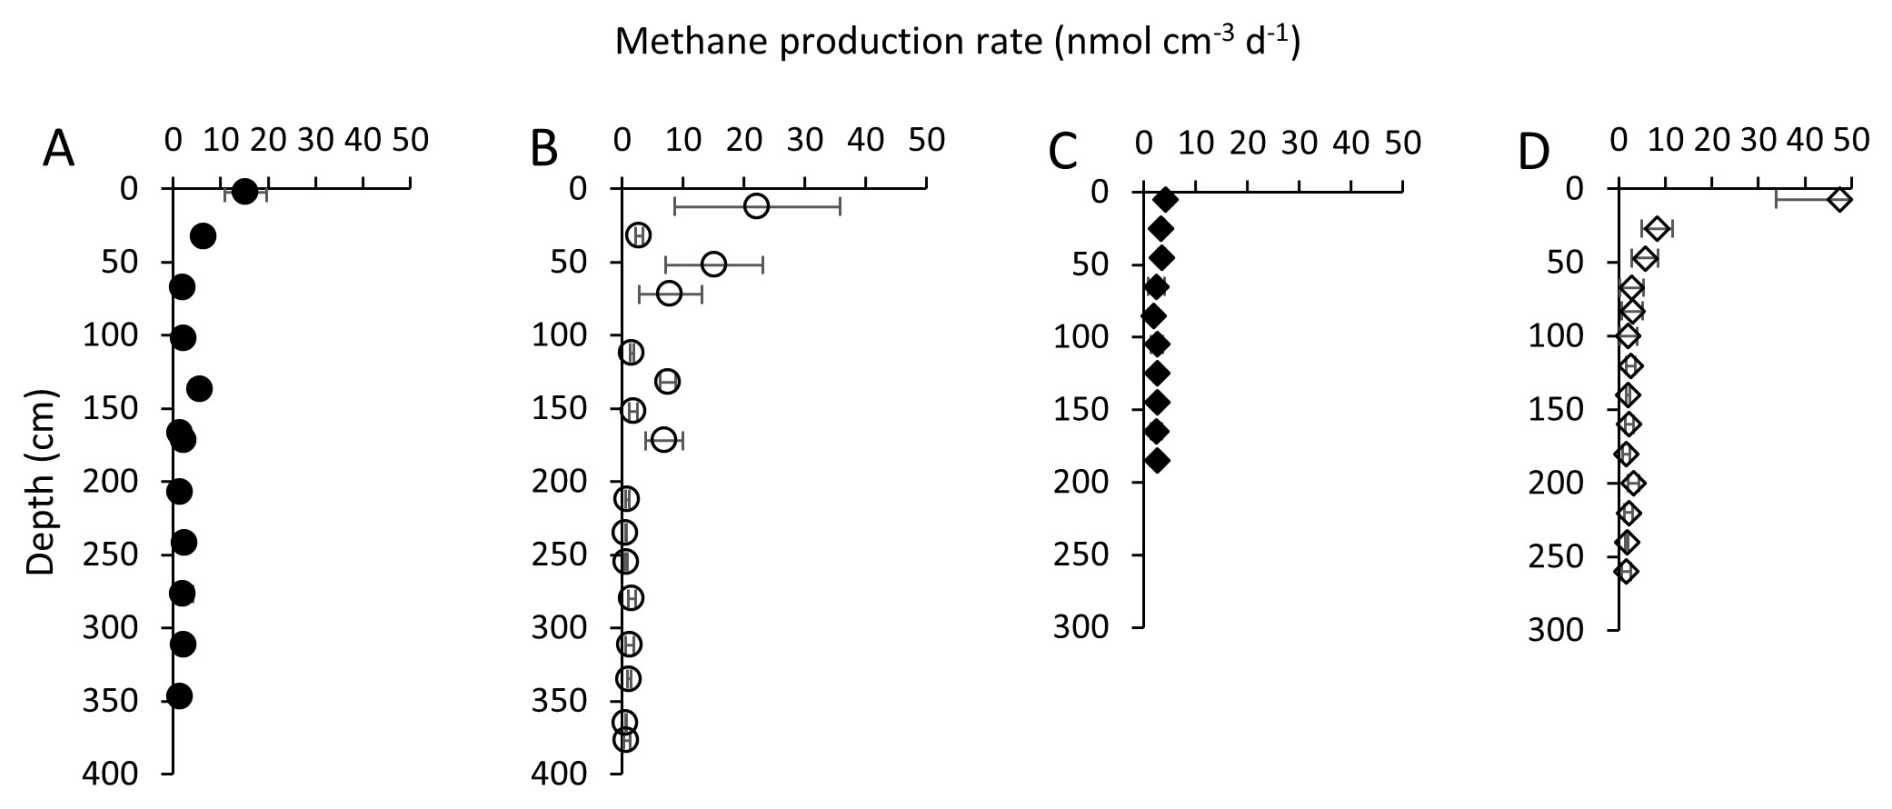
Figure 3CH4 production rates (nmol CH4 cm−3 d−1) from incubation experiments of BTL sediments: center (A) and edge (B) cores. A steep decrease in rates with depth is observed in both the edge and center sites. Depth to permafrost beneath BTL is thought to be 10 to 15 m (Walter Anthony et al., 2020). CH4 production rates (nmol CH4 cm−3 d−1) in GSL from incubation experiments of the center (C) and edge (D) cores. A noticeable decrease in rates with depth is observed at both the center and edge of the lake. The talik depth in GSL is estimated in the center to be between 15 and 40 m (see below).
At the center of GSL (Fig. 3c), the CH4 production rates were 4 to 6 nmol cm−3 d−1 in the upper 1 m of sediment. Deeper, the rates decreased, ranging from 2 to 4 nmol cm−3 d−1. At the edge, higher rates were measured in the upper 50 cm (yet lower than in BTL), followed by a sharp decrease below 50 cm depth (Fig. 3d).
3.3 Total thawed talik CH4 production
The total profile-integrated CH4 production rate throughout the thawed talik indicates the potential flux of CH4 out of the sediment into the lake water column. This accumulated rate depends on CH4 production rates at individual depths, facies thicknesses (surface sediments, taberites, etc.) and talik thickness. Since we did not have samples below 4 m depth, we extrapolated our data to the depth range of the known taberite thickness, which was 10 to 15 m at BTL and about 16 m at GSL (Walter Anthony et al., 2020). Different fits were evaluated for calculating the total CH4 production (Tables S3–S5), and a power law regression was chosen as the best fit for extrapolating the total CH4 production rate (Table S4, Fig. 4).
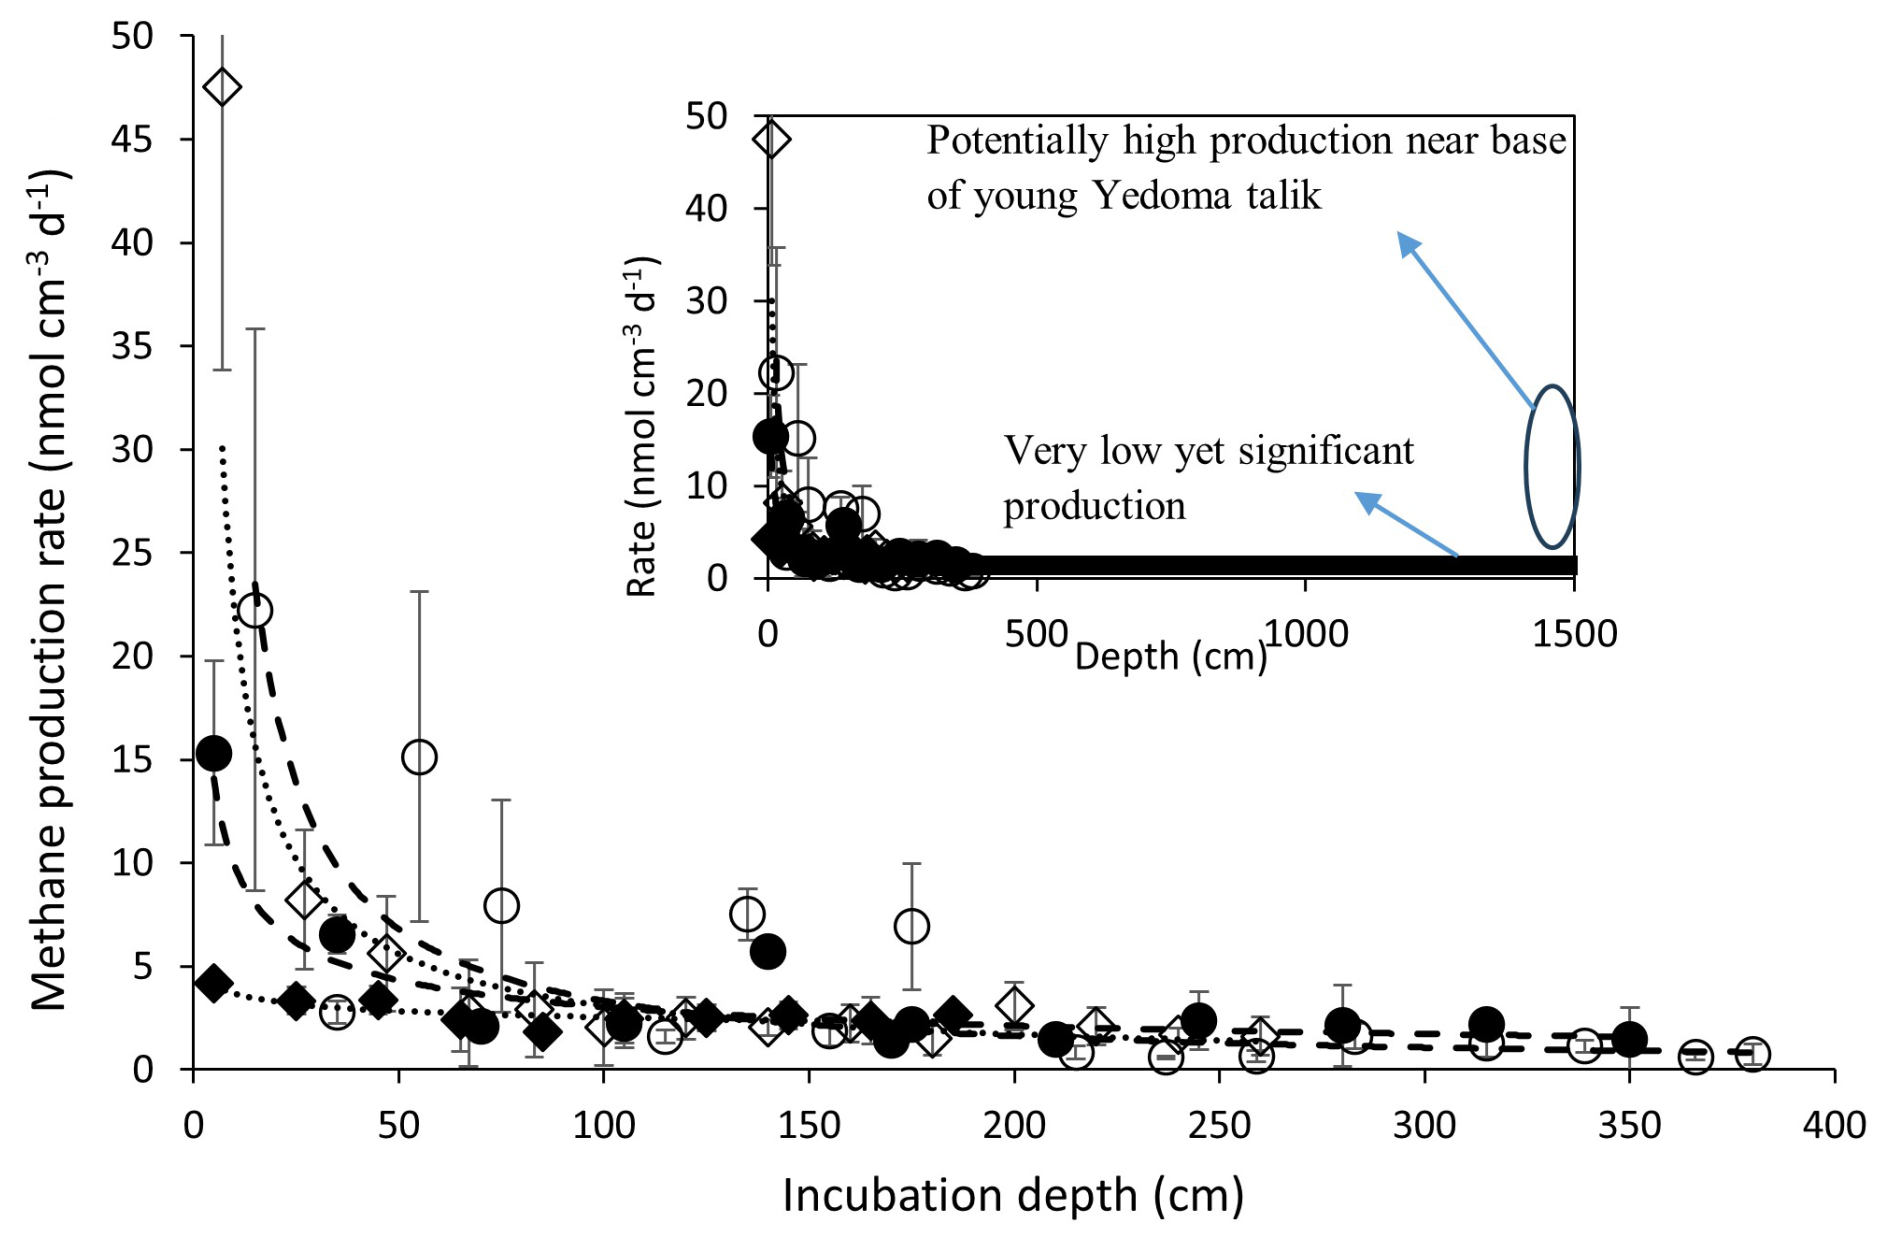
Figure 4CH4 production rates as measured in the different cores (symbols) and the power law extrapolation (curves, equations in Table S5) down to 4 and 15 m (upper-right side). A constant low rate of less than 1 nmol cm−3 d−1 below 3 m down to 15 m is also marked in the upper-right side, as well as the potential role of the high production of CH4 near of the base of the young talik.
The total 12 m column CH4 production calculated for the BTL edge and center cores was about 8.5 (±12 %) and 7.4 (±37 %) mol m−2 yr−1, respectively. In GSL, talik thickness is greater (< 40 m); however, the volumes of thawed silt are potentially comparable at both lakes, and the main difference is in time since thaw. Because BTL is a younger lake, we assume the talik sediments have thawed within the last 70 years, whereas talik sediments beneath the center of GSL are thought to have been thawed for 8 to 9 centuries (Walter Anthony et al., 2020). At GSL, our 15 m profile-integrated CH4 production rates from the center and the edge were 7 to 11 mol m−2 yr−1 (Table S4). Large uncertainties stem from the extrapolation (Table S5), the exceedingly long tail followed by the real measurements (Fig. 4), the potential variability in the composition and thickness of the surface organic-rich sediments and the actual talik depth across both lakes. We also assume that the rates are extremely low down to the base of the talik, whereas there is a potential for high production rates near the base of the young taliks. These high rates together with the high surface rates in the edges of the lakes and the center of BTL can explain the ebullition there and the lack of ebullition at the center of GSL (Walter Anthony et al., 2020).
3.4 The source of CH4
The source of CH4 in the sediment was estimated by comparing the δ13CCH4 values in the profiles to those measured in the rate incubations (after purging and waiting several months for in situ production) (Fig. S1). The δ13C values in the profiles from BTL were about −55 ‰ to −75 ‰ (edge) and −60 ‰ to −70 ‰ (center), whereas the values from the incubations of sediment from BTL were about 10 ‰ to 20 ‰ all along the profiles. The same observation is made in GSL, where the δ13C values of the dissolved CH4 in the profiles were about −60 ‰ to −70 ‰ (edge) and −70 ‰ to −80 ‰ (center), with more positive values for incubations. The significant difference between the incubations and in situ profiles points towards an additional deep source of 13C-depleted methane in the natural environment, consistent with talik-sourced ebullition observations (Walter Anthony et al., 2020).
3.5 Organic carbon characteristics in the sediments
The TOC profiles in the center of the BTL sediments exhibited a gradual decline from 2 % to less than 1 % and in GSL from approximately 1 % (Fig. S2). At the edge of the lakes, a higher TOC was observed near the top of the cores, up to 13 % (BTL) and 9 % (GSL), gradually decreasing with depth. The δ13CTOC in the center was constant near −27 ‰ in the upper 150 cm (Table S1). An increase to −25‰ was observed around 200 and 350 cm. At the edge, δ13CTOC values were around −28 ‰ at the upper part, with an increase observed below 200 cm to −25 ‰.
Rock-Eval data obtained at both the center and edge sites of both lakes exhibit a correlation between organic index values and sediment depth. The HI of BTL was mostly much higher than that of GSL and is indicative of a mix of Type I–III kerogen for the young lake (BTL) and Type III kerogen for the mature lake (GSL). The OI, on the other hand, was extremely high for both lakes, exceeding 150 mgCO2 g−1 TOC. In both the edge and center cores of BTL, there was an inverse dependency between the HI and OI, suggesting that with the loss of H, the OM became more oxidized. This relationship is missing from the mature lake, in which the OM lost most of its H, presumably due to microbial degradation (Fig. S3). The ratio in both sites of BTL decreased with depth and stabilized at 250 cm, with the center core generally exhibiting lower ratios compared to the edge. The ratio at the edge of GSL slightly decreased with depth. When comparing the two cores, the lower values were observed at the GSL center core, meaning it is more refractory than the edge (Fig. 5).
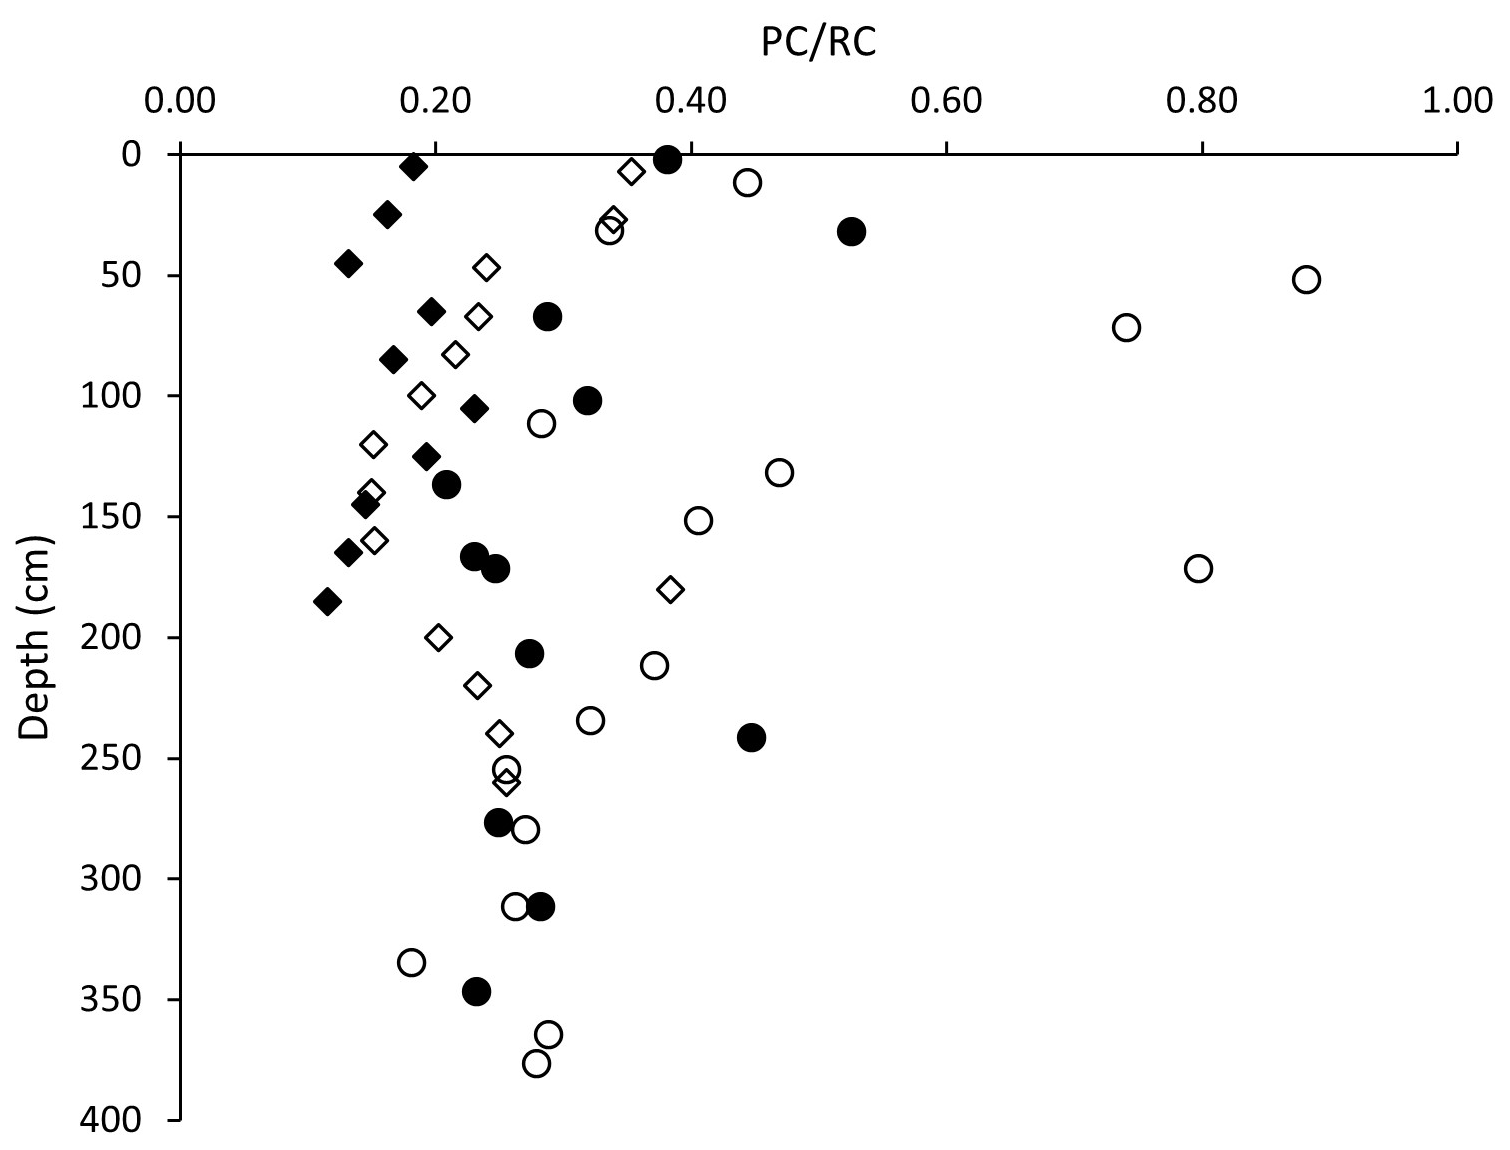
Figure 5Sediment profiles of the ratio of pyrolyzable carbon to refractory carbon (). The ratio decreases not only with depth but also with the evolution of the lakes, as organic carbon becomes more refractory. The uncertainty of the data is smaller than symbol sizes (circles – BTL, diamonds – GSL, full symbols – center, empty symbols – edge of lakes).
4.1 Total CH4 production in the talik
The CH4 production rates observed in the upper sediments of this study are similar in magnitude to the ones observed in our previous studies (Lotem et al., 2023; Pellerin et al., 2022). Previous studies in which cores depth was limited to about 1 m depth were unable to provide a full understanding of the characteristics of CH4 dynamics within thermokarst lake taliks. In Vault Lake, another thermokarst lake in central Alaska, a decrease in CH4 production was observed, with depth down to 6 m, but CH4 production rates were significantly higher than most reports (Heslop et al., 2015). Freitas et al. (2025) also showed low but significant cumulative anaerobic respiration throughout the taberal sediments, down to the gravel zone at around 16 m in GSL, with scattered values below.
Since we were able to sample up to 4 m in the talik of both BTL and GSL and in both the center and the edge (near the lakeshore) locations, our rate measurements provide an important confirmation of conceptual and numerical model predictions. They show high CH4 production rates in the surface with a steep decrease with depth in the talik as the taberite organic carbon becomes more refractory over time. Our findings are also consistent with the findings from an 8 m permafrost sediment core from the Lena delta, where the highest CH4 production rates were observed in the first 125 cm (Wagner et al., 2007).
The study also serves as the first empirical test of models predicting changes in CH4 production rates with the evolution of lakes. It shows that CH4 production rates are highest in the top sediments and are low but still significant in the deep talik. We did not measure significant differences between CH4 production rates at depths deeper than 100 cm at BTL and GSL (Fig. 4). However, other lines of evidence such as the different isotopic enrichments of the DIC pools strongly suggest that there should be differences in CH4 production rates between BTL and GSL. It may be that the low rates and higher uncertainty of the measurements in the deep talik made it impossible to differentiate between the rates in the two lakes.
The long cores and the steep CH4 production decrease with depth enable the estimation of the total production rates with higher certainty than the accumulated rates calculated in the 1 m cores and the estimated constant rates along the talik (Pellerin et al., 2022). It should be noted that despite reaching down to 4 m in the talik, we still needed to extrapolate the rates to the entire thickness of thawed taberal sediments, which has a depth of 10 to 16 m (Walter Anthony et al., 2020). It has been suggested previously that CH4 production rates may increase with the depth of the talik because more recently thawed permafrost might release more labile organic carbon available for degradation (Walter Anthony et al., 2014) due to a rapid turnover time upon thaw (Schädel et al., 2014; Shaver et al., 2006). However, previous studies have not found a significant rise in CH4 production rates with depth, except near the thaw front at the base of the young talik (Heslop et al., 2015). This potential rise in young talik is marked in Fig. 4 and may explain the lowest accumulated production rate in the center of GSL. The recent study of Freitas et al. (2025) showed similarly low values in the taberites overlying the sand/gravel zone in GSL at about 16 m and then scattered high values (in part because they were normalized to the total organics that was very low). To extrapolate our rates deeper into the talik, we experimented with several approaches such as using power law decay or constant rate, which reflect the lower rates obtained in the incubations. Using the integrated rates with a power law equation, we calculated total talik CH4 production (Table S4). We decided to present a power law fit since it indicates a declining rate in the deeper talik and reflects the overall trend observed in our incubations (Table S5). However, it is important to highlight the fact that all models that we experimented with yield similar conclusions regarding the total talik CH4 production. The model used to extrapolate CH4 production rates deep in the talik does not affect our conclusions.
An important finding is that facies thickness and talik depth play a significant role in determining total talik CH4 production, instead of just lake age and location in a lake. This is because, despite measurably higher CH4 production rates in the upper meter of sediment cores, as well as near the edges of the lakes, the low but relatively constant CH4 production rates observed at depths in all the sites (5 % to 10 %) impact the integrated talik CH4 production rates (Fig. 4).
The new total thawed talik CH4 production rates are of the same magnitude as the CH4 emissions measured by previous studies in BTL (Elder et al., 2021) and other discontinuous permafrost thermokarst lakes (Fig. 6). This similarity supports only a minor role for CH4 oxidation (aerobically and anaerobically) in the lakes. It also fits the finding in the upper 1 m of several thermokarst lakes, which shows that the anaerobic oxidation of CH4 rates, as deduced from batch experiments, are 2 orders of magnitude lower than CH4 production and not a significant sink of CH4 (Lotem et al., 2023).
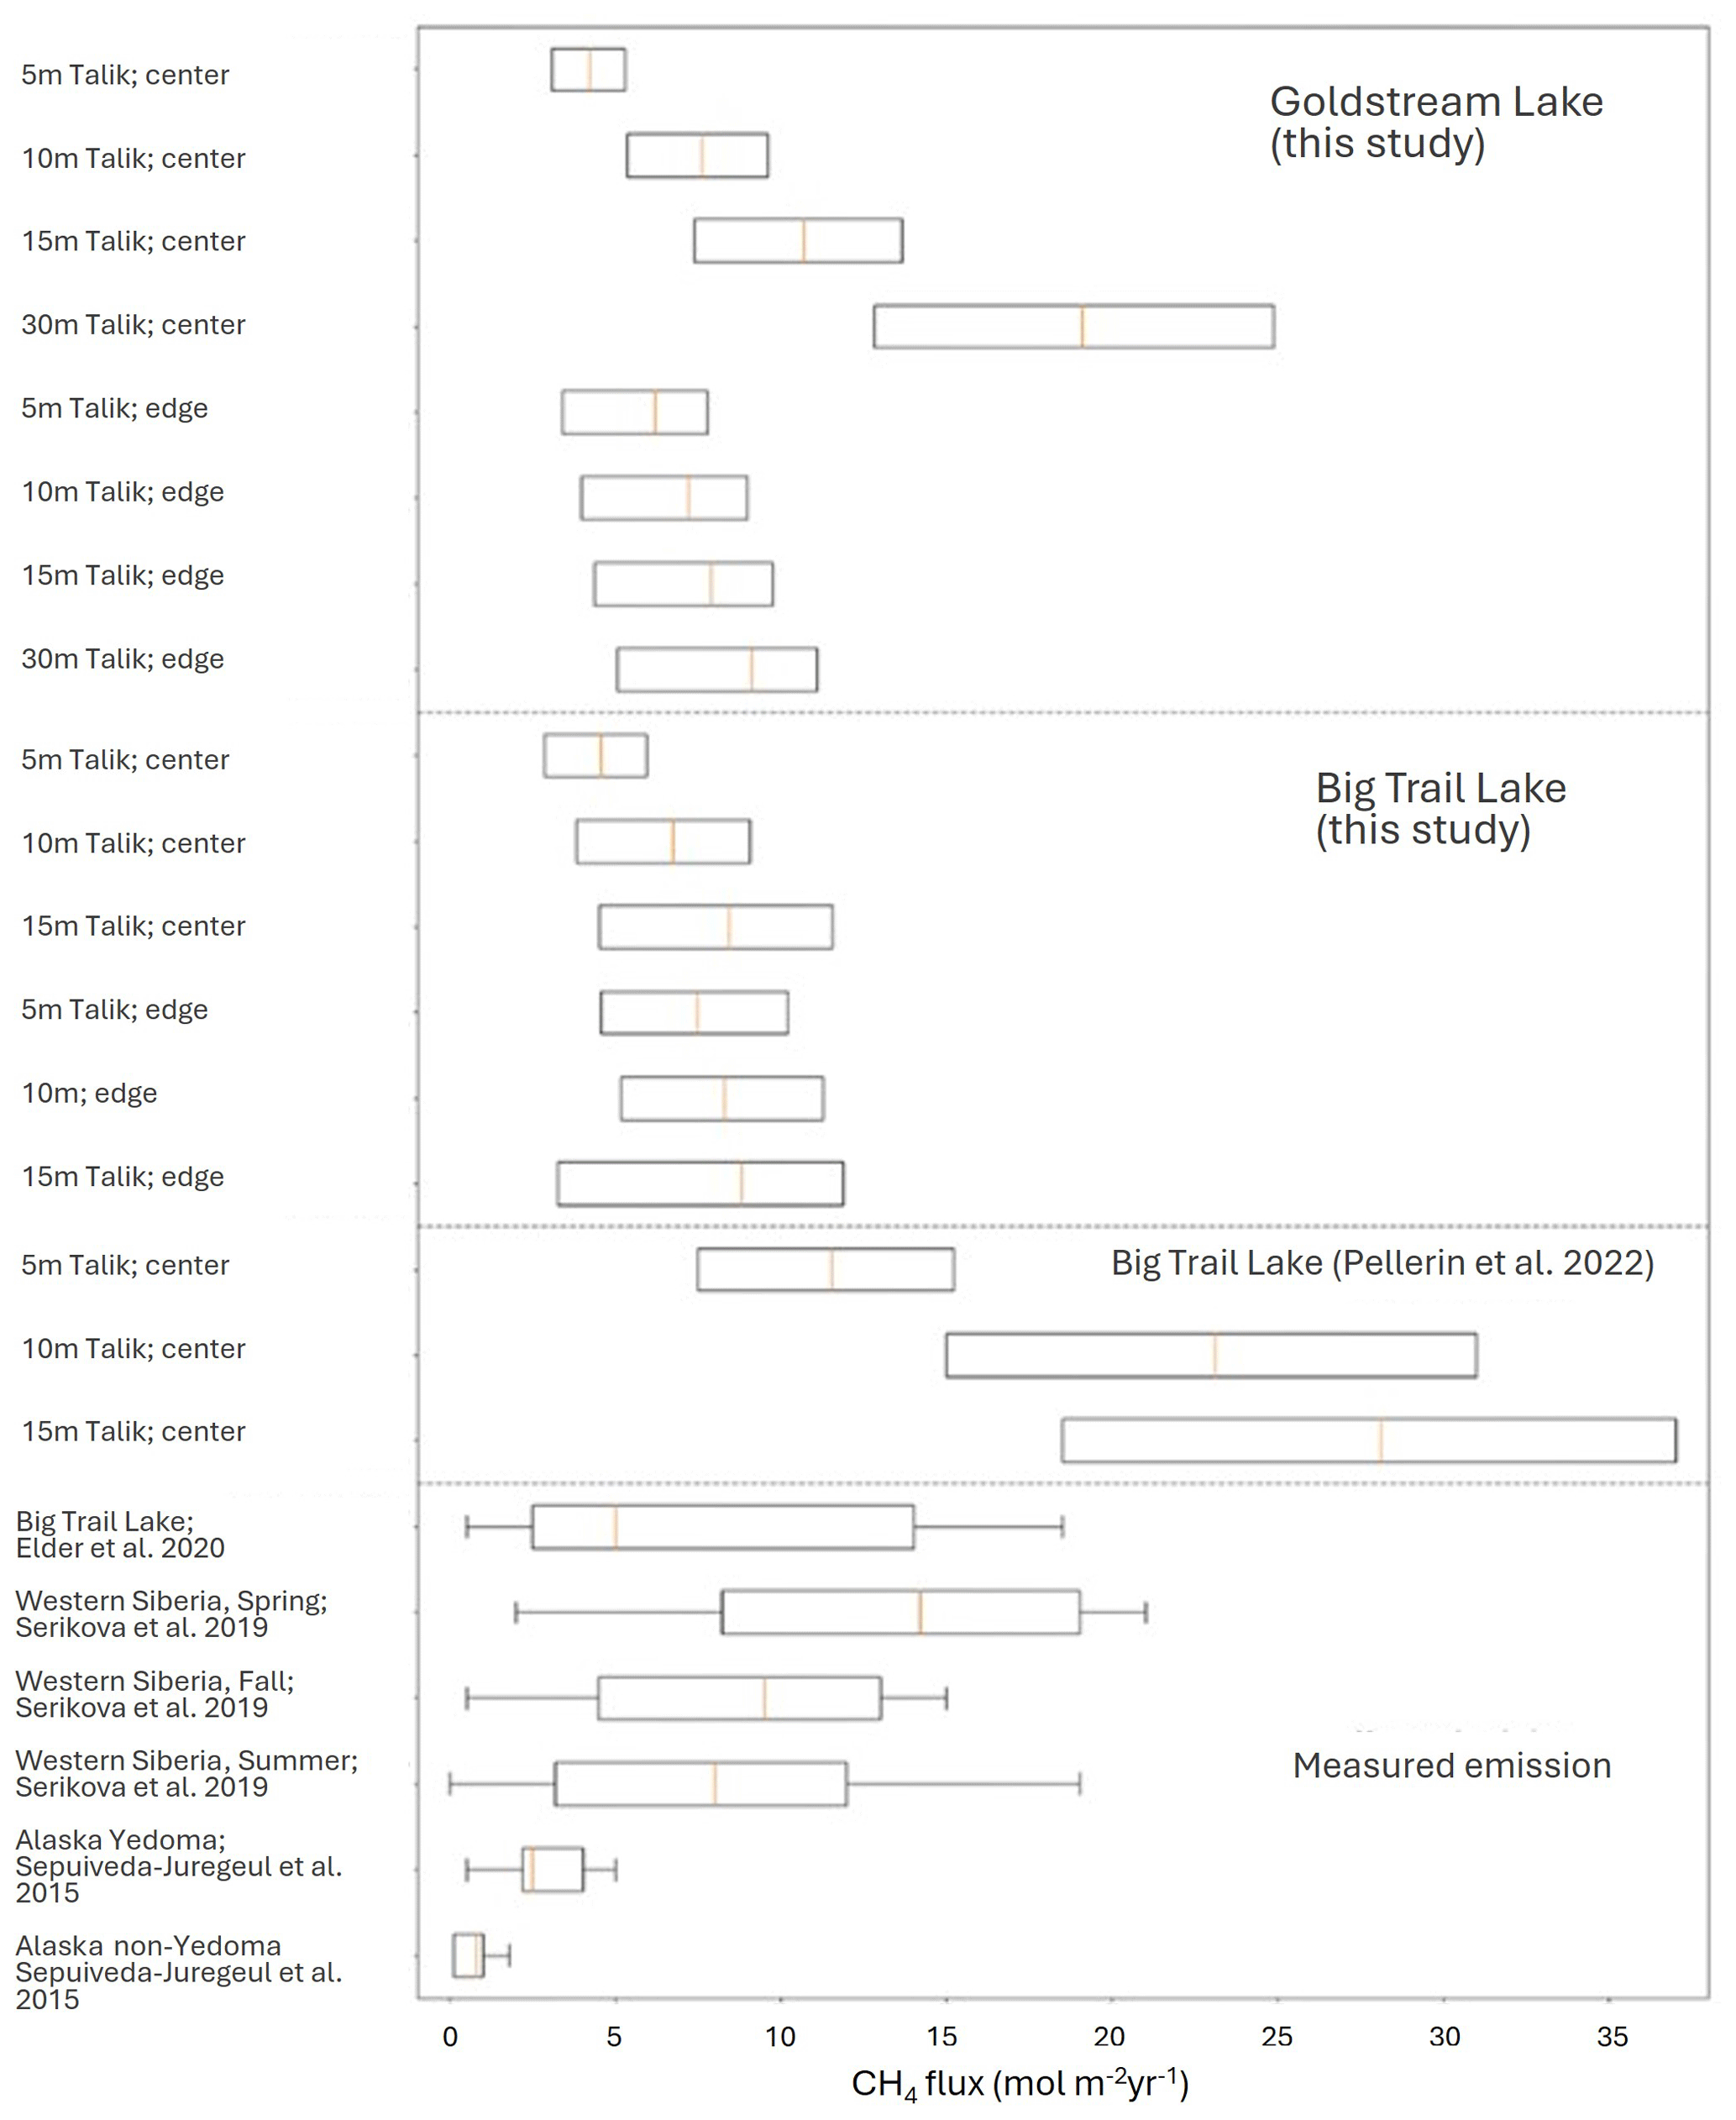
Figure 6Total talik CH4 production in BTL and GSL (mol m−2 yr−1), obtained by integrating the CH4 production rates over the potential range of thawed talik depths in the sediments (from the surface to the marked depth) using a power law extrapolation. The middle of the box corresponds to the mean estimate, and the uncertainty is the length of the boxes.
The implication of this observation is that as lakes mature, total thawed talik CH4 production rates can remain similar or even increase, although the carbon becomes less available for microbial degradation. This is when the talik deepens fast enough and offsets the overall drop in carbon lability. This is the case observed for both BTL and the eastern thermokarst margin of GSL. The question is whether there are control and a link between the organic carbon, its nature and CH4 production rates in BTL and GSL, as discussed below.
4.2 Factors influencing CH4 production rates and potential net emissions
We further investigated the controls of CH4 production in the BTL and GSL taliks. These lakes are in the same valley system, and it seems likely that they have the same sources and that CH4 production will be influenced from in situ differences. As the isotopic composition is much more sensitive for quantifying sedimentary processes rather than the concentration changes (e.g., Sivan et al., 2011), δ13CDIC and δ13CCH4 can be used to determine the controls on CH4 production in the lakes. The first clear observation is that methanogenesis is strongly imprinted in the δ13CDIC of the young recently thawed talik of BTL and not in older GSL talik, which has been thawed longer (Fig. 2). The δ13CDIC values of BTL are positive (around 10 ‰ to 20 ‰) as methanogenesis produces 13C-depleted CH4 and, by mass balance, 13C-enriched DIC. The δ13CDIC values in the sediments of GSL are about −5 ‰ to −10 ‰ at depth (Fig. 2).
The δ13C values of both lakes of −78 ‰ to −53 ‰ (Fig. 2) support this picture. They are typical of freshwater sediments, which are usually dominated by microbial acetoclastic methanogenesis (e.g., Whiticar et al., 1986). Methanogenesis pathways and their importance in this system were quantified by radiocarbon probing (Pellerin et al., 2022) and by the δ13CCH4 vs. δDCH4 (Liu et al., 2025). The relatively heavy δ13C values suggest low CH4 oxidation (e.g., Whiticar, 1999; Sivan et al., 2011), which results in 13C enrichment in CH4. The control of methanogenesis on BTL profiles is evident from looking at the δ13C values and plotting them against δ13C, similar to Krause and Treude (2021; Fig. S7). The data support acetoclastic methanogenesis and CH4 oxidation in all sites.
The main difference between the lakes is likely related to the fundamental difference in age of the two taliks, which influence the lability of organic carbon and the resulting biogeochemical cycles. The lability difference of the organics was further investigated by assessing the properties of the organic carbon in the talik of BTL and GSL.
Methane production rates are highly correlated to TOC and indices of thermal-induced lability in the upper sediments (Fig. 7a), but methane production rates and TOC are not correlated in the deep talik of BTL (Figs. S4–S5). The correlation is between two independent methods that estimate the lability of organic carbon to microbial degradation – the lability based on thermal degradation and the CH4 production rate. The most labile fraction of pyrolyzed carbon is correlated with the CH4 production rate in both the center and edge sites (Fig. 7b–d). The results demonstrate that the highest CH4 production rates observed in our study are likely due to both the lability and quantity of organic matter.
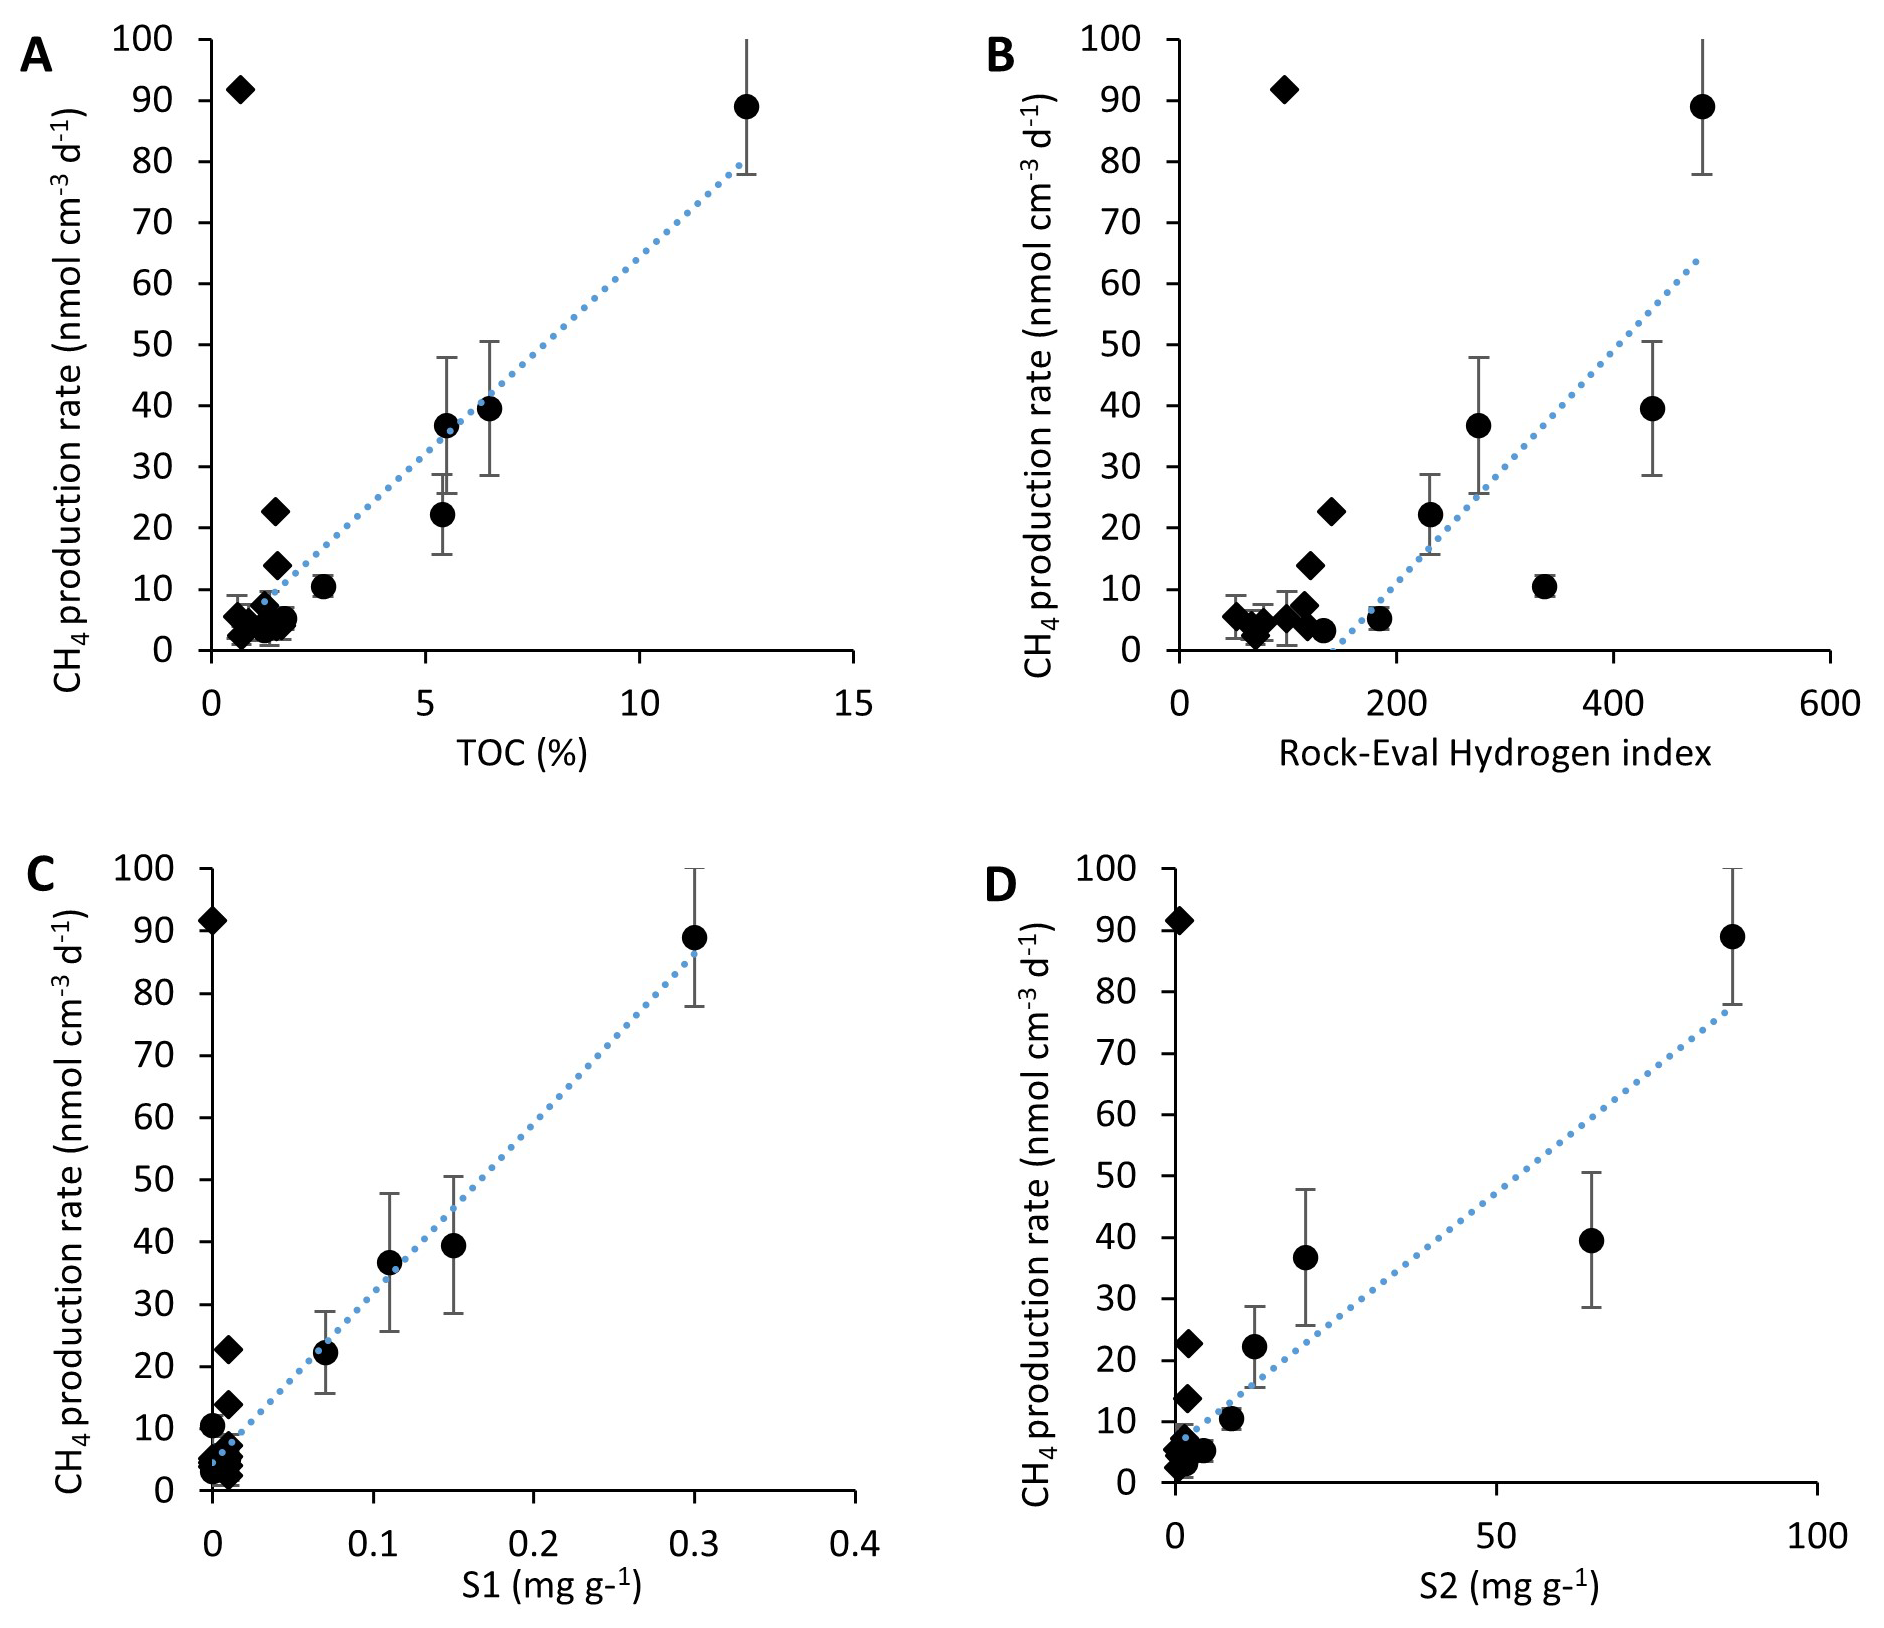
Figure 7Methane production rates (including its uncertainty) as measured in the top upper 100 cm of both the center and edge cores compared with the TOC content (A), the hydrogen index (B) (R2 = 0.67) and the most labile organic carbon compounds (Figs. S1, S2, (C, D), as measured using Rock-Eval). A positive relationship (R2 = 0.67 to 0.98) is evident in the upper 100 cm for BTL (circles) but not for GSL (diamonds).
The pyrolyzed carbon to residual carbon ratio () is a simple measure of how labile the organic carbon is. As the ratio is higher, the sample has more hydrogen and has a more pyrolyzable fraction (Carrie et al., 2012). Throughout the four cores taken for this study, the ratio was strongly dependent on depth in the talik (Fig. 5), which is consistent with older less labile organic matter deeper in the sediment because of the depositional history. However, the most interesting observation was the decreasing trend of lability to thermal-induced reactions between sites. The BTL edge had the highest values, which correspond to organic carbon with the highest lability, followed by the BTL center and the GSL edge, with the lowest value observed at the GSL center (Fig. 5). The lake edges exhibit the highest ratios compared to the center of lakes, suggesting that the center of the lakes contain more refractory organic carbon, which may be a result of the edges of the lakes being “younger” (the age since thaw). Alternatively, it could be that the edges have additional input of organic carbon from vegetation or runoff from land, as supported by the labile fractions found in the edges (Fig. 7c). Both the edge and center of GSL, on average, had lower ratios than both the center and edge of BTL. This is interpreted as GSL containing a greater fraction of less labile organic carbon, consistent with the longer time since the permafrost thawed and formed the talik and lake at this site. Carbon thus becomes less labile for microbial degradation as the lake evolves. In permafrost environments, organic carbon lability is not always correlated directly with what is termed the “age” of the organic carbon, such as in most marine sediments where lability, depth and age are often directly correlated. In the talik of thermokarst lakes, time since thaw seems to have some control on the lability of the organic carbon and exerts control on the CH4 production rate. Altogether, our study emphasizes the potential use of the lability of thermal-induced reactions as a proxy for organic lability for methanogenesis.
It therefore seems that at the onset of thawing, during the formation of a young thermokarst lake, a high amount of highly labile organic carbon accumulates and begins to degrade. As thawing progresses, the lake margins expand and deepen and the refractory organics remain, leading to lower CH4 production rates. A proposed conceptual mechanism is presented in Fig. 8. This mechanism can be tested in future studies, which include expanding the study to additional lakes, incorporating seasonal sampling and integrating microbial community analyses to better understand CH4 cycling processes.
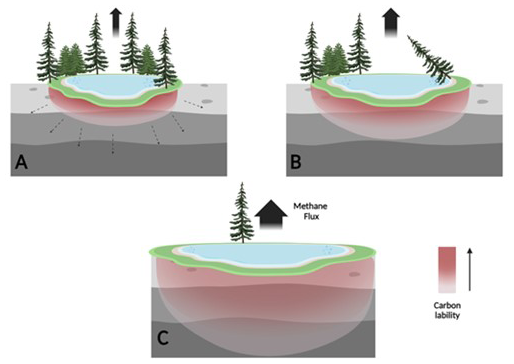
Figure 8Proposed conceptual mechanism of OM lability and CH4 emission as thermokarst lakes mature. Laboratory incubations support the conceptual and numerical models of decreasing carbon lability leading to lower CH4 production as Yedoma thermokarst lakes mature. The gray sediment denotes Yedoma permafrost soil. The red scale color denotes organic carbon lability with talik expansion into in situ thawed Yedoma (taberites). (A) Young active lake: labile carbon results in high CH4 production rates, with CH4 production in taberites proportional to the talik thickness. (B) Expanding lake: over decades, new organic carbon from surrounding soils and plants is added to surface lake sediments and to freshly thawed taberites at the base of the talik, while the availability of labile organic carbon attenuates in formerly thawed taberites. (C) Mature lake: over centuries, the talik deepens (into bedrock) beyond the depth of taberites, while taberite organic carbon becomes refractory. CH4 emissions may still be significant, depending on exogenous (non-taberite) inputs of organic carbon. At later stages (as suggested by Walter Anthony et al., 2014), the organic carbon is no longer available for methanogenesis, and the lake thus is no longer a significant source for permafrost-derived CH4 to the atmosphere.
4.3 Methane origin in the talik
The comparison of δ13C values between the profile measurements and those obtained from the incubation experiment shows less-enriched δ13C values in the sediment cores across all samples (Fig. S6). These values in the sediment profiles show that the pore water CH4 is not entirely produced in situ, suggesting that the new CH4 produced in the lake sediments contains more isotopically enriched δ13CCH4 values compared to the CH4 diffused from deeper layers, which could be produced by a different CH4 production pathway (Pellerin et al., 2022; Liu et al., 2025). CH4 generated at greater depths within the talik, which subsequently ascends through diffusion or bubble transport, exhibits a more negative δ13C, probably due to different conditions from those prevailing in the top meter of the talik, possibly under lower metabolic rates and using different metabolic pathways (Maltby et al., 2016; Berberish et al., 2020; Pellerin et al., 2022).
By considering the depleted δ13C values in the sediment cores and the corresponding incubation values at each depth, we can quantitatively assess the fraction of modern CH4 present in the sediment profile. A comprehensive analysis of the young production fraction in all four cores shows that as depth increases, the contribution of newly produced CH4 decreases and tends to approach zero across all cores (Fig. S6). Additionally, the new CH4 fraction observed in Goldstream Lake (both the edge and center) is smaller compared to that of BTL. This finding suggests a greater influence of newly produced CH4 in younger lakes compared to those that have formed and thawed longer. A shift in the methanogenesis pathway in the sediments vs. the incubations can be an alternative explanation, however less likely, given the observations here and in previous studies (Pellerin et al., 2022).
This study presents the first empirical data quantifying CH4 production and the organic carbon degradation of thermokarst lakes from young to mature. This was achieved by quantifying the evolution of organic carbon degradation and CH4 production rates throughout the evolution of lakes from a young dynamic lake to a mature one. The findings underscore the vertical variations in CH4 production rates, the influence of permafrost thawing on microbial activity and the divergent patterns observed among lakes of different development stages.
Our high-resolution profiles and long-term incubations show the highest CH4 production rates on the edges of the young BTL, then the center of BTL, then the edge of the mature GSL, with the lowest at the center of GSL. The higher rates coincided with higher TOC levels, more labile carbon content for thermal-induced chemical reactions, simpler carbon compounds and a young CH4 source. These factors provided probably favorable conditions for microbial populations to decompose carbon, resulting in elevated CH4 production. The high correlation between the two different methods to estimate organic carbon lability for microbial degradation CH4 production rates and the lability to thermal-induced chemical reactions emphasizes the potential use of the Rock-Eval analyses to estimate the susceptibility of organic carbon for microbial degradation.
Our proposed conceptual mechanism, as depicted in Fig. 8, considers these two parameters (lake age and thawed talik thickness) when discussing accumulated CH4 production rates. It can therefore be expected that the expansion of thermokarst lakes in the Arctic will continue to influence CH4 production as the younger lakes expand into deeper permafrost layers.
All data for this study are available in the table and figures of this article as well as the Supplement.
The supplement related to this article is available online at https://doi.org/10.5194/bg-22-7901-2025-supplement.
YG, AP, EER and OS participated in the sampling campaigns led by KWA and NH. YG conducted the incubation experiments. EER and YG measured the geochemical samples and processed the data. NH conducted the geophysical measurements. OS led the paper writing with AP. YOR was responsible for the Rock-Eval 6 method development and, with AP and OS, interpreted the data.
The contact author has declared that none of the authors has any competing interests.
Publisher’s note: Copernicus Publications remains neutral with regard to jurisdictional claims made in the text, published maps, institutional affiliations, or any other geographical representation in this paper. While Copernicus Publications makes every effort to include appropriate place names, the final responsibility lies with the authors. Views expressed in the text are those of the authors and do not necessarily reflect the views of the publisher.
We would like to thank the editor and the reviewers for their thorough reviews.
This research has been supported by the Israel Science Foundation (grant no. 1573-2022), the EU H2020 European Research Council (grant no. 818450), the National Science Foundation (grant no. 2022561) and the Natural Sciences and Engineering Research Council of Canada (grant no. RGPIN-2022-04305).
This paper was edited by Helge Niemann and reviewed by three anonymous referees.
Behar, F., Beaumont, V., and De B. Penteado, H. L.: Rock-Eval 6 Technology: Performances and Developments, Oil & Gas Science and Technology – Rev. IFP, 56, 111–134, https://doi.org/10.2516/ogst:2001013, 2001.
Berberish, M. E., Beaulieu, J. J., Hamilton, T. L., Waldo, S., and Buffam, I.: the spatial of sediment methane production communities within ta eutrophic reservoir: Imoportance of organic matter source and quantity, Limnology and Oceanography, 65, 1336–1358, https://doi.org/10.1002/lno.11392, 2020.
Carrie, J., Sanei, H., and Stern, G.: Standardisation of Rock–Eval pyrolysis for the analysis of recent sediments and soils, Organic Geochemistry, 46, 38–53, https://doi.org/10.1016/j.orggeochem.2012.01.011, 2012.
de Jong, A. E. E., In 'T Zandt, M. H., Meisel, O. H., Jetten, M. S. M., Dean, J. F., Rasigraf, O., and Welte, C. U.: Increases in temperature and nutrient availability positively affect methane-cycling microorganisms in Arctic thermokarst lake sediments, Environmental Microbiology, 20, 4314–4327, https://doi.org/10.1111/1462-2920.14345, 2018.
Dickens, G. R., Koelling, M., Smith, D. C., Schnieders, L., and the IODP Expedition 302 Scientists: Rhizon Sampling of Pore Waters on Scientific Drilling Expeditions: An Example from the IODP Expedition 302, Arctic Coring Expedition (ACEX), Sci. Dril., 4, 22–25, https://doi.org/10.2204/iodp.sd.4.08.2007, 2007.
Douglas, T. A., Turetsky, R. T., and Koven, C. D.: Increased rainfall stimulates permafrost thaw across a variety of Interior Alaskan Boreal ecosystems, Climate and Atmospheric Science, 3, https://doi.org/10.1038/s41612-020-0130-4, 2020.
Dutta, K., Schuur, E. A. G., Neff, J. C., and Zimov, S. A.: Potential carbon release from permafrost soils of Northeastern Siberia, Global Change Biology, 12, 2336–2351, https://doi.org/10.1111/j.1365-2486.2006.01259.x, 2006.
Elder, C. D., Thompson, D. R., Thorpe, A. K., Chandanpurkar, H. A., Hanke, P. J., Hasson, N., James, S. R., Minsley, B. J., Pastick, N. J., Olefeldt, D., Walter Anthony, K. M., and Miller, C. E.: Characterizing Methane Emission Hotspots From Thawing Permafrost, Global Biogeochemical Cycles, 35, e2020GB006922, https://doi.org/10.1029/2020GB006922, 2021.
Emond, A. M., Daanen, R. P., Graham, G. R. C., Anthony, K. W., Liljedahl, A. K., Minsley, B. J., Barnes, D. L., Romanovsky, V. E., and CGG Canada Services Ltd.: Airborne electromagnetic and magnetic survey, Goldstream Creek watershed, interior Alaska, Alaska Division of Geological & Geophysical Surveys, https://doi.org/10.14509/29681, 2018.
Estop-Aragonés, C., Olefeldt, D., Abbott, B. W., Chanton, J. P., Czimczik, C. I., Dean, J. F., Egan, J. E., Gandois, L., Garnett, M. H., Hartley, I. P., Hoyt, A., Lupascu, M., Natali, S. M., O'Donnell, J. A., Raymond, P. A., Tanentzap, A. J., Tank, S. E., Schuur, E. A. G., Turetsky, M., and Anthony, K. W.: Assessing the Potential for Mobilization of Old Soil Carbon After Permafrost Thaw: A Synthesis of 14C Measurements From the Northern Permafrost Region, Global Biogeochemical Cycles, 34, e2020GB006672, https://doi.org/10.1029/2020GB006672, 2020.
Farquharson, L., Anthony, K. W., Bigelow, N., Edwards, M., and Grosse, G.: Facies analysis of Yedoma thermokarst lakes on the northern Seward Peninsula, Alaska, Sedimentary Geology, 340, 25–37, https://doi.org/10.1016/j.sedgeo.2016.01.002, 2016.
Freitas, N. L., Walter Anthony, K., Lenz, J., Porras, R. C., and Torn, M. S.: Substantial and overlooked greenhouse gas emissions from deep Arctic lake sediment, Nat. Geosci., 18, 65–71, https://doi.org/10.1038/s41561-024-01614-y, 2025.
Hasson, N., Walter Anthony, K. M., Elder, C., Baptiste, D., Miller, C. E., Kholodov, A. L., Rybakov, S., Anthony, P., and Daanen, R. P.: Methane emissions show exponential inverse relationship with electrical resistivityfrom discontinuous permafrost wetlands in Alaska, AGU Fall Meeting 2022, Chicago, https://ui.adsabs.harvard.edu/abs/2022AGUFM.B15E..06H/abstract (last access: 15 July 2024), 2022.
Heslop, J. K., Walter Anthony, K. M., Sepulveda-Jauregui, A., Martinez-Cruz, K., Bondurant, A., Grosse, G., and Jones, M. C.: Thermokarst lake methanogenesis along a complete talik profile, Biogeosciences, 12, 4317–4331, https://doi.org/10.5194/bg-12-4317-2015, 2015.
Hopkins, D. M.: Thaw Lakes and Thaw Sinks in the Imuruk Lake Area, Seward Peninsula, Alaska, The Journal of Geology, 57, 119–131, https://doi.org/10.1086/625591, 1949.
Hugelius, G., Strauss, J., Zubrzycki, S., Harden, J. W., Schuur, E. A. G., Ping, C.-L., Schirrmeister, L., Grosse, G., Michaelson, G. J., Koven, C. D., O'Donnell, J. A., Elberling, B., Mishra, U., Camill, P., Yu, Z., Palmtag, J., and Kuhry, P.: Estimated stocks of circumpolar permafrost carbon with quantified uncertainty ranges and identified data gaps, Biogeosciences, 11, 6573–6593, https://doi.org/10.5194/bg-11-6573-2014, 2014.
Kessler, M. A., Plug, L. J., and Walter Anthony, K. M.: Simulating the decadal- to millennial-scale dynamics of morphology and sequestered carbon mobilization of two thermokarst lakes in NW Alaska, J. Geophys. Res., 117, 2011JG001796, https://doi.org/10.1029/2011JG001796, 2012.
Knoblauch, C., Beer, C., Liebner, S., Grigoriev, M. N., and Pfeiffer, E.-M.: Methane production as key to the greenhouse gas budget of thawing permafrost, Nat. Clim. Change, 8, 309–312, https://doi.org/10.1038/s41558-018-0095-z, 2018.
Krause, S. J. E. and Treude, T.: Deciphering cryptic methane cycling: Coupling of methylotrophic methanogenesis and anaerobic oxidation of methane in hypersaline coastal wetland sediment, Geochimica et Cosmochimica Acta, 302, 160–174, https://doi.org/10.1016/j.gca.2021.03.021, 2021.
Liu, J., Young, E. D., Pellerin, A., Ash, J. L., Barrett, G., Feng, X., Girguis, P. R., Krause, S. J. E., Leavitt, W. D., Murphy, K., Qin, Q., Teske, A., Valentine, D. L., Anthony, K. W., and Treude, T.: Clumped isotopes of methane trace bioenergetics in the environment, Science Advances, 11, https://doi.org/10.1126/sciadv.adu1401, 2025.
Lotem, N., Pellerin, A., Anthony, K. W., Gafni, A., Boyko, V., and Sivan, O.: Anaerobic oxidation of methane does not attenuate methane emissions from thermokarst lakes, Limnology & Oceanography, 68, 1316–1330, https://doi.org/10.1002/lno.12349, 2023.
Maltby, J., Sommer, S., Dale, A. W., and Treude, T.: Microbial methanogenesis in the sulfate-reducing zone of surface sediments traversing the Peruvian margin, Biogeosciences, 13, 283–299, https://doi.org/10.5194/bg-13-283-2016, 2016.
Martinez-Cruz, K., Sepulveda-Jauregui, A., Casper, P., Anthony, K. W., Smemo, K. A., and Thalasso, F.: Ubiquitous and significant anaerobic oxidation of methane in freshwater lake sediments, Water Research, 144, 332–340, https://doi.org/10.1016/j.watres.2018.07.053, 2018.
Obu, J.: How Much of the Earth's Surface is Underlain by Permafrost?, J. Geophys. Res. Earth Surface, 126, e2021JF006123, https://doi.org/10.1029/2021JF006123, 2021.
Olefeldt, D., Goswami, S., Grosse, G., Hayes, D., Hugelius, G., Kuhry, P., McGuire, A. D., Romanovsky, V. E., Sannel, A. B. K., Schuur, E. A. G., and Turetsky, M. R.: Circumpolar distribution and carbon storage of thermokarst landscapes, Nat. Commun., 7, 13043, https://doi.org/10.1038/ncomms13043, 2016.
Pellerin, A., Lotem, N., Walter Anthony, K., Eliani Russak, E., Hasson, N., Røy, H., Chanton, J. P., and Sivan, O.: Methane production controls in a young thermokarst lake formed by abrupt permafrost thaw, Global Change Biology, 28, 3206–3221, https://doi.org/10.1111/gcb.16151, 2022.
Péwé, T. L.: Quaternary geology of Alaska, United States Department of the Interior, Geological Survey, https://doi.org/10.3133/pp835, 1975.
Post, E., Alley, R. B., Christensen, T. R., Macias-Fauria, M., Forbes, B. C., Gooseff, M. N., Iler, A., Kerby, J. T., Laidre, K. L., Mann, M. E., Olofsson, J., Stroeve, J. C., Ulmer, F., Virginia, R. A., and Wang, M.: The polar regions in a 2 °C warmer world, Sci. Adv., 5, eaaw9883, https://doi.org/10.1126/sciadv.aaw9883, 2019.
Schädel, C., Schuur, E. A. G., Bracho, R., Elberling, B., Knoblauch, C., Lee, H., Luo, Y., Shaver, G. R., and Turetsky, M. R.: Circumpolar assessment of permafrost C quality and its vulnerability over time using long-term incubation data, Global Change Biology, 20, 641–652, https://doi.org/10.1111/gcb.12417, 2014.
Schuur, E. A. G., McGuire, A. D., Schädel, C., Grosse, G., Harden, J. W., Hayes, D. J., Hugelius, G., Koven, C. D., Kuhry, P., Lawrence, D. M., Natali, S. M., Olefeldt, D., Romanovsky, V. E., Schaefer, K., Turetsky, M. R., Treat, C. C., and Vonk, J. E.: Climate change and the permafrost carbon feedback, Nature, 520, 171–179, https://doi.org/10.1038/nature14338, 2015.
Sepulveda-Jauregui, A., Walter Anthony, K. M., Martinez-Cruz, K., Greene, S., and Thalasso, F.: Methane and carbon dioxide emissions from 40 lakes along a north–south latitudinal transect in Alaska, Biogeosciences, 12, 3197–3223, https://doi.org/10.5194/bg-12-3197-2015, 2015.
Shaver, G. R., Giblin, A. E., Nadelhoffer, K. J., Thieler, K. K., Downs, M. R., Laundre, J. A., and Rastetter, E. B.: Carbon turnover in Alaskan tundra soils: effects of organic matter quality, temperature, moisture and fertilizer, Journal of Ecology, 94, 740–753, https://doi.org/10.1111/j.1365-2745.2006.01139.x, 2006.
Sivan, O., Adler, M., Pearson, A., Gelman, F. , Bar-Or, I., John, S. G., and Eckert W.: Geochemical evidence for iron-mediated anaerobic oxidation of methane, Limnology and Oceanography, 56, 4, 1536-1544, https://doi.org/10.4319/lo.2011.56.4.1536, 2011.
Strauss, J., Schirrmeister, L., Grosse, G., Wetterich, S., Ulrich, M., Herzschuh, U., and Hubberten, H.: The deep permafrost carbon pool of the Yedoma region in Siberia and Alaska, Geophysical Research Letters, 40, 6165–6170, https://doi.org/10.1002/2013GL058088, 2013.
Turetsky, M. R., Abbott, B. W., Jones, M. C., Anthony, K. W., Olefeldt, D., Schuur, E. A. G., Grosse, G., Kuhry, P., Hugelius, G., Koven, C., Lawrence, D. M., Gibson, C., Sannel, A. B. K., and McGuire, A. D.: Carbon release through abrupt permafrost thaw, Nat. Geosci., 13, 138–143, https://doi.org/10.1038/s41561-019-0526-0, 2020.
Wagner, D., Gattinger, A., Embacher, A., Pfeiffer, E., Schloter, M., and Lipski, A.: Methanogenic activity and biomass in Holocene permafrost deposits of the Lena Delta, Siberian Arctic and its implication for the global methane budget, Global Change Biology, 13, 1089–1099, https://doi.org/10.1111/j.1365-2486.2007.01331.x, 2007.
Walter Anthony, K. M., Zimov, S. A., Grosse, G., Jones, M. C., Anthony, P. M., Iii, F. S. C., Finlay, J. C., Mack, M. C., Davydov, S., Frenzel, P., and Frolking, S.: A shift of thermokarst lakes from carbon sources to sinks during the Holocene epoch, Nature, 511, 452–456, https://doi.org/10.1038/nature13560, 2014.
Walter Anthony, K., Schneider von Deimling, T., Nitze, I., et al.: 21st-century modeled permafrost carbon emissions accelerated by abrupt thaw beneath lakes, Nat. Commun., 9, 3262, https://doi.org/10.1038/s41467-018-05738-9, 2018.
Whiticar, M. J.: Carbon and Hydrogen Isotope Systematics of Bacterial Formation and Oxidation of Methane, Chemical Geology, 161, 291–314, https://doi.org/10.1016/S0009-2541(99)00092-3, 1999.
Whiticar, M. J., Faber, E., and Schoell, M.: Biogenic Methane Formation in Marine and Freshwater Environments: CO2 Reduction vs. Acetate Fermentation – Isotope Evidence,Geochimica et Cosmochimica Acta, 50, 693–709, https://doi.org/10.1016/0016-7037(86)90346-7, 1986.
Zhang, T., Barry, R. G., Knowles, K., Heginbottom, J. A., and Brown, J.: Statistics and characteristics of permafrost and ground-ice distribution in the Northern Hemisphere, Polar Geography, 31, 47–68, https://doi.org/10.1080/10889370802175895, 2008.
Zimov, S. A., Voropaev, Y. V., Semiletov, I. P., Davidov, S. P., Prosiannikov, S. F., Chapin, F. S., Chapin, M. C., Trumbore, S., and Tyler, S.: North Siberian Lakes: A Methane Source Fueled by Pleistocene Carbon, Science, 277, 800–802, https://doi.org/10.1126/science.277.5327.800, 1997.