the Creative Commons Attribution 4.0 License.
the Creative Commons Attribution 4.0 License.
 | 09 Feb 2026
Carbon burial in two Greenland fjords shows no direct link to glacier type
Emil De Borger
Lorenz Meire
Samuel Bodé
Antonio Schirone
Karline Soetaert
Ann Vanreusel
Ulrike Braeckman
Fjord systems play a crucial role in the burial and long-term storage of organic carbon (OC). Despite their importance, Greenland's fjords remain underrepresented in global carbon budgets, even though accelerated melt of the Ice Sheet alters these ecosystems through increased freshwater discharge and iceberg calving, ultimately driving glacier retreat inland. This study compares sediment TOC, TN, and Chl-a content as well as δ13C, δ15N and organic carbon burial rates (OCBRs) in two neighbouring Greenland fjords: Nuup Kangerlua, dominated by marine-terminating glaciers (MTGs), and Ameralik, influenced by a land-terminating glacier (LTG). Although subglacial upwelling enhances primary productivity in Nuup Kangerlua, this does not translate into correspondingly higher surface sediment organic matter content or significantly higher OCBRs compared to Ameralik, where no such upwelling occurs. Instead, the average OCBRs were similar between the two fjords with 18.0 ± 1.6 g C m−2 yr−1 in Nuup Kangerlua and 16.2 ± 1.7 g C m−2 yr−1 in Ameralik. In Nuup Kangerlua, sediment Chl-a content in the upper 10 cm ranged from 0.08 to 9.8 µg g−1 and TOC from 0.05 % to 1.32 %, whereas in Ameralik they ranged from 0.35 to 20.1 µg g−1 and 0.13 % to 2.43 %, respectively. The elevated values in Ameralik are linked to a deep depositional basin that promotes OC accumulation and strongly contributes to the relatively high average OCBR. Furthermore, between 8 % and 28 % of the annual surface production in Nuup Kangerlua is ultimately buried in the sediments, whereas this proportion is substantially higher in Ameralik: 25 % to 62 %. The weaker coupling between surface production and sedimentary OC burial in Nuup Kangerlua versus Ameralik underscores the need for further research to disentangle the interactions driving primary production, carbon transfer in the food web, and the lateral and vertical transport, degradation and preservation of OC in fjord sediments.
- Article
(6703 KB) - Full-text XML
- BibTeX
- EndNote


Fjord systems represent significant carbon sinks, contributing to approximately a tenth of the annual burial of organic carbon (OC) (Smith et al., 2015). In the Northern hemisphere, carbon content and burial in fjord sediments have mainly been studied in Alaska (Cui et al., 2016a), Scotland and Ireland, (Smeaton et al., 2016; Smeaton and Austin, 2017; Smeaton and Austin, 2019; Smeaton et al., 2021), Norway (Duffield et al., 2017; Faust and Knies, 2019; Włodarska-Kowalczuk et al., 2019), Sweden (Placitu et al., 2024; Watts et al., 2024) and Svalbard (Kuliński et al., 2014; Koziorowska et al., 2018; Zaborska et al., 2018; Włodarska-Kowalczuk et al., 2019). In the Southern Hemisphere, estimates of OC burial in fjord systems are comparatively sparse and largely confined to a few regions within Patagonia (Sepúlveda et al., 2011), South Georgia (Berg et al., 2021), Antarctica (Eidam et al., 2019), and New Zealand (Hinojosa et al., 2014; Cui et al., 2016b). Despite the growing body of research in both hemispheres, Greenland remains markedly underrepresented in global carbon budgets (Smith et al., 2015), even though its coast is fringed by a myriad of fjords, including some of the most extensive fjord systems in the Arctic. Moreover, Greenland harbours the only remaining Arctic ice sheet since the last glacial period, which plays a key role in regulating Earth's climate and sea-level. The current accelerated melting of the Greenland Ice Sheet (King et al., 2020; Greene et al., 2024), driven by climate change, has far-reaching global implications and is altering fjord systems through increased freshwater discharge and iceberg calving (Calleja et al., 2017; Catania et al., 2019; Kanna et al., 2022).
Glaciers in polar regions either calve directly into the ocean (so called “marine-terminating glaciers”, further referred to as MTGs) or terminate inland, discharging into lakes or the ocean via meltwater rivers (“land-terminating glaciers”, LTGs). Fjords, inundated relict valleys carved out during previous glacial periods, often serve as channels through which these glaciers and meltwater rivers reach the ocean. Meltwater percolates down the cracks and crevices of glaciers to ultimately form sub-glacial rivers at their base (Chu, 2014). Since MTGs terminate in the ocean, this sub-glacial meltwater rises up from the bottom of the glacier within the fjord basin entraining nutrients, like nitrate, ammonium and phosphate, present in deeper water layers (Meire et al., 2017; Hopwood et al., 2018, 2020; Kanna et al., 2018; Cape et al., 2019; Halbach et al., 2019; Seifert et al., 2019). This upwelling water mass replenishes thereby essential nutrients for primary production in the surface waters, crucial for sustaining phytoplankton proliferation beyond the initial spring bloom phase. This extended bloom, running into the summer months may potentially lead to increased OC production within the fjord ecosystem (Kanna et al., 2022; Meire et al., 2023). Conversely, fjords receiving meltwater from LTGs lack this mechanism of upwelling, leading to a depletion of nutrients following the spring bloom period, resulting in substantially lower primary production in summer (Meire et al., 2017, 2023). Consequently, the carbon dynamics in LTG-dominated fjords may differ significantly from those observed in MTG-dominated fjords.
An important characteristic of fjord systems that enhances their capacity as carbon sinks is an elevated sedimentation rate, driven by their proximity to glaciers and rivers, along with the steep terrain of their watersheds (Syvitski et al., 1987). However, sedimentation rate alone is not the sole determinant of effective carbon burial (Bianchi et al., 2020). In general, the effectiveness of trapping OC varies among fjords and depends on (1) the productivity of the fjord waters, particularly phytoplankton growth, as well as terrestrial vegetation in the catchment, both of which are influenced by climate (e.g. fjord categories described in Włodarska-Kowalczuk et al., 2019), (2) factors affecting the settlement of OC to the fjord's bottom sediments like fjord geomorphology and current dynamics (Gilbert et al., 2002; Erlandsson, 2008; Faust and Knies, 2019; Watts et al., 2024) and (3) factors limiting the degradation of settled OC, among which the refractory nature of OC (Koziorowska et al., 2015; Zaborska et al., 2018), sedimentation rate (Watts et al., 2024) and bottom water redox conditions (Hinojosa et al., 2014).
Findings from the limited number of biogeochemical studies focusing on Greenland fjords have suggested that enhanced primary production observed in MTG-dominated fjords, driven by the upwelling effect, may lead to increased carbon burial in fjord sediments compared to LTG-influenced fjord systems (Meire et al., 2017, 2023; Stuart-Lee et al., 2023). However, there is limited data from Arctic fjords to test this. In Svalbard, a lower OC content has been observed in the surface sediments of an LTG-fed fjord compared to two MTG-impacted fjord systems (Laufer-Meiser et al., 2021). In contrast, another study conducted in Svalbard reported a higher OC content in the surface sediments of an LTG – compared to an MTG-influenced fjord (Koziorowska et al., 2015). While the first study ascribed the observed pattern to the glacier-driven upwelling effect, the second study attributed the higher OC content to the higher proportion of terrestrially-derived organic matter versus the more degradable marine organic matter. A study comparing organic carbon burial rates (OCBRs) in Arctic fjords stated that high-Arctic fjords (i.e. situated above 75° N) with limited glacial activity and a short phytoplankton growth period sequester lower amounts of carbon in the sediments compared to Arctic fjords with “active” glaciers and a relatively longer phytoplankton growth period (Włodarska-Kowalczuk et al., 2019).
This study aims to quantify carbon burial processes in Greenland fjord systems and to evaluate how these fjords contribute to regional carbon storage relative to differences in productivity. To achieve this, we compared two fjords that differ in primary productivity, a contrast linked to the type of glacier discharge (i.e., marine- versus land-terminating glaciers; Meire et al., 2023). We focused on differences in OC and chlorophyll-a (Chl-a) contents, their sources, and OCBRs. This comparison provides a process-based perspective on how glacier influence may affect organic matter deposition and burial efficiency in Greenland fjord sediments, and how these processes connect pelagic production to benthic carbon storage. In addition, spatial gradients in these parameters within each fjord help reveal the extent of glacial influence, as most meltwater discharge occurs in the inner fjord regions.
2.1 Study area
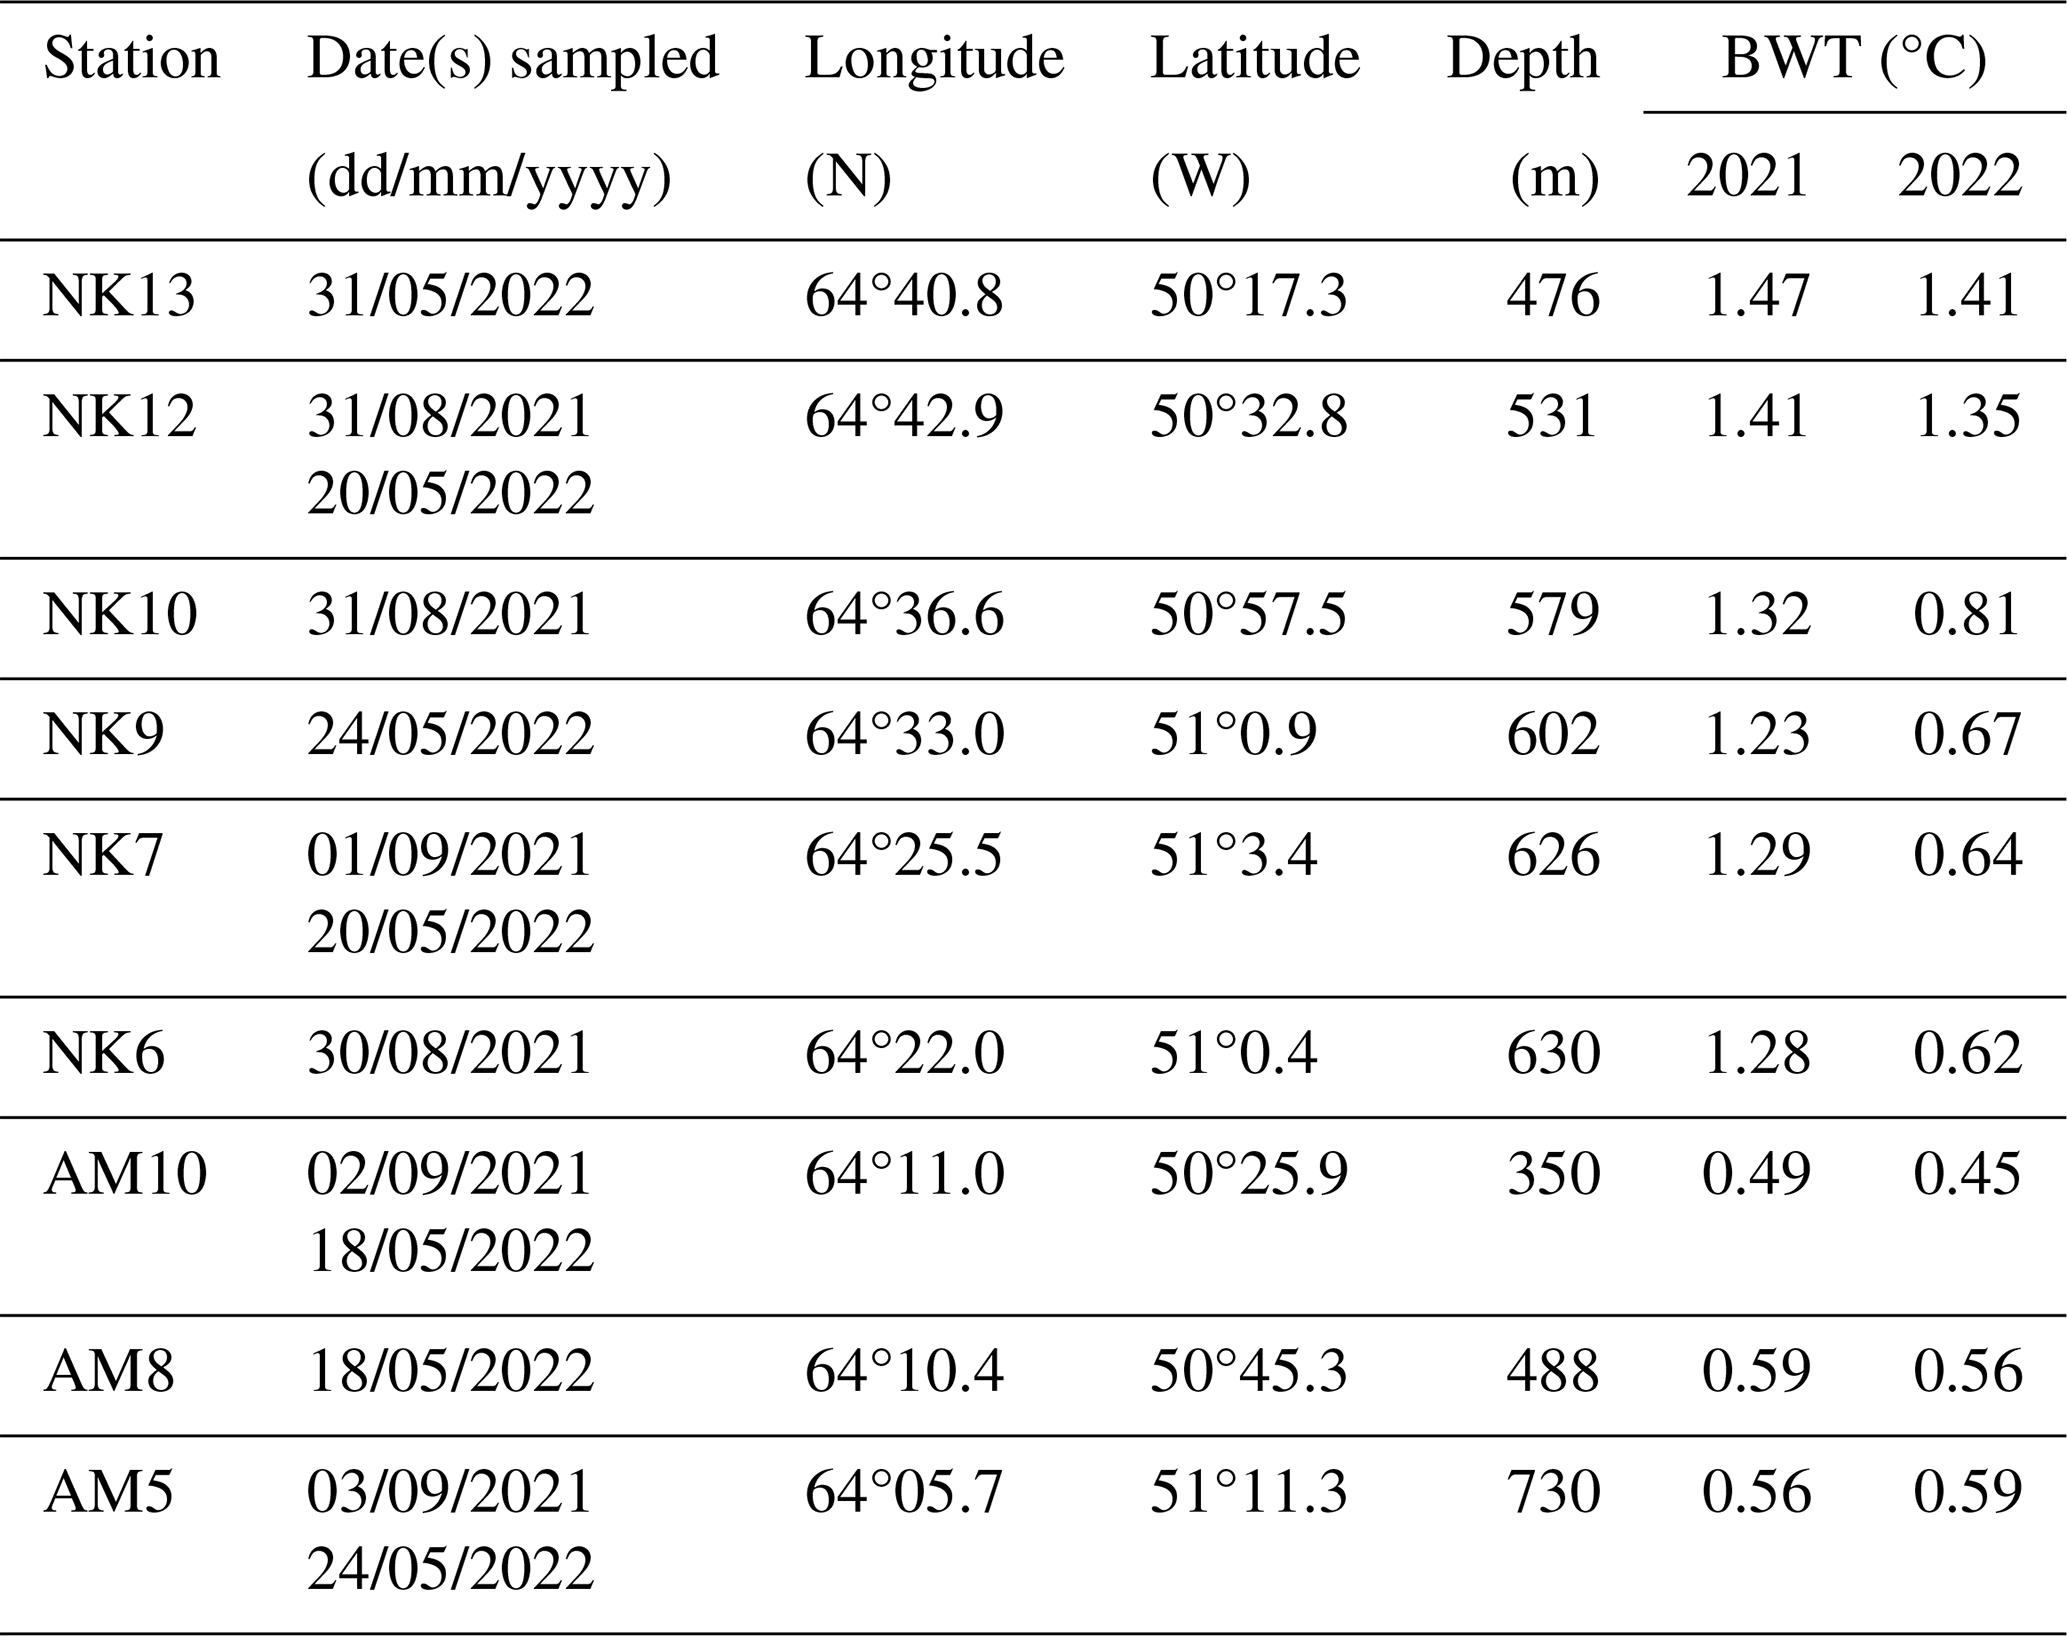
The two studied fjord systems are situated in the sub-Arctic coastal region of Southwest Greenland. Covering an area of 2013 km2, Nuup Kangerlua (formerly known as Godthåbsfjord) forms, with its many side branches, the largest fjord system of West Greenland (Mortensen et al., 2018). The main branch is ∼ 190 km long. Three marine-terminating glaciers and three meltwater rivers discharge into the fjord (Mortensen et al., 2011; Fig. 1). The land-terminating glaciers release 7.5 ± 2.1 km3 yr−1 of freshwater into the fjord system, while the marine-terminating glaciers supply 18.4 ± 5.8 km3 yr−1 of freshwater in addition to 7–10 km3 yr−1 of solid ice discharge (Van As et al., 2014; Langen et al., 2015). The seafloor morphology comprises two consecutive sills at the fjord entrance (Fig. 1) and a third sill located in the inner fjord area in front of the termini of the two innermost MTGs (Mortensen et al., 2011). Inflow of dense coastal waters renews basin water masses in the main fjord basin usually from November until April (Mortensen et al., 2011, 2014, 2018). Bottom water temperatures were situated between 1 and 1.5 °C in summer 2021, and 0.6 and 1.5 °C in spring 2022 (Table 1).
Ameralik is situated south of Nuup Kangerlua, and has a length of around 75 km and a surface area of 400 km2 (Stuart-Lee et al., 2023). The fjord receives most of the freshwater runoff from a meltwater river (Naujat Kuat) draining an inland glacier. Overeem et al. (2015) measured in 2012 a discharge of 0.78 km3 yr−1 of Naujat Kuat into the fjord. A large sill is situated at the mouth of Ameralik and rises to 110 m water depth (Stuart-Lee et al., 2021). Being more than twice as shallow compared to the entrance sills in Nuup Kangerlua, the sill restricts inflow of relatively warmer and more saline sub-polar mode water (SPMW), resulting in bottom water temperatures below 1 °C (Stuart-Lee et al., 2021; Table 1). The seafloor geomorphology behind the sill consists of a series of basins with the deepest and more extensive basin situated about 20 km inwards from the main sill. Within this basin, the bathymetry plummets to a water depth of approximately 730 m.
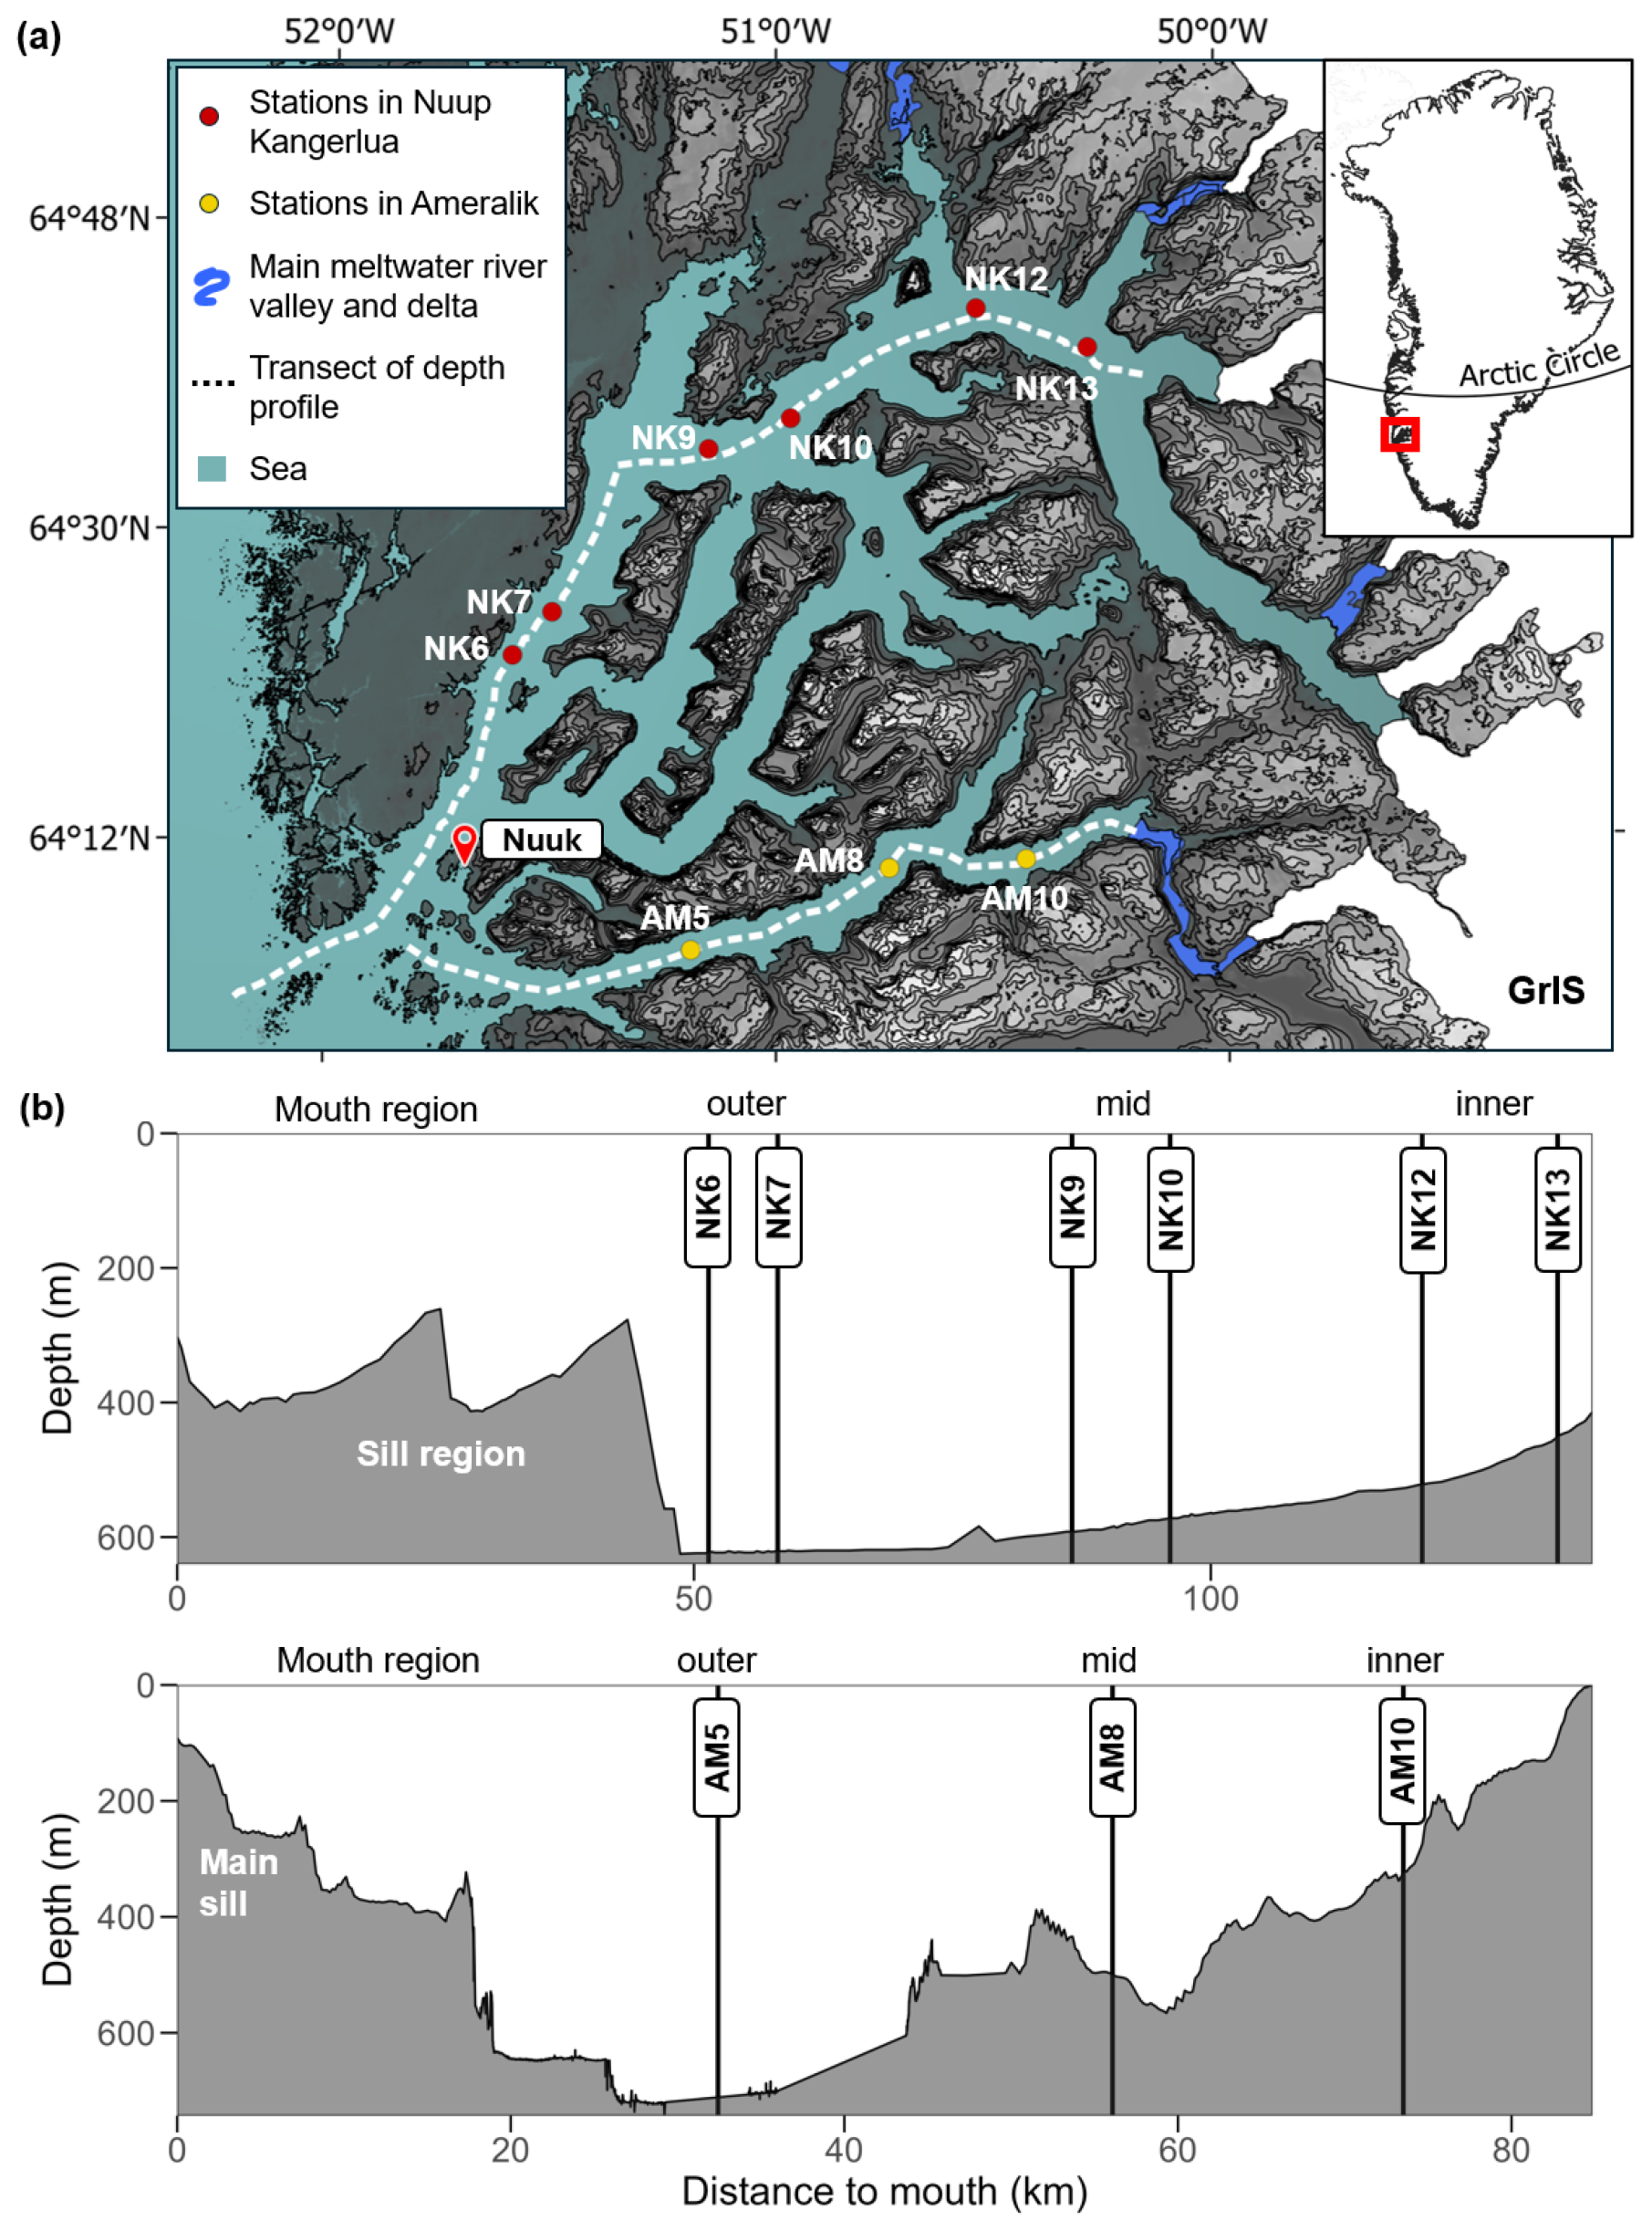
Figure 1(a) Map showing sampling locations in Nuup Kangerlua (fed by three marine-terminating glaciers and three land-terminating glaciers) and Ameralik (receiving meltwater from a land-terminating glacier). Greenland Ice Sheet (GrIS) is depicted in white. (b) Water depth profiles along-axis (white dashed lines) Nuup Kangerlua (top) and Ameralik (bottom). Both fjord basins are divided in an outer, mid and inner section behind the entrance sill(s).
2.2 Sediment sampling
Two field campaigns were organized, one in summer 2021 and one in spring 2022. Sediment samples were taken from the research vessels Polar Diver (2021) and Avataq (2022). A UWITEC multicorer (UWITEC GmbH, Austria) was deployed to sample the seafloor and included three core liners with an inner diameter of 8.6 cm. Stations were located along the main axis of both fjords (Fig. 1). No successful deployments could be carried out at the sill areas situated at the mouth area of both fjords due to the high abundance of gravel. Sampled stations are therefore located behind the sills, within the fjord basin. Although the mouth areas of both fjords could not be sampled, we divided each fjord basin into “outer,' “mid,” and “inner” sections for clarity. Throughout the text, the terms “outer,” “mid,” and “inner” refer to specific station locations. For Nuup Kangerlua, the “outer” area corresponds to stations NK6 and NK7, the “mid” area to NK9 and NK10, and the “inner” area to NK12 and NK13. In Ameralik, the “outer”, “mid”, and “inner” fjord areas correspond to stations AM5, AM8, and AM10, respectively. It is important to note that earlier studies (e.g., Mortensen et al., 2011, 2014, 2018; Meire et al., 2015, 2017; Stuart-Lee et al., 2021, 2023) referred to the same stations in Nuup Kangerlua using the prefix “GF”, derived from the Danish name “Godthåbsfjord”. In this study, we use the prefix “NK” instead, to reflect the Greenlandic name “Nuup Kangerlua”.
Core sampling and processing
At each station, three deployments were carried out for granulometry, pigment, total organic carbon (TOC) and total nitrogen (TN) analysis and one deployment for porosity and 210Pb analysis and for stable isotope analysis of TOC and TN. Fewer sediment stations were sampled in 2021 compared to 2022; however, bottom water temperature measurements were obtained in both years (Table 1). The retrieved sediment was sliced into 1 cm slices down to 10 cm sediment depth. Sediment intended to derive sediment accumulation rates (210Pb analysis) was further sliced beyond 10 cm in intervals of 2 cm until the end of the core (ranging from 10 to 44 cm sediment) ensuring sufficient material for reliable 210Pb activity detection above background levels. All samples were stored at −20 °C, except for sediment samples intended for pigment analysis, which were stored at −80 °C.
Table 1Sampling dates, coordinates, water depth, and bottom water temperatures (BWT) of sampled stations in Nuup Kangerlua (NK) and Ameralik (AM).
2.3 Sediment analysis
Grain size, porosity and dry bulk density were measured to provide insights into the physical structure and depositional environment of the sediment column. High porosity typically indicates fine-grained, loosely packed sediments with higher water content, which are common in low-energy depositional environments. Conversely, lower porosity may suggest coarser, more compacted sediments, potentially reflecting higher-energy conditions or post-depositional consolidation. Grain size distribution was determined on oven-dried samples (at 60 °C for 48 h). After homogenization, coarse material >2 mm was removed by sieving. A subsample of 0.1–1 g was resuspended in water and analyzed using a Malvern Mastersizer 2000 with the Hydro 2000S module (size range: 0.02–2000 µm), which operates based on laser diffraction. The sample was sonicated for 60 s to prevent flocculation of clays before it goes through the laser. No pretreatment to remove organic or inorganic carbon was performed prior to analysis. Grain size fractions were classified according to the Wentworth scale (1922) as clay (<4 µm), silt (4–63 µm), and sand (63–500 µm).
Sediment porosity was estimated gravimetrically using a modified water displacement method. A pre-weighed 10 mL graduated measuring cylinder was filled with 2–5 g of homogenized wet sediment. After addition of ultrapure water (Milli-Q) to the 10 mL mark (measured by the lower meniscus), the cylinder was weighed again. The sample was then dried at 80 °C for ∼ 48 h and reweighed. Porosity (ϕ) was calculated based on the difference between the wet sediment weight and the dry sediment weight (i.e., the mass of porewater), recalculated to pore water volume through correction for salinity and divided by the estimated volume occupied by the sediment (calculated as 10 mL minus the volume of water added). Dry bulk density was obtained by dividing dry mass by bulk volume.
To determine total carbon (TC), TOC and TN, sediment samples were oven-dried at 60 °C for 48 h ground using mortar and pestle, and homogenized. Between 20–35 mg of dried and homogenized sediment was weighed and placed into pre-weighed silver cups. For TC and TN analysis, silver cups were sealed by folding with tweezers into compact spheres to ensure complete combustion. For TOC analysis, carbonate removal was performed by stepwise acidification: 2–3 drops of increasing concentrations of HCl (1 %, 2 %, 5 %, and 10 %) were added sequentially using a glass pipette. After each addition, samples were dried at 60 °C for 1 to 2 h. This procedure was repeated over 2–3 d until no bubbling was observed and carbonate removal was confirmed. All measurements were conducted using a Flash 2000 NC Sediment Analyzer (Interscience), which quantifies carbon and nitrogen via dynamic flash combustion and chromatographic separation. TOC and TN contents are reported as percent of dry sediment weight (%). From these data, the molar C:N ratios were calculated dividing TOC by TN and inorganic carbon (IC) was determined by subtracting TOC from TC. To investigate the origin of the organic matter (see Sect. “Calculation of marine organic carbon fraction”), stable isotope composition, δ13C (‰ deviations from V-PDB) and δ15N (‰ deviations from air), was measured with an elemental analyzer (Thermo Flash EA1112 elementanalyzer) coupled to an isotope ratio mass spectrometer (Thermo Finnigan Delta V, IRMS). Prior to analysis, the same steps were followed as for TOC and TN analysis, except samples were freeze dried.
To explore how glacier type affects marine primary productivity and whether and how it is incorporated in the sediment, we additionally measured, for each sediment slice, the content of chlorophyll-a (Chl-a) and of its degradation products (pheophorbide-a, and pheophytin-a, pheophorbide-a like, and pheophytin-a like following Wright and Jeffrey (1997). For pigments extraction, 2 mL acetone (90 %) was added to 0.5 g freeze dried sediment under red light conditions preventing pigment degradation. The samples were subsequently sonicated for 30 s and incubated overnight at 4 °C in the dark to aid pigment release. Afterwards, the samples were centrifuged (10 min, 4000 rpm, 4 °C) and the supernatant was passed through 0.2 µm PTFE filters. Pigment separation was performed using an HPLC system (Agilent 1200 Infinity II, Agilent Technologies) equipped with a cooled auto-sampler, column oven, photodiode array detector, and fluorescence detector, following the method of Van Heukelem and Thomas (2001). Chlorophyll-a and its degradation products were identified at 665 nm wavelength. Individual pigment concentrations were determined using the response factors of the respective standards. The ratio of Chl-a to Chloroplastic Pigment Equivalent (CPE, comprising the sum of all aforementioned pigments) was used as a proxy for the “freshness” or lability of photosynthetically produced organic matter (Schubert et al., 2005; Koho et al., 2008).
Calculation of marine organic carbon fraction
Stable isotope composition in addition to C:N ratios of settled organic matter in fjord sediments has been used in multiple studies to estimate the proportion of marine versus terrestrially derived organic matter (St-Onge and Hillaire-Marcel, 2001; Hinojosa et al., 2014; Koziorowska et al., 2015; Smeaton and Austin, 2017; Zaborska et al., 2018; Faust and Knies, 2019; Limoges et al., 2020; Placitu et al., 2024). Terrestrial organic matter, primarily derived from vascular plants, tends to have higher C:N ratios (>12) and more depleted δ13C values (−25 ‰ to −30 ‰ δ13C) due to the dominance of lignin-rich, cellulose-based material and the use of C3 photosynthesis pathways (Lamb et al., 2006). In contrast, marine organic matter, originating from phytoplankton and other aquatic organisms, typically shows lower C:N ratios and less negative δ13C values (−18 ‰ to −24 ‰ δ13C), reflecting a protein-rich composition and different carbon fixation mechanisms (Lamb et al., 2006). However, the use of solely stable isotopes can render an overestimation of marine OM as eroded and reburied fossil carbon from rocks (petrogenic carbon) display δ13C values within the range of recent marine OM masking a marine fossil provenance (Burdige, 2007; Cui et al., 2016b; Wang et al., 2024). The bedrock of the catchments of both fjords is predominantly made up of Precambrian orthogneisses, granodiorites and granites. Potential sources of petrogenic carbon like meta-sedimentary rocks occur, but are rather rare in the catchment areas (<0.1 % of exposed bedrock) (Næraa et al., 2014). Therefore, it is reasonable to assume that the input of ancient carbon is likely to be limited. The catchments of both fjords consist of tundra shrub vegetation, which are typically C3 plants.
Published δ13C values for terrestrial plant material in Greenland remain limited, but available data indicate a range of −33.9 ‰ to −26.9 ‰ (Thompson et al., 2018). We adopted −26.9 ‰ as the terrestrial δ13C end-member, as this value falls within the typical Arctic range of −27.0 ‰ to −26.8 ‰ (Ruttenberg and Goñi, 1997; Naidu et al., 2000; Winkelmann and Knies, 2005; Knies and Martinez, 2009; Koziorowska et al., 2015). For marine organic matter, compiled high-latitude datasets indicate median δ13C values of particulate organic carbon around −24 ‰, with most reported values falling between approximately −19.8 ‰ and −26 ‰ (Verwega et al., 2021). Due to the scarcity of δ13C records specific to Greenland's marine organic matter, we used a marine δ13C end-member value of −20.6 ‰. This value represents the reported Arctic-average δ13C signature of sedimentary organic matter (Winkelmann and Knies, 2005) and has previously been applied as a marine end-member in Arctic fjord studies (Koziorowska et al., 2015). Given the limited availability of site-specific end-member data for Greenland fjords, fixed Arctic-average end-member values were adopted to provide first-order estimates of organic matter source contributions. These calculations are intended to indicate relative source dominance rather than precise quantitative fractions.
The fraction of OC derived from terrestrial C was calculated following the formula of Thornton and McManus (1994):
and
where δ13Ci represents the surface sediment values (0–2 cm) of δ13Corg of each sample, δ13CM is the marine end-member and δ13CT is the terrestrial end-member. Only the upper 0–2 cm was used to be able to compare with literature.
2.4 210Pb and 137Cs analysis
Lead-210 dating of the sediment was done using HPGe gamma ray spectroscopy (diameter: 101.6 mm, height 134.9 mm, carbon-epoxy window, model BE5030-7500SL-RDC-4, Canberra, Asse, Belgium). The dried and grinded sediment samples were packed into aluminium tins with calibrated geometries of 35 mL, 60 mL or 120 mL, depending on the amount of dried sediment available, and left for >21 d after sealing allowing ingrowth equilibration of the 226Ra with the proxies used to estimate its activity (214Pb and 214Bi) (Brenner et al., 2004). When tins could not be filled entirely, the headspace was measured accurately, and an empirical model per geometry was used to correct for change in efficiency. The measurement of 210Pb activity was done using its 46.5 keV gamma peak as described by Cutshall et al. (1983). The contribution of “supported” 210Pb was assessed by estimating the 226Ra activity from the average of the 214Pb (at 295.2 and 351.9 keV) and 214Bi (at 609.3 keV) activities. Supported 210Pb was then subtracted from the total 210Pb for each depth interval to determine “excess” 210Pb (210Pbex). Additionally, 137Cs levels were determined through gamma spectroscopic measurement of its 661.7 keV gamma peak.
Organic carbon burial rate
Natural-log-transformed 210Pbex activities were plotted against cumulative dry mass depth (g cm−2) for each station. Sedimentation rates at stations AM5, AM8, NK7, and NK9 were determined using the constant rate of supply (CRS) model (Appleby, 2001; Fig. A1), as a distinct increase in 137Cs was detected at these sites (Fig. A2), supporting the CRS-based chronology. The observed increase in 137Cs activity is attributed to global fallout from atmospheric nuclear weapons testing, which peaked in 1963. In contrast, the CF:CS (constant flux:constant sedimentation) model (Sanchez-Cabeza and Ruiz-Fernández, 2012) was applied to stations NK10, NK12, NK13, and AM10, where the 210Pbex profiles exhibited approximately exponential trends but lacked a clearly defined 137Cs peak. For these stations, ln-transformed 210Pbex activities were plotted against cumulative dry mass depth (g cm−2) for each station (Fig. A3). As a result, the sedimentation rate estimates for these stations should be treated with caution and verified in future studies. Mass accumulation rates (MAR, kg m−2 yr−1) were derived from the slope of the linear regression (for CF:CS) or from the CRS model output. Bulk sediment accumulation rates (SAR, mm yr−1) were calculated by dividing MAR by the average bulk density at each station. Organic carbon burial rates (OCBRs) were then calculated by multiplying MAR by the TOC content at the 9–10 cm sediment layer.
We did not apply corrections for bioturbation or mixing processes, as the 210Pbex profiles do not show evidence of such activity in the upper sediment layers. However, these processes cannot be conclusively ruled out, particularly since some of the 137Cs profiles feature broad activity peaks. Nonetheless, the 210Pb-derived chronology appears to be supported by the 137Cs profiles in AM5, AM8, NK7 and NK9 (Smith, 2001; Barsanti et al., 2020). The broad 137Cs curves or inflections, marking sustained elevation in 137Cs activity after an initial increase followed by a gradual decrease moving up the sediment column, are therefore more likely explained by continued exposure of settling particles to residual 137Cs in the overlying water after 1963. As a result, younger sediment layers also contain measurable amounts of 137Cs, smearing the signal across multiple horizons. This phenomenon has been observed in other marine settings (Tamburrino et al., 2019) and even in lake sediments (Drexler et al., 2018).
2.5 Statistical analysis
We examined differences between the two fjords and among stations in terms of sedimentary TOC and TN content, C:N ratio, Chl-a content and Chl-a:CPE ratio, using data from both the upper 2 cm sediment surface and the arithmetic mean of the upper 10 cm sediment column. Data from summer (2021) and spring (2022) were combined and treated as replicates, as the difference between the two seasons was insignificant (Welch's ANOVA, p>0.05; see further). As a consequence, stations NK12, NK10, NK7, AM10 and AM5 have six replicates since they were sampled in both seasons, while the other stations have three replicates as those stations were only sampled during spring 2022 (Table 1). Statistical analyses were performed using one-way ANOVA. Welch's ANOVA was applied when variances were unequal, and the Kruskal-Wallis test was used when normality assumptions were violated. For significant results, post hoc comparisons were made using Tukey's test, Games-Howell test, or Dunn's test, depending on the initial method. Results are reported as means ± standard deviation. In addition to the environmental parameters, the OCBRs were averaged for each fjord, and a two-sample t-test was used to assess whether the mean values differed significantly between the two fjords. Statistical analyses were performed in R (R Core Team, 2023) using the car, rstatix and FSA packages (Fox and Weisberg, 2019; Kassambara, 2023; Ogle et al., 2023).
3.1 Sediment parameters
The median grain size (d0.5) was situated in the silt fraction for all stations, though AM5, AM8 and the top 2 cm of NK7 displaying medium-sized silt, while all other stations are situated in the very fine to fine silt class (Fig. 2). In Nuup Kangerlua, the median grain size (d0.5) exhibits a modest spatial trend from the inner to the outer fjord (Fig. 2). At the inner stations (NK13 and NK12), grain size remains relatively small (<20 µm) and consistent with depth, reflecting a stable depositional environment dominated by fine particles. Grain size at the mid-fjord stations (NK10 and NK9) is slightly larger but still within the fine-silt range, indicating only subtle hydrodynamic variation. At the outer stations (NK7 and NK6), grain size increases slightly further and shows more variability with depth, which may reflect localized influence of bottom currents or episodic input of coarser particles near the fjord mouth. Overall, differences in grain size between stations are relatively small, but a general trend toward coarser material at the fjord's outer reaches is observable. In Ameralik, a similar trend is observed (Fig. 2). The inner station (AM10) shows small, uniform grain sizes comparable to those at the inner stations in Nuup Kangerlua. At the mid-fjord station (AM8), the grain size increases slightly, reflecting a subtle shift in depositional energy. The outer station (AM5) exhibits the largest grain sizes, with variability between replicates, indicating more pronounced hydrodynamic conditions and fluctuations in this area. Porosity and dry density generally fluctuated with sediment depth without a consistent pattern across most stations. In contrast, station NK10 exhibited the expected trend of decreasing porosity and increasing dry density with depth. These variations appeared to be influenced by grain size, although the processes driving the trends at NK10 are less clearly linked to sediment texture.
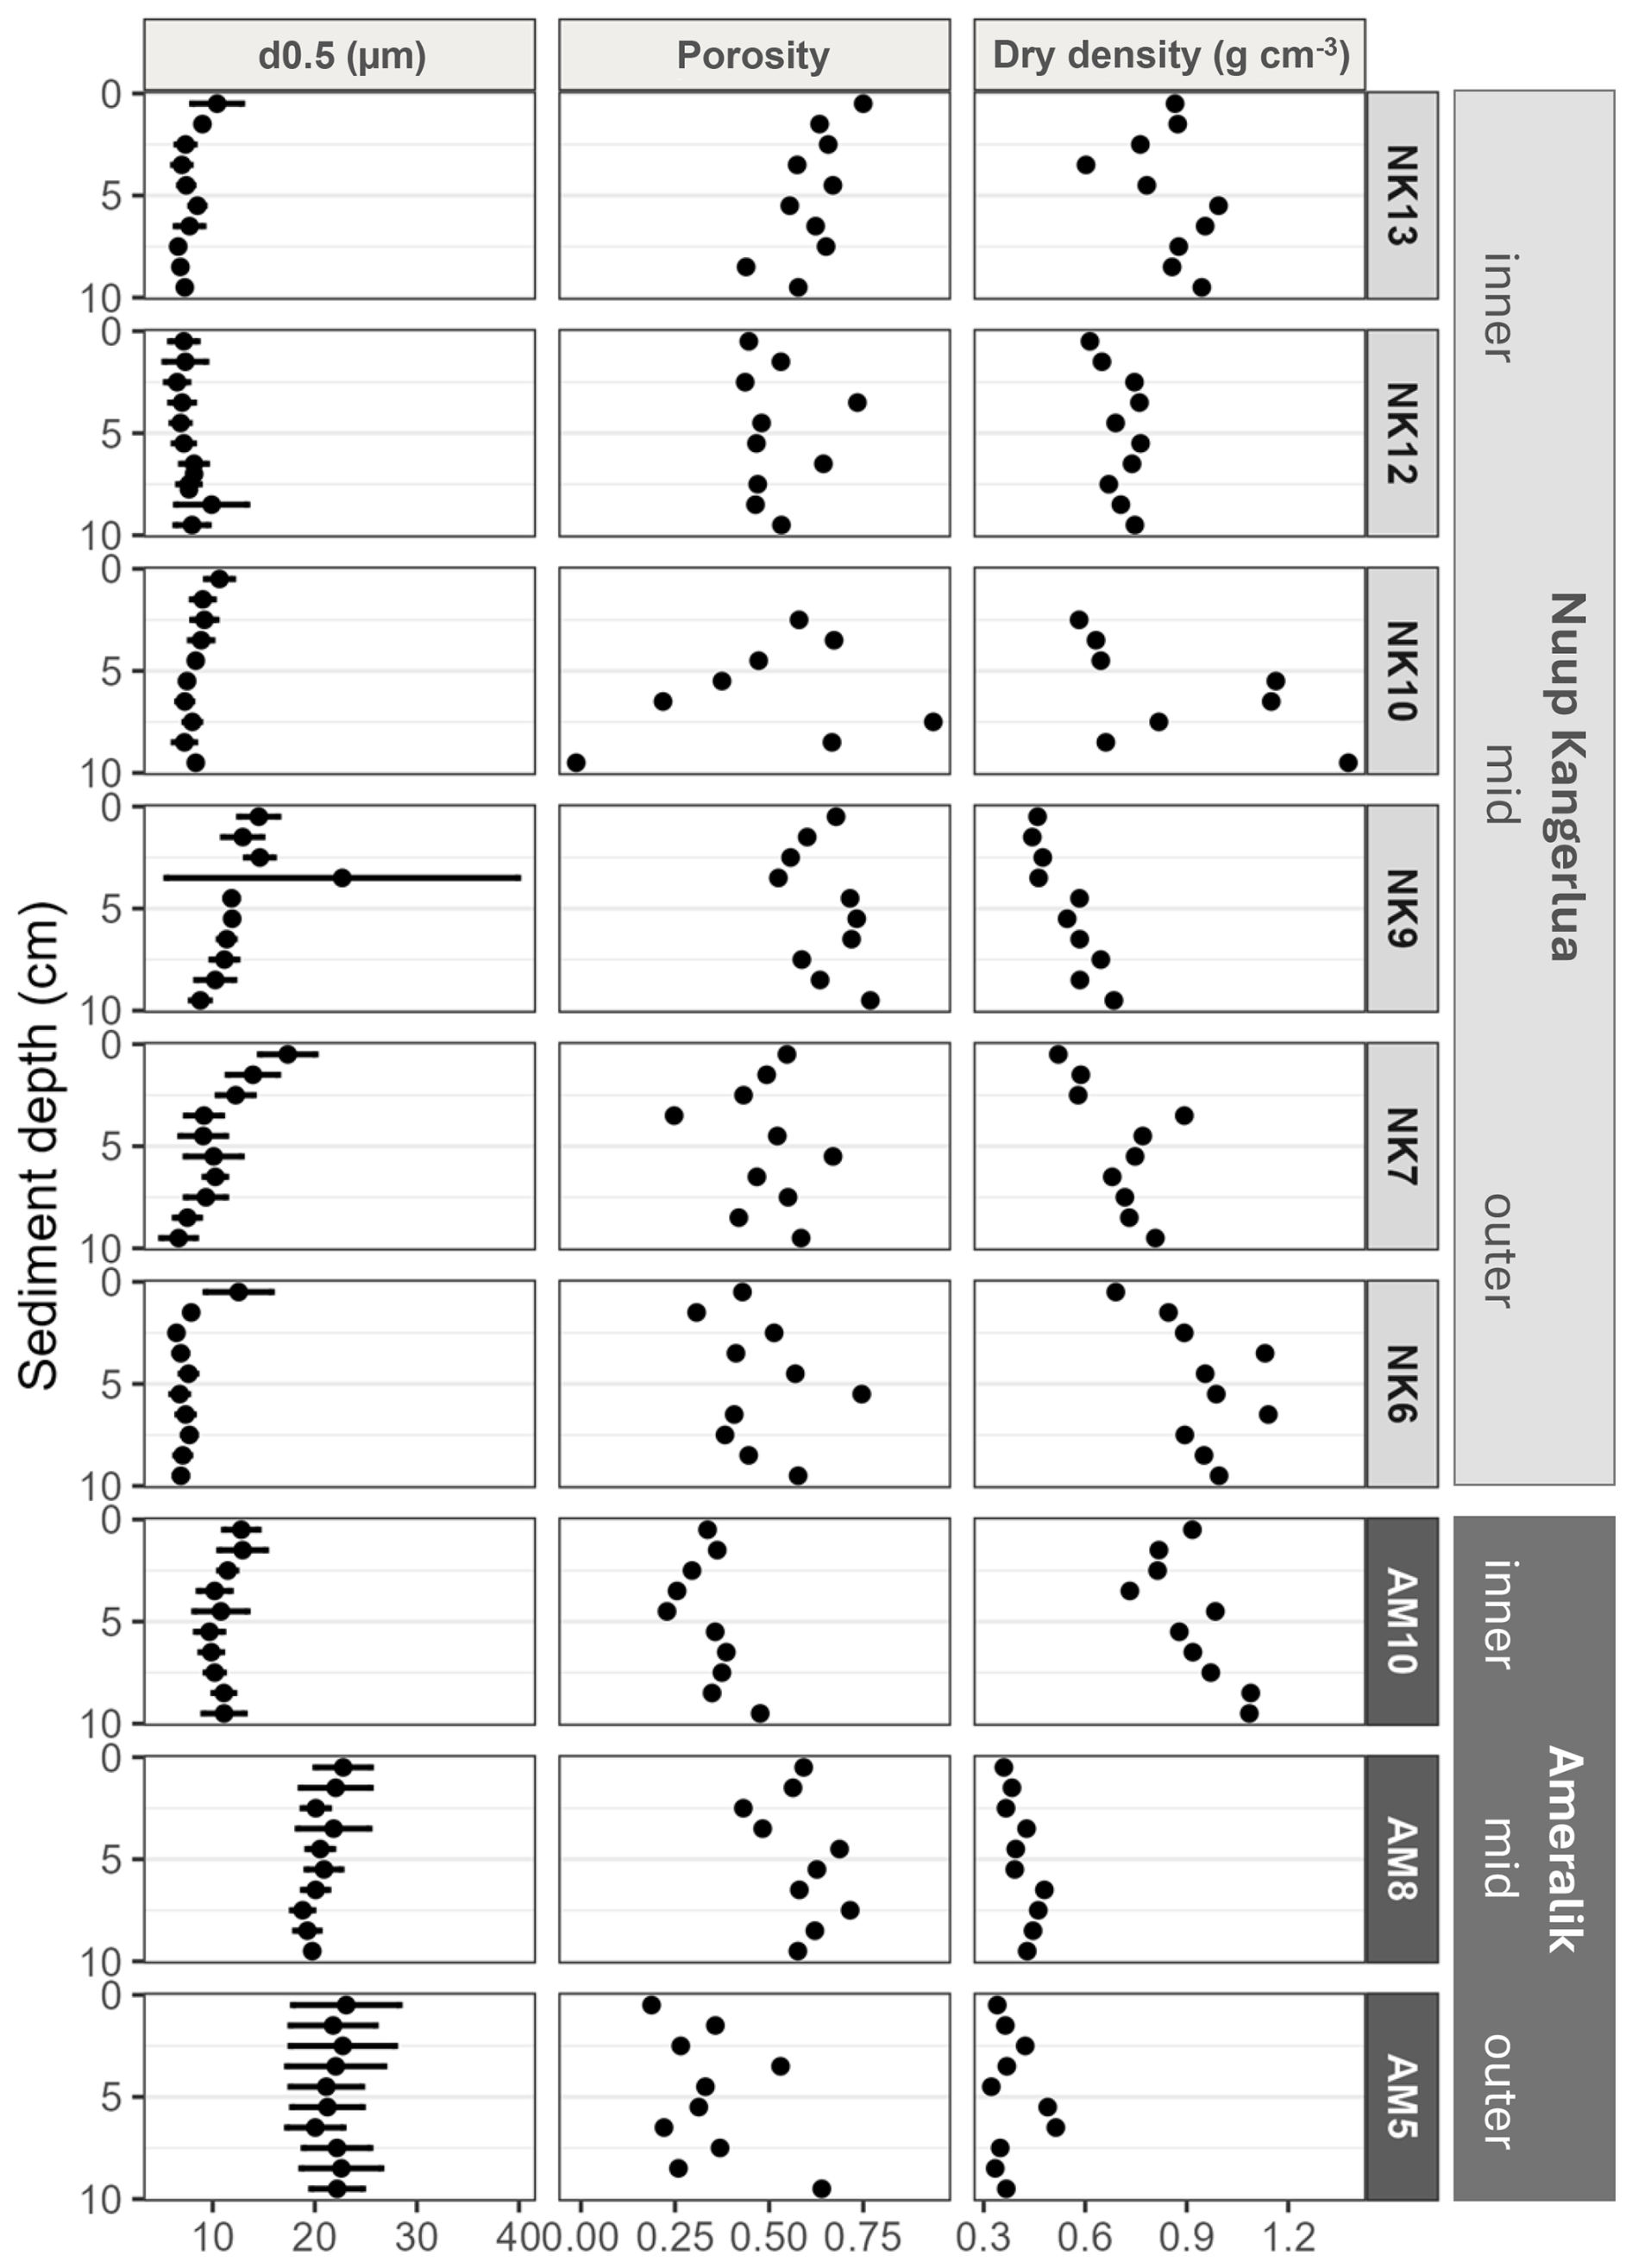
Figure 2Sediment profiles of median grain size (µm), porosity and dry density (g cm−3) of Nuup Kangerlua (NK stations) and Ameralik (AM stations). Error bars represent SD (n=3 for NK6, NK9, NK13 and AM8 and n=6 for NK7, NK10, NK12, AM5 and AM10). Only one replicate for porosity and dry density.
In Ameralik, we observed a distinct increasing trend in the surface 2 cm sediments from the inner fjord to the mid-fjord stations for TOC, TN, Chl-a content, and the Chl-a:CPE ratio. The only exception was the C:N ratio, which decreased from the inner to the mid-fjord, and then remained relatively constant (Fig. 3). In Nuup Kangerlua, the pattern was more variable. TOC, TN, and Chl-a content rose from the inner fjord towards the mid-fjord stations, peaking at NK7 and NK9, but then declined at NK6, at the outer fjord area (Fig. 3). Unlike Ameralik, the Chl-a:CPE ratio in Nuup Kangerlua showed fluctuations along the fjord axis, without a consistent trend. Overall, station AM5, located in the deepest part of the main basin of Ameralik, displayed the highest (Welch's ANOVA, p<0.05) Chl-a (16.4 ± 2.0 µg g−1 DM) and CPE (45.9 ± 7.1 µg g−1 DM) content, as well as the highest Chl-a:CPE ratios (0.36 ± 0.04) of the top 2 cm surface sediments compared to all other sampled stations of both fjords (Fig. 3). In addition, both outer and mid stations of Ameralik displayed the highest TOC values (AM5: 2.1 ± 1.5 %; AM8:1.6 ± 0.1 %) within the upper 2 cm sediment, which were significantly higher (Welch's ANOVA, p<0.05) than those observed in inner fjord station AM10 and all stations in Nuup Kangerlua (values ranging from 0.1 % to 1.3 %).
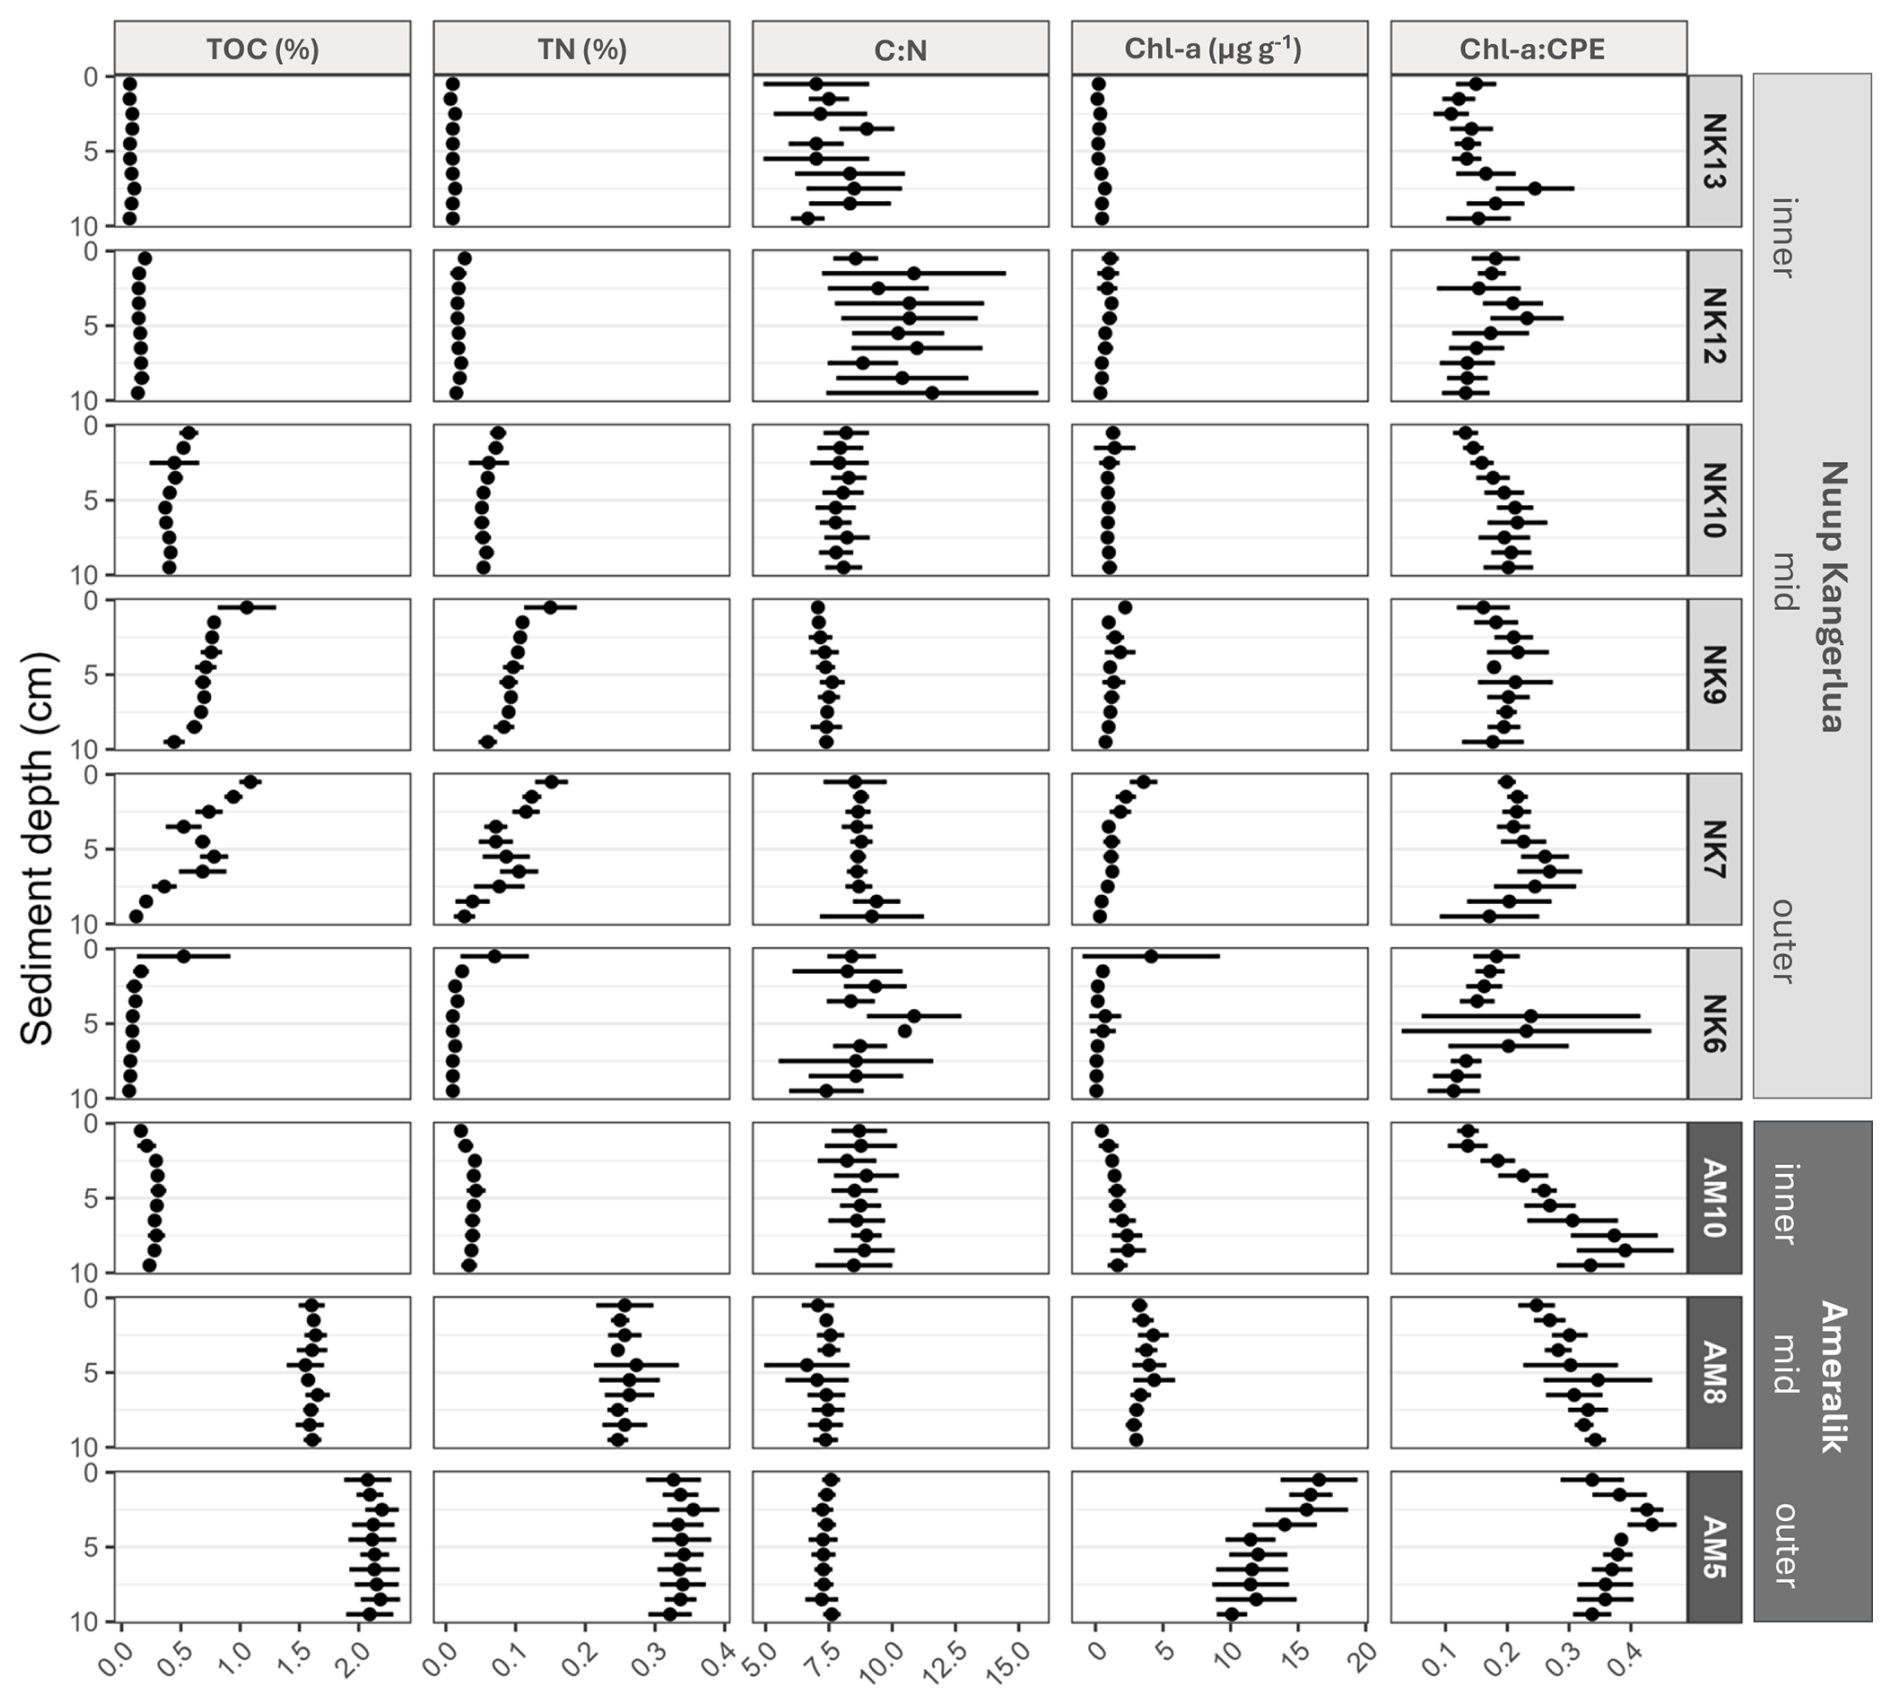
Figure 3Vertical sediment profiles depicting TOC and TN (%), molar C:N ratios and Chl-a (µg g−1 DM) of the upper 10 cm sediment of Nuup Kangerlua (NK stations) and Ameralik (AM stations). Error bars represent SD (n=3 for NK6, NK9, NK13 and AM8 and n=6 for NK7, NK10, NK12, AM5 and AM10).
Apart from NK13, OC at all stations in both fjords displayed δ13C values consistent with a predominantly marine origin, ranging from −22.4 ‰ to −20.7 ‰. Stations NK12 and AM10, both located closer to glacial inputs, showed slightly more depleted δ13C values, indicating a minor shift toward a terrestrial signal (Fig. 4). While the δ13C value fluctuated widely at NK13 ranging from −26.3 to −23.8 ‰, indicating a stronger terrestrial influence and a more heterogeneous mixture of organic matter sources. Notably, δ15N at this station increased consistently with depth, from 5.7 ‰ to 12.2 ‰ (Figs. 4a, A4). The depleted δ13C values support enhanced mixing with terrestrial organic matter, while the elevated δ15N values are more typical of marine sources, as they remain well above the 1 ‰ threshold commonly associated with terrestrial inputs. The absence of intensive agriculture in the region, which could otherwise lead to anthropogenic δ15N enrichment, supports this interpretation (Harris and Elliot, 2019). Together, the isotopic trends at NK13 suggest a dynamic depositional setting with varying contributions from glacial runoff and in-situ marine production.
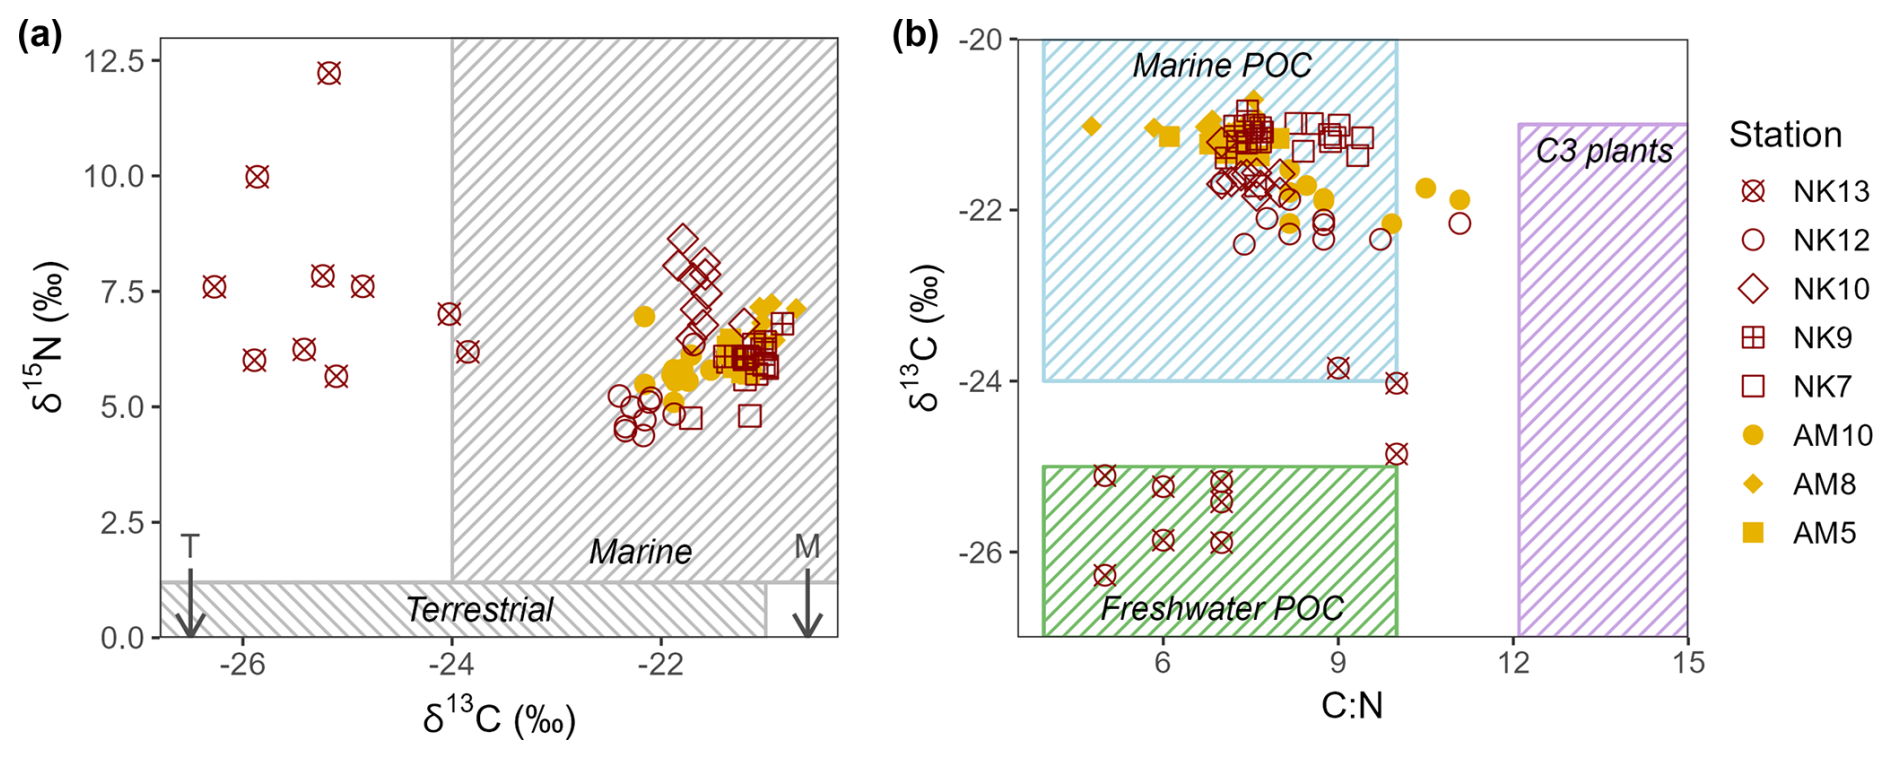
Figure 4(a) δ13C (‰ deviations from V-PDB) values plotted against δ15N (‰ deviations from air) values of the POM present in the sediment for the different station of Ameralik (filled symbols) and Nuup Kangerlua (open symbols). Typical marine and terrestrial ranges of δ13C (Lamb et al., 2006) and δ15N (Zaborska et al., 2018) are indicated with rectangles. (b) δ13C plotted against C:N ratios. Ranges of marine and freshwater POC, and C3 terrestrial plants are displayed as rectangles for reference (values taken from Lamb et al., 2006). Marine (M) and terrestrial (T) δ13C end-members used in this study are indicated with arrows.
3.2 Organic carbon burial rates
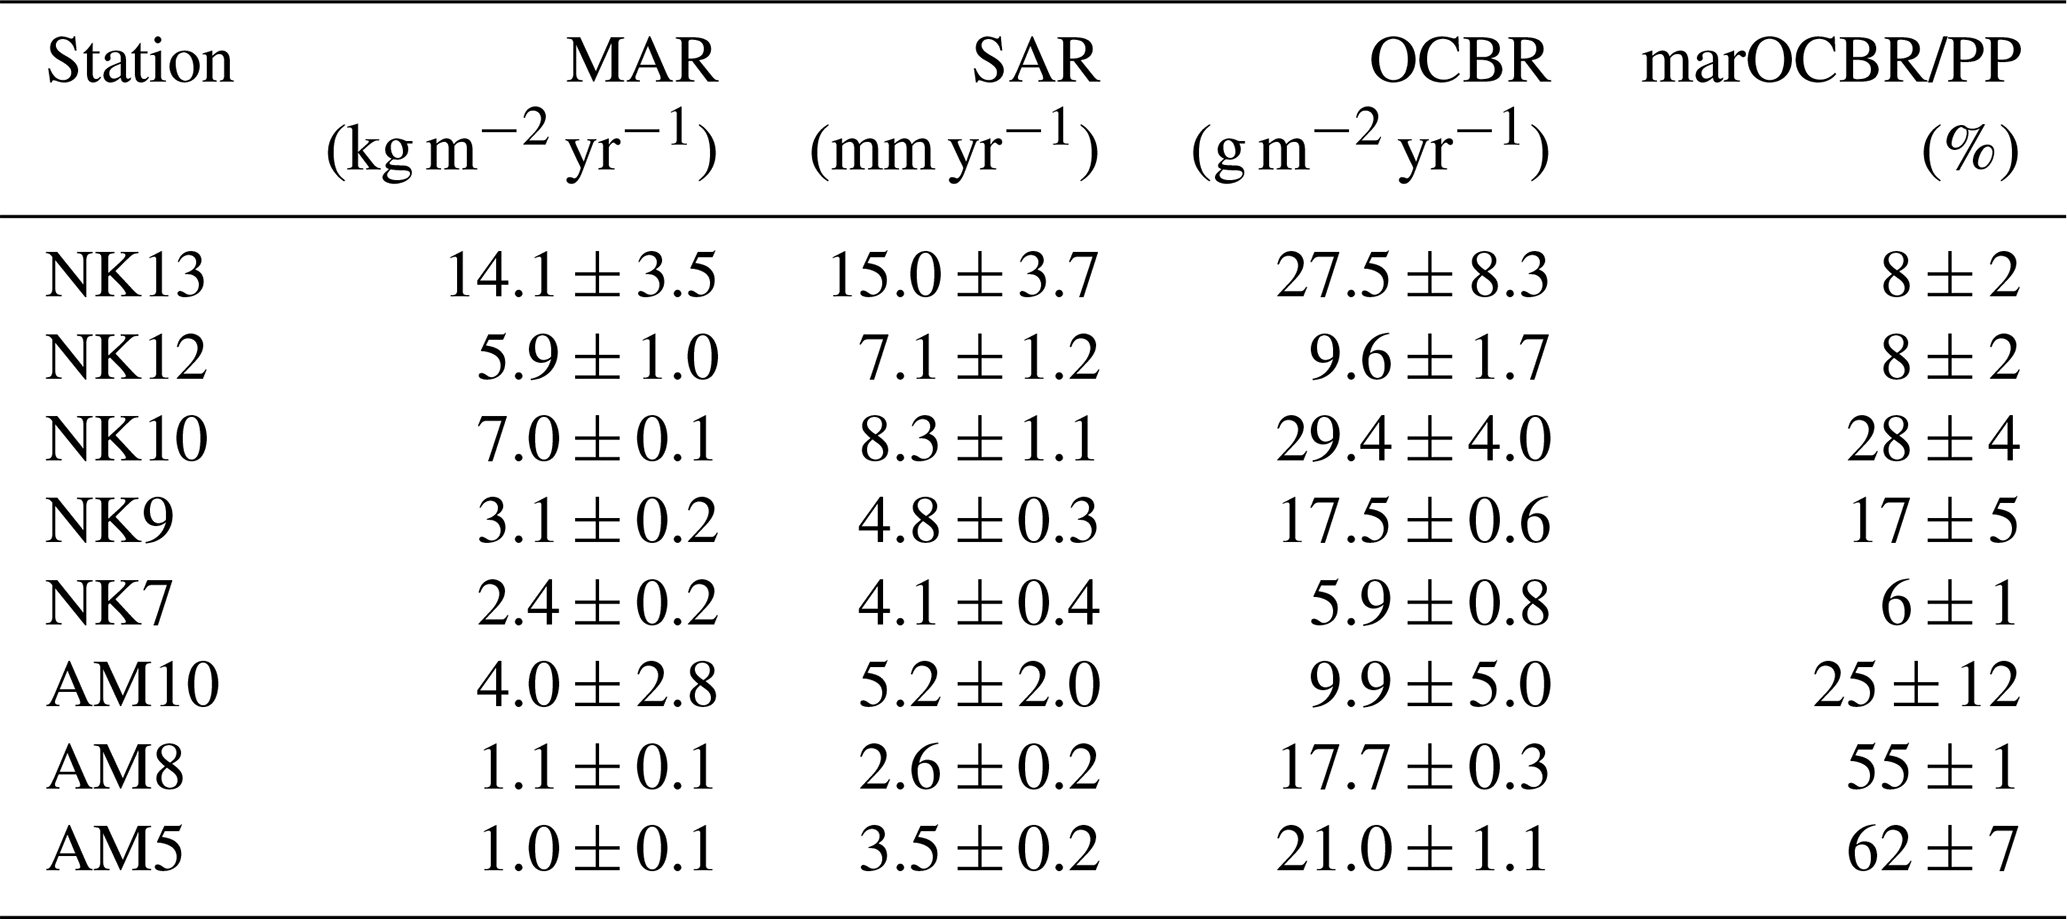
Sediment mass (MAR) and volume accumulation rates (SAR) roughly showed an increasing trend towards the inner fjord in Nuup Kangerlua. In Ameralik, MAR and SAR are also higher in the inner compared to the outer station, with minimum values in the mid station (Table 2). Burial rates of organic carbon increased towards the fjord head in Nuup Kangerlua until mid-fjord station NK10 where it reached the maximum observed rate (29.4 g OC m−2 yr−1). Following station NK12 revealed a marked drop in OCBR (9.6 g OC m−2 yr−1), whereafter high OCBR reappear in NK13 (27.5 g OC m−2 yr−1). In Ameralik, an opposite pattern unfolded with maximum OCBR in AM5 (21.0 g OC m−2 yr−1) and minimum rate in inner fjord AM10 (9.9 g OC m−2 yr−1). Note that the accumulation rates at stations NK10, NK12, NK13, and AM10 are estimates based on the CF:CS model and were not validated with independent time markers (Smith, 2001; Barsanti et al., 2020). Therefore, these estimates should be confirmed in future studies. The fraction of marine-derived OC buried relative to total primary production (estimated at 90 g C m−2 yr−1 for Nuup Kangerlua and 30 g C m−2 yr−1 for Ameralik; Meire et al., 2023) indicates that a substantial portion of primary production is buried at station NK10 (28 %), with the lowest fractions observed at the inner and outer stations (Table 2). In Ameralik, consistently high burial fractions of marine OC were recorded across the fjord, reaching a maximum of 62 % at the outer station AM5.
Table 2Mass sediment accumulation rate (MAR), volume sediment accumulation rate (SAR), organic carbon burial rate (OCBR), and the fraction of marine OC buried relative to the total primary production per station. The CRS method was applied at stations NK7, NK9, AM5, and AM8, while the CF:CS method was used for stations NK10, NK12, NK13, and AM10. “NK” denotes Nuup Kangerlua and “AM” Ameralik. Results are presented with analytical uncertainties.
With this study we wanted to identify to what extent the higher surface water productivity in a fjord with an MTG is reflected in carbon burial potential of the fjord sediments. We therefore expected higher OC content and OCBRs in sediments of Nuup Kangerlua compared to Ameralik, as MTGs present in Nuup Kangerlua increase nutrient upwelling, allowing primary productivity to extend over longer periods. Indeed, earlier studies by Stuart-Lee et al. (2023) and Meire et al. (2023) noted comparable primary productivity in Nuup Kangerlua and Ameralik at the start of the productive season (April, May). Yet, with increasing meltwater discharge, a summer bloom was observed in Nuup Kangerlua which led to a greater overall phytoplankton biomass compared to Ameralik (Stuart-Lee et al., 2023; Meire et al., 2023). However, in this study, we found a higher OC content in sediments of outer and mid fjord stations AM5 and AM8 in Ameralik compared to Nuup Kangerlua. These findings are supported by observations from a gravity core sampled nearby station AM5, which also revealed similar elevated carbon content in the sediment (Møller et al., 2006). Our results show that the fjord receiving input from three MTGs and three LTGs does not have a higher carbon burial rate than the fjord influenced by a single land-terminating glacier.
4.1 Surface sediment OC content
The OC content in the sediments of Nuup Kangerlua and Ameralik is representative for (sub-)Arctic fjord sediments (Fig. 5a). In terms of fresh organic matter, we found an average Chl-a content in Nuup Kangerlua's sediments which was slightly below the typical range observed in other North Atlantic fjords (Włodarska-Kowalczuk et al., 2019). In contrast, Ameralik exhibited an average Chl-a content nearly three times higher than the maximum values reported for Svalbard fjords (Włodarska-Kowalczuk et al., 2019). This elevated average is largely driven by the exceptionally high Chl-a content observed at station AM5.
So far, studies comparing MTG and LTG fjord systems are limited (Koziorowska et al., 2015; Laufer-Meiser et al., 2021). These studies suggest that MTG fjords tend to exhibit higher OC accumulation, as indicated by elevated OC content in surface sediments. However, when comparing the LTG system Ameralik and the MTG system Nuup Kangerlua with datasets from other fjords (Smith et al., 2002; Thamdrup et al., 2007; Koziorowska et al., 2015; Cui et al., 2016a; Faust and Knies, 2019; Włodarska-Kowalczuk et al., 2019; Laufer-Meiser et al., 2021), we observed that surface sediment OC content in LTG and even non-glaciated fjords can be comparable to that of MTG systems across the (sub-)Arctic region (Fig. 5a). Nevertheless, it is important to note that LTG fjords are underrepresented in current datasets, and low-glacial-activity MTG systems may bias comparative interpretations.
These observations suggest that factors beyond glacial influence play a significant role in controlling the degree of benthic-pelagic coupling. Specifically, the presence of MTGs does not inherently result in higher OC accumulation within sediments compared to systems without subglacial upwelling. However, elevated MARs dilute OC content with inorganic material, potentially skewing these observations. Additionally, higher TOC content in surface sediments does not automatically equate to more efficient OC burial.
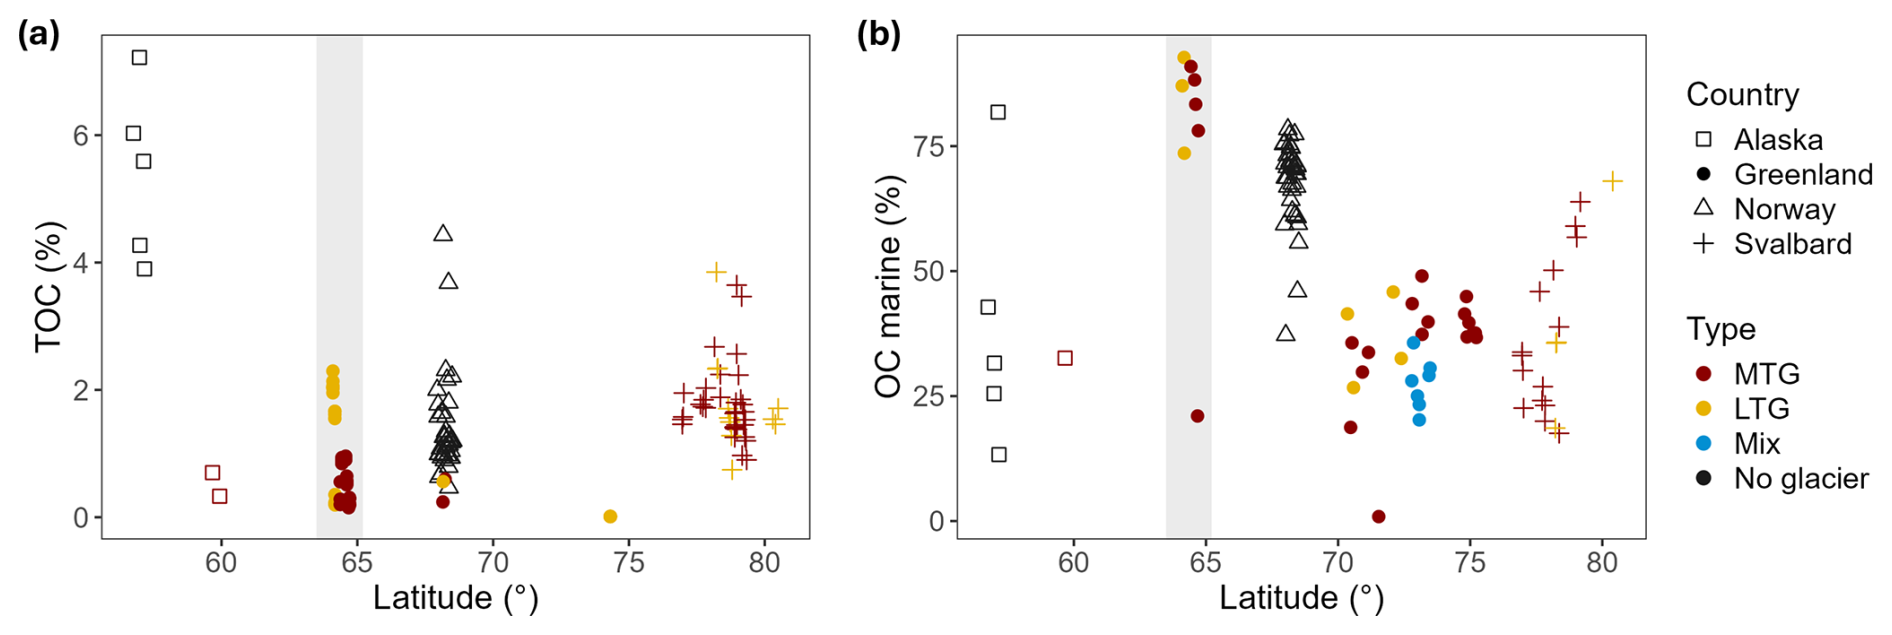
Figure 5(a) TOC content of surface sediments along latitude. Data compiled from Smith et al. (2002), Thamdrup et al. (2007), Koziorowska et al. (2015), Cui et al. (2016a); Faust and Knies (2019), Włodarska-Kowalczuk et al. (2019), Laufer-Meiser et al. (2021) and this study. (b) Fraction of TOC of marine origin along latitude. Data compiled from Koziorowska et al. (2015), Faust and Knies (2019) and this study. Both figures display data from fjords located in high latitude countries: Alaska, Greenland, Norway and Svalbard. The grey band constraints the Greenland fjords investigated in this study. Data indicated in red and yellow represent Marine terminating-glacier (MTG) and land terminating-glacier (LTG)-influenced fjord systems, respectively. The mixed type represents fjords where the dominance of MTG(s) vs LTG(s) on the fjord's hydrology could not be differentiated from literature or satellite images are depicted in blue. Non-glacial fjords are represented in black. Both graphs were created following and updating the example of Faust and Knies (2019).
OC origin
An important clue in resolving the observed patterns can be found in the deepest part of Ameralik's basin. There, specifically at station AM5, we measured a five times higher Chl-a content combined with 1.7 times higher Chl-a:CPE ratios compared to the maximum values in sediments of Nuup Kangerlua, which points to an enhanced preservation of fresh organic matter (i.e. more labile OC) within these sediments. The Chl-a content remained elevated throughout the entire 10 cm sediment profile and was consistent between spring and summer data. A difference in timing of the onset of the phytoplankton bloom between the two fjords, as previously observed (Stuart-Lee et al., 2023), could have led to an earlier build-up of pigments at the seafloor of Ameralik compared to Nuup Kangerlua at the time of sampling. However, the relatively elevated values throughout the 10 cm sediment profiles and the consistency between spring and summer data exclude such sampling time bias. In Svalbard, Koziorowska et al. (2015) also observed higher OC content in the surface sediments of an LTG-influenced fjord versus an MTG-impacted fjord. The LTG-fed fjord appeared to receive a higher fraction of terrestrial OC, which tends to be more resistant against degradation compared to marine OC (Wakeham and Canuel, 2006; Koziorowska et al., 2015). Yet, in our case, the sediment stable isotope composition and C:N ratios of both fjords reflect OC of predominantly marine origin in both fjords, likely due to the limited vegetation and a catchment geology consisting of orthogneisses, granodiorites and granites rather than organic-rich sedimentary rocks (Næraa et al., 2014). Despite the increase in shrub vegetation observed in Greenland during recent decades (Grimes et al., 2024), our data do not indicate a substantial contribution of terrestrial OC to the sediments of both fjords (Figs. 4; 5b). An exception is inner station NK13 in Nuup Kangerlua, which displayed δ15N of marine signature, though depleted δ13C values which, combined with C:N values, indicated a freshwater provenance (Fig. 4b). Since elevated δ15N values can also be caused by degradation (Dai et al., 2005), this station may contain OC more of terrestrial origin. In contrast, the stable isotope composition found at the head of Ameralik, in front of the land-terminating glacier, does not indicate a dominant terrestrial input.
So in general, the higher OC content in Ameralik sediments is not related to increased terrestrial input in the LTG-influenced fjord compared to the MTG-dominated fjord. In fact, sediments from both fjords receive OC from predominantly marine origin.
4.2 Organic carbon burial rates
Despite the higher OC content observed in the outer and mid part of the LTG-fed fjord, OCBRs were similar in both fjords due to the relatively higher MARs in Nuup Kangerlua. The higher MARs in Nuup Kangerlua result from the substantially higher discharge that three MTGs and three LTGs generate compared to the input of a single LTG in Ameralik. The average OCBR in Nuup Kangerlua was only slightly higher (18.0 ± 1.6 g OC m−2 yr−1), but not significantly (t-test, p>0.05), compared to Ameralik (16.2 ± 1.7 g OC m−2 yr−1). However, it must be noted that glacial run-off induced lithogenic dilution of OC can lead to an underestimation of OCBR in Nuup Kangerlua. Nevertheless, the observed values fall within the range of sub-Arctic fjords and Arctic fjords impacted by active glaciers (Włodarska-Kowalczuk et al., 2019).
On the local scale, Meire et al. (2023) estimated that annual pelagic primary production in 2016 was approximately three times higher in a head station of Nuup Kangerlua (∼ 90 g C m−2 yr−1 at NK10) than in a head station of Ameralik (∼ 30 g C m−2 yr−1 at AM10). Similarly, our results show that the OCBR at this very same station NK10 was about three times higher than at AM10. However, at basin scale, carbon burial remains similar in both fjords. The amount of marine OC buried throughout Nuup Kangerlua ranged from 6 % to 28 % of the annual primary production as reported by Meire et al. (2023) (90 g C m−2 yr−1). These values are comparable to those observed for fjords in Svalbard and northern Norway (Włodarska-Kowalczuk et al., 2019). In contrast, sediments in Ameralik displayed a higher burial efficiency of marine OC, ranging from 25 % to 62 % of annual primary production, suggesting more effective OC preservation in this LTG-influenced fjord (30 g C m−2 yr−1; Meire et al., 2023). These findings underscore that carbon burial dynamics in glacial fjords arise from multiple interacting factors, and that surface productivity and glacier type alone are insufficient to explain the observed patterns. The following section explores these additional processes, such as fjord morphology, bottom water conditions, and organic matter preservation, that may contribute to the observed variability.
4.3 Pelagic and geomorphological influence on OC burial
OC burial in fjord sediments is shaped not only by surface productivity but also by complex interactions between water column processes, fjord morphology, and bottom water conditions. There are several processes potentially at work leading to a decoupling of OC production in the water column and OC burial in the fjord sediments as discussed further and summarized in Fig. 6.
4.3.1 OC preservation conditions
The distinct geomorphology of Ameralik and Nuup Kangerlua, particularly their differing sill depths, shapes bottom water exchange and temperature regimes, which can influence organic matter preservation. Both fjords have no anoxic deep-water masses, and bottom water renewal occurs every one to two years (Mortensen et al., 2011; Stuart-Lee et al., 2021). However, Ameralik's shallower sill depth (∼ 110 m) compared to Nuup Kangerlua (∼ 200 m) restricts the inflow of warmer, saltier coastal waters (Stuart-Lee et al., 2021), resulting in slightly lower bottom water temperatures (∼ 0.5 °C in Ameralik vs. ∼ 1.3 °C in Nuup Kangerlua during spring sampling). While such temperature differences may contribute to the higher pigment and OC preservation observed in the slightly colder bottom waters of Ameralik, their overall impact is likely modest. Arctic microbial communities are well adapted to low temperatures, and mineralization rates below 10 °C differ only minimally (Thamdrup et al., 2007; Scholze et al., 2020). Nevertheless, the relationship between temperature, water renewal, and preservation remains worth considering, as studies from Svalbard fjords have suggested higher pigment content in sediments associated with colder bottom waters (Krajewska et al., 2020).
Since most of the OC deposited in both fjords is of marine origin, any differences in organic matter preservation between them are likely driven by environmental conditions rather than by differences in the nature of the organic material itself.
4.3.2 Transport dynamics
Besides potential differences in organic matter preservation, lateral transport may also influence the spatial distribution of OC across the seafloor. In Nuup Kangerlua, weak along-fjord gradients in sediment TOC, TN, and Chl-a content suggest dynamic currents that may redistribute OC. Estuarine and subglacial circulations, most active during melt season, can enhance OC export from inner to outer fjord (Mortensen et al., 2011, 2014; Juul-Pedersen et al., 2015).
At both fjord mouths, tidal mixing over sills drives baroclinic circulation, reintroducing nutrients into surface waters, promoting outer fjord surface productivity (Stuart-Lee et al., 2021, 2023). This aligns with higher TOC and pigment content as well as higher Chl-a:CPE ratios in Ameralik's outer fjord sediments (AM5). In contrast, Nuup Kangerlua sediments show no similar increase in TOC and pigment content in sediments of NK6 and NK7.
Sørensen et al. (2015) proposed that high POC export in Kobbefjord, a nearby glacier-free fjord, may result from OC input from Nuup Kangerlua. A similar OC transfer might explain a higher TOC and Chl-a content in the sediments toward Ameralik's mouth. While both fjords have estuarine and baroclinic circulation, stronger subglacial upwelling in Nuup Kangerlua likely enhances OC transport efficiency towards the fjord mouth. Ameralik may thus receive OC from outside, with deep basin retention supporting OC preservation (Fig. 6). The slightly coarser grain size at Ameralik's mid and outer stations, despite their distance from glacial input, may indeed reflect input from the entrance sill. Furthermore, the topography of Ameralik with the deep depression behind the sill can promote downslope transport and sediment accumulation, resulting in the relative higher TOC and pigment content at AM5 (Hargrave and Kamp-Nielsen,, 1977; Wassmann, 1984; Erlandsson, 2008). Therefore, hydrodynamics, downslope transport, or a combination of both can decouple surface productivity from local sediment deposition. In addition, in Nuup Kangerlua, greater phytoplankton biomass and a larger size class may support a more complex and efficient food web compared to Ameralik (Meire et al., 2023; Stuart-Lee et al., 2023, 2024), resulting in more OC being consumed or remineralized before it reaches the seafloor (Fig. 6).
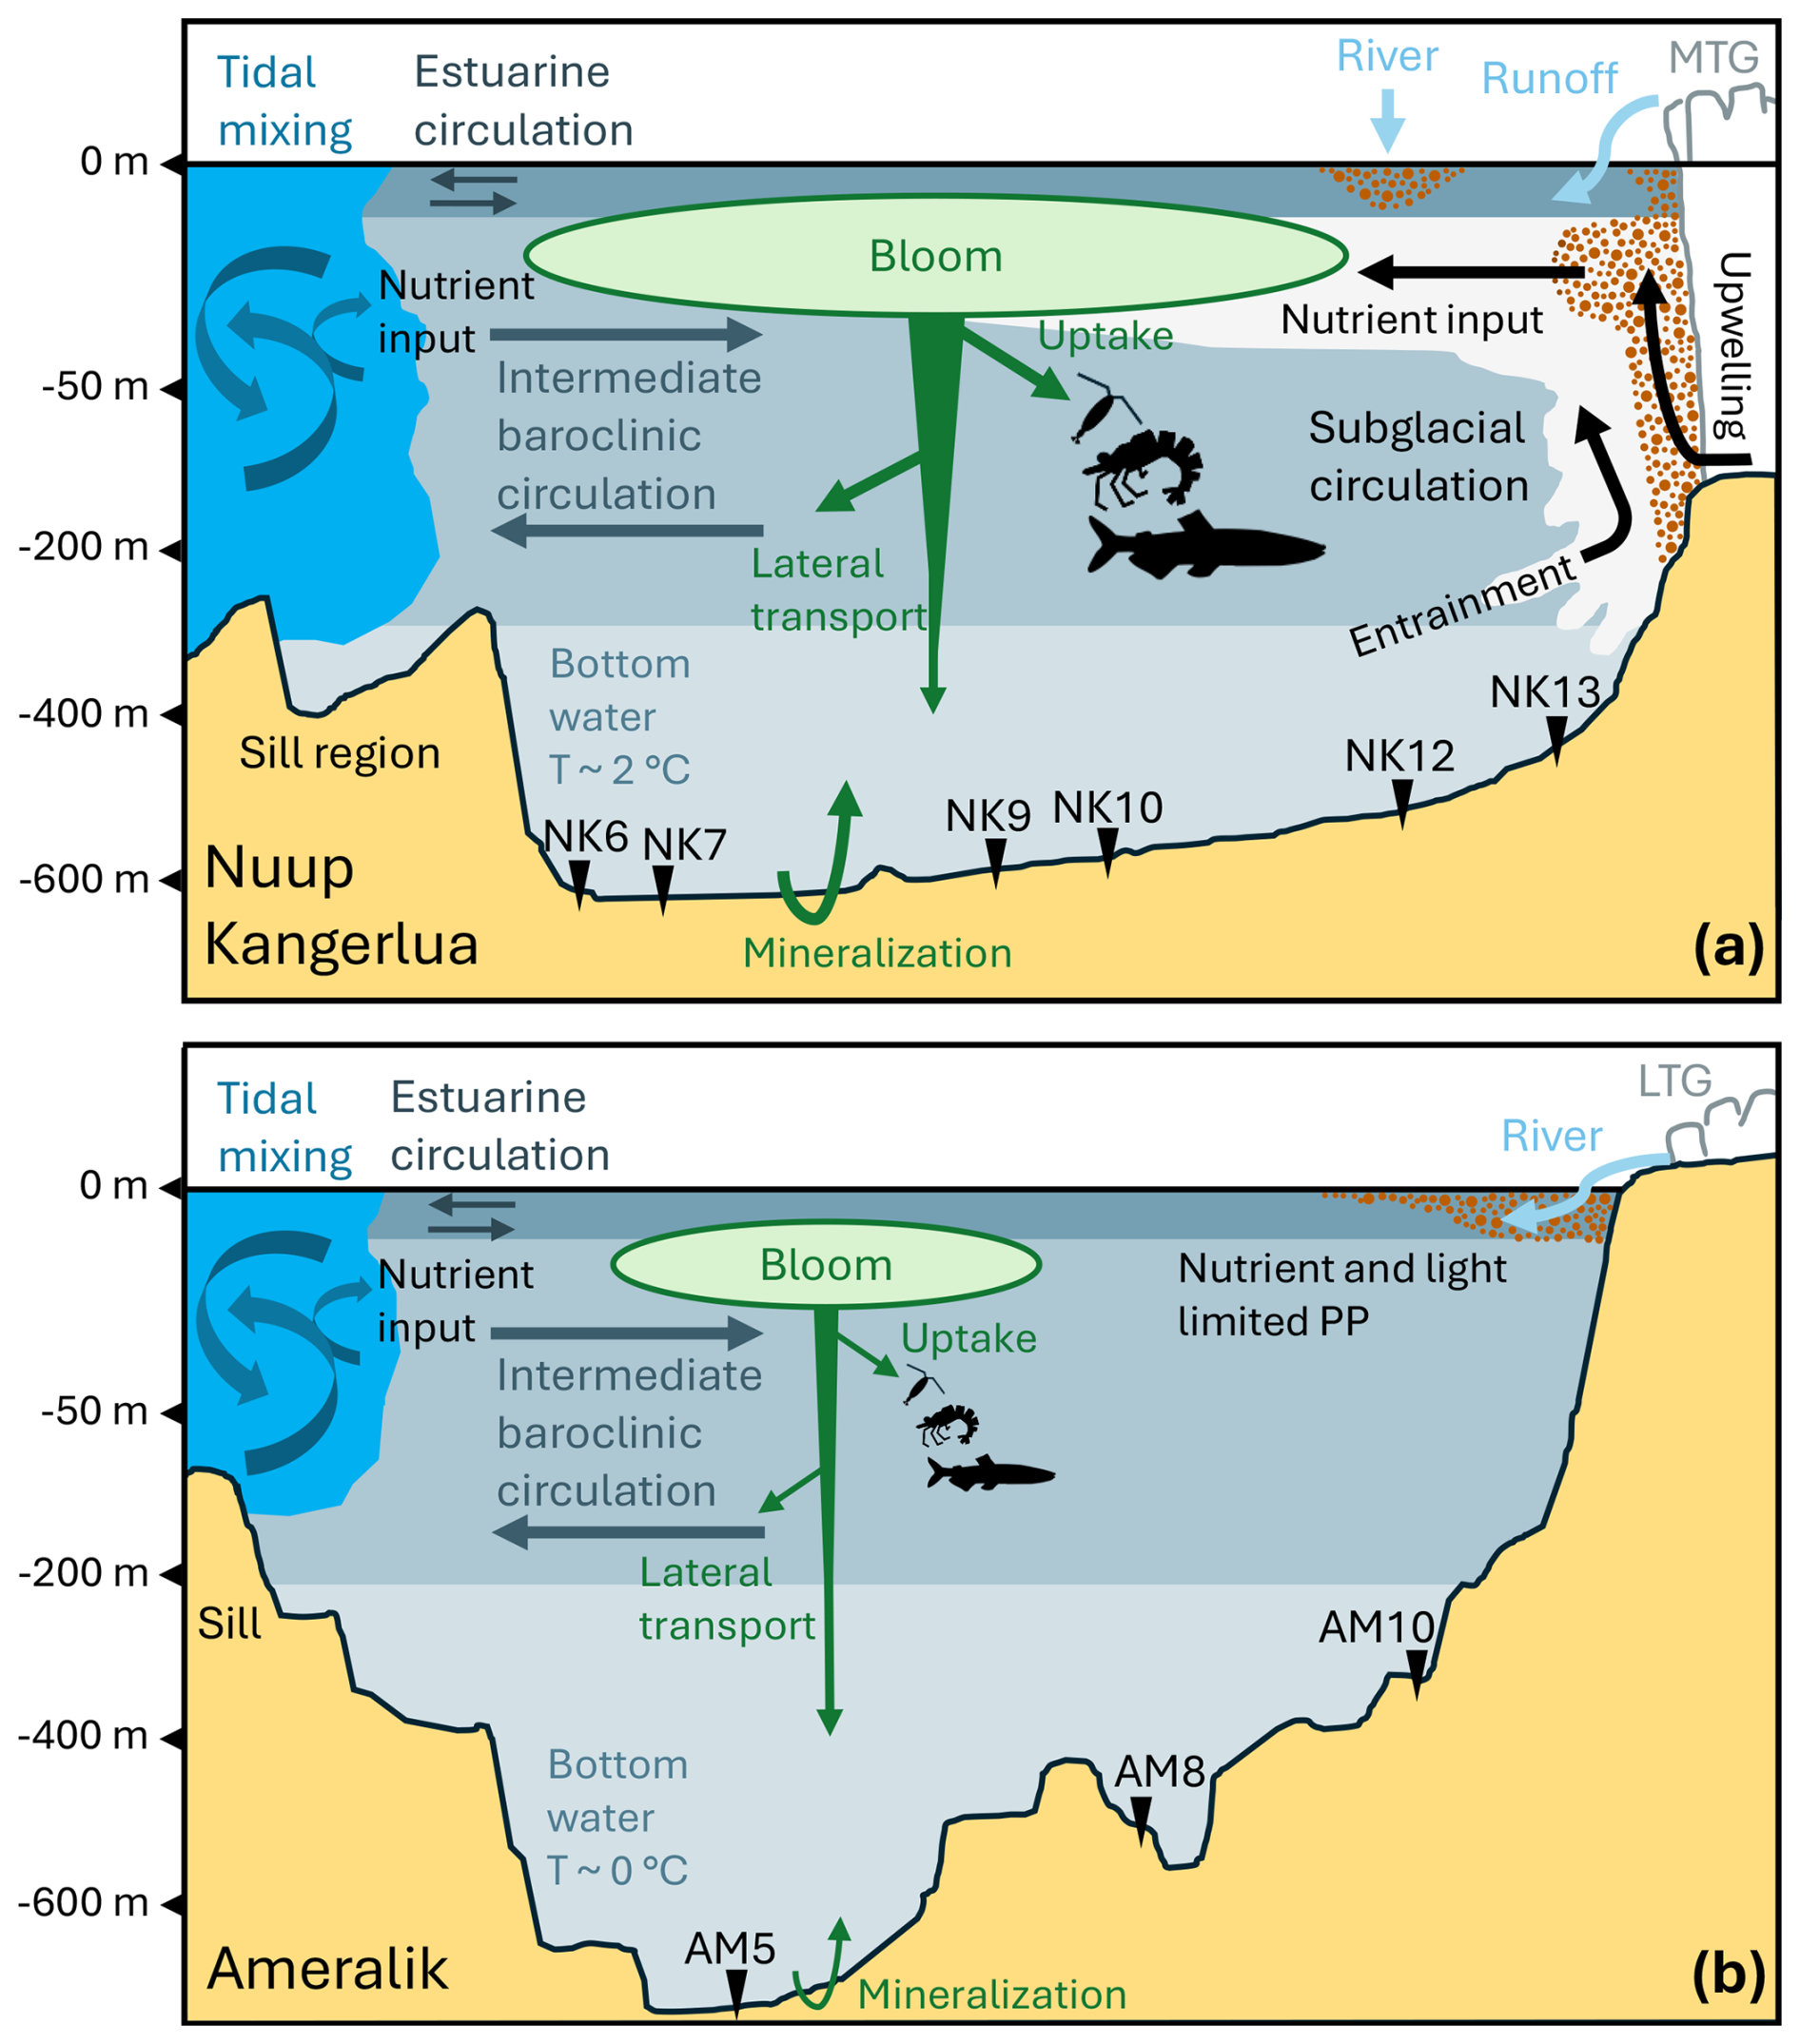
Figure 6Schematic cross-sectional view of current regime and possible ways of phytoplankton or OC flow during summer in Nuup Kangerlua (a) and Ameralik (b) fjord systems. Tidal mixing above the sill area, estuarine circulation and intermediate baroclinic circulation occurs in both fjord systems, while the presence of MTGs in Nuup Kangerlua drives subglacial circulation through subglacial discharge. Nutrients are brought to the euphotic zone via tidal mixing and subglacial circulation. Turbid plumes, indicative of suspended sediment and organic matter input from glacier discharge and river runoff, are represented by the brown dotted pattern. Green arrows represent phytoplankton or OC transport and remineralization of organic carbon at the sediment-water interface. A larger arrow points to higher expected flows. Station locations are marked along the fjords. The current dynamics illustrated for Nuup Kangerlua are based on Mortensen et al. (2018) and Stuart-Lee et al. (2023), while those for Ameralik are derived from Stuart-Lee et al. (2021, 2023).
Our results suggest that factors other than primary production and glacier type, such as sediment accumulation dynamics, lateral carbon transport, and benthic remineralization, play important roles in controlling OC burial in the two fjord systems. We therefore hypothesize that fjord systems influenced by MTGs facilitate greater lateral transport of autochthonous organic material and sustain more extensive carbon transfer through the pelagic food web than those fed by LTGs. To better constrain these mechanisms, future research should combine measurements of pelagic productivity with grazing rates, sediment trap deployments, and carbon isotopic tracing to directly assess the pathways and fate of organic carbon in the entire fjord ecosystem. In addition, benthic OC cycling and remineralization efficiency determine how much organic matter escapes degradation and is ultimately buried. Quantifying benthic oxygen uptake and sediment-water nutrient fluxes along with porewater oxygen and nutrient profiles would therefore help clarify the role of bottom-water and sediment conditions in OC preservation. Finally, MARs and OCBRs should be further investigated in Greenland and other Arctic fjords using standardized dating approaches, ideally the CRS method, to enable robust inter-fjord comparisons. As not all MARs in this study could be determined using the CRS method, these estimates warrant verification in future work. Ultimately, expanding OCBR assessments across a broader range of Greenland fjord systems will be essential to adequately evaluate the proposed hypothesis and improve regional carbon burial estimates.
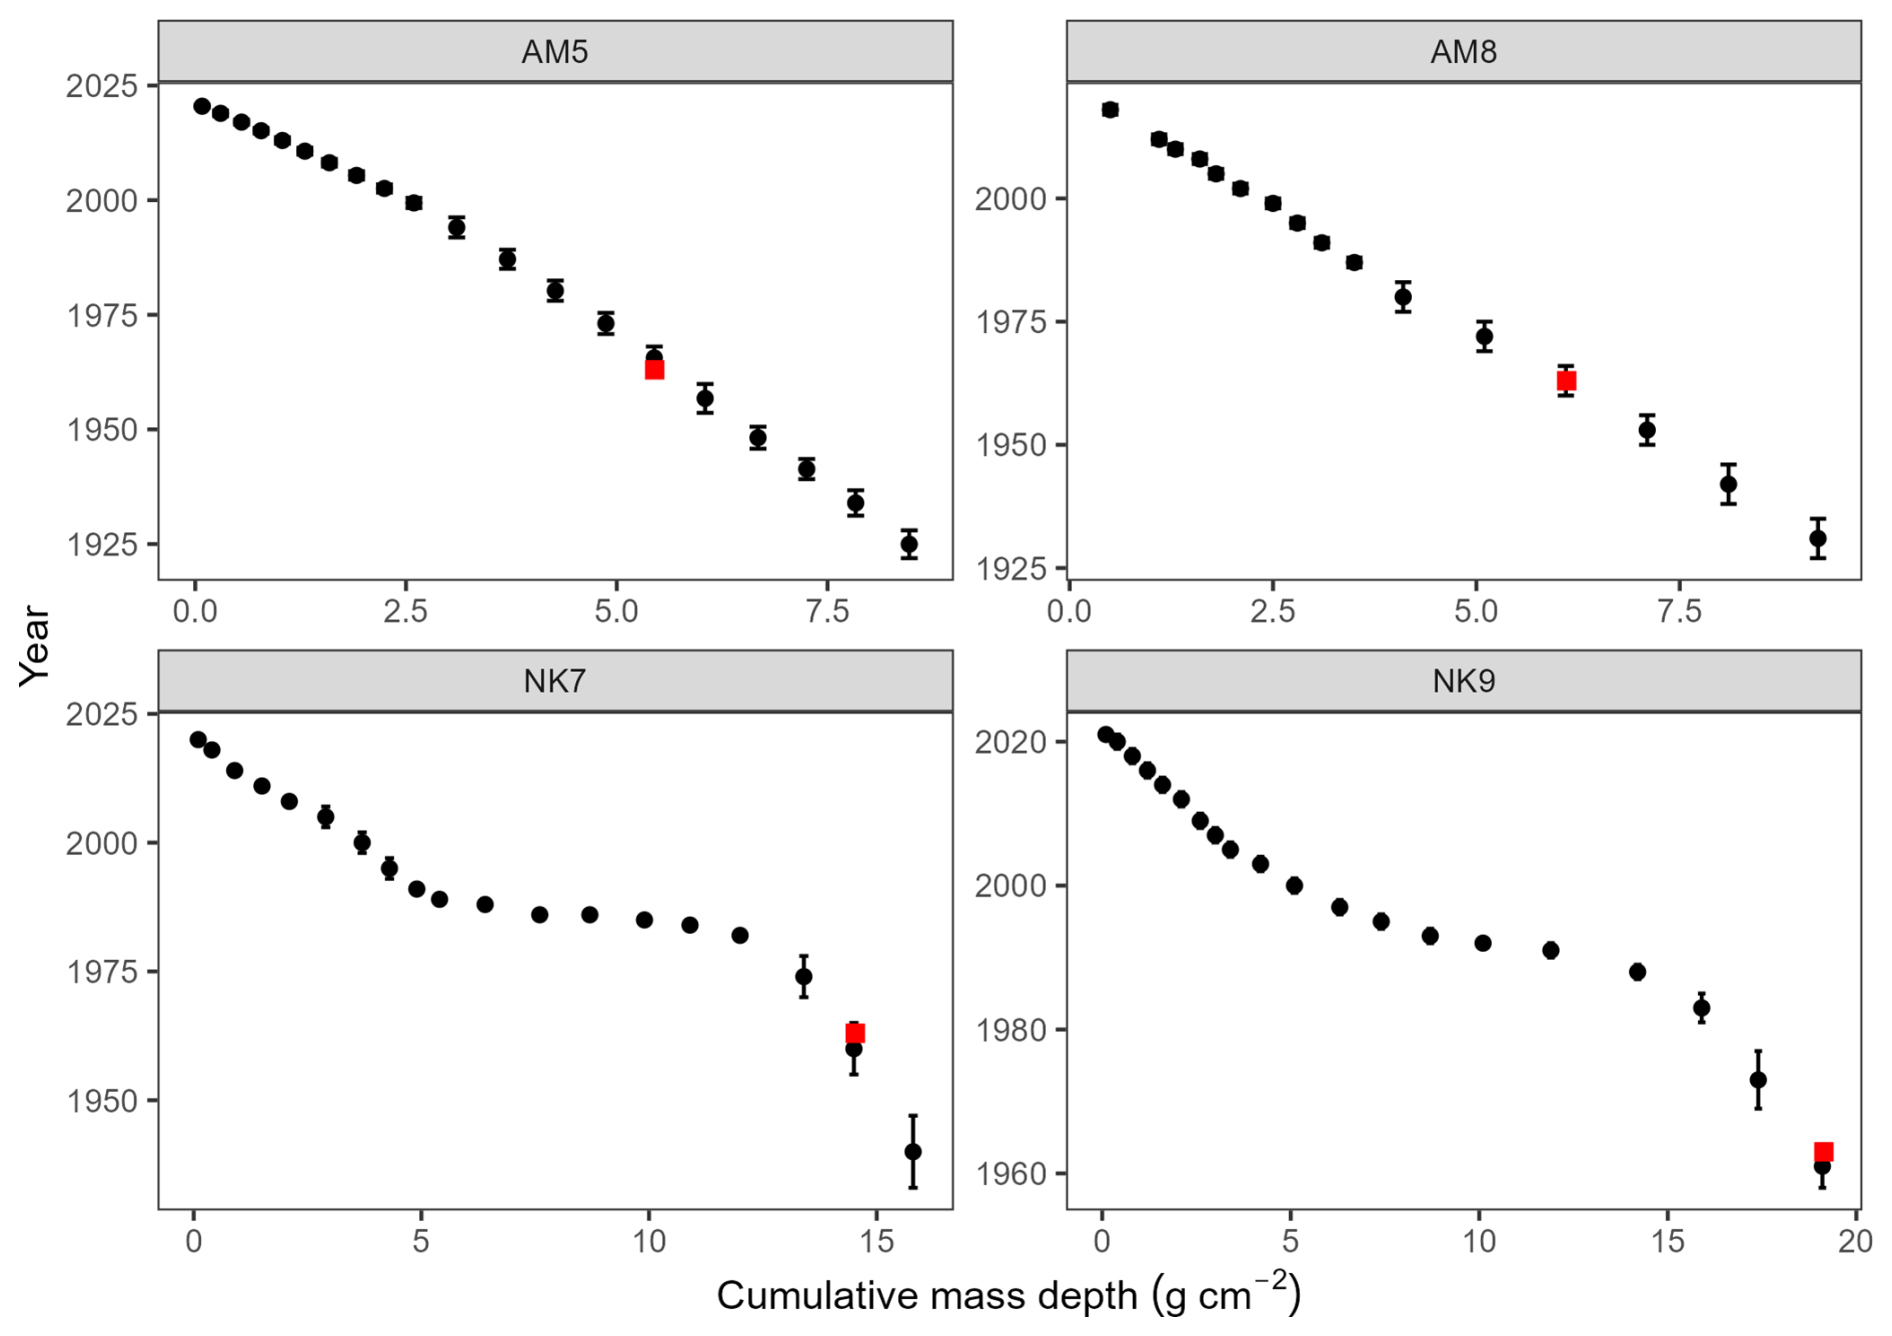
Figure A1Age–depth models for sediment cores from stations AM5, AM8, NK7, and NK9, constructed using the Constant Rate of Supply (CRS) model based on 210Pbex activity. Black circles represent modeled sediment ages plotted against cumulative mass depth (g cm−2), with error bars showing ± 1σ uncertainties. Red squares indicate the depth of the 137Cs activity peak (1963), used as an independent chronological marker for model validation.
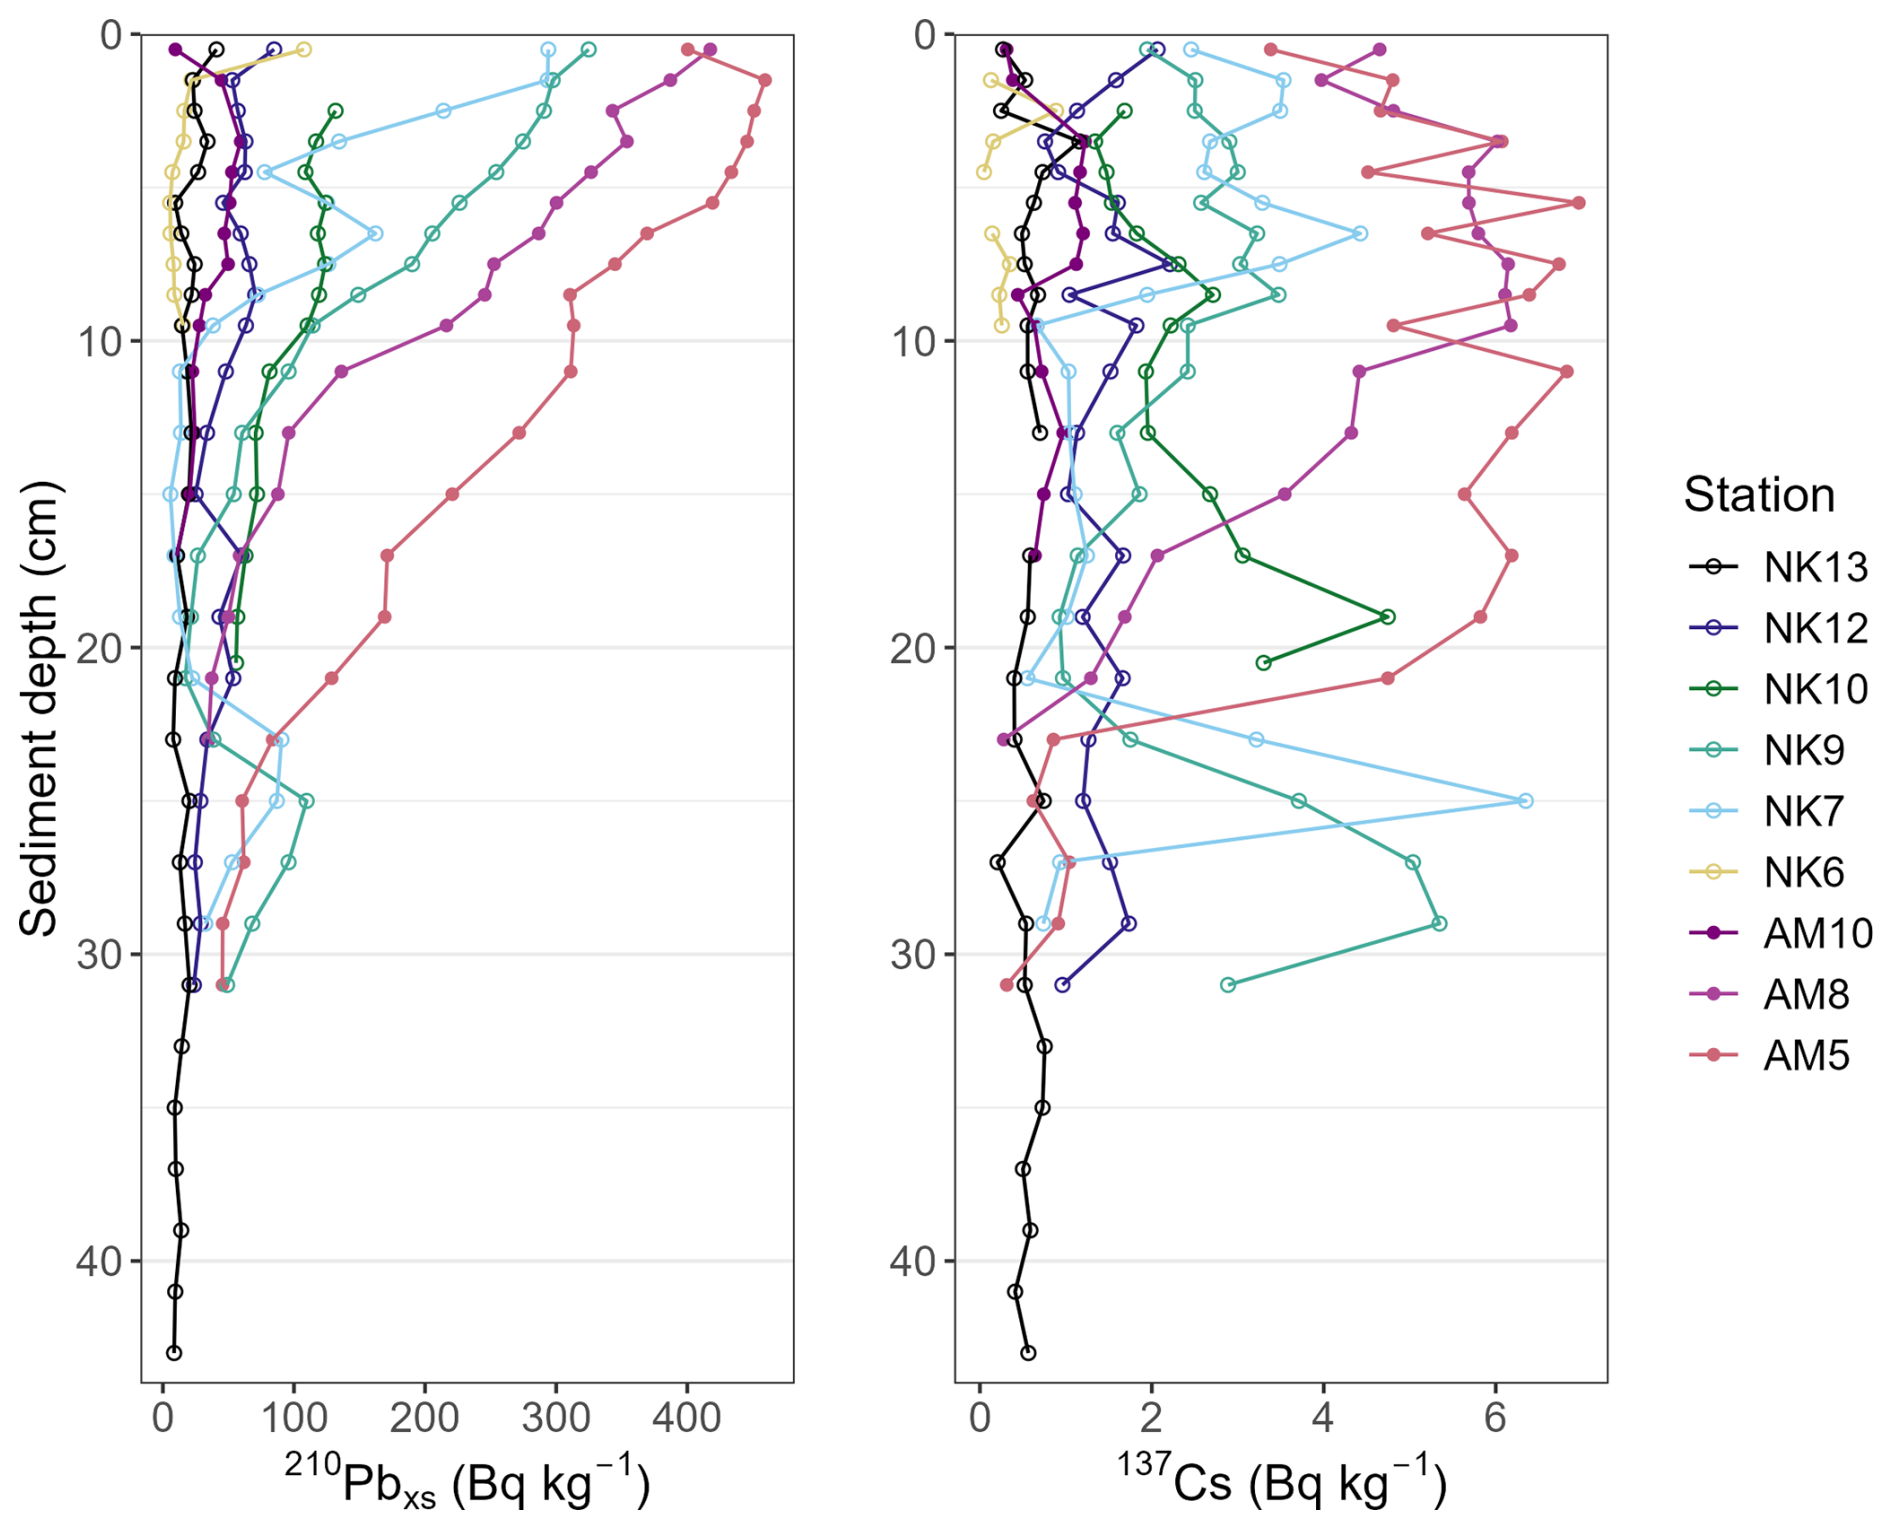
Figure A2Excess 210Pb and 137Cs profiles of Nuup Kangerlua stations (NK13, NK12, NK10, NK9, NK7 and NK6) and Ameralik stations (AM10, AM8 and AM5).
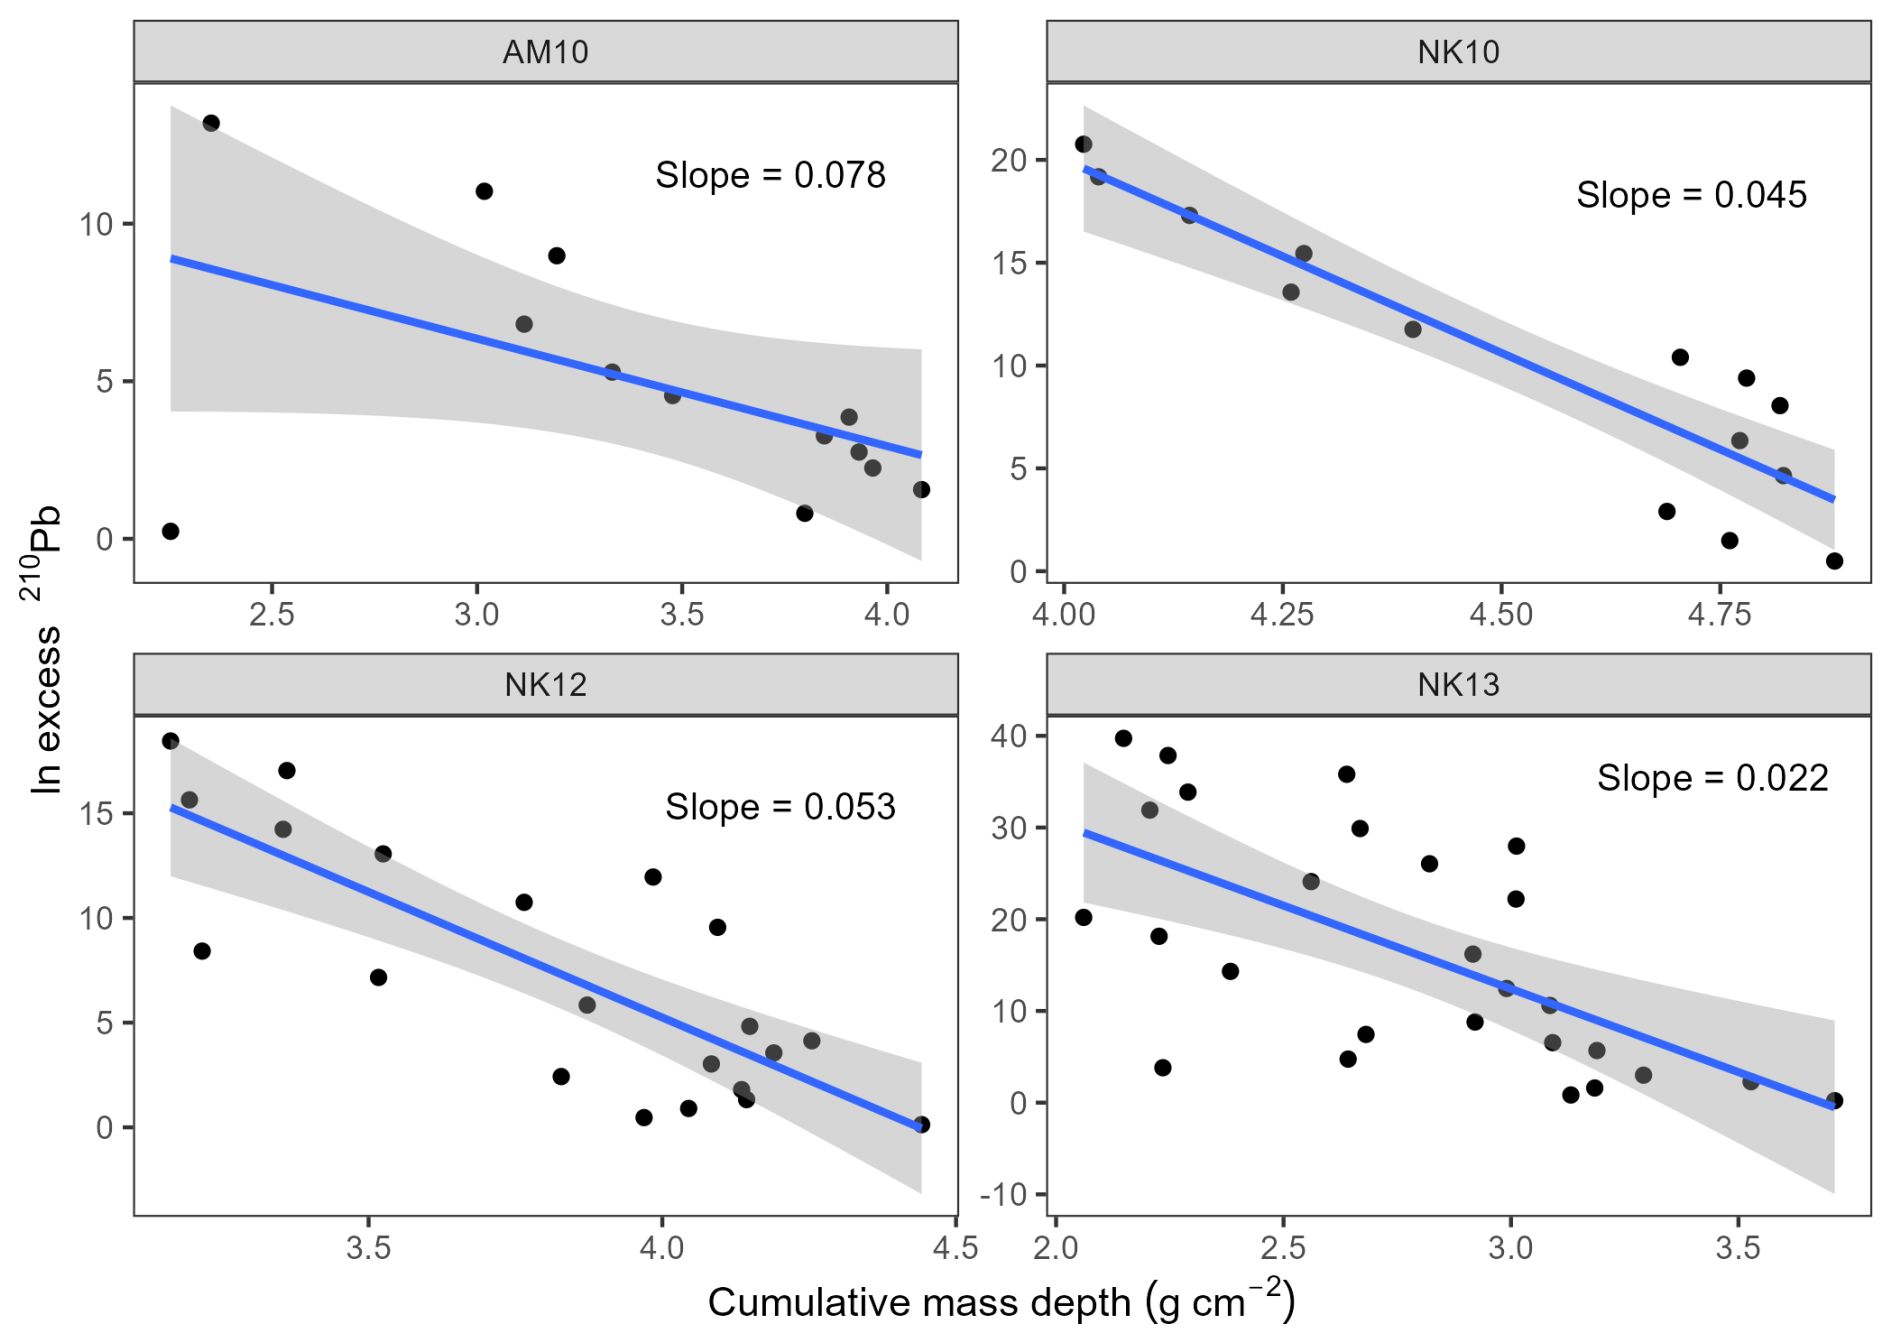
Figure A3The natural logarithm of the activity of 210Pbex is plotted against the cumulative mass depth with the linear blue line representing CF:CS fitting for stations AM10, NK10, 12 and 13.
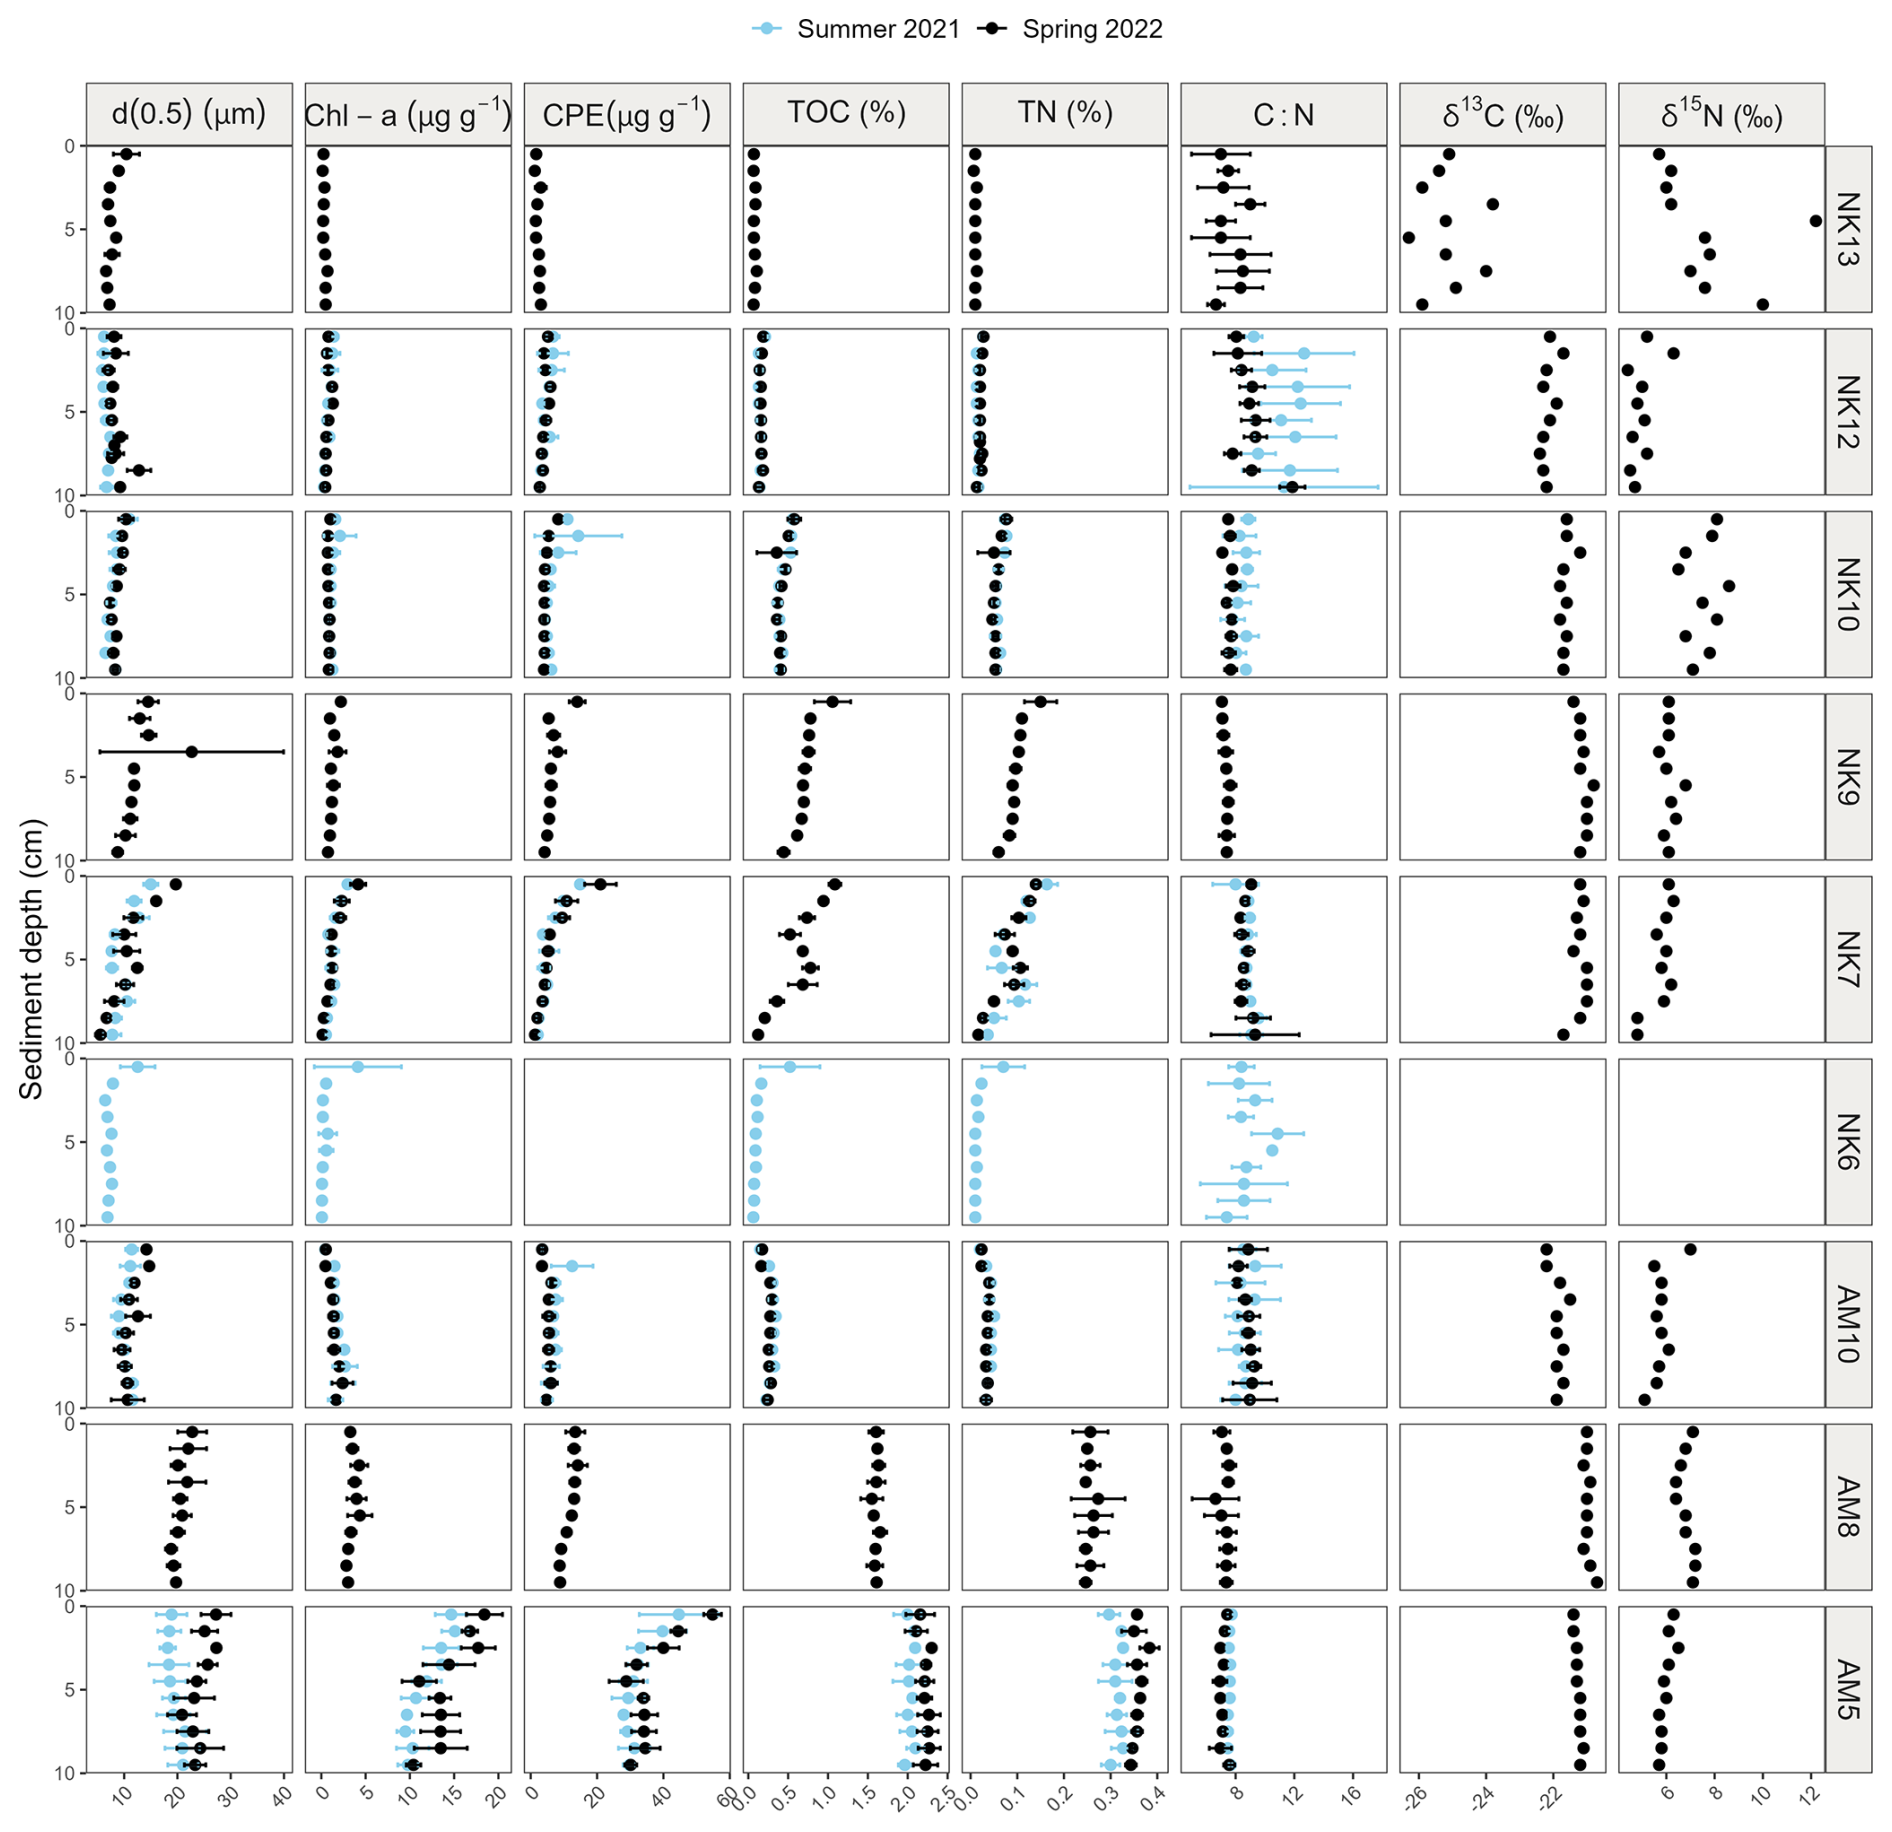
Figure A4Vertical sediment profiles depicting average median grain size (µm), Chl-a content (µg g−1 DM), Chl-a:CPE ratio, TOC and TN (%), and molar C:N ratios, and single core values of δ13C (‰), δ15N (‰), porosity and dry density (g cm−3) of the upper 10 cm sediment of Nuup Kangerlua (stations NK13, NK12, NK10, NK9, NK7 and NK6) and Ameralik (stations AM10, AM8, AM5). Error bars represent SE (n=3). Blue and black colors represent end of summer 2021 and spring 2022, respectively. Data from the two seasons is available for stations NK12, NK7, AM10 and AM5.
Code used in this study can be accessed via https://doi.org/10.5281/zenodo.18430012 (Buydens, 2026a).
The data used in this study can be accessed via https://doi.org/10.5281/zenodo.18374959 (Buydens, 2026b).
LM, AV, KS and UB acquired funding for the research project and developed the overall research objectives. LM, MB, UB, AV, KS and EDB contributed during the field work. SB supervised and carried out lab analyses of 210Pb and 137Cs. MB conducted formal analysis and AS assisted in MAR calculations and interpretation. MB prepared the original draft and all authors reviewed the manuscript.
The contact author has declared that none of the authors has any competing interests.
Publisher's note: Copernicus Publications remains neutral with regard to jurisdictional claims made in the text, published maps, institutional affiliations, or any other geographical representation in this paper. The authors bear the ultimate responsibility for providing appropriate place names. Views expressed in the text are those of the authors and do not necessarily reflect the views of the publisher.
Our sincere thanks to the Greenland Institute of Natural Resources for providing access to lab facilities and the research vessel Avataq, as well as accommodations during fieldwork. Special appreciation goes to Captain Peter Rosvig Pedersen and the crew of the Polar Diver for their assistance during field sampling. We thank MSc students Charles Makio, Marianne Lollevier and Tran Manh Quan for their contributions to sample processing and preparation. We acknowledge Bart Beuselinck and Bruno Vlaeminck (Ghent University, Marine Biology Research Group) and Peter Van Breughel (NIOZ) for sample analysis. OpenAI's ChatGPT was used to check for grammar and improve the readability of the manuscript.
This work is part of the IMAGIN project, funded by Research Foundation – Flanders (FWO) (grant no. 3G043120). The research leading to results presented in this publication was carried out with infrastructure funded by EMBRC Belgium – FWO international research infrastructure I001621N. This study contributes to the BELSPO FED-tWIN METRIC project (Marine EcosysTem Responses In a multiple pressures Context) and to the Belgian Federal Science Policy Office (BELSPO)-funded project CANOE (contract no. RV/21/CANOE).
This paper was edited by Mark Lever and reviewed by Lisa Bröder and four anonymous referees.
Appleby, P. G.: Chronostratigraphic techniques in recent sediments, in: Kluwer Academic Publishers eBooks, 171–203, https://doi.org/10.1007/0-306-47669-x_9, 2001.
Barsanti, M., Garcia-Tenorio, R., Schirone, A., Rozmaric, M., Ruiz-Fernández, A. C., Sanchez-Cabeza, J. A., and Osvath, I.: Challenges and limitations of the 210Pb sediment dating method: Results from an IAEA modelling interlaboratory comparison exercise, Quaternary Geochronology, 59, 101093, https://doi.org/10.1016/j.quageo.2020.101093, 2020.
Berg, S., Jivcov, S., Kusch, S., Kuhn, G., White, D., Bohrmann, G., Melles, M., and Rethemeyer, J.: Increased petrogenic and biospheric organic carbon burial in sub-Antarctic fjord sediments in response to recent glacier retreat, Limnology And Oceanography, 66, 4347–4362, https://doi.org/10.1002/lno.11965, 2021.
Bianchi, T. S., Arndt, S., Austin, W. E. N., Benn, D. I., Bertrand, S., Cui, X., Faust, J. C., Koziorowska-Makuch, K., Moy, C. M., Savage, C., Smeaton, C., Smith, R. W., and Syvitski, J.: Fjords as Aquatic Critical Zones (ACZs), Earth-Science Reviews, 203, 103145, https://doi.org/10.1016/j.earscirev.2020.103145, 2020.
Brenner, M., Schelske, C. L., and Kenney, W. F.: Inputs of dissolved and particulate 226Ra to lakes and implications for 210Pb dating recent sediments, Journal Of Paleolimnology, 32, 53–66, https://doi.org/10.1023/b:jopl.0000025281.54969.03, 2004.
Burdige, D. J.: Preservation of Organic Matter in Marine Sediments: Controls, Mechanisms, and an Imbalance in Sediment Organic Carbon Budgets?, ChemInform, 38, https://doi.org/10.1002/chin.200720266, 2007.
Buydens, M.: MAR and OCBR calculation, Zenodo [code], https://doi.org/10.5281/zenodo.18430013, 2026a.
Buydens, M.: Environmental sediment data Greenland fjords, Zenodo [data set], https://doi.org/10.5281/zenodo.18374960, 2026b.
Calleja, M. L., Kerhervé, P., Bourgeois, S., Kędra, M., Leynaert, A., Devred, E., Babin, M., and Morata, N.: Effects of increase glacier discharge on phytoplankton bloom dynamics and pelagic geochemistry in a high Arctic fjord, Progress in Oceanography, 159, 195–210, https://doi.org/10.1016/j.pocean.2017.07.005, 2017.
Cape, M. R., Straneo, F., Beaird, N., Bundy, R. M., and Charette, M. A.: Nutrient release to oceans from buoyancy-driven upwelling at Greenland tidewater glaciers, Nature Geoscience, 12, 34–39, https://doi.org/10.1038/s41561-018-0268-4, 2019.
Catania, G. A., Stearns, L. A., Moon, T. A., Enderlin, E. M., and Jackson, R. H.: Future Evolution of Greenland's Marine-Terminating Outlet Glaciers, Journal Of Geophysical Research Earth Surface, 125, https://doi.org/10.1029/2018jf004873, 2019.
Chu, V. W.: Greenland ice sheet hydrology, Progress in Physical Geography Earth And Environment, 38, 19–54, https://doi.org/10.1177/0309133313507075, 2014.
Cui, X., Bianchi, T. S., Jaeger, J. M., and Smith, R. W.: Biospheric and petrogenic organic carbon flux along southeast Alaska, Earth And Planetary Science Letters, 452, 238–246, https://doi.org/10.1016/j.epsl.2016.08.002, 2016a.
Cui, X., Bianchi, T. S., Savage, C., and Smith, R. W.: Organic carbon burial in fjords: Terrestrial versus marine inputs, Earth And Planetary Science Letters, 451, 41–50, https://doi.org/10.1016/j.epsl.2016.07.003, 2016b.
Cutshall, N. H., Larsen, I. L., and Olsen, C. R.: Direct analysis of 210Pb in sediment samples: Self-absorption corrections, Nuclear Instruments And Methods in Physics Research, 206, 309–312, https://doi.org/10.1016/0167-5087(83)91273-5, 1983.
Dai, J., Sun, M., Culp, R. A., and Noakes, J. E.: Changes in chemical and isotopic signatures of plant materials during degradation: Implication for assessing various organic inputs in estuarine systems, Geophysical Research Letters, 32, https://doi.org/10.1029/2005gl023133, 2005.
Drexler, J. Z., Fuller, C. C., and Archfield, S.: The approaching obsolescence of 137Cs dating of wetland soils in North America, Quaternary Science Reviews, 199, 83–96, https://doi.org/10.1016/j.quascirev.2018.08.028, 2018.
Duffield, C., Alve, E., Andersen, N., Andersen, T., Hess, S., and Strohmeier, T.: Spatial and temporal organic carbon burial along a fjord to coast transect: A case study from Western Norway, The Holocene, 27, 1325–1339, https://doi.org/10.1177/0959683617690588, 2017.
Eidam, E. F., Nittrouer, C. A., Lundesgaard, Ø., Homolka, K. K., and Smith, C. R.: Variability of Sediment Accumulation Rates in an Antarctic Fjord, Geophysical Research Letters, 46, 13271–13280, https://doi.org/10.1029/2019gl084499, 2019.
Erlandsson, C. P.: Vertical transport of particulate organic matter regulated by fjord topography, Journal of Geophysical Research Atmospheres, 113, https://doi.org/10.1029/2006jg000375, 2008.
Faust, J. C. and Knies, J.: Organic matter sources in North Atlantic fjord sediments, Geochemistry Geophysics Geosystems, 20, 2872–2885, https://doi.org/10.1029/2019gc008382, 2019.
Fox, J. and Weisberg, S.: An R Companion to Applied Regression, 3rd edn., Sage, Thousand Oaks, CA, https://www.john-fox.ca/Companion/ (last access: June 2024), 2019.
Gilbert, R., Nielsen, N., Möller, H., Desloges, J. R., and Rasch, M.: Glacimarine sedimentation in Kangerdluk (Disko Fjord), West Greenland, in response to a surging glacier, Marine Geology, 191, 1–18, https://doi.org/10.1016/s0025-3227(02)00543-1, 2002.
Greene, C. A., Gardner, A. S., Wood, M., and Cuzzone, J. K.: Ubiquitous acceleration in Greenland Ice Sheet calving from 1985 to 2022, Nature, 625, 523–528, https://doi.org/10.1038/s41586-023-06863-2, 2024.
Harris, A. J. T. and Elliott, D. A.: Stable Isotope Studies of North American Arctic Populations: A Review, Open Quaternary, 5, 11, https://doi.org/10.5334/oq.67, 2019.
Grimes, M., Carrivick, J. L., Smith, M. W., and Comber, A. J.: Land cover changes across Greenland dominated by a doubling of vegetation in three decades, Scientific Reports, 14, 3120, https://doi.org/10.1038/s41598-024-52124-1, 2024.
Halbach, L., Vihtakari, M., Duarte, P., Everett, A., Granskog, M. A., Hop, H., Kauko, H. M., Kristiansen, S., Myhre, P. I., Pavlov, A. K., Pramanik, A., Tatarek, A., Torsvik, T., Wiktor, J. M., Wold, A., Wulff, A., Steen, H., and Assmy, P.: Tidewater glaciers and bedrock characteristics control the phytoplankton growth environment in a fjord in the Arctic, Frontiers in Marine Science, 6, https://doi.org/10.3389/fmars.2019.00254, 2019.
Hargrave, B. T. and Kamp-Nielsen, L.: Accumulation of sedimentary organic matter at the base of steep bottom gradients, in: Interactions between sediment and freshwater, edited by: Golterman, H. L., Dr. W. Junk B.V. Publishers, The Hague, the Netherlands, 168–173, 1977.
Hinojosa, J. L., Moy, C. M., Stirling, C. H., Wilson, G. S., and Eglinton, T. I.: Carbon cycling and burial in New Zealand's fjords, Geochemistry Geophysics Geosystems, 15, 4047–4063, https://doi.org/10.1002/2014gc005433, 2014.
Hopwood, M. J., Carroll, D., Browning, T. J., Meire, L., Mortensen, J., Krisch, S., and Achterberg, E. P.: Non-linear response of summertime marine productivity to increased meltwater discharge around Greenland, Nature Communications, 9, 3256, https://doi.org/10.1038/s41467-018-05488-8, 2018.
Hopwood, M. J., Carroll, D., Dunse, T., Hodson, A., Holding, J. M., Iriarte, J. L., Ribeiro, S., Achterberg, E. P., Cantoni, C., Carlson, D. F., Chierici, M., Clarke, J. S., Cozzi, S., Fransson, A., Juul-Pedersen, T., Winding, M. H. S., and Meire, L.: Review article: How does glacier discharge affect marine biogeochemistry and primary production in the Arctic?, The Cryosphere, 14, 1347–1383, https://doi.org/10.5194/tc-14-1347-2020, 2020.
Juul-Pedersen, T., Arendt, K., Mortensen, J., Blicher, M., Søgaard, D., and Rysgaard, S.: Seasonal and interannual phytoplankton production in a sub-Arctic tidewater outlet glacier fjord, SW Greenland, Marine Ecology Progress Series, 524, 27–38, https://doi.org/10.3354/meps11174, 2015.
Kanna, N., Sugiyama, S., Ohashi, Y., Sakakibara, D., Fukamachi, Y., and Nomura, D.: Upwelling of macronutrients and dissolved inorganic carbon by a subglacial freshwater driven plume in Bowdoin Fjord, northwestern Greenland, Journal of Geophysical Research Biogeosciences, 123, 1666–1682, https://doi.org/10.1029/2017jg004248, 2018.
Kanna, N., Sugiyama, S., Ando, T., Wang, Y., Sakuragi, Y., Hazumi, T., Matsuno, K., Yamaguchi, A., Nishioka, J., and Yamashita, Y.: Meltwater Discharge From Marine-Terminating Glaciers Drives Biogeochemical Conditions in a Greenlandic Fjord, Global Biogeochemical Cycles, 36, https://doi.org/10.1029/2022gb007411, 2022.
Kassambara, A.: rstatix: Pipe-Friendly Framework for Basic Statistical Tests, R package version 0.7.2, https://rpkgs.datanovia.com/rstatix/ (last access: June 2024), 2023.
King, M. D., Howat, I. M., Candela, S. G., Noh, M. J., Jeong, S., Noël, B. P. Y., Van Den Broeke, M. R., Wouters, B., and Negrete, A.: Dynamic ice loss from the Greenland Ice Sheet driven by sustained glacier retreat, Communications Earth & Environment, 1, https://doi.org/10.1038/s43247-020-0001-2, 2020.
Knies, J. and Martinez, P.: Organic matter sedimentation in the western Barents Sea region: terrestrial and marine contribution based on isotopic composition and organic nitrogen content, Norw. J. Geol., 89, 79–89, 2009.
Koho, K. A., García, R., De Stigter, H. C., Epping, E., Koning, E., Kouwenhoven, T. J., and Van Der Zwaan, G. J.: Sedimentary labile organic carbon and pore water redox control on species distribution of benthic foraminifera: A case study from Lisbon–Setúbal Canyon (southern Portugal), Progress in Oceanography, 79, 55–82, https://doi.org/10.1016/j.pocean.2008.07.004, 2008.
Koziorowska, K., Kuliński, K., and Pempkowiak, J.: Sedimentary organic matter in two Spitsbergen fjords: Terrestrial and marine contributions based on carbon and nitrogen contents and stable isotopes composition, Continental Shelf Research, 113, 38–46, https://doi.org/10.1016/j.csr.2015.11.010, 2015.
Koziorowska, K., Kuliński, K., and Pempkowiak, J.: Comparison of the burial rate estimation methods of organic and inorganic carbon and quantification of carbon burial in two high Arctic fjords, Oceanologia, 60, 405–418, https://doi.org/10.1016/j.oceano.2018.02.005, 2018.
Krajewska, M., Szymczak-Żyła, M., Tylmann, W., and Kowalewska, G.: Climate change impact on primary production and phytoplankton taxonomy in Western Spitsbergen fjords based on pigments in sediments, Global and Planetary Change, 189, 103158, https://doi.org/10.1016/j.gloplacha.2020.103158, 2020.
Kuliński, K., Kędra, M., Legeżyńska, J., Gluchowska, M., and Zaborska, A.: Particulate organic matter sinks and sources in high Arctic fjord, Journal Of Marine Systems, 139, 27–37, https://doi.org/10.1016/j.jmarsys.2014.04.018, 2014.
Lamb, A. L., Wilson, G. P., and Leng, M. J.: A review of coastal palaeoclimate and relative sea-level reconstructions using δ13C and ratios in organic material, Earth-Science Reviews, 75, 29–57, https://doi.org/10.1016/j.earscirev.2005.10.003, 2006.
Langen, P. L., Mottram, R. H., Christensen, J. H., Boberg, F., Rodehacke, C. B., Stendel, M., Van As, D., Ahlstrøm, A. P., Mortensen, J., Rysgaard, S., Petersen, D., Svendsen, K. H., Aðalgeirsdóttir, G., and Cappelen, J.: Quantifying Energy and Mass Fluxes Controlling Godthåbsfjord Freshwater Input in a 5-km Simulation (1991–2012), Journal Of Climate, 28, 3694–3713, https://doi.org/10.1175/jcli-d-14-00271.1, 2015.
Laufer-Meiser, K., Michaud, A. B., Maisch, M., Byrne, J. M., Kappler, A., Patterson, M. O., Røy, H., and Jørgensen, B. B.: Potentially bioavailable iron produced through benthic cycling in glaciated Arctic fjords of Svalbard, Nature Communications, 12, https://doi.org/10.1038/s41467-021-21558-w, 2021.
Limoges, A., Weckström, K., Ribeiro, S., Georgiadis, E., Hansen, K. E., Martinez, P., Seidenkrantz, M., Giraudeau, J., Crosta, X., and Massé, G.: Learning from the past: Impact of the Arctic Oscillation on sea ice and marine productivity off northwest Greenland over the last 9,000 years, Global Change Biology, 26, 6767–6786, https://doi.org/10.1111/gcb.15334, 2020.
Meire, L., Søgaard, D. H., Mortensen, J., Meysman, F. J. R., Soetaert, K., Arendt, K. E., Juul-Pedersen, T., Blicher, M. E., and Rysgaard, S.: Glacial meltwater and primary production are drivers of strong CO2 uptake in fjord and coastal waters adjacent to the Greenland Ice Sheet, Biogeosciences, 12, 2347–2363, https://doi.org/10.5194/bg-12-2347-2015, 2015.
Meire, L., Mortensen, J., Meire, P., Juul-Pedersen, T., Sejr, M. K., Rysgaard, S., Nygaard, R., Huybrechts, P., and Meysman, F. J. R.: Marine-terminating glaciers sustain high productivity in Greenland fjords, Global Change Biology, 23, 5344–5357, https://doi.org/10.1111/gcb.13801, 2017.
Meire, L., Paulsen, M. L., Meire, P., Rysgaard, S., Hopwood, M. J., Sejr, M. K., Stuart-Lee, A., Sabbe, K., Stock, W., and Mortensen, J.: Glacier retreat alters downstream fjord ecosystem structure and function in Greenland, Nature Geoscience, 16, 671–674, https://doi.org/10.1038/s41561-023-01218-y, 2023.
Møller, H. S., Jensen, K. G., Kuijpers, A., Aagaard-Sørensen, S., Seidenkrantz, M.-S., Prins, M., Endler, R., and Mikkelsen, N.: Late-Holocene environment and climatic changes in Ameralik Fjord, southwest Greenland: evidence from the sedimentary record, The Holocene, 16, 685–695, https://doi.org/10.1191/0959683606hl963rp, 2006.
Mortensen, J., Lennert, K., Bendtsen, J., and Rysgaard, S.: Heat sources for glacial melt in a sub-Arctic fjord (Godthåbsfjord) in contact with the Greenland Ice Sheet, Journal Of Geophysical Research Atmospheres, 116, https://doi.org/10.1029/2010jc006528, 2011.
Mortensen, J., Bendtsen, J., Lennert, K., and Rysgaard, S.: Seasonal variability of the circulation system in a west Greenland tidewater outlet glacier fjord, Godthåbsfjord (64° N), Journal Of Geophysical Research Earth Surface, 119, 2591–2603, https://doi.org/10.1002/2014jf003267, 2014.
Mortensen, J., Rysgaard, S., Arendt, K. E., Juul-Pedersen, T., Søgaard, D. H., Bendtsen, J., and Meire, L.: Local Coastal Water Masses Control Heat Levels in a West Greenland Tidewater Outlet Glacier Fjord, Journal Of Geophysical Research Oceans, 123, 8068–8083, https://doi.org/10.1029/2018jc014549, 2018.
Næraa, T., Kemp, A. I. S., Scherstén, A., Rehnström, E. F., Rosing, M. T., and Whitehouse, M. J.: A lower crustal mafic source for the ca. 2550 Ma Qôrqut Granite Complex in southern West Greenland, Lithos, 192–195, 291–304, https://doi.org/10.1016/j.lithos.2014.02.013, 2014.
Naidu, A. S., Cooper, L. W., Finney, B. P., Macdonald, R. W., Alexander, C., and Semiletov, I. P.: Organic carbon isotope ratios (δ13C) of Arctic Amerasian Continental shelf sediments, International Journal Of Earth Sciences, 89, 522–532, https://doi.org/10.1007/s005310000121, 2000.
Ogle, D. H., Doll, J. C., Wheeler, A. P., and Dinno, A.: FSA: Simple Fisheries Stock Assessment Methods, R package version 0.9.5, https://CRAN.R-project.org/package=FSA (last access: June 2024), 2023.
Overeem, I., Hudson, B., Welty, E., Mikkelsen, A., Bamber, J., Petersen, D., Lewinter, A. and Hasholt, B.: River inundation suggests ice-sheet runoff retention, Journal Of Glaciology, 61, 776–788, https://doi.org/10.3189/2015jog15j012, 2015.
Placitu, S., Van de Velde, S. J., Hylén, A., Hall, P. O. J., Robertson, E. K., Eriksson, M., Leermakers, M., Mehta, N., and Bonneville, S.: Limited Organic Carbon Burial by the Rusty Carbon Sink in Swedish Fjord Sediments, Journal Of Geophysical Research Biogeosciences, 129, https://doi.org/10.1029/2024jg008277, 2024.
R Core Team: R: A Language and Environment for Statistical Computing, R Foundation for Statistical Computing, Vienna, Austria, https://www.R-project.org/ (last access: June 2024), 2023.
Ruttenberg, K. C. and Goñi, M. A.: Phosphorus distribution, C:N:P ratios, and δ13COC in arctic, temperate, and tropical coastal sediments: tools for characterizing bulk sedimentary organic matter, Marine Geology, 139, 123–145, https://doi.org/10.1016/s0025-3227(96)00107-7, 1997.
Sanchez-Cabeza, J. A. and Ruiz-Fernández, A. C.: 210Pb sediment radiochronology: An integrated formulation and classification of dating models, Geochimica Et Cosmochimica Acta, 82, 183–200, https://doi.org/10.1016/j.gca.2010.12.024, 2012.
Seifert, M., Hoppema, M., Burau, C., Elmer, C., Friedrichs, A., Geuer, J. K., John, U., Kanzow, T., Koch, B. P., Konrad, C., Van Der Jagt, H., Zielinski, O., and Iversen, M. H.: Influence of Glacial Meltwater on Summer Biogeochemical Cycles in Scoresby Sund, East Greenland, Frontiers in Marine Science, 6, https://doi.org/10.3389/fmars.2019.00412, 2019.
Sepúlveda, J., Pantoja, S., and Hughen, K. A.: Sources and distribution of organic matter in northern Patagonia fjords, Chile (∼ 44–47° S): A multi-tracer approach for carbon cycling assessment, Continental Shelf Research, 31, 315–329, https://doi.org/10.1016/j.csr.2010.05.013, 2011.
Scholze, C., Jørgensen, B. B., and Røy, H.: Psychrophilic properties of sulfate‐reducing bacteria in Arctic marine sediments, Limnology and Oceanography, 66, https://doi.org/10.1002/lno.11586, 2020.
Schubert, C. J., Niggemann, J., Klockgether, G., and Ferdelman, T. G.: Chlorin Index: A new parameter for organic matter freshness in sediments, Geochemistry Geophysics Geosystems, 6, https://doi.org/10.1029/2004gc000837, 2005.
Smeaton, C. and Austin, W. E. N.: Sources, Sinks, and Subsidies: Terrestrial Carbon Storage in Mid-latitude Fjords, Journal Of Geophysical Research Biogeosciences, 122, 2754–2768, https://doi.org/10.1002/2017jg003952, 2017.
Smeaton, C. and Austin, W. E. N.: Where's the Carbon: Exploring the Spatial Heterogeneity of Sedimentary Carbon in Mid-Latitude Fjords, Frontiers in Earth Science, 7, https://doi.org/10.3389/feart.2019.00269, 2019.
Smeaton, C., Austin, W. E. N., Davies, A. L., Baltzer, A., Abell, R. E., and Howe, J. A.: Substantial stores of sedimentary carbon held in mid-latitude fjords, Biogeosciences, 13, 5771–5787, https://doi.org/10.5194/bg-13-5771-2016, 2016.
Smeaton, C., Yang, H., and Austin, W. E. N.: Carbon burial in the mid-latitude fjords of Scotland, Marine Geology, 441, 106618, https://doi.org/10.1016/j.margeo.2021.106618, 2021.
Smith, J. N.: Why should we believe 210Pb sediment geochronologies?, Journal of Environmental Radioactivity, 55, 121–123, https://doi.org/10.1016/s0265-931x(00)00152-1, 2001.
Smith, L. M., Alexander, C., and Jennings, A. E.: Accumulation in East Greenland Fjords and on the Continental Shelves Adjacent to the Denmark Strait over the Last Century Based on 210Pb Geochronology, ARCTIC, 55, https://doi.org/10.14430/arctic695, 2002.
Smith, R. W., Bianchi, T. S., Allison, M., Savage, C., and Galy, V.: High rates of organic carbon burial in fjord sediments globally, Nature Geoscience, 8, 450–453, https://doi.org/10.1038/ngeo2421, 2015.
Sørensen, H., Meire, L., Juul-Pedersen, T., De Stigter, H., Meysman, F., Rysgaard, S., Thamdrup, B., and Glud, R.: Seasonal carbon cycling in a Greenlandic fjord: an integrated pelagic and benthic study, Marine Ecology Progress Series, 539, 1–17, https://doi.org/10.3354/meps11503, 2015.
St-Onge, G. and Hillaire-Marcel, C.: Isotopic constraints of sedimentary inputs and organic carbon burial rates in the Saguenay Fjord, Quebec, Marine Geology, 176, 1–22, https://doi.org/10.1016/s0025-3227(01)00150-5, 2001.
Stuart-Lee, A., Møller, E. F., Winding, M., Van Oevelen, D., Hendry, K. R., and Meire, L.: Contrasting copepod community composition in two Greenland fjords with different glacier types, Journal Of Plankton Research, 46, https://doi.org/10.1093/plankt/fbae060, 2024.
Stuart-Lee, A. E., Mortensen, J., Van Der Kaaden, A.-S., and Meire, L.: Seasonal Hydrography of Ameralik: A Southwest Greenland Fjord Impacted by a Land-Terminating Glacier, Journal Of Geophysical Research Oceans, 126, https://doi.org/10.1029/2021jc017552, 2021.
Stuart-Lee, A. E., Mortensen, J., Juul-Pedersen, T., Middelburg, J. J., Soetaert, K., Hopwood, M. J., Engel, A., and Meire, L.: Influence of glacier type on bloom phenology in two Southwest Greenland fjords, Estuarine Coastal And Shelf Science, 284, 108271, https://doi.org/10.1016/j.ecss.2023.108271, 2023.
Syvitski, J. P. M., Burrell, D. C., and Skei, J. M.: Fjords: Processes and Products, Springer-Verlag, New York, USA, 379 pp., ISBN-13: 978-1-4612-9091-9, 1987.
Tamburrino, S., Passaro, S., Barsanti, M., Schirone, A., Delbono, I., Conte, F., Delfanti, R., Bonsignore, M., Del Core, M., Gherardi, S., and Sprovieri, M.: Pathways of inorganic and organic contaminants from land to deep sea: The case study of the Gulf of Cagliari (W Tyrrhenian Sea), The Science Of The Total Environment, 647, 334–341, https://doi.org/10.1016/j.scitotenv.2018.07.467, 2019.
Thamdrup, B., Glud, R. N., and Hansen, J. W.: Benthic carbon cycling in Young Sound, Northeast Greenland, Meddelelser Om Grønland Bioscience, 58, 138–157, https://doi.org/10.7146/mogbiosci.v58.142646, 2007.
Thompson, H. A., White, J. R., and Pratt, L. M.: Spatial variation in stable isotopic composition of organic matter of macrophytes and sediments from a small Arctic lake in west Greenland, Arctic Antarctic And Alpine Research, 50, https://doi.org/10.1080/15230430.2017.1420282, 2018.
Thornton, S. F. and McManus, J.: Application of Organic Carbon and Nitrogen Stable Isotope and C/N Ratios as Source Indicators of Organic Matter Provenance in Estuarine Systems: Evidence from the Tay Estuary, Scotland, Estuarine Coastal And Shelf Science, 38, 219–233, https://doi.org/10.1006/ecss.1994.1015, 1994.
Van As, D., Andersen, M. L., Petersen, D., Fettweis, X., Van Angelen, J. H., Lenaerts, J. T. M., Van Den Broeke, M. R., Lea, J. M., Bøggild, C. E., Ahlstrøm, A. P., and Steffen, K.: Increasing meltwater discharge from the Nuuk region of the Greenland ice sheet and implications for mass balance (1960–2012), Journal Of Glaciology, 60, 314–322, https://doi.org/10.3189/2014jog13j065, 2014.
Van Heukelem, L. and Thomas, C. S.: Computer-assisted high-performance liquid chromatography method development with applications to the isolation and analysis of phytoplankton pigments, Journal Of Chromatography A, 910, 31–49, https://doi.org/10.1016/s0378-4347(00)00603-4, 2001.
Verwega, M.-T., Somes, C. J., Schartau, M., Tuerena, R. E., Lorrain, A., Oschlies, A., and Slawig, T.: Description of a global marine particulate organic carbon-13 isotope data set, Earth Syst. Sci. Data, 13, 4861–4880, https://doi.org/10.5194/essd-13-4861-2021, 2021.
Wakeham, S. G. and Canuel, E. A.: Degradation and preservation of organic matter in marine sediments, in: The Handbook of Environmental Chemistry, edited by: Volkman, J. K., Springer, Berlin, Germany, 295–321, https://doi.org/10.1007/698_2_009, 2006.
Wang, Y., Gélinas, Y., De Vernal, A., Mucci, A. O., Allan, E., Seidenkrantz, M.-S., and Douglas, P. M. J.: High rates of marine organic carbon burial on the southwest Greenland margin induced by Neoglacial advances, Communications Earth & Environment, 5, https://doi.org/10.1038/s43247-024-01508-2, 2024.
Wassmann, P.: Sedimentation and benthic mineralization of organic detritus in a Norwegian fjord, Marine Biology, 83, 83–94, https://doi.org/10.1007/bf00393088, 1984.
Watts, E. G., Hylén, A., Hall, P. O. J., Eriksson, M., Robertson, E. K., Kenney, W. F., and Bianchi, T. S.: Burial of Organic Carbon in Swedish Fjord Sediments: Highlighting the Importance of Sediment Accumulation Rate in Relation to Fjord Redox Conditions, Journal Of Geophysical Research Biogeosciences, 129, https://doi.org/10.1029/2023jg007978, 2024.
Winkelmann, D. and Knies, J.: Recent distribution and accumulation of organic carbon on the continental margin west off Spitsbergen, Geochemistry Geophysics Geosystems, 6, https://doi.org/10.1029/2005gc000916, 2005.
Włodarska-Kowalczuk, M., Mazurkiewicz, M., Górska, B., Michel, L. N., Jankowska, E., and Zaborska, A.: Organic Carbon Origin, Benthic Faunal Consumption, and Burial in Sediments of Northern Atlantic and Arctic Fjords (60–81° N), Journal Of Geophysical Research Biogeosciences, 124, 3737–3751, https://doi.org/10.1029/2019jg005140, 2019.
Wright, S. W. and Jeffrey, S. W.: High-resolution HPLC system for chlorophylls and carotenoids of marine phytoplankton, in: Phytoplankton pigments in oceanography: Guidelines to modern methods, edited by: Jeffrey, S. W., Mantoura, R. F. C., and Wright, S. W., Monographs on Oceanographic Methodology, 10, UNESCO Publishing, Paris, 327–341, ISBN 92-3-103275-5, 1997.
Zaborska, A., Włodarska-Kowalczuk, M., Legeżyńska, J., Jankowska, E., Winogradow, A., and Deja, K.: Sedimentary organic matter sources, benthic consumption and burial in west Spitsbergen fjords – Signs of maturing of Arctic fjordic systems?, Journal Of Marine Systems, 180, 112–123, https://doi.org/10.1016/j.jmarsys.2016.11.005, 2018.