the Creative Commons Attribution 4.0 License.
the Creative Commons Attribution 4.0 License.
 | 03 Mar 2026
Matching scales of eddy covariance measurements and process-based modeling – assessing spatiotemporal dynamics of carbon and water fluxes in a mixed forest in Southern Germany
Hassane Moutahir
Markus Sulzer
Ralf Kiese
Andreas Christen
Markus Weiler
Lea Dedden
Julian Brzozon
Pia Labenski
Prajwal Khanal
Ladislav Šigut
Eddy covariance (EC) measurements are a backbone of ecological research and have provided valuable insights into the variability of carbon and water fluxes in different ecosystems and under varying environmental conditions. Since these measurements are integrative and weighted over changing areas (footprint), species-specific information cannot be easily derived except for homogenous monocultures. However, EC sites are increasingly established in mixed forest stands which are considered to be more resilient under changing environmental conditions. This leads to the question of how species-specific responses can be determined, and whether the magnitude of fluxes derived from temporally varying flux footprint predictions (FFPs) can provide insight into these responses.
At a site in southwestern Germany's Black Forest, primarily composed of mature beech and Douglas fir trees, we investigate the dependence of EC flux measurements on different FFP areas and explore how species-specific contributions to gas exchange can be disentangled using a combined measurement and modeling framework. We applied an ecosystem model that has been calibrated from EC measurements at various sites with beech- and Douglas fir monocultures, and evaluated it with data of soil water content and soil respiration taken at homogeneous parts of the investigated mixed forest site. Then we compared hourly aggregated measurements of net carbon exchange (NEE) and evapotranspiration (ET) with model simulations under four configurations: (i) pure beech, (ii) pure Douglas fir, (iii) a static weighted average of both species, and (iv) a dynamic weighted average based on FFP variations.
The results show that weighted combinations of the two species generally provide a better match with hourly EC measurements than single-species simulations, while differences between static and dynamic weighting approaches remain relatively small. However, species-specific flux responses can be significantly different during transitional periods such as autumn and spring when physiological differences between Douglas fir and beeches are most pronounced. We demonstrate that accounting for seasonal differences is particularly important for gap-filling EC measurements in mixed forests and, consequently, for determining annual carbon and water budgets. Furthermore, EC measurements over mixed forests provide valuable information for detailed model evaluation, while species-specific modeling helps disentangle and attribute underlying ecosystem dynamics to individual species.
- Article
(6781 KB) - Full-text XML
-
Supplement
(2516 KB) - BibTeX
- EndNote


Forests play a vital role in regulating both global and national carbon and greenhouse gas (GHG) budgets, generally by acting as significant carbon sinks (Pan et al., 2011). However, the increasing frequency and intensity of extreme climatic events – such as droughts, storms, and heatwaves – poses a substantial threat to this function, potentially diminishing forests' capacity to sequester carbon or even turning them into net GHG (Anderegg et al., 2020; Haberstroh et al., 2025; Thum et al., 2025; van der Woude et al., 2023). To better understand and predict how forest ecosystems respond to changing environmental conditions, process-based ecosystem models are often used (e.g. Collalti et al., 2018; Dirnböck et al., 2018; Mäkelä et al., 2023). Such models need to be calibrated and evaluated with site measurements, for which the eddy covariance (EC) method is a key tool providing data on ecosystem carbon (C) and water (H2O) exchange (Baldocchi, 2003). However, process-based models require not only net fluxes but also their respective sink and source terms, and often rely on species-specific information, which is not easily derived from spatially integrated EC measurements (Stoy et al., 2019).
Despite these constraints, EC measurements have been established as a backbone for ecosystem research, providing key data that are essential for model calibration and evaluation. Numerous EC flux towers have been installed throughout recent decades to investigate carbon and water exchange in grasslands, agricultural areas, and forests (Baldocchi, 2003; Teuling et al., 2010). These measurements represent integrated gas exchange fluxes over an area whose size depends on wind conditions and sensor height, commonly referred to as the flux footprint prediction, FFP (Kljun et al., 2004; Schmid, 1994; Schuepp et al., 1990; Vesala et al., 2008). Thus, ecosystem scale measurements are represented by temporally dynamic FFPs that differ in size and location. Consequently, interpretation of EC measurements is becoming increasingly complex with increasing variation of ecosystem properties in different directions or distance to a respective tower (Fang et al., 2024; Grote et al., 2011b). However, the directional bias can also be exploited to extract additional information on fluxes from underlying land cover patches in spatially heterogeneous ecosystems (Cassidy et al., 2016; Helbig et al., 2017; Tuovinen et al., 2019; Xu et al., 2020). To date, most cases where EC measurements have been used to evaluate ecosystem models were done at sites assumed to be homogeneous or corrected for directional bias. In the case of forested areas these sites are typically even-aged monocultures, characterized by a similar forest structure in all cardinal directions (Mahnken et al., 2022). At sites that are less homogenous, it is important to determine the differences in gas exchange rates that can be attributed to different forest structures and compositions in specific FFPs, which might vary not only with wind speed and direction, but also on diurnal or seasonal timescales.
It should be considered that without a spatial analysis of the flux footprint and its variation over time, comparison of fluxes with simulation results can be difficult to interpret. By averaging forest structure over large areas for model application, the model may capture overall EC fluxes during the evaluation period. However, species-specific responses can still lead to deviations between simulations and measurements under particular conditions, such as heatwaves and droughts (Remy et al., 2019). Similarly, caution is advised for periods when EC data are missing. Such periods that require statistical gap filling in order to derive complete budgets for whole days, seasons, or years can be substantial. Such gap filling is usually applied without considering temporally and spatially changing footprint contributions or species composition, which could lead to biases. In addition, missing knowledge about short-term (Fox et al., 2009) or long-term (Mahecha et al., 2007) ecosystem dynamics may lead to substantial under- or overestimation of fluxes and increases the uncertainty of extrapolations into the future. Along with other issues, this data-related uncertainty has been highlighted as important for model evaluation (Medlyn et al., 2005), but only few approaches have been investigated this uncertainty explicitly at EC flux tower sites (e.g. Kutsch et al., 2005; Oishi et al., 2008), particularly in comparison with model applications indicating also the importance for spatial and temporal model resolution.
Therefore, the first objective of this study is to assess the uncertainty of fluxes when using EC measurements for evaluation of vegetation models that are initialized at specific footprint areas differing in species composition. In particular, we examine how variations in species composition affect evapotranspiration (ET) and net ecosystem exchange (NEE) when dynamically changing flux footprint predictions (FFPs) are considered. The second objective is to characterize the flux contribution of Douglas fir and beech within a mixed forest area, using a combined measurement and modelling approach. We hypothesize that simulations representing the species contribution in the FFP can provide a complementary perspective to conventional statistical gap-filling procedures by enabling species-resolved interpretations of missing fluxes.
To achieve these objectives, we (i) quantify hourly varying species contributions based on flux footprint predictions (FFPs) of an EC measurement site located in a heterogeneous forest, and (ii) evaluate the impact of FFP-specific species composition on model-measurement comparisons of net CO2 exchange and latent heat flux. The different species contributions are analyzed on different temporal scales, e.g. to differentiate between growing and non-growing season or different phenological periods. The considered site is a mixed forest dominated by patches of European beech and Douglas fir – tree species that will play a considerably larger role for future German forestry (Brandl et al., 2020; Gribbe et al., 2024). The simulations are carried out with the LandscapeDNDC model (Haas et al., 2013), which has therefore been calibrated at independent sites with pure beech (Herbst et al., 2015; McGloin et al., 2018; Pilegaard et al., 2003) and Douglas fir forests (Morgenstern et al., 2004; Van Wijk et al., 2001). The sites and calibration results are further described in the methods section and in the supplementary information.
2.1 Site description
The measurement site (48.2685° N, 7.8782° E, 490 m a.s.l.), called ECOSENSE forest, is located in the Black Forest close to the town of Ettenheim in Southwest Germany. It is a mixed forest and the area we assumed as potential flux footprint area is dominated by European beech (Fagus sylvatica, 47 %), but holds major shares of Silver fir (Abies alba, 25 %) and Douglas fir (Pseudotsuga menziesii, 21 %) (Fig. 1). The mixture type is a group mixture with firs concentrating in an approximately 200×20 m stripe within a beech forest. The average height of the dominant trees (larger than 20 cm diameter at breast height), as well as the upper height (standard deviation added to the average) is only slightly different between the species (25.5 and 27.8 m for beech, 26.0 and 29.0 m for coniferous trees, respectively). Within the ECOSENSE forest, a 46 m tall measurement tower was instrumented with an EC system and various measurement devices designated to capture carbon and water fluxes and stress relate responses (Werner et al., 2024). According to the Köppen classification, the climate at this site is temperate oceanic with mild to warm summers and cold winters. The mean annual air temperature is about 9.7 °C (ranging from 1.1 °C in January to 18.8 °C in July) and mean annual precipitation is approximately 1000 mm over the last 20 years using historical data from the nearest meteorological Lahr station (ID 2812) of the German Weather Service (DWD). Geologically, the area lies on Triassic sedimentary rock, predominantly the Plattensandstein Formation – sandstone interbedded with clay layers – with minor outcrops of the Rotton Formation. The soils at the study site are Cambisols with silty loam to loamy clay textures, free of carbonates, and well-developed to depths of 60–120 cm. They exhibit moderate permeability and low stone content (Werner et al., 2024).
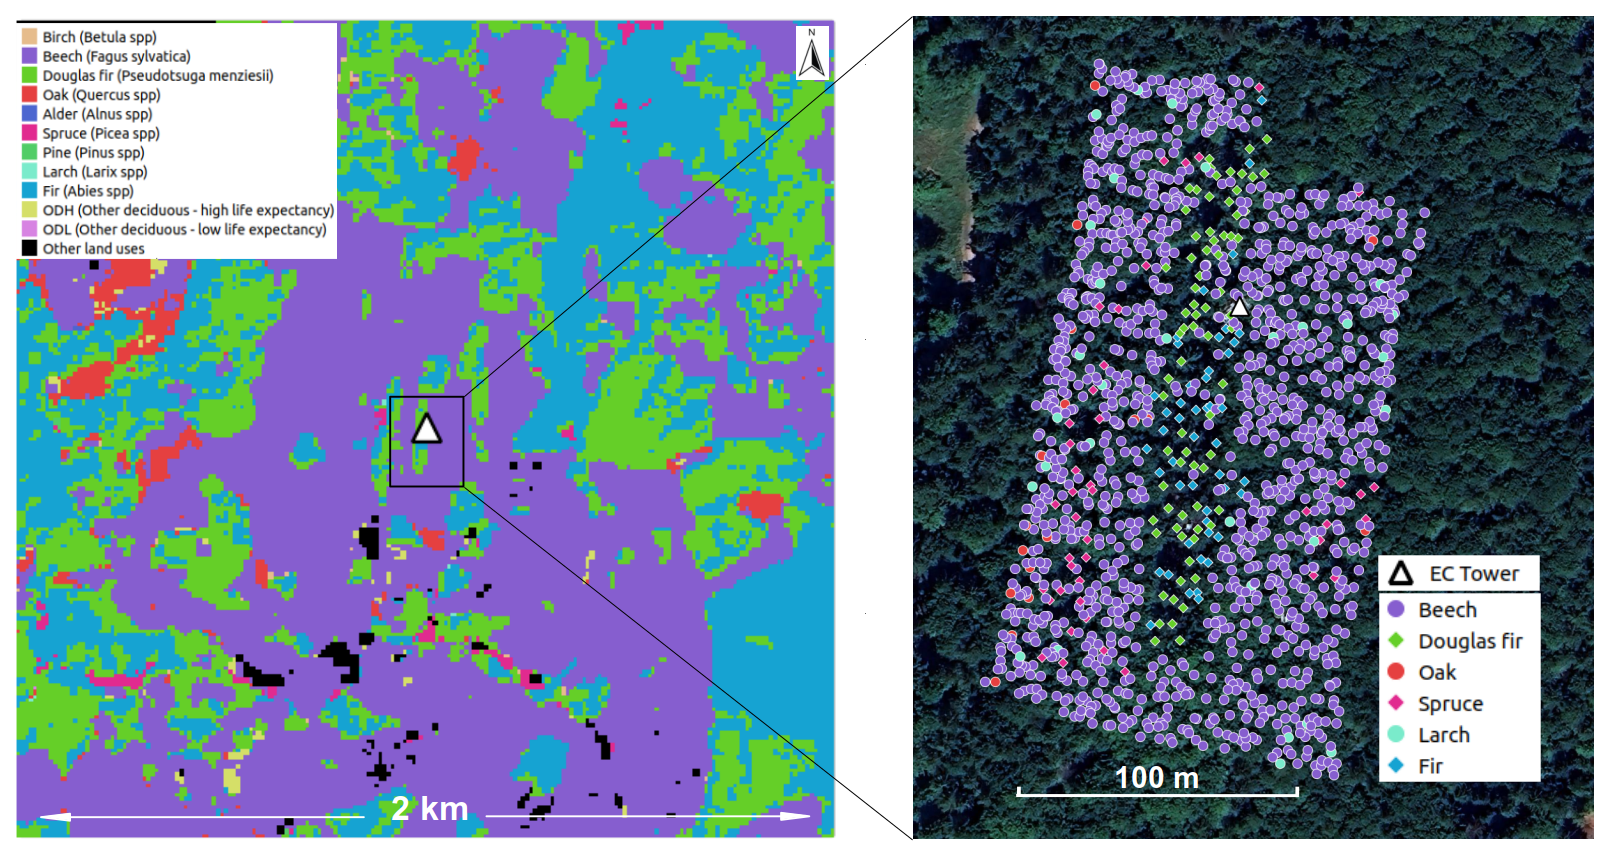
Figure 1Dominant tree species map within the 2×2 km window (left) from Blickensdörfer et al. (2022) and the tree inventory in the ECOSENSE experimental site (right). Background imagery: Map data © Google 2025, Maxar Technologies. The white triangle shows the location of the eddy covariance (EC) tower.
2.2 Site measurements
2.2.1 Eddy covariance measurements
The EC technique was used to measure the ecosystem CO2 and water vapor fluxes (evapotranspiration, ET) above the ECOSENSE forest (Aubinet et al., 2012; Burba et al., 2013). The EC instrumentation consists of a closed-path fully heated infrared gas analyzer (model Li-7200, LI-COR Inc., Lincoln, NE, USA) combined with a three-dimensional sonic anemometer (model CSAT3B, Campbell Scientific Inc., Logan, UT, USA), both measuring at a frequency of 20 Hz. Due to technical problems, the heating system was not working until early December 2024. The EC measurements were performed approximately 18 m above the canopy of the ECOSENSE forest on top of a measurement tower at a height of 46 m above ground level.
EddyPro (version 7.0.9) was used to calculate half-hourly fluxes, which were later averaged to hourly fluxes, from the 20 Hz measurements of the infrared gas analyzer and the three-dimensional sonic anemometer (LI-COR Biosciences, 2022). In this study, only CO2 fluxes and ET data with quality flags 0 or 1 were used for further analysis, data with quality flag 2 were discarded. The REddyProc software was used for further processing of the EC data (Wutzler et al., 2018), including u∗-filtering according to Papale et al. (2006) and gap filling using the marginal distribution sampling (MDS) method (Reichstein et al., 2005). The MDS method applies look-up tables for similar meteorological conditions, considering shortwave irradiance, air temperature, and vapor pressure deficit, to fill the gaps in the flux data. If no meteorological data are available, the gaps in the flux data are filled using the MDS method with the mean daily course of the fluxes in a moving time window of adjacent days (Reichstein et al., 2005; Wutzler et al., 2018). A flux footprint prediction climatology was created for every hour with available data from the EC system, using the R-code of Kljun et al. (2015). The FFPs were calculated for a domain of 2×2 km centered on the tower at a spatial resolution of 1×1 m. The input data for the flux footprint predictions were taken from the EddyPro output, except planetary boundary layer height, which was retrieved from the ERA5-Land weather reanalysis dataset (Hersbach et al., 2023). The available EC data from the first year after start of the measurements (15 May 2024 to 15 May 2025) were used for the presented analysis. For FFP calculations over forested areas, the zero-plane displacement (d) must be considered. In absence of vertical wind profile measurements, we followed the common practice to assume that d equals two-thirds of the canopy height. However, since the reported values of d in relation to canopy height range between 0.5 and 0.8 (Oliveira et al., 2022), we tested the sensitivity to the choice of this parameter varying it within this range (−25 % to +20 % relative to the standard value). Overall, the effect on flux contribution to the variation of d was less than 1 % in comparison to the reference case (see Table S2 in the Supplement).
2.2.2 Auxiliary measurements
Meteorological data
Several meteorological variables required as input for the LandscapeDNDC model are measured at the study site. Solar irradiance was measured by a heated and ventilated pyranometer (model CNR4, Kipp & Zonen, Delft, Netherland) mounted on the tower above the forest at a height of 47 m. Wind speed and direction was derived from the three-dimensional sonic anemometer integrated in the EC system. Unless data from the EC system were unavailable, data from a propeller anemometer (model Young 05103, R. M. Young Company, Traverse City, Michigan, USA) also mounted on top of the tower were used. Air temperature and relative humidity are taken in the vicinity of the site under open field conditions with sensors mounted at a height of 2 m above ground level inside a passive ventilated radiation shield (model HygroVue 10 and RAD10E, Campbell Scientific Inc., Logan, UT, USA).
Soil moisture
In the ECOSENSE forest permanently installed soil moisture sensors SMT100 (Truebner GmbH, Neustadt, Germany) are used to measure dielectric permittivity, soil temperature and volumetric soil water content based on time domain transmission (TDT) principle. A total of 40 sensors were installed in 10 profiles of 4 depths (30, 50, 70 and 90 cm) at the center (plateau) of the observed EC footprint area continuously measuring at a frequency of 15 min. For investigating species influences, two plots were selected influenced only by either purely beech or Douglas fir respectively, each holding seven neighboring trees of similar age and height. Within each of the plots, five soil moisture profiles were arranged in a stratified-random design to ensure a good spatial coverage. First measurements started in October 2023 and are ongoing. All raw data undergo a quality control procedure adapted from Dorigo et al. (2013).
Soil respiration
Soil respiration was measured with an open bottom chamber equipped with a CO2-Sensor (GMP343, Vaisala Oyj, Finland) at a total of 35 plots (2.25 m2 per plot). The 35 plots were measured once within one day but always in a different order to prevent any diurnal effects. We recorded the tree species for each plot within a vicinity of 5 m (radius) and for model evaluation we only chose plots influenced by either pure European beech (18 plots) or pure Douglas fir (8 plots) composition. Soil respiration was measured on a weekly to bi-weekly basis using two measurement chambers simultaneously during the complete year 2024. To avoid saturation effects at the end of the measurement or too slow increase at the beginning of the measurement, time was varied depending on the season between 90 and 140 s. From both measurements we calculated a mean value, reporting the respiration for each plot. In very rare cases (< 1 %) system errors happened and the measurement time is only 80 s (1 of 1750 cases) or only one measurement per plot per day is available (3 of 1750 cases).
2.3 LandscapeDNDC model
2.3.1 Model description
LandscapeDNDC (https://ldndc.imk-ifu.kit.edu, last access: 15 August 2025) is a modular terrestrial ecosystem model (Grote et al., 2011b; Haas et al., 2013). The physiological simulation model (PSIM) of the model framework, which is used for representing forest related processes, is based on cohorts represented by trees with equal dimensions and homogeneous spatial distribution. It has been designed to reproduce atmosphere–biosphere exchange processes of carbon, water, and nitrogen, including C and N trace gas exchanges. For this purpose, detailed microclimate, biogeochemical, and physical soil process modules are provided to be coupled with vegetation modules (i.e. physiology and structure) that are parameterized at the species level. Consequently, all processes directly or indirectly depend on environmental drivers. The LandscapeDNDC model uses air temperature, global radiation, vapor pressure deficit (or relative humidity), and precipitation as meteorological inputs in daily to sub-daily temporal resolution. Soil as well as canopy are 1-D divided into multiple layers, with flexible extensions and properties, depending on available measurements and the initialized ecosystem structure.
Forest carbon uptake and loss are calculated within PSIM from the basic processes which are photosynthesis and respiration, allocation and senescence (separately for each cohort, in monocultures there is only one). Photosynthesis is calculated according to the Farquhar model (Farquhar et al., 1980), which is linked to a soil water-limited stomatal conductance module to optimize gas exchange (Leuning, 1995). Stomatal conductance and soil water availability is thus also defining transpiration. Other relevant gaseous water fluxes are evaporation from interception, which is calculated based on leaf area dependent canopy capacity, as well as from snow, open water at the ground and soil. These evaporation terms are driven by potential evaporation determined by a modified Thornthwaite approach (Thornthwaite and Mather, 1957). All of these processes are calculated in hourly resolution, for more details see descriptions in Holst et al. (2010). Respiration is differentiated into autotrophic respiration, which in turn origins from growth (fixed fraction of carbon allocated to increase biomass), maintenance (in dependence on tissue temperature and nitrogen concentration, according to Cannell and Thornley (2000) and nitrogen uptake (fixed rate related to nitrate uptake), and heterotrophic respiration related to microbial decomposition of organic matter driven by soil moisture, pH, and temperature. Carbon (and nitrogen) is allocated into the compartments: leaves, fine roots, living wood, and structural reserves according to their individual sink strength (Grote, 1998), with leaf demand driven by phenology which in turn depends on cumulated temperature and chilling requirements. Senescence of all compartments are determined by their turnover rates, and all dead materials are added to the soil carbon (and nitrogen) pools, where the explicit calculation of decomposition processes supplies heterotrophic respiration.
LandscapeDNDC has demonstrated that it could represent EC fluxes at sites dominated by oaks, pines, spruces, and beeches before (Cade et al., 2021; Molina-Herrera et al., 2015; Nadal-Sala et al., 2021). It also performed well in multi-model comparisons which evaluated aspects including forest growth (Cameron et al., 2013; Mahnken et al., 2022) and has been used to investigate carbon and water fluxes in various forested ecosystems in European sites (Dirnböck et al., 2020; Magh et al., 2019) as well as worldwide (Rahimi et al., 2021).
2.3.2 Model initialization and driving forces
In this study we used hourly meteorological data for the period from 15 May 2024 to 15 May 2025, corresponding to available EC time series at the ECOSENSE site (Fig. 2). We considered a spin-up period of 1.5 years starting in January 2023, which showed to be sufficient to allow carbon pools in the soil to equilibrate. Hourly air temperature, global radiation, wind speed, and relative humidity were taken from on-site measurements (see Sect. 2.2.2). Hourly precipitation data from the meteorological station Lahr operated by the German Weather Service (Deutscher Wetterdienst; DWD; https://cdc.dwd.de, last access: 10 June 2025), located approximately 7 km from the ECOSENSE site.
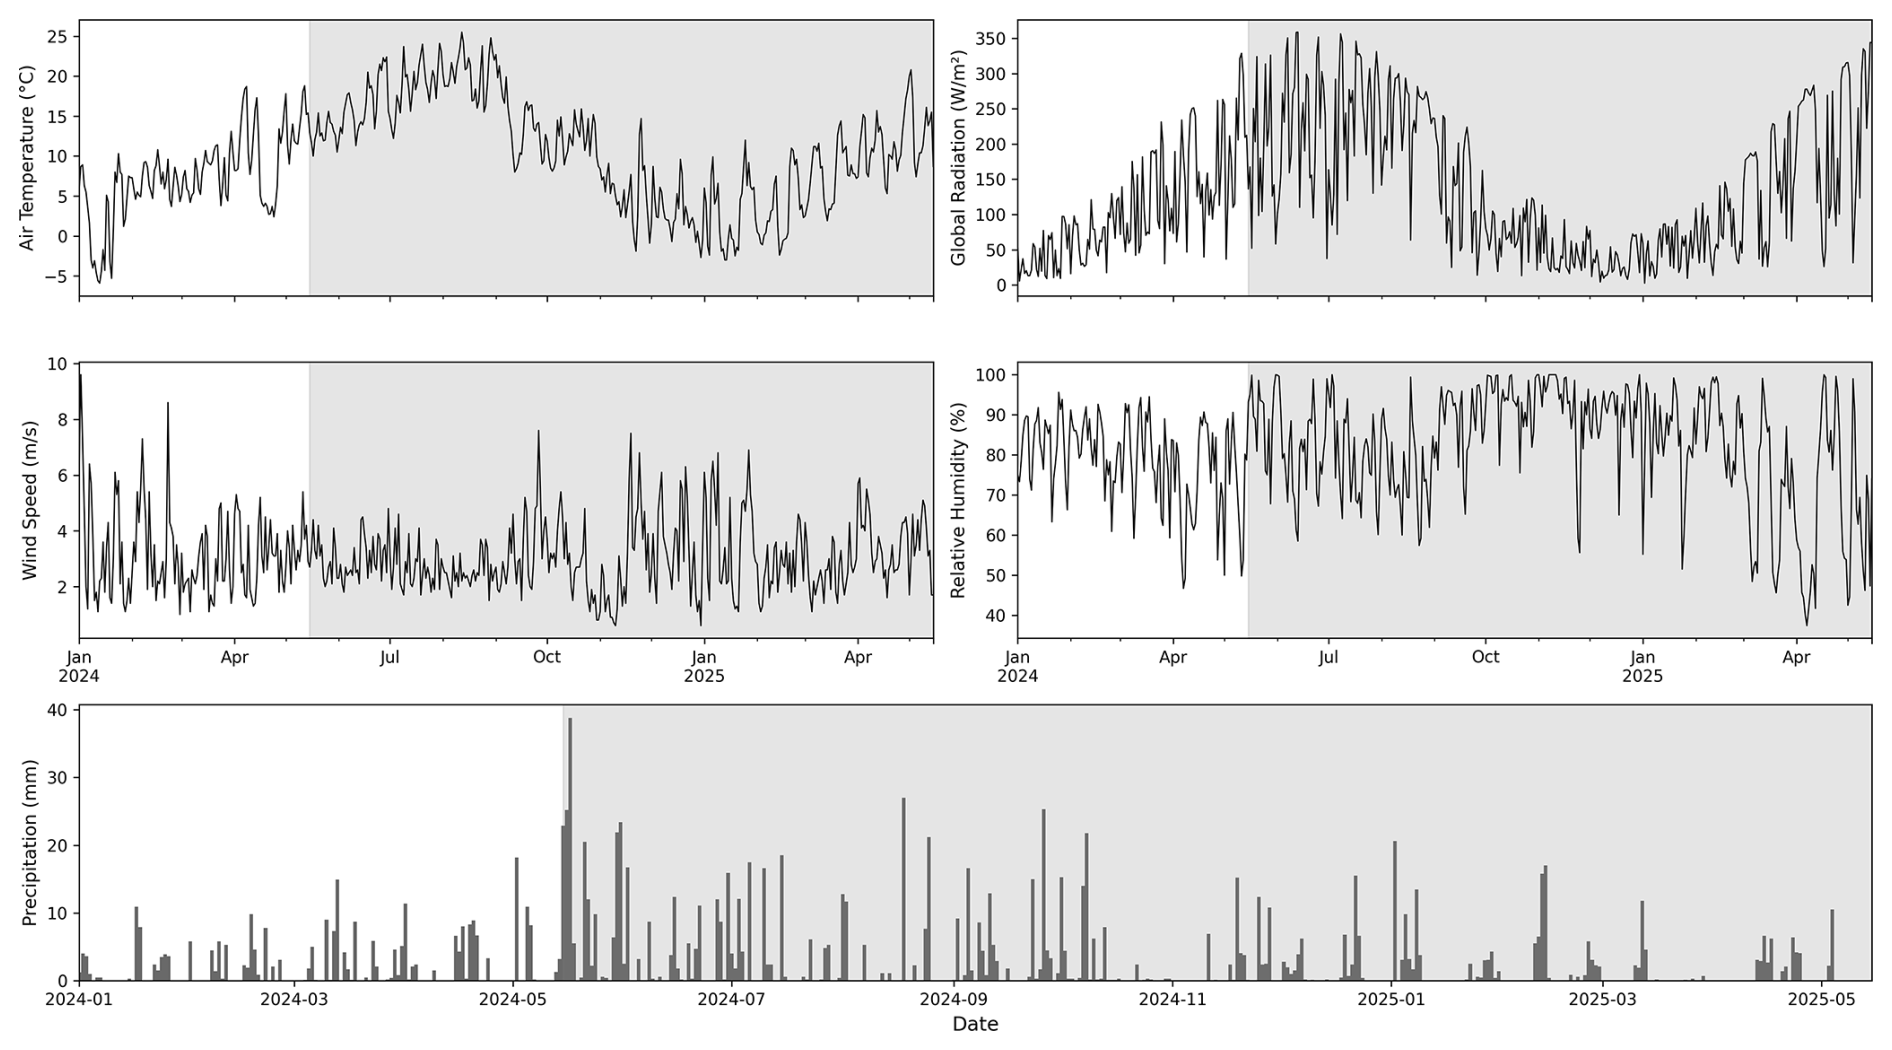
Figure 2Daily mean meteorological variables for the ECOSENSE forest during the period from 1 January 2024 to 15 May 2025. The shaded area represents the study period. Daily precipitation sums are from nearby DWD Station Lahr.
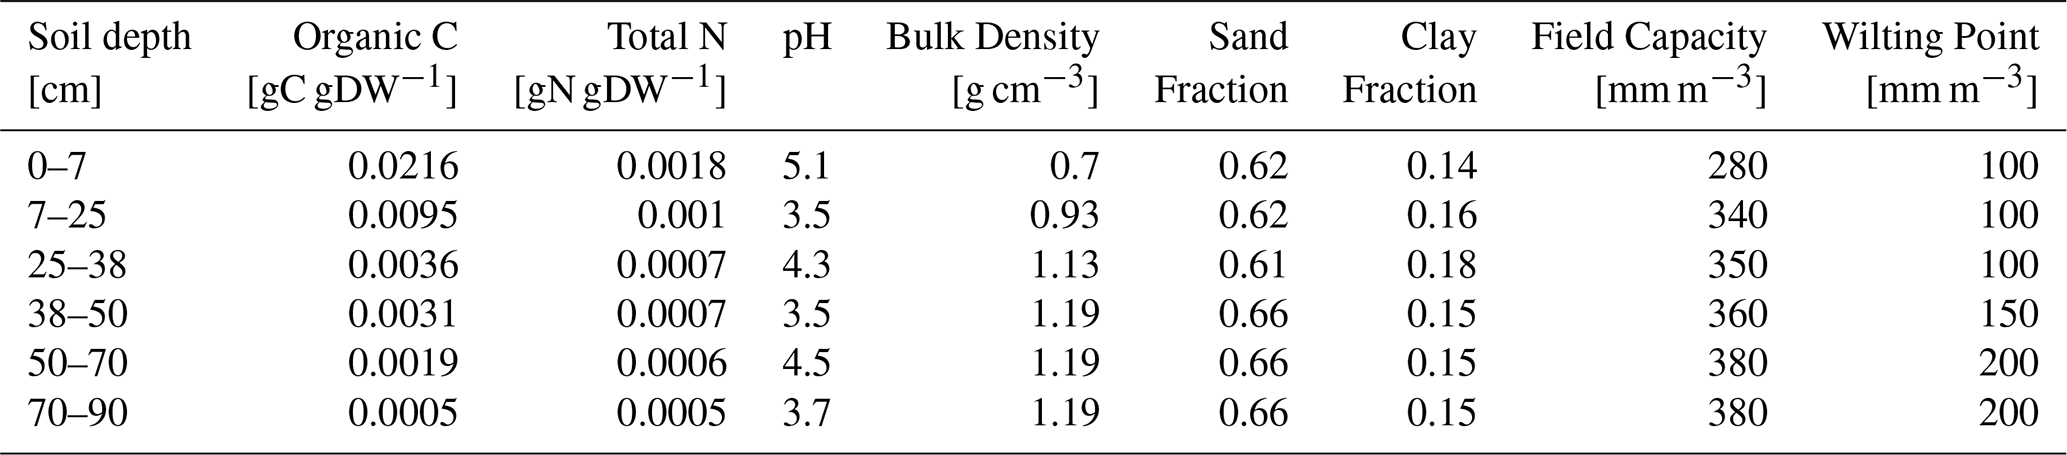
The soil initialization of the model is based on a vertical profile of soil physicochemical characteristics i.e., humus type, clay and sand content, organic C- and N-content, bulk density, saturated conductivity, stone content, pH, field capacity, and wilting point (Table 1). Only one single on-site soil profile was available for this purpose that we used for all simulations. Regarding the vegetation, we initialized two separate forest types, one representative for a beech and one for a Douglas fir forest, each indicating tree species, dominant height, tree diameter at breast height (DBH), and number of trees per hectare. In this initialization, we consider all coniferous trees to be Douglas fir, implicitly assuming that gas exchange responses of Silver fir are sufficiently similar to Douglas fir to be merged. The initialization for the beech and the Douglas fir simulations, respectively, include the upper height, mean diameter, and stem number which are derived from an individual tree inventory carried out across an area of 3 ha surrounding the EC tower (Fig. 1, right). In addition, we used the dominant tree species map at 10 m resolution (Blickensdörfer et al., 2022) to determine the overall shares of coniferous (mostly Douglas fir and Silver fir) and deciduous (mostly beech) within a potential footprint area which is a window of 2×2 km with the ECOSENSE site in the center (Fig. 1, left).
Table 1Mineral soil properties used for initialization of the LandscapeDNDC model.
2.3.3 Model parameterization, calibration and evaluation setup
The LandscapeDNDC model in a similar configuration has been used to simulate beech stands already (Grote et al., 2011a; Holst et al., 2010) but has not been applied for Douglas fir before. Thus, Douglas fir simulations required a completely new parameterization, mostly derived from literature (see Table S1 for parameters and sources). Nevertheless, in order to decrease the uncertainty related to literature derived physiological parameters, we calibrated the most sensitive parameters for water and carbon fluxes with EC measurements from various long-term observation sites. Therefore, we initialized the model for additional 3 pure beech sites and 2 pure Douglas fir sites, which provided data of latent heat flux and net carbon ecosystem exchange for at least 5 (but mostly more than 10) years. For beech we used three ICOS sites: Leinefelde in Germany (DE-Lnf; Herbst et al., 2015), Soroe in Denmark (DK-Sor; Pilegaard et al., 2003), and Stitna in the Czech Republic (CZ-Stn; McGloin et al., 2018), and for Douglas fir, we used the Speulderbos site in the Netherlands (Su et al., 2009; Van Wijk et al., 2001) and the Campbell River site in Canada (CA-Ca1; Morgenstern et al., 2004). Climate input was available daily and fluxes were accordingly aggregated and compared at this temporal resolution. During the process of evaluation, we noted that it was necessary to re-evaluate the quality flags for the until now unpublished dataset from the Speulderbos site, and to exclude two years from the total measurement series obtained from the Campbell River site due to unreliable meteorological measurements at the site. The specific criteria for these decisions are also provided in the supplementary materials (first section).
We calibrated the most sensitive parameters (see Table S1) for transpiration and CO2 exchange in a stepwise optimization approach for each site as well as for each species separately. The best parameters were selected by minimizing both the root mean square error (RSME) and the bias between the simulated and measured values. Although the site-specific parameterization in general yielded a closer fit, general species-specific parameters over all sites showed to represent all sites reasonably well (beech with R2 of 0.58 for NEE and 0.65 for ET, Douglas fir with R2 of 0.43 for NEE and 0.36 for ET). Bias is less than ±0.1 for most regressions except NEE for Douglas fir. These deviations mostly originate from a mismatch in spring, when fluxes were simulated to increase too early at Speulderbos but too late at Campbell River. For more details on error and bias of the calibration separated by ET and NEE see supplements (Supplement Figs. S1 to S3).
To evaluate the parameterized model's performance at our specific forest site, simulated soil respiration and soil moisture content at specific depths were compared with in situ measurements. Evaluation was carried out separately for plots initialized with beech- and Douglas fir, respectively using Nash–Sutcliffe efficiency (NSE) as the main performance metric.
2.4 Estimation of tree species contributions in dynamically changing flux footprints
To estimate the relative contribution of the different tree species within the FFP area of measured EC fluxes, we applied a raster-based spatial convolution approach using high-resolution, hourly FFPs and tree species cover data in analogy to Crawford and Christen (2015) (see Fig. 3). The analysis was restricted to a 2×2 km domain centered on the EC tower using only hourly footprints containing more than 80 % of the cumulative source contribution in domain. This restriction was necessary because the area containing 100 % of the cumulative source contribution would have been infinite, increasing the inconsistencies with LandscapeDNDC simulations (Kljun et al., 2015). Based on a preliminary statistical analysis, this 2×2 km domain typically captured the majority (90.7±3.7 %) of the sources area for the hourly flux measurements in the ECOSENSE site.
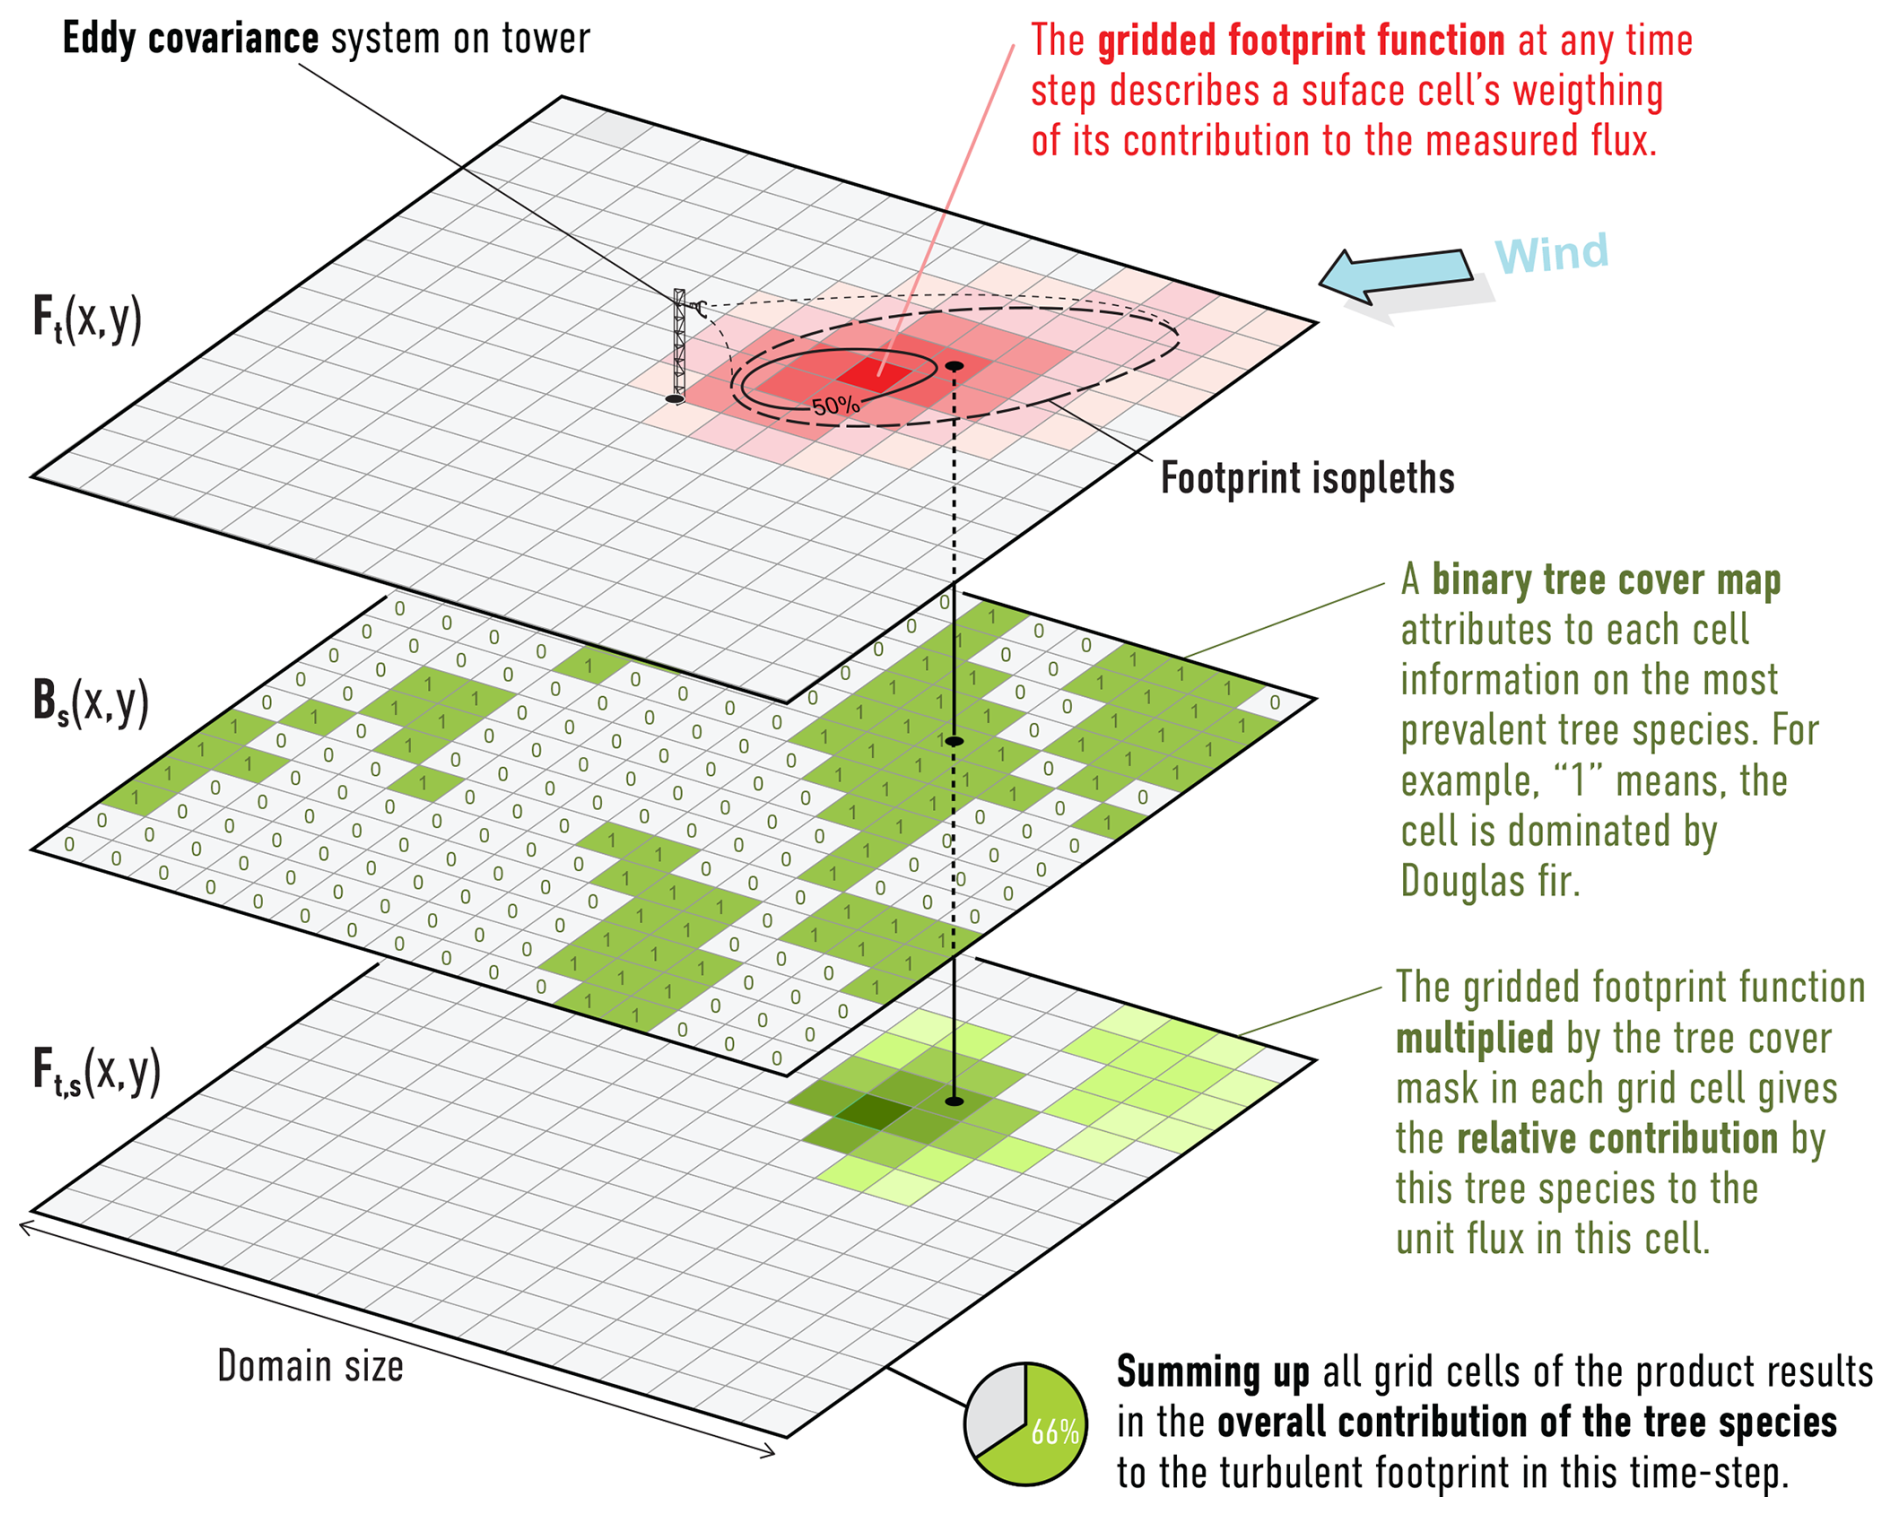
Figure 3Workflow for estimating tree species contributions to EC flux measurements using raster-based spatial analysis. For each species, a binary presence raster (middle) was generated (1 = species present, 0 = absent). Each binary raster was then multiplied by the corresponding hourly footprint function (top) to retain only the contribution from the target species. The total contribution of each species at each time step was obtained by summing the values of the resulting raster. This process was repeated for each species and each hourly footprint in the analysis period.
Flux footprint predictions were computed hourly using the analytical model by Kljun et al. (2015), producing a time series of raster layers Ft(x,y) at 1×1 m resolution, where each cell represents the % contribution of that location to the EC flux at time t. To align the spatial resolution of a tree species-cover dataset with the footprint raster, the 10×10 m dominant tree species grid (see Sect. 2.3.2) was resampled to 1×1 m resolution using nearest-neighbor interpolation, preserving a discrete species classification.
For each tree species s∈S, a binary mask Bs(x,y) was created, assigning a value of 1 to grid cells where species s was dominant, and 0 elsewhere. Each binary mask was then multiplied element-wise with the corresponding hourly footprint function following Eq. (1):
The resulting raster Ft,s retains only the contribution values associated with species s at time t. To obtain the total contribution of species s at each time step, all grid cell values in Ft,s were summed following Eq. (2):
where A denotes the 2×2 km analysis domain.
This procedure was repeated for each species and each hourly footprint to obtain a time series of species-specific source contributions Ct,s, expressed as a percentage of the total footprint signal within the 2×2 km domain. This raster-based method allowed for a consistent and scalable estimation of the relative contribution of each tree species to the EC measurements, directly linking flux source areas with vegetation composition at high spatial and temporal resolution.
2.5 Data analysis
To explore the vegetation source composition of EC carbon and water fluxes, we used NEE and ET from the LandscapeDNDC model and compared them with EC observations. The model was run for both, a pure beech and a pure Douglas fir stand representation. These two simulations were then combined in two ways and compared with EC fluxes: (i) using a static weighting (66.5 % beech, 33.5 % Douglas fir as average of all observed FFPs tree composition), and (ii) using a dynamic, footprint-based weighting, where hourly species contributions were derived by overlapping the FFP with a high-resolution dominant tree species map (see Sect. 2.3.2) and calculating the proportion of each species contributing at each time step.
Hourly aggregated EC based NEE and ET measurements were compared to the hourly outputs of each individual simulation as well as to the static and dynamic weighted averages for different time periods: the entire year (15 May 2024–15 May 2025), and the transitional periods in spring (flushing phase during April) and autumn (senescence during October). For each comparison, we applied simple linear regression and computed RMSE, NSE, and mean absolute error (MAE).
3.1 Model evaluation: Soil moisture and soil respiration
The simulated soil moisture and the simulated soil respiration showed good agreement with observations, capturing both seasonal dynamics and absolute ranges. For soil moisture at 30 cm depth, the simulated time series remained well within the observed range (min–max envelope from the five sensors), yielding NSE values of 0.65 for beech and 0.56 Douglas fir (Fig. 4). Similar results were observed at 50 cm depth with NSE values of 0.66 for beech and 0.57 for Douglas fir (Fig. S4). Soil respiration (sum of below-ground autotrophic and heterotrophic respiration) simulations captured the magnitude and seasonal patterns of measured fluxes, with simulations closely following the observed range derived from multiple daily chamber measurements (18 for beech, 8 for Douglas fir). Model–data agreement was high for both species: beech (NSE = 0.84) and Douglas fir (NSE = 0.63; Fig. 5).
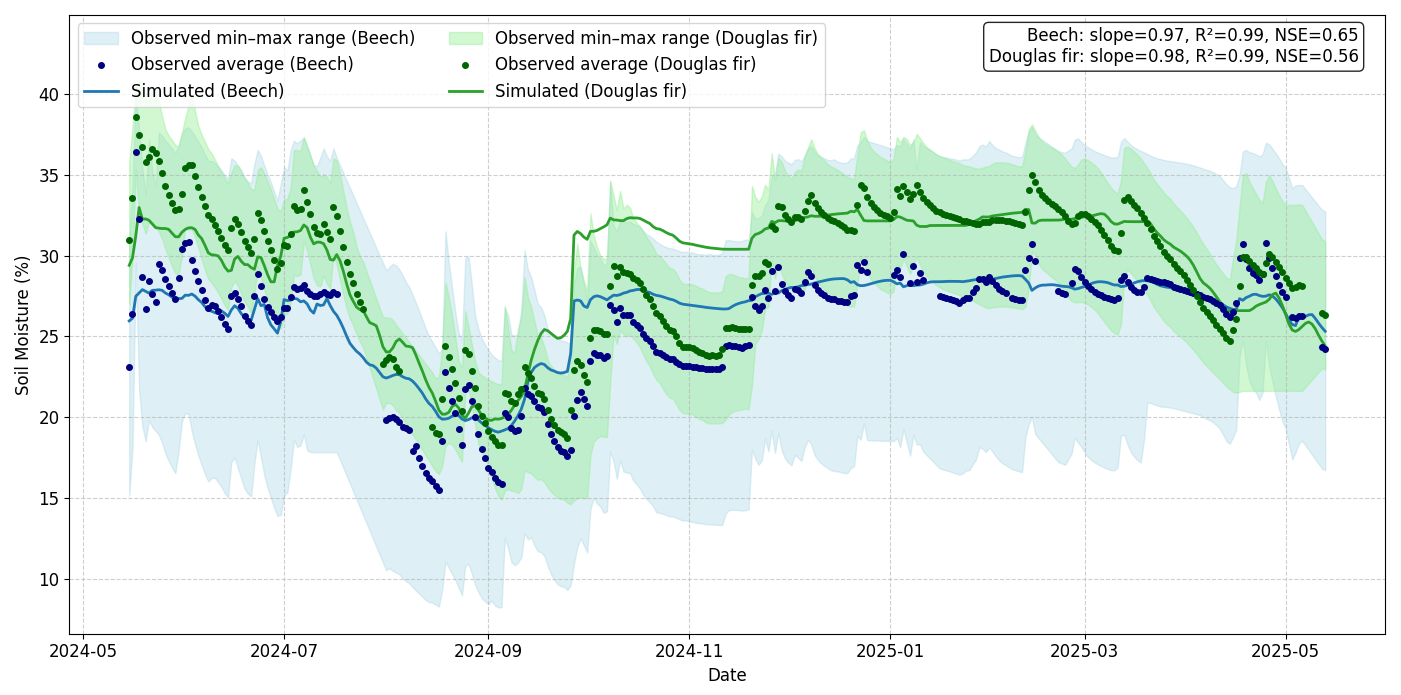
Figure 4Comparison of simulated and measured soil moisture at 30 cm depth for beech and Douglas fir plots from 15 May 2024 to 15 May 2025 at the ECOSENSE forest. The shaded area represents the observed range (min–max across five sensors in each plot), the dots show the average of the measured flux, while the solid line shows the model simulation.
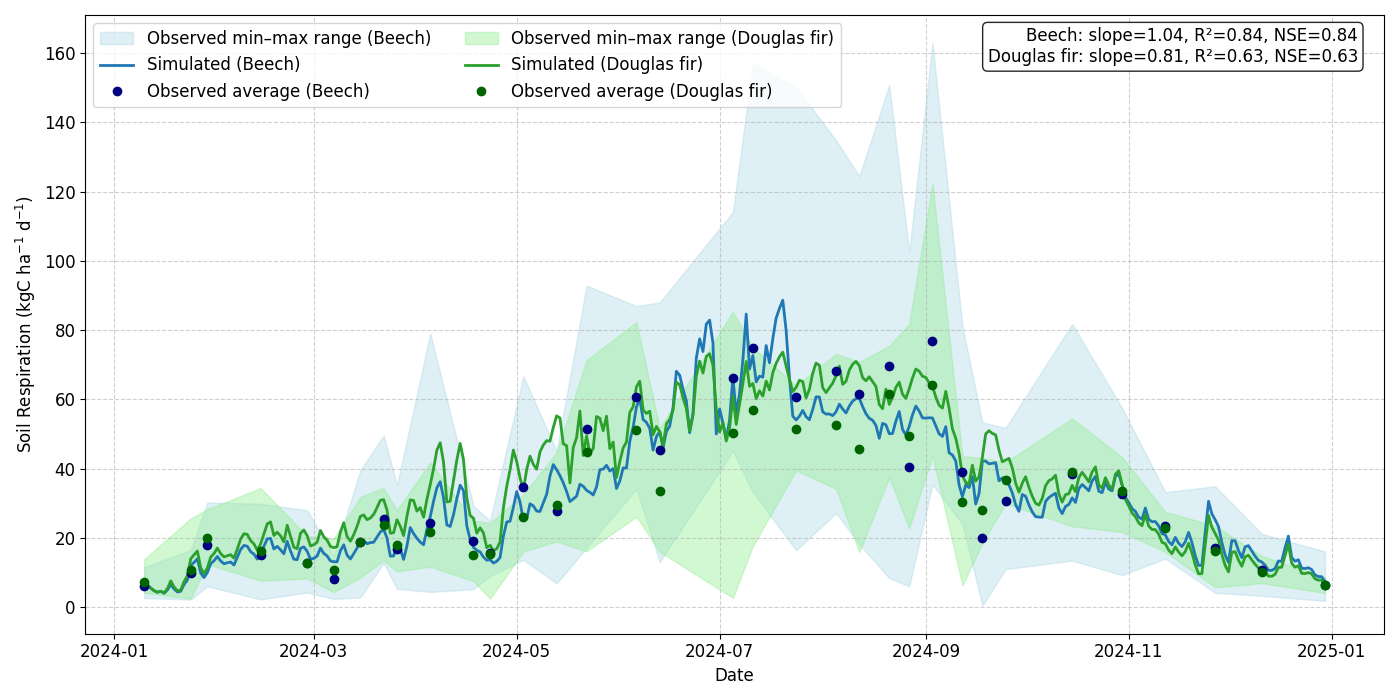
Figure 5Comparison of simulated and measured soil respiration for beech and Douglas fir stands. The shaded area represents the observed range (min–max across 18 chamber measurements per day for beech and 8 for Douglas fir), the dots shows the average of the measured flux, while the solid line shows the model simulation.
3.2 Spatial pattern of source area contribution
Seasonal and diurnal wind patterns strongly influenced the footprint of the EC fluxes at the study site. As shown in Fig. 6 (top left), winds predominantly originated from the south and southwest, with notable frequencies also from the east and northeast, varying by time of day and seasonally. These directional trends shaped the footprint geometry and the relative influence of different vegetation types on the measured fluxes. The species contribution assessed by averaging all footprints from a given wind direction (Fig. 6, bottom left) revealed that although beech dominated the source area in any wind direction (average contribution of 66.5 %), highest contribution from beech was estimated in the southeast (76.3 %) and south (71.0 %), while Douglas fir contributed more substantially at wind directions from the northeast (38.4 %), east (35.2 %), and southwest (35.0 %). We also checked if the impact of species might be influenced by variations in atmospheric stability and wind speed across cardinal directions, but variations in atmospheric stability and wind speed across different wind directions have only minor effects on species contributions within the FFPs (Fig. S5).
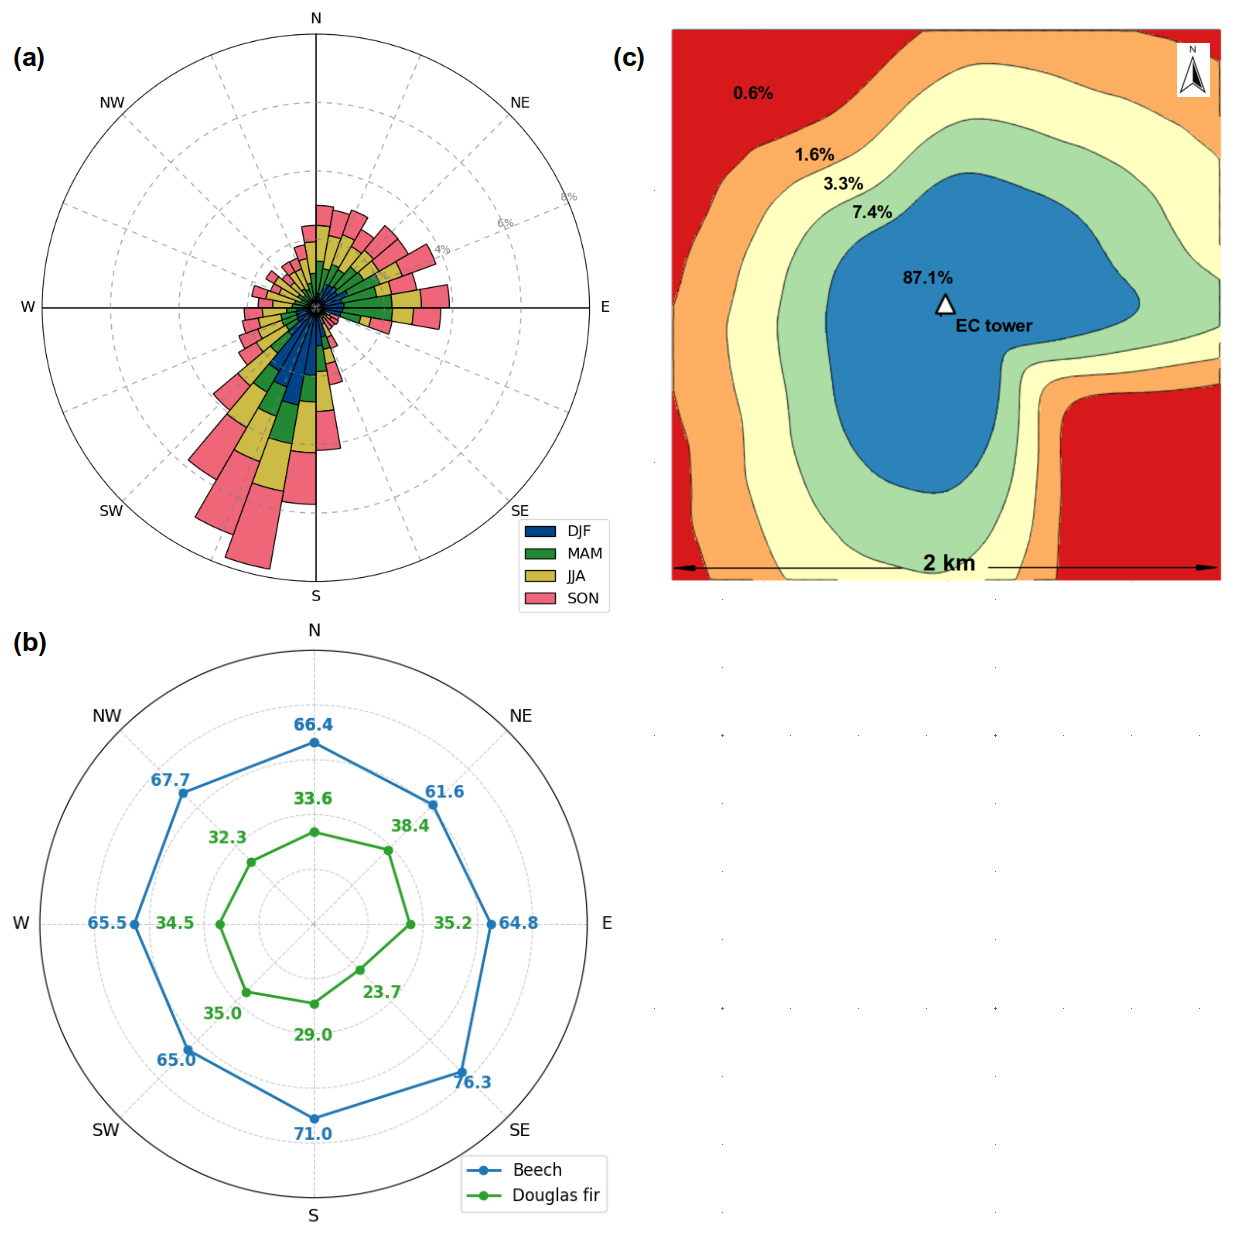
Figure 6Seasonal wind patterns and their influence on relative species contributions to EC fluxes. The wind rose (a, top left) shows the frequency and direction of winds at the study site from 15 May 2024 to 15 May 2025, with colors indicating different seasons (MAM: spring, JJA: summer, SON: autumn, DJF: winter). The source contribution heat map (c, top right) shows the cumulative footprint-weighted source area around the EC tower, aggregated over the study period. The species contribution plot (b, bottom) shows the average percentage contribution of beech and Douglas fir to the measured fluxes as a function of wind direction, based on footprint-weighted tree species data across directional bins.
The spatial distribution of source contributions, aggregated over the full study period, is presented in Fig. 6 (top right). The cumulative footprint shows that 87.1 % of the total EC flux signal originated from 80 ha (20 % of the 2×2 km area) around the EC tower. Due to the frequency distribution of the two dominant wind directions SSW and E, this high-contribution zone forms a distinctive shape resembling an inverted “L”, extending primarily southward and eastward. This spatial alignment underscores the role of wind-driven footprint dynamics and highlights how flux measurements are shaped by a focused, directionally biased region within the 2×2 km landscape surrounding the EC tower.
3.3 Simulated and measured evapotranspiration
Simulated ET was compared with ET calculated from the EC system (Fig. 7) considering four model configurations: pure beech (1) and pure Douglas fir (2), dynamically weighted forest types according to the specific footprint in any hour (3), and static footprint (4) with fixed species proportions representing the annual average (66.5 % beech and 33.5 % Douglas fir). The pure beech (1) and pure Douglas fir simulations (2) showed moderate agreement with observed ET based on the EC measurements, with R2 and NSE values between 0.51 and 0.54. Both simulations slightly underestimated peak ET, but linear regression slopes remained close to 1, and the mean bias was small (<−0.03 mm h−1 for all configurations). The footprint-weighted configurations 3 and 4 improved model–measurement alignment slightly. The dynamic footprint approach (3), integrating hourly footprint–land cover contributions, resulted in the highest NSE (0.56) closely followed by configuration 4 with the static footprint case (NSE = 0.55).
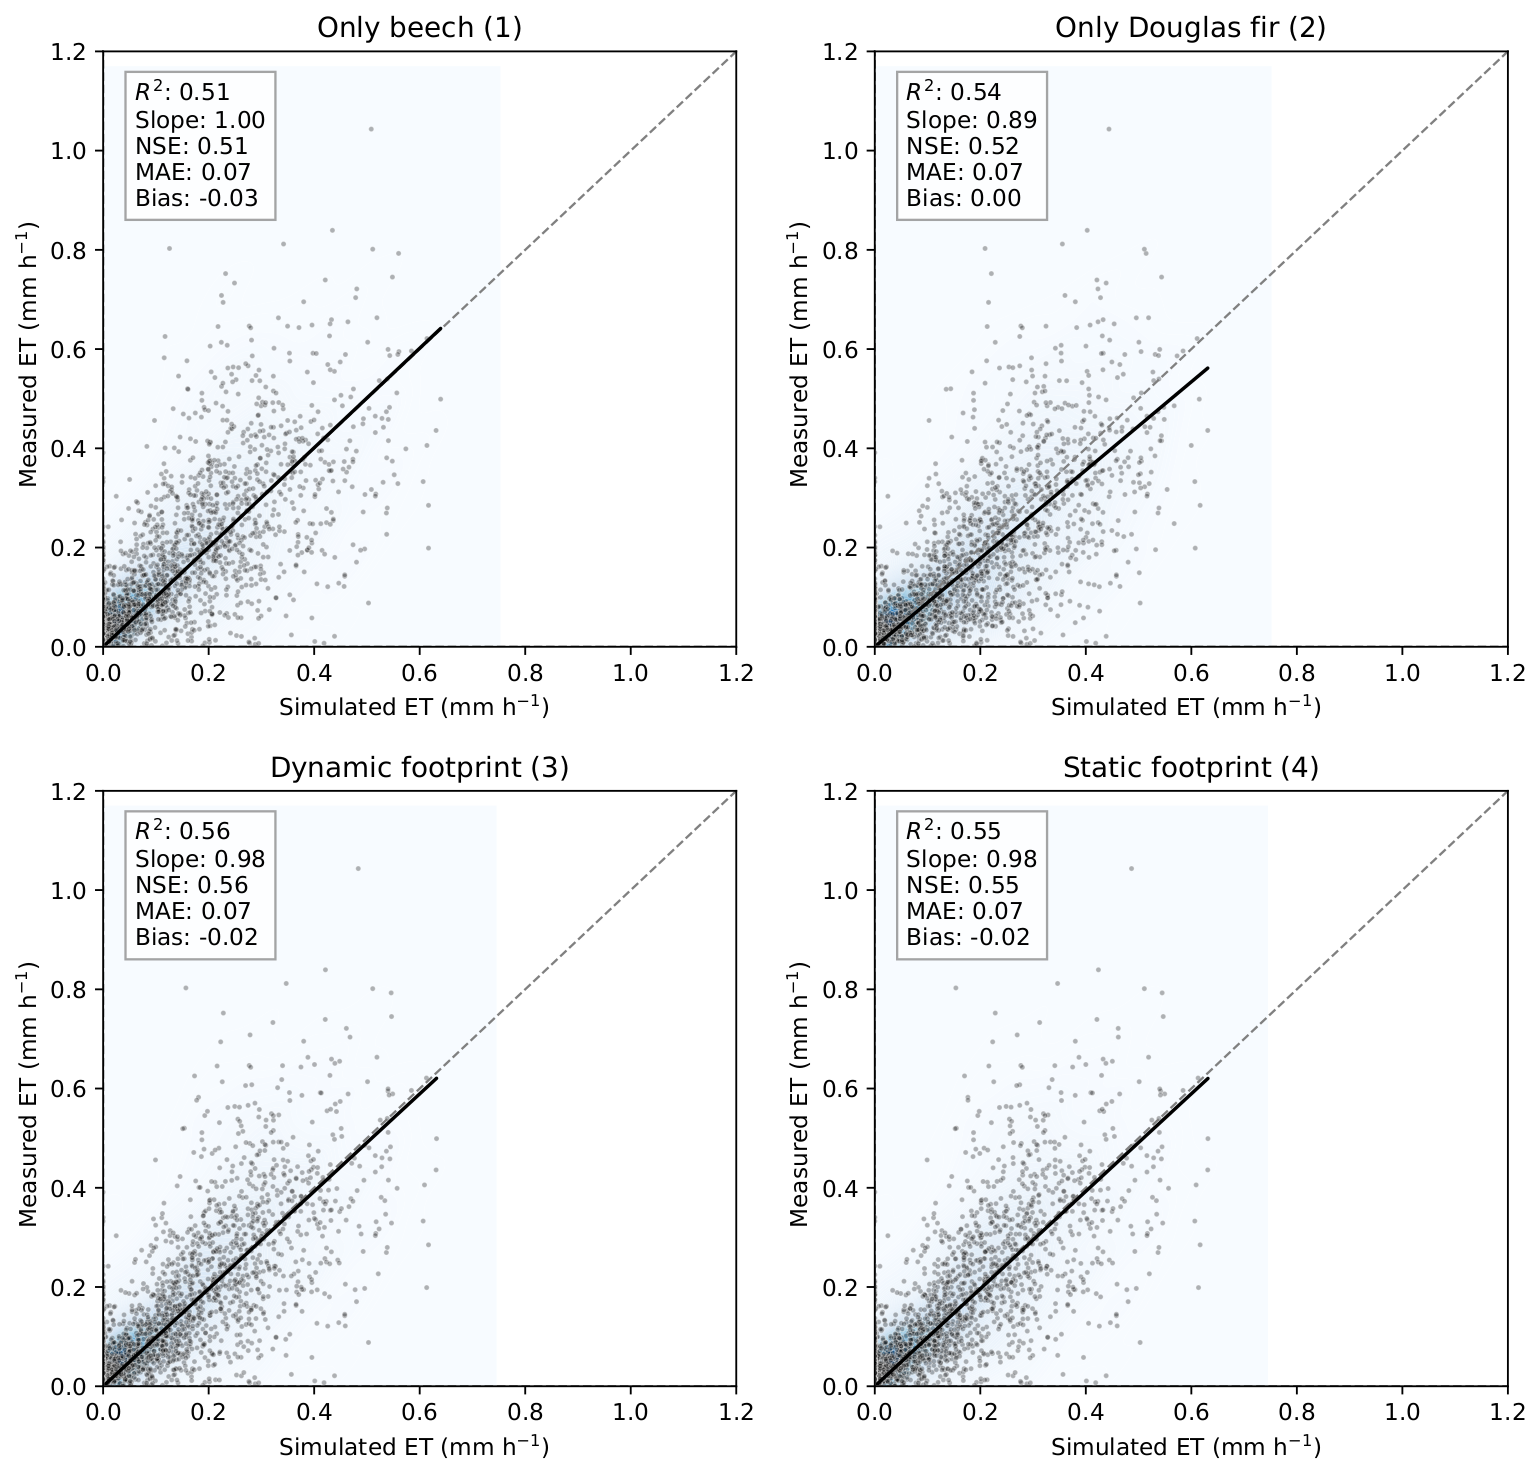
Figure 7Comparison between hourly measured and simulated evapotranspiration (ET, mm h−1) at the ECOSENSE forest for different model configurations: pure beech simulations (1) and pure Douglas fir simulations (2), dynamically weighted simulations according to the hourly footprint (3), and the static footprint (4) with fixed species proportions (66.5 % beech and 33.5 % Douglas fir). The shaded heatmap represents the kernel density estimate of point concentrations.
3.4 Simulated and measured net ecosystem exchange
3.4.1 Comparison at annual scale
Hourly NEE simulated by the LandscapeDNDC model was compared against EC measurements for the whole year considering the same four model configurations as described in Sect. 3.2 for ET evaluation. With all configurations the dynamics of NEE could be captured but with some differences in accuracy (Fig. 8). The pure beech simulation aligned slightly better with observations (R2=0.63, NSE = 0.63) than the pure Douglas fir simulation (R2= 0.55, NSE = 0.54), though both exhibited similar mean absolute errors and minimal bias (statistics are given in the figure). The agreement of simulations with measured NEE improved slightly when using footprint-weighted mixtures of the two species in the simulation (configurations 3 and 4) with similar statistical performance (R2= 0.67, NSE = 0.67, MAE = 1.86 kgC ha−1 h−1).
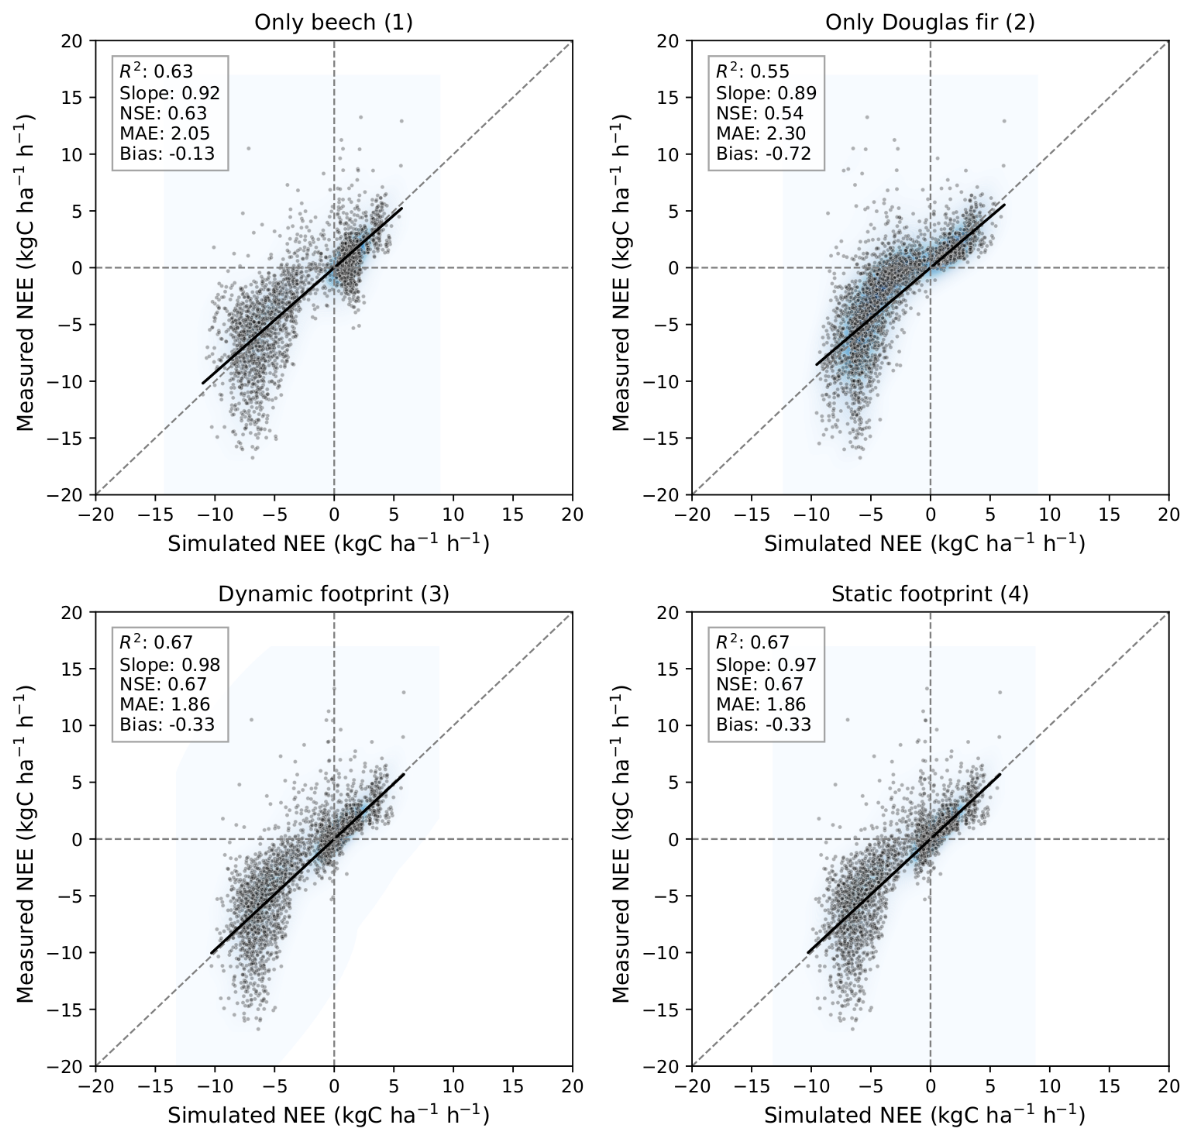
Figure 8Comparison between hourly measured and simulated net ecosystem exchange (NEE, kgC ha−1 h−1) at the ECOSENSE forest considering the configurations: pure beech (1) pure Douglas fir (2), dynamically weighted forest types according to the specific hourly footprint (3), and static footprint (4) with fixed species proportions (66.5 % beech and 33.5 % Douglas fir). The shaded heatmap represents the kernel density estimate of point concentrations.
3.4.2 Comparison across phenological phases
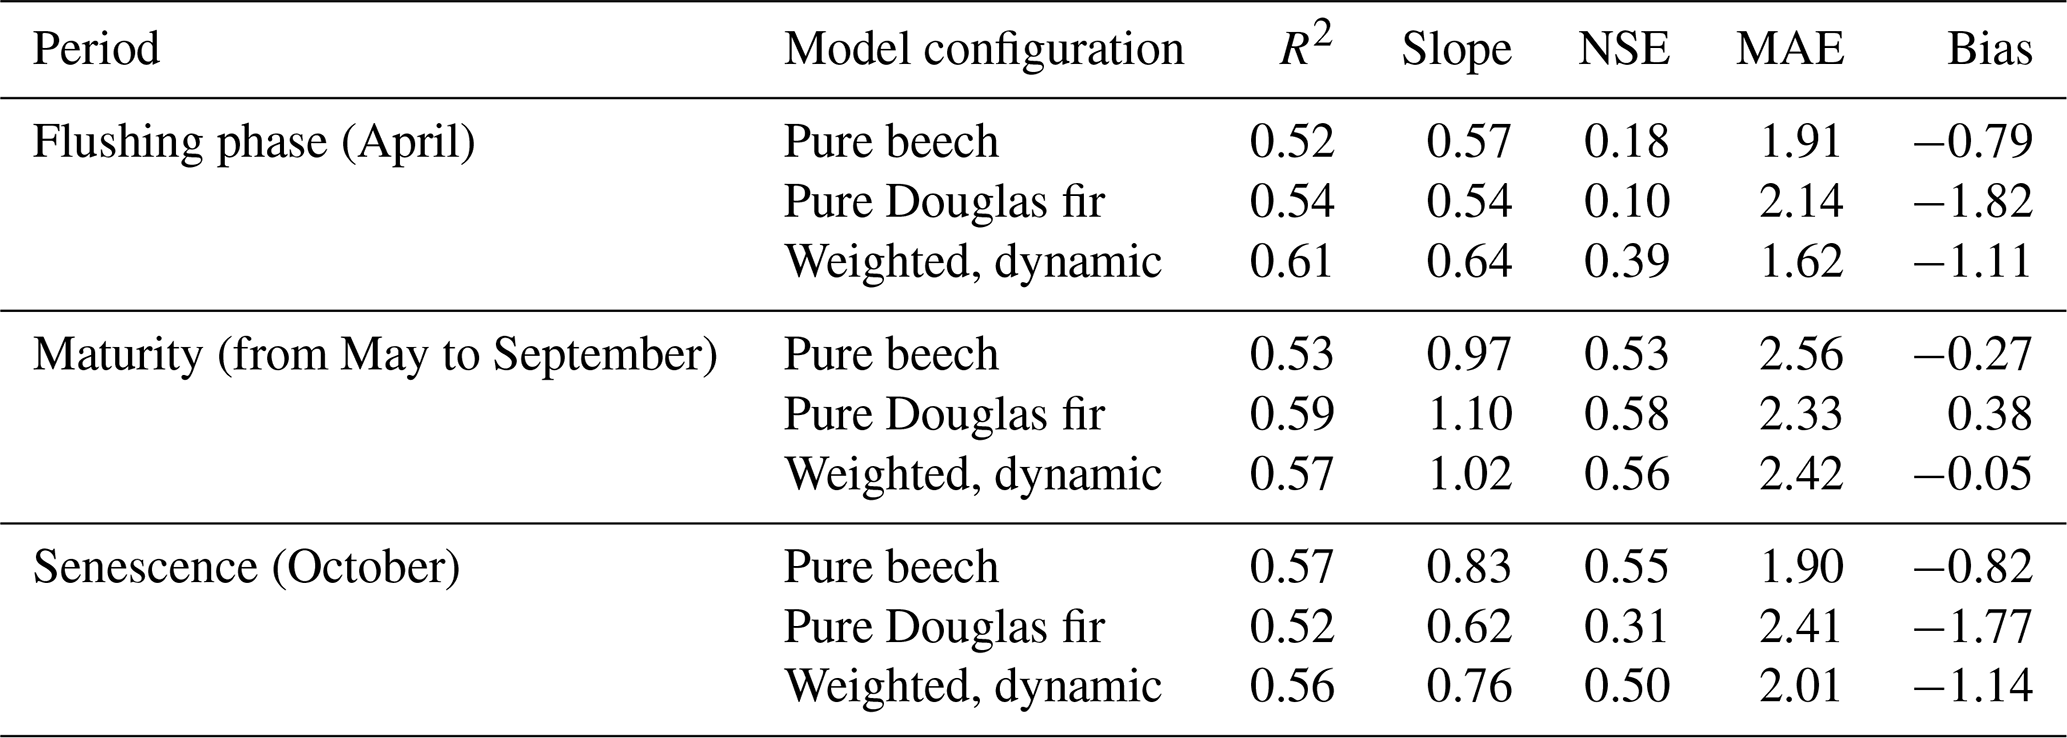
Although differences among the simulation configurations were relatively small at the annual scale, clearer contrasts emerged when analyzing distinct phenological phases. We therefore evaluated NEE separately during leaf flushing (April), the maturity period (May–September), and senescence (October). Modeled NEE for pure beech, pure Douglas fir, and their dynamic weighted combination reveals species-specific contributions to EC fluxes across phenological phases (Table 2, Fig. 9). During early leaf flushing in spring (April) where beech leaves are not yet fully developed, both pure-species simulations showed limited agreement with EC observations (NSE = 0.18 for beech and 0.10 for Douglas fir). The footprint-weighted dynamic simulation improved model–measurement agreement (NSE = 0.39), indicating that accounting for mixed species contributions better captures the transitional flux dynamics during early spring. In the maturity period (from May to September), all configurations performed similarly with the dynamic footprint simulations showing the smallest bias (−0.05). During the senescence phase (October) where beech leaves were supposed to be at least partly gone, the pure beech simulation maintained a surprisingly high perfomance (slope = 0.83, NSE = 0.55), while assuming a contribution of only Douglas fir showed a relatively weak correlation with EC observation (slope = 0.62, NSE = 0.31). The dynamic FFP simulation was in between (slope = 0.75, NSE = 0.50). Additional analyses distinguishing growing and non-growing seasons are provided in the Supplement (Fig. S6). Such a differentiation demonstrates that pure beech simulation produced exclusively positive NEE values (only respiration fluxes), which is clearly not in line with observations (NSE = −0.17). In this period, the dynamic footprint-weighted simulation, performed best, although the overall predictive skill remained limited.
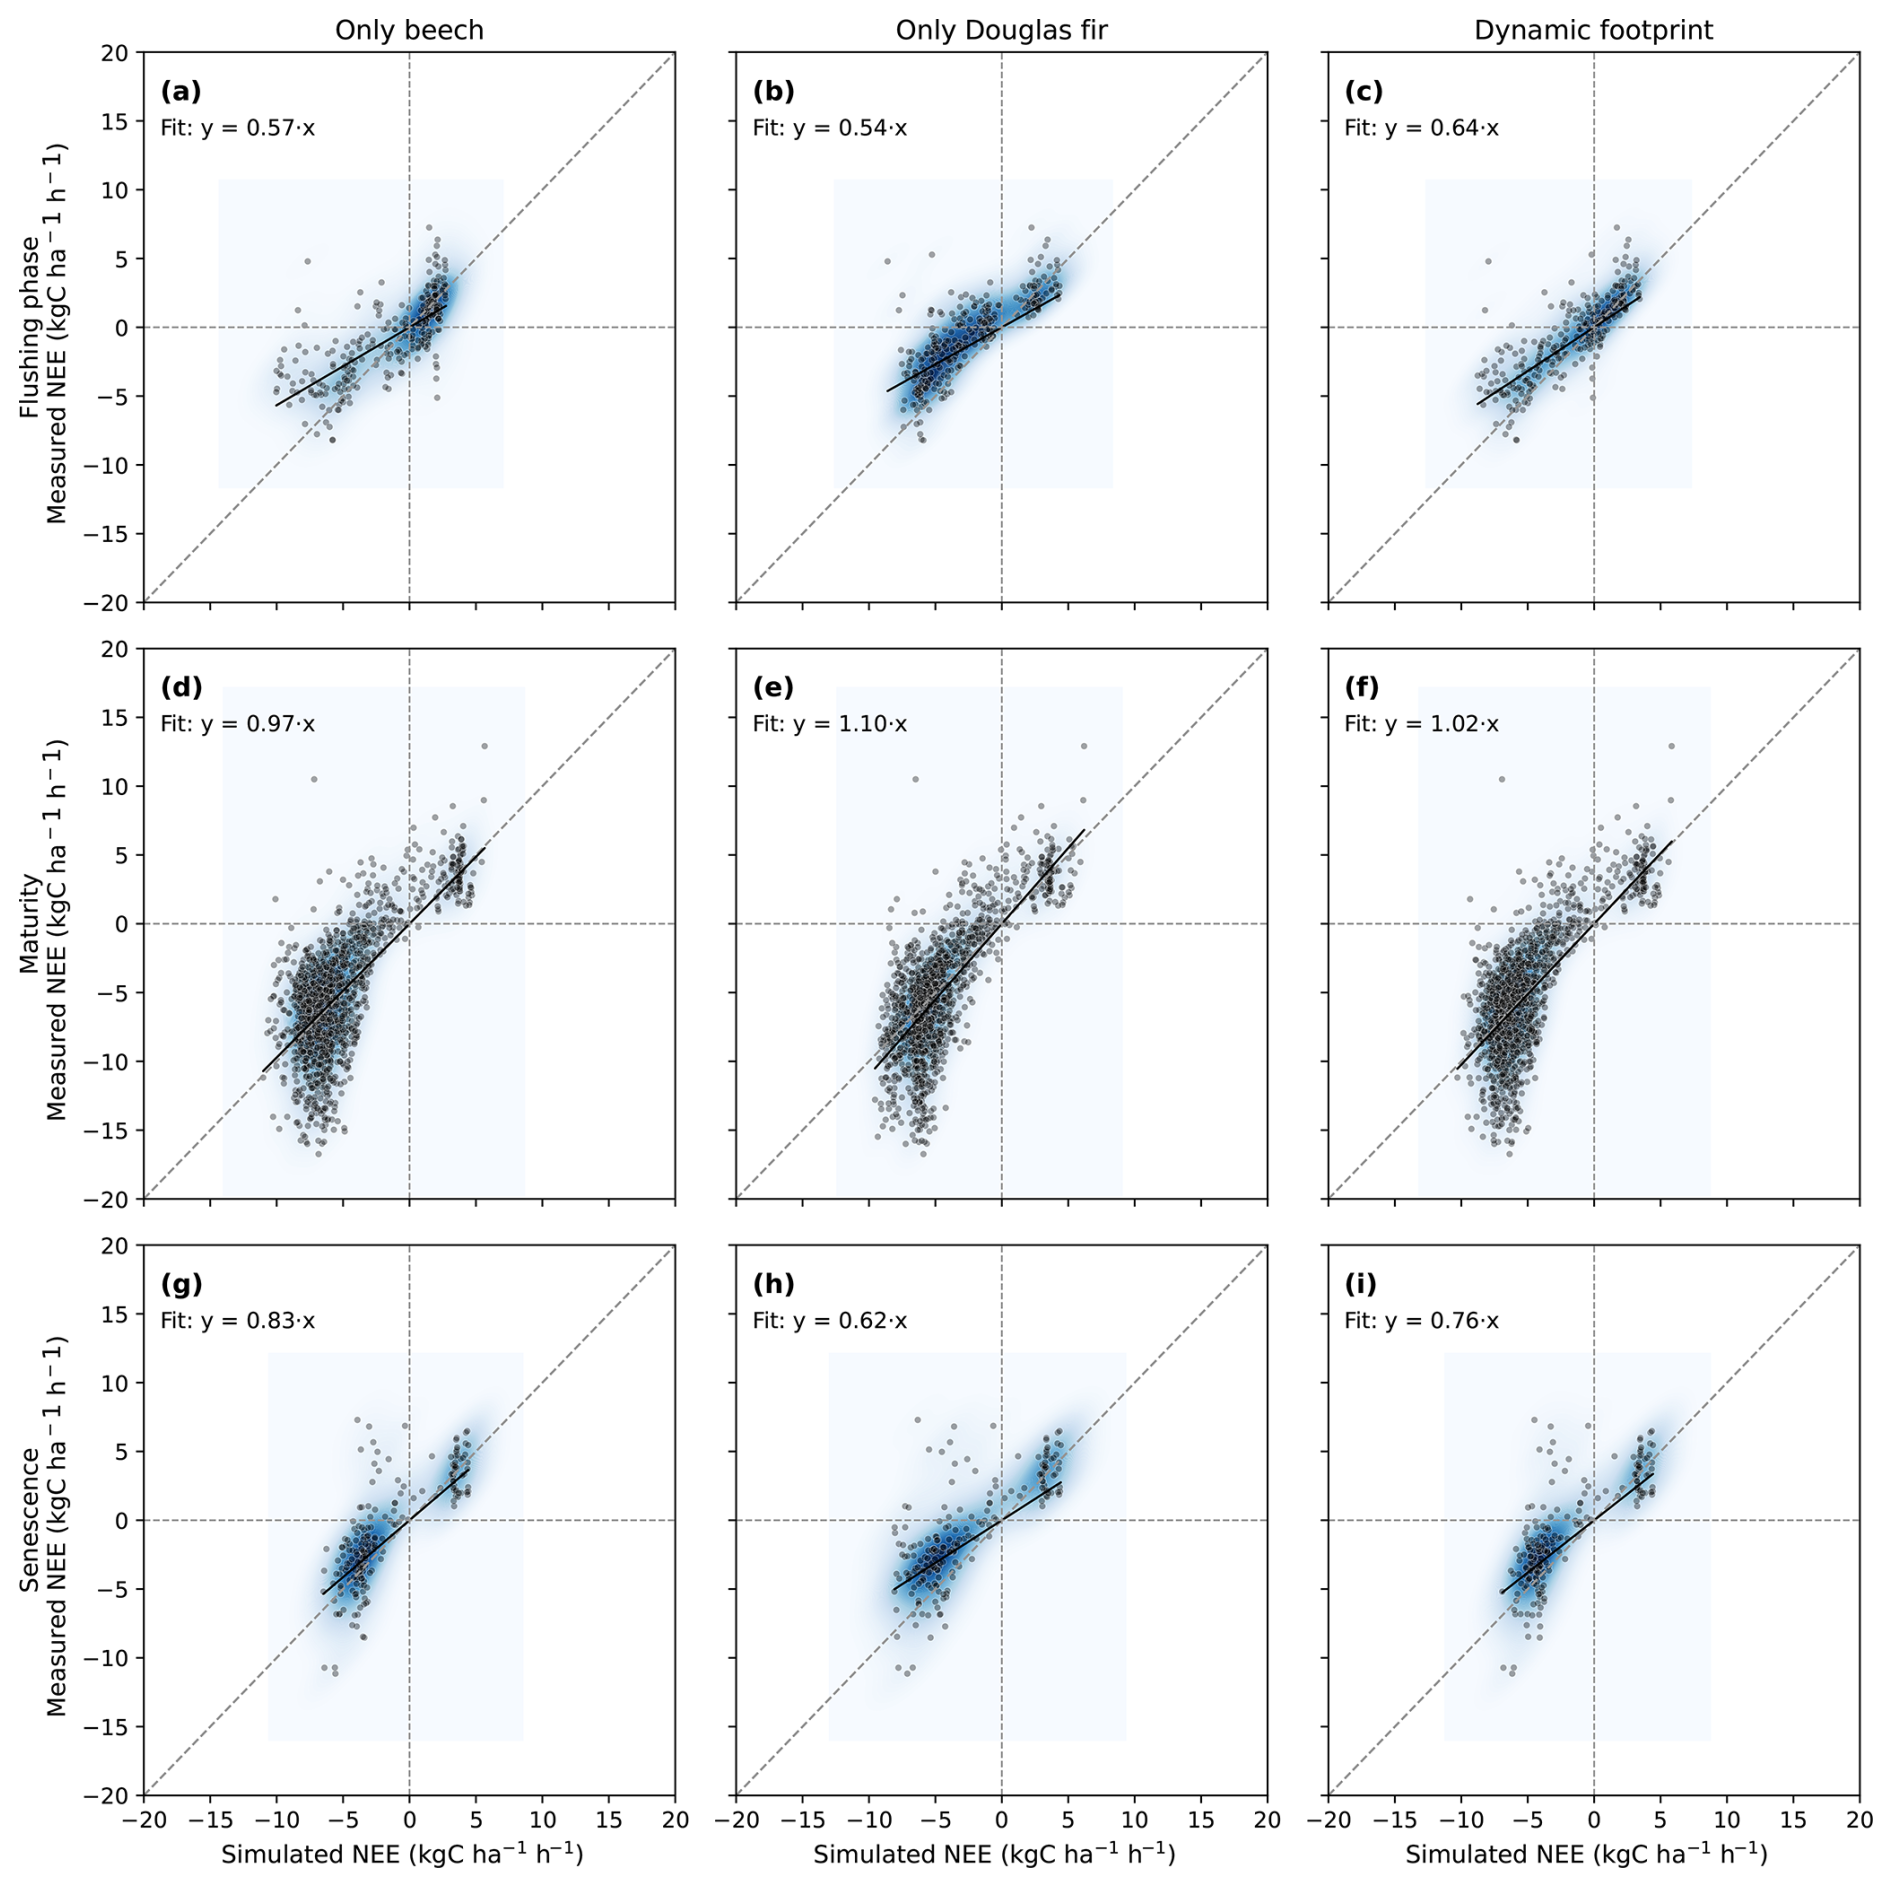
Figure 9Seasonal differentiation of hourly measured vs. simulated net ecosystem exchange (NEE, kgC ha−1 h−1) at the ECOSENSE forest considering the configurations: pure beech (first column, panels a, d, and g) pure Douglas fir (second column, panels b, e, and h), and the result for dynamically weighting the forest types according to the specific hourly footprint (third column, panels c, f, and i). The comparisons are differentiated into the development stages of beech which are flushing phase (April), maturity (May to September) and the senescence phase (October). The shaded heatmap represents the kernel density estimate of point concentrations.
Table 2Summary of statistical comparison between EC-measured and simulated NEE across three phenological periods (flushing phase, maturity, senescence). Simulations include pure beech, pure Douglas fir, and their hourly weighted combination based on dynamic flux footprint predictions (Dynamic FFP). Metrics include coefficient of determination (R2), Nash–Sutcliffe efficiency (NSE), slope, mean absolute error (MAE, kgC ha−1 h−1), and model bias (kgC ha−1 h−1).
3.5 Cumulative simulated and measured net ecosystem exchange and gap-filling performance
While the previous section provided an instantaneous comparison between simulated and measured fluxes, the cumulative NEE curves reveal seasonal dynamics and its influence by species-specific phenology (Figs. 10, 11). First, we are comparing only the time periods when measurements are available (3053 valid hourly observations after quality control and u∗-filtering, out of 8760 possible hours per year), therefore neglecting simulated fluxes during periods without evaluation data from the EC tower (Fig. 10). From the start of the analyzed period (15 May 2024) through late September, both beech (yellow dashed line) and Douglas fir (green dashed line) simulations accumulate negative values, indicating net carbon uptake during summer. After leaf senescence in beech, its cumulative curve reverses direction and increases (net carbon release), while Douglas fir holds an approximate equilibrium between respiration and carbon assimilation, resulting in a flat winter curve until the end of March. In early spring, Douglas fir resumes carbon uptake earlier in the year compared to beech, causing its cumulative curve to decline sooner. The EC-derived cumulative NEE (black line) is closer to the simulation of pure beech than to pure Douglas fir, reflecting its dominance within the flux footprint. Accordingly, also a simulation that considers both species weighted by their average contribution over the area (blue dashed line) shows a close agreement with the EC measurements.
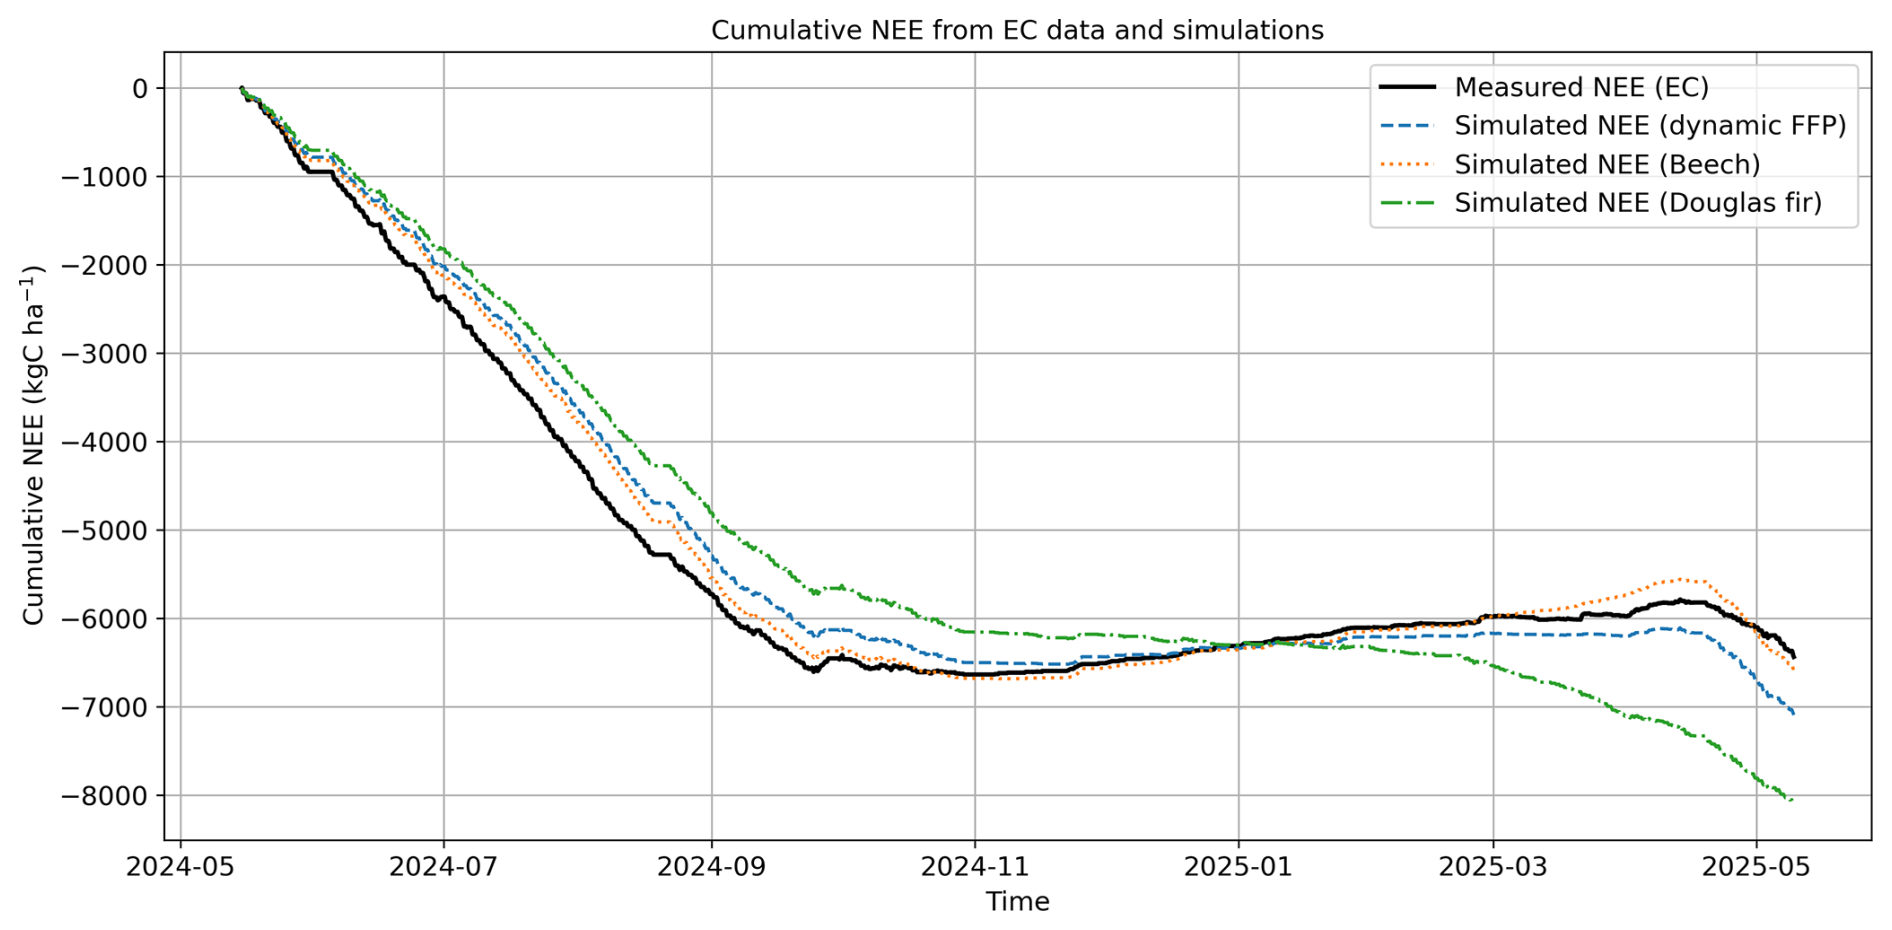
Figure 10Cumulative annual NEE from EC measurements and model simulations from 15 May 2024 to 15 May 2025, based on periods with available hourly measurement data (without any gap filling).
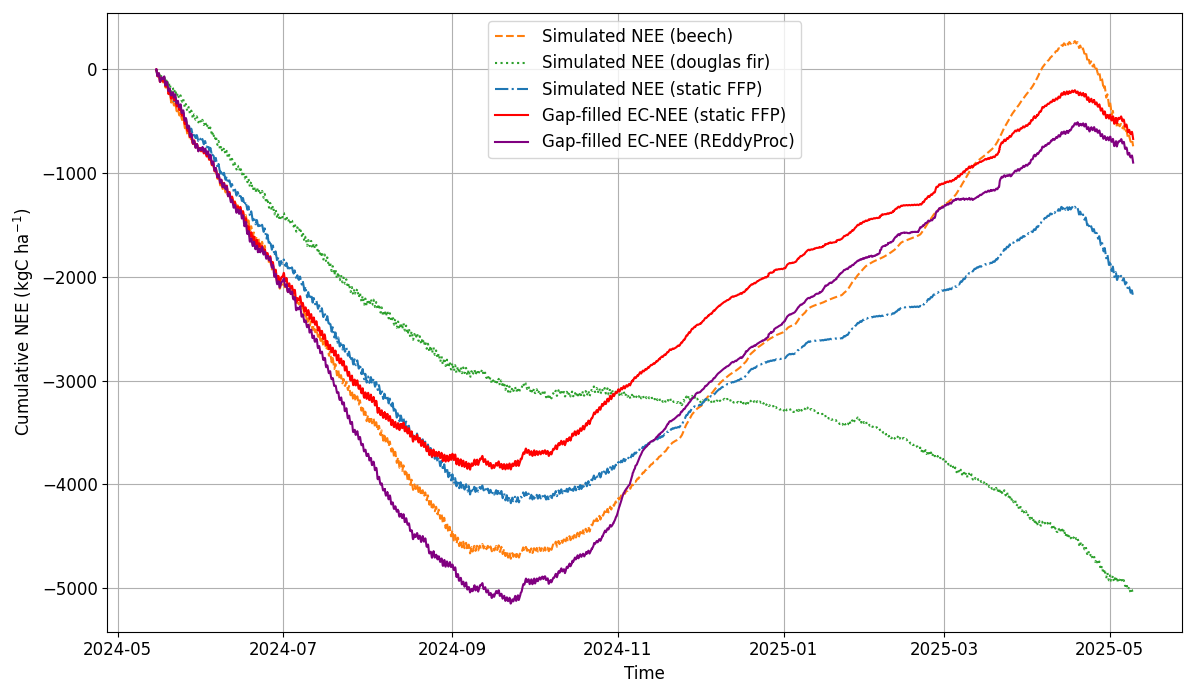
Figure 11Gap-filled cumulative annual NEE from EC measurements and model simulations for the period from 15 May 2024 to 15 May 2025.
The annual carbon balances are furthermore compared by replacing gaps in the EC-derived NEE time series by either simulated values using the fixed footprint distribution (red line) or the by the REddyProc software which uses a marginal distribution sampling approach (violet line, Fig. 11). The model-based gap filling ended up in a smaller overall sequestration than the one using a sophisticated statistical approach (−669.7 compared to 897.7 kgC ha−1 yr−1). However, the dynamics of carbon exchange are considerably different for the two approaches, with the simulation model indicating a smaller uptake in autumn, but also less respiration losses during winter. Both effects are mainly driven by Douglas fir (green broken line) which is assumed to have an overall smaller photosynthesis activity than beech but also is able to still assimilate in winter during favorable weather periods.
With NSE values above 0.6 for soil moisture and ∼0.8 for soil respiration, our simulations are within or above the range reported for site-level model evaluations in comparable forests (e.g. Noh et al., 2024; Zhang et al., 2021). Our results thus show that the LandscapeDNDC model can capture key hydrological and belowground carbon processes at the ECOSENSE forest independently of the tree species. We are aware that one carbon and one water evaluation term, compared throughout a single year is leaving room for uncertainty. For example, soil respiration measurements still aggregate the fluxes from heterotrophic and autotrophic sources (Noh et al., 2024) which the model differentiates using a number of assumptions but respective measurements for corroborating these assumptions are not yet available. Similarly, partitioning between transpiration and surface evaporation is important to consider in a mixed forest (Bittner et al., 2010) since hydraulic conductance as well as interception capacity will differ by species. The respective model parameters, however, are not specifically evaluated in the ECOSENSE forest and are thus again uncertain (see Table S1). Nevertheless, the evaluation extends beyond EC measurements which is in contrast to other model evaluation studies (Bergkvist et al., 2023; Gao et al., 2017; Kramer et al., 2002; Morales et al., 2005). In other words, it was possible to represent important soil and species-specific properties, enabling a more detailed analysis of the composition of the area integrated footprint flux measurements.
Overall, the footprint-weighted simulations which consider the temporally changing relative contributions from beech and Douglas fir, tends to enhance the agreement with data derived from EC flux measurements, compared with considering only one (e.g. the dominant) species. We acknowledge, however, that FFPs calculated according to Kljun et al. (2015) have several limitations. The footprint model is most accurate for flat and uniform surfaces but introduce errors in areas with variable topography, non-uniform canopy structures, or rapidly changing meteorological conditions because it assumes stationary and horizontal homogeneity over the EC integration period. We need thus to be cautious when comparing EC derived NEE and ET fluxes with simulations which are based on footprints that are weighted dynamically or using fixed-fractions, two approaches that performed overall very similar. It follows from the relatively uniform contribution of species within cardinal directions that it is possible to replace a dynamically weighted approach of species abundance with an equal share, which is in contrast to investigations that were set up at sites with different contribution of species in particular directions (Griebel et al., 2016). In the current case the share of Douglas fir varied between approximately 24 % and 38 %.
The differences between simulations were found to be stronger during transitional periods in spring (and partly autumn) when species responses diverged most strongly. Simulations only considering beech underestimated particularly early-season fluxes, when Douglas fir had its photosynthetic ability already fully activated. In contrast, simulations that only consider Douglas fir behavior, strongly overestimate the carbon uptake outside the period of the growing season (Fig. S6). The cumulative flux analysis underscores the dominant role of beech while the contribution of Douglas fir is still considerable. The important role of species composition, particularly during specific periods has been highlighted before, for example regarding a mixed conifer-hardwood forest in the US, where inhomogeneities within the flux footprint and species-specific functional traits have strongly influenced the aggregated EC flux signal (Kim et al., 2018). Also, EC measurements in a mixed forest in Belgium already demonstrated a stronger carbon sequestration as well as an earlier onset and faster progress of net carbon uptake in conifers compared to beeches (Aubinet et al., 2002) The overall carbon uptake and loss rates of beeches in Belgium were more similar to that of conifers than simulated in this study, which might be due to a more expressed seasonality or to the shorter observation period at the ECOSENSE site. This comparison indicates that the investigation throughout only one year might be too short to derive conclusions about competition differences.
Our results additionally highlight the strong differentiation that originates from a mix of deciduous and evergreen species. With the deciduous species concentrating carbon uptake and evaporation during the growing period but the evergreen species mitigating carbon losses during the non-growing season.
Due to gaps in EC measurements, it is not straightforward to derive annual flux budgets. Data gaps cannot simply be interpolated because of complex interactions with weather (Vekuri et al., 2023) and physiological boundary conditions (Klosterhalfen et al., 2023). Therefore, detangling a lumped EC flux according to its species composition within a footprint is advantageous for reducing the uncertainty and for improving the accuracy of gap filling, which is not the case in current gap-filling approaches (Mahabbati et al., 2021). Our results demonstrate that the lumped flux consists of species-specific contributions that vary in their importance throughout the season. Using an approach that is more related to one of the two – usually the dominating beech flux – thus implies considerable bias in the results. In our case, gap filling based on the underlying species-specific developments represented in LandscapeDNDC showed similar overall performance to the standard REddyProc approach. However, the statistical procedure estimates a higher carbon loss during the non-growing season compared to the estimates by the simulation model (and a somewhat higher input during the growing season). NEE statistical estimates during this period deviate similarly from measurements as from simulated fluxes (measurements during the non-growing period: +150.5 kgC ha−1; model simulations and statistical estimates during the same periods: +147.7 and +231.6 kgC ha−1). Thus, the model estimates seem to be more reliable regarding the seasonal dynamic of carbon exchange. To ensure that this is not an accidental result, we have compared both approaches by a systematic test, where we created artificial gaps into the NEE measurements (354 h randomly distributed across the study period) and compared fluxes that have been estimated with either the REddyProc method or the process-based model approach. Both methods achieved broadly comparable performance, with REddyProc showing slightly higher correlation (Fig. S7). Process-based gap-filling approaches have been advocated as a means to reduce biases in annual carbon budgets before (Stoy et al., 2006; Xing et al., 2008). With the current analysis we could corroborate this demand and demonstrate the suitability of process-based models for this task, notwithstanding that established tools can provide similar or even better results. A particular advantage of such an approach is that it not only provides reliable flux estimates but also information about the likely composition of the investigated fluxes that the statistical approach cannot.
The integrated, process-based ecosystem model LandscapeDNDC could be successfully evaluated with soil respiration and water content measurements at beech and Douglas fir sites using parameters derived from long-term eddy covariance observations. By considering the flux footprint contribution of each species separately, hydrological and carbon fluxes from integrated tower measurements could be better reproduced than by only accounting for the dominant species (beech) alone, especially during transitional seasons when functional differences driven by the different species physiology were most pronounced. Despite inherent uncertainties from limited evaluation metrics, the model captured essential tree species-specific dynamics, enabling a meaningful decomposition of EC fluxes into beech and Douglas fir contributions. These findings highlight the significance of species composition in interpreting mixed-forest carbon fluxes and demonstrate that combining process-based modeling with a detailed footprint analysis and geospatial data on tree species distribution can reduce biases in flux partitioning and gap filling. The application of this method can therefore be used to improve carbon and water balance assessments in forests where deciduous and evergreen species coexist. This is particularly important when information is required about the current and future potential of forests to sequester carbon in the framework of national and global assessments for climate mitigation assessments.
The LandscapeDNDC model source code for released versions of the model is permanently available online at the Radar4KIT database (https://doi.org/10.35097/438, Butterbach-Bahl et al., 2021). The published model version that has been used for the presented simulations can also be freely downloaded upon request from the website: https://ldndc.imk-ifu.kit.edu/download/download-model.php (last access: 25 August 2025). All parameters needed to run the model are provided in the Supplement (soil properties, initial stand properties, and species-specific parameters). Forcing data will be provided on request. Furthermore, the data used for evaluation of beech sites are available from the ICOS data portal (https://www.icos-cp.eu/data-products/ecosystem-release, last access: 21 August 2024, sites ID CZ-Stn, DE-Lnf, DK-Sor). The Douglas fir data are provided either from the AmeriFlux Network (https://ameriflux.lbl.gov/doi/FLUXNET/CA-Ca1/, last access: 9 December 2024) or can be directly obtained from the University of Twente, the Netherlands (by request from KP).
The supplement related to this article is available online at https://doi.org/10.5194/bg-23-1719-2026-supplement.
MH, KR, and GR designed the conceptual approach, determined the modeling setup, and led the manuscript writing. MH and SM performed the data analysis with additional contributions from CA, DL, and BJ regarding field site data collection. KP and SL provided additional data for evaluation and LP did the model calibration. All co-authors contributed to writing and revising the manuscript.
The contact author has declared that none of the authors has any competing interests.
Publisher's note: Copernicus Publications remains neutral with regard to jurisdictional claims made in the text, published maps, institutional affiliations, or any other geographical representation in this paper. The authors bear the ultimate responsibility for providing appropriate place names. Views expressed in the text are those of the authors and do not necessarily reflect the views of the publisher.
We would like to thank the support by Teja Kattenborn for his support in initialization vegetation structure for the simulation runs. We also thank Christian Markwitz from the Bioclimatology department at the University of Goettingen for the support on interpreting the ICOS data from the site DE-Lnf.
This research is funded as part of the Collaborative Research Centre by the German Science Foundation (DFG, Project ID 459819582 – SFB 1537/1 ECOSENSE) and by the German Federal Ministry of Research, Technology and Space (BMFTR) project “Integrated Greenhouse Gas Monitoring System for Germany – Observations” (ITMS-Q&S and ITMS-Q&S II – Agri-For-Live) under grant numbers 01LK2105A & 01LK2306A. Complementing investigations at the Czech site are further supported by the Ministry of Education, Youth and Sports of the Czech Republic as part of the CzeCOS program (grant number LM2023048) and the AdAgriF project (CZ.02.01.01/00/22_008/0004635). This work used resources of the Deutsches Klimarechenzentrum (DKRZ) granted by its Scientific Steering Committee (WLA) under project ID bm1400.
The article processing charges for this open-access publication were covered by the Karlsruhe Institute of Technology (KIT).
This paper was edited by Andreas Ibrom and reviewed by two anonymous referees.
Anderegg, W. R. L., Trugman, A. T., Badgley, G., Anderson, C. M., Bartuska, A., Ciais, P., Cullenward, D., Field, C. B., Freeman, J., Goetz, S. J., Hicke, J. A., Huntzinger, D., Jackson, R. B., Nickerson, J., Pacala, S., and Randerson, J. T.: Climate-driven risks to the climate mitigation potential of forests, Science, 368, eaaz7005, https://doi.org/10.1126/science.aaz7005, 2020.
Aubinet, M., Heinesch, B., and Longdoz, B.: Estimation of the carbon sequestration by a heterogeneous forest: night flux corrections, heterogeneity of the site and inter-annual variability, Glob. Change Biol., 8, 1053–1071, https://doi.org/10.1046/j.1365-2486.2002.00529.x, 2002.
Aubinet, M., Vesala, T., and Papale, D.: Eddy Covariance – A Practical Guide to Measurement and Data Analysis, Springer, Dordrecht, 449 pp., ISBN 978-94-007-2351-1, https://doi.org/10.1007/978-94-007-2351-1, 2012.
Baldocchi, D. D.: Assessing the eddy covariance technique for evaluating carbon dioxide exchange rates of ecosystems: past, present and future, Glob. Change Biol., 9, 479-492, https://doi.org/10.1046/j.1365-2486.2003.00629.x, 2003.
Bergkvist, J., Lagergren, F., Linderson, M.-L. F., Miller, P., Lindeskog, M., and Jönsson, A. M.: Modelling managed forest ecosystems in Sweden: An evaluation from the stand to the regional scale, Ecol. Modelling, 477, 110253, https://doi.org/10.1016/j.ecolmodel.2022.110253, 2023.
Bittner, S., Talkner, U., Krämer, I., Beese, F., Hölscher, D., and Priesack, E.: Modeling stand water budgets of mixed temperate broad-leaved forest stands by considering variations in species specific drought response, Agr. Forest Meteorol., 150, 1347–1357, https://doi.org/10.1016/j.agrformet.2010.06.006, 2010.
Blickensdörfer, L., Oehmichen, K., Pflugmacher, D., Kleinschmit, B., and Hostert, P.: Dominant Tree Species for Germany (2017/2018), OpenAgrar, Göttingen, https://doi.org/10.3220/data20221214084846, 2022.
Brandl, S., Paul, C., Knoke, T., and Falk, W.: The influence of climate and management on survival probability for Germany's most important tree species, Forest Ecol. Manag., 458, 117652, https://doi.org/10.1016/j.foreco.2019.117652, 2020.
Burba, G., Madsen, R., and Feese, K.: Eddy Covariance Method for CO2 Emission Measurements in CCUS Applications: Principles, Instrumentation and Software, Enegy. Proc., 40, 329–336, https://doi.org/10.1016/j.egypro.2013.08.038, 2013.
Butterbach-Bahl, K., Grote, R., Haas, E., Kiese, R., Klatt, S., and Kraus, D.: LandscapeDNDC (v1.30.4), Karlsruhe Institute of Technology (KIT) [code], https://doi.org/10.35097/438, 2021.
Cade, S. M., Clemitshaw, K. C., Molina-Herrera, S., Grote, R., Haas, E., Wilkinson, M., Morison, J. I. L., and Yamulki, S.: Evaluation of LandscapeDNDC Model Predictions of CO2 and N2O Fluxes from an Oak Forest in SE England, Forests, 12, 1517, https://doi.org/10.3390/f12111517, 2021.
Cameron, D. R., Van Oijen, M., Werner, C., Butterbach-Bahl, K., Grote, R., Haas, E., Heuvelink, G. B. M., Kiese, R., Kros, J., Kuhnert, M., Leip, A., Reinds, G. J., Reuter, H. I., Schelhaas, M. J., De Vries, W., and Yeluripati, J.: Environmental change impacts on the C- and N-cycle of European forests: a model comparison study, Biogeosciences, 10, 1751–1773, https://doi.org/10.5194/bg-10-1751-2013, 2013.
Cannell, M. G. R. and Thornley, J. H. M.: Modelling the components of plant respiration: Some guiding principles, Ann. Bot., 85, 45–54, https://doi.org/10.1006/anbo.1999.0996, 2000.
Cassidy, A. E., Christen, A., and Henry, G. H. R.: The effect of a permafrost disturbance on growing-season carbon-dioxide fluxes in a high Arctic tundra ecosystem, Biogeosciences, 13, 2291–2303, https://doi.org/10.5194/bg-13-2291-2016, 2016.
Collalti, A., Trotta, C., Keenan, T. F., Ibrom, A., Medlyn, B. E., Reyer, C. P., Grote, R., Bond-Lamberty, B., Vicca, S., Migliavacca, M., Veroustraete, F., Anav, A., Campioli, M., Scoccimarro, E., and Matteucci, G.: Thinning can reduce losses in carbon use efficiency and carbon stocks in managed forests under warmer climate, J. Adv. Model. Earth Sy., 10, 2427–2452, https://doi.org/10.1029/2018MS001275, 2018.
Crawford, B. and Christen, A.: Spatial source attribution of measured urban eddy covariance CO2 fluxes, Theor. Appl. Climatol., 119, 733–755, https://doi.org/10.1007/s00704-014-1124-0, 2015.
Dirnböck, T., Pröll, G., Austnes, K., Beloica, J., Beudert, B., Canullo, R., De Marco, A., Fornasier, M. F., Futter, M., Goergen, K., Grandin, U., Holmberg, M., Lindroos, A.-J., Mirtl, M., Neirynck, J., Pecka, T., Nieminen, T. M., Nordbakken, J.-F., Posch, M., Reinds, G.-J., Rowe, E. C., Salemaa, M., Scheuschner, T., Starlinger, F., Uzieblo, A. K., Valinia, S., Weldon, J., Wamelink, W. G. W., and Forsius, M.: Currently legislated decreases in nitrogen deposition will yield only limited plant species recovery in European forests, Environ. Res. Lett., 13, 125010, https://doi.org/10.1088/1748-9326/aaf26b, 2018.
Dirnböck, T., Kraus, D., Grote, R., Klatt, S., Kobler, J., Schindlbacher, A., Seidl, R., Thom, D., and Kiese, R.: Substantial understory contribution to the C sink of a European temperate mountain forest landscape, Landscape Ecol., 35, 483–499, https://doi.org/10.1007/s10980-019-00960-2 2020.
Dorigo, W. A., Xaver, A., Vreugdenhil, M., Gruber, A., Hegyiová, A., Sanchis-Dufau, A. D., Zamojski, D., Cordes, C., Wagner, W., and Drusch, M.: Global Automated Quality Control of In Situ Soil Moisture Data from the International Soil Moisture Network, Vadose Zone J., 12, vzj2012.0097, https://doi.org/10.2136/vzj2012.0097, 2013.
Fang, J., Fang, J., Chen, B., Zhang, H., Dilawar, A., Guo, M., and Liu, S.: Assessing Spatial Representativeness of Global Flux Tower Eddy-Covariance Measurements Using Data from FLUXNET2015, Scientific Data, 11, 569, https://doi.org/10.1038/s41597-024-03291-3, 2024.
Farquhar, G. D., Von Caemmerer, S., and Berry, J. A.: A biochemical model of photosynthetic CO2 assimilation in leaves of C3 species, Planta, 149, 78–90, https://doi.org/10.1007/BF00386231, 1980.
Fox, A., Williams, M., Richardson, A. D., Cameron, D., Gove, J. H., Quaife, T., Ricciuto, D., Reichstein, M., Tomelleri, E., Trudinger, C. M., and Van Wijk, M. T.: The REFLEX project: Comparing different algorithms and implementations for the inversion of a terrestrial ecosystem model against eddy covariance data, Agr. Forest Meteorol., 149, 1597–1615, https://doi.org/10.1016/j.agrformet.2009.05.002, 2009.
Gao, Y., Markkanen, T., Aurela, M., Mammarella, I., Thum, T., Tsuruta, A., Yang, H., and Aalto, T.: Response of water use efficiency to summer drought in a boreal Scots pine forest in Finland, Biogeosciences, 14, 4409–4422, https://doi.org/10.5194/bg-14-4409-2017, 2017.
Gribbe, S., Enderle, L., Weigel, R., Hertel, D., Leuschner, C., and Muffler, L.: Recent growth decline and shifts in climatic growth constraints suggest climate vulnerability of beech, Douglas fir, pine and oak in Northern Germany, Forest Ecol. Manag., 566, 122022, https://doi.org/10.1016/j.foreco.2024.122022, 2024.
Griebel, A., Bennett, L. T., Metzen, D., Cleverly, J., Burba, G., and Arndt, S. K.: Effects of inhomogeneities within the flux footprint on the interpretation of seasonal, annual, and interannual ecosystem carbon exchange, Agr. Forest Meteorol., 221, 50–60, https://doi.org/10.1016/j.agrformet.2016.02.002, 2016.
Grote, R.: Integrating dynamic morphological properties into forest growth modeling. II. Allocation and mortality, Forest Ecol. Manag., 111, 193–210, https://doi.org/10.1016/S0378-1127(98)00328-4, 1998.
Grote, R., Kiese, R., Grünwald, T., Ourcival, J.-M., and Granier, A.: Modelling forest carbon balances considering tree mortality and removal, Agr. Forest Meteorol., 151, 179-190, https://doi.org/10.1016/j.agrformet.2010.10.002, 2011a.
Grote, R., Korhonen, J., and Mammarella, I.: Challenges for evaluating process-based models of gas exchange at forest sites with fetches of various species, Forest Syst., 20, 389–406, https://doi.org/10.5424/fs/20112003-11084, 2011b.
Haas, E., Klatt, S., Fröhlich, A., Werner, C., Kiese, R., Grote, R., and Butterbach-Bahl, K.: LandscapeDNDC: A process model for simulation of biosphere-atmosphere-hydrosphere exchange processes at site and regional scale, Landscape Ecol., 28, 615–636, https://doi.org/10.1007/s10980-012-9772-x, 2013.
Haberstroh, S., Christen, A., Sulzer, M., Scarpa, F., and Werner, C.: Recurrent hot droughts cause persistent legacy effects in a temperate Scots Pine forest, Plant Biol., 1–15, https://doi.org/10.1111/plb.70066, 2025.
Helbig, M., Chasmer, L. E., Desai, A. R., Kljun, N., Quinton, W. L., and Sonnentag, O.: Direct and indirect climate change effects on carbon dioxide fluxes in a thawing boreal forest–wetland landscape, Glob. Change Biol., 23, 3231–3248, https://doi.org/10.1111/gcb.13638, 2017.
Herbst, M., Mund, M., Tamrakar, R., and Knohl, A.: Differences in carbon uptake and water use between a managed and an unmanaged beech forest in central Germany, Forest Ecol. Manag., 355, 101–108, https://doi.org/10.1016/j.foreco.2015.05.034, 2015.
Hersbach, H., Bell, B., Berrisford, P., Biavati, G., Horányi, A., Muñoz Sabater, J., Nicola, J., Peubey, C., Radu, R., Rozum, I., Schepers, D., Simmons, A., Soci, C., Dee, D., and Thépaut, J.-N.: ERA5 hourly data on single levels from 1940 to present, Copernicus Climate Change Service (C3S) Climate Data Store (CDS) [data set], https://doi.org/10.24381/cds.adbb2d47, 2023.
Holst, J., Grote, R., Offermann, C., Ferrio, J. P., Gessler, A., Mayer, H., and Rennenberg, H.: Water fluxes within beech stands in complex terrain, Int. J. Biometeorol., 54, 23–36, https://doi.org/10.1007/s00484-009-0248-x, 2010.
Kim, J., Hwang, T., Schaaf, C. L., Kljun, N., and Munger, J. W.: Seasonal variation of source contributions to eddy-covariance CO2 measurements in a mixed hardwood-conifer forest, Agr. Forest Meteorol., 253–254, 71–83, https://doi.org/10.1016/j.agrformet.2018.02.004, 2018.
Kljun, N., Calanca, P., Rotachhi, M. W., and Schmid, H. P.: A simple parameterisation for flux footprint predictions, Bound-Lay. Meteorol., 112, 503–523, 2004.
Kljun, N., Calanca, P., Rotach, M. W., and Schmid, H. P.: A simple two-dimensional parameterisation for Flux Footprint Prediction (FFP), Geosci. Model Dev., 8, 3695–3713, https://doi.org/10.5194/gmd-8-3695-2015, 2015.
Klosterhalfen, A., Chi, J., Kljun, N., Lindroth, A., Laudon, H., Nilsson, M. B., and Peichl, M.: Two-level eddy covariance measurements reduce bias in land-atmosphere exchange estimates over a heterogeneous boreal forest landscape, Agr. Forest Meteorol., 339, 109523, https://doi.org/10.1016/j.agrformet.2023.109523, 2023.
Kramer, K., Leinonen, I., Bartelink, H. H., Berbigier, P., Borghetti, M., Bernhofer, C., Cienciala, E., Dolman, A. J., Froer, O., Gracia, C. A., Granier, A., Grünwald, T., Hari, P., Jans, W., Kellomäki, S., Loustau, D., Magnani, F., Markkanen, T., Matteucci, G., Mohren, G. M. J., Moors, E., Nissinen, A., Peltola, H., Sabaté, S., Sanchez, A., Sontag, M., Valentini, R., and Vesala, T.: Evaluation of six process-based forest growth models using eddy-covariance measurements of CO2 and H2O fluxes at six forest sites in Europe, Glob. Change Biol., 8, 213–230, https://doi.org/10.1046/j.1365-2486.2002.00471.x, 2002.
Kutsch, W. L., Liu, C., Hörmann, G., and Herbst, M.: Spatial heterogeneity of ecosystem carbon fluxes in a broadleaved forest in Northern Germany, Glob. Change Biol., 11, 70–88, https://doi.org/10.1111/j.1365-2486.2004.00884.x, 2005.
Leuning, R.: A critical appraisal of a combined stomatal-photosynthesis model for C3 plants, Plant Cell Environ., 18, 339–355, https://doi.org/10.1111/j.1365-3040.1995.tb00370.x, 1995.
LI-COR Biosciences: Eddy Covariance Processing Software (Version 7.0.9), https://www.licor.com/products/eddy-covariance/eddypro (last access: 17 August 2025), 2022.
Magh, R.-K., Bonn, B., Grote, R., Burzlaff, T., Pfausch, S., and Rennenberg, H.: Drought superimposes the positive effect of silver-fir on water relations of European beech in mature forest stands, Forests, 10, 897, https://doi.org/10.3390/f10100897, 2019.
Mahabbati, A., Beringer, J., Leopold, M., McHugh, I., Cleverly, J., Isaac, P., and Izady, A.: A comparison of gap-filling algorithms for eddy covariance fluxes and their drivers, Geosci. Instrum. Method. Data Syst., 10, 123–140, https://doi.org/10.5194/gi-10-123-2021, 2021.
Mahecha, M. D., Reichstein, M., Lange, H., Carvalhais, N., Bernhofer, C., Grünwald, T., Papale, D., and Seufert, G.: Characterizing ecosystem-atmosphere interactions from short to interannual time scales, Biogeosciences, 4, 743–758, https://doi.org/10.5194/bg-4-743-2007, 2007.
Mahnken, M., Cailleret, M., Collalti, A., Trotta, C., Biondo, C., D'Andrea, E., Dalmonech, D., Gina, M., Makela, A., Minunno, F., Peltoniemi, M., Trotsiuk, V., Nadal-Sala, D., Sabate, S., Vallet, P., Aussenac, R., Cameron, D., Bohn, F., Grote, R., and Augustynczik, A.: Accuracy, realism and general applicability of European forest models, Glob. Change Biol., 28, 6921–6943, https://doi.org/10.1111/gcb.16384, 2022.
Mäkelä, A., Minunno, F., Kujala, H., Kosenius, A.-K., Heikkinen, R. K., Junttila, V., Peltoniemi, M., and Forsius, M.: Effect of forest management choices on carbon sequestration and biodiversity at national scale, AMBIO, 52, 1737–1756, https://doi.org/10.1007/s13280-023-01899-0, 2023.
McGloin, R., Šigut, L., Havránková, K., Dušek, J., Pavelka, M., and Sedlák, P.: Energy balance closure at a variety of ecosystems in Central Europe with contrasting topographies, Agr. Forest Meteorol., 248, 418–431, https://doi.org/10.1016/j.agrformet.2017.10.003, 2018.
Medlyn, B. E., Robinson, A. P., Clement, R., and McMurtrie, R. E.: On the validation of models of forest CO2 exchange using eddy covariance data: some perils and pitfalls, Tree Physiol., 25, 839–857, https://doi.org/10.1093/treephys/25.7.839, 2005.
Molina-Herrera, S., Grote, R., Santabárbara-Ruiz, I., Kraus, D., Klatt, S., Haas, E., Kiese, R., and Butterbach-Bahl, K.: Simulation of CO2 fluxes at European forest ecosystems with the coupled soil-vegetation process model “LandscapeDNDC”, Forests, 6, 1779–1809, https://doi.org/10.3390/f6061779, 2015.
Morales, P., Sykes, M. T., Prentice, I. C., Smith, P., Smith, B., Bugmann, H., Zierl, B., Friedlingstein, P., Viovy, N., Sabaté, S., Sánchez, A., Pla, E., Gracia, C. A., Sitch, S., Arneth, A., and Ogee, J.: Comparing and evaluating process-based ecosystem model predictions of carbon and water fluxes in major European forest biomes, Glob. Change Biol., 11, 2211–2233, https://doi.org/10.1111/j.1365-2486.2005.01036.x, 2005.
Morgenstern, K., Andrew Black, T., Humphreys, E. R., Griffis, T. J., Drewitt, G. B., Cai, T., Nesic, Z., Spittlehouse, D. L., and Livingston, N. J.: Sensitivity and uncertainty of the carbon balance of a Pacific Northwest Douglas-fir forest during an El Niño/La Niña cycle, Agr. Forest Meteorol., 123, 201–219, https://doi.org/10.1016/j.agrformet.2003.12.003, 2004.
Nadal-Sala, D., Grote, R., Birami, B., Lintunen, A., Mammarella, I., Preisler, Y., Rotenberg, E., Salmon, Y., Tatrinov, F., Yakir, D., and Ruehr, N.: Assessing model performance via the most limiting environmental driver (MLED) in two differently stressed pine stands, Ecol. Appl., 31, e02312, https://doi.org/10.1002/eap.2312, 2021.
Noh, N. J., Renchon, A. A., Knauer, J., Haverd, V., Li, J., Griebel, A., Barton, C. V. M., Yang, J., Sihi, D., Arndt, S. K., Davidson, E. A., Tjoelker, M. G., and Pendall, E.: Reconciling Top-Down and Bottom-Up Estimates of Ecosystem Respiration in a Mature Eucalypt Forest, J. Geophys. Res.-Biogeo., 129, e2024JG008064, https://doi.org/10.1029/2024JG008064, 2024.
Oishi, A. C., Oren, R., and Stoy, P. C.: Estimating components of forest evapotranspiration: A footprint approach for scaling sap flux measurements, Agr. Forest Meteorol., 148, 1719–1732, https://doi.org/10.1016/j.agrformet.2008.06.013, 2008.
Oliveira, B. R. F., Keizer, J. J., and Foken, T.: Changes of the aerodynamic characteristics of a flux site after an extensive windthrow, Biogeosciences, 19, 2235–2243, https://doi.org/10.5194/bg-19-2235-2022, 2022.
Pan, Y., Birdsey, R. A., Fang, J., Houghton, R., Kauppi, P. E., Kurz, W. A., Phillips, O. L., Shvidenko, A., Lewis, S. L., Canadell, J. G., Ciais, P., Jackson, R. B., Pacala, S. W., McGuire, A. D., Piao, S., Rautiainen, A., Sitch, S., and Hayes, D.: A large and persistent carbon sink in the world's forests, Science, 333, 988–993, https://doi.org/10.1126/science.1201609, 2011.
Papale, D., Reichstein, M., Aubinet, M., Canfora, E., Bernhofer, C., Kutsch, W., Longdoz, B., Rambal, S., Valentini, R., Vesala, T., and Yakir, D.: Towards a standardized processing of Net Ecosystem Exchange measured with eddy covariance technique: algorithms and uncertainty estimation, Biogeosciences, 3, 571–583, https://doi.org/10.5194/bg-3-571-2006, 2006.
Pilegaard, K., Mikkelsen, T. N., Beier, C., Jensen, N. O., Ambus, P., and Ro-Poulsen, H.: Field measurements of atmosphere–biosphere interactions in a Danish beech forest, Boreal. Environ. Res., 8, 315–333, 2003.
Rahimi, J., Ago, E. E., Ayantunde, A., Berger, S., Bogaert, J., Butterbach-Bahl, K., Cappelaere, B., Cohard, J.-M., Demarty, J., Diouf, A. A., Falk, U., Haas, E., Hiernaux, P., Kraus, D., Roupsard, O., Scheer, C., Srivastava, A. K., Tagesson, T., and Grote, R.: Modeling gas exchange and biomass production in West African Sahelian and Sudanian ecological zones, Geosci. Model Dev., 14, 3789–3812, https://doi.org/10.5194/gmd-14-3789-2021, 2021.
Reichstein, M., Falge, E., Baldocchi, D., Papale, D., Aubinet, M., Berbigier, P., Bernhofer, C., Buchmann, N., Gilmanov, T., Granier, A., Grünwald, T., Havranokova, K., Ilvesniemi, H., Janous, D., Knohl, A., Laurila, T., Lohila, A., Loustau, D., Matteucci, G., Meyers, T., Miglietta, F., Ourcival, J.-M., Pumpanen, J., Rambal, S., Rotenberg, E., Sanz, M., Tenhunen, J., Seufert, G., Vaccari, F., Vesala, T., Yakir, D., and Valentini, R.: On the separation of net ecosystem exchange into assimilation and ecosystem respiration: review and improved algorithm, Glob. Change Biol., 11, 1–16, https://doi.org/10.1111/j.1365-2486.2005.001002.x, 2005.
Remy, C. C., Krofcheck, D. J., Keyser, A. R., Litvak, M. E., Collins, S. L., and Hurteau, M. D.: Integrating Species-Specific Information in Models Improves Regional Projections Under Climate Change, Geophys. Res. Lett., 46, 6554–6562, https://doi.org/10.1029/2019GL082762, 2019.
Schmid, H. P.: Source areas for scalars and scalar fluxes, Bound-Lay. Meteorol., 67, 293–318, https://doi.org/10.1007/BF00713146, 1994.
Schuepp, P. H., Leclerc, M. Y., MacPherson, J. I., and Desjardins, R. L.: Footprint prediction of scalar fluxes from analytical solutions of the diffusion equation, Bound-Lay. Meteorol., 50, 355–373, https://doi.org/10.1007/BF00120530, 1990.
Stoy, P. C., Katul, G. G., Siqueira, M. B. S., Juang, J. Y., Novick, K. A., Uebelherr, J. M., and Oren, R.: An evaluation of models for partitioning eddy covariance-measured net ecosystem exchange into photosynthesis and respiration, Agr. Forest Meteorol., 141, 2–18, https://doi.org/10.1016/j.agrformet.2006.09.001, 2006.
Stoy, P. C., El-Madany, T. S., Fisher, J. B., Gentine, P., Gerken, T., Good, S. P., Klosterhalfen, A., Liu, S., Miralles, D. G., Perez-Priego, O., Rigden, A. J., Skaggs, T. H., Wohlfahrt, G., Anderson, R. G., Coenders-Gerrits, A. M. J., Jung, M., Maes, W. H., Mammarella, I., Mauder, M., Migliavacca, M., Nelson, J. A., Poyatos, R., Reichstein, M., Scott, R. L., and Wolf, S.: Reviews and syntheses: Turning the challenges of partitioning ecosystem evaporation and transpiration into opportunities, Biogeosciences, 16, 3747–3775, https://doi.org/10.5194/bg-16-3747-2019, 2019.
Su, Z., Timmermans, W. J., van der Tol, C., Dost, R., Bianchi, R., Gómez, J. A., House, A., Hajnsek, I., Menenti, M., Magliulo, V., Esposito, M., Haarbrink, R., Bosveld, F., Rothe, R., Baltink, H. K., Vekerdy, Z., Sobrino, J. A., Timmermans, J., van Laake, P., Salama, S., van der Kwast, H., Claassen, E., Stolk, A., Jia, L., Moors, E., Hartogensis, O., and Gillespie, A.: EAGLE 2006 – Multi-purpose, multi-angle and multi-sensor in-situ and airborne campaigns over grassland and forest, Hydrol. Earth Syst. Sci., 13, 833–845, https://doi.org/10.5194/hess-13-833-2009, 2009.
Teuling, A. J., Seneviratne, S. I., Stockli, R., Reichstein, M., Moors, E., Ciais, P., Luyssaert, S., van den Hurk, B., Ammann, C., Bernhofer, C., Dellwik, E., Gianelle, D., Gielen, B., Grünwald, T., Klumpp, K., Montagnani, L., Moureaux, C., Sottocornola, M., and Wohlfahrt, G.: Contrasting response of European forest and grassland energy exchange to heatwaves, Nat. Geosci., 3, 722–727, https://doi.org/10.1038/ngeo950, 2010.
Thornthwaite, C. W. and Mather, J. R.: Instructions and tables for computing potential evapotranspiration and the water balance, Publications in Climatology, 10, 183–311, 1957.
Thum, T., Miinalainen, T., Seppälä, O., Croft, H., Rogers, C., Staebler, R., Caldararu, S., and Zaehle, S.: Modelling decadal trends and the impact of extreme events on carbon fluxes in a temperate deciduous forest using a terrestrial biosphere model, Biogeosciences, 22, 1781–1807, https://doi.org/10.5194/bg-22-1781-2025, 2025.
Tuovinen, J.-P., Aurela, M., Hatakka, J., Räsänen, A., Virtanen, T., Mikola, J., Ivakhov, V., Kondratyev, V., and Laurila, T.: Interpreting eddy covariance data from heterogeneous Siberian tundra: land-cover-specific methane fluxes and spatial representativeness, Biogeosciences, 16, 255–274, https://doi.org/10.5194/bg-16-255-2019, 2019.
van der Woude, A. M., Peters, W., Joetzjer, E., Lafont, S., Koren, G., Ciais, P., Ramonet, M., Xu, Y., Bastos, A., Botía, S., Sitch, S., de Kok, R., Kneuer, T., Kubistin, D., Jacotot, A., Loubet, B., Herig-Coimbra, P.-H., Loustau, D., and Luijkx, I. T.: Temperature extremes of 2022 reduced carbon uptake by forests in Europe, Nat. Commun., 14, 6218, https://doi.org/10.1038/s41467-023-41851-0, 2023.
Van Wijk, M. T., Dekker, S. C., Bouten, W., Kohsiek, W., and Mohren, G. M. J.: Simulation of carbon and water budgets of a Douglas-fir forest, Forest Ecol. Manag., 145, 229–241, https://doi.org/10.1016/S0378-1127(00)00439-4, 2001.
Vekuri, H., Tuovinen, J.-P., Kulmala, L., Papale, D., Kolari, P., Aurela, M., Laurila, T., Liski, J., and Lohila, A.: A widely-used eddy covariance gap-filling method creates systematic bias in carbon balance estimates, Sci. Rep., 13, 1720, https://doi.org/10.1038/s41598-023-28827-2, 2023.
Vesala, T., Kljun, N., Rannik, Ü., Rinne, J., Sogachev, A., Markkanen, T., Sabelfeld, K., Foken, T., and Leclerc, M. Y.: Flux and concentration footprint modelling: State of the art, Environ. Pollut., 152, 653–666, https://doi.org/10.1016/j.envpol.2007.06.070, 2008.
Werner, C., Wallrabe, U., Comella, L., Christen, A., Dormann, C., Haberstroh, S., Göritz, A., Grote, R., Jouda, M., Kiese, R., Korvik, J., Koch, B., Kreuzwieser, J., Lang, F., Müller, J., Prucker, O., Rühe, J., Reiterer, A., Rupitsch, S., Schack-Kirchner, H., Schmitt, K., Stobbe, N., Weiler, M., Wöllenstein, J., and Woias, P.: ECOSENSE - Multi-scale quantification and modelling of spatio-temporal dynamics of ecosystem processes by smart autonomous sensor networks, RIO, 10, e129357, https://doi.org/10.3897/rio.10.e129357, 2024.
Wutzler, T., Lucas-Moffat, A., Migliavacca, M., Knauer, J., Sickel, K., Šigut, L., Menzer, O., and Reichstein, M.: Basic and extensible post-processing of eddy covariance flux data with REddyProc, Biogeosciences, 15, 5015–5030, https://doi.org/10.5194/bg-15-5015-2018, 2018.
Xing, Z., Bourque, C. P. A., Meng, F.-R., Cox, R. M., Swift, D. E., Zha, T., and Chow, L.: A process-based model designed for filling of large data gaps in tower-based measurements of net ecosystem productivity, Ecol. Model., 213, 165–179, https://doi.org/10.1016/j.ecolmodel.2007.11.018, 2008.
Xu, B., Arain, M. A., Black, T. A., Law, B. E., Pastorello, G. Z., and Chu, H.: Seasonal variability of forest sensitivity to heat and drought stresses: A synthesis based on carbon fluxes from North American forest ecosystems, Glob. Change Biol., 26, 901–918, https://doi.org/10.1111/gcb.14843, 2020.
Zhang, W., Yao, Z., Li, S., Zheng, X., Zhang, H., Ma, L., Wang, K., Wang, R., Liu, C., Han, S., Deng, J., and Li, Y.: An improved process-oriented hydro-biogeochemical model for simulating dynamic fluxes of methane and nitrous oxide in alpine ecosystems with seasonally frozen soils, Biogeosciences, 18, 4211–4225, https://doi.org/10.5194/bg-18-4211-2021, 2021.