the Creative Commons Attribution 4.0 License.
the Creative Commons Attribution 4.0 License.
 | 26 Mar 2026
Wind-induced collapse of the biopolymeric surface microlayer induces sudden changes in sea surface roughness
Gernot Friedrichs
Kerstin E. Krall
Bernd Jähne
All exchange between the ocean and atmosphere has to cross the sea surface microlayer (SML), yet the SML impact on modulating air-sea exchange rates remains poorly understood. Surfactants, including biopolymers, can influence exchange rates by altering the rheological properties of the SML, damping surface turbulence, and capillary wave formation. We investigated the impact of wind speed on SML biopolymer enrichment, surface roughness, and interfacial surfactant coverage at the Heidelberg “Aeolotron”, a large annular wind-wave facility filled with 18 000 L seawater. Our results show that biopolymer enrichment, specifically the enrichment of polypeptides and polysaccharides, in the SML declined sharply at wind speeds above 6 m s−1, coinciding with a sudden increase in the Mean Square Slope (MSS) of waves by 1–2 orders of magnitude. At wind speed < 6 m s−1, biopolymer enrichment in the SML was accompanied by high surfactant surface coverage and strongly reduced MSS values compared to non-enriched or essentially surfactant-free clean freshwater surfaces, indicating a substantial impact of biopolymer enrichment in the SML for air-sea exchange at lower wind speed. Selective SML enrichment was observed, particularly for the amino acids arginine and glutamic acid, and the amino sugar galactosamine. Amino acid and carbohydrate monomers in the SML also exhibited significant and compound-specific wind-induced variability. Our findings suggest that biopolymers, particularly those derived from bacterial production, accumulate in the SML and act as powerful biosurfactants. Unlike artificial surfactant films, natural SML components were more susceptible to wind-induced disruption and to microbial production and decomposition. Our findings reveal that ecological processes actively regulate the chemical and physical properties of the SML, including surfactant surface coverage, and thereby potentially modulate air–sea heat and mass exchange.
- Article
(4363 KB) - Full-text XML
- BibTeX
- EndNote


All exchange between the ocean and atmosphere traverses a thin upper ocean boundary layer known as the sea surface microlayer (SML) (Cunliffe et al., 2013; Engel et al., 2017). Less than 1 mm thick, the SML is the chemically and structurally complex organic interface layer right below the air-sea interface with distinct physical, chemical, and biological properties, often enriched in high molecular weight biopolymers and surface-active agents (surfactants). These surfactants are amphiphilic molecules with both hydrophilic (water-attracting) and hydrophobic (water-repelling) groups. Under low-wind conditions, the accumulation of organic material and surfactants in the SML dampens capillary waves and reduces light reflection, making the SML appear smooth, a phenomenon often referred to as a slick. In the ocean, slicks appear shiny, calm, or darker than the surrounding water because they reflect sunlight differently.
Various biochemicals, including heteropolymers of lipids, amino acids, and carbohydrates, contribute to the oceanic surfactant pool (Cunliffe et al., 2013; Gašparović and Ćosović, 2003). For example, in lipopolysaccharides, the carbohydrate and lipid moieties represent the hydrophilic and the hydrophobic parts of the molecule. Surfactants can impede air-sea gas exchange by modifying the surface rheological properties of the SML. Specifically, surfactants increase the surface elasticity and effective surface viscosity of water. As a result, Marangoni stresses arise from surface-tension gradients. This damps the formation of capillary waves, which reduces small-scale roughness, and leads to a stronger turbulent energy dissipation near the surface (Wei and Wu, 1992; Frew et al., 1990; Jenkinson et al., 2018; Laxague et al., 2024). In this context, the overall effect of surfactants arises from complex and dynamic competitive adsorption: an excess of highly surface-active compounds inhibits the adsorption of less active surfactants, while a deficiency promotes the contribution of the latter (Pogorzelski et al., 2006; Frka et al., 2012). In the open ocean, organic matter derived from phytoplankton production contains surfactants (Croot et al., 2007; Frew et al., 1990; Wurl et al., 2011). Regions with elevated primary production are therefore expected to have higher surfactant concentrations (Wurl et al., 2011). However, chlorophyll a (Chl a), often used as a proxy for primary production, may not accurately predict surfactant occurrence (Laß et al., 2013; Sabbaghzadeh et al., 2017). Instead, a mixture of more recalcitrant dissolved organic matter (DOM) and freshly produced biopolymers seems to control surfactant dynamics in the SML (Barthelmeß and Engel, 2022). Certain strains of heterotrophic bacteria produce surfactants (Satpute et al., 2010) and have also been associated with surfactant-covered ocean surfaces (Kurata et al., 2016). In addition, surfactants present in seawater have been associated with human-related and terrestrial sources, such as riverine runoff (Cuscov and Muller, 2015; Shaharom et al., 2018).
Variability of surfactants in the SML is likely one of the main reasons why parameterizations based solely on wind speed struggle to accurately predict mass and momentum exchange between the sea and atmosphere, particularly at low wind speeds where the number of observations is small (Wanninkhof et al., 2009; Nagel et al., 2019). This significantly hinders accurate estimates of the ocean's contribution to the cycling of greenhouse gases. For example, a substantial reduction of air-sea fluxes of CO2 has been documented under high accumulation of natural surfactants using surface seawater of the Atlantic in an on-board air-sea gas exchange tank experiment (Pereira et al., 2018). In association with cyanobacteria blooms (Trichodesmium sp.) in the Baltic Sea, a drastic reduction of the gas transfer coefficient (kw) was associated with bloom-induced biosurfactants, leading to ±20 % differences in seasonal CO2 uptake estimates (Schmidt and Schneider, 2011). Another study in the eastern tropical North Atlantic indicated that surfactants, especially in areas of high biological productivity, may dampen the air-sea exchange of other greenhouse gases like N2O as well (Kock et al., 2012). Estimates on how surfactants in the SML reduce global net oceanic CO2 uptake vary between 15 % and 60 % (Pereira et al., 2018; Asher et al., 1997; Tsai and Liu, 2003; Wurl et al., 2016). However, at sea, the variability and complexity of organic matter composition, combined with a dynamic physical environment, including waves, rain, and varying wind speed, make it hard to directly quantify the influence of surfactants on air–sea gas exchange and to examine which biochemical components contribute to the surfactant pool. Repeated conditions of constant wind speeds, especially in the low wind regime, are challenging to meet in the open ocean.
To investigate the influence of wind speed and surfactants on air–water mass exchange under more controlled conditions, wind-channel experiments have typically been conducted using freshwater and defined additions of artificial surfactants such as oleyl alcohol, hexadecanol, Triton-X and hexadecylamine (Hühnerfuss et al., 1981; Jähne et al., 1987; Alpers and Hühnerfuss, 1989; Mesarchaki et al., 2015; Frew et al., 1995; Gade et al., 1998; Krall, 2013). These studies demonstrated strong wave damping of surfactants up to a wind speed of 13 m s−1 (Broecker et al., 1978; Jähne et al., 1987). Only a limited number of wind-channel experiments have been conducted using natural surface films and seawater. For example, Tang and Wu (1992) demonstrated the wave-damping capacity of natural films under varying wind speeds, but did not investigate the biochemical composition of the surfactants. Contributing to a joint effort to close this knowledge gap, by conducting an experimental campaign at the Heidelberg Aeolotron, a unique large-scale facility capable of generating controlled wind conditions of up to 22 m s−1, which we filled with 18 000 L natural seawater. Unlike previous investigations that relied largely on artificial surfactants, freshwater, or simplified laboratory systems, our approach allowed us to directly examine natural marine biochemicals under controlled yet realistic SML conditions. Specifically, we investigated how wind speed influences the enrichment of the two quantitatively most abundant biopolymer classes, total hydrolysable amino acids (THAA) and total combined carbohydrates (TCCHO), in the SML and how these biopolymers contribute to capillary wave damping. To further link SML composition to surface physical properties, we also quantified surface roughness in terms of mean square slope measurements and surfactant surface coverage.
2.1 Experimental conditions and treatments
This study was part of the larger “Aeolotron” experiment, conducted in November 2014 to investigate various air-sea exchange processes under controlled wind conditions. The Aeolotron is an annular wind wave tank in Heidelberg, Germany, with a diameter of approximately 10 m, a water depth of 1 m, a 1.4 m air space above the water, and a total surface area of 18.4 m2 (Fig. 1a).
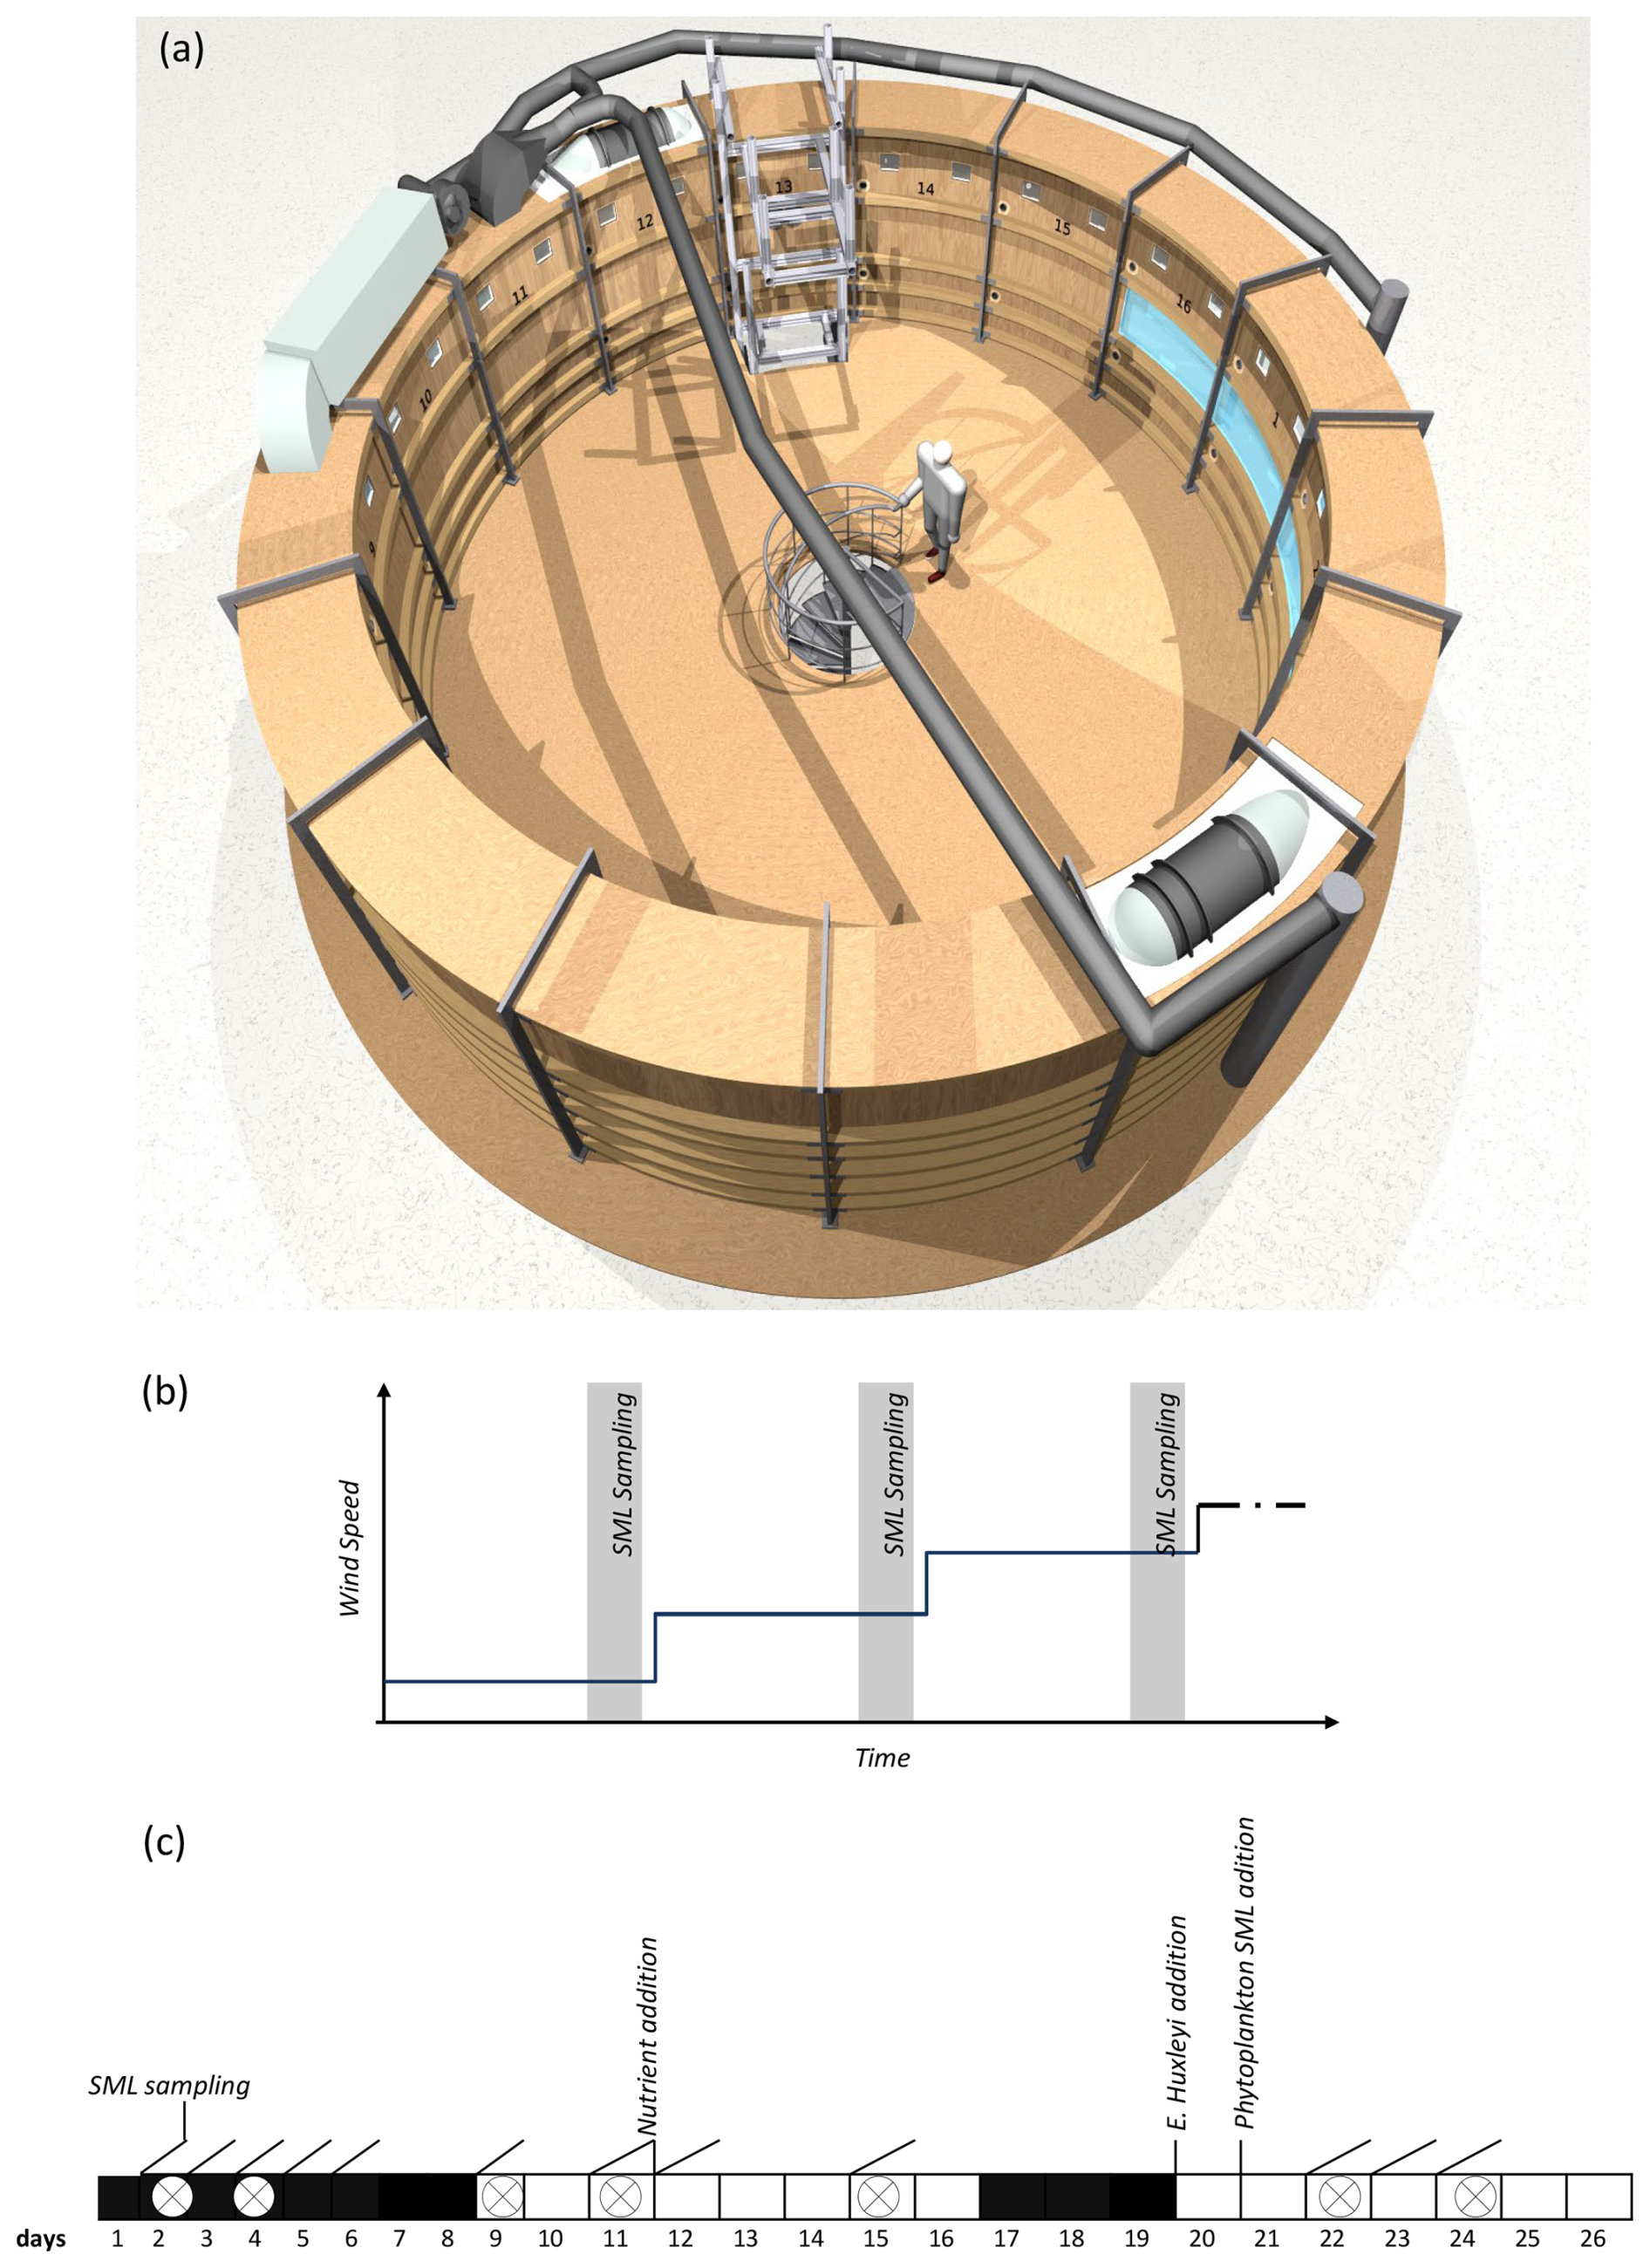
Figure 1Top-view on the Heidelberg annular wind-wave channel Aeolotron (a), where experiments with increasing wind speed were conducted on 7 d. Step-wise increase in wind speed applied during each wind experiment (b) and timeline of the Aeolotron study with different seawater modifications and the seven wind experiments (crossed circles) (c).
Due to its unique annular geometry, the Aeolotron wind-wave tank offers distinct advantages over conventional linear wind-wave tanks when aiming to replicate ocean-like conditions (Schmundt et al., 1995). In linear tanks, surfactants tend to accumulate near the wave absorber and are eventually rendered inactive, as they are transported out of the active measurement region by wind and wave action. In contrast, the annular design of the Aeolotron ensures that surface films remain uniformly distributed, allowing for sustained and realistic interactions at the air-water interface. Additionally, while conventional linear tanks are limited by fetch, the Aeolotron permits the continuous development of wind waves along an effectively unlimited fetch, allowing for the generation of older, more ocean-like wave fields. This enables the study of processes that are otherwise difficult to capture in shorter linear facilities.
Importantly, the limited absolute size of the Aeolotron does not compromise its relevance for studying interfacial gas exchange processes. The key mechanisms governing air-sea gas exchange, particularly those involving the sea surface microlayer (SML), operate on length scales of millimetres or less. These include molecular diffusion, micro-scale turbulence, and surfactant-mediated suppression of short capillary waves, all of which are fully resolved within the Aeolotron's experimental framework (Schmundt et al., 1995; Mesarchaki et al., 2015). As such, the Aeolotron provides an excellent platform for investigating the fundamental physics of gas transfer and interfacial dynamics under highly controlled yet ocean-relevant conditions.
The setup of the Aeolotron experiment and the physical, chemical and biological treatments in the course of the experiment are described in more detail elsewhere (Engel et al., 2018). Briefly, the wind wave channel was filled with approximately 18 000 L of seawater, which had been collected in September 2014 in the North Atlantic and German Bight, North Sea. The seawater had been stored in the dark at 10 °C for about a month until it was used to fill the Aeolotron.
Seawater temperature within the Aeolotron ranged from 20.13 to 22.21 °C. Light sources were operated over the tank for two periods of 8 (days 7–16) and 6 d (days 20–26), providing a photon flux of 115–120 µmol m−2 s−1. Inorganic nutrients were added on day 12. About 800 mL of a culture of Emiliania huxleyi (cell density: 4.6 × 10⁵ cell mL−1) was added on day 20. In addition, 6L of biogenic microlayer sampled with the glass plate during a previous phytoplankton mesocosm experiment, stored frozen at −20 °C for about 6 months, was thawed and added on day 21. The total duration of the Aeolotron experiment was 26 d.
During the Aeolotron experiment, a total of 7 wind experiments were conducted on days 2, 4, 9, 11, 15, 22, and 24 (Fig. 1b, c). During each experiment, the wind speed was increased stepwise yielding a range of wind speeds (U10) from 1.3 to 21.9 m s−1. The duration of each wind speed setting varied from 30 min to 2 h, with longer durations for the lower wind speeds. This scheme was chosen to facilitate robust concurrent measurements of air-sea gas exchange for each wind speed condition in a parallel project (Mesarchaki et al., 2015).
Wind speeds during the experiments were measured using a Pitot tube, and water velocities were measured using an acoustic Doppler velocimeter mounted equidistant from both the outer and inner wall at a water depth of approximately 50 cm. The friction velocity U∗, a measure for the wind's momentum input into the water, was calculated from the water velocity using a momentum balance method (Bopp, 2014). The friction velocity U∗ measured in the Aeolotron was subsequently converted to U10 using a parametrization of the drag coefficient derived from the open ocean (Edson et al., 2013).
2.2 Wave Slope Measurement
The Mean Square Slope (MSS, a statistical dimensionless parameter for surface roughness) of the water surface is strongly correlated with the air-sea gas transfer velocity (Jähne et al., 1987; Frew et al., 2004). The MSS is, therefore, an important parameter linking sea surface properties to air-sea exchange processes. During this study, the MSS of wind-induced waves was computed from wave slope images (Kiefhaber et al., 2014). These images were taken by a high-speed camera, positioned in a telecentric setup above the water surface, capturing images of a wave-height independent area at the water surface measuring 16 cm × 20 cm, achieving a resolution of 0.22 mm2 per pixel at a rate of 1500 frame s−1. Illumination of the water body was achieved from below, utilizing a programmable high-power LED light source in such a way that both the along-wind and cross-wind slopes, sx and sy of the waves, could be computed. From the slope images, the MSS is simply computed as an average over space and time, MSS = (sx2+sy2). As a reference, the variation of MSS with wind speed was determined for clean freshwater in a separate Aeolotron study beforehand (Kunz, 2017). Uncertainties for MSS values are < 10 % for values > 0.002. Close to the detection limit of 0.0003, uncertainties are in the order of the measured value.
2.3 Sampling
The SML was sampled on 12 d in the morning at low wind speed (U10: 1.3–1.5 m s−1) and towards the end of each wind speed step during each of the seven wind experiments (Fig. 1b). Sampling was carried out using the glass plate technique in accordance with established protocols (Cunliffe and Wurl, 2014), employing a borosilicate glass plate (500 × 250 × 5 mm) and a Teflon wiper. For sampling, the glass plate was inserted perpendicular to the surface and withdrawn at a rate of ∼ 20 cm s−1. Subsequently, the sample, retained by surface tension, was removed utilizing a Teflon wiper. Each sampling involved between 23 and 48 dips and precise documentation of the number of dips and total volume collected. All samples were collected in acid-cleaned (10 % HCl) glass bottles, washed with ultrapure water from a Milli-Q system, and rinsed with 20 mL of sample initially. Before each sampling event, both the glass plate and wiper were cleaned with 10 % HCl and extensively rinsed with Milli-Q water.
The thickness (d, µm) of the SML sampled with the glass plate was approximated:
where V represents the collected SML volume (ranging from 200–420 mL), A denotes the sampling area of the glass plate (A=2000 cm2), and n is the number of dips (Cunliffe and Wurl, 2014). In this study, d serves as an operational estimate for the thickness of the SML and is referred to as apparent SML thickness.
Underlying water (ULW) samples were taken in the morning at low wind speed from a tap ∼ 50 cm below the water surface, representing half the water column's height. These samples, ∼ 500 mL each, were filled into 10 % HCl-cleaned borosilicate glass bottles, rinsed with Milli-Q water, and pre-rinsed with ∼ 20 mL of the sample directly before filling. ULW samples were collected daily between day 1 and day 26 of the experiment, except for day 6 (Fig. 1c).
2.4 Analysis of organic compounds
2.4.1 Dissolved organic carbon (DOC)
Samples for DOC (20 mL) were collected in duplicate from the SML and ULW and filled into combusted glass ampoules after filtration through combusted glass-fibre filters (GF/F) filters (8 h, 500 °C). Samples were acidified with 80 µL of 85 % phosphoric acid, heat sealed immediately, and stored at 4 °C in the dark until analysis. DOC samples were analyzed by applying the high-temperature catalytic oxidation method (TOC-VCSH, Shimadzu) (Engel and Galgani, 2016). The instrument was calibrated every 8–10 d by measuring standard solutions of 0, 500, 1000, 1500, 2500 and 5000 µg C L−1, prepared from a potassium hydrogen phthalate standard (Merck 109017). Every measurement day, Milli-Q water was used to determine the instrument blank, which was accepted for values < 12 µg C L−1. DOC analysis was validated on every measurement day with deep seawater reference (DSR) material provided by the Consensus Reference Materials Project of RSMAS (University of Miami) yielding values within the certified range of 42–45 µmol C L−1. Additionally, two internal standards with DOC within the range of those in samples were prepared each measurement day using a potassium hydrogen phthalate (Merck 109017). DOC concentration was determined in each sample from 5 to 8 injections. The precision was < 4 %, estimated as the relative standard deviation of replicate measurements.
2.4.2 Biopolymers
Total hydrolysable amino acids (THAA), i.e., amino acids with a peptide bond, including amino acids contained in polypeptides or heteropolymers, like lipopeptides and glycopeptides, were determined in ULW and SML (Lindroth and Mopper, 1979; Dittmar et al., 2009). 5 mL of sample were filled into pre-combusted glass vials (8 h, 500 °C) and stored at −20 °C until analysis. Duplicate samples were hydrolyzed for 20 h at 100 °C with HCl (30 % suprapur, Merck) and neutralized by acid evaporation under vacuum in a microwave at 60 °C. Samples were washed with Milli-Q water to remove the remaining acid. Analysis was performed on a 1260 HPLC system (Agilent). Thirteen different amino acids were separated with a C18 column (Phenomenex Kinetex, 2.6 µm, 150 × 4.6 mm) after in-line derivatization with o-phtaldialdehyde and mercaptoethanol. The following standard amino acids were used: aspartic acid (ASX), glutamic acid (GlX), serine (SER), arginine (ARG), glycine (GLY), threonine (THR), alanine (ALA), tyrosine (TYR), valine (VAL), phenylalanine (PHE), isoleucine (ILEU), leucine (LEU), γ- aminobutyric acid (GABA). α- aminobutyric acid was used as an internal standard to account for losses during handling. Solvent A was 5 % Acetonitrile (LiChrosolv, Merck, HPLC gradient grade) in Sodiumdihydrogenphospate (Merck, suprapur) Buffer (pH 7.0), Solvent B was Acetonitrile. A gradient was run from 100 % solvent A to 78 % solvent A in 50 min. The detection limit for individual amino acids was 2 nmol monomer L−1. The precision was < 5 %, estimated as the relative standard deviation of replicate measurements.
Based on THAA measurement, the Degradation Index (DI) was calculated as an indicator of the diagenetic status of organic matter (Dauwe and Middelburg, 1998). For instance, leucine typically exhibits preferential degradation compared to glycine. Mole percentages of amino acid were standardized using averages, and standard deviations and multiplied with factor coefficients based on Principal Component Analysis (PCA) as given in Dauwe et al. (1999). Lower DI values indicate more degraded organic matter, whereas higher DI values indicate more fresh organic matter.
Total hydrolysable carbohydrates > 1 kDa (TCHO), i.e., carbohydrates with a glycosidic bond, including carbohydrates contained in polysaccharides and heteropolymers like glycolipid and glycopeptides, were determined in bulk seawater and in the SML. 20 mL were filled into pre-combusted glass vials (8 h, 500 °C) and kept frozen at −20 °C until analysis. The analysis was conducted by applying high-performance anion exchange chromatography coupled with pulsed amperometric detection (HPAEC-PAD) on a Dionex ICS 3000 (Engel and Händel, 2011). Samples were desalinated by membrane dialysis (1 kDa MWCO, Spectra Por) for 5 h at 1 °C, hydrolyzed for 20 h at 100 °C with 0.4 M HCl final concentration, and neutralized through acid evaporation under vacuum and nitrogen atmosphere (1 h, 60 °C). Two replicate samples were analyzed. For our system, the best resolution of sugars was obtained at 25 °C and, therefore, applied constantly during all analyses. In order to minimize degradation of samples before analysis, the temperature in the autosampler was kept at 4 °C. The system was calibrated with a mixed sugar standard solution including the neutral sugars: fucose (4.6 µM, FUC), rhamnose (3.1 µM, RHA), arabinose (2,0 µM, ARA), galactose (2.4 µM, GAL), xylose/mannose (3.1 µM, XYL/MAN), glucose (2.4 µM, GLC), amino sugars: galactosamine (2,0 µM, GAL-N), glucosamine (2.8 µM, GLC-N), and acidic sugars: galacturonic acid (2.8 µM, GAL-URA), gluconic acid (5.1 µM, GLC-AC), glucuronic acid (3.0 µM, GLC-URA) and muramic acid (1.9 µM, MUR-AC). Regular calibration was performed by injecting 12.5, 15.0, 17.5 and 20 µL of mixed standard solution. The linearity of the calibration curves of individual sugar standards was verified in the concentration range 10 nM–10 µM. Therefore, the standard mixture was diluted 10, 20, and 50-fold with Milli-Q water. The injection volume for samples and for the blank was 17.5 µL. To check the performance of carbohydrate analysis and stability of the HPLC-PAD system, a 17.5 µL standard solution was analyzed after every second sample. The detection limit was 10 nmol L−1 for each sugar, with a standard deviation between replicate runs of < 2 %. Milli-Q water was used as a blank to account for potential contamination during sample handling. Blanks were treated and analyzed in the same way as the samples. Blank concentration was subtracted fromthe sample concentration if above the detection limit.
The relative concentration of a substance (A) in the SML was compared to its concentration in ULW by the enrichment factor (EF):
Because of normalization, EFs for different components can be readily compared. Enrichment of a component is indicated by EF > 1, depletion by EF < 1. Statistical analyses were conducted using SigmaStat 4.0.
2.4.3 Surfactant Coverage and Enrichment
Samples for surfactant coverage (sc) were taken only for the initially low and at the highest wind speed. Duplicate 50 mL SML samples were collected on 7 experimental days (days 2, 4, 9, 11, 15, 22, and 24) for initially low and at the highest wind speed; on day 2, only a low wind sample was available. The SML samples were transferred into polypropylene bottles, immediately frozen at −40 °C for transport, and stored at −80 °C before analysis using surface-sensitive non-linear vibrational sum-frequency generation (VSFG) spectroscopy with a commercial picosecond VSFG spectrometer (EKSPLA, 532 nm up-conversion wavelength). The use of VSFG spectroscopy for SML surfactant analysis and its interpretation has been shown previously (Engel et al., 2018; Laß and Friedrichs, 2011). The VSFG signal intensity IVSFG, SML (integrated over the spectral wavenumber range of C-H bond signatures, 2750–3000 cm−1) can be related to the surfactant surface coverage via a square root relationship (), where IVSFG, DPPC refers to the intensity of a well-defined reference surfactant monolayer, here an artificial monolayer of the phospholipid dipalmitoylphosphatidylcholine (DPPC), a well-characterized and chemically stable model surfactant. In our previous work, which focused on the correlation of low wind speed data with the concentration of γ-aminobutric acid (GABA) as an indicator for microbial decomposition (Engel et al., 2018), we have used a highly compressed monolayer of DPPC in its solid 2D phase as the reference signal for a completely surfactant-covered surface. However, as the complex mixture of biosurfactants will prevent the formation of such a highly ordered monolayer, we now have adopted the onset of the DPPC 2D phase transition.
In order to convert sc into an effective concentration measure for surfactants in the SML and thus enable a direct correlation with the measured concentration trends of the DOM fractions THAA and TCHO, the exact composition and surfactant properties of the substances present in the SML would have to be known. However, for a surfactant pool typically dominated by wet (i.e., “soluble” in contrast to “unsoluble” dry) surfactants (Laß and Friedrichs, 2011), it is reasonable to assume an adsorption equilibrium of bulk SML surfactants with the air-water interface such that sc can be described by a reduced Langmuir isotherm (Burrows et al., 2014) according to:
or
Here, c∗ is the reduced concentration with corresponding to the effective bulk SML surfactant concentration yielding a half-covered surfactant monolayer. Accordingly, sc increases linearly with c∗ at low surfactant concentrations but levels out towards the limiting value of a completely covered surface at high surfactant concentrations. While the surfactant indices c∗ and sc derived from the VSFG measurements provide semi-quantitative insights into surfactant abundance and surface coverage, it is important to note that they are based on assumptions and approximations and should be interpreted accordingly. For example, the analysis may be biased by the variable composition of the surfactant pool during the Aeolotron study. This may have induced more or less pronounced variations in the effective value, which, however, was assumed to be constant.
3.1 Organic matter variations in the SML in the course of the Aeolotron experiment
Biomass in the water column and variations in microbial abundance and organic matter composition in the course of the Aeolotron experiment have been reported previously (Engel et al., 2018). To illustrate the conditions in which the wind experiments were conducted, we briefly describe the relevant findings here. Particulate organic matter remained low throughout the experiment, with particulate organic carbon (POC) concentrations ranging between 4 and 29 µmol L−1. Chlorophyll a (Chl a) concentration increased after introducing an Emiliania huxleyi culture on day 19, reaching peak values of 0.042 µg L−1 on day 25. DOC concentration in the bulk seawater increased during the course of the experiment (days 2–24) from 85 to 120 µmol L−1. Biopolymers accumulating in the SML can be dissolved, colloidal and particulate. In particular, gel-like particles containing amino acids – Coomassie stainable particles (CSP) and carbohydrate containing transparent exopolymer particles (TEP) – have been shown to accumulate in the SML (Sun et al., 2018). To account for these components in our analysis, and given that the cellular biomass was generally low, we here report total concentrations of the biochemicals, where THAA ranged from 0.83 to 1.67 µmol L−1 and TCHO from 0.66 to 1.28 µmol L−1.
Throughout the Aeolotron experiment, the SML consistently showed enrichment in DOC, THAA, and TCHO, except on day 15, where the difference between SML and ULW fell within analytical error limits. DOC enrichment factors (EFDOC) ranged from 1.0 to 1.6. THAA concentration in the SML was highest on day 4 with 35.5 µmol L−1, declined to the lowest concentration on day 15 (1.05 µmol L−1), and increased again after the addition of natural phytoplankton-derived organic matter on days 20 and 21 (Fig. 2a). In general, the monomeric composition of THAA in the SML was dominated by GLX (15.8 mol %–25.3 mol %), GLY (14.2 mol %–21.5 mol %), and ASX (8.84 mol %–16.0 mol %). GABA, an indicator for bacterial degradation, was highest on day 15 with 0.41 mol %. High enrichment of THAA in the SML was observed during the first 11 d of the Aeolotron experiment (EFTHAA = 13–38). THAA were slightly depleted in the SML on day 15 (EFTHAA = 0.91) and became enriched again thereafter (EFTHAA = 2.89–3.24). A selective enrichment of individual amino acids in the THAA pool of the SML was observed, with the highest enrichment observed on day 4 for the basic amino acid ARG (EFARG = 74.4), which contributed only 2.8 mol %–6.2 mol % to the THAA pool, and for the acidic amino acid GLX (EFGLX = 53.7).
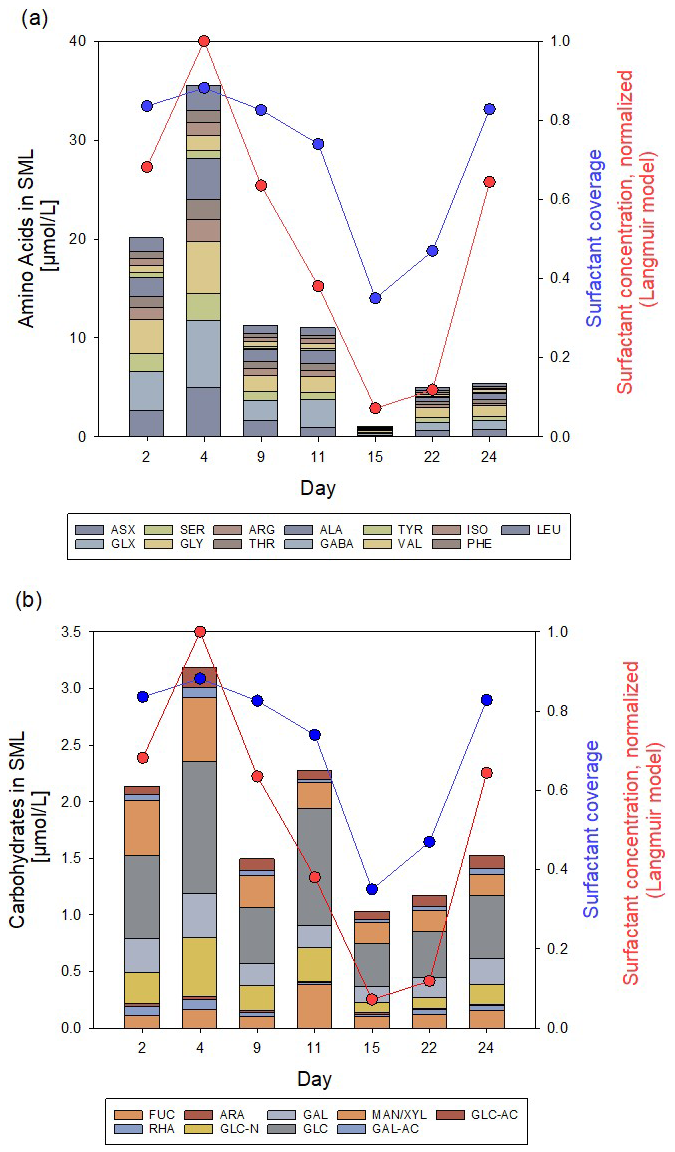
Figure 2Concentration/composition of (a) THAA and (b) THCO in the SML at low initial wind speed (1.3–2.0 m s−1) and variation of surfactant surface coverage (sc, blue circles), as well as normalized reduced bulk SML surfactant concentration (, red circles). Based on a dataset first published in Engel et al. (2018).
Organic matter accumulating in the SML was generally less degraded than in the ULW, as indicated by the degradation index (DI) based on THAA composition (Fig. S1). This, in turn, suggested that it was the “fresher” fraction of biopolymers that became selectively enriched in the SML. In particular, DI values for organic matter in the SML were lowest on day 15, when biopolymer concentration was also lowest, indicating preferential decomposition of the more labile organic matter.
TCHO in the SML varied between 2.14 and 1.03 µmol L−1, and – similar to THAA – were higher during the first 11 d of the experiment, lowest on day 15, and increased again until day 24, but without reaching the high values from the first days of the experiment (Fig. 2b). TCHO were enriched in the SML with EFTCHO of 1.5–5.6, with higher values observed during the first 4 d of the experiment. TCHO composition in the SML was dominated by GLC (33 mol %–45 mol %), XYL/MAN (10 %–23 %), and GAL (8.8 mol %–15 mol %). FUC has been considered an indicator of labile, phytoplankton-derived TCHO (Engel et al., 2012). FUC was 5 mol % at the beginning of the experiment and increased after the addition of the phytoplankton-derived material to 17 mol %. Likewise, GLC-N, as an indicator of more degraded TCHO, decreased from 12.6 mol % initially to 8 mol %. Within the pool of TCHO in the SML, the highest enrichment was observed on day 4 for the amino-sugar GLC-N (EFGLC-N = 12.89) and the acidic sugars GAL-URA and GLC-URA (EFGAL-URA = 6.70, EFGLC-URA = 6.57). On day 22, biopolymer concentration in the SML had increased again as natural slick material was added on day 21, yielding EFTCHO values around 3 on days 22 and 24.
The biopolymer ratio [THAA] : [TCHO] was highest on days 2 and 4 with values of 9.4 and 11, respectively, and decreased thereafter. [THAA] : [TCHO] was lowest on day 15 with equal concentrations and yielded 4.3 and 3.6 on days 22 and 24.
Variations in biopolymers in the SML aligned well with the surfactant surface coverage index sc. Surface coverage was generally high, with sc > 0.74 for 5 out of 7 d. The overall similar trend in biopolymer and surfactant abundance was even more evident in the reduced surfactant-concentration data, which have been normalized to the maximum value of measured on day 2 for clarity. The correlation between the normalized reduced surfactant concentration and THAA was slightly higher (r = 0.84; n = 7; p = 0.019) than for TCHO (r = 0.79; n = 7, p = 0.034). Together with the higher abundance of THAA and presumably higher surface activity of polypeptides compared to polysaccharides (Burrows et al., 2014), this is another indication that, in particular, protein-rich material was important for the formation of the highly surfactant-covered air-water interface.
3.2 Sea surface properties and biochemical SML composition at increasing wind speed
During the Aeolotron study and all seven wind experiments, the water column was covered by an SML, with an apparent thickness (d) of 31–50 µm. In the course of the Aeolotron experiment, SML thickness increased from d = 36 µm on day 2 to d = 45 µm on day 24, determined at low wind speed for each measurement day. Combining all data from wind speed experiments days 4 to 24 showed clear patterns regarding the relationship between SML thickness and wind speed (Fig. 3). Overall, d increased gradually and significantly with wind speeds (r = 0.63, n = 34, p < 0.001). The value of d varied between the same wind speed of different experiments, but was always lowest at low wind speeds, suggesting that SML disruption and mixing between the SML and ULW and surface accumulation of organic components during high wind speeds had no long-lasting (> 24 h) memory effects on SML thickness.
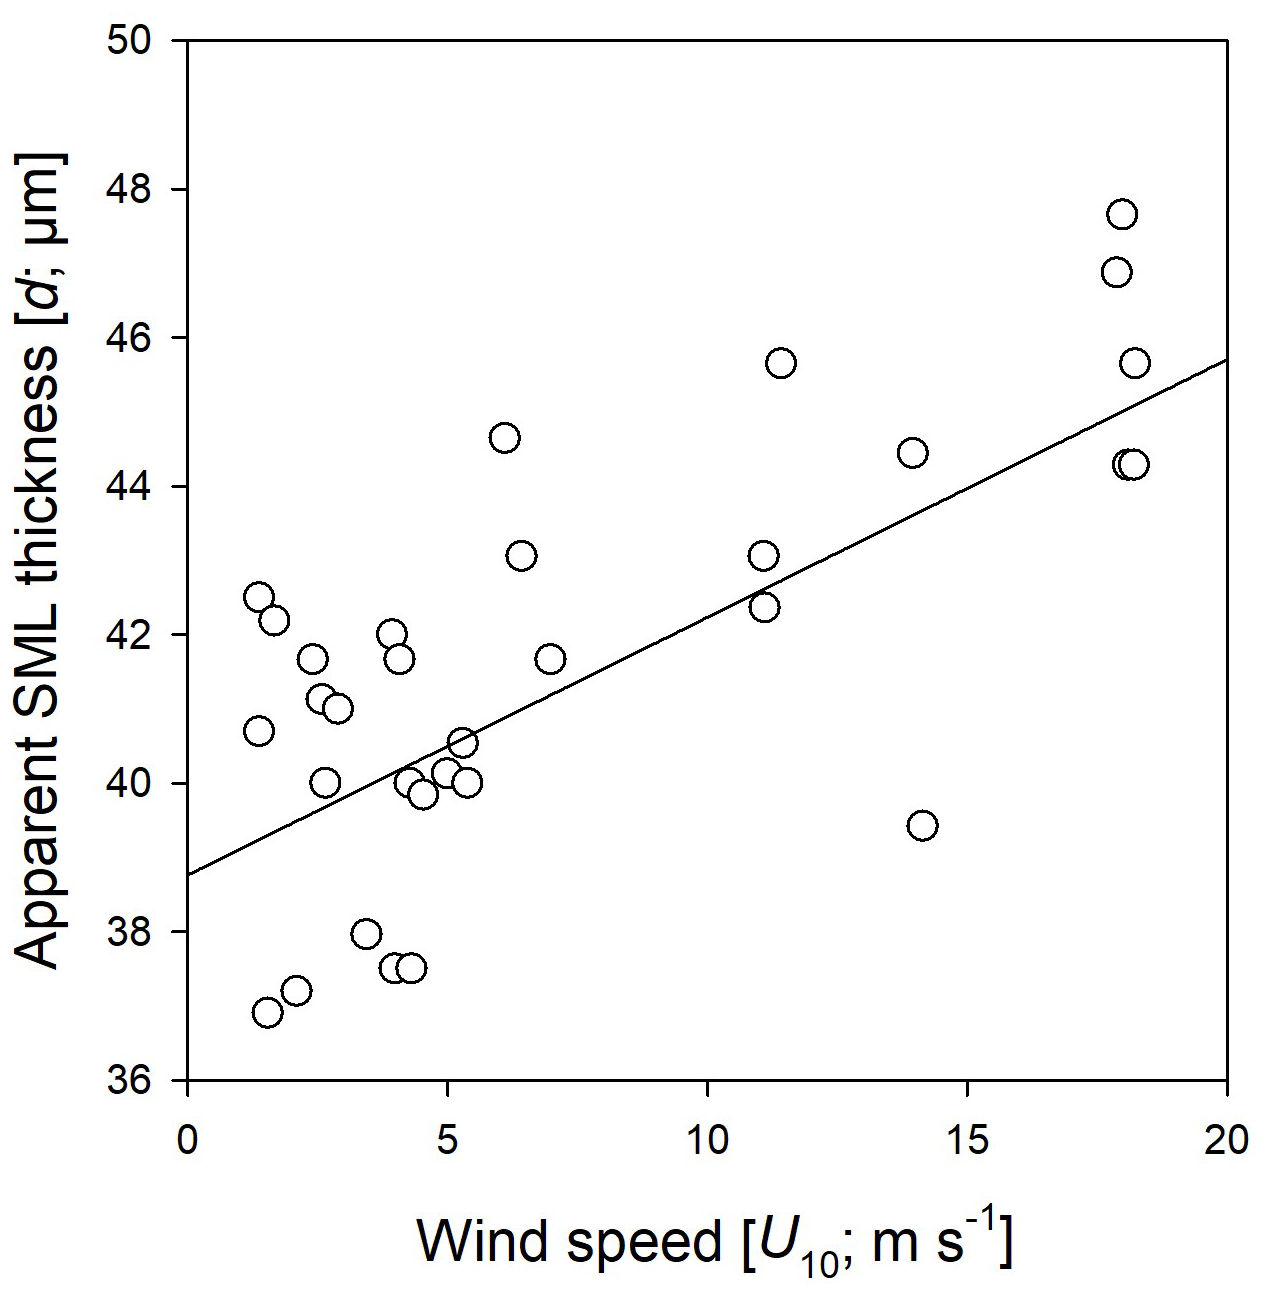
Figure 3Relationship between wind speed (U10) and the apparent thickness of the SML (d) as assessed by glass-plate sampling during the Aeolotron experiment.
The surface roughness, a measure of the small- to medium-scale structure of the wave field that controls how the sea interacts with wind and light, has been determined by means of the MSS value, a parameter directly correlated with air-sea exchange of gases and heat. Reference freshwater MSS values showed a gradual increase with wind speed (U10) from 5.35 × 10⁻³ at 3.2 m s−1 to 1.90 × 10⁻¹ at 22.1 m s−1 (Fig. 4). The total range of MSS values for natural seawater was 3.0 × 10⁻⁴–1.67 × 10⁻¹. Compared to freshwater, MSS values abruptly changed around 6 m s−1 and were about 1–2 orders of magnitude lower at wind speeds of U10 < 6 m s−1 during experiments conducted on days 2, 4, 9, 11 and 24. This strong wave-damping effect at U10 < 6 m s−1 was accompanied by high surfactant surface coverage values of sc > 0.74. On days 15 and 22, with sc < 0.47, surface coverage was significantly lower, and the corresponding MSS values at low windspeed were clearly higher and close to those observed for freshwater, yielding values of 1.32 × 10⁻³–3.52 × 10⁻³. At wind speeds > 6 m s−1, MSS generally continued to increase with wind speed for all available natural seawater samples and, despite some variability between the experimental days, closely followed the freshwater trend.
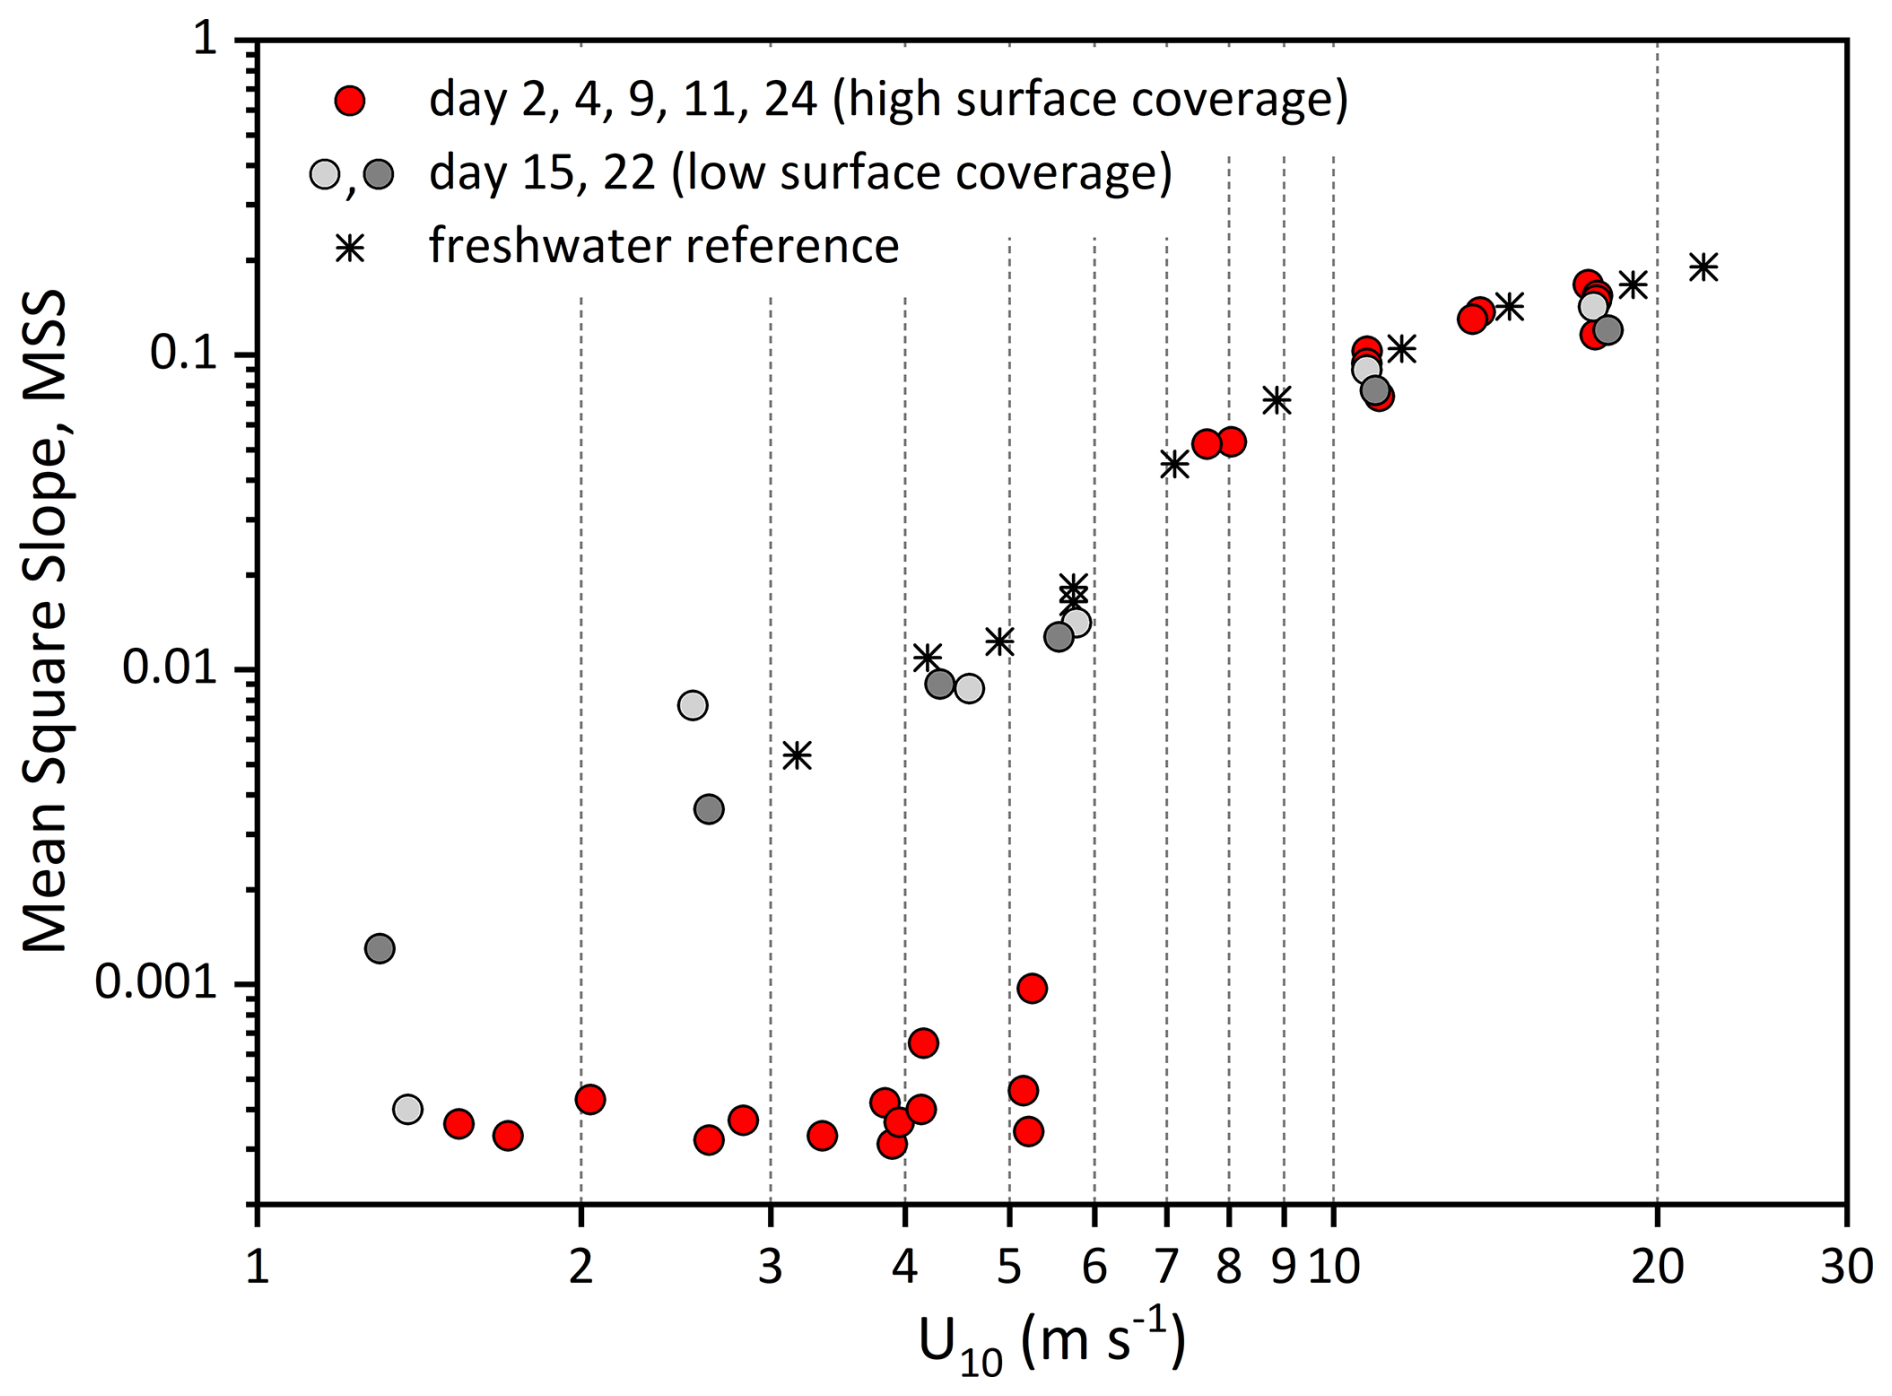
Figure 4Mean Square Slopes (MSS, dimensionless) relative to wind speed (U10, m s−1) during experiments with natural seawater. Days 2, 4, 9, 11 and 24 (red circles) with significant wave damping at wind speeds < 6 m s−1; day 15 (light grey circles), and day 22 (grey circles) with little wave damping compared to pure freshwater (asterisk).
For a better representation of biopolymer accumulation in the SML at different wind speeds, we grouped data for days 2 and 4, and for days 9 and 11. Days 15, 22 and 24 showed different patterns and are shown individually. In accordance with previously observed enrichment patterns, concentrations of biopolymers in the SML declined with increasing wind speed, showing a pronounced step to lower values at wind speeds > 5–6 m s−1. This effect was most evident for experiments days 2–11, having the highest initial SML biopolymer concentration (Fig. 5a–o). At wind speed > 5–6 m s−1, THAA and TCHO concentrations in the SML were similar or equal to ULW concentration. This collapse of the biopolymeric SML enrichment coincided with the sudden and pronounced change in MSS. On day 15, biopolymer concentration in the SML was not different from the ULW at initially low wind speed. The absence of an organic SML enrichment on day 15 may be attributed to enhanced microbial decomposition and is supported by the amino-acid-based degradation index (DI), which was lowest on day 15, suggesting a high degree of degradation (Engel et al., 2018). In this sense, the slight increase of DOC with increasing wind speeds on day 15 and even more pronounced on days 22 and 24, i.e., after the addition of phytoplankton and phytoplankton-derived organic matter to the ULW, suggests that organic matter of the underlying water enriched the SML again, likely due to enhanced mixing and rising of film-covered bubbles after wave-breaking, which is an established mechanism discussed in literature (Blanchard, 1975; Stefan and Szeri, 1999; Sabbaghzadeh et al., 2017) (Fig. 5i). On days 22 and 24, higher biopolymer concentrations in the SML were observed again, likely due to the addition of organic matter from a phytoplankton culture (day 20) and slick material from an earlier mesocosm study (day 21). Biopolymer concentration and enrichment, however, stayed below values observed during the first two weeks of the experiment. Enrichment of the biopolymers THAA and TCHO in the SML ranged between 0.74 and 38 for EFTHAA and between 0.70 and 5.77 for EFTCHO and fell to values ∼ 1 at U10 > 5–6 m s−1 also.
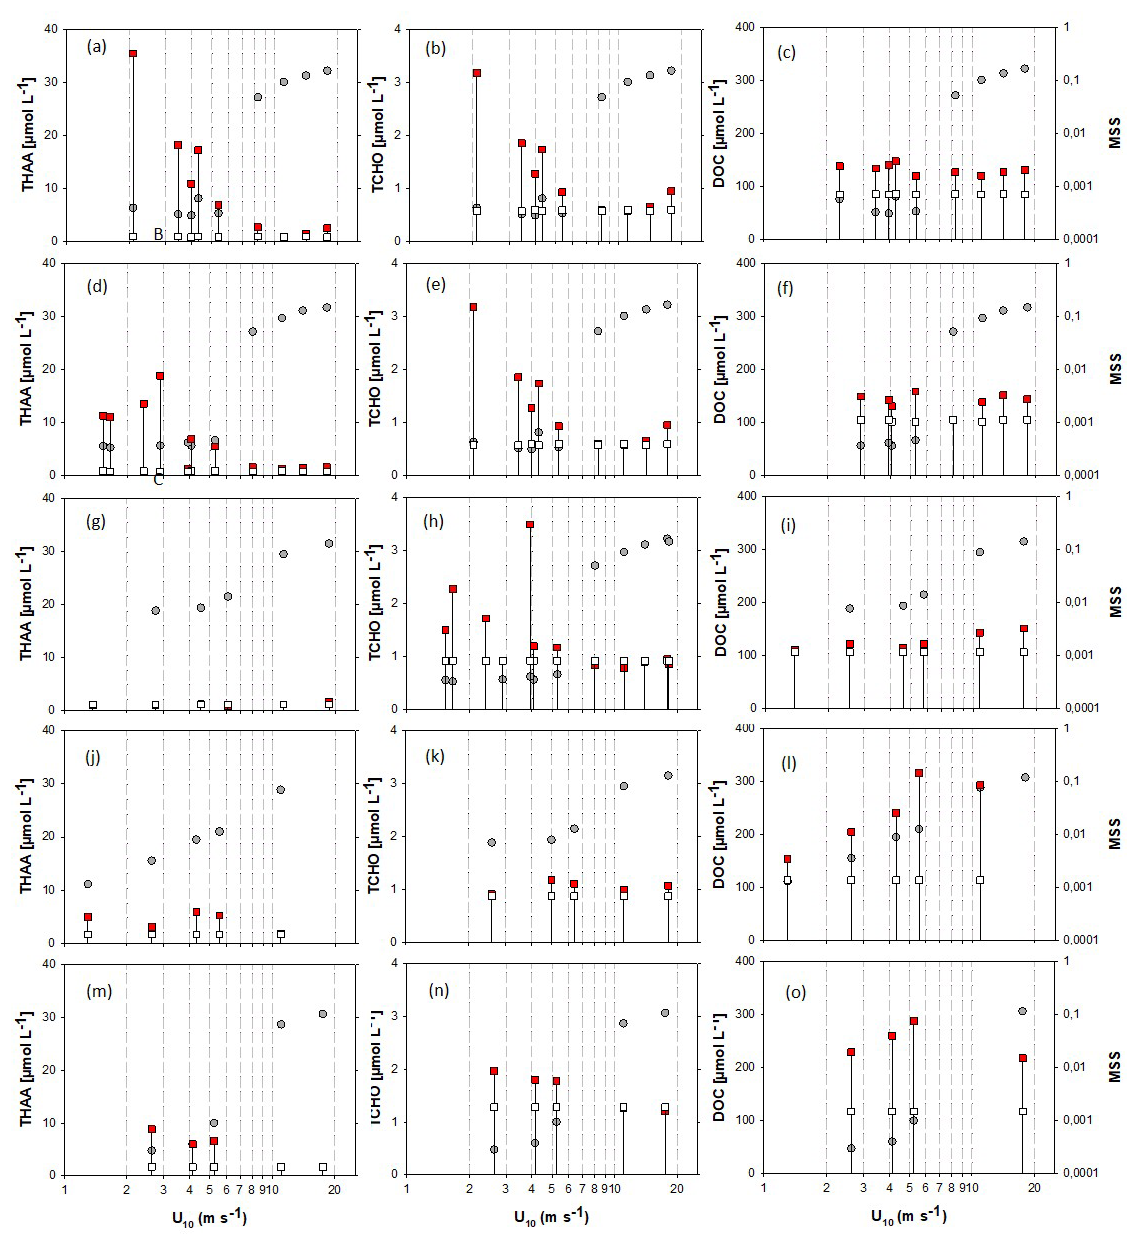
Figure 5Changes in organic matter components in the SML (red squares) and ULW (open squares) at different wind speeds (U10), and associated MSS values (grey circles). For better coverage of wind speeds, samples with similarities in SML biopolymer concentrations and surface coverage were grouped, specifically, samples were grouped for days 2 and 4: panels (a)–(c) and days 9 and 11: panels (d)–(f). Day 15: panels (g)–(i), day 22: panels (j)–(l), day 24: panels (m)–(o). Drop lines indicate associated SML-ULW pairs.
Enrichment of DOC in the SML varied between EFDOC 1.04 and 2.78 and was not directly related to wind speed. In contrast to THAA and TCHO, DOC concentration in the SML remained higher than in the underlying bulk seawater or even increased at increasing wind speed. Differences in DOC concentrations between SML and bulk seawater were moderate during experiments days 2, 4, 9 and 11 (Fig. 5c, f), lowest on day 15 (Fig. 5i) and highest for the experiments conducted after the addition of organic material (Fig. 5l, o).
Surfactant surface coverage and the corresponding reduced surfactant concentration in the bulk SML were determined only at the lowest and highest wind speeds, respectively (Fig. 6). Both quantities were clearly reduced at high wind speed, except for day 15. As already outlined above, in contrast to all other days, day 15 did not show an enrichment of organics in the SML, along with a presumably high degree of degradation. Consequently, surfactant surface coverage closely resembled biopolymer accumulation in the SML. In general (excluding day 15), surfactant surface coverage (factor 1.6 ± 0.2, n = 5) and effective surfactant concentration (factor 4.6 ± 1.5, n = 5) were smaller at high wind speed and less variable at low wind speed, supporting the idea of surfactant accumulation in slicks.
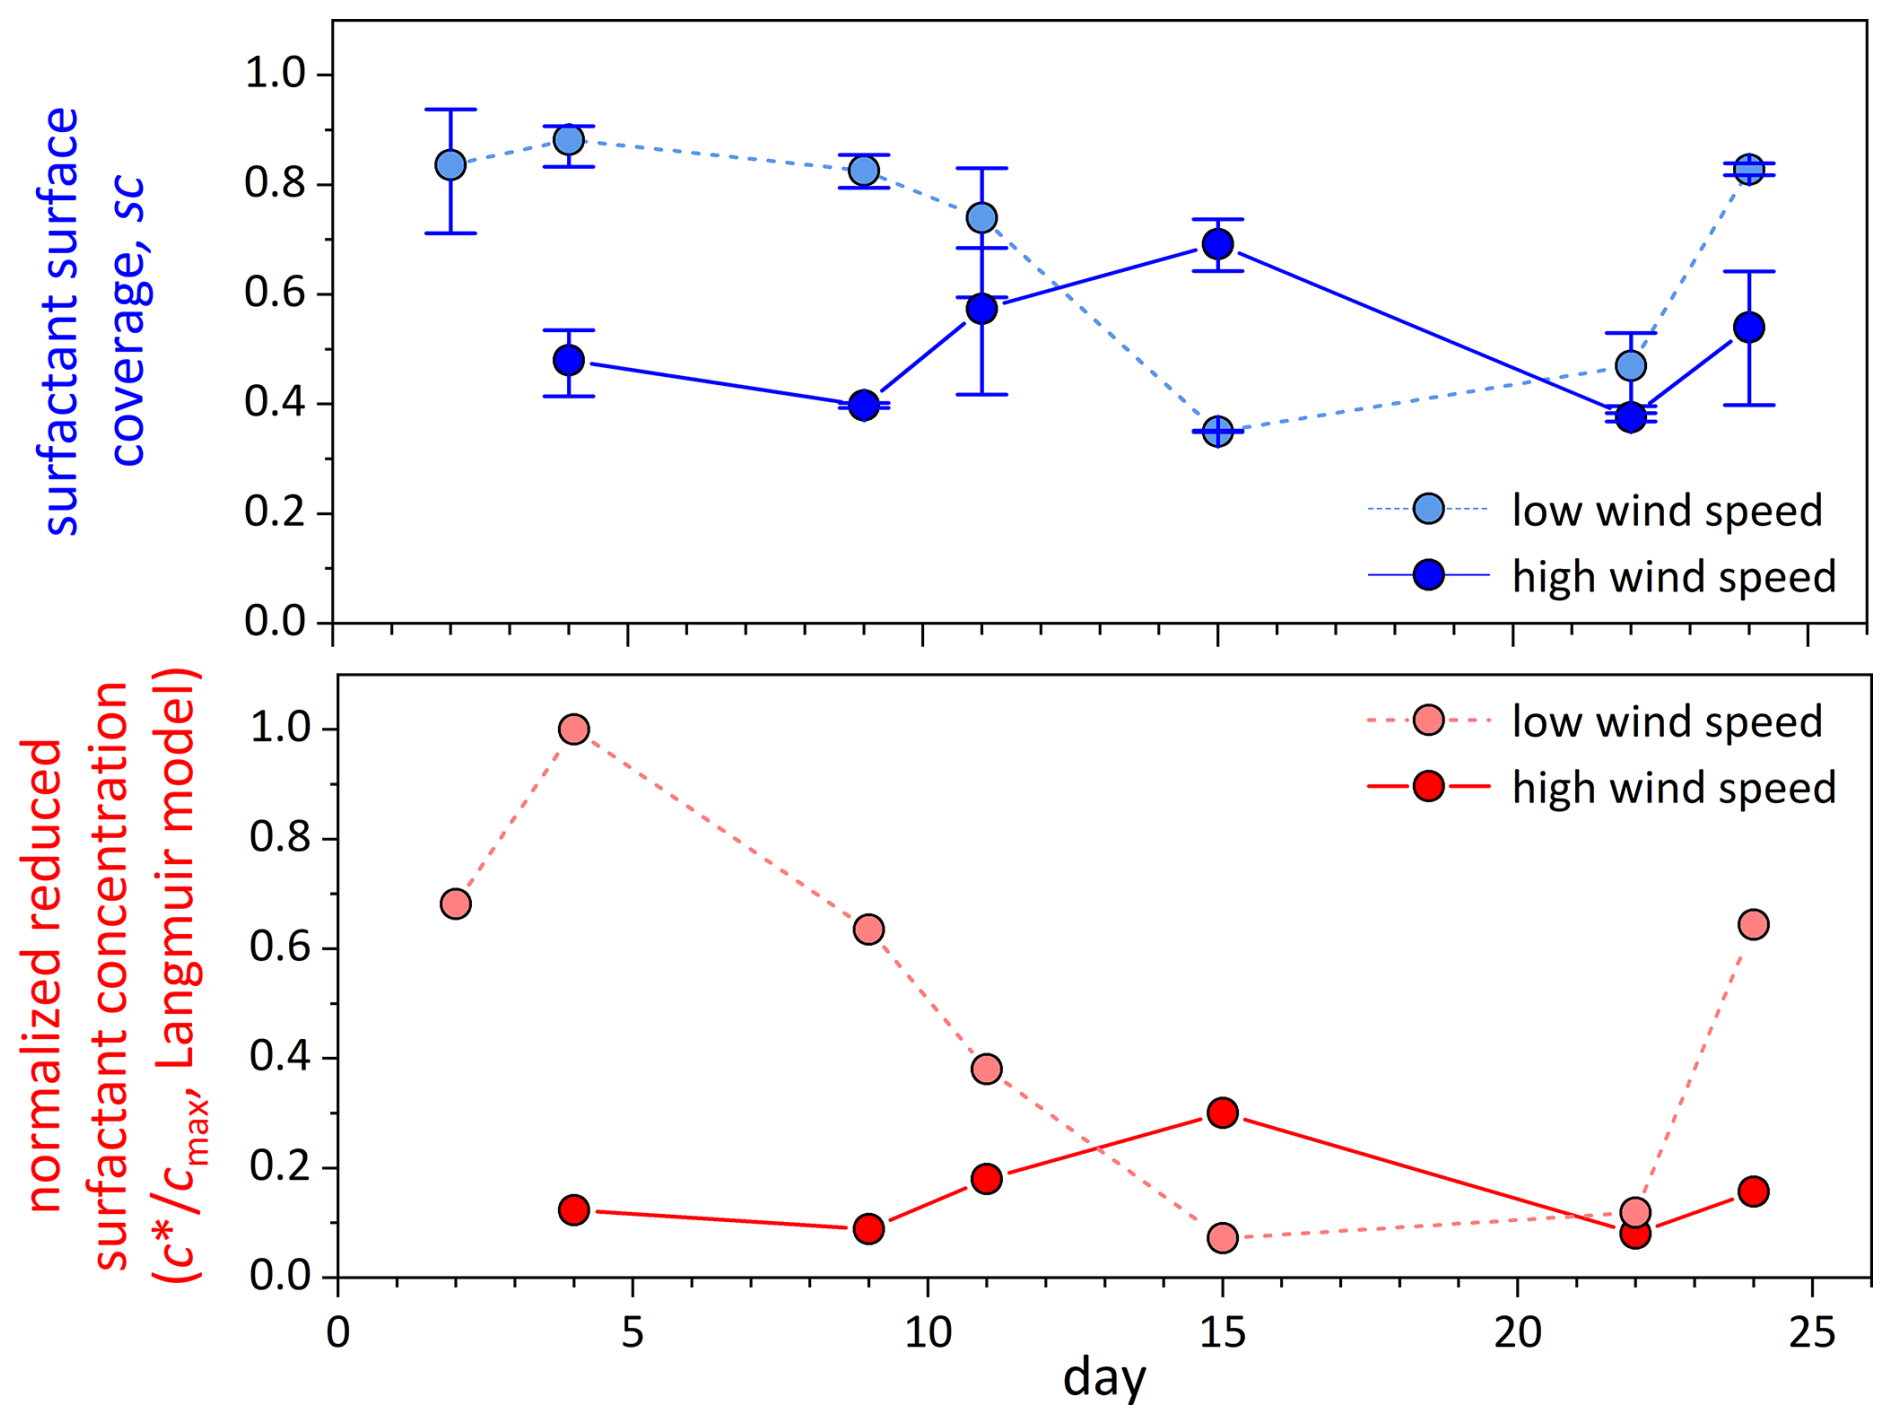
Figure 6Surfactant surface coverage sc (blue symbols) and normalized reduced bulk SML surfactant concentration (red symbols), as determined by VSFG spectroscopy for SML samples at the end of the lowest (light color) and highest wind speed (dark color) setting. No surfactant data were obtained at high wind on day 2.
3.3 Wind-induced changes in biopolymer composition
In addition to concentration changes, wind speed also altered the monomeric composition of biopolymers in the SML. Wind speed clearly affected THAA composition in the SML, with a significant decrease in molar contributions of PHE, VAL, ARG, and ISO (p < 0.001) and significant increases (p < 0.001) in GLY, GABA, SER, and LEU, while changes were less or not significant for TYR, ALA, GLX, ASX, and THR (Table 1). At times of high THAA enrichment (EFTHAA > 6), i.e. days 2–11, a strong selective enrichment of ARG and GLX was observed in the SML at all wind speeds, with EFArg being approximately twice as high as EFTHAA (Fig. 7a). In contrast, GABA was relatively depleted in the SML, with EFGABA being less than half as much as EFTHAA. Selective enrichment of ARG vanished after day 15 and was only slightly higher on days 22 and 24, with the highest EFARG = 6.8 at EFTHAA = 5.3.
Table 1Correlation between wind speed (U10) and monomeric components (mol %) of TCHO (left column) and THAA (right column) as observed for the SML samples. n.s.: not significant.
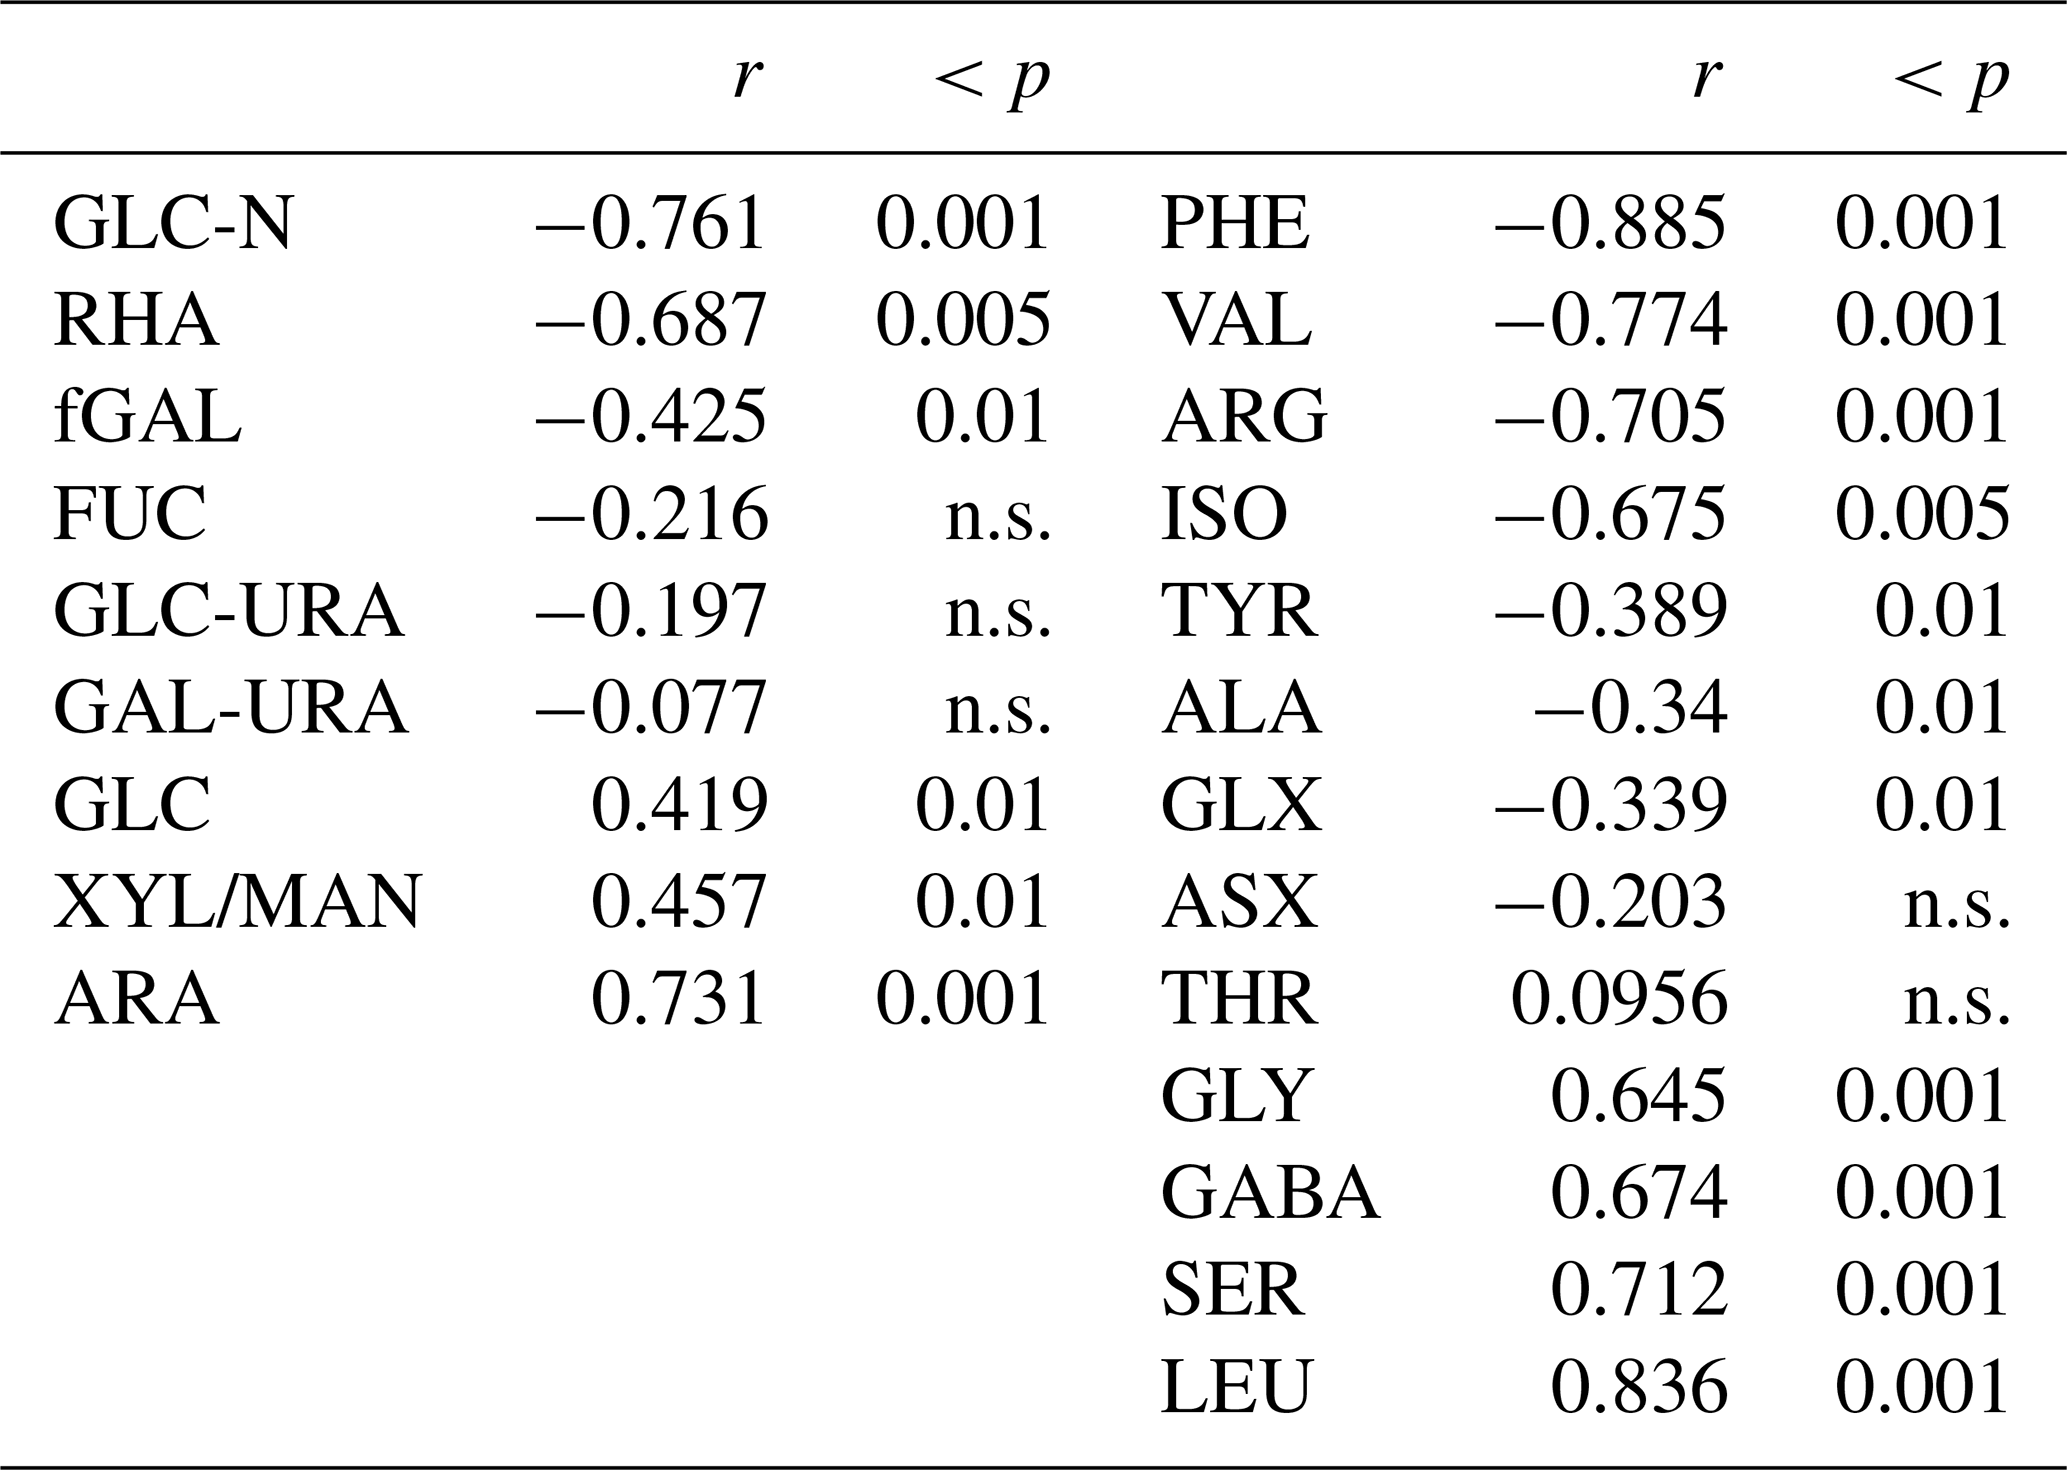
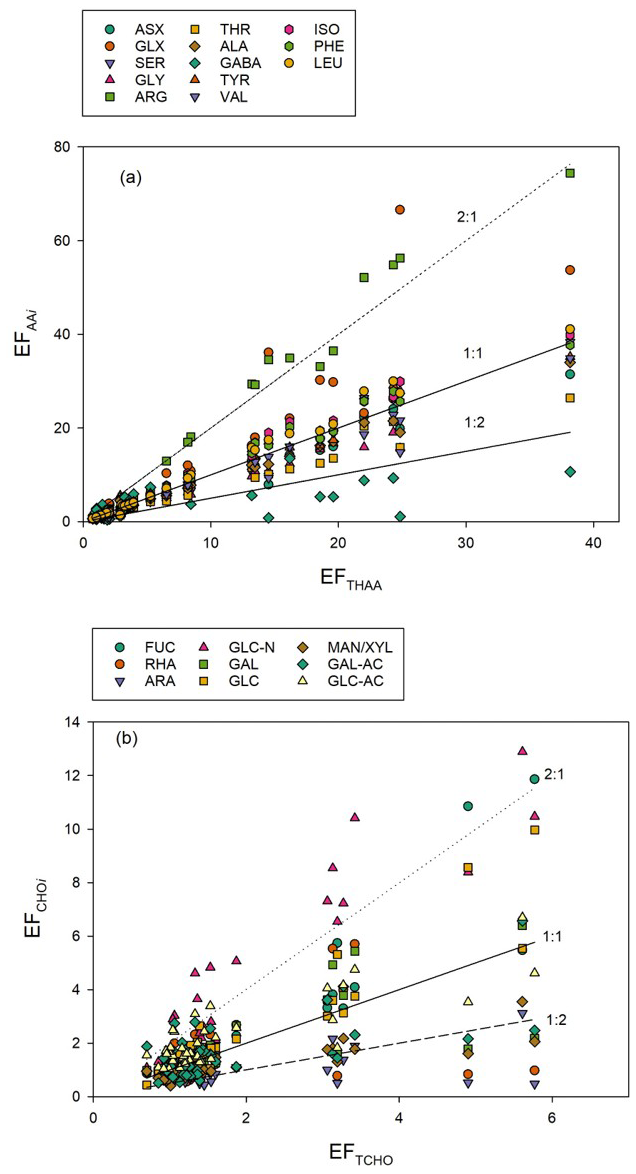
Figure 7Relationships between Enrichment Factors (EFs) of individual amino acids (EF) and total hydrolysable amino acids (EFTHAA) (a) and between EFs of individual sugars (EF) and total combined carbohydrates (EFTCHO) (b). Lines shown for reference: 2-fold enrichment (2 : 1), no enrichment (1 : 1) and 2-fold depletion (1 : 2).
Wind-induced changes in THAA composition indicate that the rather fresh organic material that accumulated at the SML under low wind conditions was mixed into the underlying seawater and replaced at higher wind speeds by more diagenetically altered material. This was evident from the DI index being systematically higher at wind speed < 6 m s−1 than above. Again, only day 15 stood out of this pattern with similarly low DI indices at all tested wind speeds. In contrast to THAA, wind-induced effects on the carbohydrate composition of biopolymers were less pronounced. A clearly significant selective decrease with increasing wind speed was observed for GLC-N, GAL and RHA (Table 1). Also, GAL became depleted at increasing winds, while no impact was observed on the uronic acids GLC-URA and GAL-URA, as well as on FUC. ARA was the only sugar that became clearly enriched in the SML with increasing wind speed, while GLC and XYL/MAN, being quantitatively the most important sugars, showed only a moderate relationship with wind speed.
Like individual amino acids, some sugars were selectively enriched in the SML, in particular when TCHO enrichment was relatively high (EFTCHO > 2) (Fig. 7b). This was most pronounced for the amino-sugar GAL-N with EFGAL-N: 1.08–12.9 compared to TCHO with EFTCHO: 0.70–5.77. Interestingly, only a slight selective enrichment was observed for the two uronic acids determined during this study when compared to EFTCHO, i.e., GAL-URA (EFGAL-URA: 0.51–6.57) and GLC-URA (EFGLC-URA: 1.04–6.57). Uronic acids are building blocks of complex gel-like colloidal and particulate material suggested to form the SML (Sieburth, 1983; Cunliffe and Murrell, 2009), and accumulation of carbohydrate-rich gel-like transparent exopolymer particles (TEP) was also observed during this study (Sun et al., 2018). ARA and XYL/MAN were consistently less enriched than TCHO, showing EFAra: 0.44–3.12 and EFXYL/MAN: 0.41–3.55, respectively.
4.1 Accumulation of biopolymers at the air-sea interface
Seven experiments were conducted with natural seawater in the annular wind-wave channel Aeolotron and revealed distinct patterns regarding the accumulation of natural organic matter in the SML, the impact of wind speed on biopolymer enrichment and composition, as well as the effects of biopolymer enrichment on capillary wave damping. Firstly, biopolymers, specifically substances containing amino acids and carbohydrates, were found to be highly enriched in the SML at low wind speeds (< 6 m s−1).
Biopolymers have long been considered important in the SML dynamics; the SML itself proposed to be a highly hydrated loose gel of tangled macromolecules and colloids (Sieburth, 1983; Cunliffe and Murrel, 2009). During this study, the range of biopolymer (THAA + TCHO) concentration in the SML was 1.4–40 µmol L−1, which is comparable to the range observed in the ocean. For instance, average SML concentrations of 1.72 ± 0.44 µmol L−1 TAA and 1.1 ± 0.49 µmol L−1 TCHO were determined in the tropical Eastern North Atlantic (Barthelmeß et al., 2021) and approximately 2 µmol L−1 THAA and 2.5-3.8 µmol L−1 TCHO were found in the western Baltic Sea (Barthelmeß and Engel, 2022). In the highly productive upwelling system off Peru, SML concentrations can reach up to 6 µmol L−1 THAA and 7.8 µmol L−1 TCHO (Engel and Galgani, 2016). For the North-Western Atlantic Ocean, THAA concentrations of up to 10 µmol L−1 have been reported (Kuznetsova et al., 2004). Likewise, variable and high enrichments of biopolymers in the SML have been observed. For instance, EFs of dissolved amino acids varied between 5 and 43 in the subtropical Atlantic and Mediterranean Seas (Reinthaler et al., 2008) and between 1.1 and 9 in the Eastern Tropical South Pacific (Zäncker et al., 2017). As observed during this study, the enrichment of amino acids in the SML often exceeds the enrichment in carbohydrates (Engel and Galgani, 2016; Zäncker et al., 2017; van Pinxteren et al., 2012).
Based upon high biopolymer enrichment, the SML often shows typical biofilm properties (Wurl and Holmes, 2008), with high biological activity and specifically adapted organisms, i.e., neuston. Hydrolysis experiments revealed that microbial activity can significantly reduce amino acid concentrations in microlayer samples, even to values below those found in the underlying water (Kuznetsova and Lee, 2001). During this study, the amino acid and carbohydrate concentrations in the SML were reduced to the ULW level by day 15, indicating that microbial degradation may indeed counteract biopolymer accumulation and, therefore, slick formation in the sea.
4.2 Interactions of wind speed and biopolymer accumulation in the SML
The conditions in the Aeolotron at low wind speeds resembled typical slick conditions as observed in the field. The most prominent property of surfactants is their damping of capillary waves, as indicated by a reduction in the MSS value. The damping effect results from the dissipation of wave energy due to changes in the viscoelasticity of the interfacial surface layer (Cini et al., 1983) and is referred to as the Marangoni effect (McKenna and Bock, 2006). The intensity of the Marangoni effect depends on the quantity and composition of surface-active compounds in slicks. Under slick conditions, accompanied by high values of surfactant coverage, MSS values in the Aeolotron were reduced by about 1–2 orders of magnitude compared to the freshwater reference. However, the damping effect largely vanished at > 6 m s−1. At a wind-speed threshold of approximately 6 m s−1, the collapse of the biopolymeric surface layer induced an abrupt change in sea-surface roughness. Because the MSS is widely recognized as a predictor of air–sea gas transfer velocity (McKenna and Bock, 2006; Frew et al., 2004), such an abrupt shift in surface roughness should likewise be reflected in the gas-transfer measurements. Indeed, Ribas-Ribas et al. (2018) reported a decrease in N2O gas transfer velocities at wind speeds of approximately U10 = 5.5–8 m s−1, during an accompanying Aeolotron experiment – findings that are highly consistent with our observations.
Previous wind-wave tank experiments, not carried out on natural samples but with strong artificial surfactants, showed significant wave damping until wind speeds of U10 ∼ 18 m s−1 (Alpers and Hühnerfuss, 1989). During experiments in a linear wind-wave tunnel, an artificial surface film (oleyl alcohol) began to tear at a wind speed of 13 m s−1 (Broecker et al., 1978). Previous Aeolotron experiments with surface films of hexadecanol and olive oil and with the soluble surfactants Triton X-100 and Tergitol 15-S-12 at a concentration of 5 ppm also showed damping effects at higher wind speed (Bernd Jähne, unpublished data). So far, wind-wave tank experiments with natural seawater and, hence, natural surfactants and surface films remain scarce. Our data show that the wave-damping effects of biogenic surface films may behave differently from artificial films. Natural SML components may be more susceptible to wind-induced disruption and more variable over time and space. Biopolymer variability in the SML may thus be expected over the diurnal cycle, as wind speed often increases during the night. Our data also show that the amount and chemical composition of biopolymers and, in consequence, the surface activity can vary with microbial production and decomposition. Due to natural chemical heterogeneity, the impact of natural surface film on air-sea gas exchange, however, may differ from our observations. In particular, where stronger surfactants are present, also natural films may resist higher wind speeds. For instance, surfactant enrichment in the SML has been reported for wind speeds of up to 9.5 m s−1 (Wurl et al., 2011); DOC enrichment up to 9.7 m s−1 in the Mediterranean Sea (Reinthaler et al., 2008), and enrichment of combined amino acids in the North Atlantic Ocean at wind speeds of 7 m s−1 (Kuznetsova et al., 2004). Clearly, a mechanistic understanding of wind speed and SML biopolymer enrichment has yet to be established. In this regard, conducting controlled wind-wave experiments using natural seawater can offer important insights into the role of natural surfactants in modulating air-sea gas exchange.
On the one hand and in contrast to THAA and TCHO biopolymers, no significant relationship between wind speed and DOC enrichment was observed. On the other hand, the apparent thickness of the SML increased significantly with rising wind speeds. The sensitivity of SML thickness to wind speed has been reported previously, with an increase in apparent SML thickness up to wind speeds between 5.5 and 7.9 m s−1 (Beaufort 4) in the Baltic Sea (Falkowska, 1999), or a decrease in SML thickness with wind speeds ranging from 1 to 5 m s−1 (Liu and Dickhut, 1998). This may be explained by different and partly antagonistic processes influencing organic matter enrichment in the SML. On the one hand, wind can reduce microlayer enrichment through turbulent mixing, which increases with wind speed. Conversely, wind can enhance the enrichment of certain components by promoting bubble formation, which facilitates the scavenging of organic matter from the ULW to the microlayer (Hunter and Liss, 1981). In the environment, other processes also interact with organic matter enrichment, such as the production or decomposition of organic matter in the SML or the mixing and advection of water masses. Our study allowed us to follow the changes in SML composition with increasing wind speed and suggests that the enrichment of organic matter in the SML and its response to wind is highly compound-specific. Biopolymers, i.e. TCAA and TCHO, showed the highest EFs and responded similarly to increasing wind, with no discernible difference between SML and underwater concentrations at wind speed > 6 m s−1. DOC is a bulk measure and includes a variety of different substances that may be more or less prone to mixing or enrichment. Indeed, EFs for DOC were rather low compared to THAA and TCHO. DOC concentration in the SML may simply be high because of diffusive exchange with high background concentration of organic substances that do not have surfactant properties. Hence, a uniform relationship of DOC enrichment in the SML with regard to wind speed seems unlikely. In this study, DOC concentration and enrichment in the SML increased with wind speed on day 15 and were even more pronounced on days 22 and 24. This indicates a net upward transport of DOC from the ULW to the SML due to increased turbulence or rising bubbles at higher wind speeds. Because of the high concentration of DOC, an increase in DOC may have contributed to the increase in apparent thickness (d) of the SML with wind speed observed during this study, although it cannot fully explain it. This also shows that apparent SML thickness and visually apparent slick conditions are not necessarily related.
During the first two weeks in the Aeolotron, slicks showed THAA accumulation up to 10 times higher than TCHO accumulation. This aligns with observations that protein-rich, gel-like particles were highly enriched at low wind speeds, especially in the early stages of the experiment (Sun et al., 2018). At the same time, the highest surfactant coverage, as determined by VSFG-spectroscopy, was observed. The [THAA] : [TCHO] or, more generally, the protein carbohydrate (P C) ratio in the SML was highest on days 2 and 4. This suggests that polypeptides not only played an important role in slick formation but also included particularly powerful biosurfactants. The P C ratio of biopolymers has been interpreted as an indicator for the relative hydrophobicity of extracellular polymeric substances (EPS) (Santschi et al., 2020), based on observations of increasing hydrophobic contact area (HCA) with increasing P C ratio (Xu et al., 2011). Exopolymers with high P C ratios are mainly produced by bacteria, whereas phytoplankton EPS contain more carbohydrates (Santschi et al., 2020). The high P C ratio of surface slicks at the beginning of this study can be explained by the predominance of bacterial biomass in the seawater, which was collected in the deep North Sea and not exposed to light until day 8 of the experiment. Our observations showed that capillary waves were most strongly damped on days 2–11. In contrast, the P C ratio was much lower, with values ∼ 4, when SML material from phytoplankton origin replenished the organic matter pool of the SML on days 22 and 24. Since the seawater, which was used to fill the Aeolotron, had been stored in the dark for about one month prior to the experiment, any fresh material must have been derived mainly from heterotrophic bacterial production. The high P C ratio, together with the high DI value of the organic material in the SML at the beginning of the study, suggests that bacterial-derived biopolymers accumulate and act as powerful biosurfactants in the SML.
Within the pool of THAA and THCO, monomers with dielectric properties (basic/acidic AAs and basic/acidic CHO) were most enriched and most sensitive to wind speed, suggesting that surfactant properties are linked to those monomeric components. Among the amino acids, significantly enriched in the SML were GLX and ARG. High GLX and ARG enrichment has been reported for oceanic SML previously (Barthelmeß et al., 2021; Sun et al., 2018; van Pinxteren et al., 2012). In general, the enrichment of amino acids at the air-sea interface depends on their amphiphilic properties (Ćosović and Vojvodić, 1998), which arise from the degree of polarity exhibited on their molecular surfaces. Among the amino acids discussed here, ARG and GLX are considered hyperpolar and represent typical hydrophilic head groups of biosurfactants. Lipoamino acids derived from ARG have increasingly gathered interest in biotechnological applications as they represent nontoxic and degradable cationic biosurfactants with anti-microbial properties (Singh and Tyagi, 2014). Surfactant activity in surface waters of the Tropical Eastern North Atlantic has been directly related to ARG concentration (Barthelmeß et al., 2021). The GLX-containing lipopeptide Surfactin, produced by Bacillus spp., a species also found in seawater, is one of the most effective biosurfactants (Zhen et al., 2023). During this study, we didn't identify the molecular structure of surfactants. However, the high THAA enrichment in the SML, together with even higher selective enrichment of ARG and GLX, and strong surfactant activity, point to lipoamino acids with a bacterial source during the first days of this study.
Enrichment in the SML was generally smaller for TCHO than for THAA. On day 22, after material from a phytoplankton culture and bloom experiment was added, and the P C ratio in the SML decreased, MSS values at comparable wind speeds were higher. Marine photoautotrophic plankton is the major source of biomolecules in the ocean, providing ∼ 50 Gt of organic carbon yr−1. In general, the biochemical composition of autotrophic cells comprises the following major components by weight: proteins (17 %–57 %), carbohydrates (4.1 %–37 %), and lipids (2.9 %–18 %) (Parsons et al., 1961). Extracellular polymers released from the autotrophic cell, however, contain largely polysaccharides (Engel et al., 2004; Thornton, 2014). Among the carbohydrates that showed a selective enrichment in the SML was FUC, a sugar that is typically found in polysaccharides released from phytoplankton and seaweeds (Buck-Wiese et al., 2023), and GLC-N, a sugar contained in bacterial exopolymers (Maßmig et al., 2024). GLC-N, RHA and Gal were particularly sensitive to wind speed. GLC-N is often contained in biosurfactants and, like arginine, has received attention in the biotechnological search for replacement of toxic synthetic surfactants. Rhamnolipids are typical biosurfactants consisting of one or two rhamnose sugar molecules linked to hydroxy fatty acid chains. Galactolipids can be found in some cyanobacteria and algae and include galactose residues linked to lipid moieties. However, compared to peptide-based surfactants, carbohydrate-based surfactants seem to be less abundant or less effective during this study.
The amino-acids-based DI, as well as the presence of FUC, suggested that organic matter accumulating at the SML was less degraded than in the underlying seawater. This finding is consistent with earlier findings on SML biopolymer composition and surfactant activity in the Baltic Sea (Barthelmeß and Engel, 2022), which show that the highest surface activity was triggered by the microbial release of fresh organic matter. Marine microorganisms release surfactants for several ecological and physiological reasons. For example, they act as emulsifiers and aid in substrate uptake, in particular hydrophobic organic compounds, such as oil, and are produced by a variety of marine bacteria (Floris et al., 2020). Moreover, surfactants facilitate the colonization of surfaces by helping microorganisms adhere to substrates and form biofilms. In higher organisms, e.g., mammals, surfactants are critical to maintaining lung function or for skin protection. A common feature of surfactants is their accumulation at interfaces. The air-sea interface, including both the SML and bubbles, represents the largest interface in the ocean and serves as a trap for surfactants released to seawater. Since microbial surfactants are used extracellularly, they must be stable enough in the marine environment to fulfil their ecological roles. The production and subsequent accumulation of biopolymers, including surfactants, in the SML illustrate how marine life can alter the physical environment at the ocean's surface. This biotic effect on upper ocean physics has direct implications for climate regulation, as changes in gas exchange and surface turbulence can impact the ocean's role in sequestering carbon dioxide and regulating atmospheric gases. Thus, these effects may be particularly pronounced in areas of high surfactant productivity, highlighting the complex interplay and feedback between biodiversity, chemical diversity, and air-sea exchange in the ocean.
Our research revealed that biopolymers, particularly polypeptides, produced by marine microorganisms, serve as efficient natural surfactants in the SML. Natural surfactants that accumulated in the SML during this study exhibited a significant damping effect on wave formation up to wind speeds of U10 ≈ 6 m s−1. However, at even higher wind speeds and going along with the collapse of the biopolymeric SML, the damping effect largely vanished. This sheds light on the ecological role of marine biopolymers and underscores their influence on physical air-sea exchange processes. A better understanding of the dynamic linkages between marine life and gas exchange could be pivotal to accurately assessing the ocean's present and future contributions to the climate system, including the uptake or release of climate-relevant gases like CO2 and methane.
The data supporting the findings of this study have been published on the PANGAEA data repository (https://doi.org/10.1594/PANGAEA.992654, Engel, 2026).
AE conceptualized the study and provided the biopolymer data. GF provided the surfactant data. KK and BJ contributed the MSS data. AE wrote the original manuscript. GF, KK, and BJ reviewed and edited the original manuscript.
The contact author has declared that none of the authors has any competing interests.
Publisher's note: Copernicus Publications remains neutral with regard to jurisdictional claims made in the text, published maps, institutional affiliations, or any other geographical representation in this paper. The authors bear the ultimate responsibility for providing appropriate place names. Views expressed in the text are those of the authors and do not necessarily reflect the views of the publisher.
This article is part of the special issue “Biogeochemical processes and Air–sea exchange in the Sea-Surface microlayer (BG/OS inter-journal SI)”. It is not associated with a conference.
We thank the captain and crew of R/V POSEIDON and Armin Form for seawater collection. Thanks also go to Martin Sperling and Cuici Sun for sampling the SML and underlying water during the Aeolotron experiment. Kristian Laß is acknowledged for making available the VSFG data through the project CP1212 of the Kiel cluster of excellence, “The Future Ocean”. Jon Roa, Ruth Flerus, Katja Laß and Tania Klüver are greatly acknowledged for their technical support. We also thank Maximilian Bopp for providing friction velocity data.
This research has been supported by the Bundesministerium für Forschung, Technologie und Raumfahrt (BMFTR; grants nos. 03F0662A-TP2.1 and 03F0662A-TP2.2) and the Deutsche Forschungsgemeinschaft (DFG; grant no. CP1212) and is a contribution to the international Surface Ocean Lower Atmosphere Study (SOLAS) and the DFG research group Biogeochemical processes and Air–sea exchange in the Sea-Surface microlayer [BASS] SP1.1 Dynamic enrichment processes of organic matter in the SML and 1.4 Chemical and photochemical transformation of organic matter.
The article processing charges for this open-access publication were covered by the GEOMAR Helmholtz Centre for Ocean Research Kiel.
This paper was edited by Peter S. Liss and reviewed by Simon Hauser and one anonymous referee.
Alpers, W. and Hühnerfuss, H.: The damping of ocean waves by surface films: A new look at an old problem, J. Geophys. Res.-Oceans, 94, 6251–6265, 1989.
Asher, W. E., Karle, L. M., and Higgins, B. J.: On the differences between bubble-mediated air–water transfer in freshwater and seawater, J. Mar. Res., 55, 813–845, 1997.
Barthelmeß, T. and Engel, A.: How biogenic polymers control surfactant dynamics in the surface microlayer: insights from a coastal Baltic Sea study, Biogeosciences, 19, 4965–4992, https://doi.org/10.5194/bg-19-4965-2022, 2022.
Barthelmeß, T., Schütte, F., and Engel, A.: Variability of the sea surface microlayer across a filament's edge and potential influences on gas exchange, Front. Mar. Sci., 8, 718384, https://doi.org/10.3389/fmars.2021.718384, 2021.
Blanchard, D. C.: Bubble scavenging and the water-to-air transfer of organic material in the sea, in: Applied Chemistry at Protein Interfaces, ACS Symp. Ser., American Chemical Society, 18, 360–387, https://doi.org/10.1021/ba-1975-0145.ch018, 1975.
Bopp, M.: Luft- und wasserseitige Strömungsverhältnisse im ringförmigen Heidelberger Wind-Wellen-Kanal (Aeolotron), Master's thesis, Universität Heidelberg, Germany, https://doi.org/10.11588/heidok.00017151, 2014.
Broecker, H. C., Petermann, J., and Siems, W.: The influence of wind on CO2 exchange in a wind-wave tunnel, including the effects of monolayers, J. Mar. Res., 36, 595–610, 1978.
Buck-Wiese, H., Andskog, M. A., Nguyen, N. P., Bligh, M., Asmala, E., Vidal-Melgosa, S., and Hehemann, J. H.: Fucoid brown algae inject fucoidan carbon into the ocean, P. Natl. Acad. Sci. USA, 120, e2210561119, https://doi.org/10.1073/pnas.2210561119, 2023.
Burrows, S. M., Ogunro, O., Frossard, A. A., Russell, L. M., Rasch, P. J., and Elliott, S. M.: A physically based framework for modeling the organic fractionation of sea spray aerosol from bubble film Langmuir equilibria, Atmos. Chem. Phys., 14, 13601–13629, https://doi.org/10.5194/acp-14-13601-2014, 2014.
Cini, R., Lombardini, P. P., and Hühnerfuss, H.: Remote sensing of marine slicks utilizing their influence on wave spectra, Int. J. Remote Sens., 4, 101–110, 1983.
Ćosović, B. and Vojvodić, V.: Voltammetric analysis of surface active substances in natural seawater, Electroanalysis, 10, 429–434, 1998.
Croot, P. L., Passow, U., Assmy, P., Jansen, S., and Strass, V. H.: Surface active substances in the upper water column during a Southern Ocean Iron Fertilization Experiment (EIFEX), Geophys. Res. Lett., 34, L03612, https://doi.org/10.1029/2006GL028080, 2007.
Cunliffe, M. and Murrell, J. C.: The sea-surface microlayer is a gelatinous biofilm, ISME J., 3, 1001–1003, https://doi.org/10.1038/ismej.2009.69, 2009.
Cunliffe, M. and Wurl, O.: Guide to best practices to study the ocean's surface, Occas. Publ. Mar. Biol. Assoc. UK, ISSN 0260-2784, 2014.
Cunliffe, M., Engel, A., Frka, S., Gašparović, B., Guitart, C., Murrell, J. C., and Wurl, O.: Sea surface microlayers: A unified physicochemical and biological perspective of the air–ocean interface, Prog. Oceanogr., 109, 104–116, 2013.
Cuscov, M. and Muller, F. L.: Differentiating humic and algal surface active substances in coastal waters by their pH-dependent adsorption behaviour, Mar. Chem., 174, 35–45, 2015.
Dauwe, B. and Middelburg, J. J.: Amino acids and hexosamines as indicators of organic matter degradation state in North Sea sediments, Limnol. Oceanogr., 43, 782–798, 1998.
Dauwe, B., Middelburg, J. J., Herman, P. M. J., and Heip, C. H. R.: Linking diagenetic alteration of amino acids and bulk organic matter reactivity, Limnol. Oceanogr., 44, 1809–1814, 1999.
Dittmar, T., Cherrier, J., and Ludwichowski, K. U.: The analysis of amino acids in seawater, in: Practical Guidelines for the Analysis of Seawater, CRC Press, 79–90, https://doi.org/10.1201/9781420073072, 2009.
Edson, J. B., Jampana, V., Weller, R. A., Bigorre, S. P., Plueddemann, A. J., Fairall, C. W., Miller, S. D., Mahrt, L., Vickers, D., and Hersbach, H.: On the exchange of momentum over the open ocean, J. Phys. Oceanogr., 43, 1589–1610, https://doi.org/10.1175/JPO-D-12-0173.1, 2013.
Engel, A.: Experimental data on the impact of wind speed on SML biopolymer enrichment, surface roughness, and interfacial surfactant coverage at the Heidelberg “Aeolotron”, PANGAEA [data set], https://doi.org/10.1594/PANGAEA.992654, 2026.
Engel, A. and Galgani, L.: The organic sea-surface microlayer in the upwelling region off the coast of Peru and potential implications for air–sea exchange processes, Biogeosciences, 13, 989–1007, https://doi.org/10.5194/bg-13-989-2016, 2016.
Engel, A. and Händel, N.: A novel protocol for determining the concentration and composition of sugars in particulate and in high molecular weight dissolved organic matter in seawater, Mar. Chem., 127, 180–191, 2011.
Engel, A., Delille, B., Jacquet, S., Riebesell, U., Rochelle-Newall, E., Terbrüggen, A., and Zondervan, I.: Transparent exopolymer particles and dissolved organic carbon production by Emiliania huxleyi exposed to different CO2 concentrations: a mesocosm experiment, Aquat. Microb. Ecol., 34, 93–104, 2004.
Engel, A., Harlay, J., Piontek, J., and Chou, L.: Contribution of combined carbohydrates to dissolved and particulate organic carbon after the spring bloom in the northern Bay of Biscay, Cont. Shelf Res., 45, 42–53, 2012.
Engel, A., Bange, H. W., Cunliffe, M., Burrows, S. M., Friedrichs, G., Galgani, L., and Zäncker, B.: The ocean's vital skin: Toward an integrated understanding of the sea surface microlayer, Front. Mar. Sci., 4, 165, https://doi.org/10.3389/fmars.2017.00165, 2017.
Engel, A., Sperling, M., Sun, C., Grosse, J., and Friedrichs, G.: Organic matter in the surface microlayer: Insights from a wind wave channel experiment, Front. Mar. Sci., 5, 182, https://doi.org/10.3389/fmars.2018.00182, 2018.
Falkowska, L.: Sea surface microlayer: a field evaluation of Teflon plate, glass plate and screen sampling techniques. Part 1. Thickness of microlayer samples and relation to wind speed, Oceanologia, 41, 211–221, 1999.
Floris, R., Rizzo, C., and Giudice, A. L.: Biosurfactants from marine metabolomics: new insights into biology and medicine, Metabolomics, 3, https://doi.org/10.5772/intechopen.80493, 2020.
Frew, N. M., Goldman, J. C., Dennett, M. R., and Johnson, A. S.: Impact of phytoplankton-generated surfactants on air–sea gas exchange, J. Geophys. Res.-Oceans, 95, 3337–3352, 1990.
Frew, N. M., Bock, E. J., McGillis, W. R., Karachintsev, A. V., Hara, T., Münsterer, T., and Jähne, B.: Variation of air–water gas transfer with wind stress and surface viscoelasticity, in: Air–Water Gas Transfer, Zenodo, 529–541, https://doi.org/10.5281/zenodo.10405, 1995.
Frew, N. M., Bock, E. J., Schimpf, U., Hara, T., Haußecker, H., Edson, J. B., and Jähne, B.: Air–sea gas transfer: its dependence on wind stress, small-scale roughness, and surface films, J. Geophys. Res.-Oceans, 109, C08S17, https://doi.org/10.1029/2003JC002131, 2004.
Frka, S., Dautović, J., Kozarac, Z., Ćosović, B., Hoffer, A., and Kiss, G.: Surface-active substances in atmospheric aerosol: an electrochemical approach, Tellus B, 64, 18490, https://doi.org/10.3402/tellusb.v64i0.18490, 2012.
Gade, M., Alpers, W., Hühnerfuss, H., and Lange, P. A.: Wind wave tank measurements of wave damping and radar cross sections in the presence of monomolecular surface films, J. Geophys. Res.-Oceans, 103, 3167–3178, 1998.
Gašparović, B. and Ćosović, B.: Surface-active properties of organic matter in the North Adriatic Sea, Estuar. Coast. Shelf Sci., 58, 555–566, 2003.
Hühnerfuss, H., Alpers, W., Lange, P. A., and Walter, W.: Attenuation of wind waves by artificial surface films of different chemical structure, Geophys. Res. Lett., 8, 1184–1186, 1981.
Hunter, K. A. and Liss, P. S.: Organic sea surface films, in: Elsevier Oceanography Series, Elsevier, vol. 31, 259–298, https://doi.org/10.1016/S0422-9894(08)70331-3, 1981.
Jähne, B., Münnich, K. O., Bösinger, R., Dutzi, A., Huber, W., and Libner, P.: On the parameters influencing air–water gas exchange, J. Geophys. Res.-Oceans, 92, 1937–1949, 1987.
Jenkinson, I. R., Seuront, L., Ding, H., and Elias, F.: Biological modification of mechanical properties of the sea surface microlayer, influencing waves, ripples, foam and air–sea fluxes, Elementa, 6, 26, https://doi.org/10.1525/elementa.262, 2018.
Kiefhaber, D., Reith, S., Rocholz, R., and Jähne, B.: High-speed imaging of short wind waves by shape from refraction, J. Eur. Opt. Soc.-Rapid Publ., 9, 14015, https://doi.org/10.2971/jeos.2014.14015, 2014.
Kock, A., Schafstall, J., Dengler, M., Brandt, P., and Bange, H. W.: Sea-to-air and diapycnal nitrous oxide fluxes in the eastern tropical North Atlantic Ocean, Biogeosciences, 9, 957–964, https://doi.org/10.5194/bg-9-957-2012, 2012.
Krall, K. E.: Laboratory investigations of air–sea gas transfer under a wide range of water surface conditions, PhD thesis, Universität Heidelberg, Germany, https://doi.org/10.11588/heidok.00014392, 2013.
Kunz, J.: Active thermography as a tool for the estimation of air–water transfer velocities, PhD thesis, Universität Heidelberg, Germany, https://doi.org/10.11588/heidok.00022903, 2017.
Kurata, N., Vella, K., Hamilton, B., Shivji, M., Soloviev, A., Matt, S., and Perrie, W.: Surfactant-associated bacteria in the near-surface layer of the ocean, Sci. Rep., 6, 19123, https://doi.org/10.1038/srep19123, 2016.
Kuznetsova, M. and Lee, C.: Enhanced extracellular enzymatic peptide hydrolysis in the sea-surface microlayer, Mar. Chem., 73, 319–332, 2001.
Kuznetsova, M., Lee, C., Aller, J., and Frew, N.: Enrichment of amino acids in the sea surface microlayer at coastal and open ocean sites in the North Atlantic Ocean, Limnol. Oceanogr., 49, 1605–1619, 2004.
Laß, K. and Friedrichs, G.: Revealing structural properties of the marine nanolayer from vibrational sum frequency generation spectra, J. Geophys. Res.-Oceans, 116, C08011, https://doi.org/10.1029/2010JC006609, 2011.
Laß, K., Bange, H. W., and Friedrichs, G.: Seasonal signatures in SFG vibrational spectra of the sea surface nanolayer at Boknis Eck Time Series Station (SW Baltic Sea), Biogeosciences, 10, 5325–5334, https://doi.org/10.5194/bg-10-5325-2013, 2013.
Laxague, N. J. M., Zappa, C. J., Soumya, S., and Wurl, O.: The suppression of ocean waves by biogenic slicks, J. R. Soc. Interface, 21, 20240385, https://doi.org/10.1098/rsif.2024.0385, 2024.
Lindroth, P. and Mopper, K.: High-performance liquid chromatographic determination of subpicomole amounts of amino acids by precolumn fluorescence derivatization with o-phthaldialdehyde, Anal. Chem., 51, 1667–1674, 1979.
Liu, K. and Dickhut, R. M.: Effects of wind speed and particulate matter source on surface microlayer characteristics and enrichment of organic matter in southern Chesapeake Bay, J. Geophys. Res.-Atmos., 103, 10571–10577, 1998.
Maßmig, M., Cisternas-Novoa, C., and Engel, A.: Uncovering the role of oxygen on organic carbon cycling: insights from a continuous culture study with a facultative anaerobic bacterioplankton species (Shewanella baltica), Front. Mar. Sci., 11, 1328392, https://doi.org/10.3389/fmars.2024.1328392, 2024.
McKenna, S. P. and Bock, E. J.: Physicochemical effects of the marine microlayer on air–sea gas transport, in: Marine Surface Films, Springer, Berlin, Heidelberg, 77–91, https://doi.org/10.1007/3-540-33271-5_9, 2006.
Mesarchaki, E., Kräuter, C., Krall, K. E., Bopp, M., Helleis, F., Williams, J., and Jähne, B.: Measuring air–sea gas-exchange velocities in a large-scale annular wind–wave tank, Ocean Sci., 11, 121–138, https://doi.org/10.5194/os-11-121-2015, 2015.
Nagel, L., Krall, K. E., and Jähne, B.: Measurements of air–sea gas transfer velocities in the Baltic Sea, Ocean Sci., 15, 235–247, https://doi.org/10.5194/os-15-235-2019, 2019.
Parsons, T. R., Stephens, K., and Strickland, J. D. H.: On the chemical composition of eleven species of marine phytoplankters, J. Fish. Res. Board Can., 18, 1001–1016, 1961.
Pereira, R., Ashton, I., Sabbaghzadeh, B., Shutler, J. D., and Upstill-Goddard, R. C.: Reduced air–sea CO2 exchange in the Atlantic Ocean due to biological surfactants, Nat. Geosci., 11, 492–496, https://doi.org/10.1038/s41561-018-0136-2, 2018.
Pogorzelski, S. J., Kogut, A. D., and Mazurek, A. Z.: Surface rheology parameters of source-specific surfactant films as indicators of organic matter dynamics, Hydrobiologia, 554, 67–81, 2006.
Reinthaler, T., Sintes, E., and Herndl, G. J.: Dissolved organic matter and bacterial production and respiration in the sea-surface microlayer of the open Atlantic and the western Mediterranean Sea, Limnol. Oceanogr., 53, 122–136, 2008.
Ribas-Ribas, M., Helleis, F., Rahlff, J., and Wurl, O.: Air–sea CO2 exchange in a large annular wind-wave tank and the effects of surfactants, Front. Mar. Sci., 5, 457, https://doi.org/10.3389/fmars.2018.00457, 2018.
Sabbaghzadeh, B., Upstill-Goddard, R. C., Beale, R., Pereira, R., and Nightingale, P. D.: The Atlantic Ocean surface microlayer from 50° N to 50° S is ubiquitously enriched in surfactants at wind speeds up to 13 m s−1, Geophys. Res. Lett., 44, 2852–2858, https://doi.org/10.1002/2017GL072988, 2017.
Santschi, P. H., Xu, C., Schwehr, K. A., Lin, P., Sun, L., Chin, W. C., and Quigg, A.: Can the protein carbohydrate (P C) ratio of exopolymeric substances (EPS) be used as a proxy for their “stickiness” and aggregation propensity?, Mar. Chem., 218, 103734, https://doi.org/10.1016/j.marchem.2019.103734, 2020.
Satpute, S. K., Banat, I. M., Dhakephalkar, P. K., Banpurkar, A. G., and Chopade, B. A.: Biosurfactants, bioemulsifiers and exopolysaccharides from marine microorganisms, Biotechnol. Adv., 28, 436–450, 2010.
Schmidt, R. and Schneider, B.: The effect of surface films on the air–sea gas exchange in the Baltic Sea, Mar. Chem., 126, 56–62, 2011.
Schmundt, D., Münsterer, T., Lauer, H., and Jähne, B.: The circular wind-wave facilities at the University of Heidelberg, in: Air–Water Gas Transfer, edited by: Jähne, B. and Monahan, E. C., AEON, Hanau, Zenodo, 505–516, https://doi.org/10.5281/zenodo.10404, 1995.
Shaharom, S., Latif, M. T., Khan, M. F., Yusof, S. N. M., Sulong, N. A., Wahid, N. B. A., and Suratman, S.: Surfactants in the sea surface microlayer, subsurface water and fine marine aerosols in different background coastal areas, Environ. Sci. Pollut. Res., 25, 27074–27089, 2018.
Sieburth, J. M.: Microbiological and organic-chemical processes in the surface and mixed layers, in: Air–Sea Exchange of Gases and Particles, 121–172, https://doi.org/10.1007/978-94-009-7169-1_3, 1983.
Singh, A. and Tyagi, V. K.: Arginine-based novel cationic surfactants: a review, Tenside Surf. Det., 51, 202–214, 2014.
Stefan, R. L. and Szeri, A. J.: Surfactant scavenging and surface deposition by rising bubbles, J. Colloid Interface Sci., 212, 1–13, 1999.
Sun, C.-C., Sperling, M., and Engel, A.: Effect of wind speed on the size distribution of gel particles in the sea surface microlayer: insights from a wind–wave channel experiment, Biogeosciences, 15, 3577–3589, https://doi.org/10.5194/bg-15-3577-2018, 2018.
Tang, S. and Wu, J.: Suppression of wind-generated ripples by natural films: a laboratory study, J. Geophys. Res.-Oceans, 97, 5301–5306, 1992.
Tsai, W. T. and Liu, K. K.: An assessment of the effect of sea surface surfactant on global atmosphere–ocean CO2 flux, J. Geophys. Res.-Oceans, 108, 3127, https://doi.org/10.1029/2000JC000740, 2003.
Thornton, D. C.: Dissolved organic matter (DOM) release by phytoplankton in the contemporary and future ocean, Eur. J. Phycol., 49, 20–46, 2014.
van Pinxteren, M., Müller, C., Iinuma, Y., Stolle, C., and Herrmann, H.: Chemical characterization of dissolved organic compounds from coastal sea surface microlayers (Baltic Sea, Germany), Environ. Sci. Technol., 46, 10455–10462, 2012.
Wanninkhof, R., Asher, W. E., Ho, D. T., Sweeney, C., and McGillis, W. R.: Advances in quantifying air–sea gas exchange and environmental forcing, Annu. Rev. Mar. Sci., 1, 213–244, 2009.
Wei, Y. and Wu, J.: In situ measurements of surface tension, wave damping, and wind properties modified by natural films, J. Geophys. Res.-Oceans, 97, 5307–5313, 1992.
Wurl, O. and Holmes, M.: The gelatinous nature of the sea-surface microlayer, Mar. Chem., 110, 89–97, 2008.
Wurl, O., Wurl, E., Miller, L., Johnson, K., and Vagle, S.: Formation and global distribution of sea-surface microlayers, Biogeosciences, 8, 121–135, https://doi.org/10.5194/bg-8-121-2011, 2011.
Wurl, O., Stolle, C., Van Thuoc, C., Thu, P. T., and Mari, X.: Biofilm-like properties of the sea surface and predicted effects on air–sea CO2 exchange, Prog. Oceanogr., 144, 15–24, 2016.
Xu, C., Zhang, S., Chuang, C. Y., Miller, E. J., Schwehr, K. A., and Santschi, P. H.: Chemical composition and relative hydrophobicity of microbial exopolymeric substances isolated by anion exchange chromatography and their actinide-binding affinities, Mar. Chem., 126, 27–36, 2011.
Zäncker, B., Bracher, A., Röttgers, R., and Engel, A.: Variations of the organic matter composition in the sea surface microlayer: a comparison between open ocean, coastal, and upwelling sites off the Peruvian coast, Front. Microbiol., 8, 2369, https://doi.org/10.3389/fmicb.2017.02369, 2017.
Zhen, C., Ge, X. F., Lu, Y. T., and Liu, W. Z.: Chemical structure, properties and potential applications of surfactin, as well as advanced strategies for improving its microbial production, AIMS Microbiol., 9, 195–214, 2023.