the Creative Commons Attribution 4.0 License.
the Creative Commons Attribution 4.0 License.
 | 30 Mar 2026
Characterisation and quantification of organic carbon burial using a multiproxy approach in saltmarshes from Aotearoa New Zealand
Olga Albot
Joshua Ratcliffe
Richard Levy
Sebastian Naeher
Daniel J. King
Catherine Ginnane
Jocelyn Turnbull
Mary Jill Ira Banta
Christopher Wood
Jenny Dahl
Jannine Cooper
Andy Phillips
USAto
New Zealand.
Blue carbon ecosystems, such as saltmarshes, play a vital role in mitigating climate change by sequestering atmospheric carbon dioxide and storing it as buried organic carbon for centuries to millennia. While there are international methodologies for generating blue carbon credits through coastal wetland restoration, their application in Aotearoa New Zealand is limited due to insufficient data on saltmarsh carbon stocks, accumulation rates and the processes governing long-term carbon preservation. To quantify these metrics, we examined 45 sediment cores collected from five saltmarsh sites in Aotearoa New Zealand. The cores were analysed for elemental composition, stable isotopes, and lipid biomarkers. These data were collected using a range of techniques, including X-ray fluorescence (XRF), Ramped-Pyrolysis Oxidation-Accelerator Mass Spectrometry (RPO-AMS), and Pyrolysis-Gas Chromatography-Mass Spectrometry (Py-GC-MS). Results show high variability in soil organic matter properties, carbon stocks (41.3±9.4 to 92.3±66.2 Mg C ha−1; mean ± SE), and accumulation rates (0.46±0.02 to 1.53±0.09 Mg C ha−1 yr−1; mean ± SE). Stable isotope and lipid biomarker results indicate substantial contributions from saltmarsh vegetation to the organic carbon pool. Results suggest that plant-derived organic carbon is preserved in the oldest basal sediments. Our findings highlight that spatial variability must be considered when conducting carbon assessments in saltmarsh ecosystems. Further research is required to determine the environmental drivers that influence long-term carbon storage and to improve the accuracy of blue carbon assessments in Aotearoa New Zealand.
-
Please read the editorial note first before accessing the article.
-
Article
(14815 KB)
-
Supplement
(3846 KB)
-
Please read the editorial note first before accessing the article.
- Article
(14815 KB) - Full-text XML
-
Supplement
(3846 KB) - BibTeX
- EndNote


Coastal wetlands, such as saltmarshes, mangroves, and seagrass meadows, sequester atmospheric carbon dioxide (CO2) and store it as buried organic carbon (OC; “blue carbon”) over centuries to millennia (Chmura et al., 2003; Mcleod et al., 2011). These ecosystems can accumulate up to 53.65 Tg OC yr−1 and account for 30 % of the total carbon burial in ocean sediments (Wang et al., 2021). This storage potential has led to high public and private interest in protecting and restoring these ecosystems for their climate mitigation potential (e.g., Ministry for the Environment, 2022, 2024; Ross et al., 2024), and blue carbon credit methodologies have been developed for the voluntary carbon market (Friess et al., 2022; Lovelock et al., 2023a; Needelman et al., 2018). As a result, research that aims to quantify the carbon sequestration potential of blue carbon ecosystems (BCEs) has increased over the past decade (Howard et al., 2023; Macreadie et al., 2019). Despite these efforts, major gaps in the data required to fully characterise these systems remain, especially in temperate regions of the Southern Hemisphere (Bertram et al., 2021; Howard et al., 2023; Macreadie et al., 2019, 2021).
Saltmarshes occur at the interface between terrestrial, marine, and estuarine settings and accumulate OC that is: (a) produced in-situ by saltmarsh plants (autochthonous sources) and (b) derived from terrestrial and marine organisms that live outside the saltmarsh and are transported and deposited at the marsh surface by riverine runoff and tidal inundation (allochthonous sources; Howard et al., 2014; Middelburg et al., 1997). These OC sources often mix with siliciclastic minerals that are also transported via fluvial and coastal currents and are deposited to form minerogenic soils (Howard et al., 2014; Middelburg et al., 1997; Saintilan et al., 2013). Given the complex combination of autochthonous and allochthonous sediment contributions to the below-ground carbon pool, improving our understanding of these sources and their preservation mechanisms is critical for accurately estimating sequestration potential and informing blue carbon credit methodologies.
The average soil carbon accumulation rate (CAR) for saltmarshes in Aotearoa New Zealand (NZ) is 0.89 Mg C ha−1 yr−1 (Bulmer et al., 2024), which is significantly smaller than the global mean estimates that range between 1.67 and 2.45 Mg C ha yr−1 (Chmura et al., 2003; Ouyang and Lee, 2014; Wang et al., 2021). Attempts to characterise the source of OC and its preservation characteristics in BCEs in NZ are also limited (e.g., Bulmer et al., 2020; Pérez et al., 2017; Sikes et al., 2009; Thomson et al., 2025). Here we examine five coastal saltmarsh systems at three locations that span 6.56° of latitude from Rangaunu Harbour in Northland (34°58′ S, 173°13′ E) to Pāuatahanui Wildlife Reserve in Wellington (41°06′ S, 174°54′ E). Our aim is to better characterise these saltmarsh systems via three primary research objectives: (i) quantify the carbon stocks and accumulation rates across a range of saltmarsh habitats, (ii) assess the source and preservation characteristics of buried organic material, and (iii) synthesise results to guide future research.
Five saltmarsh sites in three geographic locations in the North Island of NZ were selected to capture a range of geomorphic and environmental settings.
2.1 Okatakata Islands, Omaia Island and Awanui, Rangaunu Harbour, Northland
Omaia and Okatakata Islands are situated within the 9700 ha Rangaunu Harbour in Northland, which features tidal flats colonised by mangroves and saltmarshes, and three main channels: Kaimaumau, Awanui, and Pukewhau (Fig. 1; Heath et al., 1983). Stopbanks around the southern shores and tributary streams were first built in 1916 and prevent spring tides and tidal surges from extending inland (Cathcart, 2005). Okatakata consists of two islands, forming a 38 ha saltmarsh. Omaia is a 50 ha drained saltmarsh used as pastureland since 1937, with drains and stopbanks installed to prevent tidal flooding (Land Information New Zealand, 2018). Isolated patches of saltmarsh (Awanui) are present immediately south of Omaia. Historical imagery shows that Awanui and Okatakata have remained undisturbed by human activities since at least the early 1940s.
2.2 Robert Findlay Wildlife Reserve, Pūkorokoro-Miranda, Waikato
Robert Findlay Wildlife Reserve (Robert Findlay) spans approximately 27 ha on the Firth of Thames' western coastline, within the 8500 ha Pūkorokoro-Miranda coastal wetland (Fig. 1), which is designated a wetland of “international significance” (Gerbeaux, 2003). The wetland, located on a chenier plain, was used for farming since 1865, and a floodgate and drains were installed in the early 1900s when stilt ponds were created for shell extraction (Queen Elizabeth II National Trust, 1992; Woodley, 2016). By 1980, the drainage canals and floodgates were no longer maintained and gradually filled with silt, enabling the saltmarsh to regenerate. A conservation covenant was established in 1988 (Queen Elizabeth II National Trust, 1992).
2.3 Pāuatahanui Wildlife Reserve, Wellington
Pāuatahanui Wildlife Reserve (Pāuatahanui) is situated within the Pāuatahanui inlet, which forms the northern branch of the Te Awarua-o-Porirua Harbour, located 30 km north of central Wellington, and has extensive areas of saltmarsh approximately 50 ha in size (Fig. 1). The saltmarsh formed after a Mw 8.2 earthquake on the Wairarapa fault in 1855, which caused widespread uplift around the Wellington region (Grapes and Downes, 1997, 2010). Historical records indicate that prior to this earthquake, the site of the present-day saltmarsh comprised subtidal or tidal flat environments (McManaway and Gaz, 1852; Park, 1841). The marsh likely began to form immediately following the uplift event and was well established by ca. 1865 (Stephenson, 1986). Drainage canals were built across sections of the saltmarsh and the area was used as pastureland for cattle and sheep until the 1980s (Sheehan, 1988). In 1980, NZ Forest and Bird replanted four hectares of saltmarsh, and in 1984, the NZ Government established the Wildlife Management Reserve and began restoration on the remaining 46 ha (Conwell, 2010; Guardians of Pāuatahanui Inlet, 2021).
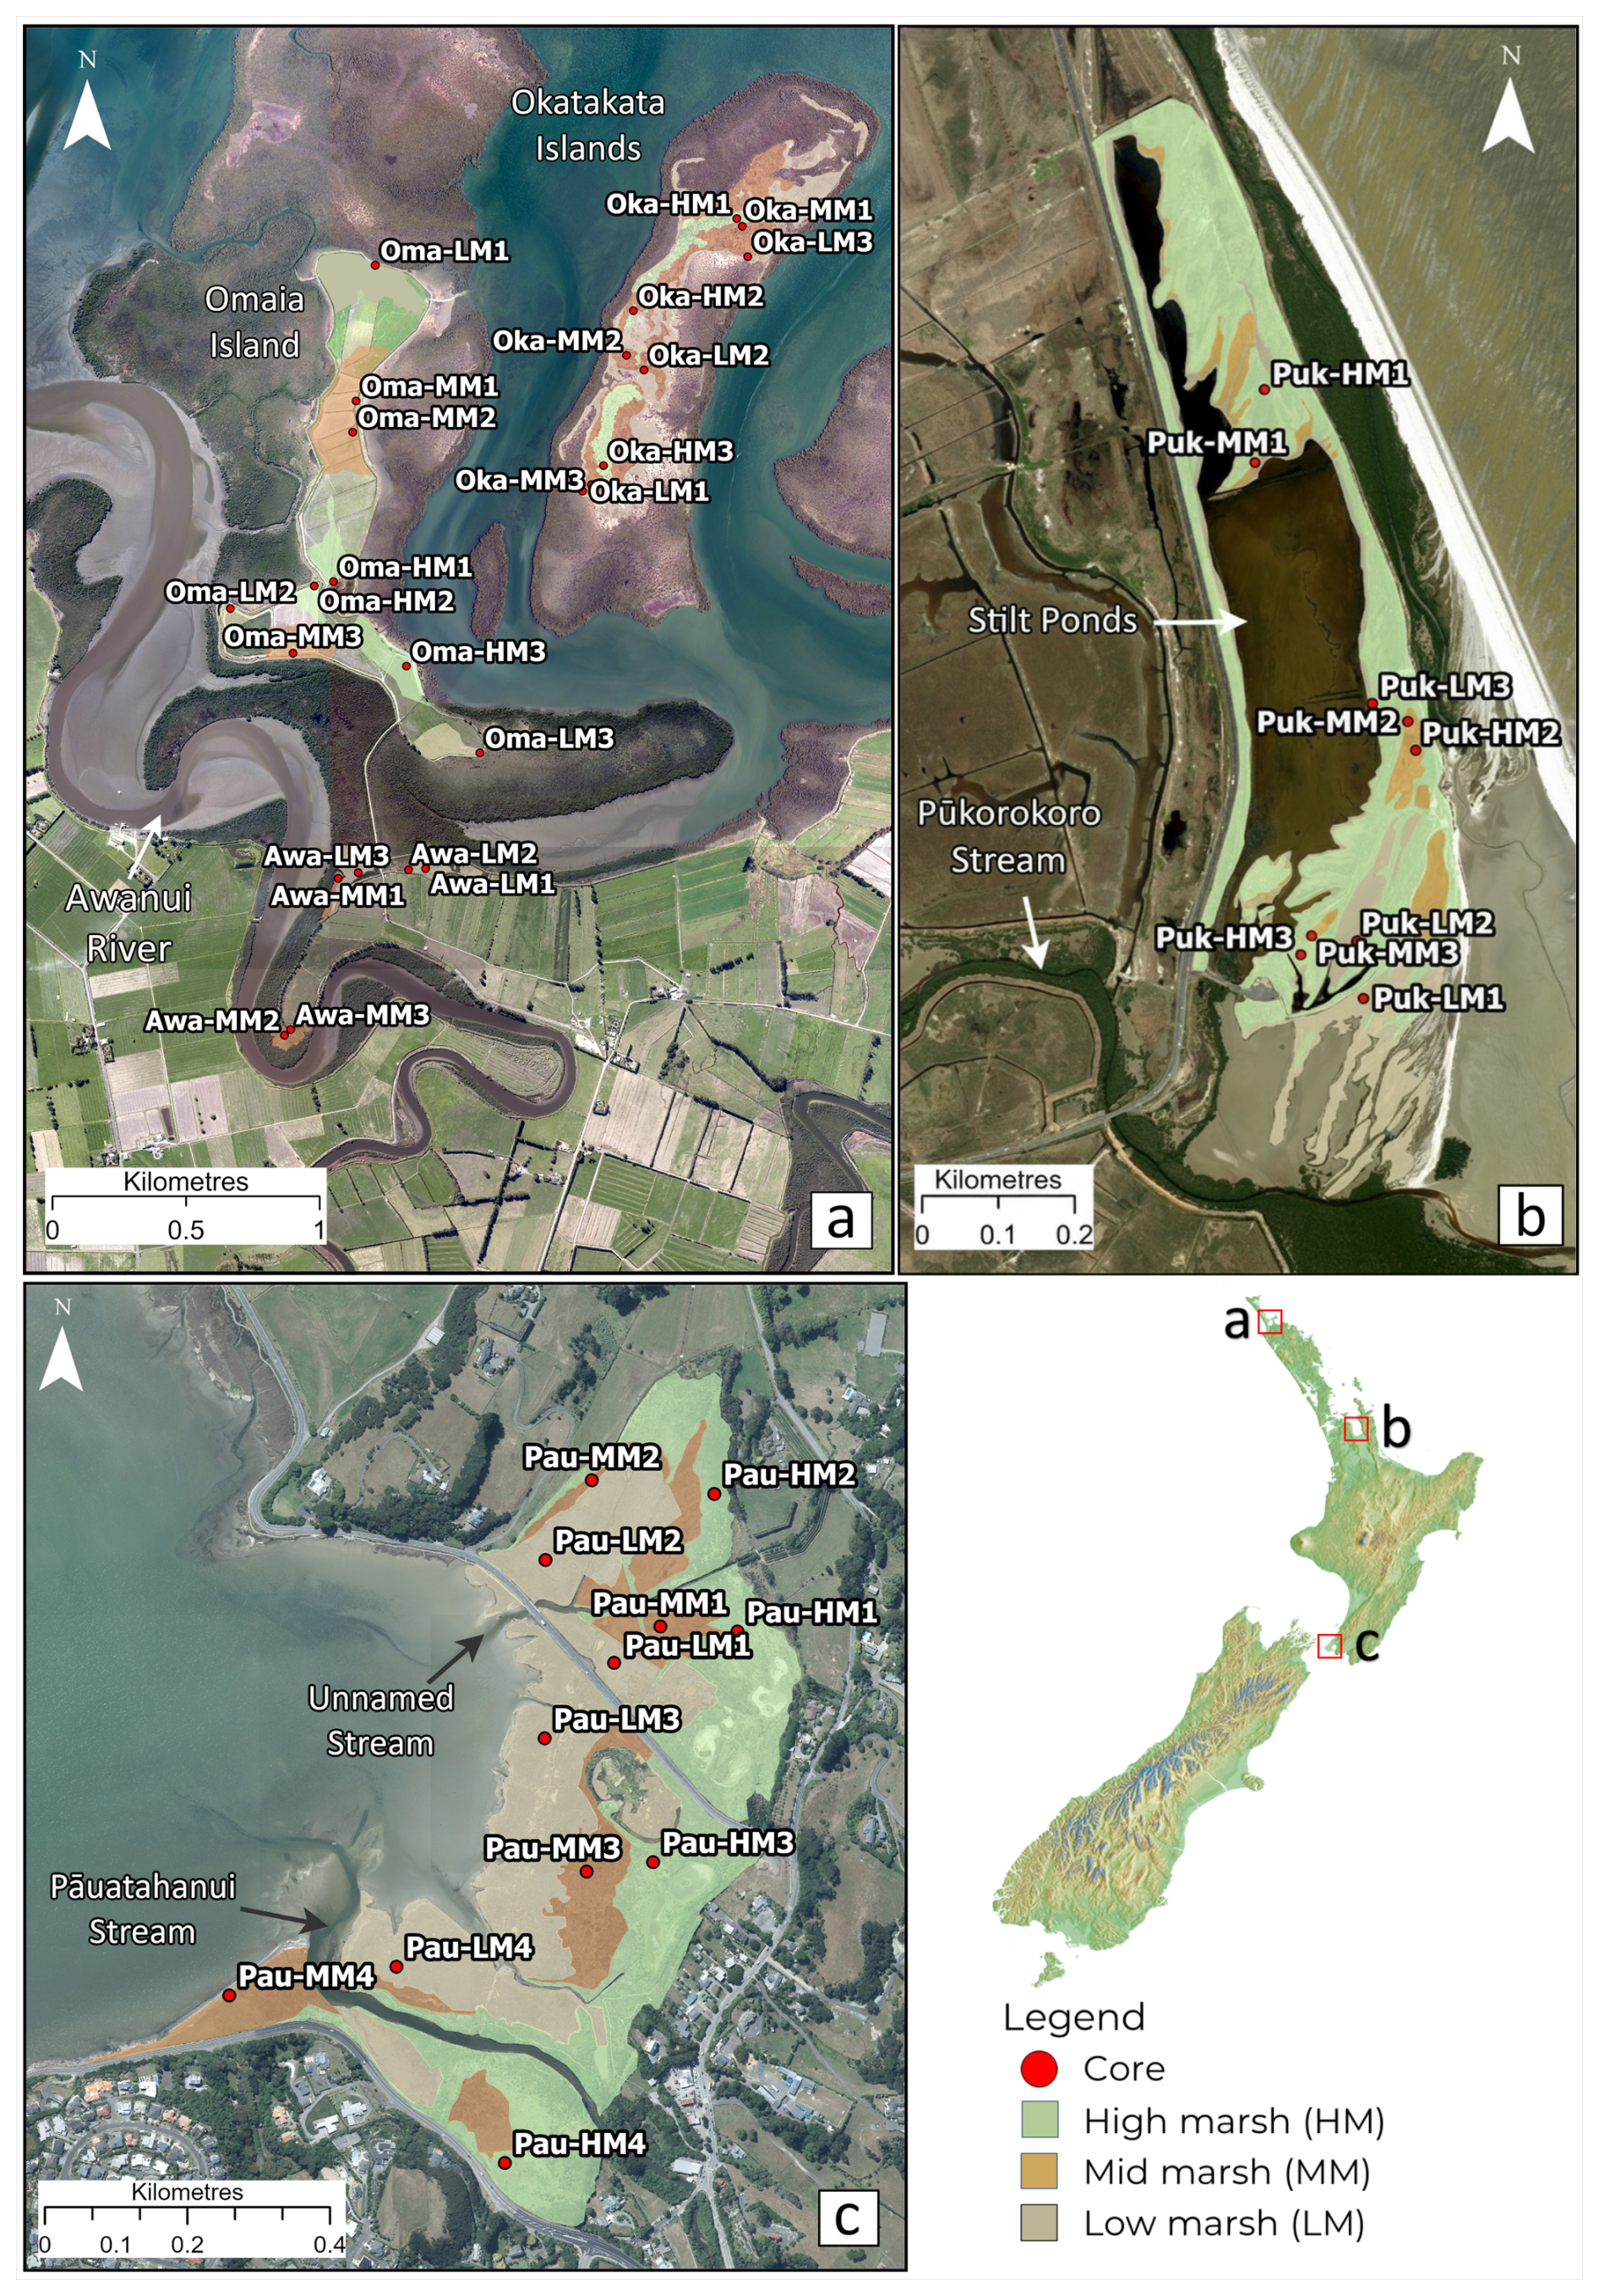
Figure 1Study sites and sample locations within (a) Rangaunu Harbour, where Oma, Oka and Awa represent study sites Omaia, Okatakata and Awanui, respectively; (b) Robert Findlay, where core locations are denoted as Puk; and (c) Pāuatahanui, where core locations are represented as Pau. Imagery is sourced from the LINZ Data Service and licensed for reuse under the CC BY 4.0 licence.
3.1 Field sampling
Prior to sample collection, ground-based vegetation surveys were used to classify low, mid and high marsh zones for all sites based on saltmarsh plant community composition (after King, 2022). Historical aerial imagery was also examined to delineate former marsh zones across Omaia. Regions with higher former vegetation density were characterised as high and mid marsh, and lower density zones as low marsh. Detailed documentation of vegetation was done in 50×50 cm quadrats prior to sediment coring. Dominant vegetation types are summarised in Table S1 (Supplement).
Twelve sediment cores were collected from Pāuatahanui saltmarsh in November and December 2021. During fieldwork in January 2022, 33 sediment cores were collected from Omaia (9), Okatakata (9), Awanui (6), and Robert Findlay (9) (Fig. 1 and Table S1). All cores were collected with a gouge auger (6 cm diameter; 50 cm length), which recovers a cylindrical sediment core with minimal compaction (Smeaton et al., 2020). Cores were placed in PVC half-pipes with ice packs and transported to Earth Sciences New Zealand (ESNZ), Lower Hutt, NZ, and stored in a refrigeration facility at 4 °C. Cores were described following the Troels-Smith (1955) sediment classification system. One core from each marsh zone from Omaia, Okatakata and Robert Findlay and two cores from each marsh zone from Pāuatahanui were sampled in 2 cm depth increments from the top of the core down to 50 cm, and after that in 5 cm intervals down to the base of the core (after Howard et al., 2014). The remaining cores were sub-sampled at 5 cm intervals between 0 and 20 cm and in 10 cm intervals from 20 cm to the base. A total of 97, 25, 56, 75, and 61 samples were collected from Pāuatahanui, Robert Findlay, Awanui, Okatakata and Omaia cores, respectively. In cases where the base of the saltmarsh deposit was difficult to identify, a microscope was used to determine whether saltmarsh foraminifera were present or not (after King et al., 2024).
3.2 Elemental and stable isotope analysis of Total Organic Carbon (TOC) and Total Nitrogen (TN)
First, large roots and aboveground biomass were manually picked from surface samples to avoid biasing average soil organic matter (OM) properties. We note that samples were not size fractioned as this study focuses on bulk soil OC, which includes belowground living plant biomass (e.g., small rootlets and rhizomes; Macreadie et al., 2017). All samples were then weighed, freeze-dried and weighed again, and homogenised using a ball mill.
Three hundred and fourteen samples were analysed for total organic carbon (TOC; wt %) and total nitrogen (TN; wt %) concentrations and their stable isotope composition (δ13Corg and δ15N) at the Stable Isotope Laboratory at ESNZ. TOC and δ13Corg were determined on acidified samples (treated with 10 % HCl for 12 h) by elemental analysis isotope ratio mass spectrometry (EA-IRMS) using an EA Eurovector 3000 and Elementar Isoprime model. TN and δ15N values were analysed on unacidified samples (Smeaton et al., 2024; Sollins et al., 1999). Internal reference standards for δ13Corg (Cane Sugar −10.3 ‰, beet sugar −24.6 ‰ and EDTA −31.1 ‰) and δ15N (Leucine 2.0 ‰, EDTA 0.58 ‰ and Caffeine −7.8 ‰) were run every 10 samples. δ13Corg and δ15N values are reported in permil (‰) relative to the Vienna Pee Dee Belemnite (VPDB) standard and AIR, respectively. The C:N ratio is reported as the molar ratio of TOC to TN. The analytical precision of the measurements is ±0.2 wt % for TOC, ±0.1 wt % for TN, ±0.2 ‰ for δ13C and ±0.3 ‰ for δ15N.
Dry bulk density (DBD; g cm−3) was calculated by dividing the mass of the dry sample by the sample volume following standard methodologies (Howard et al., 2014). Organic carbon density (CD; g C cm−3) was calculated by multiplying bulk density by the OC content for each sample depth increment (wt %; Howard et al., 2014). TOC stocks (Mg C ha−1) for each core were calculated by integrating the depth intervals (2, 5 or 10 cm) over the depth range of the core.
3.3 Chronology
We use a published age model from core PauM1, which was previously collected from Pāuatahanui (King et al., 2024), to interpolate the age of sediments in core Pau-HM3 and estimate CARs. The age model for PauM1 was developed using a Bayesian framework in the R package rplum (Blaauw et al., 2024) and assumes the base of the Pāuatahanui saltmarsh formed in 1855 following uplift during a Mw 8.2 earthquake on the Wairarapa fault (Grapes and Downes, 1997; Stephenson, 1986).
Lead isotope data were used to produce new age-depth models for three cores: Okatakata (Oka-MM1), Awanui (Awa-MM2) and Robert Findlay (Puk-MM1). Each core was sub-sampled in 1 cm increments, and the number of samples varied from 9 to 16 based on the core length and stratigraphy. Lead isotope data were generated using gamma and alpha spectrometry conducted at the radio-isotope facility at the New Zealand Institute of Public Health and Forensic Science, Christchurch, NZ. All samples were measured with gamma spectrometry, and every second sample in each core was measured with alpha spectrometry. For gamma spectrometry, sediment samples were packed into petri dishes and left to equilibrate for three weeks and then analysed to detect radionuclide activity to include 210Pb, 137Cs, 228Ra and 226Ra (Arias-Ortiz et al., 2018; Goldstein and Stirling, 2003). For alpha spectrometry, the samples were first processed to prepare the granddaughter 210Po source, and the activity of 210Po was then measured to calculate excess 210Pb activities. Decay of excess 210Pb activity (half-life = 22.5 years; Appleby, 1997; Arias-Ortiz et al., 2018) and 137Cs discharge peak in ∼1965 (Goff and Chagué-Goff, 1999) were used to determine the rate of sediment accumulation. Age-depth models were generated using rplum (Blaauw et al., 2024).
CARs for each core were calculated by dividing the TOC stock for each depth interval by the corresponding age as per the rplum age-depth models. CARs are presented for each age-depth interval with the 95 % confidence interval (CI). Mean CARs for each marsh core were then calculated and are presented as mean ± SE.
14C dating was attempted on sieved sedge and rush fragments (>1 mm) from basal samples from cores Oka-MM1, Awa-MM2 and Oma-MM3 at the Rafter Radiocarbon Laboratory at ESNZ. However, the reported calibrated ages for all basal samples were modern (post-bomb) and unsuitable for inclusion in the age-depth models and for estimating a date of original saltmarsh establishment at Omaia (Albot et al., 2026).
3.4 X-ray fluorescence (XRF)
Elemental abundances in 314 samples were measured using an Olympus Vanta M-series XRF portable scanner at Victoria University of Wellington, Wellington, NZ. The scanner has a 9 mm-diameter primary beam connected to a workstation that allows remote operation. Approximately 2–3 g of dried and homogenised sediment was placed in plastic tubes (5 mL; 15 mm diameter), resulting in sediment thickness in the tube of >10 mm. Each sample was measured using the standard “Geochem 3-Beam” method (50, 40 and 10 kV beams set for 30, 30 and 40 s “live time” respectively) built into the scanner, which is designed to detect and quantify major and some trace elements, including Al, Ca, Fe, K, Si, Mn, S, Sr, Ti, Zn, Cu, Pb, Zr, Nb and Rb. Measurements were taken at the start and end of each analytical period for nine external standards provided by the United States Geological Survey (USGS; AGV-2 Andesite; BHVO-2 Hawaiian Basalt; COQ-1 Carbonatite; W-2 Diabse; SGR-1 Green River Shale; SCo-1 Cody Shale) and the Geological Survey of Japan (GSJ; JR-2 Igneous; JG-2 Igneous; JF-2 Igneous). Results are reported as absolute concentrations in parts per million (ppm). The measurements were used to calculate elemental ratios relevant to OM sources and preservation. Specifically, Ca, Sr and S as marine sources (e.g., carbonates and sulfates), with Ca and Sr also reflecting biogenic carbonate; S as indicative of reducing conditions/anoxic environments that result from intrusion of sulphate-rich marine waters into organic sediments where sulphate-reducing bacteria oxidise OM; Ti, Al, Fe, Si, and K as terrestrial/lithogenic indicators from weathering of continental silicate rocks; Fe and Mn as markers of redox processes, for example, sulphate-reduction intensifying biogeochemical cycling of metals; and Zr:Rb as a grain size proxy (coarse-clay ratio), as Zr is predominantly found in coarser sediments and Rb in clays (Croudace and Rothwell, 2015; Ewers Lewis et al., 2019; Kelleway et al., 2017; Naeher et al., 2013).
3.5 Organic carbon fingerprinting
3.5.1 Lipid extraction and Gas Chromatography-Mass Spectrometry (GC-MS) analysis
Selected samples from Pāuatahanui (Pau-HM1 n=5, Pau-MM4 n=6, Pau-LM4 n=6), Okatakata (Oka-HM2 n=5, Oka-MM1 n=5, Oka-LM1 n=6) and Awanui (Awa-MM2 n=9) were analysed to determine their lipid biomarker compositions. Samples were selected along core profiles at intervals where pronounced shifts or distinct changes were observed in TOC contents, C:N ratios, δ13Corg and δ15N trends. Analyses were carried out in the ESNZ/VUW Organic Geochemistry Laboratory at ESNZ following the methodology described in Naeher et al. (2012, 2014) with some modifications, as reported in Verret et al. (2025).
The GC-MS data, focused on n-alkanes and steroids, were interpreted with Agilent MassHunter/Chemstation software based on relative retention times and diagnostic mass spectra. Several indices based on n-alkane distributions, such as the carbon preference index (CPI), odd-over-even predominance (OEP), the average chain length ratio (ACL), and the relative contribution of aquatic plants relative to terrestrial biomass (Paq index), as well as C28 and C29 stanol-sterol ratios, were calculated as described below.
CPI provides an estimate for the predominance of odd-numbered over even-numbered carbon chains and was calculated for C23-C33 carbon homologues using Eq. (1) as reported in Wang et al. (2003):
CPI has been commonly used as a proxy to estimate the degree of OM degradation or determine dominant OM sources. Odd-numbered n-alkane chains dominate in fresh biomass and recent sediments, and diagenetic alteration of OM results in preferential decay of odd-chain-length n-alkanes (Bray and Evans, 1961; Meyers and Ishiwatari, 1993). High CPI values indicate fresh OM, whereas values <1 indicate a high degree of microbial degradation or thermal maturation (Cranwell, 1981; Eglinton and Hamilton, 1967). Values close to 1–2 indicate partial OM degradation by microorganisms (Jaffé et al., 2001; Tanner et al., 2010; Zhao et al., 2024). Emergent and submerged/floating aquatic plants typically exhibit CPI values >3 (Bray and Evans, 1961; Eglinton and Hamilton, 1967; Jiménez-Morillo et al., 2024).
Similar to CPI, OEP also represents the predominance of odd-numbered over even-numbered carbon chains. This index is calculated using Eq. (2) from Zech et al. (2010).
High OEP values >1 have been interpreted to represent fresh, undegraded OM or terrestrial plant sources, while lower OEP values are indicative of OM degradation or less terrestrial inputs (Cranwell, 1981; Eglinton and Hamilton, 1967; Wang et al., 2003, 2015; Zech et al., 2010).
ACL is the weighted average of carbon chain lengths for the long-chain n-alkanes detected in the C27-C31 range and was calculated following Eq. (3) of Poynter and Eglinton (1990):
Variations in ACL can represent changes in vegetation types and have also been partly attributed to changes in prevailing temperature and/or moisture of the surrounding environment (Derrien et al., 2017; Poynter et al., 1989; Zhou et al., 2010). For example, the predominance of C27 and C29 n-alkanes is characteristic of rush, sedge, shrub, and tree species, while C31 and C33 are more abundant in grasses and herbs (Eley et al., 2016; Zech et al., 2010).
P(aqueous), referred to as Paq, is calculated using Eq. (4) from Ficken et al. (2000):
Higher Paq values indicate a higher proportion of submerged and emergent aquatic vascular plants (macrophytes) and wetter conditions (Ficken et al., 2000). Low Paq values of ≤0.25 indicate high contributions of higher terrestrial vascular plants, whereas high Paq values >0.4 indicate dominant contributions of marine and freshwater macrophytes (Ficken et al., 2000; Zhao et al., 2024). Sikes et al. (2009) further differentiate between emergent macrophytes, typically ranging between 0.4 and 0.6, and submerged and floating macrophytes exhibiting values >0.6.
Finally, the stanol-sterol ratio was calculated following Eq. (5) from Naafs et al. (2019):
C28 and C29 sterols are derived mainly from higher plants (Gaskell and Eglinton, 1976; Volkman, 1986). In anaerobic and reducing conditions, sterols are reduced to stanols due to microbial activity. This makes the stanol-sterol ratio a good indicator of diagenetic degradation of plant OM, where higher stanol-sterol ratios indicate more degraded material (Naafs et al., 2019; Wakeham, 1989).
3.5.2 Ramped-Pyrolysis Oxidation-Accelerator Mass Spectrometry (RPO-AMS)
RPO-AMS analysis was run at the Rafter Radiocarbon Laboratory at ESNZ, following the methodology described in Ginnane et al. (2024), with minor modifications (i.e., sieving to obtain a homogenous, non-biased sample). This analysis thermochemically separates OC in a particulate sample to create a radiocarbon profile of its compositional constituents (Ginnane et al., 2024; Rosenheim et al., 2008). Analyses were performed on one basal sample each from Okatakata (Oka-MM1, 28–30 cm depth) and Awanui (Awa-MM2, 90–95 cm depth). Δ14C values and conventional radiocarbon ages (CRAs) are reported as defined by Stuiver and Polach (1977) and fraction modern (Fm) values are reported as defined by Donahue et al. (1990).
The Δ14C data for each oxidised pyrolytic split is used to calculate the relative proportion of syndepositional (i.e., modern) OC versus recalcitrant carbon (i.e., older/reworked carbon) based on the modified isotopic mixing model by Broz et al. (2023) provided in Eq. (6), below.
where Cmodern is the modelled fraction of syndepositional carbon, TOC is the total OC content (wt %) of the bulk sample, Δ14Csplit is the measured Δ14C value of each pyrolytic split, Δ14Cmodern is a typical value for a modern post-bomb OC endmember (where Δ14C is assumed to be 0 ‰ in materials deposited in the last 2 kyr), and Δ14Clast_split is the final Δ14C pyrolytic split value where all labile carbon components are considered to be degraded based on the Pyrolysis-Gas Chromatography-Mass Spectrometry (Py-GC-MS) composition results as described below.
3.5.3 Pyrolysis-Gas Chromatography-Mass Spectrometry (Py-GC-MS)
Py-GC-MS analyses imitate the ramped pyrolysis process without oxidation to determine the molecular distributions that correspond to the radiocarbon measurements, which provide information about the origin, relative quantities, and degradation states of different OM sources (Ginnane et al., 2024). Py-GC-MS analysis was undertaken in the ESNZ/VUW Organic Geochemistry Laboratory at ESNZ, following Maier et al. (2025). These analyses were performed on one basal sample each from Okatakata (Oka-MM1, 28–30 cm depth) and Awanui (Awa-MM2, 90–95 cm depth).
Pyrolytic compounds for each split were grouped into the following categories (after Carr et al., 2010; Kaal et al., 2020; Maier et al., 2025; Zhang et al., 2019; and references therein): n-alkanes, with < C21 and ≥ C21 representing marine and terrestrial vegetation sources, respectively; polysaccharide derivatives (e.g., furans, furaldehydes and related compounds) from plant pigments; thiophenes derived from sulphur compounds; phenols derived from terrestrial plant lignin; polycyclic aromatic hydrocarbons (PAHs) as indicators of terrestrial carbon sources; and nitrogen (N)-containing compounds (e.g., benzonitrile, indole and related compounds) as indicators of proteinaceous aquatic microorganisms or microbial biomass. The remaining compound classes, such as cyclic alkanes and alkylbenzenes, are considered undiagnostic because they are primarily derived from recalcitrant OM (e.g., Ginnane et al., 2024; Maier et al., 2025).
3.6 Statistical analysis
3.6.1 Soil organic matter properties
R Studio (version 4.2.1) was used to test whether variability in measured soil variables across five different study sites and between individual cores collected from three distinct vegetation zones within sites was statistically significant. First, Levene's test for equal variance and Shapiro-Wilk's test for normality were run on all datasets. Because the normality and equal variance assumptions were not met, non-parametric Kruskal-Wallis and post-hoc Dunn's tests were used for pairwise comparisons. To account for the increased likelihood of Type I errors (incorrectly finding a statistically significant difference when there isn't one) associated with multiple comparisons, the Benjamini-Hochberg correction was applied to control the false discovery rate.
3.6.2 Principal Component Analysis (PCA) and hierarchical clustering
Principal Components Analysis (PCA) and hierarchical clustering were conducted on two separate datasets that included elemental, stable isotope, and XRF data, with variations based on the presence or absence of lipid biomarker indices. PCA was performed in R Studio (version 4.2.1) using the FactoMineR package. Where results showed low inter-variable correlation, thereby limiting the effectiveness of PCA, variables with minimal association with PC1 and PC2 were excluded, leading to more interpretable PCs. Specifically, the quality of representation (Cos2), which identifies the contributions of the variables on each PC, and the loadings matrix, which indicates the strength and direction of the relationship (positive or negative), were used to interpret the strength and direction of relationships.
Hierarchical clustering utilising Ward's criterion was employed to complement PCA and provide an alternative perspective on data clustering. Analyses were performed in R Studio using the hclust function. Welch's t-tests were conducted to assess the statistical significance of differences between cluster means and the overall mean for each variable. Additionally, pairwise t tests with the Benjamini-Hochberg correction were performed to compare the means of variables between the identified clusters.
4.1 Stratigraphy and sedimentology
Depth of refusal, typically indicating the base of saltmarsh sediments, ranged from a minimum thickness of 5 cm for low and high marsh cores at Robert Findlay to >95 cm for a mid marsh core at Awanui. Marsh sediments at Pāuatahanui comprised herbaceous peat or organic-rich silts in the top 5–15 cm, underlain by silts and clays (Fig. 2a). Shelly sands and clays, interpreted as pre-marsh sediments, were observed at refusal depths across all cores. Most marsh sediments at Robert Findlay generally comprised sandy/silty peat in the top 5 cm, underlain by shelly silts and sands in high marsh zones and shelly clay in low and mid marsh zones (Fig. 2b). At Omaia, cores consisted of a thin layer of topsoil underlain by layers of intermixed silty sands, silts and clays with occasional thin peaty layers (Fig. 2c). Sediments at Okatakata included a 10–15 cm thick upper unit of sandy/silty peat and organic-rich silts that sit on top of silty clays (Fig. 2d). Marsh sediments at Awanui typically comprised peaty/organic-rich silts and clays within the top 10 cm, underlain by organic-rich clays and silt (Fig. 2e, f). However, several cores collected from low marsh areas with juvenile vegetation (Awa-LM1 and Awa-LM2) were entirely composed of organic-rich sands. Most cores collected from low marsh areas at all sites were bioturbated. Examples of detailed stratigraphic logs following the Troels-Smith (1955) classification are provided for cores Pau-HM3, Puk-MM1, Oma-MM3, Oka-MM1, and Awa-MM2 in Figs. S1–S5 (Supplement).
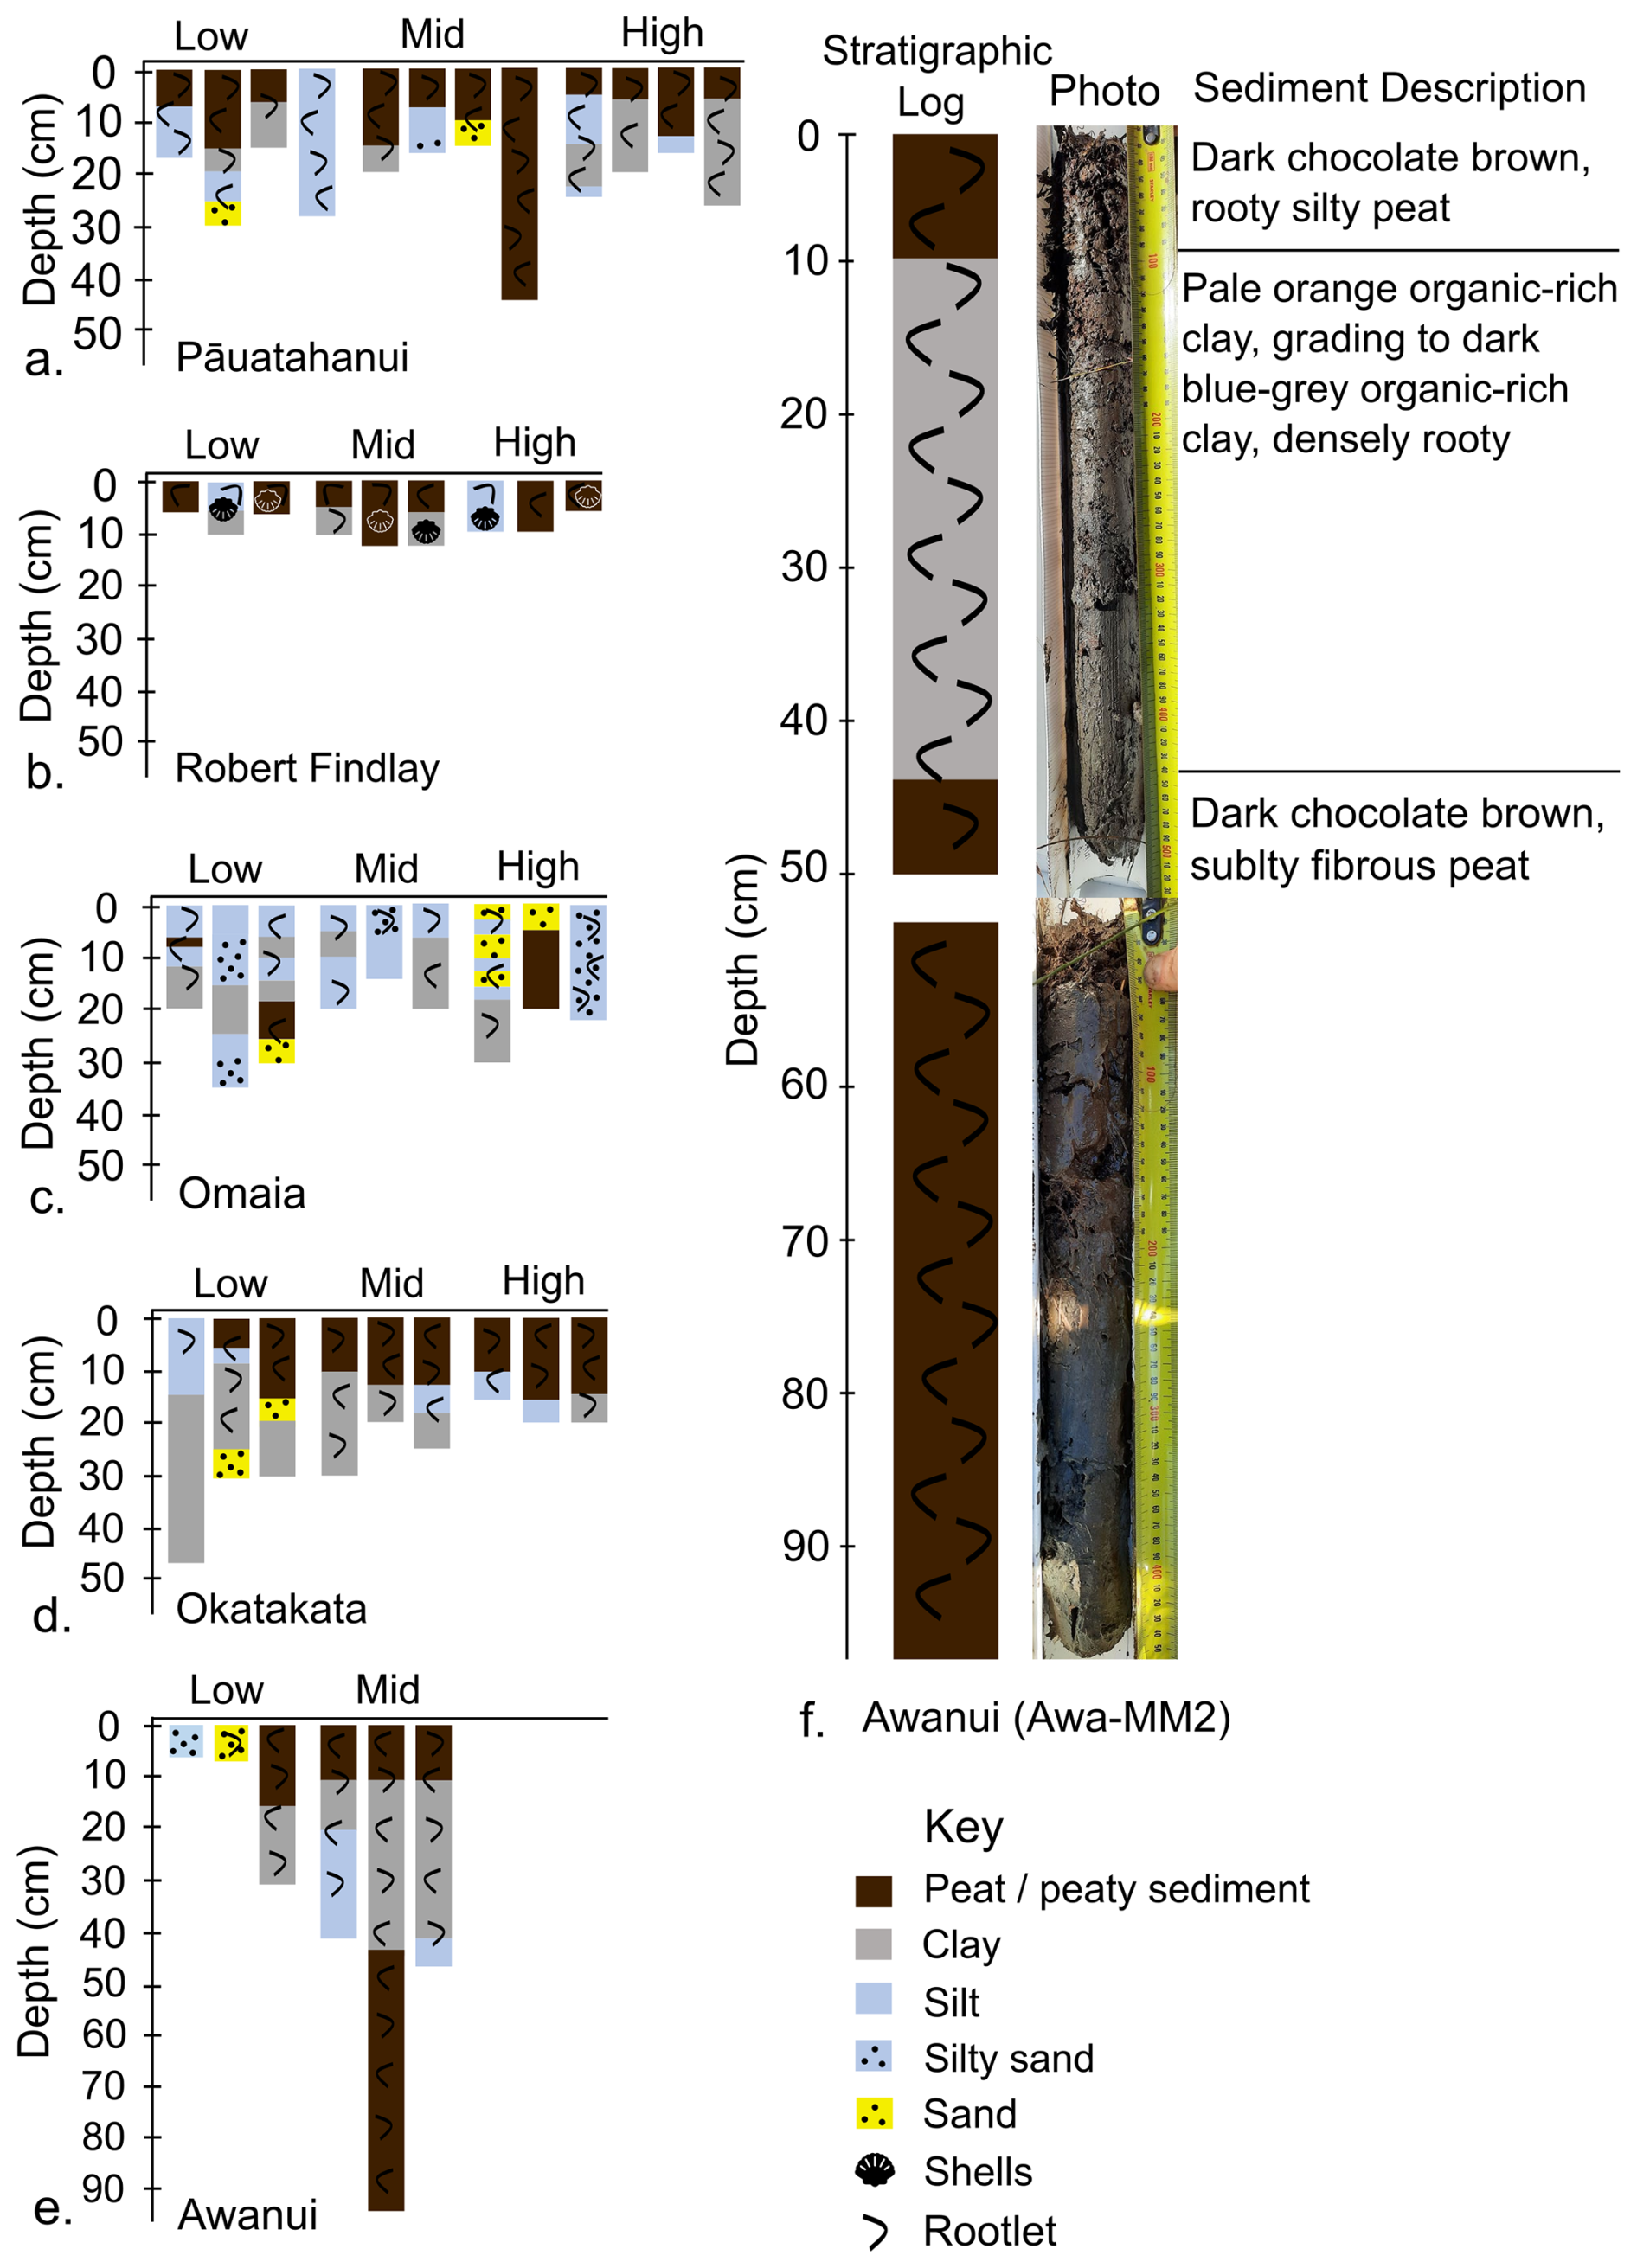
Figure 2Simplified stratigraphy for sediment cores from (a) Pāuatahanui, (b) Robert Findlay, (c) Omaia, (d) Okatakata, (e) Awanui, and (f) simplified stratigraphy and photograph of core Awa-MM2. The Troels-Smith (1955) classification is simplified to peaty sediment and minerogenic lithologies in this schematic diagram.
4.2 Bulk soil organic matter variables and carbon stocks
Statistically significant differences (p<0.05) in TOC, TN, CD and DBD were observed between sites and in at least one marsh zone at each site, although no consistent patterns emerged regarding which zones had higher values. Statistical results for Levene's, Shapiro-Wilk's and Kruskal-Wallis tests are presented in Table S2. Tables S3–S7 provide the results of the post-hoc Dunn tests (Supplement). Mean carbon stocks ranged from 41.3±9.4 Mg C ha−1 at Robert Findlay to 92.3±66.2 Mg C ha−1 at Awanui (Table 1; Fig. 3). In most marsh zones, mean carbon stocks exceed median values, demonstrating a positive skew arising from the sampling of locations with higher carbon stocks. Table S8 (Supplement) summarises the results by marsh zone for each site. Kruskal-Wallis results indicate no significant difference in carbon stocks across the five sites (N=45; p=0.48).
Table 1Mean (± SE) values for Total Organic Carbon (TOC), Total Nitrogen (TN), Dry Bulk Density (DBD), Carbon Density (CD), and carbon stocks (mean ± SE) for each study site.
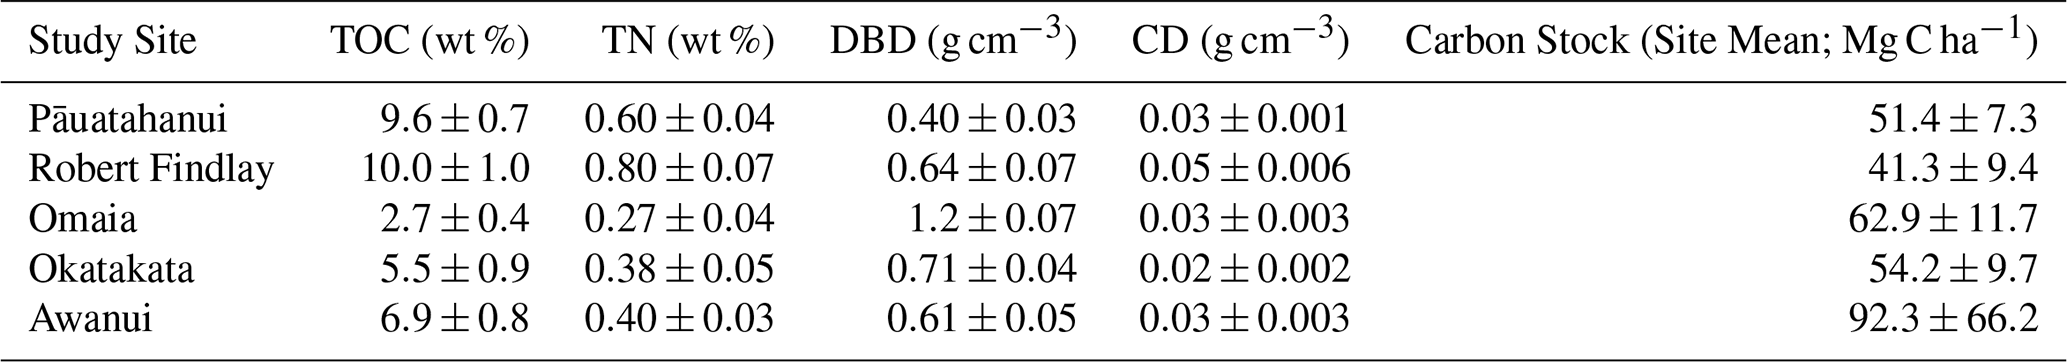
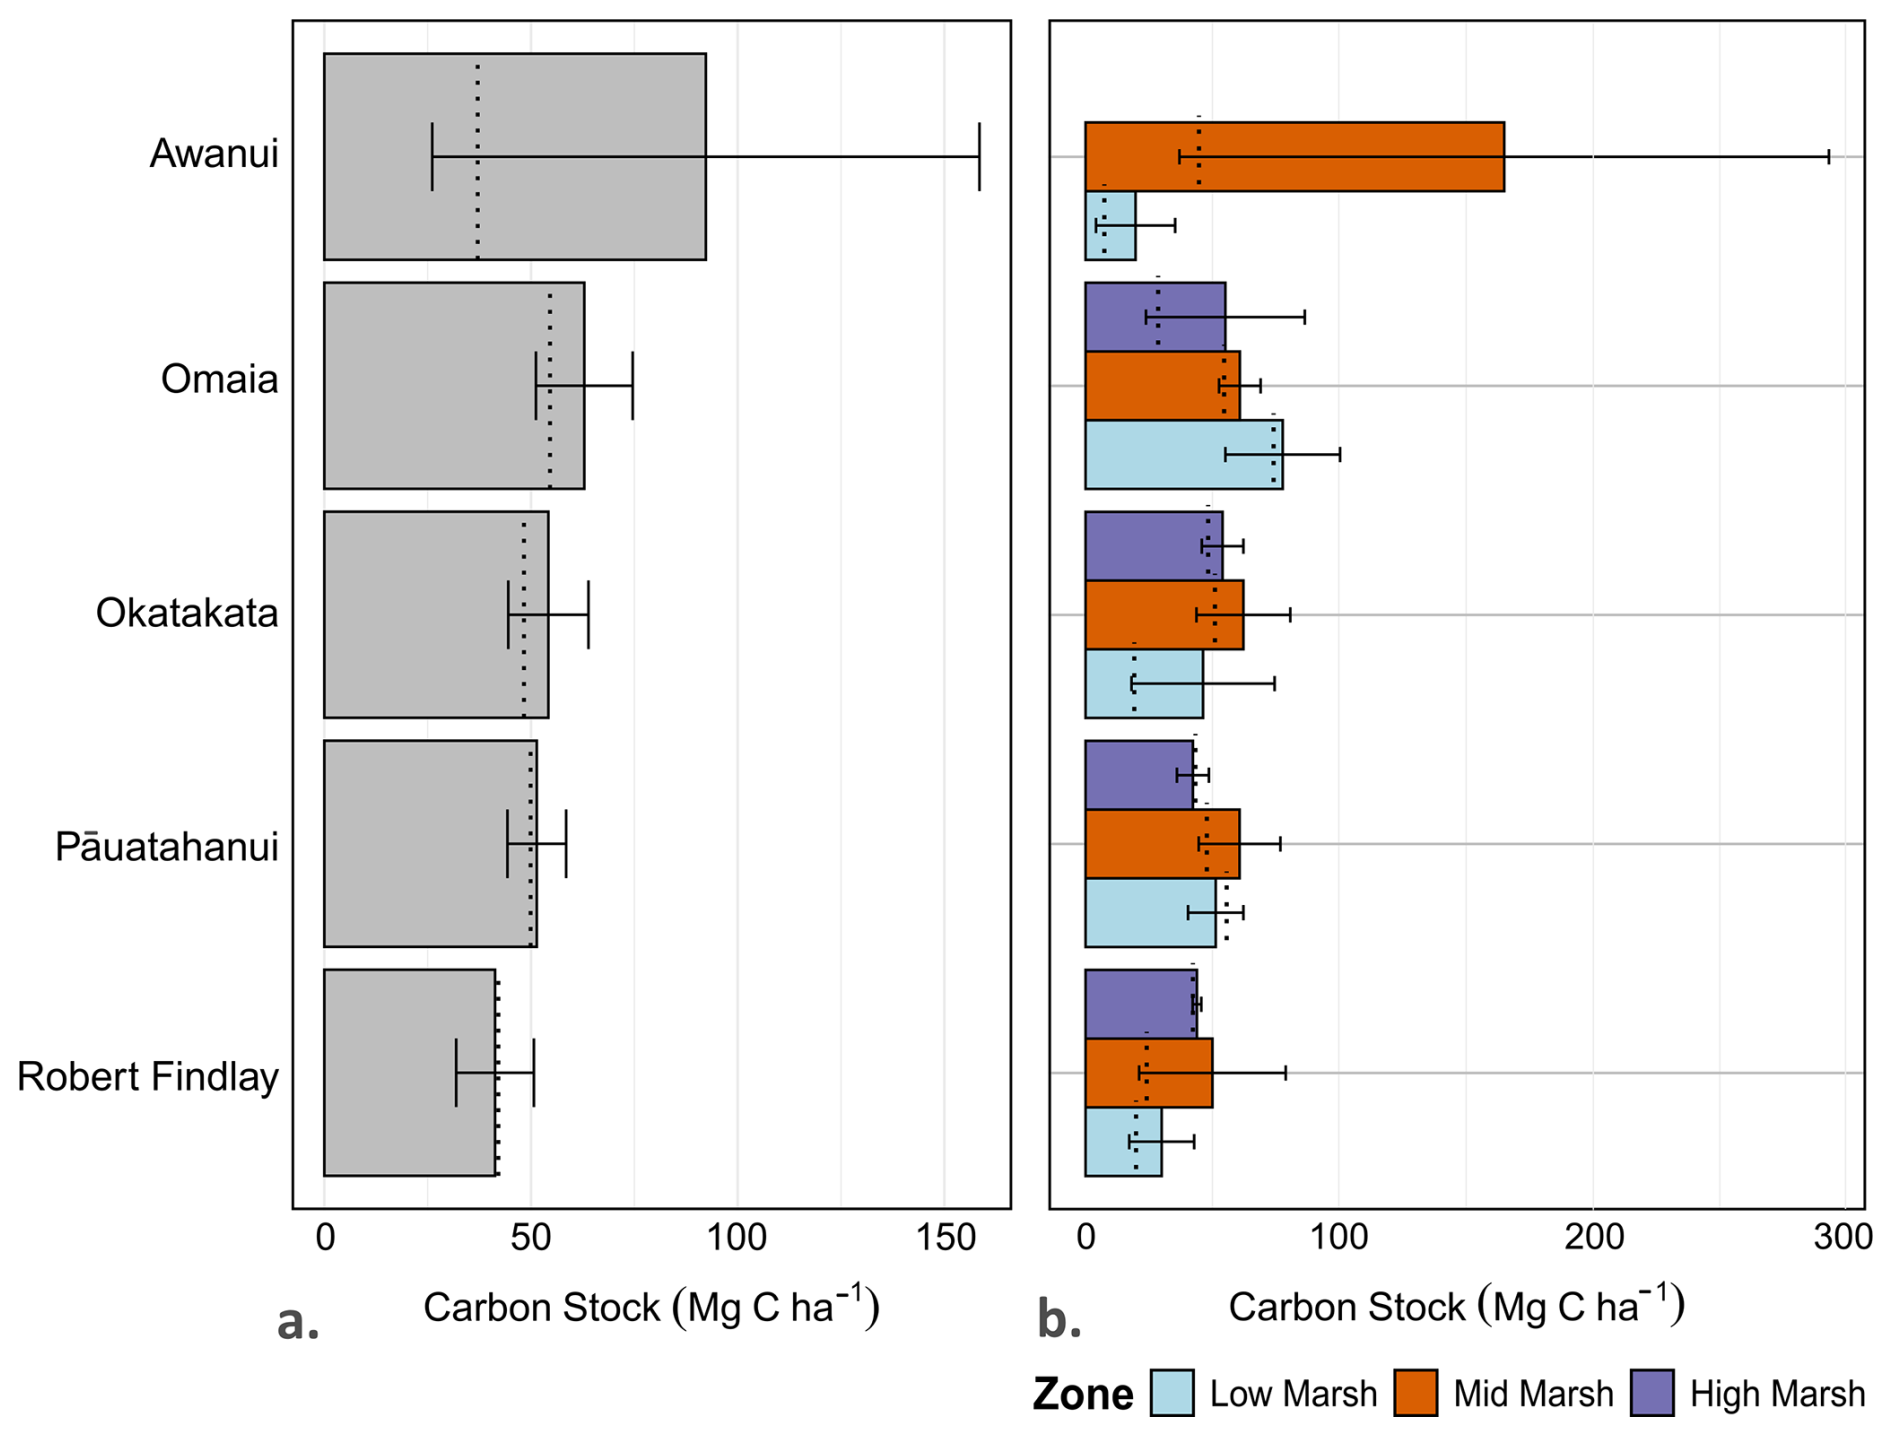
Figure 3(a) Mean carbon stocks (Mg C ha−1 ± SE) at each study site, and (b) mean carbon stocks per marsh zone for each study site. The black dotted line represents the median value.
4.3 Chronology
Total 210Pb activities for all three age-depth models decline from the surface and reach supported levels (i.e., equilibrium with parent isotope; ≤10210Pb Bq kg−1) at 40 cm for Awanui and 20 cm at Okatakata, but do not reach supported levels at Robert Findlay. 137Cs peaks at Robert Findlay, Okatakata and Awanui were evident between 9–10, 2–3, and 7–8 cm, respectively (Fig. 4b, d, f), and correlate to the ∼1965 peak fallout in NZ (Goff and Chagué-Goff, 1999). The mean 95 % CI is 26.2 years at Robert Findlay, 51.2 years at Okatakata and 24.9 years at Awanui. Robert Findlay shows age uncertainty <30 years for the top 10 cm of the core, which increases up to 47 years at the base of the marsh deposit (Fig. 4a). Age uncertainty at Okatakata is below 30 years for sediments deposited down to 5 cm and increases to 55 years at the marsh base (Fig. 4c). Age uncertainty in the Awanui core for sediments deposited between 0 and 20 cm is less than 20 years. This uncertainty increases to between 20–32 years below 20 cm (Fig. 4e).
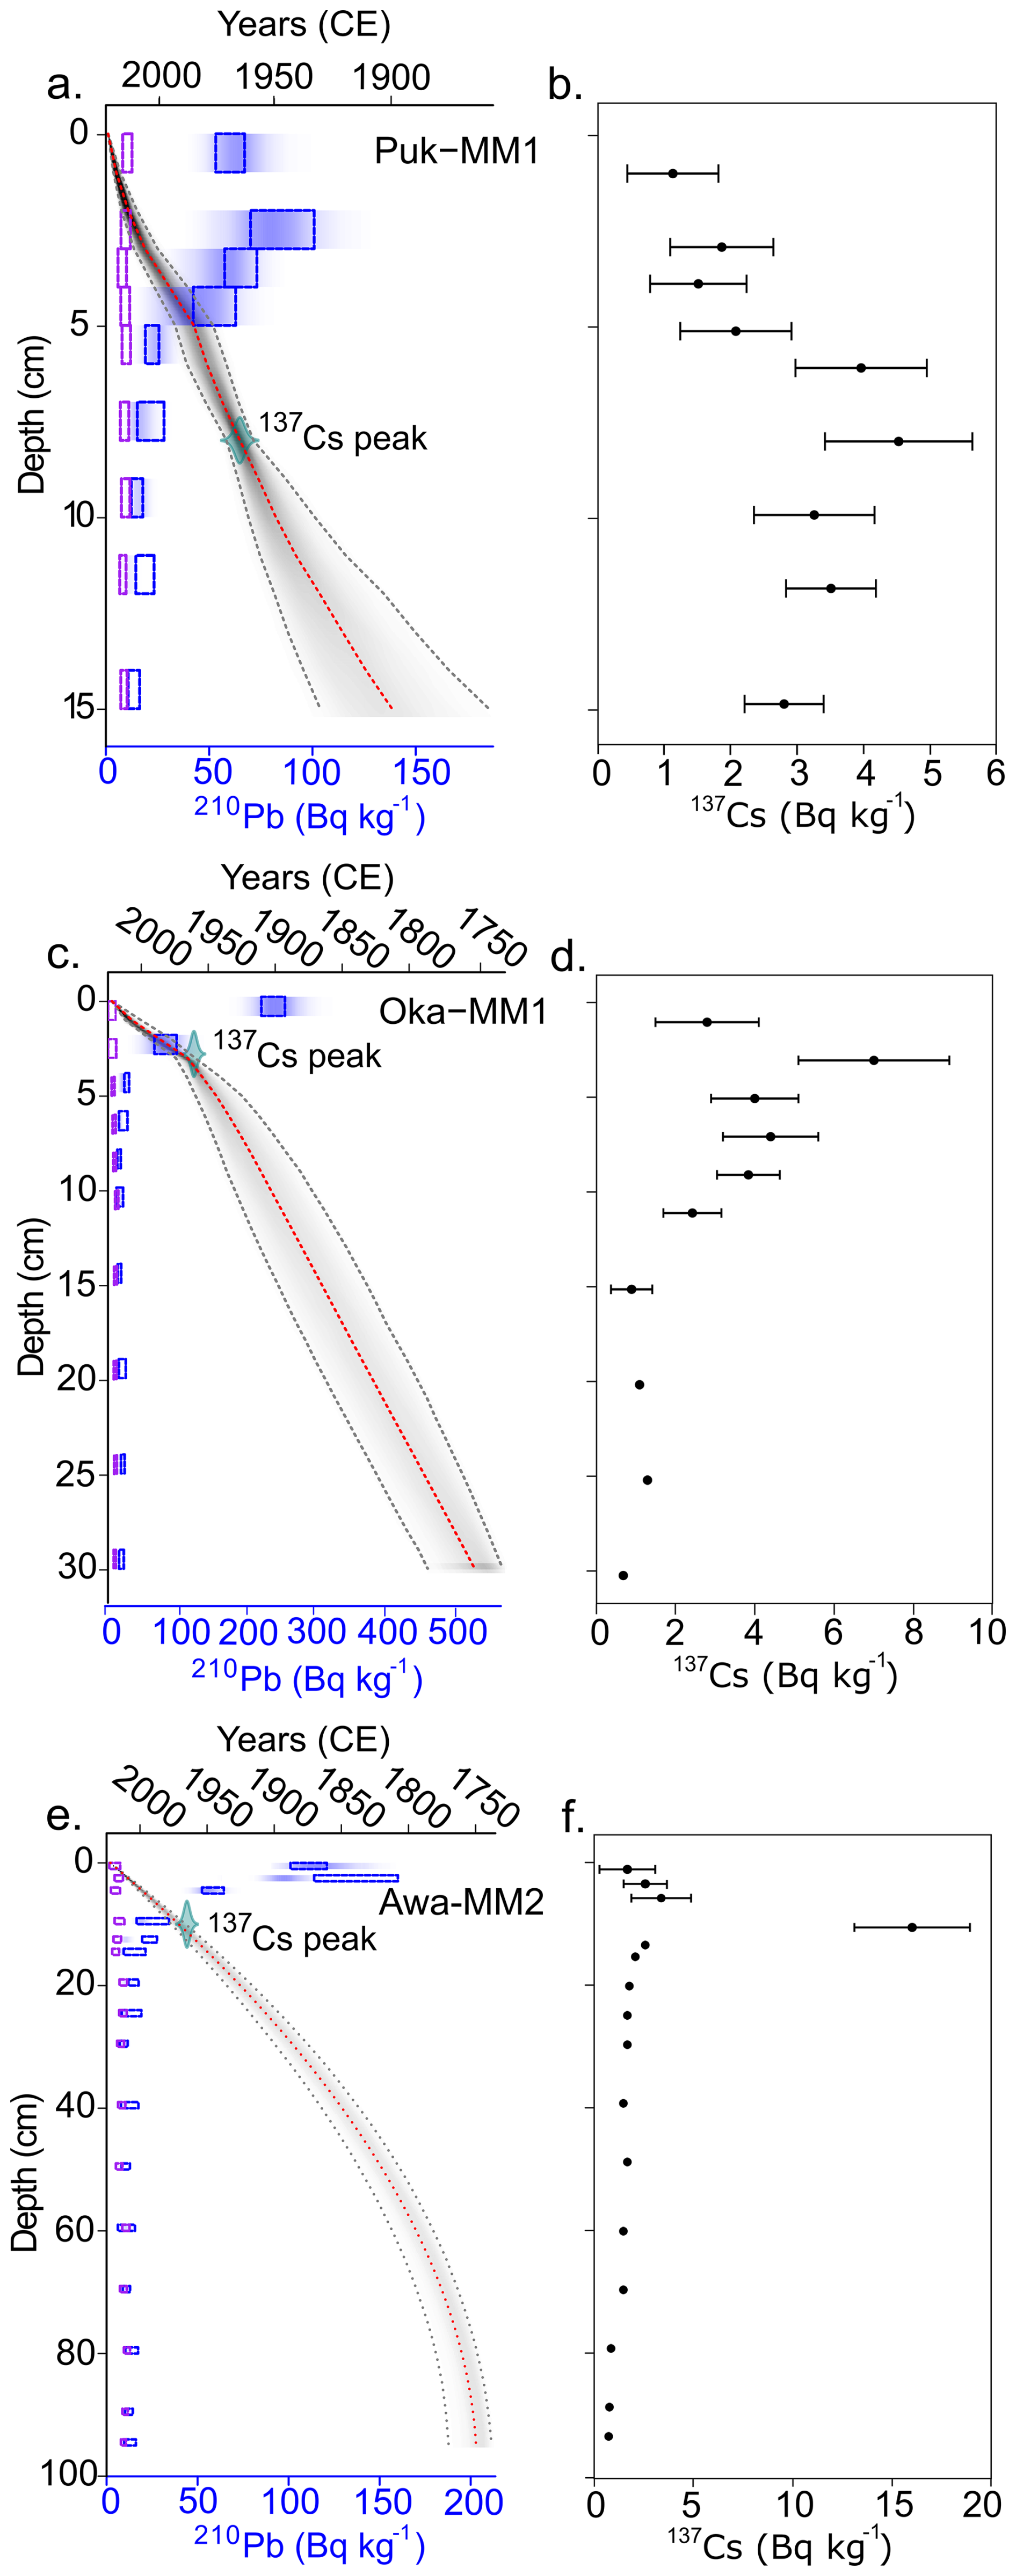
Figure 4Bayesian age-depth models for (a) Robert Findlay (core Puk-MM1), (c) Okatakata (core Oka-MM1), and (e) Awanui (core Awa-MM2). The y axis represents the depth of the cores (cm), and the x axis depicts the estimated age (years in Common Era; CE). The red dotted line represents the model mean, and the grey shaded area represents the 95 % confidence interval (CI). The dotted boxes and shading represent total 210Pb (Bq kg−1) activity as measured by alpha and gamma spectrometry. 137Cs peak is plotted as a calendar date (1965±2). (b), (d) and (f) show 137Cs levels for each core.
4.4 Carbon Accumulation Rates (CARs)
Soil CARs ranged from a minimum of 0.37 Mg C ha−1 yr−1, CI [0.35, 0.43], in basal sediments at Okatakata, to a maximum of 2.16 Mg C ha−1 yr−1, CI [1.96, 2.44], in surface sediments at Awanui (Fig. 5). Robert Findlay exhibited the highest mean CAR (1.53±0.09 Mg C ha−1 yr−1; mean ± SE), followed by Awanui (1.32±0.01 Mg C ha−1 yr−1), Pāuatahanui (0.64±0.02 Mg C ha−1 yr−1), and Okatakata (0.46±0.02 Mg C ha−1 yr−1).
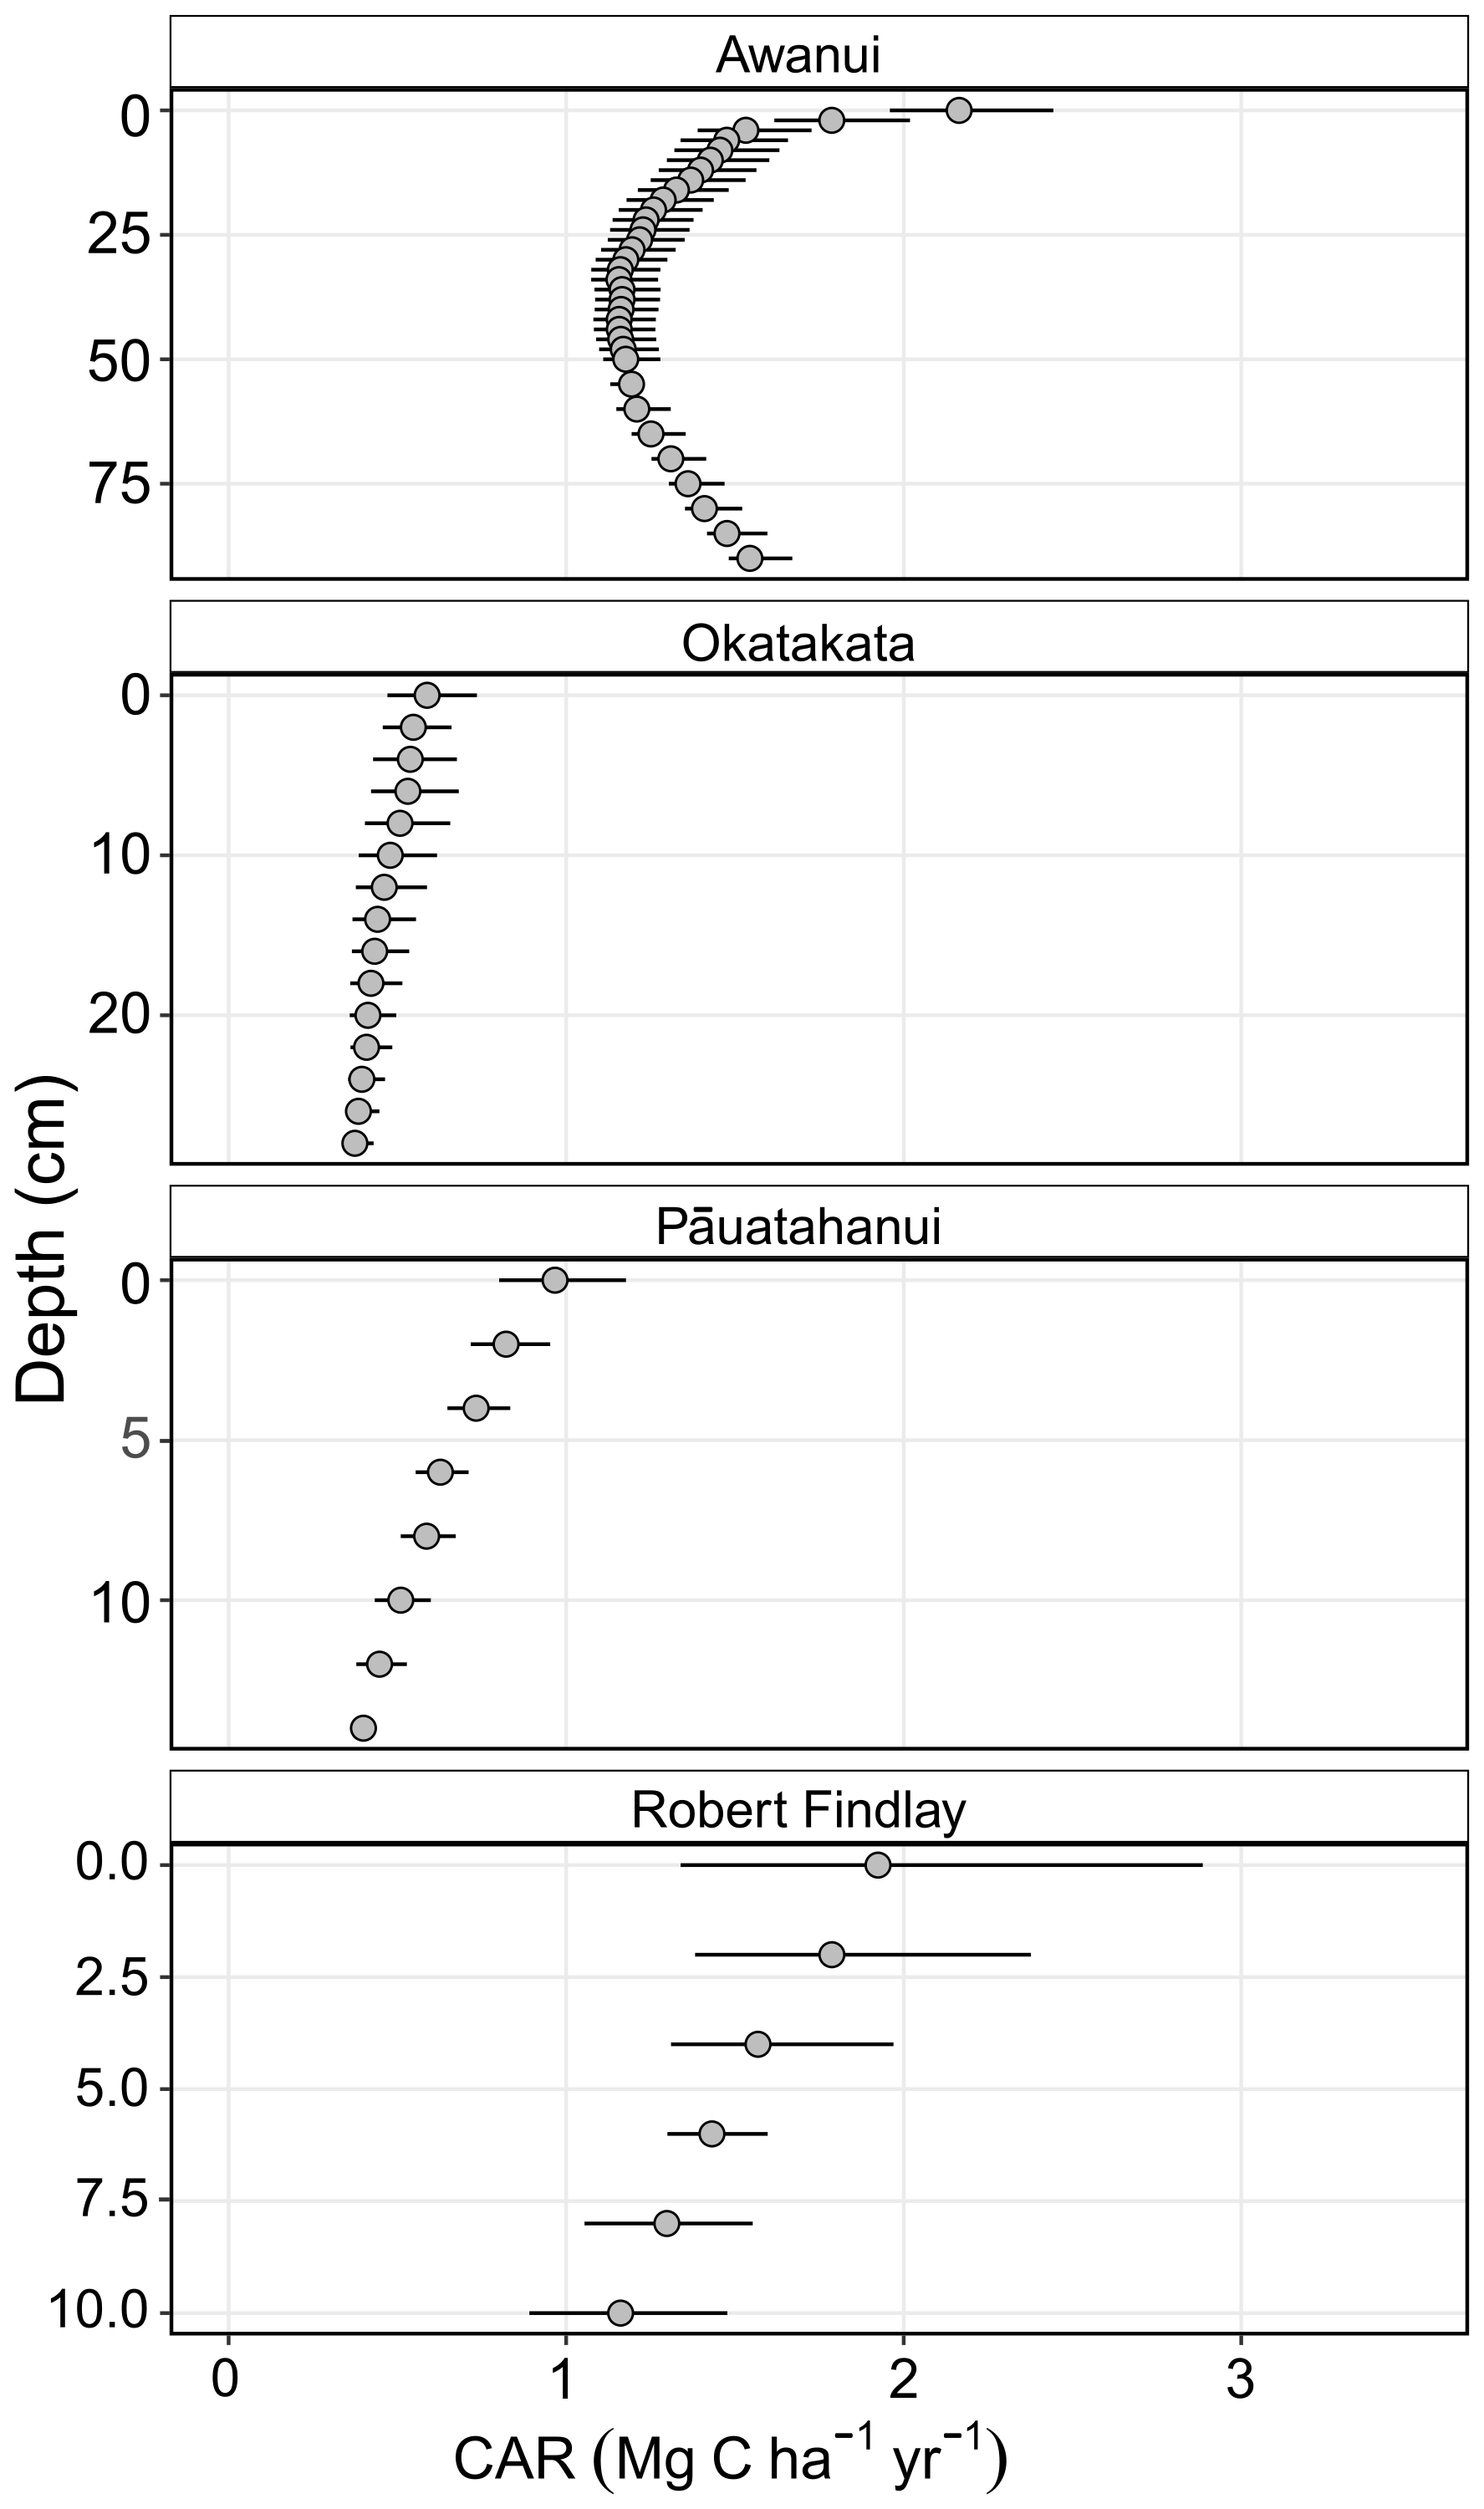
Figure 5Core soil CARs (Mg C ha−1 yr−1 ± mean 95 % CI) obtained from Bayesian age-depth models generated using rplum (Blaauw et al., 2024): Awanui core Awa-MM2; Okatakata core Oka-MM1; and Robert Findlay core Puk-MM1. Pāuatahanui core Pau-HM3 was interpolated based on the age-depth model in King et al. (2024).
4.5 Stable isotope analysis of carbon and nitrogen
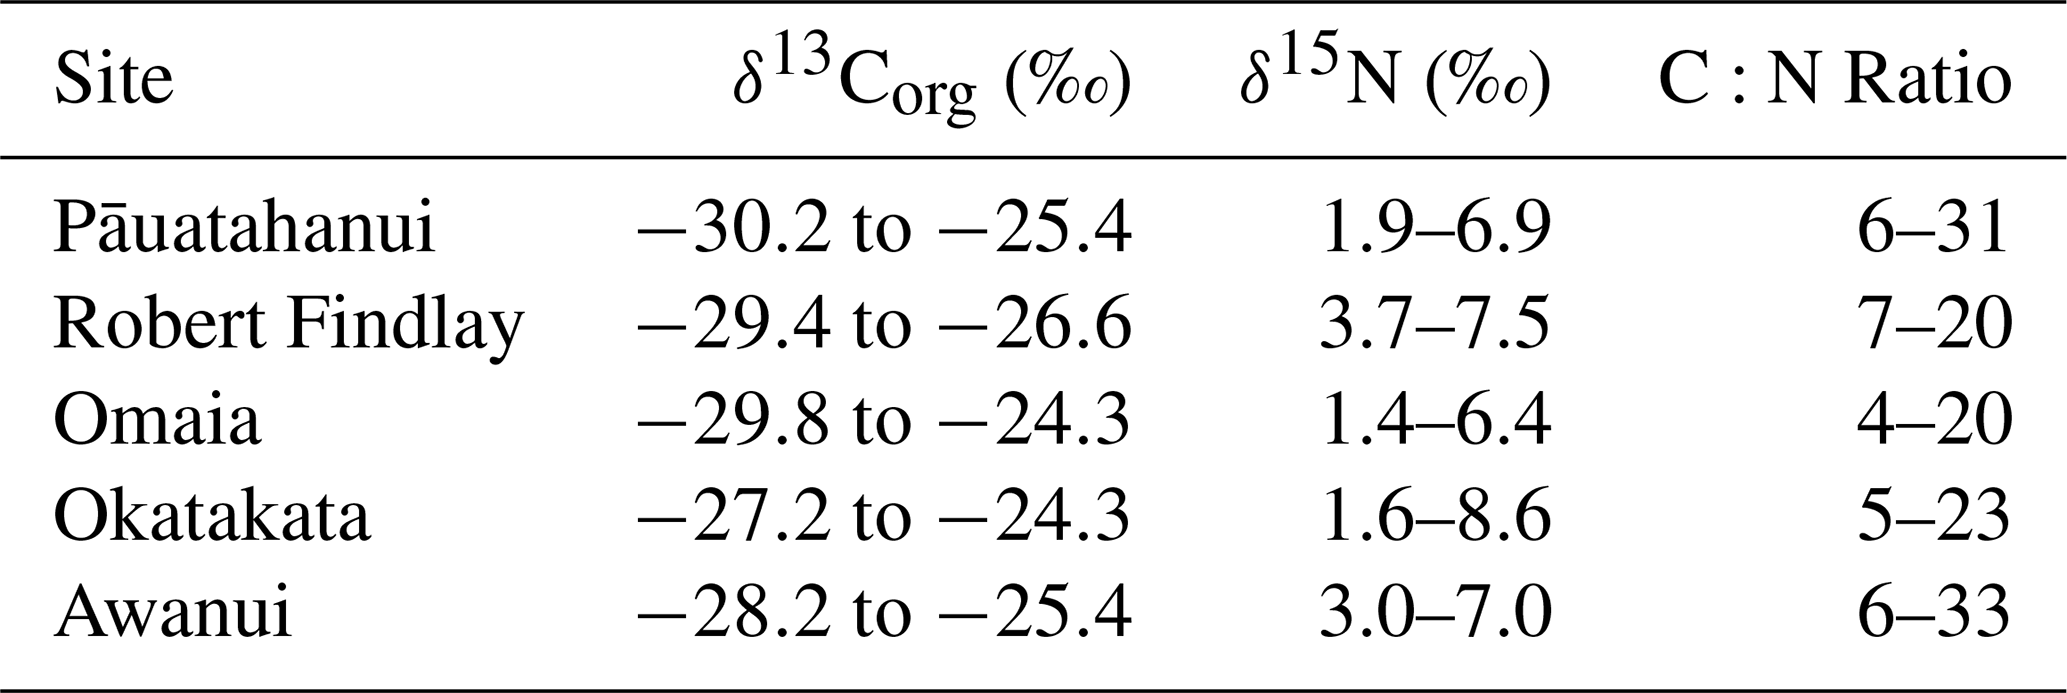
δ13Corg, δ15N and C:N ranges for the study sites are provided in Table 2. δ13Corg versus C:N scatter plots (Fig. 6) show that the sample distributions across all sites fall predominantly within the C3 plant range, freshwater dissolved OC (DOC) and particulate OC (POC) sources. Omaia and Okatakata show contributions from two additional sources of OC: freshwater algae and marine DOC. Omaia exhibits the widest range of carbon sources.
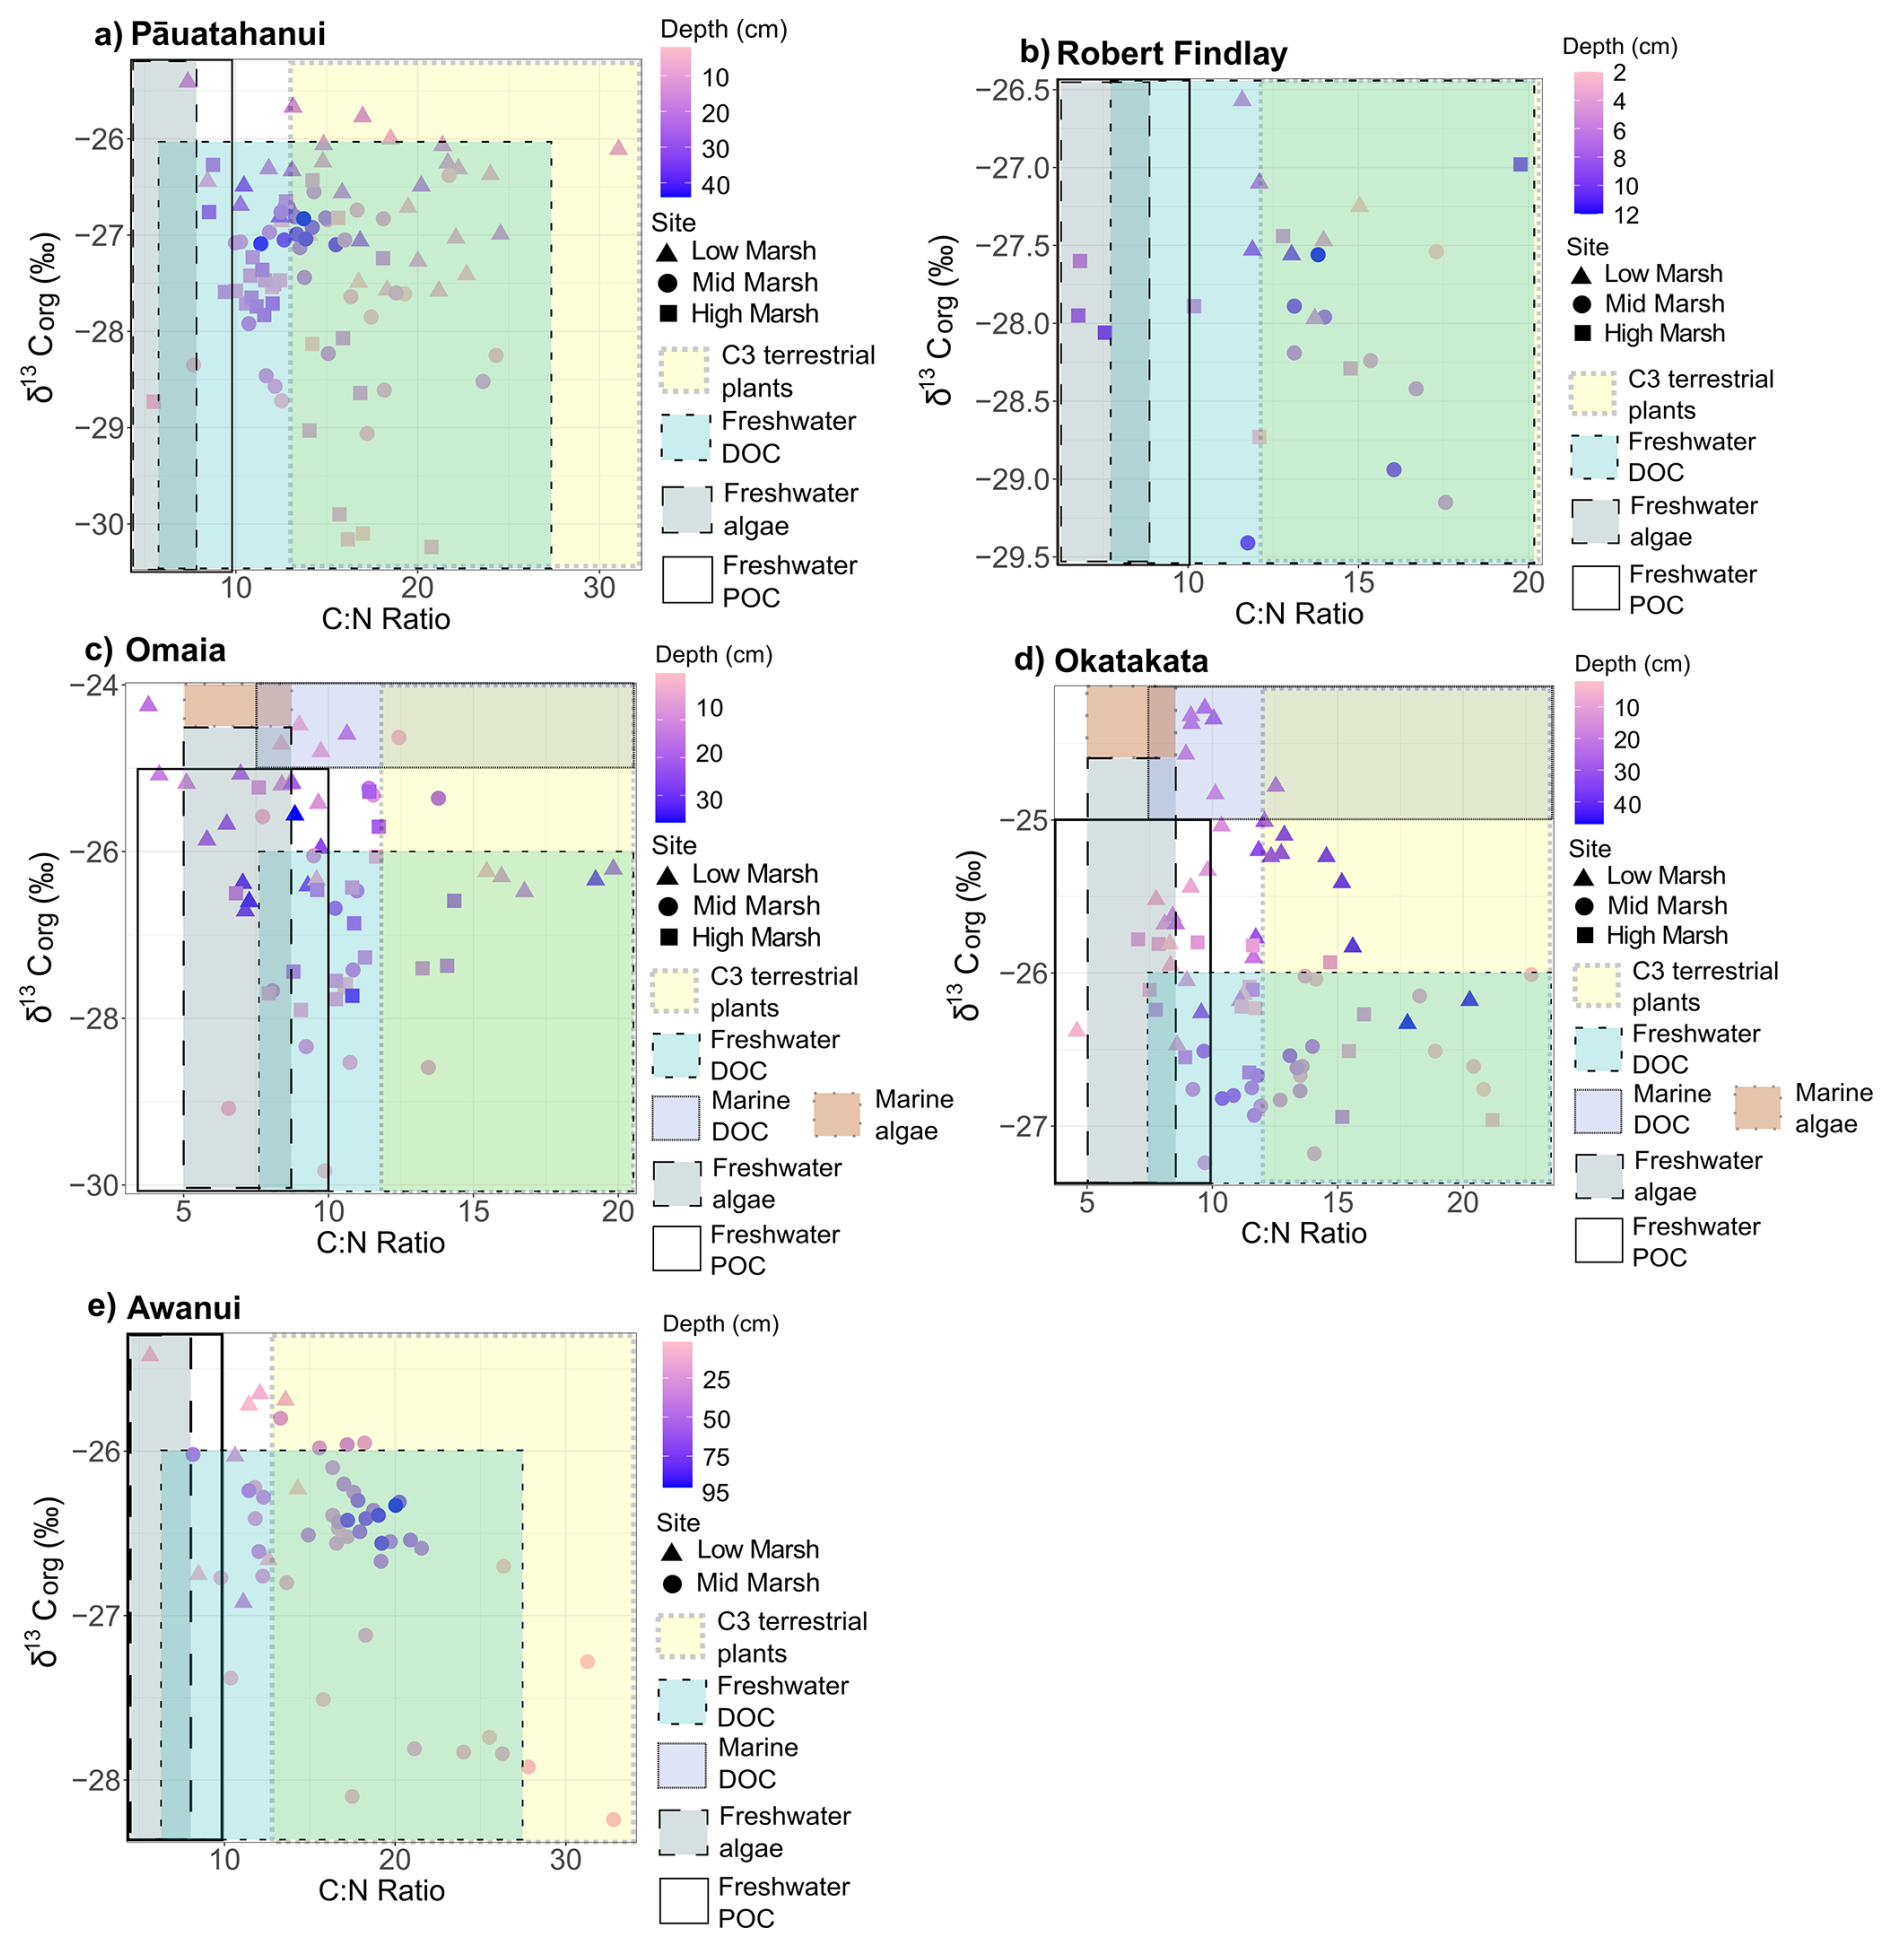
Figure 6Scatterplots of δ13Corg (‰) and C:N ratios for (a) Pāuatahanui, (b) Robert Findlay, (c) Omaia, (d) Okatakata and (e) Awanui. Note that the x and y scales differ based on site-specific ranges. The coloured boxes represent the typical δ13Corg and C:N ranges of the different sources of organic inputs to the coastal environment – C3 terrestrial plants, freshwater DOC, marine DOC, freshwater algae, marine algae, and freshwater POC. The ranges have been compiled from various studies and presented by Lamb et al. (2006).
Table 2δ13Corg, δ15N and C:N ratio ranges at the five study sites.
4.6 X-ray fluorescence (XRF)
XRF analyses quantified the following major and trace elements in all cores: Mn, Al, Fe, Zr, Ca, Si, K, Sr, Nb, Rb, Ti, Zn, S, Pb, and Cu (Albot et al., 2026). PCA and hierarchical cluster analysis were used to examine the stratigraphy and relationships between XRF measurements and other datasets. These results are shown in Fig. 9 and discussed in Sect. 5.2 and 5.3.
4.7 Lipid biomarkers
Distribution of biomarkers, ratios and indices
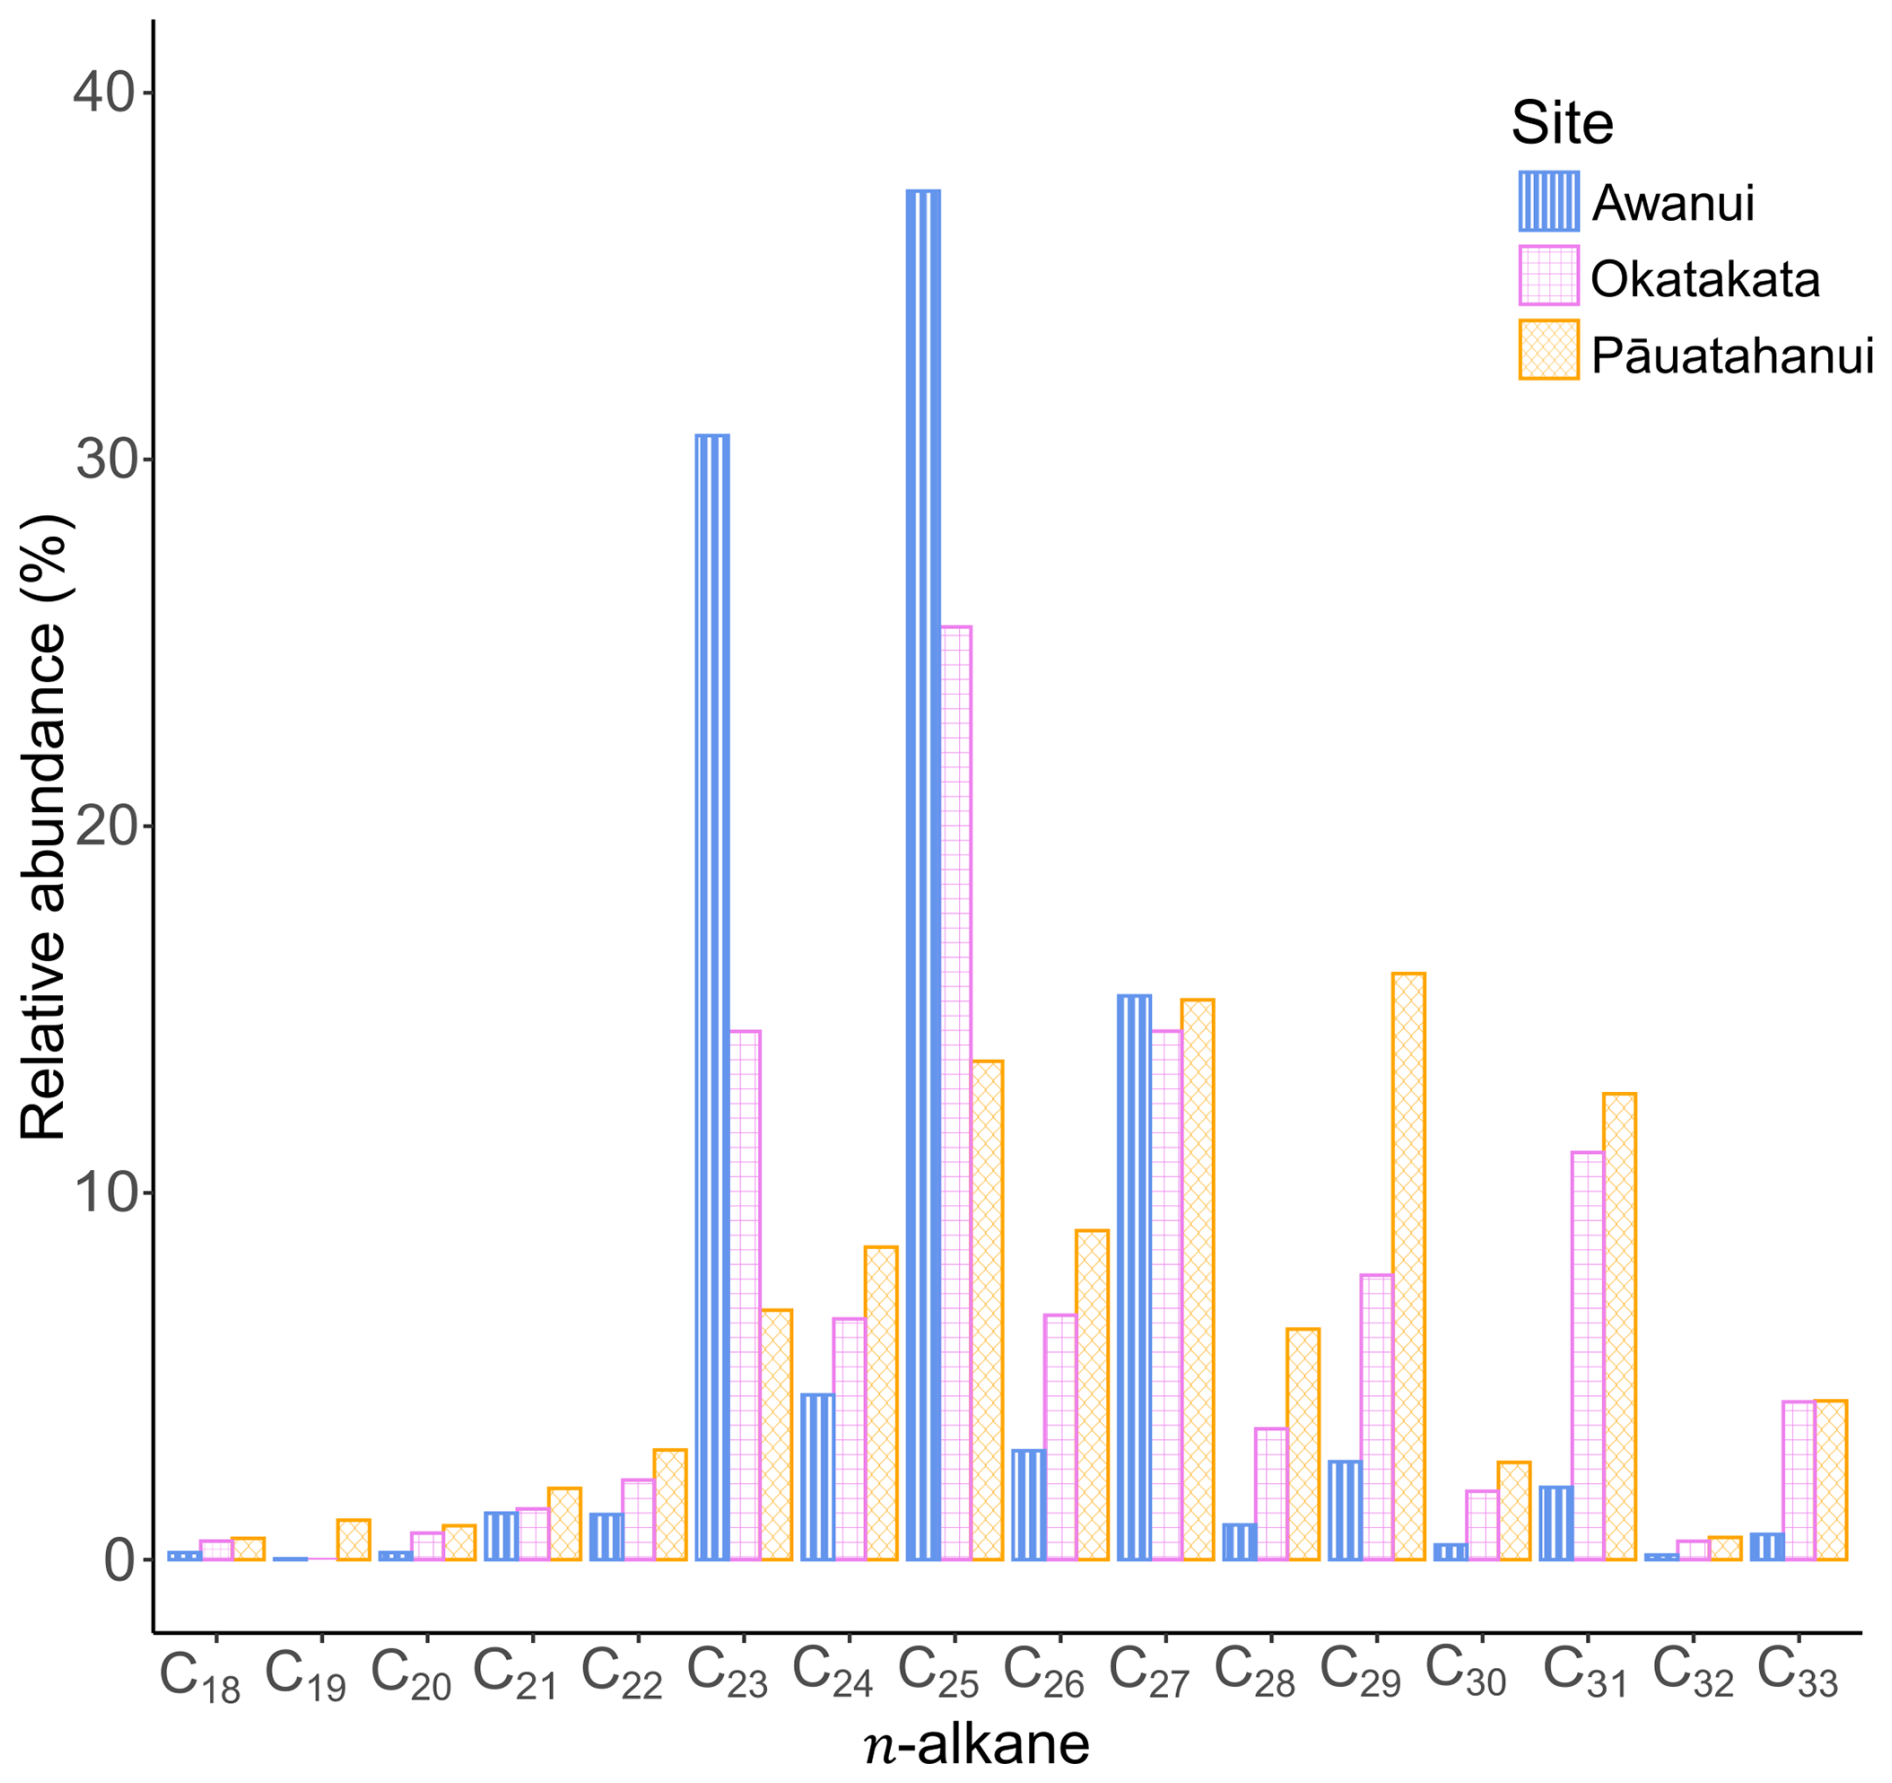
The distribution of n-alkanes in the apolar biomarker fractions ranges from C18 to C33 and shows dominance of either mid-chain (mid-molecular weight; C21-C25) or long-chain (high molecular weight; C26-C33) n-alkanes across all sites. There is a higher relative abundance of odd-carbon n-alkanes than even-carbon n-alkanes (Fig. 7). Pāuatahanui has higher relative abundances of long-chain n-alkanes (65 %) than mid-chain n-alkanes (33 %). In comparison, at Okatakata and Awanui, the mid-chain n-alkanes (50 % and 75 %, respectively) exhibit a higher relative abundance than the long-chain n-alkanes (49.5 % and 25 %, respectively). Short-chain n-alkanes (< C21) contributions were 2 % at Pāuatahanui and <1 % at Okatakata and Awanui.
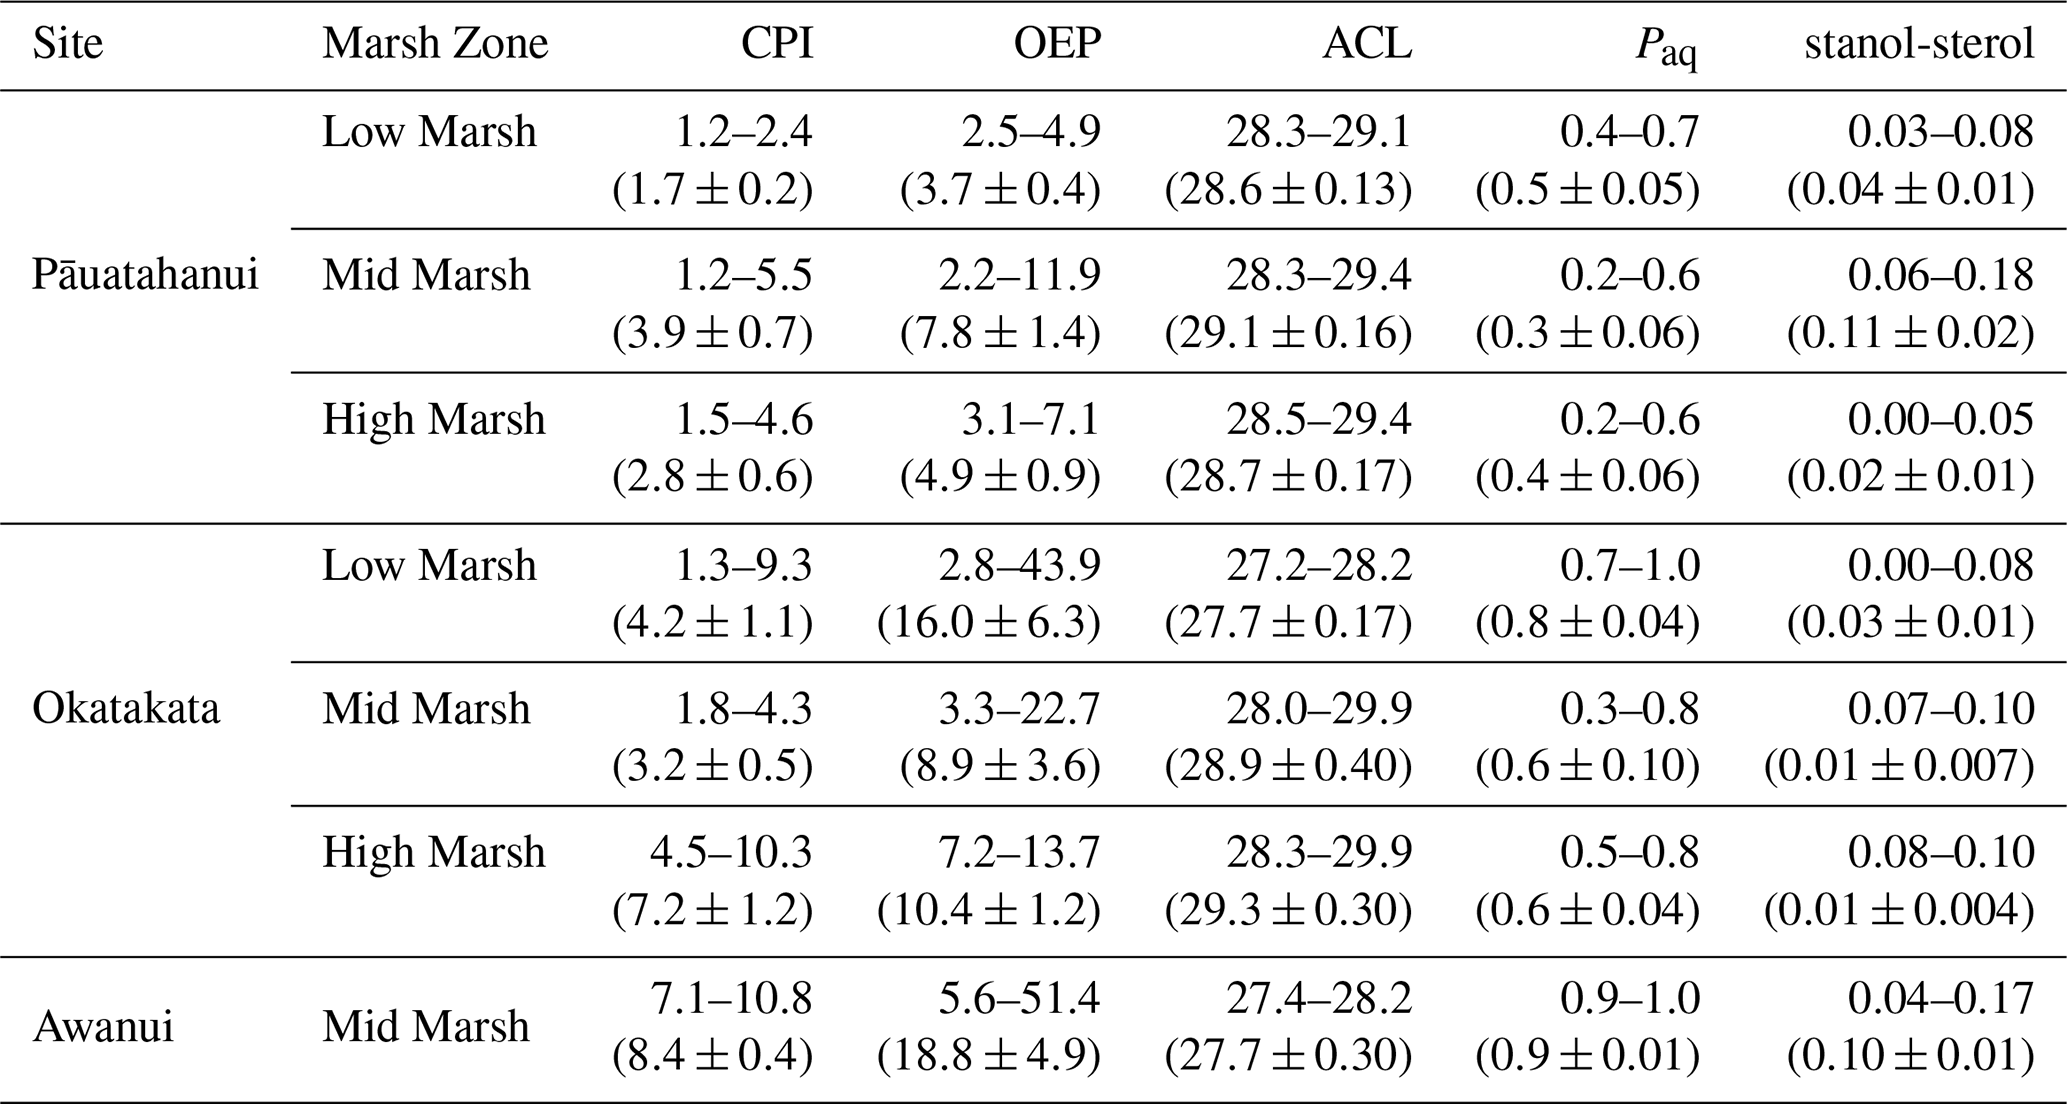
Total concentrations of C21-C33 n-alkanes in sediments ranged from 0.01 to 2.9 µg g−1 TOC at Pāuatahanui, 0.01 to 4.4 µg g−1 TOC at Okatakata, and from 0.7 to 9.4 µg g−1 TOC at Awanui. Across sites, CPI ranged from 1.2 at Pāuatahanui to 10.8 at Awanui. OEP index was >2.2, ranging from 2.2 at Pāuatahanui to 51.4 at Awanui. ACL values varied between 27.2 and 29.9. Paq ranged from 0.2 at Pāuatahanui to 1.0 at Awanui. Stanol–sterol ratios were generally low, ranging from 0 to 0.18, with deeper samples typically exhibiting higher values. C28 steroids, specifically campesterol and its degradation product campestanol, and C29 steroids, specifically sitosterol and its degradation product sitostanol, are used to calculate the stanol-sterol ratios, as these were the most abundant steroids in the samples. Stigmasterol was present in some samples but was too low in abundance to include in the ratio calculations. Table 3 summarises site-specific ranges, and Fig. S6 (Supplement) shows boxplots of biomarker indices for each core examined in the study. Example chromatograms showing the distribution of n-alkanes and steroids are presented in Figs. S7 and S8 (Supplement).
Table 3Biomarker index ranges at Pāuatahanui, Okatakata and Awanui. Mean ± SE are presented in brackets.
4.8 Ramped-Pyrolysis Oxidation-Accelerator Mass Spectrometry (RPO-AMS) and Pyrolysis-Gas Chromatography-Mass Spectrometry (Py-GC-MS)
CRAs for the collected and measured pyrolytic splits ranged from 515±85 years Before Present (BP) to 2491±165 years BP at Okatakata, with measured pyrolysis temperatures ranging from 105 to 700 °C. At Awanui, CRAs ranged from 2350±160 years BP to 3246±188 years BP, with measured pyrolysis temperatures ranging from 105 to 700 °C. Isotopic mixing model results provide estimates of 67 % (first collected pyrolytic split) to 0 % (fifth collected pyrolytic split) and 62 % to 0 % of syndepositional OC within sediments at Okatakata and Awanui, respectively. Table 4 shows the RPO-AMS and isotopic mixing results, and Fig. S9 (Supplement) shows the RPO thermographs with the pyrolytic splits.
Figure 8 shows the identified relative abundances of the determined compound groups in all five measured pyrolytic splits. Most common compound types in the first split are polysaccharide derivatives, thiophenes and N-compounds, making up 72 % and 85 % at Okatakata and Awanui, respectively. Higher temperature splits show increasing proportions of recalcitrant OC (phenols, cyclic alkanes and alkylbenzenes) and undiagnostic sources. By the third split, these contribute 59 % and 48 % at Okatakata and Awanui, respectively. Figure S10 (Supplement) shows example chromatograms for the temperature splits following ramped Py-GC-MS analysis.
Table 4RPO-AMS and isotopic mixing model (Cmodern) results for Okatakata (Oka) and Awanui (Awa) samples.
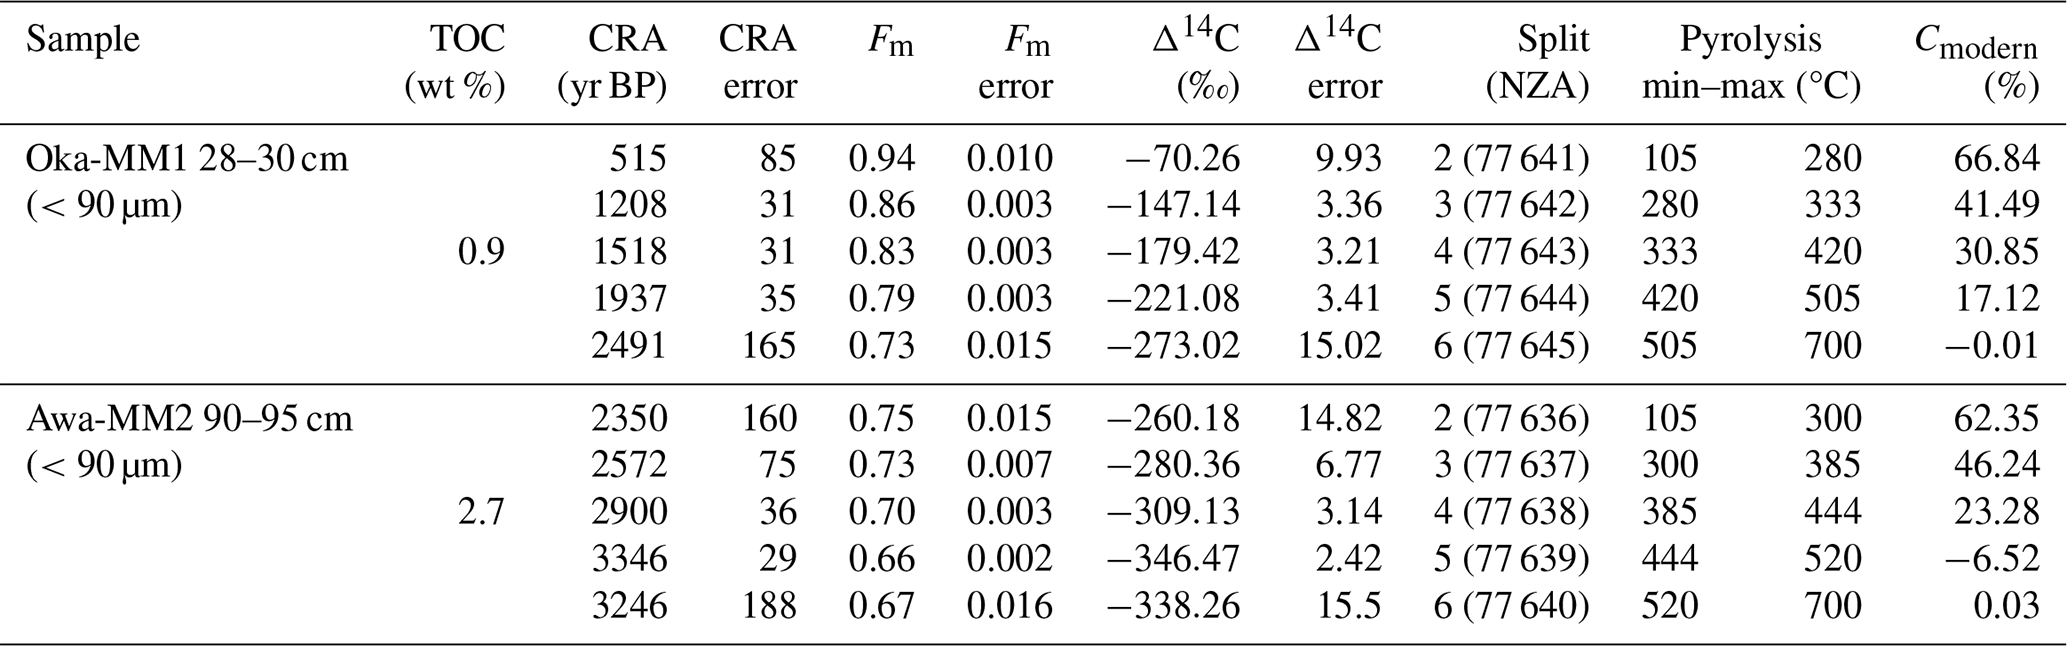
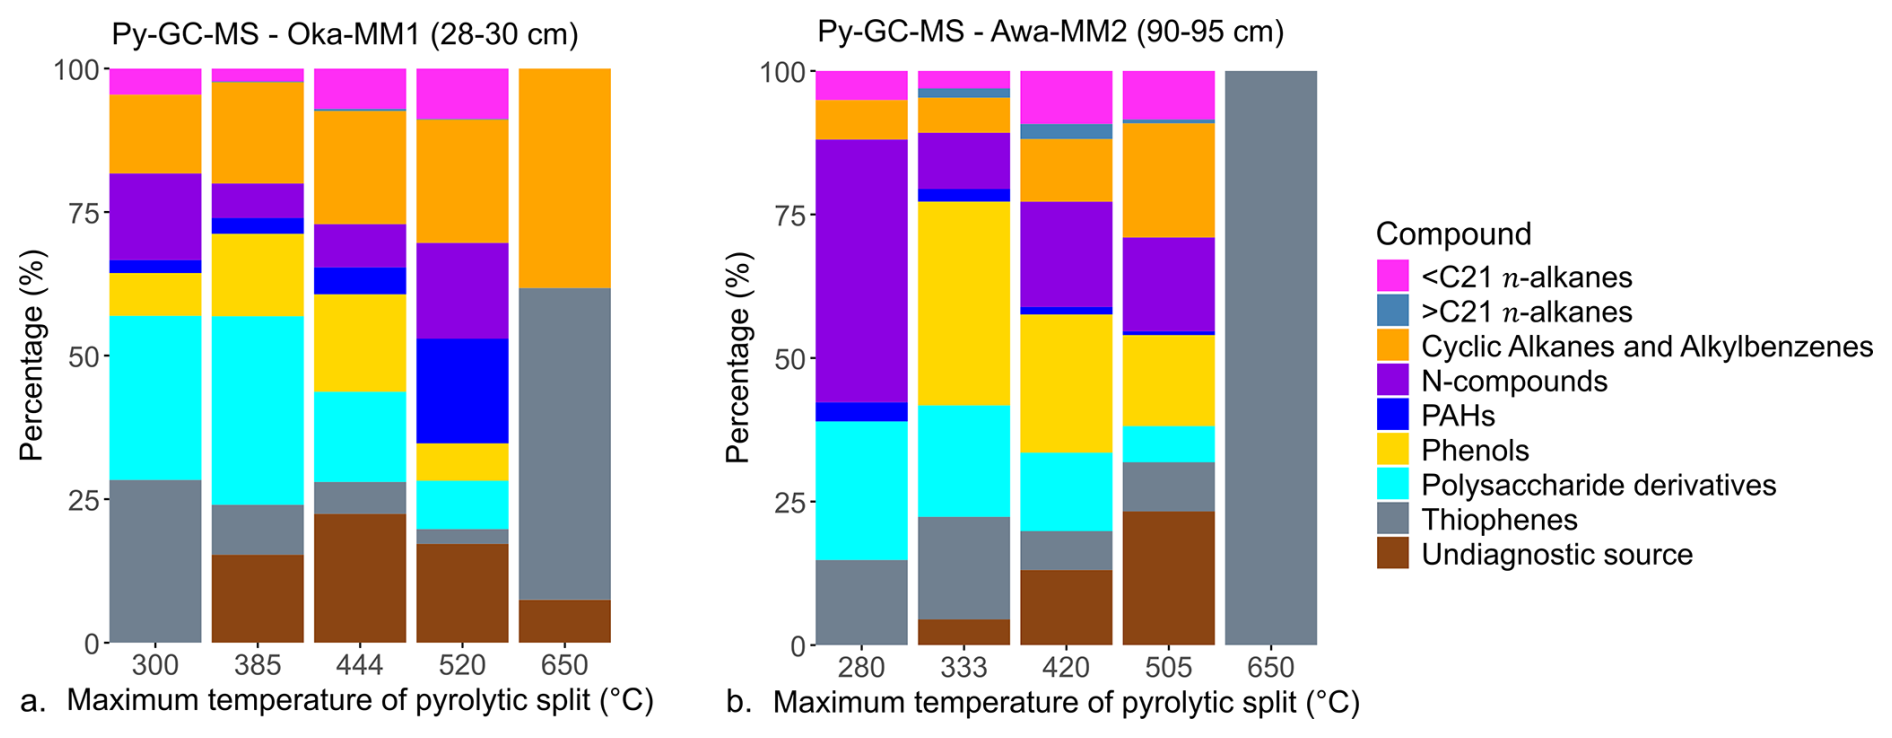
Figure 8Bar graphs of OC source composition for each pyrolytic split (°C) for (a) Okatakata sample Oka-MM1 (28–30 cm) and (b) Awanui sample Awa-MM2 (90–95 cm).
4.9 Principal Component Analysis (PCA) and hierarchical clustering
PCA of elemental, isotope, and XRF datasets for all samples (excluding δ15N, Mn, Sr, K and Ca due to their weak correlations) explained 61.3 % of the variance along PC1 and PC2 (Fig. 9a). PC1 reflects OM content with negative correlations for TOC, TN, CD, and positive correlations for δ13Corg, DBD, Si and Zr:Rb. TOC and TN displayed the highest loadings and Cos2 values, suggesting they are the most influential variables in PC1. PC2 reflects lithogenic content with positive correlations for Ti, Fe, Al, S, and δ13Corg. Ti and Fe had the highest loadings and Cos2 values, suggesting that they are the most influential variables in PC2. Hierarchical cluster analysis identified three distinct groups (Fig. 9b; Tables S9–S10). Cluster 1 (top 20 cm samples) exhibited statistically significantly (p<0.05) higher mean TOC, TN, and C:N, and lower δ13Corg, DBD, and Zr:Rb. Cluster 2 (0–50 cm) showed lower TOC, TN and C:N and higher DBD. Cluster 3 (5–95 cm) showed higher mean Al, Fe, Ti, Si, S, and δ13Corg.
PCA of elemental, isotope, XRF, and lipid biomarker datasets (excluding δ15N, Mn, Ca, Al and stanol-sterol due to their weak correlations) explained 64.3 % of the variance along PC1 and PC2 (Fig. 9c). PC1 represents lithogenic content with positive loadings for Ti, Fe, S, CPI, OEP, and Paq, and negative correlations for Sr, Si, K, and ACL. PC2 is associated with OM content, showing negative correlations for TOC, TN, CD, C:N, and positive correlations for Zr:Rb, DBD and δ13Corg. Hierarchical clustering revealed three distinct groups with statistically significant (p<0.05) differences in means (Fig. 9d; Tables S11–S12). Cluster 1 (top 15 cm from Pāuatahanui, Okatakata, and Awanui) showed higher mean TOC and TN but lower DBD, Si, and Zr:Rb. Cluster 2 (0–45 cm from Pāuatahanui and Okatakata) had lower mean TOC, TN, S, Fe, CPI, and OEP, but higher Sr, Si, K and Zr:Rb, while Cluster 3 (5–95 cm Awanui and Okatakata) exhibited higher δ13Corg, S, Fe, Ti, OEP and Paq, and lower ACL.
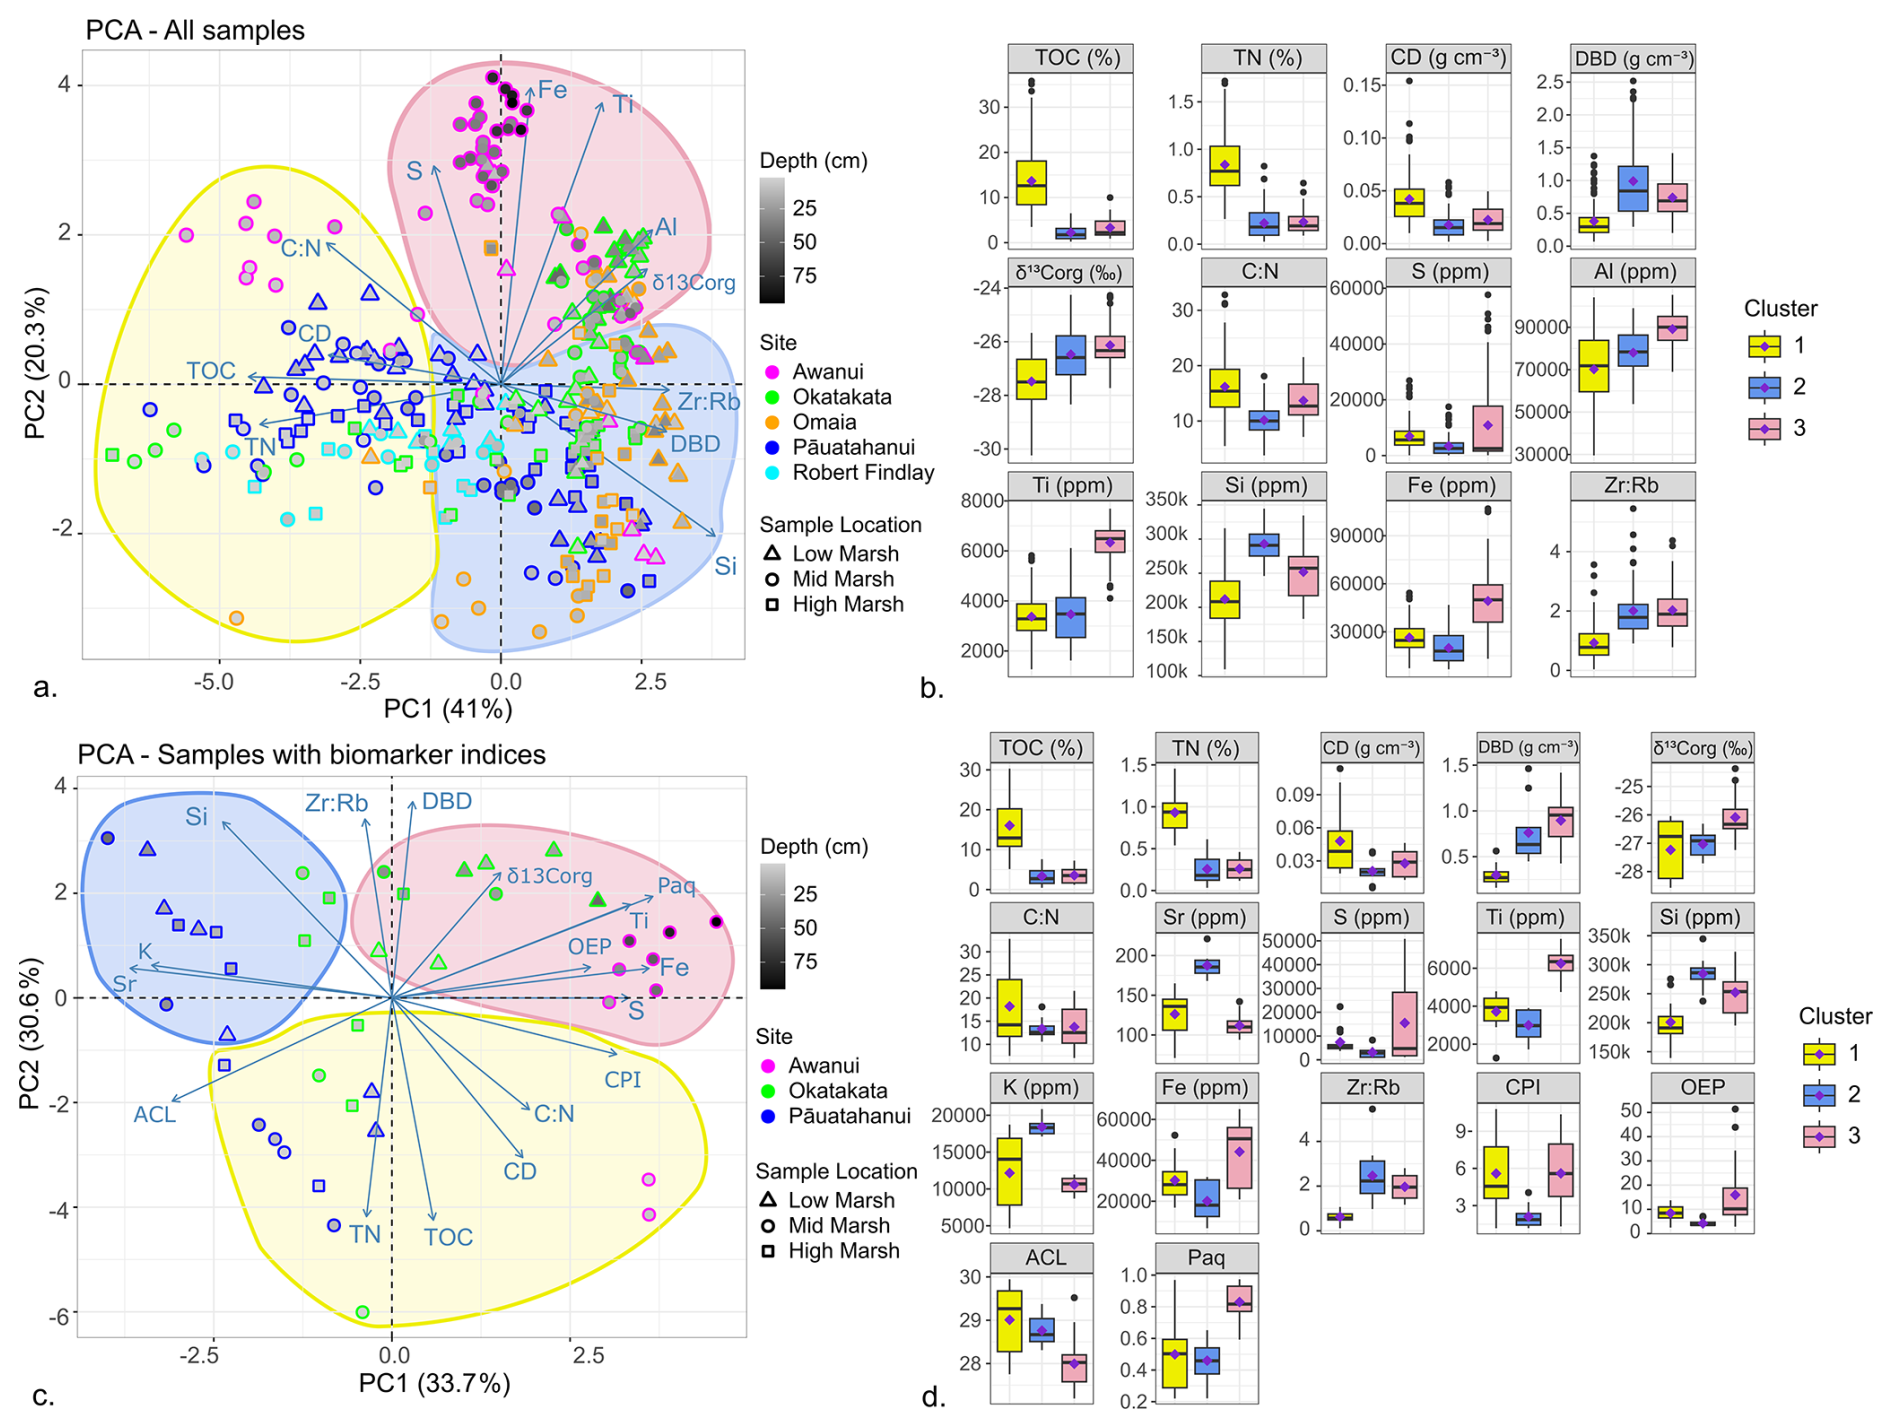
Figure 9(a) PCA plots and (b) hierarchical cluster analysis of elemental, isotopic and XRF data sets for all study sites. (c) PCA plots and (d) hierarchical cluster analysis of elemental, isotopic, XRF and biomarker data sets. Clusters identified in hierarchical cluster analysis are outlined on the PCA plots.
Data collected in this study provides important new information regarding carbon stocks and accumulation rates, and OM source and preservation at five saltmarsh locations in NZ. Soil OC stocks and CARs are highly variable, ranging from 41.3±9.4 to 92.3±66.2 Mg C ha−1 and 0.46±0.02 to 1.53±0.09 Mg C ha−1 yr−1 (mean ± SE), respectively. These values are similar to previously reported values for saltmarshes and mangroves in NZ (Bulmer et al., 2024), but are smaller compared to global saltmarsh averages (Chmura et al., 2003; Maxwell et al., 2024; Ouyang and Lee, 2014; Wang et al., 2021). Vegetation type (zonation) appears to have no influence on TOC stock (Tables S2–S7), but accumulation of OC in the top 15–20 cm of sedimentary packages, proximity to allochthonous inputs, and site-specific geochemistry all appear to influence site variability (Fig. 9). Results from carbon and nitrogen stable isotope (Fig. 6) and lipid biomarker analyses (Fig. 7) indicate substantial contributions from saltmarsh vegetation to the OC pool. OM decay increases with depth at all sites (Fig. 9). However, abundant labile plant-derived OC in the lowermost saltmarsh sediments suggests that OC buried under anoxic conditions can be preserved over longer timeframes (Fig. 8). Figure 10 provides an overview of the key findings.
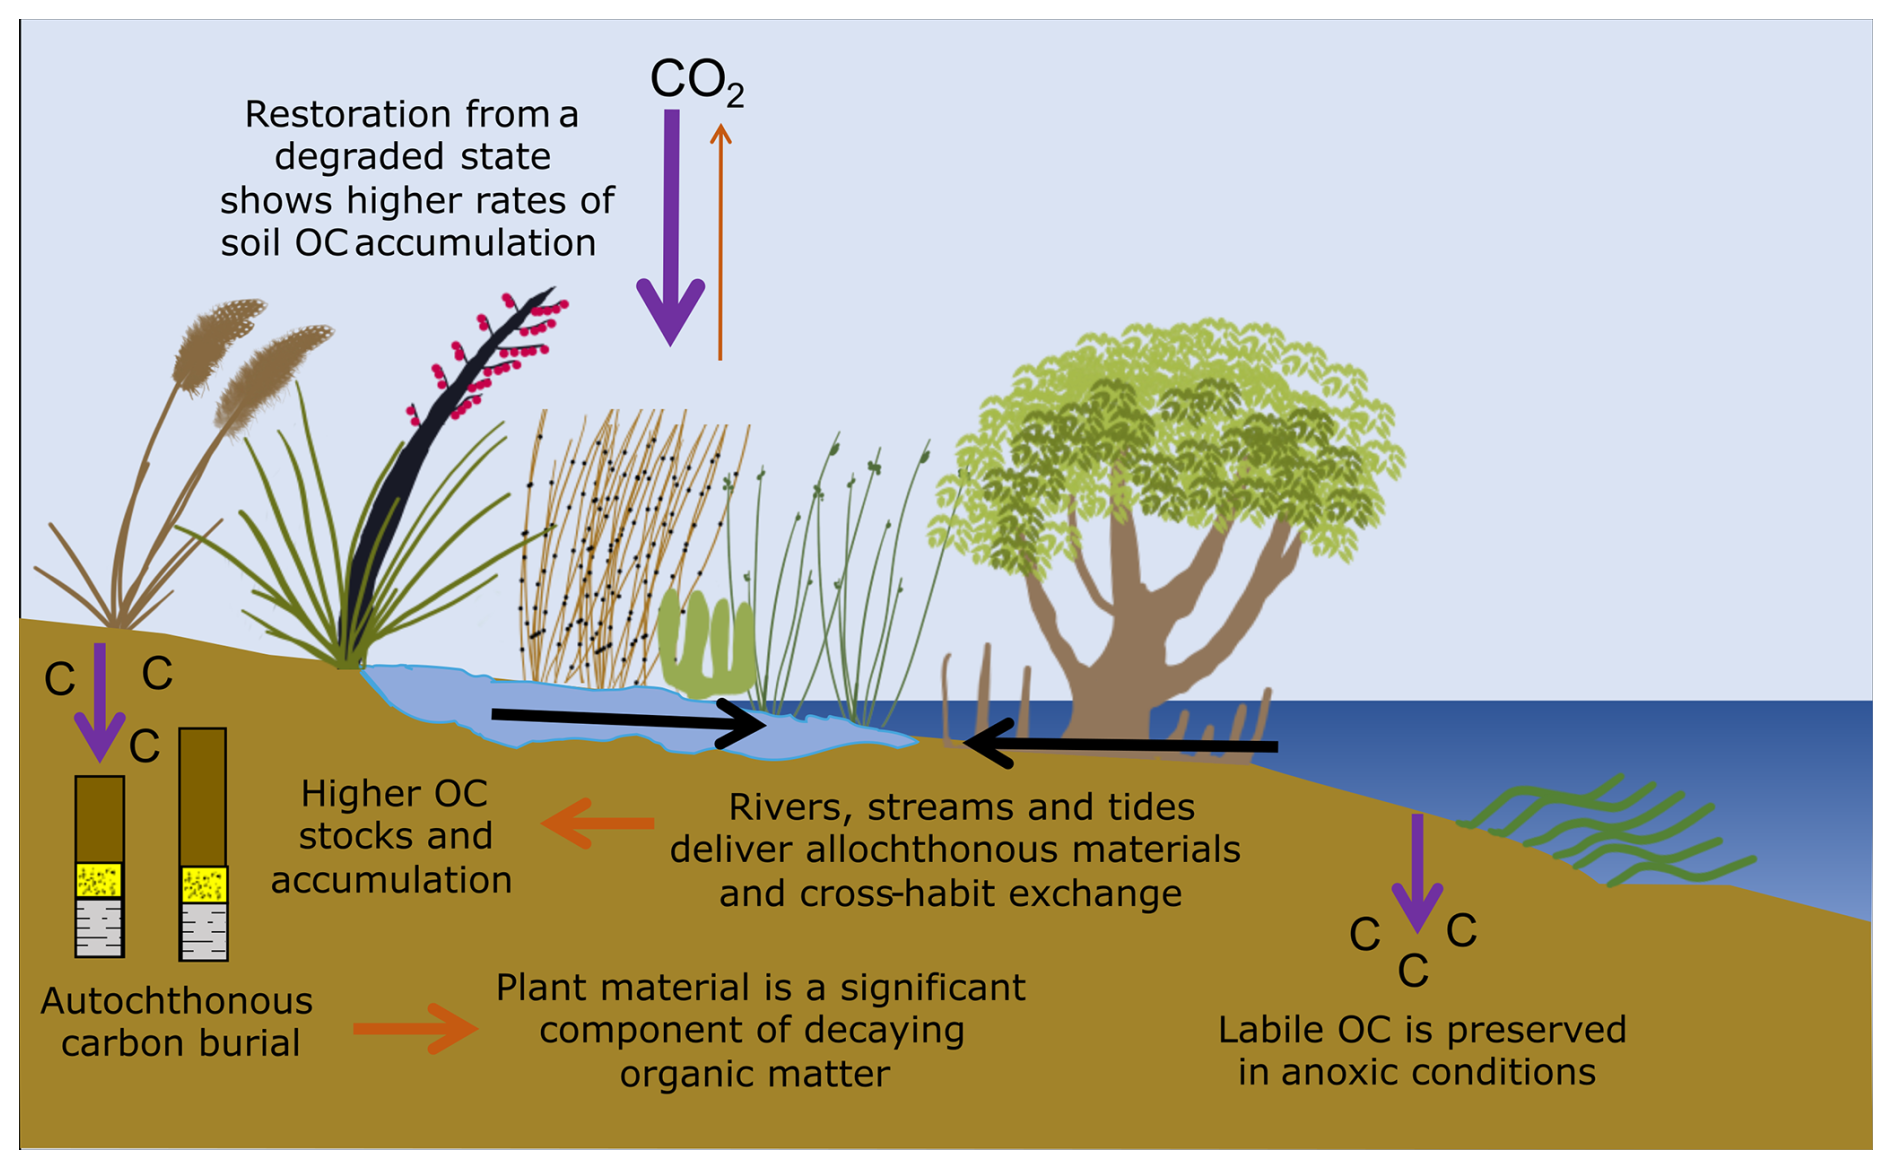
Figure 10Schematic summary of key processes controlling organic carbon storage in saltmarsh sediments. The figure was created by the authors and synthesises concepts described by Howard et al. (2023).
5.1 Carbon stocks and accumulation rates
TOC stocks at all sites except Awanui are lower than estimated global representative soil OC stocks (83.1 Mg C ha−1) derived from analysis of soils with an average depth of 30 cm (Maxwell et al., 2024). Low values at Robert Findlay are likely because saltmarsh deposits at this location are only 9 cm thick on average. Saltmarsh sediments at Okatakata and Pāuatahanui are reasonably thick (25 and 23 cm on average), and lower TOC stocks are likely due to site-specific geomorphic settings, such as lower siliciclastic inputs at Okatakata and historic anthropogenic impacts at Pāuatahanui. Saltmarsh deposits at Omaia are 23 cm thick on average, but were subject to increased OM decay rates due to greater exposure to oxygen when the marsh was converted to pasture (Ewers Lewis et al., 2018; Heuscher et al., 2005). Therefore, these TOC stocks likely reflect a higher-than-average amount of degraded marsh materials and soils that accumulated following drainage. Awanui recorded the highest mean TOC stock and the largest range in values, due to cores collected from juvenile to well-established marshes. Awanui also contains the thickest recovered sequence of saltmarsh sediments (95 cm). This deposit has a TOC stock value (421 Mg C ha−1) that is almost five times higher than the national average for saltmarsh soils of similar thickness (92.5±12.42 Mg C ha−1; Bulmer et al., 2024), and nearly double the estimated global representative stock for 1 m saltmarsh deposits (268 Mg C ha−1; Maxwell et al., 2024).
Okatakata and Awanui saltmarshes are less than 700 m apart, but the mean TOC stock at Awanui is more than double that at Okatakata. Basal sediments at both sites have similar ages (1750±32 CE at Awanui and 1759±54 CE at Okatakata), but the mean sediment accumulation rate is 1.1 mm yr−1 at Okatakata and 3.5 mm yr−1 at Awanui. Awanui saltmarsh is closer to Awanui River than Okatakata and likely receives a relatively high input of allochthonous sediment. Previous studies have also attributed higher TOC stocks in saltmarshes that are adjacent to freshwater sources to the addition of terrestrial sediments (Hansen et al., 2017; Hayes et al., 2017; Kelleway et al., 2016; Peck et al., 2025; Van de Broek et al., 2016, 2018). Higher rates of mineral sediment deposition lead to more rapid burial of OC, which enhances its preservation (Kirwan and Mudd, 2012; Van de Broek et al., 2016, 2018) and contributes to the higher stocks (Fig. 10).
Mean CARs at our study sites vary between 0.46±0.02 to 1.53±0.09 Mg C ha−1 yr−1. These rates are lower than global average values but are comparable to the NZ mean estimate of 0.89 Mg C ha yr−1 (Bulmer et al., 2024). A preliminary assessment of the restoration effect at Pāuatahanui and Robert Findlay shows increased carbon accumulation, with post-restoration rates approaching the highest observed values in each core (Figs. 10 and S11). Similar trends have been reported in restored saltmarshes in the United Kingdom and northwest Europe, where CARs increased by a factor of 1.6 following restoration (Drexler et al., 2020; Mason et al., 2022; Miller et al., 2022; Mossman et al., 2022).
Several factors can contribute to low CARs observed in saltmarshes around the world. For example, young saltmarsh deposits at locations in Great Britain (Smeaton et al., 2024) and Scandinavia (Leiva-Dueñas et al., 2024) have low mean (1.1±0.43 Mg C ha yr−1) and median (0.32 Mg C ha yr−1) accumulation rates, respectively. These low rates are attributed to the relatively young age of these marshes and the fact that relatively thin saltmarsh deposits form under temperate climatic conditions. Saltmarsh deposits in the southwest Atlantic (Martinetto et al., 2023) also have low mean carbon burial rates (0.48 Mg C ha−1 yr−1) that are likely caused by biological activity, including bioturbation by burrowing crabs that can mix and oxygenate the soils, causing OC degradation. The rate of relative sea level rise can also affect accumulation rates. Coastal sediments require accommodation space in which to accumulate, and this accommodation space is created as relative sea level rises (Rogers et al., 2019, 2022). Saltmarsh deposits in NZ seldom exceed 0.5 meters in thickness (Gehrels et al., 2008), partly because sea level has remained relatively stable across the Southern Hemisphere over the past 6 kyr (Rogers et al., 2023). All saltmarsh deposits examined in this study are young, bioturbated, and accumulated at locations where relative sea level has remained relatively stable. These factors all contribute to relatively low carbon stocks and accumulation rates.
5.2 Sources of organic matter in saltmarshes
Knowing the source of OM in saltmarsh soils can help us understand processes that drive carbon accumulation and can better inform the carbon mitigation potential of these ecosystems. δ13Corg and C:N data indicate that the OC accumulated in saltmarsh soils examined in this study is primarily derived from a combination of saltmarsh C3 plants and estuarine biota (Fig. 6). Sediments at Okatakata, Omaia and Awanui also include OM from freshwater algae that was most likely transported to the sites via plumes from the Awanui River. Omaia sediments contain carbon derived from the widest range of sources, which likely reflects the influence of human activity, including drainage and farming, which mixed older marine sediments with saltmarsh deposits, younger topsoil and pasture vegetation. Although δ13C signatures presented in this study typically indicate C3 plant inputs, these values cannot distinguish between saltmarsh vegetation, which is also C3 in NZ, and other terrestrial C3 plants, which include all indigenous NZ plants and at least some of the commercial exotic crops, such as rye grass Lolium perenne. Because all cores, except at Omaia, were collected within sites dominated by saltmarsh species (with surrounding mangroves at all sites except Pāuatahanui) and little/no adjacent forestry or terrestrial vegetation, we interpret the C3 signal as primarily saltmarsh derived. However, we acknowledge that contributions from transported terrestrial material cannot be excluded, as tidal mixing and river discharge can deliver allochthonous marine- and terrigenous-derived OM (Alongi, 1997; Bulmer et al., 2020; Pondell and Canuel, 2022; Smeaton et al., 2024).
Given the overlap in observed isotopic and elemental ratios, it is challenging to quantify the relative contribution of allochthonous and autochthonous sources without knowing the specific δ13Corg, δ15N and C:N values for each end-member and their decomposition rates (Kumar et al., 2020b; Wang et al., 2003). These data were not collected in the study. However, lipid biomarker analysis offers additional insights into the origins of OM (e.g., Naeher et al., 2022; Peters et al., 2007). Odd-chain-length n-alkanes in the range C21 to C33 dominate in Pāuatahanui (98 %), Okatakata (99 %), and Awanui (99 %) and indicate epicuticular waxes from saltmarsh plants (Fig. 7). Biomarkers from marine and freshwater algae, bacteria and/or other microorganisms (< C20) (Cranwell, 1981; Eglinton and Hamilton, 1967; Ficken et al., 2000; Kumar et al., 2019; Meyers, 1997; Zhang et al., 2024) were insignificant across all sites. Positive correlations between CPI and OEP with values >3 in surface sediments also suggest that saltmarsh vegetation contributes to the sedimentary OM (Figs. 9 and 10; Kennicutt et al., 1987; Zhao et al., 2024).
Biomarkers can also help identify which individual saltmarsh plant species the OM originates from. For example, the dominance of C23 and C25 n-alkanes and Paq values >0.6 at Okatakata and Awanui suggest soil organic material is derived from Salicornia quinqueflora (Tanner et al., 2007, 2010). Other aquatic plants that could be contributing to the mid-chain n-alkanes include moss species Kindbergia spp. and Polytrichum spp. (Ortiz et al., 2016), both of which were observed in low and mid marsh areas. It is also possible that floating macrophytes are delivered via tidal/riverine inputs; however, these were not observed during data collection. In contrast, dominant peaks at C27, C29, C31 and C33, and Paq<0.6 at Pāuatahanui reflect emergent macrophytes and salt-tolerant terrestrial plants. Studies have demonstrated that C3 saltmarsh grass, rush, sedge and shrub species exhibit maximum abundances in the C27–C33 range, consistent with the n-alkane distributions, as well as ACL values of 27–29 (Eley et al., 2016; Ferreira et al., 2009; Ortiz et al., 2011; Pondell and Canuel, 2022; Tanner et al., 2007, 2010; Wang et al., 2003; Zhang and Wang, 2019). PCA plots confirm these observations as ACL and Paq display opposite trends, and an increase in Paq and a decrease in ACL indicate dominance of non-emergent macrophytes (Fig. 9). Upstream terrestrial plants, such as Pinus radiata can also be a source of C29 n-alkane (Gonzalez-Vila et al., 2003; Kumar et al., 2020a). However, there are no pine plantations adjacent to the study sites, and terrestrial plant debris/litter was not observed during fieldwork. Seagrass species may contribute C29 n-alkanes to the OC pool (Jaffé et al., 2001; Kumar et al., 2020a). Seagrass habitats are present at Pāuatahanui (Zabarte-Maeztu et al., 2020), and Rangaunu Harbour has one of the largest seagrass habitats in the country (Bulmer et al., 2024). Therefore, cross-habitat exchange could contribute to the composition of the OC pool (Bulmer et al., 2020).
Furthermore, plant-derived OC tends to be more resistant to microbial breakdown than OC from algae and bacteria, which may result in its preferential preservation in sediments (Schmidt et al., 2011; Zhang et al., 2024). Clearly, the estimated CARs presented in this study reflect both autochthonous and allochthonous carbon input and do not reflect the amount of OC directly sequestered from the atmosphere through in-situ production (Smeaton et al., 2024). However, lipid biomarker analysis demonstrates that saltmarsh vegetation makes up a substantial portion of OM at the studied sites, and burial and preservation of autochthonous OM contribute to the long-term carbon storage capacity of saltmarshes.
5.3 Organic matter preservation
Strong positive correlation between TOC and TN at all sites suggests they are likely influenced by similar geochemical processes (Fig. 9; Brandini et al., 2022; Zhang et al., 2024). Surface samples generally exhibit higher mean OM contents (TOC, TN, CD, C:N) and lower mean concentrations of lithogenic components (Si, K, Ti, Fe, Zr:Rb). This indicates that young, finer-grained, organic-rich surface sediments with fresh OC are predominant across study sites (Kelleway et al., 2017; Krüger et al., 2024; Mazarrasa et al., 2023). Finer-grained samples typically have higher OC content because a higher proportion of silt and clay in sediments enhances preservation of OM (Mazarrasa et al., 2023; Meyers, 1994; Russell et al., 2023). In contrast, older, deeper, coarser-grained samples generally show lower OM, higher lithogenic content, enriched δ13Corg, higher stanol-sterol values, lower C:N ratios, and lower CPI values of 1–2. These characteristics suggest that OM has been preferentially utilised and decomposed by microbial activity over time, increasing the lithogenic contribution in the OC pool (Benner et al., 1987; Jaffé et al., 2001; Krüger et al., 2024; Zhao et al., 2024). Omaia shows enriched δ13Corg, low TOC, TN, and CD, and increased DBD values in the majority of samples, reflecting the degraded and compacted nature of the soils.
At Awanui and Okatakata, deeper samples display higher OM content alongside sulphur, suggesting preservation of OC under sulphur-rich anoxic conditions (Antler et al., 2019; Froelich et al., 1979; Thamdrup et al., 1994). This aligns with the observation that oxic and suboxic degradation of OC is restricted to shallow depths (<20 cm), and deeper soil horizons remain more consistently anaerobic, promoting preservation (Howarth and Teal, 1979; Spivak et al., 2019). However, the dominance of aerobic or anaerobic conditions also depends on the position of the saltmarsh in the tidal frame. Locations that are flooded less frequently tend to oxidise to depths up to 30 cm below the surface (e.g., Mueller et al., 2019). In these “drier” locations, other factors, such as microbial community compositions, formation of organo-mineral complexes, and physical protection by mineral aggregates, may control OM preservation (Barber et al., 2017; Macreadie et al., 2025; Spivak et al., 2019). Samples recovered from lower depths in the cores taken at Awanui and Okatakata also have the highest Ti, Al, and Fe contents. Our age-depth models indicate these sediments were deposited when flood control and drainage works were carried out in the Awanui River catchment between 1916 and 1936. These activities likely increased downstream transport of terrestrial sediment to the harbour (Cathcart, 2005). It is possible that deposition of mineral sediments and their geochemical interactions with OC (e.g., OC binding with iron oxides to form stable Fe-OC complexes) enhanced OM preservation (Barber et al., 2017; Macreadie et al., 2025).
Isotopic mixing model results from RPO-AMS analysis provide a first-order approximation of the relative contributions of labile, syndepositional versus older, recalcitrant OC in the soils. The results suggest a relative proportion of two-thirds labile and one-third recalcitrant OC at Okatakata and Awanui basal samples for the lowest-temperature split (Table 4). RPO-AMS split age profiles of both basal samples at Okatakata and Awanui show a wide range of ages that are older than those estimated using 210Pb age-depth models, representing the mixture of labile and recalcitrant carbon delivered to the site. Awanui has much older carbon compared to Okatakata. This is consistent with the core's proximity to the river, which delivers allochthonous material from the upper catchment.
Py-GC-MS results provide additional insights into the OM composition in samples that were also processed for RPO-AMS ages. Lower-temperature splits generated from basal samples from Okatakata (100 to 300 and 300 to 385 °C) and Awanui (100 to 280 and 280 to 333 °C) show higher relative contributions of syndepositional OC. These lower-temperature splits release more labile and volatile compounds, which are more closely associated with the sources and state of syndepositional carbon (Ginnane et al., 2024; Rosenheim et al., 2008). For example, furans indicate the presence of higher-molecular-weight polysaccharides such as cellulose, a major carbohydrate constituent of plant cell walls that is readily consumed by microbes (Carr et al., 2010; Kaal et al., 2020). Further heating during pyrolysis (typically >400 °C) breaks down the macromolecular structure of OM compounds, releasing more recalcitrant and older reworked OM (Ginnane et al., 2024; Maier et al., 2025). Phenols, for instance, reflect lignin, a macromolecular compound found almost exclusively in the cell walls of terrestrial vascular plants, which is more resistant to OM degradation (Grandy and Neff, 2008; Kaal et al., 2020; Zhang and Wang, 2019). Higher-temperature pyrolytic splits for Okatakata and Awanui also produce higher relative abundances of cyclic alkanes/alkylbenzenes and other undiagnostic or refractory compounds (Fig. 8). Collectively, Py-GC-MS results indicate preservation of both labile and recalcitrant saltmarsh plant-derived OC under anoxic conditions at Okatakata and Awanui (Figs. 8 and 10; González-Pérez et al., 2012). However, N-containing pyrolysis products (e.g., indole, benzonitrile, pyridine) in coastal wetland soils have also been attributed to amino acids and proteins from algae and phytoplankton (Carr et al., 2010; Kaal et al., 2020), as well as bacterial biomass within soil OM (Ferreira et al., 2009; Zhang and Wang, 2019; Zhu et al., 2016). TLE and Py-GC-MS analyses of the basal samples suggest ≤1 % and ≤5 % contributions from marine source n-alkanes at Okatakata and Awanui, respectively (Figs. 7 and 8), indicating that N-compounds in the samples likely correspond to microbial biomass. These findings suggest some degree of post-depositional microbial decomposition, but in-situ plant biomass preserved under anoxic conditions is evident in the signal.
5.4 Implications and future research
This study provides the first integrated assessment of carbon stocks, accumulation rates, and OM source and preservation across a latitudinal gradient of saltmarshes in NZ. Our findings reveal that carbon accumulation and preservation are strongly influenced by site-specific factors such as land use history, sediment characteristics, and allochthonous inputs. Notably, we demonstrate that even relatively young saltmarsh deposits can store substantial amounts of carbon when conditions favour OM preservation. Our results also corroborate previous research showing that soil OM properties, carbon stocks and accumulation rates vary widely with geomorphic setting, land use history, tidal regime, salinity, vegetation type, local lithologic input, and soil depth (e.g., Ewers Lewis et al., 2019; Hansen et al., 2017; Kelleway et al., 2016; Martinetto et al., 2023; Martins et al., 2022; McMahon et al., 2023; Owers et al., 2020; Ruiz-Fernández et al., 2018; Russell et al., 2023; Saintilan et al., 2013). Blue carbon sampling strategies must consider these sources of variability to achieve accurate assessment. Our results suggest that allochthonous inputs, particularly in locations proximal to freshwater sources such as rivers, play a critical role in enhancing carbon accumulation and preservation. The study also highlights the importance of measuring OC to the base of the saltmarsh deposit to capture the full extent of carbon storage and preservation processes. Future research could explore the role of other environmental variables such as distance to tidal creeks and freshwater sources, vegetation biomass, elevation, inundation frequency and duration, salinity and sediment composition on OM dynamics and carbon stocks in NZ saltmarshes (e.g., Hansen et al., 2017; Janousek et al., 2025; McMahon et al., 2023; Puppin et al., 2024; Russell et al., 2023).
These findings have practical implications for blue carbon assessment methodologies. Current blue carbon methodologies, such as those used by Verra, often require removal of allochthonous material to estimate accumulation rates (Needelman et al., 2018). Results from this and other recent studies (e.g., Li et al., 2025; Peck et al., 2025) suggest that allochthonous inputs can enhance long-term preservation of OC. Furthermore, allochthonous carbon transported to restored wetlands in tidally influenced locations is considered “additional” because its preservation results directly from the restoration activities (Lovelock et al., 2023a, b). Strict exclusion of allochthonous contribution to saltmarsh OM, when these inputs are not already accounted elsewhere, may underestimate the true sequestration potential of saltmarsh ecosystems. Streamlined protocols that balance scientific rigour with practical requirements are needed to improve carbon mitigation estimates and scale BCE restoration globally.
This study successfully quantified carbon stocks and accumulation rates across five saltmarsh sites in NZ, revealing significant variability influenced by site-specific factors such as geomorphic settings, land use, and proximity to allochthonous inputs. Mean carbon stocks ranged from 41.3±9.4 to 92.3±66.2 Mg C ha−1, and mean accumulation rates ranged from 0.46±0.02 to 1.53±0.09 Mg C ha−1 yr−1 (mean ± SE). Although these values are lower than global averages, they are comparable to previous national estimates for NZ. Stable isotopes, lipid biomarkers, and RPO-AMS combined with Py-GC-MS analyses provided complementary insights into the source and composition of soil OM. Together, these analyses indicate that in-situ saltmarsh vegetation is a major contributor to the OM pool and that plant-derived OC remains preserved in saltmarsh soils for several centuries. Overall, these findings improve national estimates of carbon accumulation in saltmarsh ecosystems and advance the methodological approaches needed to assess the potential for BCEs to capture carbon and mitigate climate change impacts.
To view data for this article, please visit https://doi.org/10.5281/zenodo.17790165 (Albot et al., 2026).
The supplement related to this article is available online at https://doi.org/10.5194/bg-23-2155-2026-supplement.
OA: conceptualisation, funding acquisition, project administration, investigation, methodology, data curation, formal analysis, visualisation, writing (original draft preparation, review and editing); JR: conceptualisation, supervision, methodology, writing (review and editing); RL: conceptualisation, funding acquisition, supervision, writing (review and editing); SN: investigation, methodology, formal analysis, visualisation, writing (review and editing); DK: investigation, visualisation, writing (review); CG: investigation, writing (review and editing); JT: supervision, writing (review); MB: investigation, writing (review); CW: investigation; JD: investigation; JC: investigation; AP: investigation.
At least one of the (co-)authors is a member of the editorial board of Biogeosciences. The peer-review process was guided by an independent editor, and the authors also have no other competing interests to declare.
Publisher's note: Copernicus Publications remains neutral with regard to jurisdictional claims made in the text, published maps, institutional affiliations, or any other geographical representation in this paper. The authors bear the ultimate responsibility for providing appropriate place names. Views expressed in the text are those of the authors and do not necessarily reflect the views of the publisher.
We thank Jay Streatfield for his assistance with fieldwork and Michael Lechermann (PHF Science) for the generation of 210Pb data. Rewi Newnham, Gavin Dunbar, Jane Chewings, Dez Tessler (Victoria University of Wellington), and Joe Prebble and Kate Clark (ESNZ) are thanked for their valuable discussions, help with securing field gear, sample storage space, laboratory work oversight and health and safety planning. We thank Pūkorokoro Miranda Naturalists Trust, the Department of Conservation and the landowners of Omaia Island for allowing sampling access. We acknowledge the study was conducted on the ancestral lands of Ngāi Takoto, Ngāti Pāoa and Ngāti Toa.
This research was supported by the Ministry of Business Innovation and Employment as part of the NZ SeaRise (Contract ID: RTVU1705) and Our Changing Coast (Contract ID: RTVU2201) Programmes and GNS Science Global Change through Time Programme (Strategic Science Investment Fund, Contract ID: C05X1702), and student grants from the Department of Conservation (Project Number: E4186) and The Nature Conservancy (Project Number: P120996).
This paper was edited by Yuan Shen and reviewed by Timothy Thomson and one anonymous referee.
Albot, O., Ratcliffe, J., Levy, R., Naeher, S., King, D., Ginnane, C., Jocelyn, T., Banta, M. J. I., Wood, C., Dahl, J., Cooper, J., and Phillips, A.: Characterisation and quantification of organic carbon burial using a multiproxy approach in saltmarshes from Aotearoa New Zealand, Zenodo [data set], https://doi.org/10.5281/zenodo.17790165, 2026.
Alongi, D. M.: Coastal ecosystem processes, CRC Press, 1st ed., ISBN 978-0367400798, 1997.
Antler, G., Mills, J. V., Hutchings, A. M., Redeker, K. R., and Turchyn, A. V.: The sedimentary carbon-sulfur-iron interplay–A lesson from East Anglian salt marsh sediments, Front. Earth Sci., 7, 140, https://doi.org/10.3389/feart.2019.00140, 2019.
Appleby, P. G.: Dating recent sediments by 210Pb: problems and solutions, Seminar on dating of sediment and determination of sedimentation rate, Helsinki, Finland, 1–3 April 1997, paper presentation, https://inis.iaea.org/records/vtsmx-fvz88 (last access: 18 November 2024), 1997.
Arias-Ortiz, A., Masqué, P., Garcia-Orellana, J., Serrano, O., Mazarrasa, I., Marbà, N., Lovelock, C. E., Lavery, P. S., and Duarte, C. M.: Reviews and syntheses: 210Pb-derived sediment and carbon accumulation rates in vegetated coastal ecosystems – setting the record straight, Biogeosciences, 15, 6791–6818, https://doi.org/10.5194/bg-15-6791-2018, 2018.
Barber, A., Brandes, J., Leri, A., Lalonde, K., Balind, K., Wirick, S., Wang, J., and Gélinas, Y.: Preservation of organic matter in marine sediments by inner-sphere interactions with reactive iron, Sci. Rep., 7, 366, https://doi.org/10.1038/s41598-017-00494-0, 2017.
Benner, R., Fogel, M. L., Sprague, E. K., and Hodson, R. E.: Depletion of 13C in lignin and its implications for stable carbon isotope studies, Nature, 329, 708–710, https://doi.org/10.1038/329708a0, 1987.
Bertram, C., Quaas, M., Reusch, T. B. H., Vafeidis, A. T., Wolff, C., and Rickels, W.: The blue carbon wealth of nations, Nat. Clim. Change, 11, 704–709, https://doi.org/10.1038/s41558-021-01089-4, 2021.
Blaauw, M., Christen, J. A., Aquino-Lopez, M. A., Esquivel-Vazquez, J., Gonzalez, O. M., Belding, T., Theiler, J., Gough, B., and Karney, C.: Bayesian Age-Depth Modelling of Cores Dated by Pb-210, CRAN Package `rplum', https://cran.r-project.org/web/packages/rplum/rplum.pdf (last access: 11 May 2025), 2024.
Brandini, N., da Costa Machado, E., Sanders, C. J., Cotovicz, L. C., Bernardes, M. C., and Knoppers, B. A.: Organic matter processing through an estuarine system: Evidence from stable isotopes (δ13C and δ15N) and molecular (lignin phenols) signatures, Estuar. Coast. Shelf Sci., 265, 107707, https://doi.org/10.1016/J.ECSS.2021.107707, 2022.
Bray, E. E. and Evans, E. D.: Distribution of n-paraffins as a clue to recognition of source beds, Geochim. Cosmochim. Ac., 22, 2–15, https://doi.org/10.1016/0016-7037(61)90069-2, 1961.
Broz, A., Aguilar, J., Xu, X., and Silva, L. C. R.: Accumulation of radiocarbon in ancient landscapes: A small but significant input of unknown origin, Sci. Rep., 13, 7476, https://doi.org/10.1038/s41598-023-34080-4, 2023.
Bulmer, R. H., Stephenson, F., Jones, H. F. E., Townsend, M., Hillman, J. R., Schwendenmann, L., and Lundquist, C. J.: Blue Carbon Stocks and Cross-Habitat Subsidies, Front. Marine Sci., 7, 380, https://doi.org/10.3389/fmars.2020.00380, 2020.
Bulmer, R. H., Stewart-Sinclair, P. J., Lam-Gordillo, O., Mangan, S., Schwendenmann, L., and Lundquist, C. J.: Blue carbon habitats in Aotearoa New Zealand – opportunities for conservation, restoration, and carbon sequestration, Restoration Ecology, 32, e14225, https://doi.org/10.1111/rec.14225, 2024.
Carr, A. S., Boom, A., Chase, B. M., Roberts, D. L., and Roberts, Z. E.: Molecular fingerprinting of wetland organic matter using pyrolysis-GC/MS: an example from the southern Cape coastline of South Africa, J. Paleolimnol., 44, 947–961, https://doi.org/10.1007/s10933-010-9466-9, 2010.
Cathcart, B.: Awanui River Flood Management Plan, Northland Regional Council, Whangarei, New Zealand, https://www.nrc.govt.nz/media/orsjlwtd/awanuiriverfloodmanagementplanv50.pdf (last access: 25 June 2025), 2005.
Chmura, G. L., Anisfeld, S. C., Cahoon, D. R., and Lynch, J. C.: Global carbon sequestration in tidal, saline wetland soils, Global Biogeochem. Cycles, 17, 1111–1123, https://doi.org/10.1029/2002GB001917, 2003.
Conwell, R.: Pauatahanui Wildlife Reserve – the First 25 years, Nature Space, Wellington, New Zealand, http://www.naturespace.org.nz/sites/default/files/ document/attachments/PAUATAHANUI WILDLIFE MANAGEMENT RESERVE FIRST 25 YEARS.pdf (last access: 25 June 2025), 2010.
Cranwell, P. A.: Diagenesis of free and bound lipids in terrestrial detritus deposited in a lacustrine sediment, Org. Geochem., 3, 79–89, https://doi.org/10.1016/0146-6380(81)90002-4, 1981.
Croudace, I. W. and Rothwell, R. G.: Micro-XRF Studies of Sediment Cores: Applications of a non-destructive tool for the environmental sciences, Springer, vol. 17, https://doi.org/10.1017/S0033822200040121, 2015.
Derrien, M., Yang, L., and Hur, J.: Lipid biomarkers and spectroscopic indices for identifying organic matter sources in aquatic environments: A review, Water Res., 112, 58–71, https://doi.org/10.1016/J.WATRES.2017.01.023, 2017.
Donahue, D. J., Linick, T. W., and Jull, A. J. T.: Isotope-ratio and background corrections for accelerator mass spectrometry radiocarbon measurements, Radiocarbon, 32, 135–142, https://doi.org/10.1017/S0033822200040121, 1990.
Drexler, J. Z., Davis, M. J., Woo, I., and De La Cruz, S.: Carbon sources in the sediments of a restoring vs. historically unaltered salt marsh, Estuaries and Coasts, 43, 1345–1360, https://doi.org/10.1007/s12237-020-00748-7, 2020.
Eglinton, G. and Hamilton, R. J.: Leaf Epicuticular Waxes: The waxy outer surfaces of most plants display a wide diversity of fine structure and chemical constituents, Science, 156, 1322–1335, https://doi.org/10.1126/science.156.3780.1322, 1967.
Eley, Y., Dawson, L., and Pedentchouk, N.: Investigating the carbon isotope composition and leaf wax n-alkane concentration of C3 and C4 plants in Stiffkey saltmarsh, Norfolk, UK, Org. Geochem., 96, 28–42, https://doi.org/10.1016/j.orggeochem.2016.03.005, 2016.
Ewers Lewis, C. J., Carnell, P. E., Sanderman, J., Baldock, J. A., and Macreadie, P. I.: Variability and vulnerability of coastal `blue carbon' stocks: a case study from southeast Australia, Ecosystems, 21, 263–279, https://doi.org/10.1007/s10021-017-0150-z, 2018.
Ewers Lewis, C. J., Baldock, J. A., Hawke, B., Gadd, P. S., Zawadzki, A., Heijnis, H., Jacobsen, G. E., Rogers, K., and Macreadie, P. I.: Impacts of land reclamation on tidal marsh `blue carbon' stocks, Sci. Total Environ., 672, 427–437, https://doi.org/10.1016/j.scitotenv.2019.03.345, 2019.
Ferreira, F. P., Vidal-Torrado, P., Buurman, P., Macias, F., Otero, X. L., and Boluda, R.: Pyrolysis-gas chromatography/mass spectrometry of soil organic matter extracted from a Brazilian mangrove and Spanish salt marshes, Soil Sci. Soc. Am. J., 73, 841–851, https://doi.org/10.2136/sssaj2008.0028, 2009.
Ficken, K. J., Li, B., Swain, D. L., and Eglinton, G.: An n-alkane proxy for the sedimentary input of submerged/floating freshwater aquatic macrophytes, Org. Geochem., 31, 745–749, https://doi.org/10.1016/S0146-6380(00)00081-4, 2000.
Friess, D. A., Howard, J., Huxham, M., Macreadie, P. I., and Ross, F.: Capitalizing on the global financial interest in blue carbon, PLOS Climate, 1, e0000061, https://doi.org/10.1371/journal.pclm.0000061, 2022.
Froelich, P., Klinkhammer, G. P., Bender, M. L., Luedtke, N. A., Heath, G. R., Cullen, D., Dauphin, P., Hammond, D., Hartman, B., and Maynard, V.: Early oxidation of organic matter in pelagic sediments of the eastern equatorial Atlantic: suboxic diagenesis, Geochim. Cosmochim. Ac., 43, 1075–1090, https://doi.org/10.1016/0016-7037(79)90095-4, 1979.
Gaskell, S. J. and Eglinton, G.: Sterols of a contemporary lacustrine sediment, Geochim. Cosmochim. Ac., 40, 1221–1228, https://doi.org/10.1016/0016-7037(76)90157-5, 1976.
Gehrels, W. R., Hayward, B. W., Newnham, R. M., and Southall, K. E.: A 20th century acceleration of sea-level rise in New Zealand, Geophys. Res. Lett., 35, L02717, https://doi.org/10.1029/2007GL032632, 2008.
Gerbeaux, P.: The Ramsar Convention: a review of wetlands management in New Zealand, Pacific Ecologist, 4, 37–41, 2003.
Ginnane, C. E., Turnbull, J. C., Naeher, S., Rosenheim, B. E., Venturelli, R. A., Phillips, A. M., Reeve, S., Parry-Thompson, J., Zondervan, A., and Levy, R. H., Yoo, K.-C., Dunbar, G., Calkin, T., Escutia, C., and Gutierrez Pastor, J.: Advancing Antarctic sediment chronology through combined ramped pyrolysis oxidation and Pyrolysis-GC-MS, Radiocarbon, 66, 1120–1139, https://doi.org/10.1017/RDC.2023.116, 2024.
Goff, J. R. and Chagué-Goff, C.: A late Holocene record of environmental changes from coastal wetlands: Abel Tasman National Park, New Zealand, Quaternary Int., 56, 39–51, https://doi.org/10.1016/S1040-6182(98)00016-0, 1999.
Goldstein, S. J. and Stirling, C. H.: Techniques for measuring uranium-series nuclides: 1992–2002, Rev. Mineral. Geochem., 52, 23–57, https://doi.org/10.2113/0520023, 2003.
González-Pérez, J. A., Chabbi, A., de La Rosa, J. M., Rumpel, C., and González-Vila, F. J.: Evolution of organic matter in lignite-containing sediments revealed by analytical pyrolysis (Py–GC–MS), Org. Geochem., 53, 119–130, https://doi.org/10.1016/j.orggeochem.2012.08.001, 2012.
Gonzalez-Vila, F. J., Polvillo, O., Boski, T., Moura, D., and de Andres, J. R.: Biomarker patterns in a time-resolved Holocene/terminal Pleistocene sedimentary sequence from the Guadiana river estuarine area (SW Portugal/Spain border), Org. Geochem., 34, 1601–1613, https://doi.org/10.1016/j.orggeochem.2003.08.006, 2003.
Grandy, A. S. and Neff, J. C.: Molecular C dynamics downstream: the biochemical decomposition sequence and its impact on soil organic matter structure and function, Sci. Total Environ., 404, 297–307, https://doi.org/10.1016/j.scitotenv.2007.11.013, 2008.
Grapes, R. and Downes, G.: The 1855 Wairarapa, New Zealand, earthquake: analysis of historical data, Bulletin of the New Zealand Society for Earthquake Engineering, 30, 271–368, https://doi.org/10.5459/bnzsee.30.4.271-368, 1997.
Grapes, R. H. and Downes, G. L.: Charles Lyell and the great 1855 earthquake in New Zealand: first recognition of active fault tectonics, J. Geol. Soc., 167, 35–47, https://doi.org/10.1144/0016-76492009-104, 2010.
Guardians of Pāuatahanui Inlet: The Inlet, https://www.gopi.org.nz/the-inlet/, last access: 18 August 2022, 2021.
Hansen, K., Butzeck, C., Eschenbach, A., Gröngröft, A., Jensen, K., and Pfeiffer, E.-M.: Factors influencing the organic carbon pools in tidal marsh soils of the Elbe estuary (Germany), Journal of Soils and Sediments, 17, 47–60, https://doi.org/10.1007/s11368-016-1500-8, 2017.
Hayes, M. A., Jesse, A., Hawke, B., Baldock, J., Tabet, B., Lockington, D., and Lovelock, C. E.: Dynamics of sediment carbon stocks across intertidal wetland habitats of Moreton Bay, Australia, Global Change Biology, 23, 4222–4234, https://doi.org/10.1111/gcb.13722, 2017.
Heath, R. A., Shakespeare, B. S., and Greig, M. J. N.: Physical oceanography of Rangaunu Harbour, Northland, New Zealand, New Zealand Journal of Marine and Freshwater Research, 17, 481–493, https://doi.org/10.1080/00288330.1983.9516021, 1983.
Heuscher, S. A., Brandt, C. C., and Jardine, P. M.: Using soil physical and chemical properties to estimate bulk density, Soil Sci. Soc. Am. J., 69, 51–56, https://doi.org/10.2136/sssaj2005.0051a, 2005.
Howard, J., Hoyt, S., Isensee, K., Telszewski, M., and Pidgeon, E. (Eds.): Coastal blue carbon: methods for assessing carbon stocks and emissions factors in mangroves, tidal salt marshes, and seagrasses, Conservation International, Intergovernmental Oceanographic Commission of UNESCO, and International Union for Conservation of Nature, Arlington, VA, USA, https://www.cifor.org/knowledge/publication/5095 (last access: 25 June 2025), 2014.
Howard, J., Sutton-Grier, A. E., Smart, L. S., Lopes, C. C., Hamilton, J., Kleypas, J., Simpson, S., McGowan, J., Pessarrodona, A., and Alleway, H. K.: Blue carbon pathways for climate mitigation: Known, emerging and unlikely, Marine Policy, 156, 105788, https://doi.org/10.1016/j.marpol.2023.105788, 2023.
Howarth, R. W. and Teal, J. M.: Sulfate reduction in a New England salt marsh 1, Limnol. Oceanogr., 24, 999–1013, https://doi.org/10.4319/lo.1979.24.6.0999, 1979.
Jaffé, R., Mead, R., Hernandez, M. E., Peralba, M. C., and DiGuida, O. A.: Origin and transport of sedimentary organic matter in two subtropical estuaries: a comparative, biomarker-based study, Org. Geochem., 32, 507–526, https://doi.org/10.1016/S0146-6380(00)00192-3, 2001.
Janousek, C. N., Krause, J. R., Drexler, J. Z., Buffington, K. J., Poppe, K. L., Peck, E., Adame, M. F., Watson, E. B., Holmquist, J., and Bridgham, S. D.: Blue carbon stocks along the Pacific coast of North America are mainly driven by local rather than regional factors, Global Biogeochem. Cycles, 39, e2024GB008239, https://doi.org/10.1029/2024GB008239, 2025.
Jiménez-Morillo, N. T., Moreno, J., Moreno, F., Fatela, F., Leorri, E., and De la Rosa, J. M.: Composition and sources of sediment organic matter in a western Iberian salt marsh: Developing a novel prediction model of the bromine sedimentary pool, Sci. Total Environ., 907, 167931, https://doi.org/10.1016/j.scitotenv.2023.167931, 2024.
Kaal, J., Cortizas, A. M., Mateo, M.-Á., and Serrano, O.: Deciphering organic matter sources and ecological shifts in blue carbon ecosystems based on molecular fingerprinting, Sci. Total Environ., 742, 140554, https://doi.org/10.1016/j.scitotenv.2020.140554, 2020.
Kelleway, J. J., Saintilan, N., Macreadie, P. I., Baldock, J. A., Heijnis, H., Zawadzki, A., Gadd, P., Jacobsen, G., and Ralph, P. J.: Geochemical analyses reveal the importance of environmental history for blue carbon sequestration, J. Geophys. Res.-Biogeo., 122, 1789–1805, https://doi.org/10.1002/2017JG003775, 2017.
Kelleway, J. J., Saintilan, N., Macreadie, P. I., and Ralph, P. J.: Sedimentary Factors are Key Predictors of Carbon Storage in SE Australian Saltmarshes, Ecosystems, 19, 865–880, https://doi.org/10.1007/s10021-016-9972-3, 2016.
Kennicutt, M. C., Barker, C., Brooks, J. M., DeFreitas, D. A., and Zhu, G. H.: Selected organic matter source indicators in the Orinoco, Nile and Changjiang deltas, Org. Geochem., 11, 41–51, https://doi.org/10.1016/0146-6380(87)90050-7, 1987.
King, D. J.: The Simple Handbook of New Zealand Salt Marsh Plants, https://www.researchgate.net/publication/354268056_The_Simple_Handbook_of_New_Zealand_Salt_Marsh_Plants (last access: 10 July 2024), 2022.
King, D. J., Newnham, R. M., Rees, A. B. H., Clark, K. J., Garrett, E., Gehrels, W. R., Naish, T. R., and Levy, R. H.: A∼ 200-year relative sea-level reconstruction from the Wellington region (New Zealand) reveals insights into vertical land movement trends, Marine Geology, 467, 107199, https://doi.org/10.1016/j.margeo.2023.107199, 2024.
Kirwan, M. L. and Mudd, S. M.: Response of salt-marsh carbon accumulation to climate change, Nature, 489, 550–553, https://doi.org/10.1038/nature11440, 2012.
Krüger, N., Finn, D. R., and Don, A.: Soil depth gradients of organic carbon-13–A review on drivers and processes, Plant Soil, 495, 113–136, https://doi.org/10.1007/s11104-023-06328-5, 2024.
Kumar, M., Boski, T., Lima-Filho, F. P., Bezerra, F. H. R., González-Vila, F. J., Bhuiyan, M. K. A., and González-Pérez, J. A.: Biomarkers as indicators of sedimentary organic matter sources and early diagenetic transformation of pentacyclic triterpenoids in a tropical mangrove ecosystem, Estuarine, Coastal Shelf Sci., 229, 106403, https://doi.org/10.1016/j.ecss.2019.106403, 2019.
Kumar, M., Boski, T., de la Rosa, J. M., and González-Pérez, J. A.: Discerning natural and anthropogenic organic matter inputs to salt marsh sediments of Ria Formosa lagoon (South Portugal), Environmental Science and Pollution Research, 27, 28962–28985, https://doi.org/10.1007/s11356-020-09235-9, 2020a.
Kumar, M., Boski, T., González-Vila, F. J., Jiménez-Morillo, N. T., and González-Pérez, J. A.: Characteristics of organic matter sources from Guadiana Estuary salt marsh sediments (SW Iberian Peninsula), Cont. Shelf Res., 197, 104076, https://doi.org/10.1016/J.CSR.2020.104076, 2020b.
Lamb, A. L., Wilson, G. P., and Leng, M. J.: A review of coastal palaeoclimate and relative sea-level reconstructions using δ13C and ratios in organic material, Earth-Sci. Rev., 75, 29–57, https://doi.org/10.1016/j.earscirev.2005.10.003, 2006.
Land Information New Zealand: Record of title under Land Transfer Act 2017 (Identifier NA596/85), 2018.
Leiva-Dueñas, C., Graversen, A. E. L., Banta, G. T., Hansen, J. N., Schrøter, M. L. K., Masqué, P., Holmer, M., and Krause-Jensen, D.: Region-specific drivers cause low organic carbon stocks and sequestration rates in the saltmarsh soils of southern Scandinavia, Limnol. Oceanogr., 69, 290–308, https://doi.org/10.1002/lno.12480, 2024.
Li, Y., Fu, C., Ye, C., Song, Z., Kuzyakov, Y., Vancov, T., Guo, L., Luo, Z., Van Zwieten, L., Wang, Y., Luo, Y., Wang, W., Zeng, L., Han, G., Wang, H., and Luo, Y.: Increased mineral-associated organic carbon and persistent molecules in allochthonous blue carbon ecosystems, Global Change Biology, 31, e70019, https://doi.org/10.1111/gcb.70019, 2025.
Lovelock, C. E., Adame, M. F., Bradley, J., Dittmann, S., Hagger, V., Hickey, S. M., Hutley, L. B., Jones, A., Kelleway, J. J., and Lavery, P. S.: An Australian blue carbon method to estimate climate change mitigation benefits of coastal wetland restoration, Restoration Ecology, 31, e13739, https://doi.org/10.1111/rec.13739, 2023a.
Lovelock, C. E., Adame, M. F., Dittmann, S., Hagger, V., Hickey, S. M., Hutley, L. I., Jones, A., Kelleway, J. J., Lavery, P. S., Macreadie, P. I., Maher, D. T., Mosely, L., Rogers, K., and Sippo, J. Z.: Response to Gallagher (2022) – the Australian Tidal Restoration for Blue Carbon method 2022 – conservative, robust, and practical, Restoration Ecology, 31, e14027, https://doi.org/10.1111/rec.14027, 2023b.
Macreadie, P. I., Ollivier, Q. R., Kelleway, J. J., Serrano, O., Carnell, P. E., Ewers Lewis, C. J., Atwood, T. B., Sanderman, J., Baldock, J., Connolly, R. M., Duarte, C. M., Lavery, P. S., Steven, A., and Lovelock, C. E.: Carbon sequestration by Australian tidal marshes, Sci. Rep., 7, 44071, https://doi.org/10.1038/srep44071, 2017.
Macreadie, P. I., Anton, A., Raven, J. A., Beaumont, N., Connolly, R. M., Friess, D. A., Kelleway, J. J., Kennedy, H., Kuwae, T., Lavery, P. S., Lovelock, C. E., Smale, D. A., Apostolaki, E. T., Atwood, T. B., Baldock, J., Bianchi, T. S., Chmura, G. L., Eyre, B. D., Fourqurean, J. W., Hall-Spencer, J. M., Huxham, M., Hendriks, I. E., Krause Jensen, D., Laffoley, D., Luisetti, T., Marbà, N., Masque, P., McGlathery, K. J., Megonigal, J. P., Murdiyarso, D., Russell, B. D., Santos, R., Serrano, O., Silliman, B. R., Watanabe, K., and Duarte, C. M.: The future of Blue Carbon science, Nat. Commun., 10, 3998, https://doi.org/10.1038/s41467-019-11693-w, 2019.
Macreadie, P. I., Costa, M. D. P., Atwood, T. B., Friess, D. A., Kelleway, J. J., Kennedy, H., Lovelock, C. E., Serrano, O., and Duarte, C. M.: Blue carbon as a natural climate solution, Nat. Rev. Earth Environ., 2, 826–839, https://doi.org/10.1038/s43017-021-00224-1, 2021.
Macreadie, P. I., Akhand, A., Trevathan-Tackett, S. M., Duarte, C. M., Baldock, J., Bowen, J. L., and Connolly, R. M.: Stabilisation and destabilisation of coastal blue carbon: The key factors, Earth-Sci. Rev., 265, 105133, https://doi.org/10.1016/J.EARSCIREV.2025.105133, 2025.
Maier, K. L., Ginnane, C. E., Naeher, S., Turnbull, J. C., Nodder, S. D., Howarth, J., Bury, S. J., Hilton, R. G., and Hillman, J. I. T.: Earthquake-triggered submarine canyon flushing transfers young terrestrial and marine organic carbon into the deep sea, Earth Planet. Sc. Lett., 654, 119241, https://doi.org/10.1016/j.epsl.2025.119241, 2025.
Martinetto, P., Alberti, J., Becherucci, M. E., Cebrian, J., Iribarne, O., Marbà, N., Montemayor, D., Sparks, E., and Ward, R.: The blue carbon of southern southwest Atlantic salt marshes and their biotic and abiotic drivers, Nat. Commun., 14, 8500, https://doi.org/10.1038/s41467-023-44196-w, 2023.
Martins, M., de los Santos, C. B., Masqué, P., Carrasco, A. R., Veiga-Pires, C., and Santos, R.: Carbon and nitrogen stocks and burial rates in intertidal vegetated habitats of a mesotidal coastal lagoon, Ecosystems, 25, 372–386, https://doi.org/10.1007/s10021-021-00660-6, 2022.
Mason, V., Wood, K. A., Jupe, L. L., Burden, A., and Skov, M.: Saltmarsh Blue Carbon in UK and NW Europe – evidence synthesis for a UK Saltmarsh Carbon Code, Report to the Natural Environment Investment Readiness Fund, UK Centre for Ecology and Hydrology, https://www.ceh.ac.uk/sites/default/files/2022-05/Saltmarsh Blue Carbon in UK and NW Europe_1.pdf (last access: 25 June 2025), 2022.
Maxwell, T. L., Spalding, M. D., Friess, D. A., Murray, N. J., Rogers, K., Rovai, A. S., Smart, L. S., Weilguny, L., Adame, M. F., and Adams, J. B.: Soil carbon in the world's tidal marshes, Nat. Commun., 15, 10265, https://doi.org/10.1038/s41467-024-54572-9, 2024.
Mazarrasa, I., Neto, J. M., Bouma, T. J., Grandjean, T., Garcia-Orellana, J., Masqué, P., Recio, M., Serrano, Ó., Puente, A., and Juanes, J. A.: Drivers of variability in Blue Carbon stocks and burial rates across European estuarine habitats, Sci. Total Environ., 886, 163957, https://doi.org/10.1016/j.scitotenv.2023.163957, 2023.
Mcleod, E., Chmura, G. L., Bouillon, S., Salm, R., Björk, M., Duarte, C. M., Lovelock, C. E., Schlesinger, W. H., and Silliman, B. R.: A blueprint for blue carbon: toward an improved understanding of the role of vegetated coastal habitats in sequestering CO2, Frontiers in Ecology and the Environment, 9, 552–560, https://doi.org/10.1890/110004, 2011.
McMahon, L., Ladd, C. J. T., Burden, A., Garrett, E., Redeker, K. R., Lawrence, P., and Gehrels, R.: Maximizing blue carbon stocks through saltmarsh restoration, Front. Marine Sci., 10, 1106607, https://doi.org/10.3389/fmars.2023.1106607, 2023.
McManaway, T. D. and Gaz, D.: Pauatahanui and Porirua – Country Sheet No. 9, Paekakariki, New Zealand, 1852.
Meyers, P. A.: Preservation of elemental and isotopic source identification of sedimentary organic matter, Chem. Geol., 114, 289–302, https://doi.org/10.1016/0009-2541(94)90059-0, 1994.
Meyers, P. A.: Organic geochemical proxies of paleoceanographic, paleolimnologic, and paleoclimatic processes, Org. Geochem., 27, 213–250, https://doi.org/10.1016/S0146-6380(97)00049-1, 1997.
Meyers, P. A. and Ishiwatari, R.: Lacustrine Organic Geochemistry – an overview of indicators of organic matter sources and diagenesis in lake sediments, Org. Geochem., 20, 867–900, https://doi.org/10.1016/0146-6380(93)90100-P, 1993.
Middelburg, J. J., Nieuwenhuize, J., Lubberts, R. K., and Van de Plassche, O.: Organic carbon isotope systematics of coastal marshes, Estuar. Coast. Shelf Sci., 45, 681–687, https://doi.org/10.1006/ecss.1997.0247, 1997.
Miller, C. B., Rodriguez, A. B., Bost, M. C., McKee, B. A., and McTigue, N. D.: Carbon accumulation rates are highest at young and expanding salt marsh edges, Commun. Earth Environ., 3, 173, https://doi.org/10.1038/s43247-022-00501-x, 2022.
Ministry for the Environment: Te hau mārohi ki anamata: Towards a productive, sustainable and inclusive economy – Aotearoa New Zealand's first emissions reduction plan (Report No. ME 1639), Ministry for the Environment, Wellington, New Zealand, https://environment.govt.nz/assets/publications/Aotearoa-New-Zealands-first-emissions-reduction-plan.pdf (last access: 25 June 2025), 2022.
Ministry for the Environment: New Zealand's second emissions reduction plan 2026–30. Tā Aotearoa mahere whakaheke tukunga tuarua (Report No. ME 1857), Ministry for the Environment, Wellington, New Zealand, https://environment.govt.nz/assets/publications/climate-change/ERP2/New-Zealands-second-emissions-reduction-plan-202630.pdf (last access: 25 June 2025), 2024.
Mossman, H. L., Pontee, N., Born, K., Hill, C., Lawrence, P. J., Rae, S., Scott, J., Serato, B., Sparkes, R. B., and Sullivan, M. J. P.: Rapid carbon accumulation at a saltmarsh restored by managed realignment exceeded carbon emitted in direct site construction, PLoS One, 17, e0259033, https://doi.org/10.1371/journal.pone.0259033, 2022.
Mueller, P., Ladiges, N., Jack, A., Schmiedl, G., Kutzbach, L., Jensen, K., and Nolte, S.: Assessing the long-term carbon-sequestration potential of the semi-natural salt marshes in the European Wadden Sea, Ecosphere, 10, e02556, https://doi.org/10.1002/ecs2.2556, 2019.
Naafs, B. D. A., Inglis, G. N., Blewett, J., McClymont, E. L., Lauretano, V., Xie, S., Evershed, R. P., and Pancost, R. D.: The potential of biomarker proxies to trace climate, vegetation, and biogeochemical processes in peat: A review, Global Planet. Change, 179, 57–79, https://doi.org/10.1016/j.gloplacha.2019.05.006, 2019.
Naeher, S., Smittenberg, R. H., Gilli, A., Kirilova, E. P., Lotter, A. F., and Schubert, C. J.: Impact of recent lake eutrophication on microbial community changes as revealed by high resolution lipid biomarkers in Rotsee (Switzerland), Org. Geochem., 49, 86–95, https://doi.org/10.1016/j.orggeochem.2012.05.014, 2012.
Naeher, S., Gilli, A., North, R. P., Hamann, Y., and Schubert, C. J.: Tracing bottom water oxygenation with sedimentary Mn/Fe ratios in Lake Zurich, Switzerland, Chem. Geol., 352, 125–133, https://doi.org/10.1016/j.chemgeo.2013.06.006, 2013.
Naeher, S., Niemann, H., Peterse, F., Smittenberg, R. H., Zigah, P. K., and Schubert, C. J.: Tracing the methane cycle with lipid biomarkers in Lake Rotsee (Switzerland), Org. Geochem., 66, 174–181, https://doi.org/10.1016/j.chemgeo.2013.06.006, 2014.
Naeher, S., Cui, X., and Summons, R. E.: Biomarkers: molecular tools to study life, environment, and climate, Elements, 18, 79–85, https://doi.org/10.2138/gselements.18.2.79, 2022.
Needelman, B. A., Emmer, I. M., Emmett-Mattox, S., Crooks, S., Megonigal, J. P., Myers, D., Oreska, M. P. J., and McGlathery, K.: The science and policy of the verified carbon standard methodology for tidal wetland and seagrass restoration, Estuar. Coasts, 41, 2159–2171, https://doi.org/10.1007/s12237-018-0429-0, 2018.
Ortiz, J. E., Díaz-Bautista, A., Aldasoro, J. J., Torres, T., Gallego, J. L. R., Moreno, L., and Estébanez, B.: n-Alkan-2-ones in peat-forming plants from the Roñanzas ombrotrophic bog (Asturias, northern Spain), Org. Geochem., 42, 586–592, https://doi.org/10.1016/j.orggeochem.2011.04.009, 2011.
Ortiz, J. E., Borrego, Á. G., Gallego, J. L. R., Sánchez-Palencia, Y., Urbanczyk, J., Torres, T., Domingo, L., and Estébanez, B.: Biomarkers and inorganic proxies in the paleoenvironmental reconstruction of mires: The importance of landscape in Las Conchas (Asturias, Northern Spain), Org. Geochem., 95, 41–54, https://doi.org/10.1016/j.orggeochem.2016.02.009, 2016.
Ouyang, X. and Lee, S. Y.: Updated estimates of carbon accumulation rates in coastal marsh sediments, Biogeosciences, 11, 5057–5071, https://doi.org/10.5194/bg-11-5057-2014, 2014.
Owers, C. J., Rogers, K., Mazumder, D., and Woodroffe, C. D.: Temperate coastal wetland near-surface carbon storage: Spatial patterns and variability, Estuarine, Coast. Shelf Sci., 235, 106584, https://doi.org/10.1016/j.ecss.2020.106584, 2020.
Park, R.: Map of the Village of Porirua with the Sacred Other Lots Adjoining, Wellington Survey Office, Wellington, New Zealand, 1841.
Peck, E. K., Goñi, M., and Wheatcroft, R. A.: Spatiotemporal controls on organic matter sourcing to minerogenic salt marshes, Limnol. Oceanogr., 70, 84–89, https://doi.org/10.1002/lno.12739, 2025.
Pérez, A., Machado, W., Gutierrez, D., Stokes, D., Sanders, L., Smoak, J. M., Santos, I., and Sanders, C. J.: Changes in organic carbon accumulation driven by mangrove expansion and deforestation in a New Zealand estuary, Estuar. Coast. Shelf Sci., 192, 108–116, https://doi.org/10.1016/j.ecss.2017.05.009, 2017.
Peters, K. E., Walters, C. C., and Moldowan, J. M.: The biomarker guide, Vol. 2: Biomarkers and isotopes in petroleum systems and earth history, 2nd ed., Cambridge University Press, ISBN 978-1107098558, 2007.
Pondell, C. R. and Canuel, E. A.: Composition of organic matter in soils from tidal marshes around the Chesapeake Bay, USA, as revealed by lipid biomarkers and stable carbon and nitrogen isotopes, Estuar. Coast. Shelf Sci., 277, 108068, https://doi.org/10.1016/j.ecss.2022.108068, 2022.
Poynter, J. and Eglinton, G.: Molecular composition of three sediments from hole 717c: The Bengal fan, Proceedings of the Ocean Drilling Program: Scientific Results, 116, 155–161, http://www-odp.tamu.edu/publications/116_SR/VOLUME/CHAPTERS/sr116_14.pdf (last access: 25 June 2025), 1990.
Poynter, J. G., Farrimond, P., Robinson, N., and Eglinton, G.: Aeolian-derived higher plant lipids in the marine sedimentary record: Links with palaeoclimate, Paleoclimatology and Paleometeorology: Modern and Past Patterns of Global Atmospheric Transport, 282, 435–462, https://doi.org/10.1007/978-94-009-0995-3_18, 1989.
Puppin, A., Tognin, D., Ghinassi, M., Franceschinis, E., Realdon, N., Marani, M., and D'Alpaos, A.: Spatial patterns of organic matter content in the surface soil of the salt marshes of the Venice Lagoon (Italy), Biogeosciences, 21, 2937–2954, https://doi.org/10.5194/bg-21-2937-2024, 2024.
Queen Elizabeth II National Trust: Glen Isla Farms Ltd management statement, Wellington, New Zealand, 1992.
Rogers, K., Kelleway, J. J., Saintilan, N., Megonigal, J. P., Adams, J. B., Holmquist, J. R., Lu, M., Schile-Beers, L., Zawadzki, A., Mazumder, D., and Woodroffe, C. D.: Wetland carbon storage controlled by millennial-scale variation in relative sea-level rise, Nature, 567, 91–95, https://doi.org/10.1038/s41586-019-0951-7, 2019.
Rogers, K., Zawadzki, A., Mogensen, L. A., and Saintilan, N.: Coastal Wetland Surface Elevation Change Is Dynamically Related to Accommodation Space and Influenced by Sedimentation and Sea-Level Rise Over Decadal Timescales, Front. Marine Sci., 9, 807588, https://doi.org/10.3389/fmars.2022.807588, 2022.
Rogers, K., Kelleway, J. J., and Saintilan, N.: The present, past and future of blue carbon, Cambridge Prisms: Coastal Futures, 1, e30, https://doi.org/10.1017/cft.2023.17, 2023.
Rosenheim, B. E., Day, M. B., Domack, E., Schrum, H., Benthien, A., and Hayes, J. M.: Antarctic sediment chronology by programmed-temperature pyrolysis: Methodology and data treatment, Geochem. Geophys. Geosyst., 9, https://doi.org/10.1029/2007GC001816, 2008.
Ross, F. W. R., Clark, D. E., Albot, O., Berthelsen, A., Bulmer, R., Crawshaw, J., and Macreadie, P. I.: A preliminary estimate of the contribution of coastal blue carbon to climate change mitigation in New Zealand, New Zealand Journal of Marine and Freshwater Research, 58, 530–540, https://doi.org/10.1080/00288330.2023.2245770, 2024.
Ruiz-Fernández, A. C., Carnero-Bravo, V., Sanchez-Cabeza, J. A., Pérez-Bernal, L. H., Amaya-Monterrosa, O. A., Bojórquez-Sánchez, S., López-Mendoza, P. G., Cardoso-Mohedano, J. G., Dunbar, R. B., Mucciarone, D. A., and Marmolejo-Rodríguez, A. J.: Carbon burial and storage in tropical salt marshes under the influence of sea level rise, Sci. Total Environ., 630, 1628–1640, https://doi.org/10.1016/j.scitotenv.2018.02.246, 2018.
Russell, S. K., Gillanders, B. M., Detmar, S., Fotheringham, D., and Jones, A. R.: Determining Environmental Drivers of Fine-Scale Variability in Blue Carbon Soil Stocks, Estuar. Coasts, 47, 48–59, https://doi.org/10.1007/s12237-023-01260-4, 2023.
Saintilan, N., Rogers, K., Mazumder, D., and Woodroffe, C.: Allochthonous and autochthonous contributions to carbon accumulation and carbon store in southeastern Australian coastal wetlands, Estuar. Coast. Shelf Sci., 128, 84–92, https://doi.org/10.1016/j.ecss.2013.05.010, 2013.
Schmidt, M. W. I., Torn, M. S., Abiven, S., Dittmar, T., Guggenberger, G., Janssens, I. A., Kleber, M., Kögel-Knabner, I., Lehmann, J., and Manning, D. A. C.: Persistence of soil organic matter as an ecosystem property, Nature, 478, 49–56, https://doi.org/10.1038/nature10386, 2011.
Sheehan, M.: Pauatahanui and The Inlet (Porirua History Series), Porirua Museum, Porirua, New Zealand, 1988.
Sikes, E. L., Uhle, M. E., Nodder, S. D., and Howard, M. E.: Sources of organic matter in a coastal marine environment: Evidence from n-alkanes and their δ13C distributions in the Hauraki Gulf, New Zealand, Marine Chem., 113, 149–163, https://doi.org/10.1016/j.marchem.2008.12.003, 2009.
Smeaton, C., Barlow, N. L. M., and Austin, W. E. N.: Coring and compaction: Best practice in blue carbon stock and burial estimations, Geoderma, 364, 114180, https://doi.org/10.1016/j.geoderma.2020.114180, 2020.
Smeaton, C., Garrett, E., Koot, M. B., Ladd, C. J. T., Miller, L. C., McMahon, L., Foster, B., Barlow, N. L. M., Blake, W., and Gehrels, W. R.: Organic carbon accumulation in British saltmarshes, Sci. Total Environ., 926, 172104, https://doi.org/10.1016/j.scitotenv.2024.172104, 2024.
Sollins, P., Glassman, C., Paul, E. A., Swanston, C., Lajtha, K., Heil, J. W., and Elliott, E. T.: Soil carbon and nitrogen: pools and fractions, in: Standard soil methods for long-term ecological research, edited by: Robertson, G. P., Coleman, D. C., Bledsoe, C. S., and Sollins, P., Oxford University Press, 89–105, 1999.
Spivak, A. C., Sanderman, J., Bowen, J. L., Canuel, E. A., and Hopkinson, C. S.: Global-change controls on soil-carbon accumulation and loss in coastal vegetated ecosystems, Nat. Geosci., 12, 685–692, https://doi.org/10.1038/s41561-019-0435-2, 2019.
Stephenson, G. K.: Wetlands: discovering New Zealand's shy places, 1st ed., Government Printing Office Publishing, Wellington, New Zealand, ISBN 0477013546, 1986.
Stuiver, M. and Polach, H. A.: Discussion reporting of 14C data, Radiocarbon, 19, 355–363, https://doi.org/10.1017/S0033822200003672, 1977.
Tanner, B. R., Uhle, M. E., Kelley, J. T., and Mora, C. I.: C3/C4 variations in salt-marsh sediments: An application of compound specific isotopic analysis of lipid biomarkers to late Holocene paleoenvironmental research, Org. Geochem., 38, 474–484, https://doi.org/10.1016/J.ORGGEOCHEM.2006.06.009, 2007.
Tanner, B. R., Uhle, M. E., Mora, C. I., Kelley, J. T., Schuneman, P. J., Lane, C. S., and Allen, E. S.: Comparison of bulk and compound-specific δ13C analyses and determination of carbon sources to salt marsh sediments using n-alkane distributions (Maine, USA), Estuar. Coast. Shelf Sci., 86, 283–291, https://doi.org/10.1016/j.ecss.2009.11.023, 2010.
Thamdrup, B., Fossing, H., and Jørgensen, B. B.: Manganese, iron and sulfur cycling in a coastal marine sediment, Aarhus Bay, Denmark, Geochim. Cosmochim. Ac., 58, 5115–5129, https://doi.org/10.1016/0016-7037(94)90298-4, 1994.
Thomson, T., Pilditch, C. A., Fusi, M., Prinz, N., Lundquist, C. J., and Ellis, J. I.: Vulnerability of Labile Organic Matter to Eutrophication and Warming in Temperate Mangrove Ecosystems, Global Change Biology, 31, e70087, https://doi.org/10.1111/gcb.70087, 2025.
Troels-Smith, J.: Characterization of unconsolidated sediments, Dan. Geol. Unders., 3, 39–73, 1955.
Van de Broek, M., Temmerman, S., Merckx, R., and Govers, G.: Controls on soil organic carbon stocks in tidal marshes along an estuarine salinity gradient, Biogeosciences, 13, 6611–6624, https://doi.org/10.5194/bg-13-6611-2016, 2016.
Van de Broek, M., Vandendriessche, C., Dries, P., Merckx, R., Temmerman, S., and Govers, G.: Long-term organic carbon sequestration in tidal marsh sediments is dominated by old-aged allochthonous inputs in a macrotidal estuary, Global Change Biology, 24, 2498–2512, https://doi.org/10.1111/gcb.14089, 2018.
Verret, M., Naeher, S., Lacelle, D., Ginnane, C., Dickinson, W., Norton, K., Turnbull, J., and Levy, R.: Preservation and degradation of ancient organic matter in mid-Miocene Antarctic permafrost, Biogeosciences, 22, 5771–5786, https://doi.org/10.5194/bg-22-5771-2025, 2025.
Volkman, J. K.: A review of sterol markers for marine and terrigenous organic matter, Org. Geochem., 9, 83–99, https://doi.org/10.1016/0146-6380(86)90089-6, 1986.
Wakeham, S. G.: Reduction of stenols to stanols in particulate matter at oxic–anoxic boundaries in sea water, Nature, 342, 787–790, https://doi.org/10.1038/342787a0, 1989.
Wang, F., Sanders, C. J., Santos, I. R., Tang, J., Schuerch, M., Kirwan, M. L., Kopp, R. E., Zhu, K., Li, X., Yuan, J., and others: Global blue carbon accumulation in tidal wetlands increases with climate change, National Science Review, 8, nwaa296, https://doi.org/10.1093/nsr/nwaa296, 2021.
Wang, X. C., Chen, R. F., and Berry, A.: Sources and preservation of organic matter in Plum Island salt marsh sediments (MA, USA): long-chain n-alkanes and stable carbon isotope compositions, Estuar. Coast. Shelf Sci., 58, 917–928, https://doi.org/10.1016/J.ECSS.2003.07.006, 2003.
Wang, Y., Yang, H., Zhang, J., Xu, M., and Wu, C.: Biomarker and stable carbon isotopic signatures for 100–200 year sediment record in the Chaihe catchment in southwest China, Sci. Total Environ., 502, 266–275, https://doi.org/10.1016/j.scitotenv.2014.09.017, 2015.
Woodley, K.: How should we develop our land?, Pukorokoro Miranda News. Journal of the Pukorokoro Miranda Naturalist's Trust, 101, 6–7, https://shorebirds.org.nz/wp-content/uploads/2017/09/PM-News-101.pdf (last access: 11 June 2025), 2016.
Zabarte-Maeztu, I., Matheson, F. E., Manley-Harris, M., Davies-Colley, R. J., Oliver, M., and Hawes, I.: Effects of fine sediment on seagrass meadows: a case study of Zostera muelleri in Pāuatahanui Inlet, New Zealand, J. Marine Sci. Eng., 8, 645, https://doi.org/10.3390/jmse8090645, 2020.
Zech, M., Buggle, B., Leiber, K., Marković, S., Glaser, B., Hambach, U., Huwe, B., Stevens, T., Sümegi, P., and Wiesenberg, G.: Reconstructing Quaternary vegetation history in the Carpathian Basin, SE-Europe, using n-alkane biomarkers as molecular fossils: problems and possible solutions, potential and limitations, E and G Quaternary Sci. J., 58, 148–155, https://doi.org/10.3285/eg.58.2.03, 2010.
Zhang, J., Hao, Q., Li, Q., Zhao, X., Fu, X., Wang, W., He, D., Li, Y., Zhang, Z., and Zhang, X.: Source identification of sedimentary organic carbon in coastal wetlands of the western Bohai Sea, Sci. Total Environ., 913, 169282, https://doi.org/10.1016/j.scitotenv.2023.169282, 2024.
Zhang, T. and Wang, X.: Stable carbon isotope and long-chain alkane compositions of the major plants and sediment organic matter in the Yellow River Estuarine wetlands, Journal of Ocean University of China, 18, 735–742, https://doi.org/10.1007/s11802-019-3918-2, 2019.
Zhang, Z., Wang, J. J., Lyu, X., Jiang, M., Bhadha, J., and Wright, A.: Impacts of land use change on soil organic matter chemistry in the Everglades, Florida – a characterization with pyrolysis-gas chromatography–mass spectrometry, Geoderma, 338, 393–400, https://doi.org/10.1016/j.geoderma.2018.12.041, 2019.
Zhao, J., Zhang, L., Zhang, Y., Yu, Q., and Luo, S.: Lipid biomarker evidences of natural and anthropogenic organic matter inputs in sediments from the eastern Sunda Shelf in the southern South China Sea, Cont. Shelf Res., 275, 105184, https://doi.org/10.1016/j.csr.2024.105184, 2024.
Zhou, W., Zheng, Y., Meyers, P. A., Jull, A. J. T., and Xie, S.: Postglacial climate-change record in biomarker lipid compositions of the Hani peat sequence, Northeastern China, Earth Planet. Sc. Lett., 294, 37–46, https://doi.org/10.1016/j.epsl.2010.02.035, 2010.
Zhu, R., Versteegh, G. J. M., and Hinrichs, K.-U.: Detection of microbial biomass in subseafloor sediment by pyrolysis GC/MS, Journal of Analytical and Applied Pyrolysis, 118, 175–180, https://doi.org/10.1016/j.jaap.2016.02.002, 2016.
Please read the editorial note first before accessing the article.
- Article
(14815 KB) - Full-text XML
-
Supplement
(3846 KB) - BibTeX
- EndNote