the Creative Commons Attribution 4.0 License.
the Creative Commons Attribution 4.0 License.
 | 15 Apr 2026
Forest diversity and environmental factors shape contrasting soil-litter fluxes of biogenic volatile organic compounds and methane in three central Amazonian ecosystems
Débora Pinheiro-Oliveira
Hella van Asperen
Murielli Garcia Caetano
Michelle Robin
Achim Edtbauer
Nora Zannoni
Joseph Byron
Jonathan Williams
Layon Oreste Demarchi
Maria Teresa Fernandez Piedade
Jochen Schöngart
Florian Wittmann
Sergio Duvoisin-Junior
Carla Batista
Rodrigo Augusto Ferreira de Souza
Eliane Gomes Alves
Biogenic volatile organic compounds (BVOCs) play a crucial role in biosphere-atmosphere interactions and the global carbon cycle. While vegetation is recognized as the primary source of BVOC fluxes in forest ecosystems, recent studies suggest that the carbon-rich soil-litter compartment plays a significant role in gas fluxes. However, the drivers, variability, and magnitude of these fluxes across different forest types remain poorly understood. This is particularly notable in the Amazon rainforest, the world's largest source of BVOCs, where measurements remain scarce. In this study, we investigated the net soil-litter gas exchange of BVOCs and methane, along with their potential drivers – soil and litter nutrient content, soil and litter microbial biomass, soil temperature, and soil moisture – across three forest types in central Amazonia: White Sand Forest (WS), Upland Forest (Up), and Ancient River Terrace Forest (AR). Our results showed distinct soil-litter gas exchange patterns across the forest types. WS exhibited both high emissions and consumption of gases, notably high acetaldehyde and methane emissions, along with an uptake of monoterpenes. Up showed lower overall fluxes, with moderate emissions and consumption of dimethyl sulfide (DMS), isoprene, and acetaldehyde. In contrast, AR presented no significant fluxes. Among the variables tested, models indicated that soil moisture and temperature were the strongest drivers of fluxes in WS, whereas microbial biomass was the main driver in Up. Our measurements suggest that, despite covering a relatively small area in the Amazon basin, WS can be a significant ecosystem for BVOC and methane fluxes, where these fluxes are influenced by soil moisture and temperature. Our findings underscore the need to account for forest-type-specific fluxes when modeling BVOC and methane emissions in the Amazon, particularly under changing climate conditions.
- Article
(4609 KB) - Full-text XML
-
Supplement
(2107 KB) - BibTeX
- EndNote


Biogenic Volatile Organic Compounds (BVOCs) play critical roles across scales, from cellular processes to global climate regulation. While primarily emitted by plants, BVOCs can also be produced and consumed by soil, litter, and microorganisms. Once released into the atmosphere, they actively participate in atmospheric chemistry and physics, influencing climate dynamics. BVOCs react with key atmospheric oxidants – including hydroxyl radicals (OH), ozone (O3), and nitrate radicals (NO3) – to form secondary organic aerosols (SOAs) (Artaxo et al., 2022; Yáñez-Serrano et al., 2020). SOAs, in turn, have a major influence on cloud properties, enhancing cloud condensation nuclei (CCN) concentrations, thereby impacting precipitation patterns and altering cloud lifecycles (Liu and Matsui, 2022). Depending on their chemical composition, SOAs can also influence the Earth's radiation budget by scattering incoming solar radiation (resulting in a cooling effect) or absorbing outgoing longwave radiation. Additionally, depending on the concentration of nitrogen oxides (NOx), BVOCs contribute to the formation of tropospheric ozone – an important greenhouse gas and a major air pollutant (Vella et al., 2025). Given these large-scale impacts, accurately quantifying BVOC fluxes in terrestrial ecosystems is essential for advancing our understanding of forest–atmosphere interactions and for improving Earth system models, thereby improving climate predictions.
Global emissions of BVOCs from terrestrial vegetation are estimated at approximately 760 Tg C yr−1, with isoprene (C5H8) and monoterpenes (C10H16) accounting for around 70 % and 11 % of these emissions, respectively (Guenther et al., 2012; Sindelarova et al., 2014). Isoprene is a simple building block compound emitted in large quantities, particularly by tropical forests. Monoterpenes (e.g., α-pinene, β-pinene, limonene) are structurally more complex (Guenther et al., 2012; Alves et al., 2016), with (–) α-pinene being the second most emitted compound (Zannoni et al., 2020; Yáñez-Serrano et al., 2018). The Amazon rainforest alone contributes about 40 % of global BVOC emissions, playing a critical role in the global carbon cycle (Guenther et al., 2012; Wang et al., 2024; Tripathi et al., 2025). However, these global estimates primarily consider emissions from plants, neglecting potential contributions from soil and litter, which might also include a large variety of BVOC chemical species. This gap is particularly significant given recent evidence that the soil–litter together is a compartment that can also play a crucial role in BVOC emissions (Bourtsoukidis et al., 2018; Drewer et al., 2021; Fan et al., 2020, 2024; Peñuelas et al., 2014; Tang et al., 2019). Within this compartment, multiple biological and physical processes influence BVOC dynamics. These include plant-related processes such as intra- and inter-organism communication, herbivore defense, and symbiotic interactions (Gfeller et al., 2013; Lin et al., 2007; Rasheed et al., 2021; Steeghs et al., 2004; Tang et al., 2019; Trowbridge et al., 2020). Additionally, soil microorganisms produce and consume BVOCs for communication and ecological interactions (e.g., defense and competition), with these compounds also being released as residual metabolic products (Jdanova and Isidorov, 2002; Leff and Fierer, 2008; Venturini et al., 2023; Liu et al., 2024; Monard et al., 2021; Crocker et al., 2025).
Greenhouse gases (GHGs), such as methane (CH4), carbon dioxide (CO2), and nitrous oxide (N2O), are also produced and consumed by soil microorganisms through key metabolic processes, including methanogenesis, methanotrophy, and microbial respiration (Conrad, 2009, 2020; Saggar et al., 2013; Hofmann et al., 2016). While CO2 and methane are not classified as BVOCs, they play a crucial role in overall gas exchange processes and provide a broader perspective of soil-litter gas (carbon) fluxes. Moreover, environmental factors such as soil moisture, temperature, and nutrient availability influence both BVOC and GHG fluxes, albeit through distinct but interconnected biological and physical mechanisms (Greenberg et al., 2012; Tang et al., 2019; Asensio et al., 2007). These interconnected processes drive net ecosystem gas exchange between the soil-litter compartment and the atmosphere, making methane and CO2 key components for understanding processes driving BVOC flux dynamics.
Fluxes of GHGs and BVOCs can also be linked to litter decomposition. This process is influenced by various physical factors, including soil moisture, temperature, and nutrient availability, which collectively can enhance microbial activity – one of the main drivers of these fluxes (Greenberg et al., 2012; Tang et al., 2019; Mäki et al., 2017; Asensio et al., 2007). Specifically, microbial processes such as nitrification and denitrification can result in the production and consumption of N2O in soils (Butterbach-Bahl et al., 2013; Snyder et al., 2009). Together, these processes drive the net ecosystem exchange of BVOCs and GHGs between the soil-litter compartment and the atmosphere, and the magnitude and direction of this exchange may vary across different ecosystem types.
The Amazon Basin is a mosaic of diverse forest types (Oliveira-Filho et al., 2021), each with distinct plant species composition (ter Steege et al., 2013), shaped by the region's highly variable soil properties (Quesada et al., 2011, 2012). Although Amazonian heterogeneity is known to play a critical role in regulating biogeochemical cycles, comparative studies across forest types, especially at the soil–litter interface, are still scarce. Distinct interactions between vegetation and soil can lead to highly variable patterns of BVOC and GHG exchange. This lack of representation underscores the urgent need for studies that account for the region's ecological diversity to capture better the unique contributions of each forest type to biogeochemical processes. Quantifying this variability is key to improving both regional and global models, as gas fluxes are unlikely to be uniform within the Amazon.
To address these gaps, we investigated soil-litter fluxes of BVOCs (acetaldehyde, methanol, 42, dimethyl sulfide, isoprene and monoterpenes) and GHGs (CH4 and CO2), soil and litter nutrient content and microbial biomass, and soil temperature and moisture from three forest types in central Amazonia: (i) Ancient River Terrace Forest – a forest that was flooded in the past and is no longer flooded due to changes in the river course (paleoigapó); (ii) White Sand Forest (locally called campinarana) – a less common forest type that occupies about 5 % of the Amazon basin (Adeney et al., 2016); and (iii) Upland Forest (locally called terra-firme) – the most common forest in Amazonia, with the highest plant species richness (Emidio et al., 2016; Luize et al., 2018). We aimed to answer the following questions: (i) what is the emission/consumption of BVOCs, CO2, and CH4 in magnitude and chemical diversity, and; (ii) what are the main drivers of soil-litter gas exchanges across these three forest types in central Amazonia (specifically, soil moisture, soil temperature, nutrient content and microbial biomass from soil and litter)?
2.1 Site Description
This study was conducted in the MAUA–PELD experimental plots (PELD is the abbreviation in Portuguese for long-term ecological research) (Fig. 1) at the Amazon Tall Tower Observatory (ATTO) experimental site. This site is located 150 km northeast of Manaus and is part of the Uatumã Sustainable Reserve (USDR), which covers an area of 424 430 ha (Andreae et al., 2015). The climate is tropical humid, with average annual rainfall of 2376 mm and a temperature of 28 °C (Botía et al., 2022). There are two distinct seasons, the wet season from December to May and the dry season from July to October, with transition seasons in between. The ATTO site contains three dominant non-flooded ecosystems: a dense Upland Forest (Up) on the plateau, with an elevation close to 100 m (terra-firme); a White Sand Forest (WS) (campinarana); and another type of terra-firme vegetation that developed on the lower-laying ancient river terraces (Ancient River Terrace Forests (AR)) (Fig. 1) (Andreae et al., 2015).
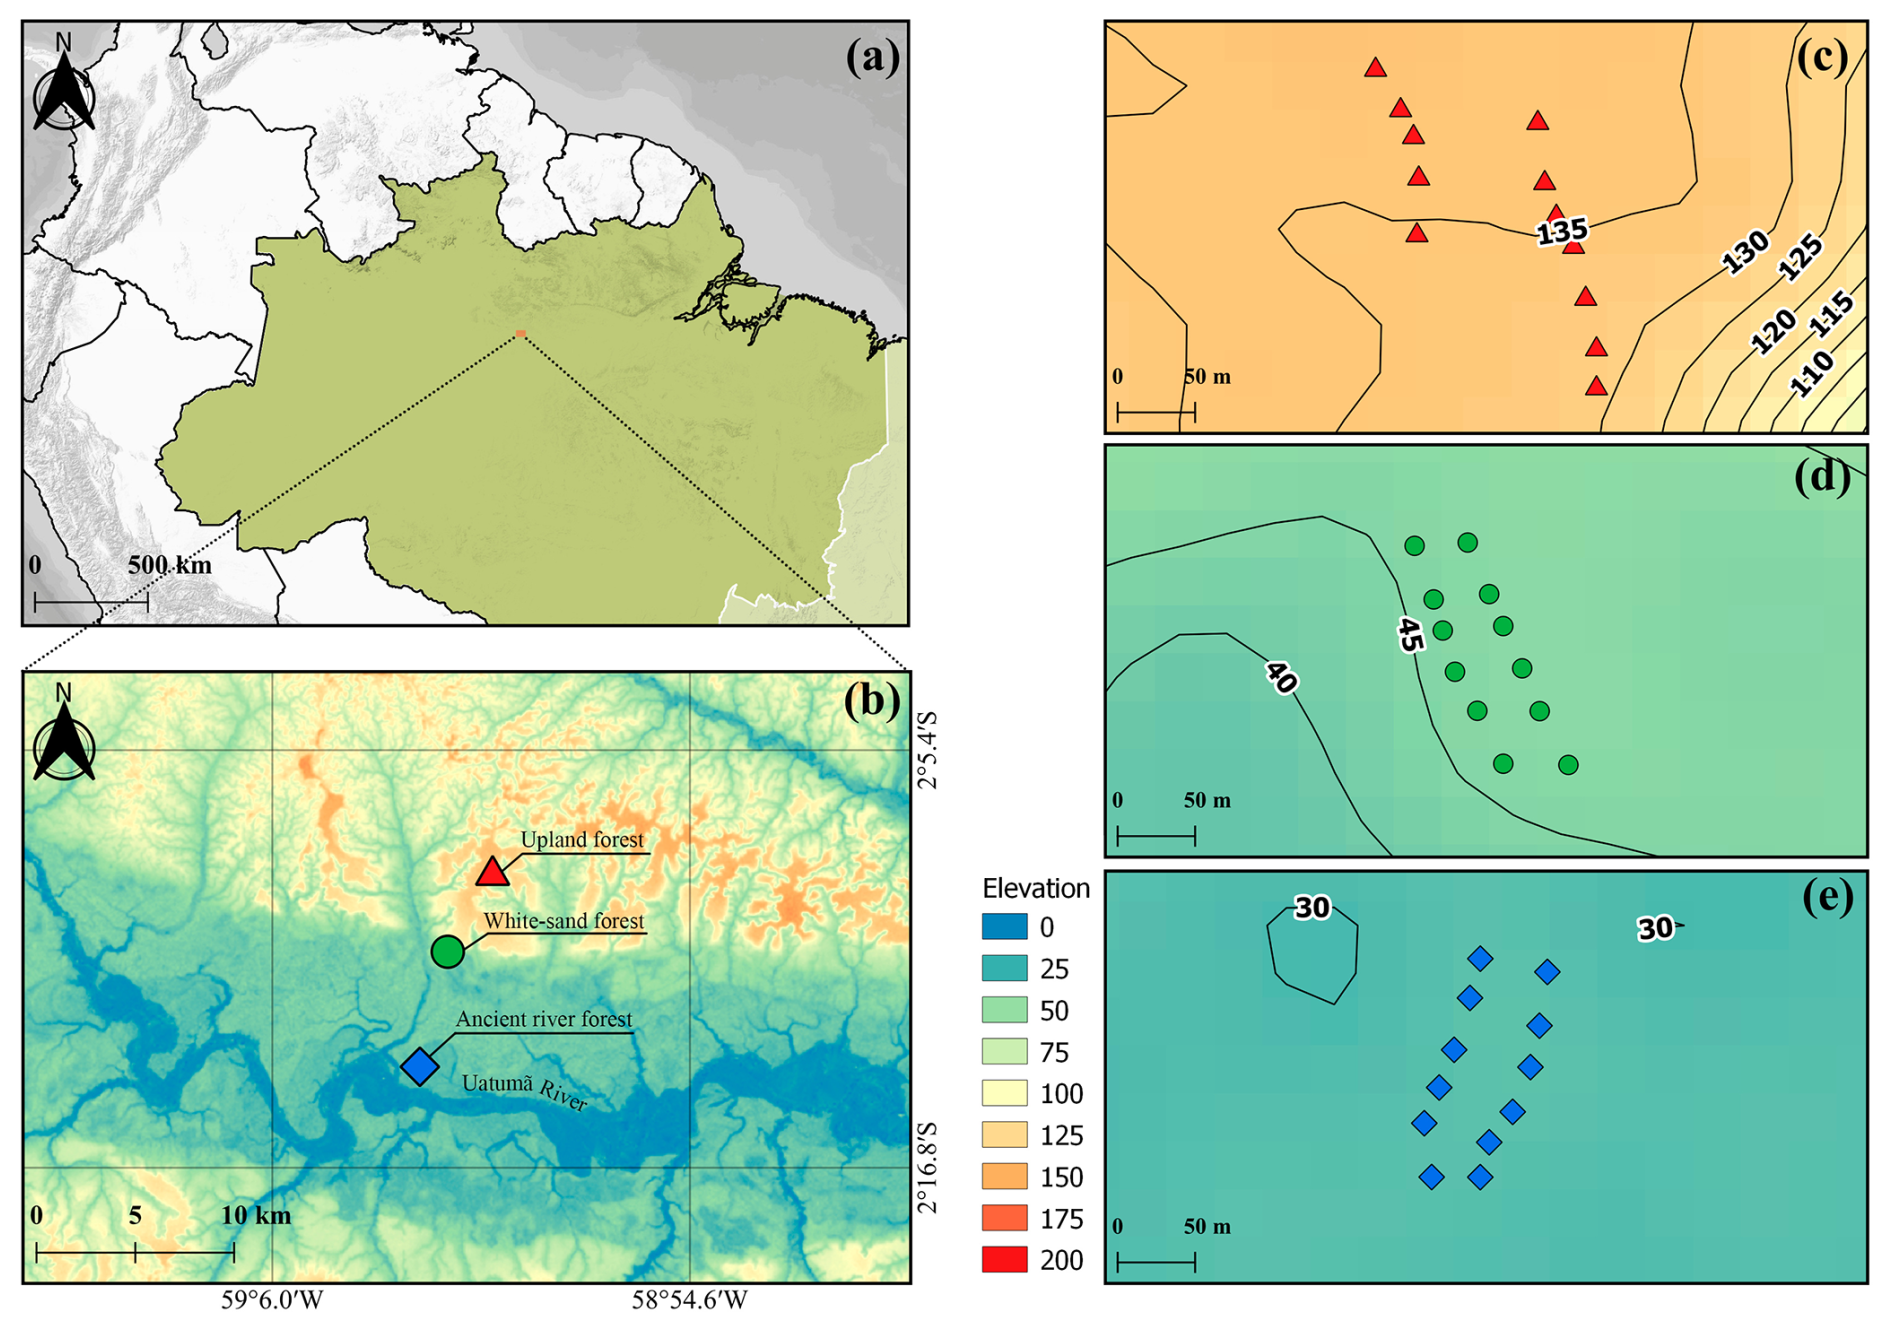
Figure 1(a) Location of the ATTO site. (b) A map illustrating the locations of the different forest types evaluated in this study: Upland Forest (Up), White Sand Forest (WS), and Ancient River Terrace Forest (AR), and showing the Uatumã River, a tributary of the Amazon River. (c), (d) and (e): The distribution of sampling points along the Transects in each forest type (Upland Forest – top, White Sand Forest – middle, and Ancient River Terrace Forest – bottom); black lines and numbers indicate the elevation (above sea level – a.s.l.).
Topography is critical to soil formation in the central Amazon region (Quesada et al., 2012). At the ATTO site, a clear topographic gradient is associated with different soil characteristics (Fig. 1). In the Ancient River Terrace Forest, soil contains more silt and clay (39 % sand, 37 % silt, 23 % clay) in comparison to the adjacent sandy White Sand Forest soils (57 % sand, 40 % silt, 1.50 % clay). Upland Forest soils are more clayey and contain very little sand (13 % total sand, 34 % silt, 52 % clay) (data from this study; Supplement, Sect. S1; Table S1). Upland Forest soils, which are predominantly ferrasols, are known to hold more water than other tropical soils, benefiting forest activity during the dry season (Quesada et al., 2012). Ancient River Terrace Forest soils are typically allisols, younger and richer in nutrients compared to upland ferralsols (Andreae et al., 2015). White Sand Forest soils are arenosols, characterized by high permeability and low water retention, with low specific heat capacity and often nutrient-poor organic layers (Quesada et al., 2011). The study area in the White Sand Forest has high water table variability, with a hard subsoil layer that restricts drainage and can flood the root system during the wet season (Demarchi et al., 2022).
2.2 Sampling Design
For each forest type, a PELD-MAUA plot (∼ 1 ha) (https://peld-maua.inpa.gov.br, last access: 30 March 2026) was selected. Within each plot, two 150 m Transects were established (Fig. 1) in homogeneous areas characterized by consistent vegetation structure, soil characteristics, and topography, to minimize spatial variability and avoid pseudo-replication. Along each Transect, six sampling points were marked at ∼ 30 m intervals, resulting in a total of 36 soil chamber measurements conducted on consecutive days; although this design was necessary for logistical reasons, it also allowed us to examine the influence of external factors beyond forest-type differences. Chamber-based methods (Sect. 2.3; Fig. 1) were employed for the in-situ quantification of CO2, CH4, and BVOC fluxes from the soil–litter compartment. These chambers were installed directly in the field with minimal disturbance to the surrounding environment. To account for potential background signals and chamber interferences, three blank chambers, with the same dimensions as the sample chamber, but each featuring completely bottom-sealed collars, were deployed per Transect and measured simultaneously alongside the sample chambers (Fig. 2b).
Tedlar bags (CEL Scientific, Cerritos, CA, USA) were used to collect gas samples directly from the outlet of the pump connected to the chambers, capturing the air for subsequent analysis of BVOCs, CO2, and CH4. After each gas flux measurement, soil temperature (T, °C) (TP-101, Delhi, India) and soil volumetric water content (VWC, %) were measured around the collar five times using a probe (AT SMT150, Cambridge, UK), and the averages were calculated. Surface soil samples were collected from the organic layer, approximately within the upper 5 cm of the soil. Samples from the litter and surface soil layers were collected inside the chamber and stored for analysis of chemical and physical characteristics and microbial biomass. Due to expected low variation and limited possibility for laboratory analyses, nutrient samples from soil and litter (excluding carbon and nitrogen) and granulometry were collected as mixed samples pooled and homogenized from two collars. To minimize diurnal variation, each Transect was measured between 08:00 and 10:00 (local time), after which collected samples were processed and analyzed for BVOC and GHG concentrations. During the measurements, no precipitation was observed, but one large rain event occurred just before the measurement of Transect 2 of the White Sand Forest.
2.3 Flux Chamber Measurements
The flux chambers used in this study were produced by the Max Planck Institute for Biogeochemistry. The soil chamber, consisting of a lid and a soil collar (Fig. 2a), was made entirely of 100 % stainless steel, with a total volume of 21 L and a surface area of 855 cm2 (0.0855 m2). The blank chamber collar had the same dimensions as the soil collar but contained a sealed bottom. Two Teflon inlets were connected to the top of the chamber, and inside the chamber was a fan that mixed the gases in the chamber headspace. A PTFE-coated Viton O-ring was positioned at the edge of the collar over which the chamber was placed, ensuring a tight seal between the chamber and the collar.
Before gas sampling, each collar was carefully installed in a non-invasive manner by gently pressing its edge into the litter and surface soil to minimize disturbance to plant shoots and roots. To further ensure a tight seal preventing any potential leakage, the surrounding soil was carefully pressed against the outer edges of the collar (Aaltonen et al., 2011). This method ensured that the chamber system was effectively isolated from external gas exchange. The chamber and collar were sealed together with multiple clamps to prevent outside air from entering the chamber during measurements. The collars were installed approximately 24 h prior to sampling to allow the surrounding environment to stabilize.
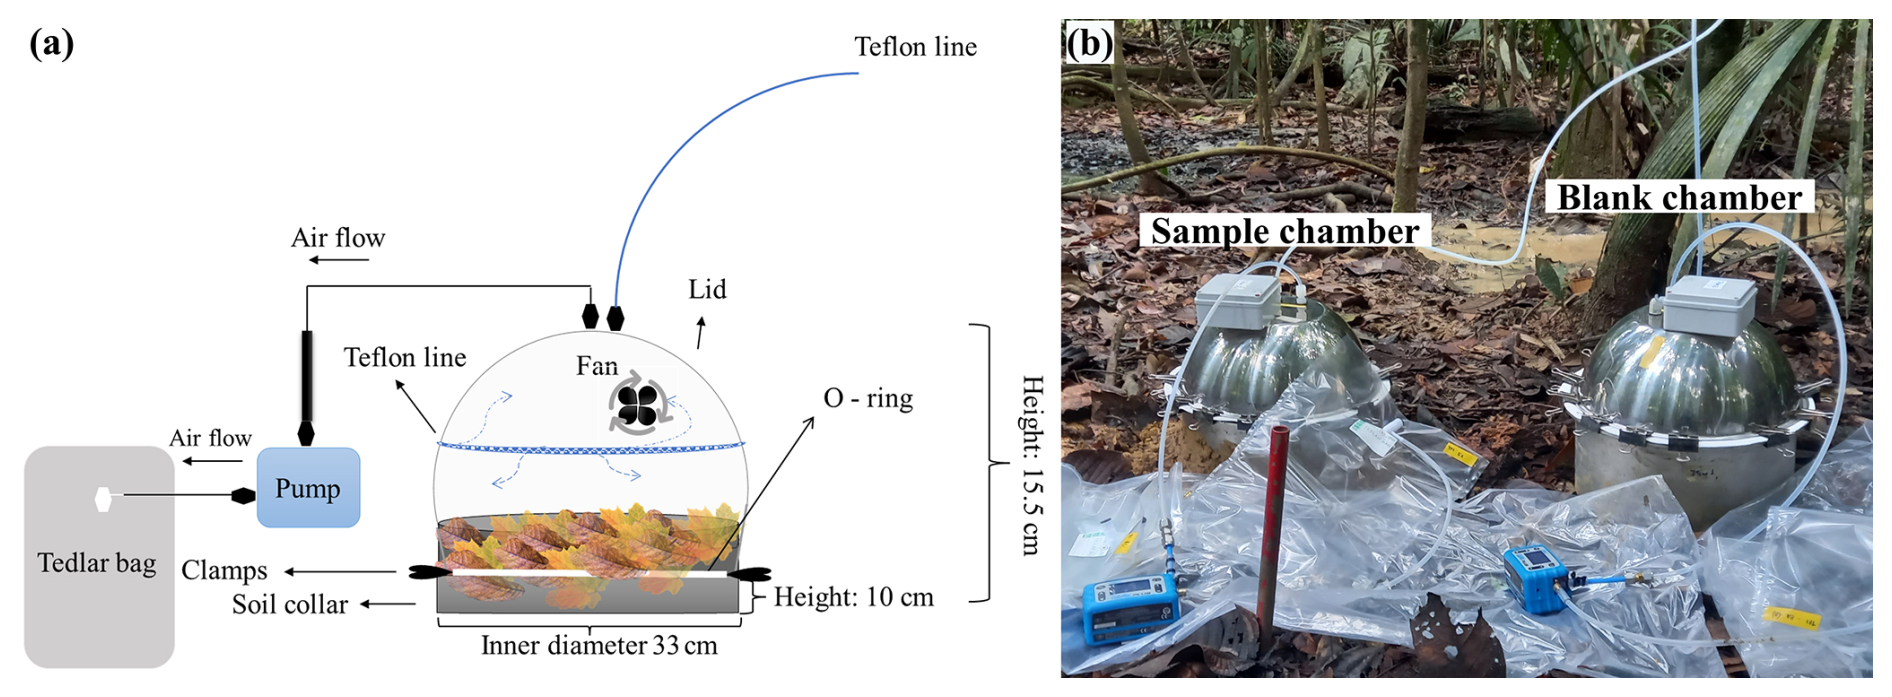
Figure 2(a) Schematic of the flux chamber. (b) Photo of the measurement setup of the sample and the blank chamber.
Gas collection took place in December 2021, during the dry-to-wet season transition. Before placing the lid on the collar, the chamber was manually ventilated to minimize gas accumulation caused by the collar. Once the chamber was closed and sealed with clamps, the internal fan was turned on to ensure mixing. An air sampling pump (GilAir® Plus, Levitt Safety, Ottawa, ON), operating at a flow rate of 500 sccm, initiated continuous flow from the chamber outlet immediately after closure to maintain constant conditions throughout the measurement.
After 20 min of chamber closure with continuous air circulation, a Tedlar bag was connected to the outlet of the Teflon pump, and a 5 L air sample was collected over the next 10 min. By the end of the 30 min measurement process, a total of 15 L of air had flowed through the chamber, and the last 5 L were used for subsequent analyses. The sample volumes collected were determined by the specific requirements of each analytical instrument. Measurements of BVOCs were performed using proton-transfer-reaction quadrupole mass spectrometry (PTR-QMS; IONICON Analytik, Innsbruck, Austria), prioritizing sufficient ion counts per second (CPS) and integration cycles for reliable detection of BVOC concentrations with the required precision, especially considering their typically trace levels. Greenhouse gases (GHGs) were measured using a Los Gatos Ultra-Portable Gas Analyzer (California, USA), hereafter referred to as the Los Gatos analyzer. Finally, for the offline measurements with cartridges and for specific compound identification and qualitative analysis with thermal-desorption gas chromatography time-of-flight mass spectrometry (TD-GC-TOF-MS; Bench ToF Tandem Ionisation, Markes International, Bridgend, UK), at least 2 L of sample air was required to effectively load the adsorbent cartridges. These analyses are further detailed in the Supplement, Sect. S4.2.
The same procedure was followed by a blank chamber, which was measured under identical conditions to account for gas contributions unrelated to soil and litter processes. For logistical reasons, measurements were conducted with three chambers simultaneously, pairing two sample chambers with one blank chamber, followed by two additional sets, resulting in the measurement of six samples and three blank chambers per day. Because air was continuously extracted from the chamber headspace by the pump, ambient air entered the chamber through one additional inlet, which consisted of a 2 m long open Teflon tube, fixed approximately 2 m above the ground and positioned at the same location for both sample and blank chambers. The setup ensured that both chambers (sample and blank) were diluted or affected by ambient air to the same degree, minimizing potential biases.
After sampling, bags were handled carefully to prevent leakage. Potential compound losses due to adsorption onto the inner walls or diffusion through the bag material were minimized by storing all samples in a dark, stainless-steel box to avoid light exposure and keeping them in air-conditioned lab containers at low temperatures until analysis. All samples were analyzed on the same day, within a maximum of 8 h post-collection, following the recommendations of Beauchamp et al. (2008). Gas analysis began with the quantification of BVOCs using a PTR-QMS. Subsequent analyses of CO2 and CH4 concentrations were conducted using a Los Gatos analyzer. Each sample bag was then used to fill stainless steel cartridges (containing Tenax TA and Carbograph 5TD adsorbents), which were later analyzed via TD-GC-TOF-MS. Detailed descriptions of the analytical procedures and results are in Sect. S4 and S4.1 of the Supplement.
2.4 PTR-QMS measurements and Los Gatos analyzer measurements
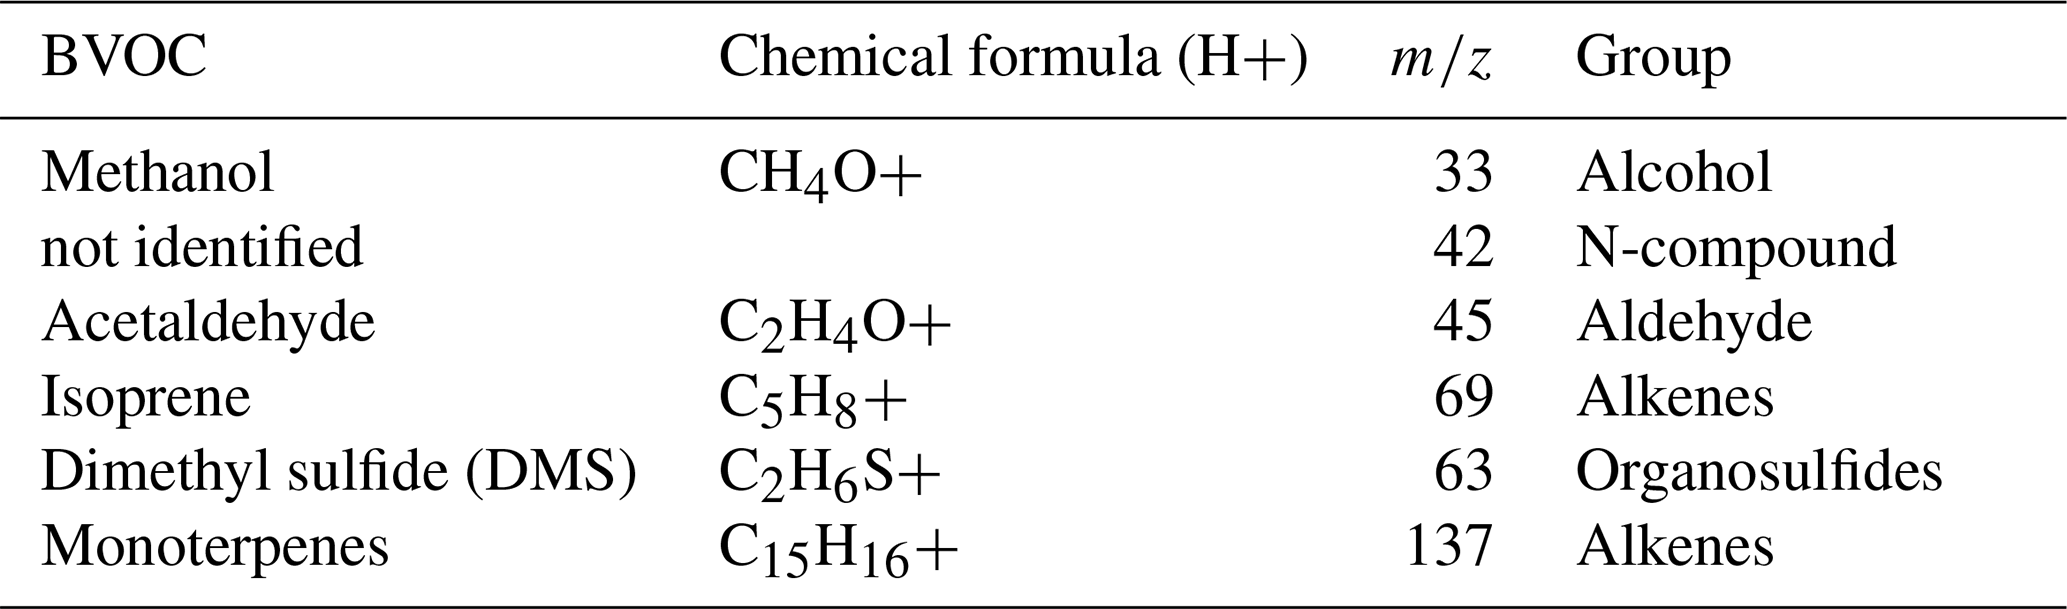
Tedlar bags were connected to the PTR-QMS for analysis of BVOCs (Lindinger et al., 1998). The PTR-QMS H3O+ mode was used for chemical ionization, which is extremely sensitive to all BVOCs that have a higher proton affinity than water, covering most volatile organic compounds (Edtbauer et al., 2021). Six compounds were analyzed (Table 1). The PTR-QMS was operated under standard conditions at 2.3 mbar, and E/N 120, with 60 °C, with a drift tube voltage of 600 V. During each PTR-QMS measurement cycle, the following specific protonated mass-to-charge ratios () were measured, 21 (H3O18+), 32 (O2+), and 37 (H2O-H3O+), with a dwell time of 500 ms each; and Methanol (33), compound not identified ( 42), Acetaldehyde (45), Dimethyl sulfide – DMS (63), Isoprene (69) and Monoterpenes (137), with a dwell time of 1 s. We measured approximately 17 cycles for each bag. Mass identifications were based on the available literature (Warneke et al., 2015) and were consistent with a PTR-MS mass library database – GLOVOC (Yáñez-Serrano et al., 2021) and gas calibration with certified standards.
Calibrations were performed before the experiment using a multi-component calibration mix containing various gases of known concentrations (Apel-Riemer Environmental, Inc.) (Supplement; Sect. 2; Table S2). Four-point calibration curves were generated by diluting the multicomponent with synthetic air, humidifying the air stream with a water bubbler filled with distilled water, and controlling the flow with mass flow controllers (Supplement; Sect. 2; Fig. S1). Curves were calculated considering the normalized counts per second as a function of the mixing ratio. Previously, some compounds important for soil-litter processes (Peñuelas et al., 2014) – such as acetone, ethanol, and formaldehyde – were considered for this study, but as they did not show a good fit, they were excluded from this work. The error of PTR-QMS concentration measurements of the six presented compounds is expected to consist of a systematic part and a statistical part. The systematic error consists of the uncertainty of the calibration gas standard (±5 %), the error of the flow measurements (±5 %), and the error of the calibration slope (14.8 %, 52.4 %, 12.5 %, 18.4 %, 18.2 % for methanol, 42, acetaldehyde, DMS and monoterpenes, respectively). The statistical error is based on the repeatability of the concentration measurement during the calibration routine, and was found to be 14.4 %, 26.2 %, 14.8 %, 13.7 %, 6.0 % for methanol, 42, acetaldehyde, DMS and monoterpenes, respectively. The systematic error affects both bags in the same direction, whereas the statistical error can differ between the two bags in a pair. Therefore, to evaluate the uncertainty of the fluxes, we focused on the propagated statistical uncertainty, as described in Sect. 2.5.
After PTR-QMS analysis, the bags were connected to a Los Gatos analyzer to measure the mixing ratios of methane and CO2. The Los Gatos analyzer is an instrument based on laser absorption spectroscopy, specifically Off-axis Integrated Cavity Output Spectroscopy (OA-ICOS), enabling ultra-sensitive, precise, and real-time measurements of trace gases in gas samples (Pohlman et al., 2021; van Asperen et al., 2024). The instrument operates at a relatively low sample flow rate (∼ 0.1 L min−1), and a minimum gas volume of 0.3 L was used as a precaution to ensure measurement stability and accurate determination of CH4 and CO2 concentrations; air from the sample bags was analyzed for 3 min, and mean concentrations were calculated from the final 2 min of measurement.
2.5 BVOC & GHG flux calculation
To calculate BVOC and GHG fluxes, the Volumetric Mixing Ratios of the blank chamber bags (VMRb) were subtracted from the sample chamber bags (VMR):
In which VMR is expressed in pptv or ppbv. By subtracting the mixing ratios of a blank chamber, dVMR represents the concentration difference attributable solely to soil and litter fluxes, corrected for potential chamber effects or the influence of ambient air entering the system. To ensure data reliability, bag pairs for which the concentration difference (dVMR) was less than or equal to the combined statistical uncertainty (calculated using the Root-Sum-Square method from the individual bag uncertainties) were assigned a value of zero. This approach ensures that only reliably detected fluxes are considered while retaining the full sample size for modeling. For simplicity, we used a closed chamber approach to calculate fluxes rather than the open steady-state approach. The constant sample flow introduces a dilution effect that may lead to an underestimation of the fluxes by up to 25 % (see Supplement, Sect. S3). The reported fluxes should therefore be considered conservative estimates, and this potential bias does not affect the main conclusions of the study.
To convert dVMR to fluxes, we used:
where N is the value of fixed molar volume at 25 °C (24.8 L mol−1; 40.3 mol m−3), V is the chamber volume (0.021 m3), A is the chamber area (0.0855 m2), and T is the average sampling time (25 min). Flux values in nmol m−2 min−1 were converted to ng m−2 h−1.
2.6 Soil and Litter Analyses
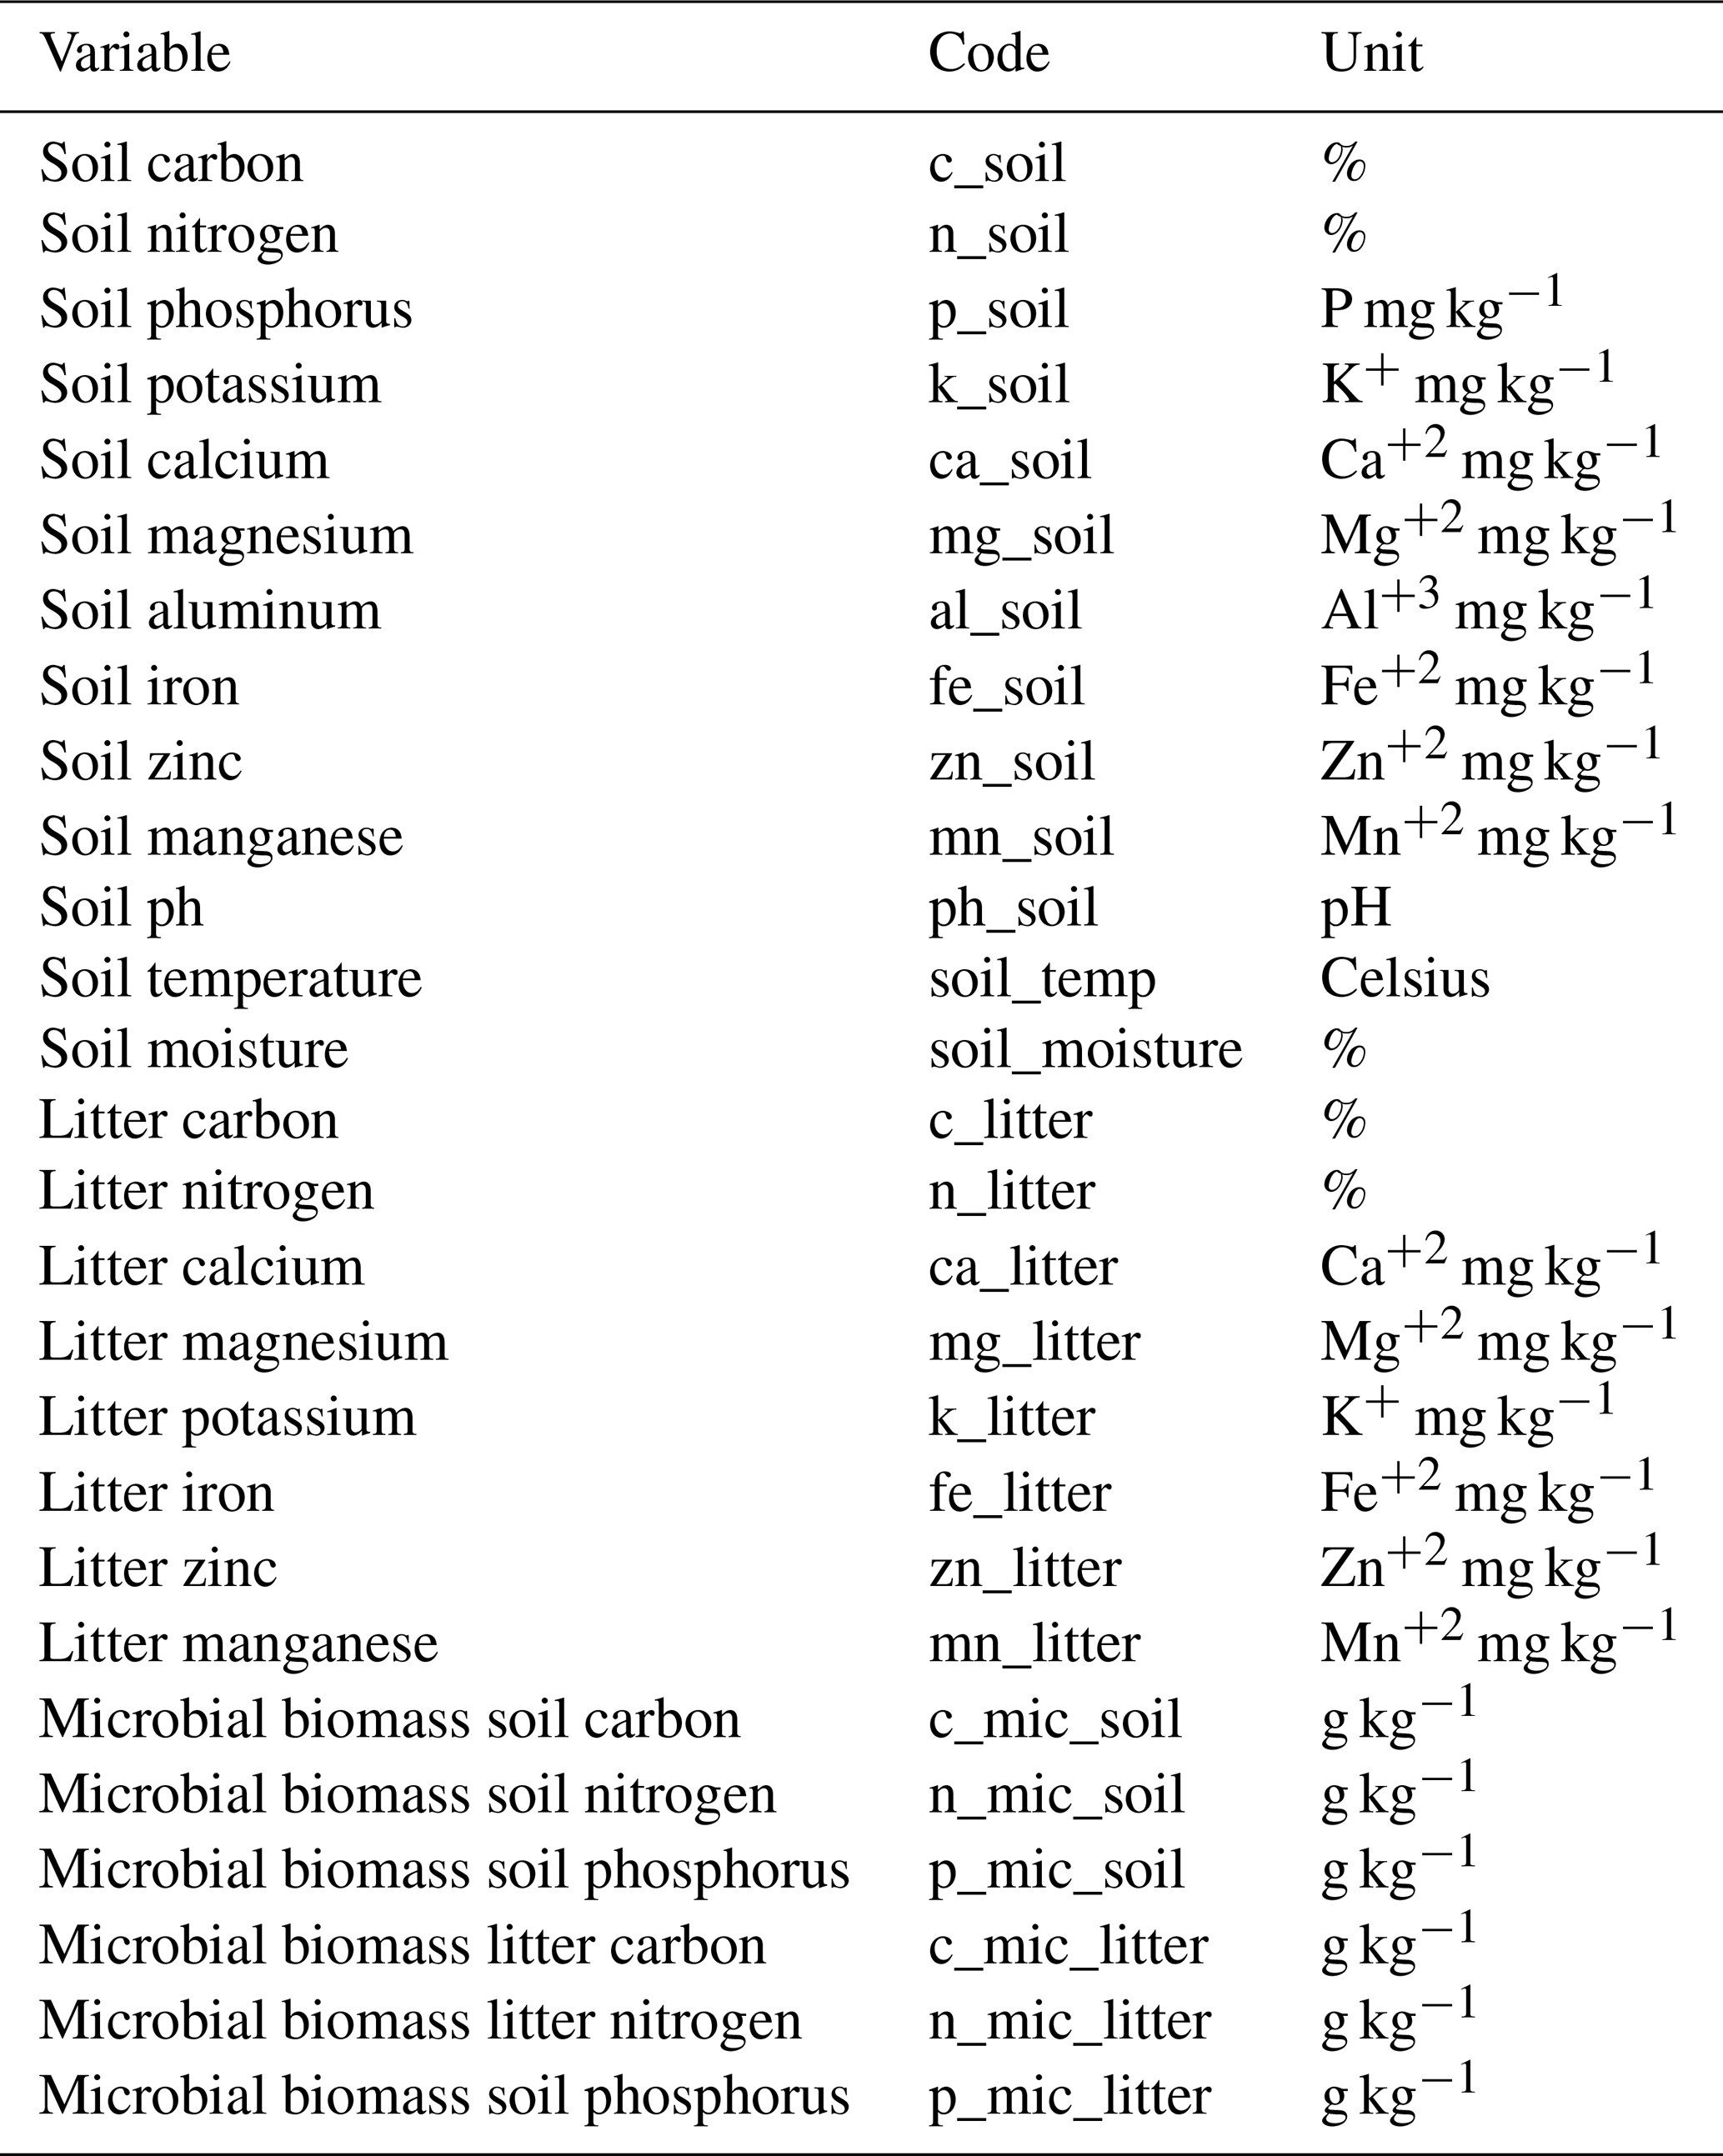
The Thematic Laboratory of Soils and Plants (LTSP, at the National Institute for Amazonian Research – INPA) analyzed soil and litter nutrient content according to adapted protocols (EMBRAPA, 1999). The nutrients – iron (Fe+2), calcium (Ca+2), magnesium (Mg+2), zinc (Zn+2), potassium (K+), manganese (Mn+), phosphorus (P), and aluminum (Al) – were determined by digestion with a nitro-perchloric acid solution (Malavolta et al., 1989). Total phosphorus (P) was quantified using colorimetry (Murphy and Riley, 1962; Olsen and Sommers, 1982) and measured using a UV spectrophotometer (Model 1240, Shimadzu, Kyoto, Japan). Potassium (K), calcium (Ca), and magnesium (Mg) concentrations were determined by atomic absorption spectrophotometry (AAS, 1100 B, 250 Perkin Elmer, Ueberlingen, Germany), as described by Anderson and Ingram (1993). Soil carbon and nitrogen content was determined by the Routine Measurements & Analyses Lab (RoMA, MPI-BGC) with the elemental analyzer “varioEL” (Elementar Analysensysteme GmbH, Elementar-Straße 1, D-63505 Langenselbold, Germany). Soil porosity was analyzed using the pycnometer method described in Flint and Flint (2002). The amount of water was corrected for soil density.
For analysis of soil and litter microbial Carbon, Nitrogen, and Phosphorus (C, N, and P) contents, 2 g of fresh litter and 5 g of fresh soil were used from each sample chamber. These were separated into fumigated and non-fumigated samples. The fumigated samples were left with chloroform for 24 h and then divided into two sub-samples. First, 50 mL of KCl (Potassium Chloride) was added, and total C and N were extracted, and for the second, 50 mL of NaHCO3 (Sodium Bicarbonate) was added for total P extraction. Following the same extraction protocol, the non-fumigated samples were prepared for direct extraction without going through the 24 h fumigation period. Microbial C, N, and P content was estimated in fumigated and non-fumigated extracts from the difference in organic C, N, and total P measured by a TOC/TN analyzer (Jenkinson et al., 2004). The extraction of the microbial biomass was performed at INPA, and the analyses were done by the Routine Measurements & Analyses Lab (RoMA, MPI-BGC).
The litter layer inside the measurement collars was not quantified in terms of litter mass or plant species composition. However, during field sampling, we qualitatively observed spatial variation in litter accumulation among measurement points and forest types, reflecting the natural heterogeneity of litter inputs typical of Amazonian forests. In general, thicker litter layers were observed in the Ancient River Terrace Forest and the White Sand Forest, which appeared broadly similar in litter accumulation, whereas the Upland Forest tended to have comparatively thinner layers.
2.7 Statistical analyses
A total of 36 samples were evaluated (n=12 per forest type). Gas fluxes were first correlated with potential predictors (soil and litter characteristics, Table 2), revealing variations between forest types. Separate regression models were built for each forest type to maximize predictive ability, with variable selection based on the following criteria: (1) given the statistical power limitation of models (n=12), the maximum number of independent variables possible to include was two; thus, (2) we tested all models with one or two independent variable combinations; finally, (3) we chose the models which showed no multicollinearity and had the highest adjusted R-squared and lowest Akaike's information criterion (AIC). The “ols_step_all_possible” function from the “olsrr” package (Hebbali, 2024) was used, and multicollinearity was assessed via VIF (<2.5; Hair et al., 2009). Principal Component Analysis (PCA) and Pearson's correlation (Hmisc package; Harrell, 2018) were performed to explore variable interactions. Variations within forest types (e.g., between Transects) were analyzed using t-tests for normal data and Kruskal-Wallis tests for non-normal data, with a significance level of 0.05. All analyses were conducted in R (v4.3.0; R Core Team, 2023).
3.1 Comparison between forest types
The three forest types showed very different gas fluxes for BVOCs and GHGs (Fig. 3), with the highest fluxes observed in the White Sand Forest. Fluxes were very low in the Upland Forest, and almost no gas fluxes were observed in the Ancient River Terrace Forest. Acetaldehyde emissions showed the most significant differences between forest types, with flux averages of 35.87 ± 46.86 mg m−2 h−1 (mean ± SD) for the White Sand Forest, −0.09 ± 0.02 mg m−2 h−1 for the Upland Forest, and −0.02 ± 0.008 mg m−2 h−1 for the Ancient River Terrace Forest. Isoprenoid (isoprene and monoterpenes) fluxes were also high in the White Sand Forest, and clear differences were found between forest types concerning the speciation of monoterpenes (Supplement; Fig. S2).
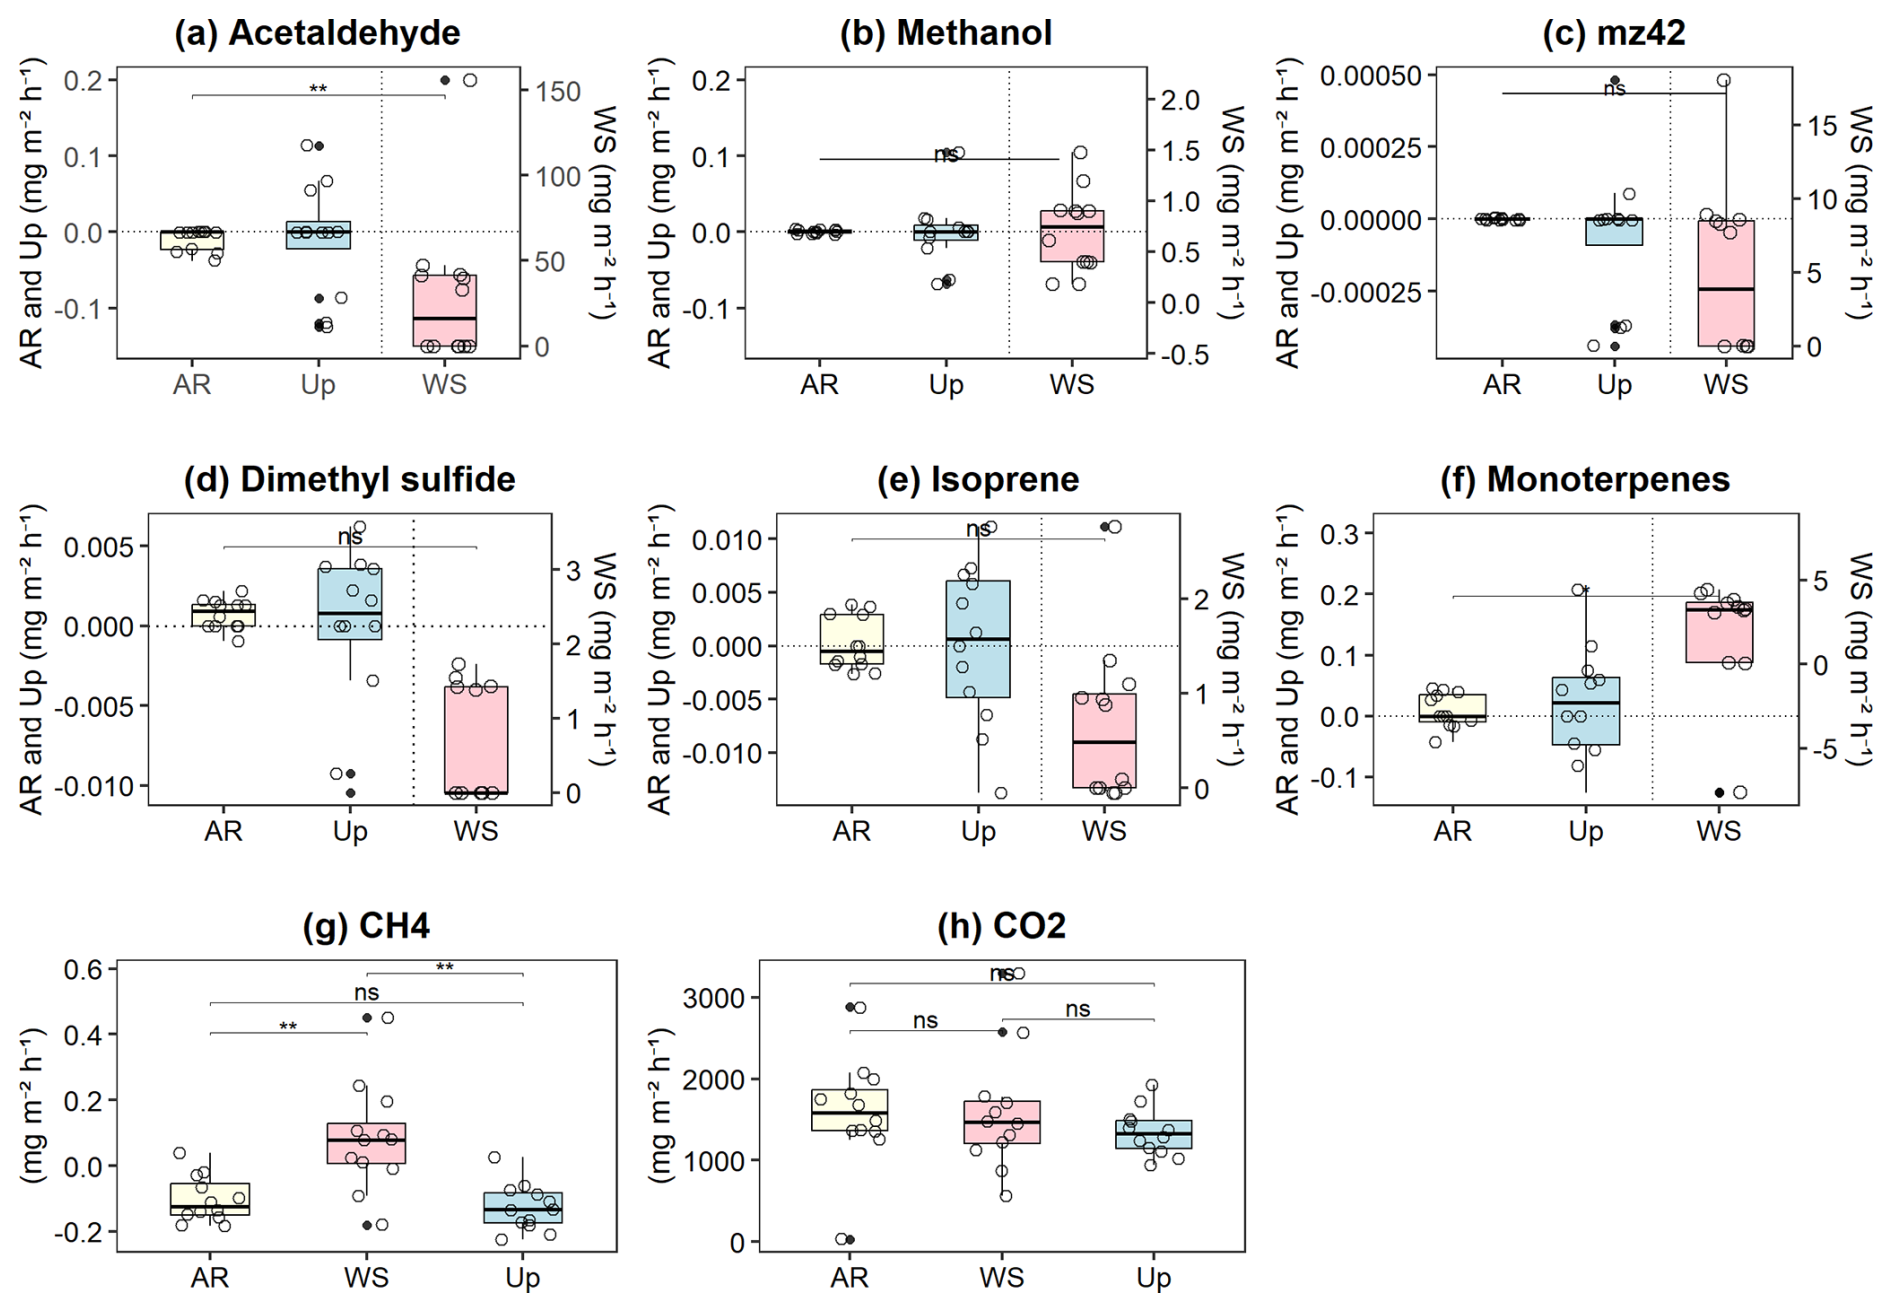
Figure 3Soil–litter fluxes of biogenic volatile organic compounds (BVOCs) and greenhouse gases (GHGs) across three forest types: Ancient River Terrace Forest (AR), White Sand Forest (WS), and Upland Forest (Up). Panels show fluxes of (a) acetaldehyde, (b) methanol, (c) 42, (d) dimethyl sulfide (DMS), (e) isoprene, (f) monoterpenes, (g) methane (CH4), and (h) carbon dioxide (CO2). Statistical differences between forest types are indicated by horizontal brackets (p<0.05; p<0.01), while “ns” denotes non-significant differences (N=36). Differences were assessed using ANOVA for normally distributed data and the Kruskal–Wallis test for non-normal data, followed by Dunn's post hoc test with Bonferroni correction. Boxes represent the median (horizontal line) and the interquartile range (IQR). Whiskers extend to 1.5 × IQR, and points represent individual observations.
In the White Sand Forest, high isoprenoid emissions were observed, with isoprene fluxes averaging 0.66 ± 0.84 mg m−2 h−1, and monoterpene fluxes averaging 1.12 ± 4.31 mg m−2 h−1 . Details on the monoterpene and sesquiterpene speciation can be found in the Supplement, Sect. S4.2. Conversely, very low (negative) values were recorded in the Upland Forest (Isoprene, −0.005 ± 0.003 mg m−2 h−1 and monoterpenes −0.02 ± 0.08 mg m−2 h−1) and Ancient River Terrace Forest (Isoprene, −0.002 ± 0.001 mg m−2 h−1 and monoterpenes −0.011 ± 0.015 mg m−2 h−1). In the WS we also observed the consumption of monoterpenes (with −7.63 mg m−2 h−1, highlighted as an outlier in Fig. 3) and high emissions of DMS (1.10 ± 1.14 mg m−2 h−1), whereas a consumption of the latter was observed in the Upland Forest (−0.001 ± 0.005 mg m−2 h−1) and Ancient River Terrace Forest (−0.0003 ± 0.001 mg m−2 h−1). CH4 fluxes showed substantial variation in the White Sand Forest, with both uptake (−0.09 ± 0.08 mg m−2 h−1) and emission (0.14 ± 0.13 mg m−2 h−1). In contrast, the Upland Forest and Ancient River Terrace Forest showed methane uptake primarily, with average fluxes of −0.14 ± 0.05 and −0.13 ± 0.03 mg m−2 h−1, respectively.
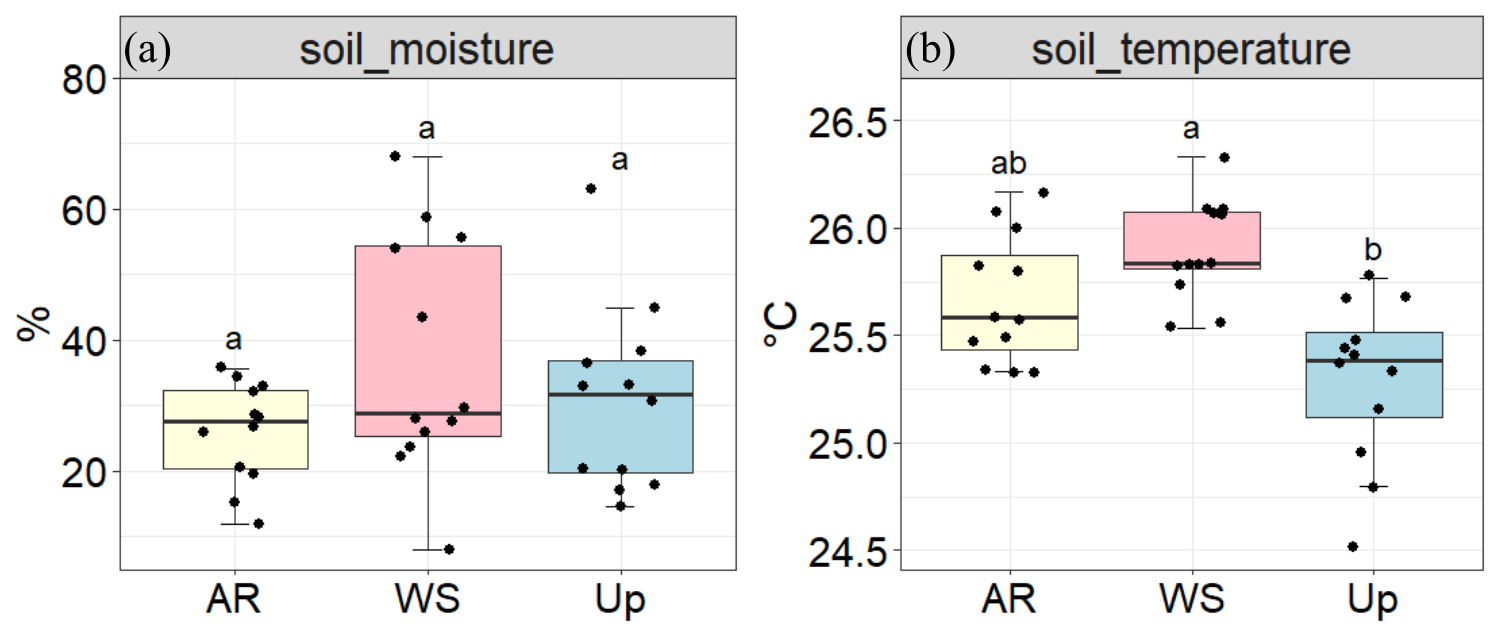
Figure 4Soil moisture (%) and soil temperature (°C) across three forest types: Ancient River Terrace Forest (AR), White Sand Forest (WS), and Upland Forest (Up). Panels show (a) soil moisture and (b) soil temperature. Different letters indicate statistically significant differences between forest types (p<0.05; N=36), assessed using ANOVA for normally distributed data. Boxes represent the median (horizontal line) and the interquartile range (IQR). Whiskers extend to 1.5 × IQR, and points represent individual observations.
There were no statistically significant differences in soil moisture across forest types (Fig. 4); however, the White Sand Forest showed the highest and the lowest soil moisture values.
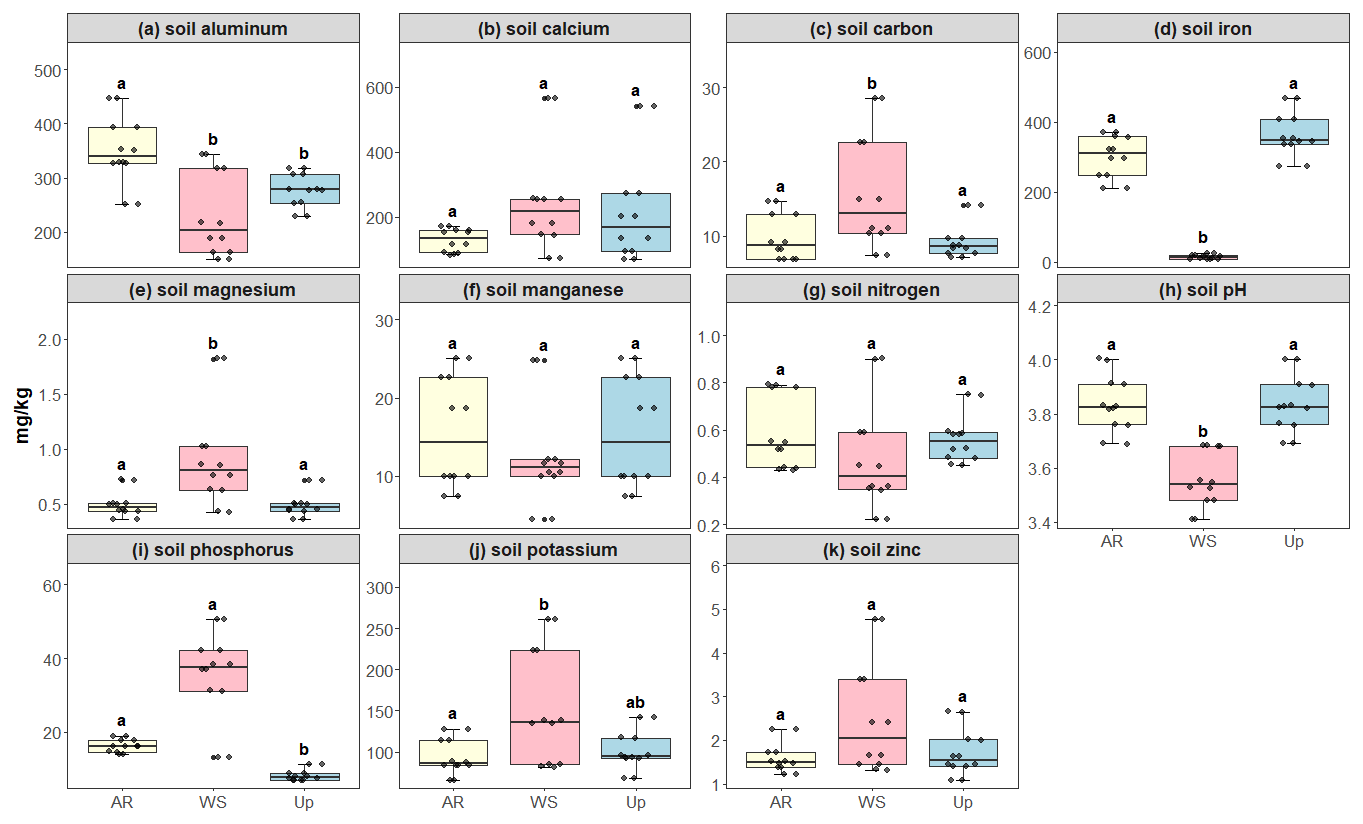
Figure 5Soil micro- and macronutrient concentrations across three forest types: Ancient River Terrace Forest (AR), White Sand Forest (WS), and Upland Forest (Up). Panels show (a) aluminum, (b) calcium, (c) carbon, (d) iron, (e) magnesium, (f) manganese, (g) nitrogen, (h) soil pH, (i) phosphorus, (j) potassium, and (k) zinc. Different letters indicate statistically significant differences between forest types (p<0.05; N=36). Differences were assessed using ANOVA for normally distributed data (aluminum) and the Kruskal–Wallis test for non-normal data (carbon, calcium, iron, potassium, magnesium, manganese, nitrogen, phosphorus, pH, and zinc). Boxes represent the median (horizontal line) and the interquartile range (IQR). Whiskers extend to 1.5 × IQR, and points represent individual observations.
Soil macro- and micronutrients varied considerably between the forest types, with statistically significant differences in carbon, magnesium, phosphorus, and iron for the White Sand Forest. Phosphorus content was the highest in the White Sand Forest compared to other forest types (Fig. 5). All litter nutrients exhibited significant differences between forest types: Upland Forest showed the highest average concentrations of calcium, iron, manganese, and zinc, while the Ancient River Terrace Forest had the highest nitrogen, potassium, and phosphorus concentrations, and the White Sand Forest had slightly higher carbon concentrations (Fig. 6).
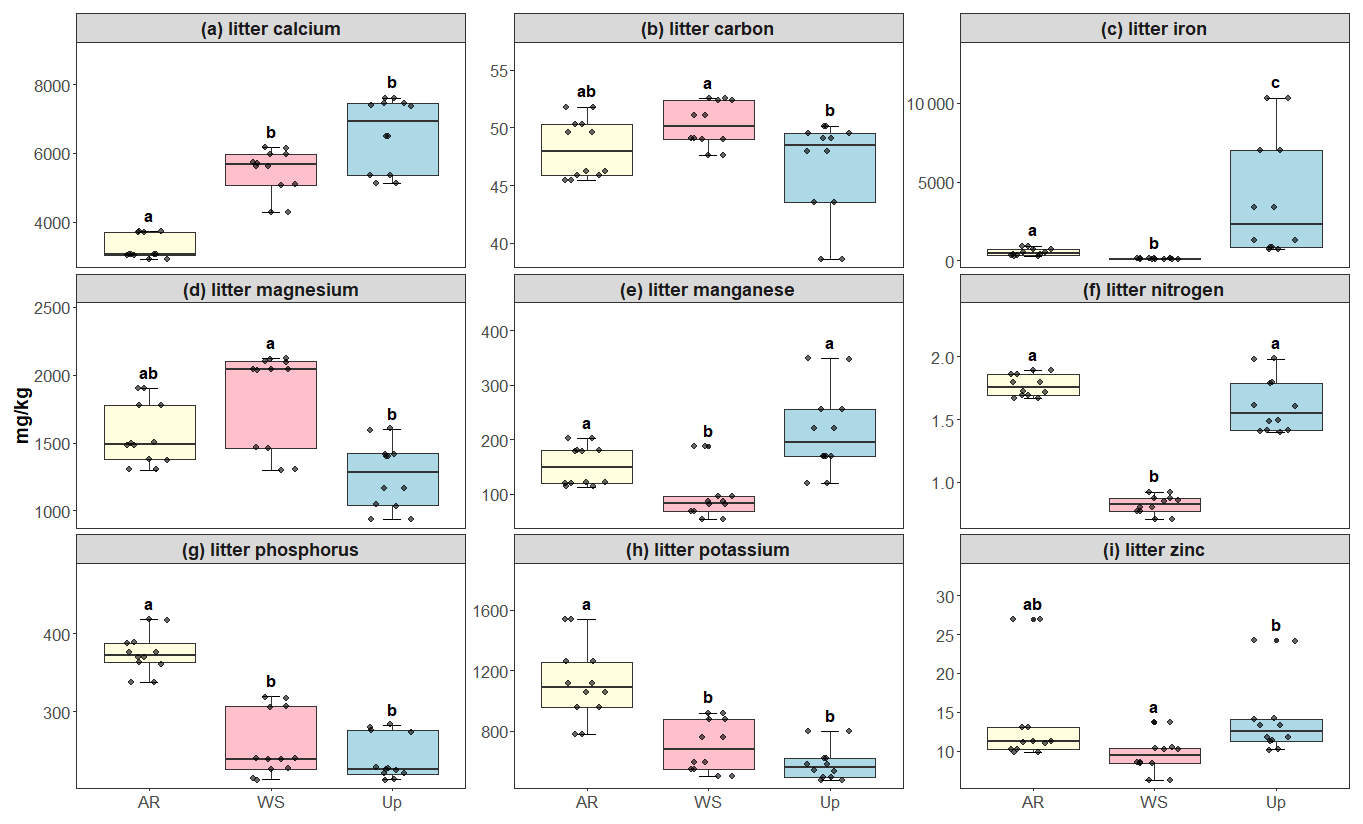
Figure 6Litter micro- and macronutrient concentrations across three forest types: Ancient River Terrace Forest (AR), White Sand Forest (WS), and Upland Forest (Up). Panels show (a) calcium, (b) carbon, (c) iron, (d) magnesium, (e) manganese, (f) nitrogen, (g) phosphorus, (h) potassium, and (i) zinc. Different letters indicate statistically significant differences between forest types (p<0.05; N=36). Differences were assessed using ANOVA for normally distributed data (potassium and nitrogen) and the Kruskal–Wallis test for non-normal data (carbon, calcium, iron, magnesium, manganese, phosphorus, and zinc). Boxes represent the median (horizontal line) and the interquartile range (IQR). Whiskers extend to 1.5 × IQR, and points represent individual observations.
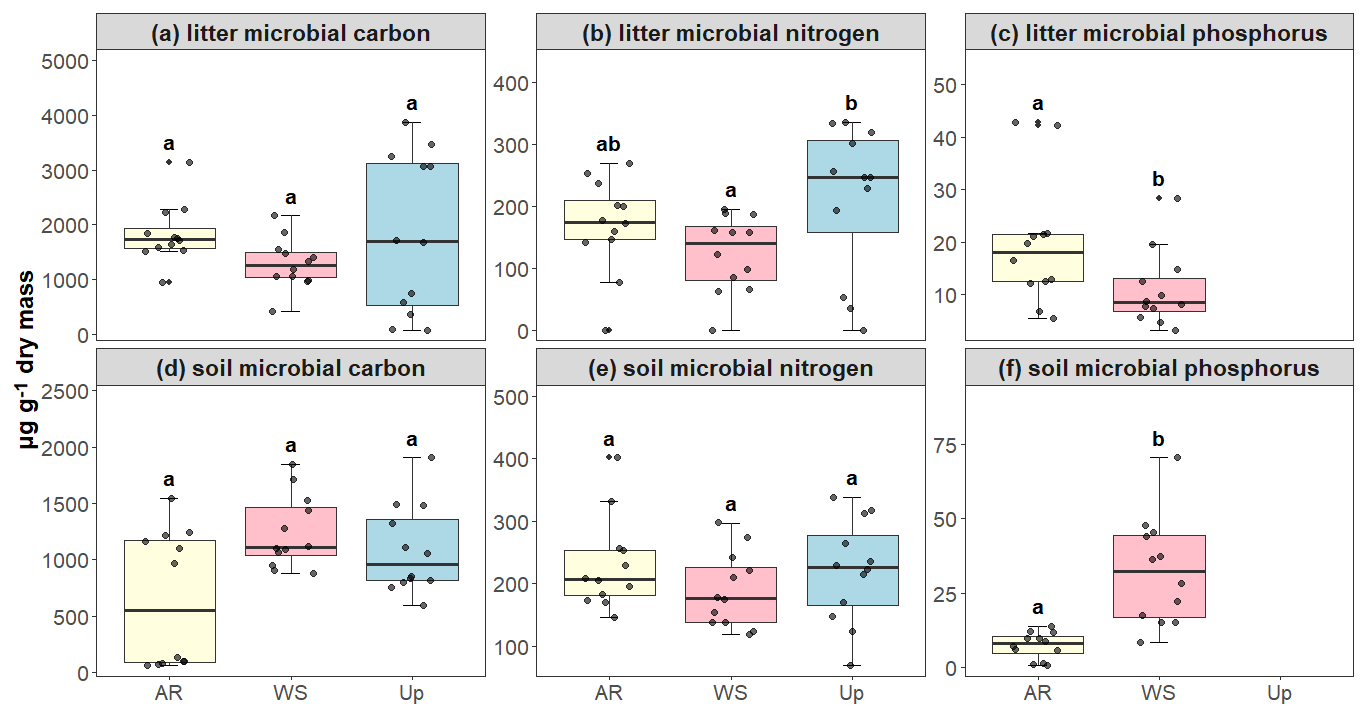
Figure 7Microbial biomass of carbon (C), nitrogen (N), and phosphorus (P) in litter and soil across three forest types: Ancient River Terrace Forest (AR), White Sand Forest (WS), and Upland Forest (Up). Panels show (a) litter microbial carbon, (b) litter microbial nitrogen, (c) litter microbial phosphorus, (d) soil microbial carbon, (e) soil microbial nitrogen, and (f) soil microbial phosphorus. Different letters indicate statistically significant differences between forest types (p<0.05; N=36). Differences were assessed using ANOVA for normally distributed data (litter microbial carbon, soil microbial nitrogen, and soil microbial phosphorus) and the Kruskal–Wallis test for non-normal data (soil microbial carbon, litter microbial nitrogen, and litter microbial phosphorus). Boxes represent the median (horizontal line) and the interquartile range (IQR). Whiskers extend to 1.5 × IQR, and points represent individual observations.
Microbial biomass (soil and litter), used here as a proxy for microbial activity, showed significant differences between forest types only for soil phosphorus, which was higher in the White Sand Forest compared to the Ancient River Terrace Forest (no data available for the Upland Forest). For carbon and nitrogen, significant differences were observed only in litter microbial biomass, with the upland forest exhibiting the highest values and the white sand forest the lowest. However, for most microbial biomass parameters measured across soil and litter, differences between forest types were not statistically significant (Fig. 7).
3.2 Identification of drivers of BVOC and GHG fluxes
3.2.1 Principal Component Analysis
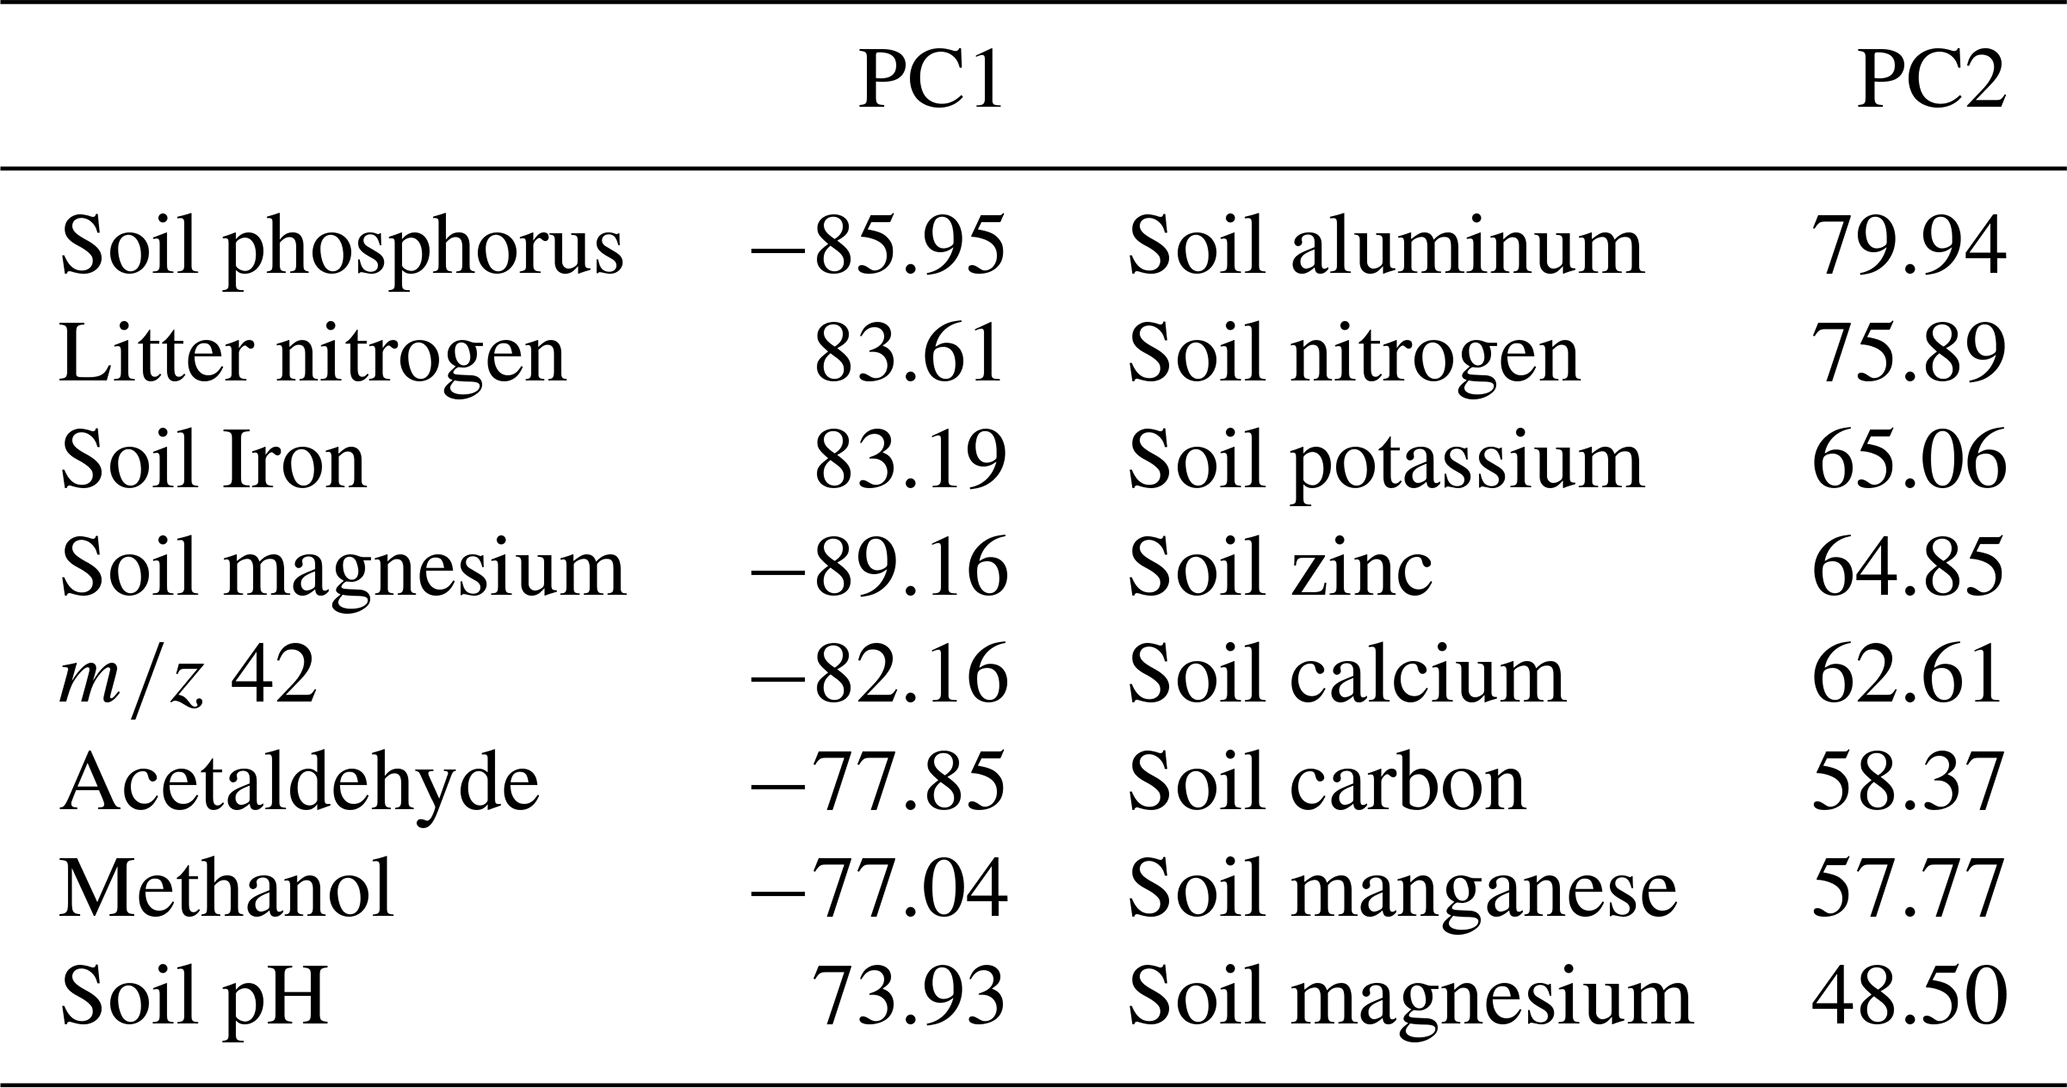
A PCA of soil and litter characteristics and microbial biomass, and gas fluxes (BVOC and GHG) indicated that PC1 and PC2 axes accounted for 48.5 % of the data variation (Fig. 8). The first axis explained 31.6 % and the second 12.6 % (Table 3). The PCA grouped forest types into two distinct groups: Ancient River Terrace and Upland Forests showed considerable overlap, with lower fluxes linked to litter characteristics, soil and litter microbial biomass, CO2, and soil pH. In contrast, the White Sand Forest formed a separate group with higher fluxes associated with soil temperature, moisture, and elevated levels of phosphorus, magnesium, and potassium.
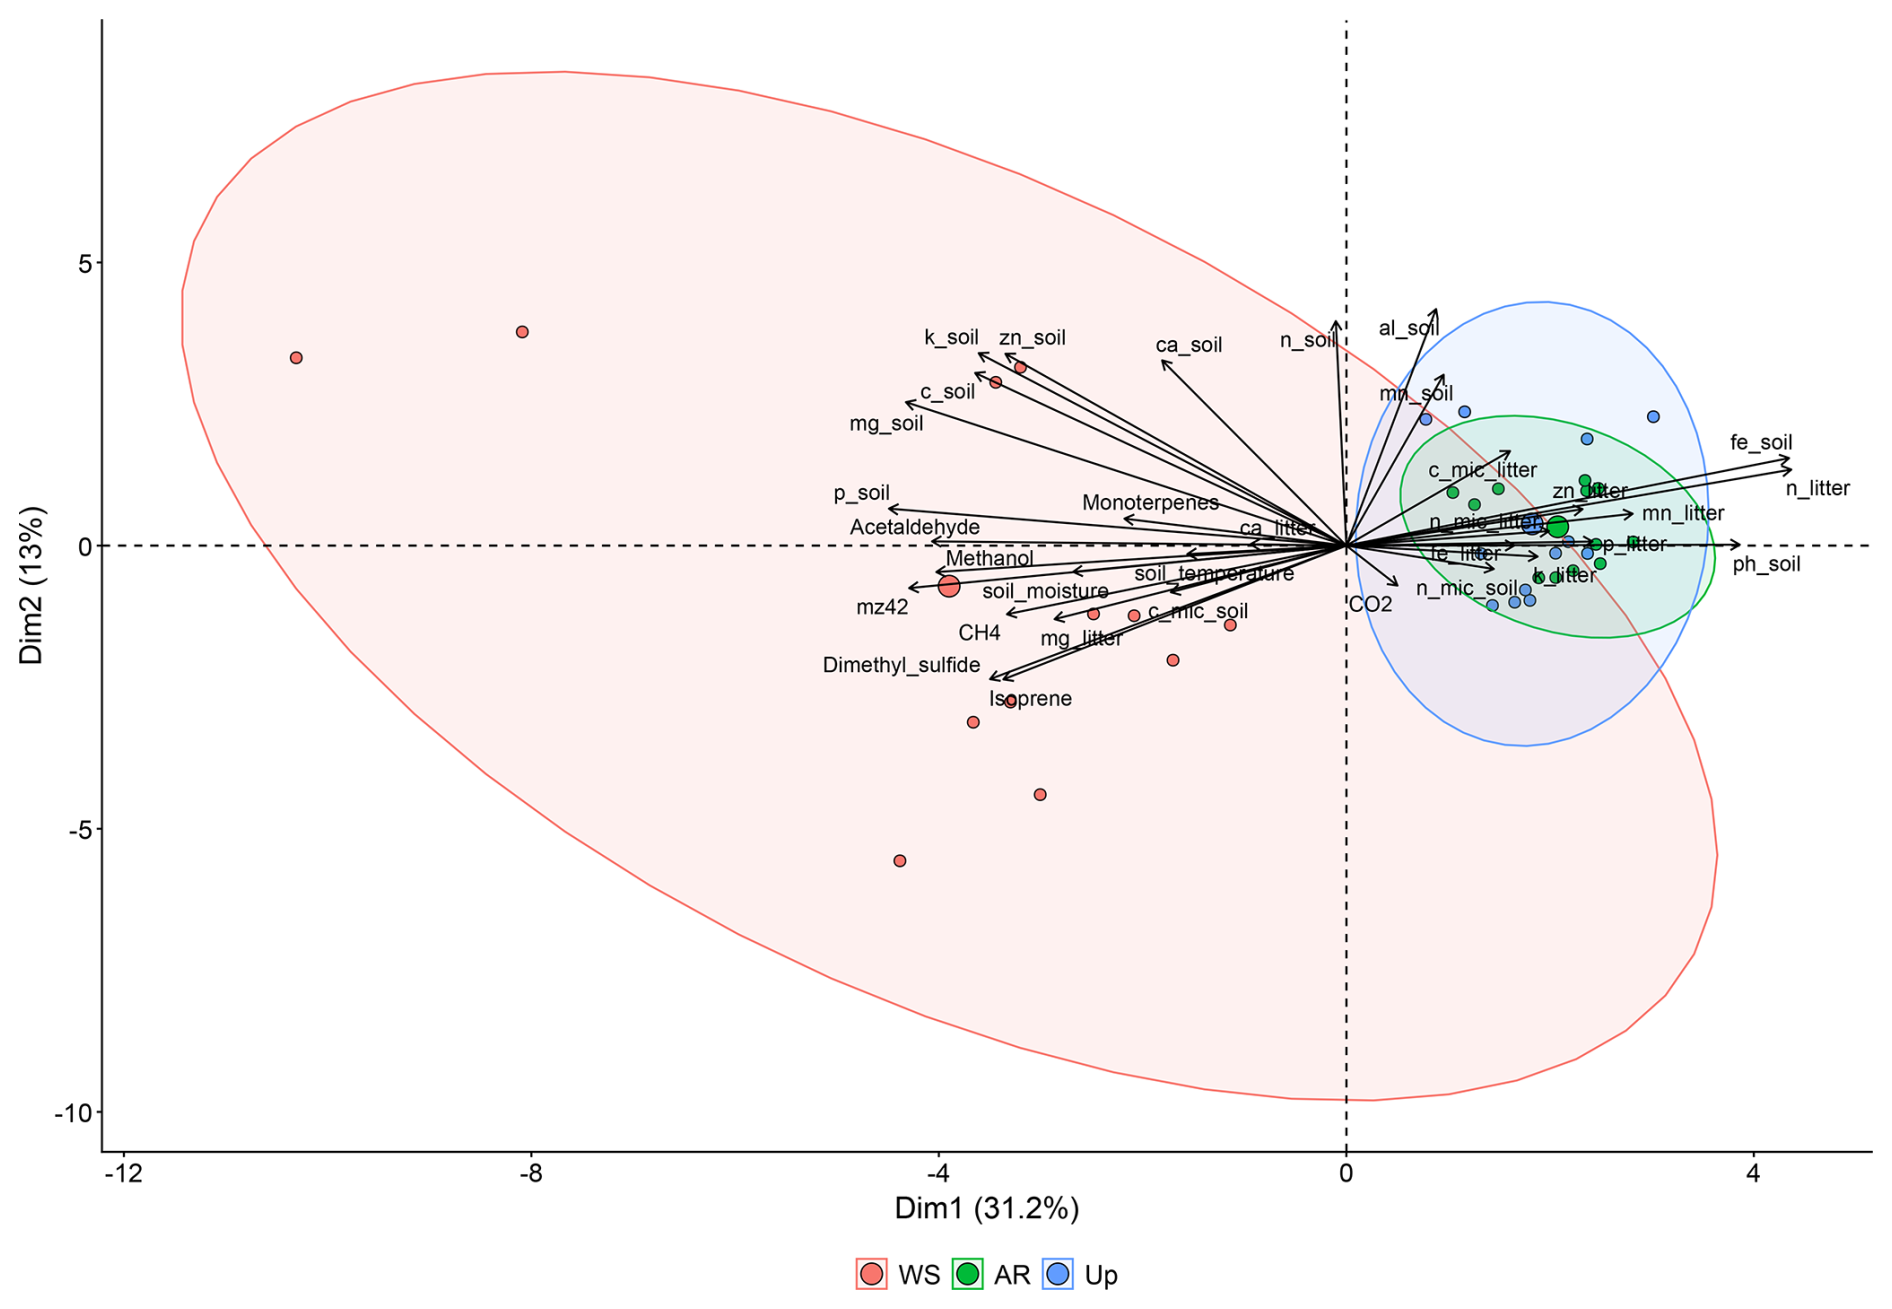
Figure 8PCA wherein the vectors reflect their correlation with the variables, and the colored circles represent the average PCA score related to each ambient. The analyzed variables are BVOCs (methanol, 42, acetaldehyde, DMS, isoprene and monoterpenes), greenhouse gases (methane and CO2), soil characteristics (carbon, nitrogen, phosphorus, potassium, calcium, magnesium, aluminum, iron, zinc, manganese, pH, temperature, and soil moisture), litter characteristics (carbon, nitrogen, calcium, magnesium, potassium, iron, zinc, manganese), and soil and litter microorganism dynamics (soil microbial nitrogen, soil microbial phosphorus, soil microbial carbon, litter microbial nitrogen, litter microbial phosphorus and litter microbial carbon). AR = Ancient River Terrace Forest, Up = Upland Forest, WS = White Sand Forest.
Table 3Percentage correlation values extracted from PCA; Fig. 8.
3.2.2 Linear regression models for different forest types
We used linear regression models (referred to as linear models) to better understand the relationships between predictor variables and fluxes, as identified by the PCA analyses. Flux predictors showed substantial variation between the forest types (Figs. S3a, b, S4a, b, and S5a, b, in Sect. S5; Supplement). Model comparisons for each forest type revealed similarities between Ancient River Terrace Forest and Upland Forests (Table 4). In contrast, the White Sand Forest was distinct (Table 4), as also shown by the PCA analysis.
In the Ancient River Terrace Forest, linear models for gas fluxes and predictor variables showed coefficients of determination (R2) above 0.8 for methanol, acetaldehyde, isoprene, and monoterpenes (Table 4). The most important nutrients for predicting gas fluxes from this forest type were potassium, manganese, magnesium, iron, carbon, and phosphorus. The linear models for monoterpenes had soil microbial biomass carbon and litter potassium as predictors. The linear models for GHG had soil temperature, soil moisture, and litter nutrients as predictors.
Table 4Multiple linear regression models with soil and litter characteristics and microbial biomass as predictors of gas fluxes in the three forest types – Ancient River Terrace Forest (AR), Upland Forest (Up), and White Sand Forest (WS). B = unstandardized coefficients. CI = confidence interval. f2 = Cohen's f2 effect size. R2 = R-squared value. = Adjusted R-squared value. N=36.
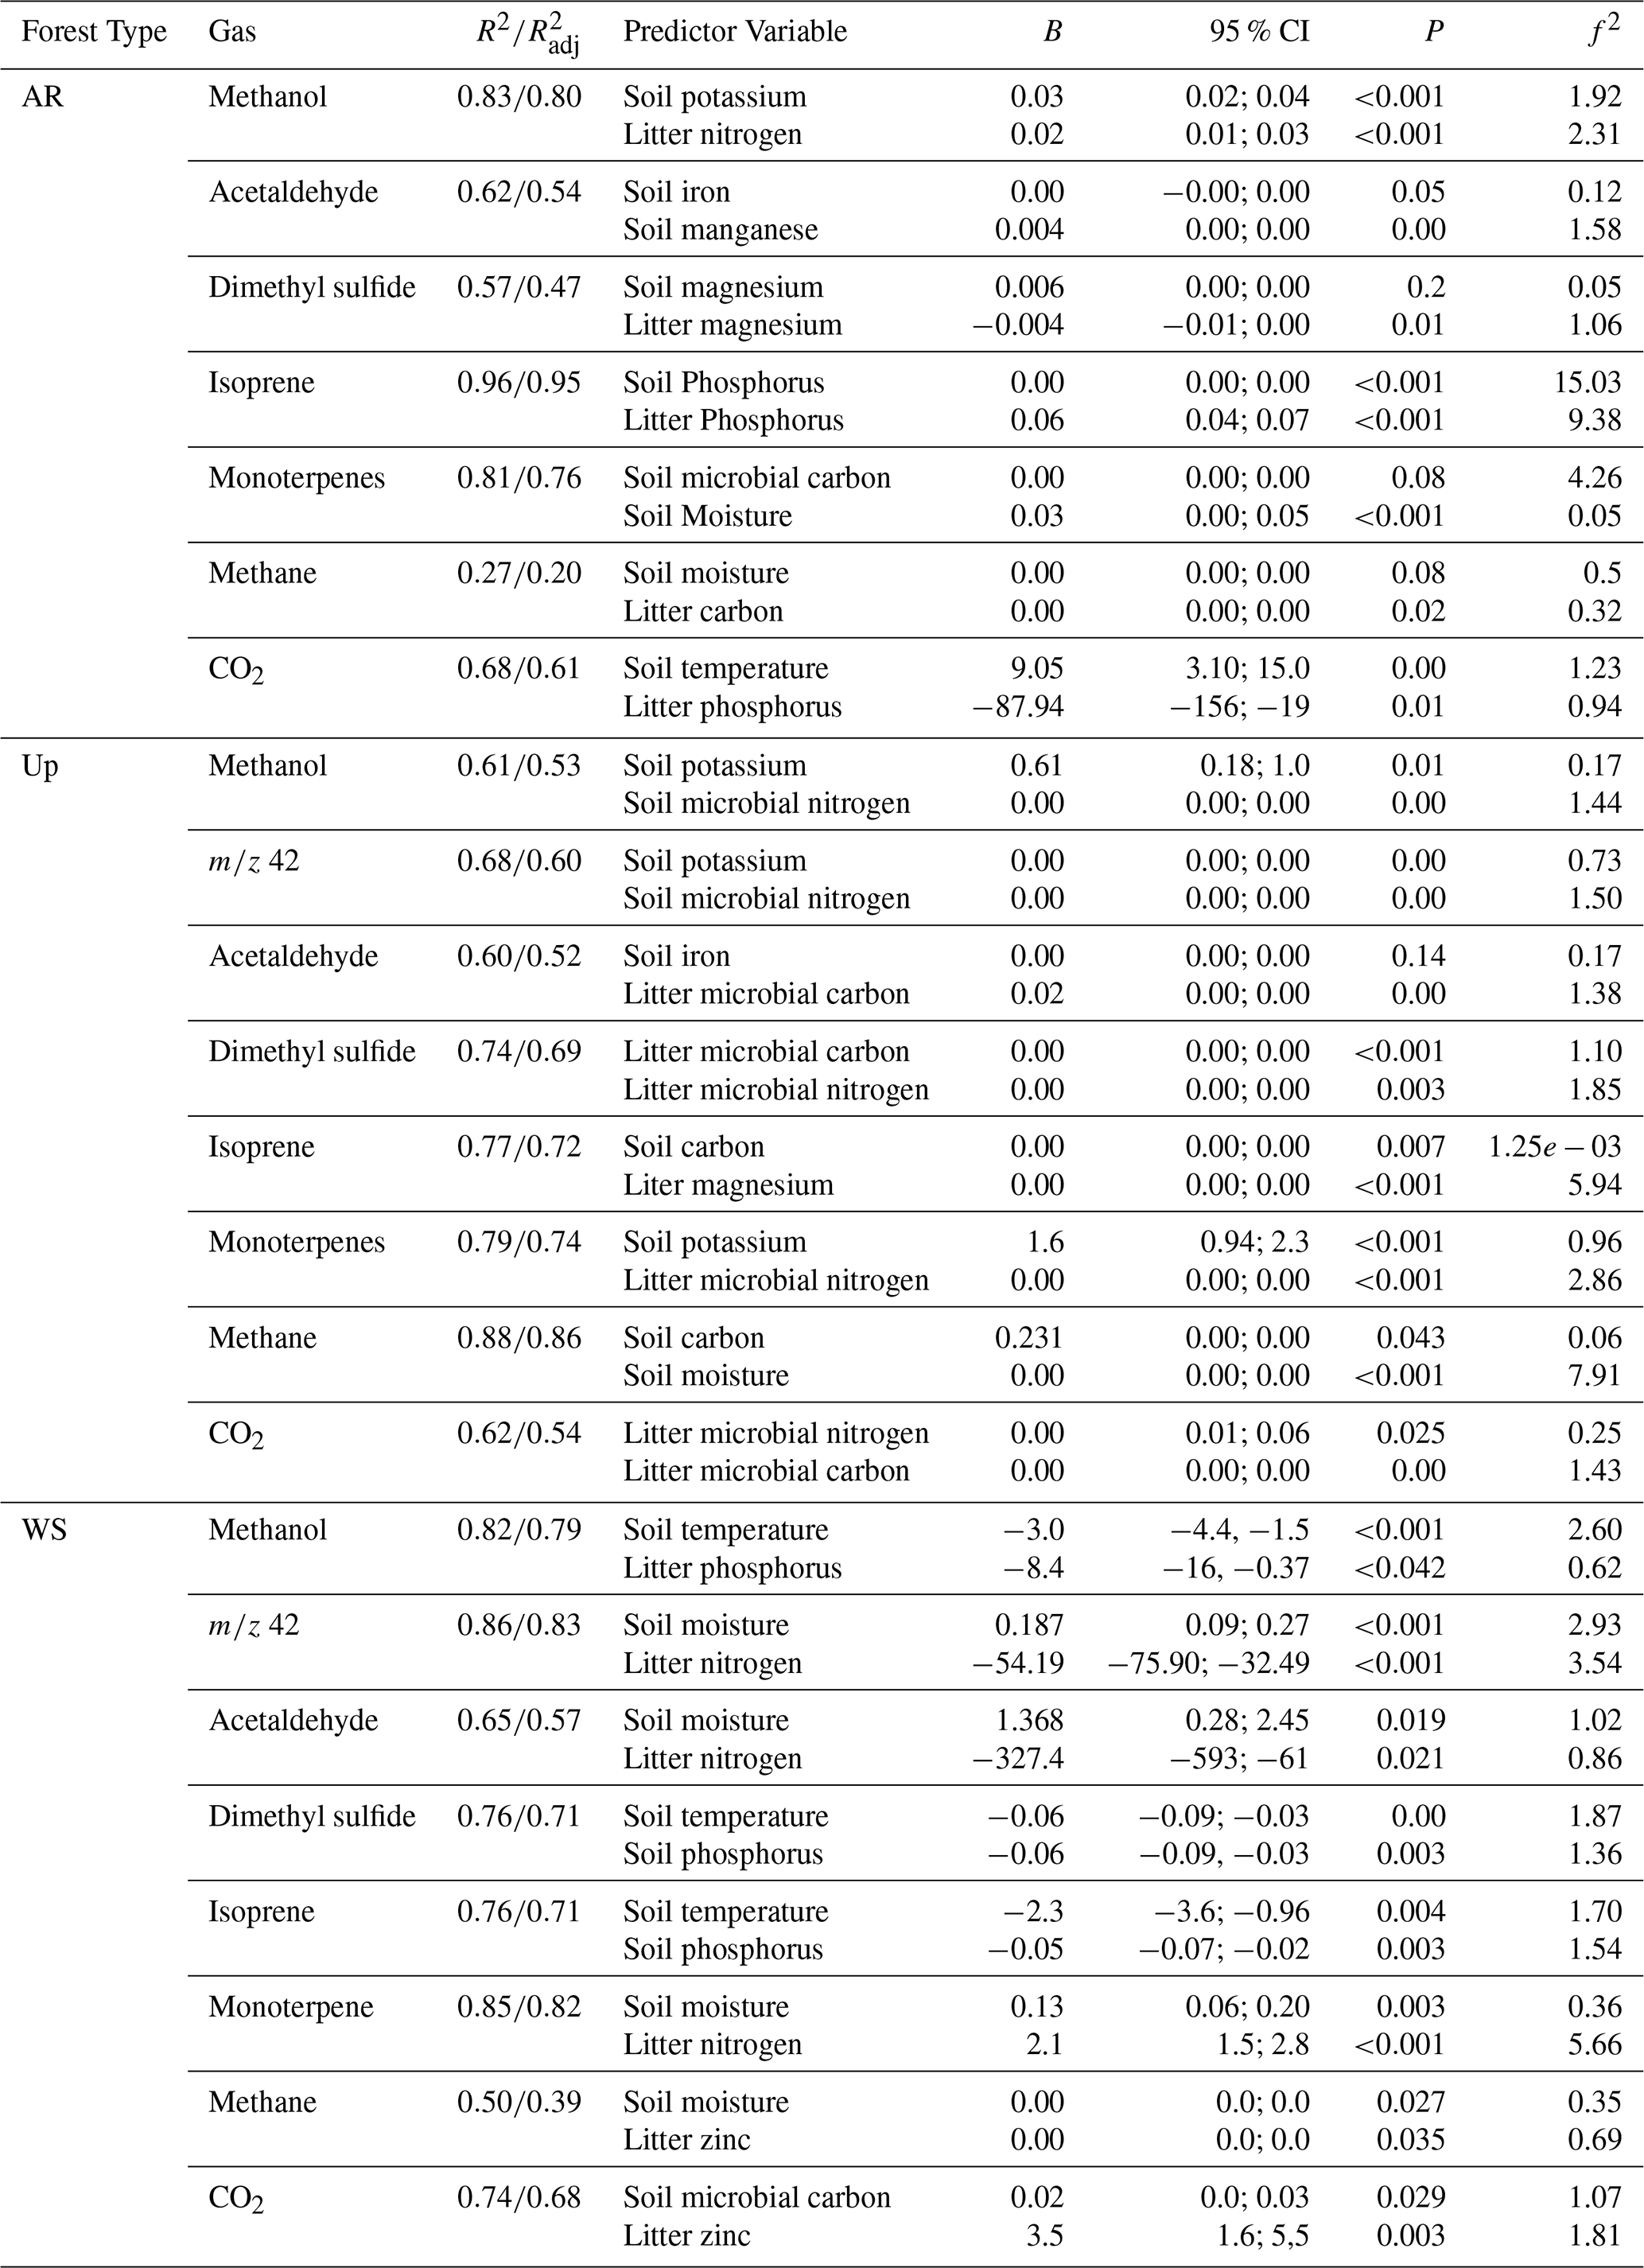
For the Upland Forest, linear models for gas fluxes showed R2 higher than 0.8 for isoprene and methane (Table 4), and key nutrients for predicting gas fluxes included potassium, iron, manganese, and carbon. Microbial biomass was significant in predicting gases like methanol and DMS. Acetaldehyde and isoprene shared soil iron and manganese as predictors, while DMS and CO2 were linked to litter carbon and microbial nitrogen.
In the White Sand Forest, linear models showed R2 higher than 0.8 for methanol, 42, and monoterpenes (Table 4). Key nutrient predictors included phosphorus, nitrogen, and zinc. All emitted gases (except CO2) were influenced by soil temperature or moisture. Soil temperature was inversely related to fluxes of methanol, DMS, and isoprene, while emissions of 42, acetaldehyde, monoterpenes, and methane increased with soil moisture.
3.3 Spatial variability within forest types
Figure 9 shows BVOC and GHG fluxes of each Transect, Fig. 10 shows soil temperature and soil moisture of each Transect, and Fig. 11 illustrates the spatial variability within and between Transects for isoprene and monoterpenes (see Supplement, Sect. S7; Figs. S8, S9, and S10 for other gases). In the Ancient River Terrace Forest, BVOC fluxes were generally lower in Transect 1, while GHG fluxes were similar between Transects (Fig. 9); soil temperature was higher in Transect 1, while Transect 2 was slightly wetter (although not statistically significant) (Fig. 10). White Sand Forest exhibited the greatest variation between Transects, with the highest BVOC emissions in Transect 2, and significant variations in acetaldehyde, 42, DMS, isoprene, and methanol; monoterpene fluxes showed high variation in emissions and consumption in Transect 1, while Transect 2 had low variation and high emissions; and methanol was emitted in Transect 1 and consumed in Transect 2. In the Upland Forest, significant differences between Transects were noted for acetaldehyde, 42, DMS, and isoprene.
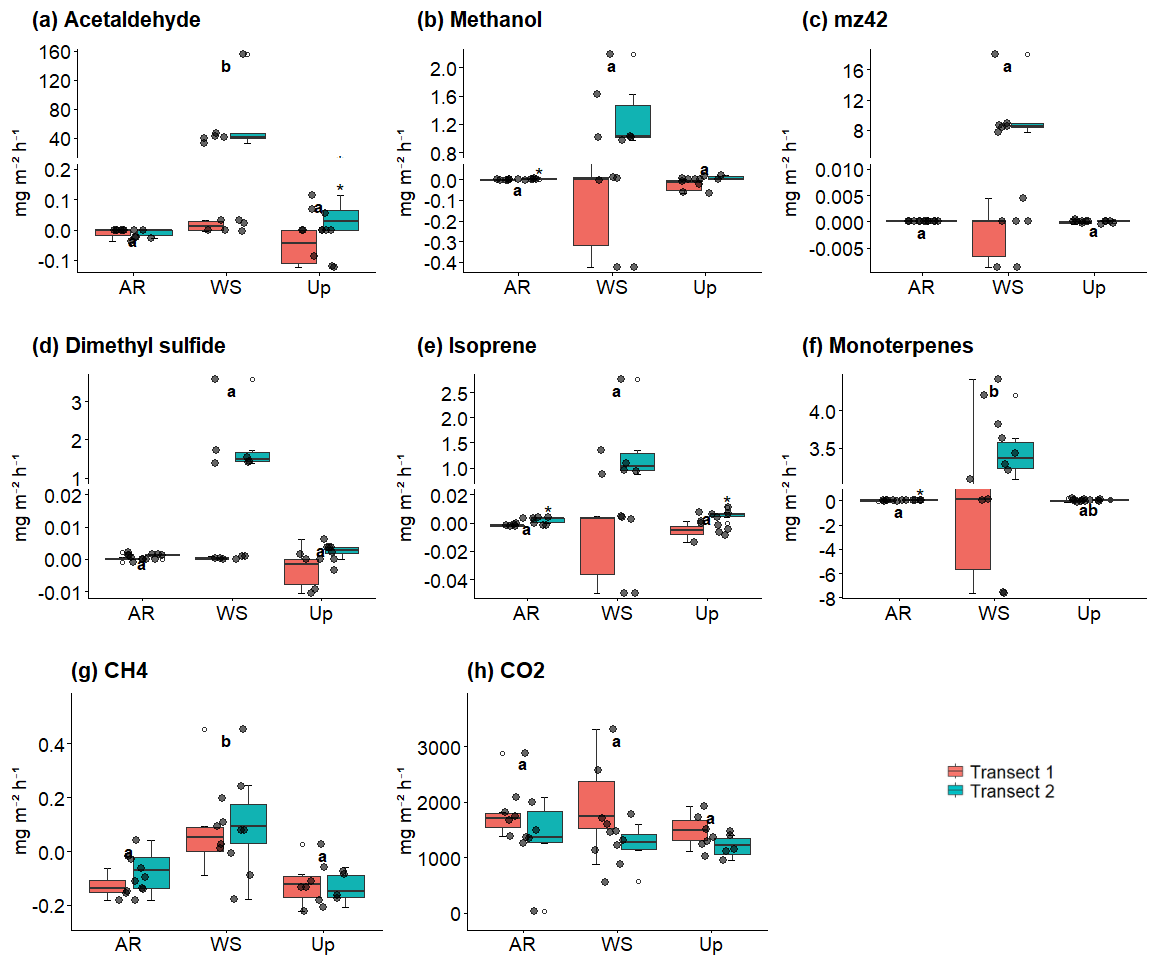
Figure 9Soil–litter BVOC and greenhouse gas (GHG) fluxes across three forest types and their respective transects: Ancient River Terrace Forest (AR), White Sand Forest (WS), and Upland Forest (Up). Panels show (a) acetaldehyde, (b) methanol, (c) 42, (d) dimethyl sulfide (DMS), (e) isoprene, (f) monoterpenes, (g) methane (CH4), and (h) carbon dioxide (CO2). Colors indicate the two transects within each forest type. Different letters indicate statistically significant differences between forest types (p<0.05; N=36), assessed using the Kruskal–Wallis test for non-normal data. Boxes represent the median (horizontal line) and the interquartile range (IQR). Whiskers extend to 1.5 × IQR, and points represent individual observations. For panels (a)–(f), the y-axis is broken and displayed on two scales to improve the visualization of variation in flux values.
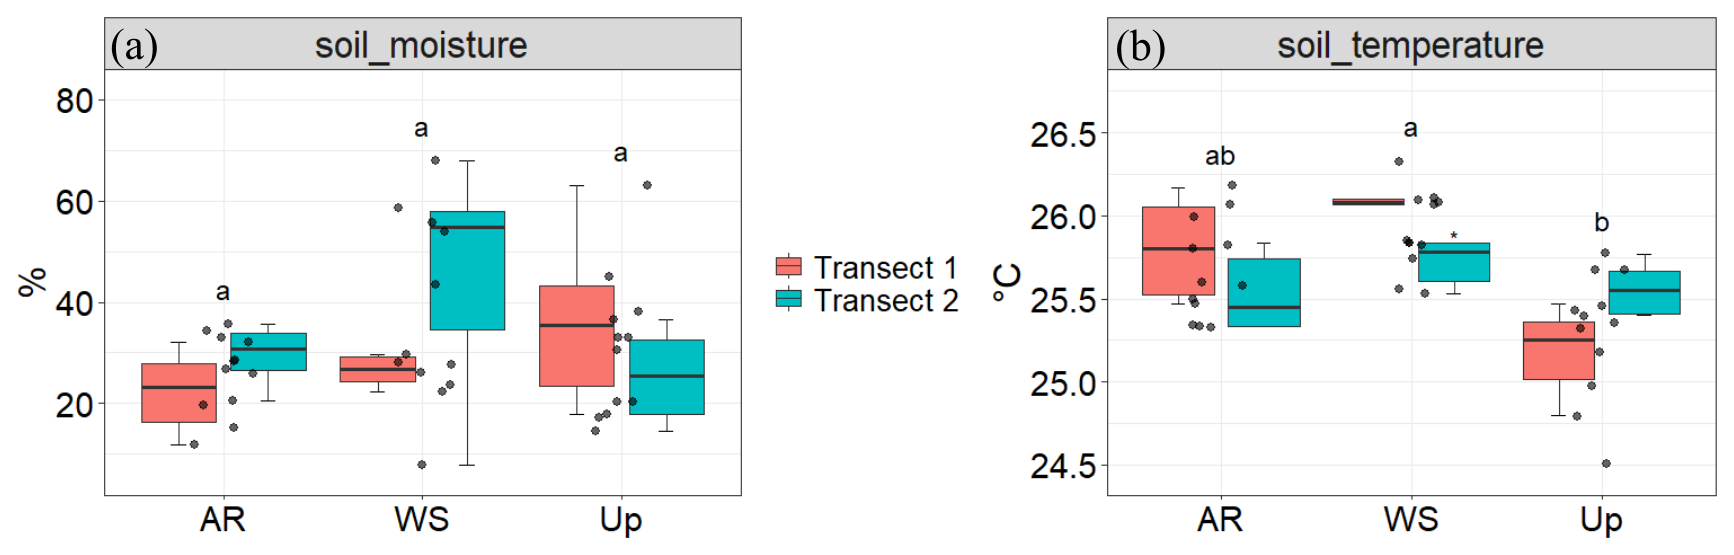
Figure 10Soil moisture (%) and soil temperature (°C) across three forest types and their respective transects: Ancient River Terrace Forest (AR), White Sand Forest (WS), and Upland Forest (Up). Panels show (a) soil moisture and (b) soil temperature. Colors indicate the two transects within each forest type. Different letters indicate statistically significant differences between forest types (p<0.05; N=36), assessed using ANOVA for normally distributed data. Boxes represent the median (horizontal line) and the interquartile range (IQR). Whiskers extend to 1.5 × IQR, and points represent individual observations.
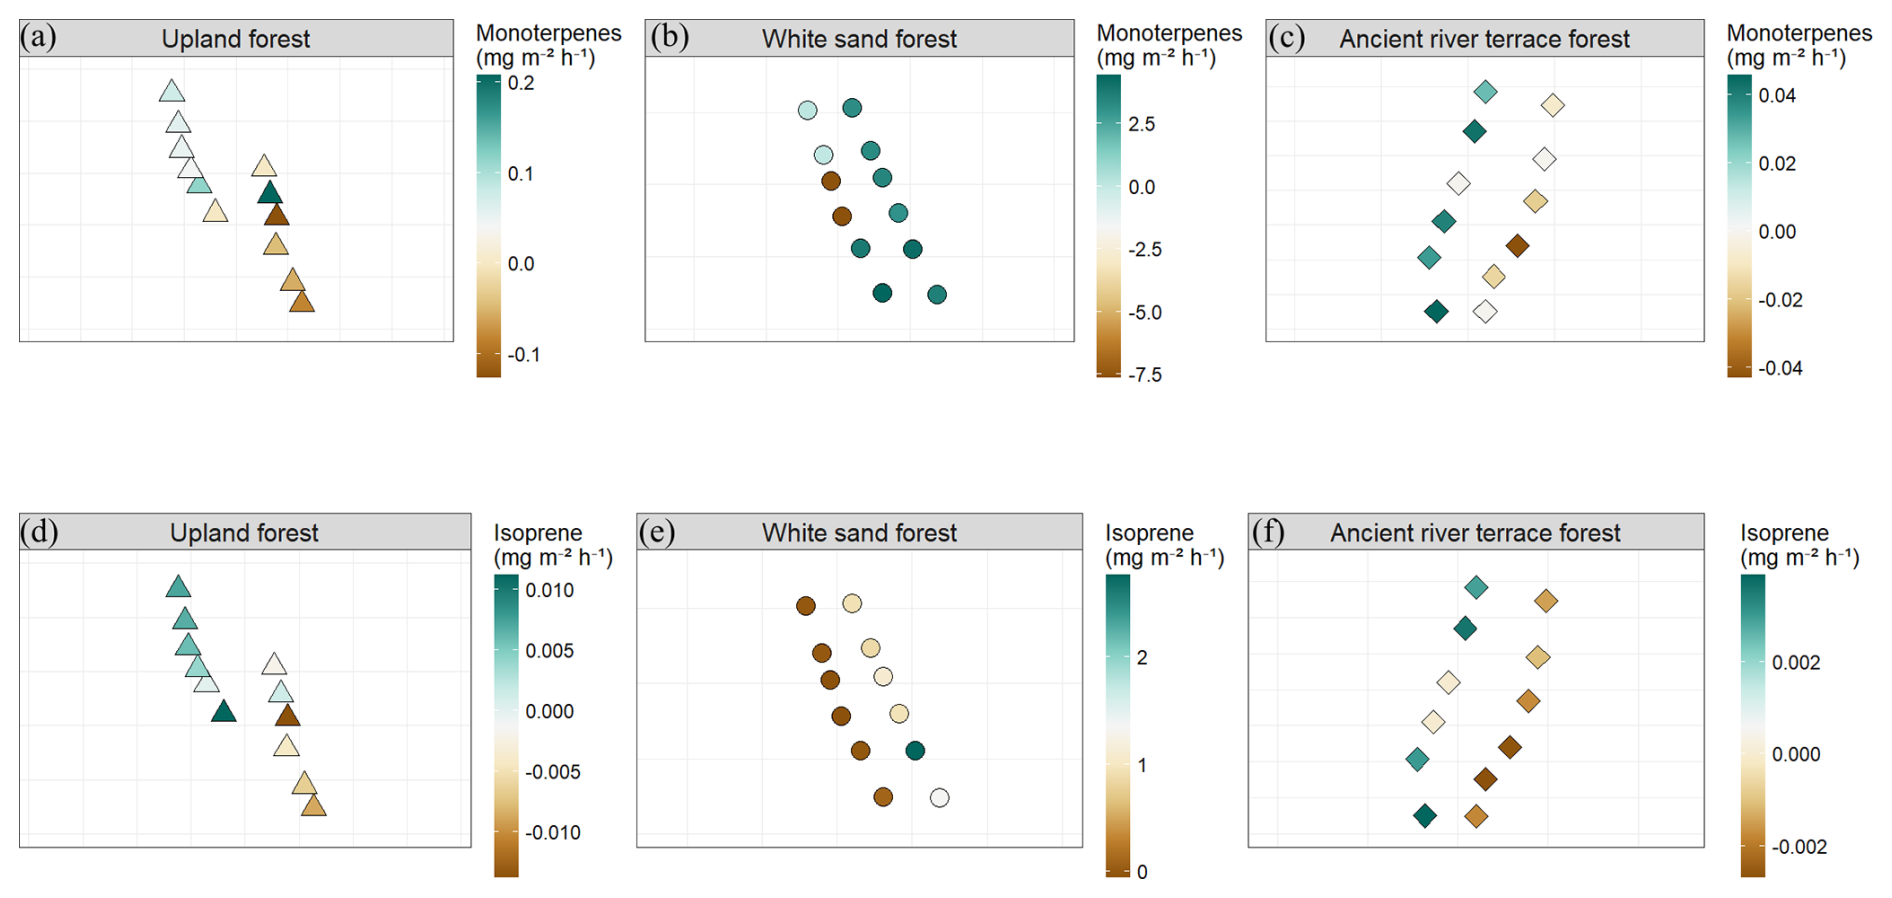
Figure 11Spatial distribution of BVOC fluxes across sampling points within the three forest types: Upland Forest, White Sand Forest, and Ancient River Terrace Forest. Panels show monoterpene fluxes (a–c) and isoprene fluxes (d–f), expressed in mg m−2 h−1 . Each forest type includes two transects sampled on consecutive days, with six sampling points per transect (N=12 per forest type). Points represent individual chamber locations along each transect, illustrating the spatial heterogeneity of BVOC emissions within the forest plots.
Previous studies investigating tropical soil BVOC fluxes using in-situ measurements and incubation (Bourtsoukidis et al., 2018) and fertilization experiments (Llusià et al., 2022) showed that fluxes were higher than previously anticipated. Although these pioneer studies were very important to understand soil BVOC fluxes from the tropics, our study took one step further by investigating soil-litter BVOC and GHG fluxes across Amazonian Forest types. We found that soil-litter BVOC and GHG fluxes changed across forest types and were influenced by differences in nutrient content, soil moisture, temperature, and microbial biomass. Given the extensive number of measured variables, we chose to focus our discussion on the key observations related to BVOC and methane fluxes and their drivers, rather than covering all variables and fluxes. However, since these variables may still be of interest to the reader, detailed analyses are provided in the Supplement (Sect. 5). In the following sections, we first compare soil–litter properties among forest types, followed by a comparison of observed BVOC and GHG fluxes both between forest types and with other tropical studies. We then discuss their potential drivers and the broader significance of our findings.
4.1 Differences in soil and litter nutrient contents across forest types
Variations in soil and litter properties were observed among forest types, particularly concerning their total nutrient contents. These total nutrient pools reflect long-term nutrient availability and reservoirs within each ecosystem, shaped by distinct biogeochemical processes. In the Ancient River Terrace Forest, high concentrations of potassium and phosphorus were found in the litter, suggesting strong nutrient retention and efficient cycling within this forest type. This may result from its history of periodic flooding and the presence of allisols – relatively young, nutrient-rich soils (Andreae et al., 2015).
In the Upland Forest, the dominance of soil iron total content is likely related to the intense leaching common in its ferrasols (oxisols), resulting in iron enrichment due to the removal of other nutrients (Mosquera et al., 2024). In addition, the formation of iron oxides can reduce the mineralization of organic matter, promoting iron accumulation in the leaf litter (Li et al., 2023). The White Sand Forest showed differences in soil properties when compared to the other forest types analyzed. Despite its well-documented low fertility (de Mendonça et al., 2015; Demarchi et al., 2022) and arenosol characteristics, this forest type displayed unexpectedly high soil phosphorus and carbon total concentrations. Phosphorus total concentrations, for instance, were up to four times higher than in Upland and Ancient River Terrace Forests. This observation may possibly reflect the role of dissolved organic nutrients in mitigating nutrient limitations (Lange et al., 2024), or the efficient capture and retention of nutrients within the forest's extensive root mats, which can enhance carbon storage and nutrient cycling in structurally analogous ecosystems (Draper et al., 2014). Furthermore, iron total concentrations in the soil of this forest were lower than expected (Cornu et al., 1997), possibly attributed to spatial variability and seasonal dynamics. During the dry season, the low water-retention capacity of sandy soils leads to drought stress, whereas in the wet season, leaching redistributes iron, aluminum, and magnesium (García-Villacorta et al., 2016) – a process that can form cemented horizons, impeding drainage and elevating water tables (Franco and Dezzeo, 1994; Demarchi et al., 2022). Variable iron concentrations, together with wet-season leaching and elemental redistribution, shape the White Sand Forest into a highly distinct environment. In addition, tree species composition could play a role in influencing nutrient stocks in this forest type (García-Villacorta et al., 2016; Gomes Alves et al., 2022).
4.2 Differences in Gas Fluxes across Forest Types
Here, by comparing forest type fluxes, it is important to recognize that our chamber measurements represent the combined (net) flux from both soil and litter. Observed differences between sites may therefore reflect variations in the relative contributions of soil and litter, for example, due to differences in litter amounts. The amount of litter in the chambers was not quantified, although we generally observed more litter in the White Sand Forest and Ancient River Terrace Forest. These patterns may also vary seasonally as litter inputs and decomposition rates change throughout the year (Rodrigues et al., 2023), potentially contributing to local differences in soil–litter gas fluxes. Because our measurements do not allow us to separate these sources, we treat soil and litter as a single compartment in our analysis and discuss differences in combined soil–litter fluxes across forest types. Future studies should include measurements of litter mass and species composition to better constrain their influence on gas exchange.
The White Sand Forest exhibited the highest emissions and consumption of BVOCs and GHGs, accompanied by the greatest chemical diversity in gas fluxes. Plant species endemic to this ecosystem may influence BVOC emission patterns and their chemical speciation: Fine et al. (2004, 2006) showed that tree species adapted to very nutrient-poor sandy soils highly invest in secondary metabolite compounds in defense against herbivory, since leaves are very energetically costly for the plant. This large quantity of secondary compounds can directly influence litter decomposition rate (Chomel et al., 2016) and probably release gases and various compounds into the soil and water (Caetano Garcia, 2022).
No clear differences between forest types were observed for the soil–litter CO2 exchange fluxes. The large variation at the local scale, both within and between forest types, has previously been reported for a central Amazonian field site (van Asperen et al., 2020). Overall, the values measured in this study fall within the range commonly reported for soil respiration in Amazonian forests. Previous studies across different forest types in central Amazonia have documented soil CO2 fluxes typically between ∼ 2 and 6 µmol m−2 s−1 (corresponding roughly to 320–950 mg m−2 h−1), with fluxes largely depending on soil moisture and temperature conditions (van Asperen et al., 2020; Chambers et al., 2004; Doff sotta et al., 2004).
Isoprenoids were emitted in considerable amounts in the White Sand Forest. As isoprenoids are not expected to be emitted from soil (Bach and Rohmer, 2013; Asensio et al., 2008), the observed high emissions might indicate contributions from the activity of microorganisms living in the soil and litter (Carruthers and Lee, 2021; Hernandez-Arranz et al., 2019). In addition, it is important to note that, although emissions in this study are expected to come from soil and litter, the contribution of root emissions cannot be ruled out, as the main source of isoprenoids is expected to be plant metabolism (Pulido et al., 2012; Thulasiram et al., 2007).
A previous study on experimental rainforest soils – similar to Upland Forest soils – showed BVOC soil uptake (under wet conditions) primarily for isoprenoids, carbonyls, and alcohols, as well as soil emissions of DMS and carbonyl compounds such as acetaldehyde and acetone (Pugliese et al., 2023). Our Upland Forest isoprene fluxes exhibited lower soil uptake (−0.005 mg m−2 h−1) compared to the increased uptake fluxes under drier conditions (∼ −2.38 mg m−2 h−1) observed by Pugliese et al. (2023). This lower isoprene uptake by the soil observed in the Upland Forest likely reflects microbial assimilation and/or abiotic sorption processes acting on atmospheric isoprene within the soil–litter compartment. These processes are strongly influenced by forest structural attributes and underlying soil properties, which are likely different between this study and Pugliese et al. (2023). Additionally, the higher atmospheric isoprene concentrations reported by Pugliese et al. (2023) compared with those in this study may help explain the greater soil isoprene uptake observed in their work.
In general, our Upland and Ancient River Terrace Forests showed lower average emissions and uptake than those reported by Pugliese et al. (2023). A study focusing on methanol fluxes in cropland soils observed values ranging from 0.53 to 2.93 mg m−2 h−1 (Liu et al., 2024), which are higher than those observed in our study in Upland and Ancient River Terrace Forests but comparable to the White Sand Forest fluxes (0.61 ± 0.81 mg m−2 h−1). These higher emissions in crop soils can likely be attributed to factors such as crop species, tillage, fertilization, and irrigation, which can all influence BVOC emission rates; whereas the high methanol emission observed in our study could be related to the root growth of White Sand Forest's extensive root mats, although future studies are necessary to confirm this hypothesis.
The highest DMS emissions were observed in the White Sand Forest (∼ 1.10 ± 1.14 mg m−2 h−1), which were higher than the DMS emission of 5.76 µg m−2 h−1 reported by Jardine et al. (2015) for Amazon soils. However, while an interesting observation, it is important to note that the high magnitude of DMS fluxes presented here might partly be caused by a potential agglomerate of acetaldehyde (mass 45) with water, resulting in the same mass as DMS (63), suggesting that future studies should make use of techniques that differentiate these compounds.
A compound with a mass-to-charge ratio () of 42 was observed in the White Sand Forest, but its identity could not be confirmed due to technical limitations (Dunne et al., 2012). This 42 is frequently attributed to acetonitrile, a known biomass burning marker primarily associated with anthropogenic sources (Huangfu et al., 2021). However, since it can also be emitted by microorganisms (Raio et al., 2020), it is possible that the microbial communities of the White Sand Forest contributed to potential acetonitrile ( 42) emissions.
Methane uptake was observed in the Upland (−0.12 mg m−2 h−1) and Ancient River Terrace Forests (−0.10 mg m−2 h−1), whereas emissions were observed in the White Sand Forest (0.12 mg m−2 h−1). In another central Amazonia site, Upland Forest methane fluxes of similar magnitude were observed (−0.02 to −0.09 mg m−2 h−1) (van Asperen et al., 2020). However, the discrepancy in White Sand Forest fluxes, with uptake reported in their study (−0.38 to −0.25 mg m−2 h−1) and emissions observed here, can likely be attributed to the high spatial variability characteristic of white sand forest ecosystems.
4.3 Drivers of Soil and Litter Gas Fluxes
4.3.1 Soil moisture and soil temperature as drivers of soil-litter gas fluxes
A PCA was initially conducted to identify variables that might differentiate forest types and their gas fluxes. However, due to the overlapping ellipses and limited discrimination capacity, linear models were applied to further explore the findings. These models highlighted soil temperature and moisture as key physical drivers across all three forest types, aligning with observations in other ecosystems (Trowbridge et al., 2020; Pugliese et al., 2023; Liu et al., 2024).
Nevertheless, before evaluating these key drivers, it is important to recognize that external factors inevitably influence soil moisture and temperature. Although transects were consistently measured at the same time (08:00–10:00 local time), they were conducted on consecutive days under varying weather conditions. In addition, while radiation was not quantified during the campaign, its effects should be considered. Despite the use of opaque chambers, the chamber surrounding environment – and thus the prevailing BVOC flux dynamics – may still be modulated by incoming radiation. These factors are particularly important in the White Sand Forest, where the open canopy, short stature, and shallow water table (Adeney et al., 2016; Rossetti et al., 2019) promote highly dynamic conditions, reflected in the strong variability of soil temperature and moisture between consecutive transects. While on one hand these factors represent a limitation, it also allowed us to explore the influence of external factors on gas fluxes within the same forest type, such as the rain event, which will be discussed hereafter.
In addition to the complicating external factors, we should also note that high soil moisture values were generally accompanied by lower soil temperatures, thereby complicating separating individual drivers. A similar pattern was observed by van Asperen et al. (2024), who showed that the direct effects of temperature and moisture are difficult to differentiate under tropical field conditions, where temperature variation is usually small. Furthermore, it should be noted that this study is additionally limited by a small temporal dataset. Thus, although some BVOC fluxes showed a positive association with soil moisture and a negative association with soil temperature, distinguishing the primary driver remains difficult. Nevertheless, despite the limitations described above, we discuss the expected effects of soil moisture and temperature on our fluxes below.
We observed a negative relationship between temperature and certain BVOC fluxes, but we interpret this as an indirect effect mediated by the previously described link to soil moisture. In general, elevated temperatures are expected to enhance both BVOC emissions and biological uptake, as described by Baggesen et al. (2022). If the temperature sensitivity of uptake exceeds that of emission, this may result in reduced net emissions or even a net sink for BVOCs (Asensio et al., 2007; Peñuelas et al., 2014; Jiao et al., 2023).
For soil moisture, we found a clear relation with most of the BVOC fluxes, especially for the White Sand Forest. The effects of moisture on BVOC fluxes were also described by Pugliese et al. (2023), who reported that rainforest soils acted as net BVOC sinks under moist conditions and as net BVOC sources under dry conditions. In the Upland Forest, we observed a similar pattern as Pugliese et al. (2023), with the wetter Transect showing BVOC consumption while the drier Transect showed emissions. The White Sand Forest showed even stronger inter-Transect differences, with high BVOC emissions observed in the wetter Transect, and low emissions and uptake observed in the drier Transect. The pronounced differences between these Transects suggest that the rainfall event preceding Transect 2 was an important driver of the observed variation. A similar hypothesis was posed by Bourtsoukidis et al. (2018), who also observed that sesquiterpene emissions from Upland Forest soils in the dry season (after a rain event) were comparable to those from vegetation. In addition to increasing soil moisture, the physical impact of rainfall may trigger short-term emission bursts (Miyama et al., 2020). As we observed substantially high isoprene, monoterpenes, and acetaldehyde emissions in Transect 2 of the White Sand Forest, we argue that these observed BVOC emissions represent a burst induced by the preceding rainfall event. Similar observations have been reported by Greenberg et al. (2012), who observed increased BVOC emissions during and immediately after rainfall in a Ponderosa pine plantation, and by Jardine et al. (2015), who reported a peak in soil DMS emissions following rainfall.
Overall, we hypothesize that the rainfall event induced an emission burst, mostly explaining the elevated BVOC fluxes observed in that transect. Nevertheless, interactions between soil temperature, soil moisture, and BVOC fluxes remain highly complex across heterogeneous forest types, with external drivers contributing to strong spatial and temporal variability and making their combined effects difficult to separate under natural field conditions.
4.3.2 Forest Type-specific Drivers of Soil-litter Gas Fluxes
We observed that drivers of soil and litter gas fluxes varied across forest types, reflecting their unique environmental conditions and nutrient dynamics. In general, Ancient River Terrace and Upland Forests showed many similarities in the predictors of certain gases, while other drivers were found for the White Sand Forest. Here, we focus on the key factors influencing gas fluxes: soil nutrients, microbial biomass, and their interactions with environmental conditions.
Soil potassium was found to be a significant factor influencing Ancient River Terrace and Upland Forest fluxes, being identified as a predictor of methanol and monoterpenes. In addition, it was also identified as a predictor of 42 fluxes in the Upland Forest. Although we did not find studies directly related to BVOCs and GHGs fluxes to soil potassium content, potassium is an essential macronutrient for plant growth and metabolism. Its availability is known to affect plant physiological processes (Wang et al., 2013), and its cycling within the soil environment, often mediated by microbial activity, influences potassium's uptake by plants (Mazahar and Umar, 2022). These plant- and soil-mediated processes can, in turn, indirectly influence the BVOC production and release observed within the soil-litter compartment of our study, by affecting the overall ecosystem health and the quality of organic matter available for decomposition.
In the Upland Forest, our methane consumption fluxes correlated well with soil carbon (in conjunction with soil moisture, as mentioned previously). Soil organic carbon is known to play an important role in supporting methanotrophic bacteria, which are responsible for methane oxidation (Lee et al., 2023); therefore, we suggest that the total soil carbon observed in our study might affect methane uptake through a similar process. Phosphorus, like carbon, is a key nutrient in the soil and significantly affects BVOC soil-litter fluxes, especially for methanol in the White Sand Forest. The relationship between phosphorus and BVOC emissions is well documented for plants since the availability of phosphorus can influence the production and emission of BVOCs (Ndah et al., 2022). However, some fertilization studies have also shown that increasing soil nutrient status (nitrogen, phosphorus, and potassium) can modify pH levels, affecting microorganisms and their health state (Stotzky et al., 1976), which directly or indirectly promotes or inhibits soil BVOC fluxes (Liu et al., 2024; Raza et al., 2017). Our findings with bi-directional soil-litter fluxes in the White Sand Forest are consistent with these previous studies showing an increase or inhibition of soil BVOC fluxes with soil nutrient content.
Interestingly, our results suggested that lower phosphorus levels were associated with higher isoprene emissions. The mechanisms behind this relationship remain unclear. However, studies on soil fertilization in tropical forests by Llusià et al. (2022) found that phosphorus fertilization is less efficient than nitrogen fertilization in increasing monoterpene and sesquiterpene emissions (they did not find isoprene emissions). They observed that emissions increased when the soil was fertilized only with nitrogen – consistent with a phosphorus-limited system – because excess nitrogen stimulates the enzymes responsible for producing monoterpenes and sesquiterpenes. Conversely, the addition of phosphorus likely redirected this nutrient toward plant growth, resulting in lower emissions of monoterpenes and sesquiterpenes in the phosphorus-fertilized plots compared to those fertilized with nitrogen. As in this study, there was no fertilization or a controlled environment, so we cannot draw similar conclusions. However, our findings provide valuable insights into the possible interactions between phosphorus, nitrogen, and soil-litter BVOC fluxes in tropical ecosystems. These observations align with previous studies on the influence of soil nutrients (Liu et al., 2024; Llusià et al., 2022), and we suggest future soil fertilization studies to explore these relationships across soil and forest types in Amazonia.
For the Upland Forest, it was found that microbial biomass was a significant driver for almost all soil-litter fluxes, except for isoprene and methane. This aligns with previous studies that have identified microbial biomass as an important driver for soil-litter gas fluxes (Leff and Fierer, 2008; Mancuso et al., 2015; Tang et al., 2019). For example, research on soil organic matter degradation by Lehnert et al. (2024) demonstrated that it is an important source of DMS emissions, highlighting the role of microorganisms associated with decomposition. Similarly, studies on tropical plant litter VOC fluxes have shown that microbial processes within the litter layer can strongly influence the production and consumption of volatile compounds (Crocker et al., 2025). Jardine et al. (2015) point out that DMS emissions in Amazonian soil are related to microbial processes, a relationship also reported in litter studies by Kesselmeier and Hubert (2002). DMS can be produced in anaerobic environments, such as saturated soil or lakes (Lehnert et al., 2024). This may explain the high emissions observed in transect 2 (wetter and more saturated) of the White Sand Forest, where conditions favorable to anaerobic processes are common and frequently linked to the production of sulfur compounds such as DMS. In contrast, in the drier transect 1 of the upland forest, DMS consumption was observed, suggesting the occurrence of microbial uptake processes. In fact, another study has shown that bacteria can consume carbon from DMS as an energy source in soil and lake sediments (Eyice et al., 2015). Therefore, the observed uptake may be the result of microorganisms utilizing the carbon present in DMS as an energy source, leading to uptake rather than production. This dual role of microorganisms – as both producers and consumers of DMS – highlights the complexity of sulfur cycling in terrestrial ecosystems.
Based on the limited number of studies investigating the relationship between microorganisms and BVOC dynamics, it has been shown that some Proteobacteria, Actinobacteria, and Firmicutes can produce isoprene (Kuzma et al., 1995; McGenity et al., 2018). Bacillus subtilis can produce isoprene in response to stress; however, the mechanism is still not clear (McGenity et al., 2018). Some studies have shown that reduced microbial diversity, whether in soil (Abis et al., 2020; Sillo et al., 2024) or associated with plant surfaces (Saunier et al., 2020), can increase BVOC fluxes and alter the chemical composition of emitted compounds. Although microbial community data were unavailable in this study, we suggest that potential differences in microbial diversity may have influenced emission and consumption patterns. Recent advances combining genomic, metabolomic, and isotopic approaches have begun to directly link microbial metabolism with VOC production and transformation in soils (Hernandez et al., 2023). Integrating such approaches with gas flux measurements would help to better identify the microbial taxa and metabolic pathways involved in BVOC exchange. Therefore, future studies should combine flux measurements with microbial community and functional analyses to better understand these dynamics.
4.4 The relevance of White Sand Forest ecosystems
This study showed large variability across forest types and unexpectedly high BVOC emissions from the White Sand Forest. In general, relatively few studies have been performed on White Sand Forests, which is partly explained by the challenging conditions of this type of forest, such as flooding and extreme temperatures (Adeney et al., 2016). In addition, the scattered patches of differentiated vegetation distributed within extensive Upland Forests (Demarchi et al., 2022) can make access to these sites even more difficult and require specific infrastructure for data collection. While our observations constitute one of the first characterizations of BVOCs in this unique forest type, their capacity to capture the full spectrum of extreme conditions is inevitably limited by the short temporal coverage of the dataset. To the best of our knowledge, only one study has provided data on BVOC fluxes with soil incubation lab measurements (Bourtsoukidis et al., 2018), and another measuring GHGs in-situ (van Asperen et al., 2020) in White Sand Forests. Despite representing only 5 % of the Amazon basin area (Adeney et al., 2016) and 8 % of the Reserve of this study (Demarchi et al., 2022), White Sand Forests are extremely important environments. Their sandy, nutrient-poor soil type has created a challenging ecosystem for plant growth (Fine and Baraloto, 2016), and this unique condition has selected specialized flora and fauna adapted to thrive in these ecosystems (Adeney et al., 2016; Demarchi et al., 2022). This high level of endemism contributes significantly to the overall biodiversity of the Amazon Basin (García-Villacorta et al., 2016). Moreover, White Sand Forests have been shown to play a crucial role in the chemistry of dissolved organic matter (DOM) in Amazonian blackwater rivers, linking terrestrial ecosystem processes to aquatic biogeochemistry (Simon et al., 2021). Our results suggest a stronger link between White Sand Forest gas fluxes and physical factors (more than other forest types), which indicates a possible sensitivity to upcoming climate extremes. Although Costa et al. (2023) did not focus specifically on the White Sand Forest, they showed that regions of the Amazon with shallow water tables – such as the White Sand Forests – can act as hydrological refuges during droughts. In these areas, higher productivity under dry conditions may maintain relatively stable carbon dynamics, presenting a contrasting response to the substantial carbon losses typically observed in deep water table, Upland Forests, during drought. In addition, a recent study reported high atmospheric isoprene concentrations in the northwestern Amazon throughout most of the year (Wells et al., 2022) – a region characterized by extensive and continuous White Sand Forest cover (Borges et al., 2014). In this context, as White Sand Forests play a critical role in regulating the carbon cycle and maintaining Amazonian biodiversity (Rossetti et al., 2019), our study suggests that White Sand Forests may represent a significant source and sink of BVOCs. Together, this highlights the need to better integrate White Sand Forests into future BVOC and GHG flux studies and Earth System modeling.
Multiple interconnected factors influence BVOC and GHG soil-litter fluxes in the central Amazon. This study highlights the significant roles of soil and litter properties, as well as microbial biomass, in driving these fluxes, with distinct patterns observed across forest types. Given the complexity of the mechanisms influencing BVOC and GHG fluxes, future studies should prioritize microbial activity and diversity, along with diurnal and seasonal cycles, to better identify the key drivers of emission and consumption in these diverse forest ecosystems. In addition, it is important to note that this research serves as a pilot study aimed at scoping out general trends, and many sampling issues can be addressed in future work. For instance, utilizing a PTR-ToF-MS could alleviate the challenges associated with measuring acetaldehyde, DMS, and 42. Longer sampling periods, ideally continuous, would allow for capturing daily variations in emissions.
Surprisingly, despite being the least fertile and diverse forest type, the White Sand Forest exhibited the highest uptake and emission fluxes. This is likely due to intrinsic environmental factors, such as soil temperature and moisture, influencing microbial activity and gas fluxes, as well as the unique vegetation composition of this ecosystem. Furthermore, external factors, such as the preceding rainfall event, may have contributed to very high emissions, potentially reflecting short-term post-rainfall pulses that would have a low or moderate effect when averaged over longer periods that capture the full range of environmental conditions in these ecosystems. Therefore, future studies extending the measurement duration would provide a clearer understanding of how rainfall events influence average soil BVOC emissions. Finally, despite their limited spatial extent in Amazonia, White Sand Forests warrant further research to elucidate their ecological processes and their influence on atmospheric dynamics. Their high BVOC fluxes may substantially affect key physical and chemical processes in the atmosphere, with potential implications for the climate system.
All data supporting the findings of this study are available in a public repository (https://doi.org/10.17871/ATTO.651.6.2645, Pinheiro de Oliveira et al., 2026).
The supplement related to this article is available online at https://doi.org/10.5194/bg-23-2451-2026-supplement.
DPO, HVA, and EGA contributed to the development and design of the study, as well as the collection, processing, and statistical analysis of the datasets. MGC and MR contributed to field data collection and data analysis. AE helped design the methodology used in the PTR-QMS and contributed to its calibration improvement. NZ, JB, JW, SDJ, and CB contributed to the chemical analysis of BVOC samples with the GC-TOF-MS and GC-MS. LD and MTFP contributed to the data analysis of the White Sand Forest. MTFP, JS, and FW contributed to the dataset for the initial selection of the points in the PELD-MAUA project plots where the soil chambers were installed. RAFS contributed to the development of the study. All authors contributed to the writing of the manuscript.
The contact author has declared that none of the authors has any competing interests.
Publisher's note: Copernicus Publications remains neutral with regard to jurisdictional claims made in the text, published maps, institutional affiliations, or any other geographical representation in this paper. The authors bear the ultimate responsibility for providing appropriate place names. Views expressed in the text are those of the authors and do not necessarily reflect the views of the publisher.
We thank the National Institute for Amazonian Research (INPA) and the Max Planck Institute for Biogeochemistry (MPI-BGC) for their ongoing support. We would also like to thank the field assistants, Jose Raimundo Ferreira Nunes and Sipko Bulthuis; and all the people involved in the logistical support of the ATTO project (André Almeida, Delano Campos, Amaury Rodrigues, Nagib Alberto, Valmir and Antonio Huxley), especially Roberta de Souza, who were essential to the development of this study. We also thank the technicians and assistants at INPA's soil laboratories – LTSP and Routine Measurements & Analyses Lab (RoMA, MPI-BGC) for their valuable lab analyses. We sincerely thank Carlos Alberto Quesada for his contributions and knowledge to this study. We also thank all the indigenous communities that have been bravely protecting the Amazon Forest and the people from riverside communities who have always worked together with us. Without the “mateiros”, we would never have achieved our scientific goals.
This research has been supported by the Bundesministerium für Bildung, Wissenschaft, Forschung und Technologie (grant nos. 01LB1001A, 01LK1602, and 01LK2101), the Financiadora de Estudos e Projetos (grant no. 01.11.01248.00), the Ministério da Ciência, Tecnologia e Inovação (grant no. 441811/2020-5), the Deutsche Forschungsgemeinschaft (grant no. 352322796), and the Fundação de Amparo à Pesquisa do Estado do Amazonas (grant no. 01.02.016301.02630/2022-76).
The article processing charges for this open-access publication were covered by the Max Planck Society.
This paper was edited by Marijn Bauters and reviewed by Paula Alejandra Lamprea Pineda and two anonymous referees.
Aaltonen, H., Pumpanen, J., Pihlatie, M., Hakola, H., Hellen, H., Kulmala, L., Vesala, T., and Bäck, J.: Boreal pine forest floor biogenic volatile organic compound emissions peak in early summer and autumn, Agric. For. Meteorol., 151, 682–691, https://doi.org/10.1016/j.agrformet.2010.12.010, 2011.
Abis, L., Loubet, B., Ciuraru, R., Lafouge, F., Houot, S., Nowak, V., Tripied, J., Dequiedt, S., Maron, P. A., and Sadet-Bourgeteau, S.: Reduced microbial diversity induces larger volatile organic compound emissions from soils. Scientific Reports, 10, 1–15, https://doi.org/10.1038/s41598-020-63091-8, 2020.
Adeney, J. M., Christensen, N. L., Vicentini, A., and Cohn-Haft, M.: White-sand Ecosystems in Amazonia. Biotropica, 48, 7–23, https://doi.org/10.1111/btp.12293, 2016.
Alves, E. G., Jardine, K., Tota, J., Jardine, A., Yãnez-Serrano, A. M., Karl, T., Tavares, J., Nelson, B., Gu, D., Stavrakou, T., Martin, S., Artaxo, P., Manzi, A., and Guenther, A.: Seasonality of isoprenoid emissions from a primary rainforest in central Amazonia, Atmos. Chem. Phys., 16, 3903–3925, https://doi.org/10.5194/acp-16-3903-2016, 2016.
Anderson, J. M. and Ingram, J. I. S.: Tropical Soil Biology and Fertility: A Handbook of Methods, 2nd edn., C.A.B. International, Wallingford, UK, 221 pp., https://doi.org/10.2307/2261129, 1993.
Andreae, M. O., Acevedo, O. C., Araùjo, A., Artaxo, P., Barbosa, C. G. G., Barbosa, H. M. J., Brito, J., Carbone, S., Chi, X., Cintra, B. B. L., da Silva, N. F., Dias, N. L., Dias-Júnior, C. Q., Ditas, F., Ditz, R., Godoi, A. F. L., Godoi, R. H. M., Heimann, M., Hoffmann, T., Kesselmeier, J., Könemann, T., Krüger, M. L., Lavric, J. V., Manzi, A. O., Lopes, A. P., Martins, D. L., Mikhailov, E. F., Moran-Zuloaga, D., Nelson, B. W., Nölscher, A. C., Santos Nogueira, D., Piedade, M. T. F., Pöhlker, C., Pöschl, U., Quesada, C. A., Rizzo, L. V., Ro, C.-U., Ruckteschler, N., Sá, L. D. A., de Oliveira Sá, M., Sales, C. B., dos Santos, R. M. N., Saturno, J., Schöngart, J., Sörgel, M., de Souza, C. M., de Souza, R. A. F., Su, H., Targhetta, N., Tóta, J., Trebs, I., Trumbore, S., van Eijck, A., Walter, D., Wang, Z., Weber, B., Williams, J., Winderlich, J., Wittmann, F., Wolff, S., and Yáñez-Serrano, A. M.: The Amazon Tall Tower Observatory (ATTO): overview of pilot measurements on ecosystem ecology, meteorology, trace gases, and aerosols, Atmos. Chem. Phys., 15, 10723–10776, https://doi.org/10.5194/acp-15-10723-2015, 2015.
Artaxo, P., Hansson, H.-C., Andreae, M. O., Bäck, J., Alves, E. G., Barbosa, H. M. J., Bender, F., Bourtsoukidis, E., Carbone, S., Chi, J., Decesari, S., Després, V. R., Ditas, F., Ezhova, E., and Fuzzi, S.: Tropical and boreal forest–atmosphere interactions: a review, Tellus B, 74, 1–23, https://doi.org/10.16993/tellusb.34, 2022.
Asensio, D., Owen, S. M., Llusià, J., and Peñuelas, J.: The distribution of volatile isoprenoids in the soil horizons around Pinus halepensis trees, Soil Biol. Biochem., 40, 2937–2947, https://doi.org/10.1016/j.soilbio.2008.08.008, 2008.
Asensio, D., Peñuelas, J., Llusià, J., Ogaya, R., and Filella, I. Interannual and interseasonal soil CO2 efflux and VOC exchange rates in a Mediterranean holm oak forest in response to experimental drought, Soil Biol. Biochem., 39, 2471–2484, https://doi.org/10.1016/j.soilbio.2007.04.019, 2007.
Bach, T. J. and Rohmer, M.: Isoprenoid synthesis in plants and microorganisms: new concepts and experimental approaches, Springer, https://doi.org/10.1007/978-1-4614-4063-5, 2013.
Baggesen, N. S., Davie-Martin, C. L., Seco, R., Holst, T., and Rinnan, R.: Bidirectional Exchange of Biogenic Volatile Organic Compounds in Subarctic Heath Mesocosms During Autumn Climate Scenarios, J. Geophys. Res.-Biogeo., 127, https://doi.org/10.1029/2021JG006688, 2022.
Beauchamp, J., Herbig, J., Gutmann, R., and Hansel, A.: On the use of Tedlar bags for breath-gas sampling and analysis, J. Breath Res., 2, 046001, https://doi.org/10.1088/1752-7155/2/4/046001, 2008.
Borges, S. H., Whittaker, A., and de Almeida, R. A. M.: Bird diversity in the Serra do Aracá region, northwestern Brazilian Amazon: Preliminary check-list with considerations on biogeography and conservation, Zoologia, 31, 343–360, https://doi.org/10.1590/S1984-46702014000400006, 2014.
Botía, S., Komiya, S., Marshall, J., Koch, T., Gałkowski, M., Lavric, J., Gomes-Alves, E., Walter, D., Fisch, G., Pinho, D. M., Nelson, B. W., Martins, G., Luijkx, I. T., Koren, G., Florentie, L., Carioca de Araújo, A., Sá, M., Andreae, M. O., Heimann, M., and Gerbig, C.: The CO2 record at the Amazon Tall Tower Observatory: A new opportunity to study processes on seasonal and inter-annual scales, Glob. Change Biol., 28, 588–611, https://doi.org/10.1111/gcb.15905, 2022.
Bourtsoukidis, E., Behrendt, T., Yañez-Serrano, A. M., Hellén, H., Diamantopoulos, E., Catão, E., Ashworth, K., Pozzer, A., Quesada, C. A., Martins, D. L., Sá, M., Araujo, A., Brito, J., Artaxo, P., Kesselmeier, J., Lelieveld, J., and Williams, J.: Strong sesquiterpene emissions from Amazonian soils, Nat. Commun., 9, 1–11, https://doi.org/10.1038/s41467-018-04658-y, 2018.
Butterbach-Bahl, K., Baggs, E. M., Dannenmann, M., Kiese, R., and Zechmeister-Boltenstern, S.: Nitrous oxide emissions from soils: how well do we understand the processes and their controls?, Philos. Trans. R. Soc. B, 368, 20130122, https://doi.org/10.1098/rstb.2013.0122, 2013.
Caetano Garcia, M.: Biogenic volatile organic compound (BVOC) emissions from decomposing leaf-litter in central Amazonia PhD thesis, National Institute for Amazonian Research (INPA), Manaus, Brazil, https://w2.solucaoatrio.net.br/inpa-cft/pub/ThesisViewAll.do?method=viewAll&id=280&pg_query=8993903373477168&pg_range=5 (last access: 30 March 2026), 2022.
Carruthers, D. N. and Lee, T. S: Diversifying Isoprenoid Platforms via Atypical Carbon Substrates and Non-model Microorganisms, Frontiers in Microbiology, 12, 791089, https://doi.org/10.3389/fmicb.2021.791089, 2021.
Chambers, J. Q., Tribuzy, E. S., Toledo, L. C., Crispim, B. F., Higuchi, N., dos Santos, J., Araújo, A. C., Kruijt, B., Nobre, A. D., and Trumbore, S. E.: Respiration from a tropical forest ecosystem: Partitioning of sources and low carbon use efficiency, Ecol. Appl., 14, 72–88, https://doi.org/10.1890/01-6012, 2004.
Chomel, M., Guittonny-Larchevêque, M., Fernandez, C., Gallet, C., DesRochers, A., Paré, D., Jackson, B. G., and Baldy, V.: Plant secondary metabolites: A key driver of litter decomposition and soil nutrient cycling, J. Ecol., 104, 1527–1541, https://doi.org/10.1111/1365-2745.12644, 2016.
Conrad, R.: Methane production in soil environments – anaerobic biogeochemistry and microbial life between flooding and desiccation, Microorganisms, 8, 1–12, https://doi.org/10.3390/microorganisms8060881, 2020.
Conrad, R.: The global methane cycle: Recent advances in understanding the microbial processes involved, Env. Microbiol. Rep., 1, 285–292, https://doi.org/10.1111/j.1758-2229.2009.00038.x, 2009.
Cornu,, S., Ambrosi, J. P., Lucas, Y., and Fevrier, D.: A comparative study of the soil solution chemistry of two Amazonian forest soils (Central Amazonia, Brazil), Hydrol. Earth Syst. Sci., 1, 313–324, https://doi.org/10.5194/hess-1-313-1997, 1997.
Costa, F. R. C., Schietti, J., Stark, S. C., and Smith, M. N.: The other side of tropical forest drought: do shallow water table regions of Amazonia act as large-scale hydrological refugia from drought?, New Phytol., 237, 714–733, https://doi.org/10.1111/nph.17914, 2023.
Crocker, L., Guo, J., U'Ren, J. M., Pugliese, G., Ladd, S. N., Werner, C., and Meredith, L. K.: Volatile organic compound (VOC) exchange in tropical leaf litter in response to wetting: An automated scheme to classify flux pulse dynamics, J. Geophys. Res.-Biogeo., 130, e2025JG008774, https://doi.org/10.1029/2025JG008774, 2025.
de Mendonça, B. A. F., Filho, E. I. F., Schaefer, C. E. G. R., Simas, F. N. B., and de Paula, M. D.: Os solos das campinaranas na amazônia Brasileira: Ecossistemas arenícolas oligotróficos, Cienc. Florest., 25, 827–839, https://doi.org/10.5902/1980509820581, 2015.
Demarchi, L. O., Klein, V. P., Aguiar, D. P. P., Marinho, L. C., Ferreira, M. J., Lopes, A., da Cruz, J., Quaresma, A. C., Schöngart, J., Wittmann, F., and Piedade, M. T. F.: The specialized white-sand flora of the Uatumã Sustainable Development Reserve, central Amazon, Brazil, Check List, 18, 187–217, https://doi.org/10.15560/18.1.187, 2022.
Draper, F. C., Roucoux, K. H., Lawson, I. T., Mitchard, E. T. A., Honorio Coronado, E. N., Lähteenoja, O., Montenegro, L. T., Sandoval, E. V., Zaráte, R., and Baker, T. R.: The distribution and amount of carbon in the largest peatland complex in Amazonia, Environ. Res. Lett., 9, 124017, https://doi.org/10.1088/1748-9326/9/12/124017, 2014.
Drewer, J., Leduning, M. M., Purser, G., Cash, J. M., Sentian, J., and Skiba, U. M.: Monoterpenes from tropical forest and oil palm plantation floor in Malaysian Borneo/Sabah: emission and composition, Environ. Sci. Pollut. Res., 28, 31792–31802, https://doi.org/10.1007/s11356-021-13052-z, 2021.
Dunne, E., Galbally, I. E., Lawson, S., and Patti, A.: Interference in the PTR-MS measurement of acetonitrile at 42 in polluted urban air – a study using switchable reagent ion PTR-MS, Int. J. Mass Spectrom., 319–320, 40–47, https://doi.org/10.1016/j.ijms.2012.05.004, 2012.
Doff sotta, E., Meir, P., Malhi, Y., Donato nobre, A., Hodnett, M., and Grace, J.: Soil CO2 efflux in a tropical forest in the central Amazon, Glob. Change Biol., 10, 601–617, https://doi.org/10.1111/j.1529-8817.2003.00761.x, 2004.
Edtbauer, A., Pfannerstill, E. Y., Pires Florentino, A. P., Barbosa, C. G. G., Rodriguez-Caballero, E., Zannoni, N., Alves, R. P., Wolff, S., Tsokankunku, A., Aptroot, A., de Oliveira Sá, M., de Araújo, A. C., Sörgel, M., de Oliveira, S. M., Weber, B., and Williams, J.: Cryptogamic organisms are a substantial source and sink for volatile organic compounds in the Amazon region, Commun. Earth Environ., 2, 1–10, https://doi.org/10.1038/s43247-021-00328-y, 2021.
Emidio, K., Martins, S. V., Antônio, C., and Soares, A.: Structure of 15 hectares permanent plots of terra firme dense forest in central Amazon, Rev. Árvore, 40, 603–615, https://doi.org/10.1590/0100-67622016000400004, 2016.
Empresa Brasileira de Pesquisa Agropecuária (EMBRAPA): Manual de análise química de solos, plantas e fertilizantes, 2nd Edn., EMBRAPA, Brasília, ISBN: 978-85-7035-198-1, 1999.
Eyice, Ö., Namura, M., Chen, Y., McGenity, T. J., and Murrell, J. C.: SIP metagenomics identifies uncultivated Methylophilaceae as dimethylsulphide degrading bacteria in soil and lake sediment, ISME J., 9, 2336–2348, https://doi.org/10.1038/ismej.2015.37, 2015.
Fan, J., Luo, R., McConkey, B. G., and Ziadi, N.: Effects of nitrogen deposition and litter layer management on soil CO2, N2O, and CH4 emissions in a subtropical pine forestland, Sci. Rep., 10, 1–11, https://doi.org/10.1038/s41598-020-65952-8, 2020.
Fan, Y., Zhang, Y., Osborne, B., and Zou, J.: Global patterns of soil greenhouse gas fluxes in response to litter manipulation, Cell Rep. Sustain., 1, 100003, https://doi.org/10.1016/j.crsus.2023.100003, 2024.
Fine, P. V. A, Mesones, I., and Coley, P. D.: Herbivores promote habitat specialization by trees in amazonian forests, Science, https://doi.org/10.1126/science.1098982, 2004.
Fine, P. V. A. and Baraloto, C.: Habitat endemism in white-sand forests: insights into the mechanisms of lineage diversification and community assembly of the Neotropical flora, Biotropica, 48, 24–33, https://doi.org/10.1111/btp.12301, 2016.
Fine, P. V. A., Miller, Z. J., Mesones, I., Irazuzta, S., Appel, H. M., Stevens, M. H. H., Sääksjärvi, I., Schultz, J. C., and Coley, P. D.: The growth-defense trade-off and habitat specialization by plants in Amazonian forests, Ecology, 87, 150–162, https://doi.org/10.1126/science.1098982, 2006.
Flint, A. L. and Flint, L. E.: Particle density, in: Methods of Soil Analysis, Part 4: Physical Methods, 229–240, https://doi.org/10.2136/sssabookser5.4.c10, 2002.
Franco, W. and Dezzeo, N.: Soils and soil-water regime in the terra-firme-caatinga forest complex near San Carlos de Rio Negro, state of Amazonas, Venezuela, Interciencia, 19, 305–316, 1994.
García-Villacorta, R., Dexter, K. G., and Pennington, T.: Amazonian white-sand forests show strong floristic links with surrounding oligotrophic habitats and the Guiana Shield, Biotropica, 48, 47–57, https://doi.org/10.1111/btp.12302, 2016.
Gfeller, A., Laloux, M., Barsics, F., Kati, D. E., Haubruge, E., du Jardin, P., Verheggen, F. J., Lognay, G., Wathelet, J. P., and Fauconnier, M. L.: Characterization of volatile organic compounds emitted by barley (Hordeum vulgare L.) roots and their attractiveness to wireworms, J. Chem. Ecol., 39, 1129–1139, https://doi.org/10.1007/s10886-013-0302-3, 2013.
Gomes Alves, E., Taylor, T., Robin, M., Pinheiro Oliveira, D., Schietti, J., Duvoisin Júnior, S., Zannoni, N., Williams, J., Hartmann, C., Gonçalves, J. F. C., Schöngart, J., Wittmann, F., and Piedade, M. T. F.: Seasonal shifts in isoprenoid emission composition from three hyperdominant tree species in central Amazonia, Plant Biol., 24, 721–733, https://doi.org/10.1111/plb.13419, 2022.
Greenberg, J. P., Asensio, D., Turnipseed, A., Guenther, A. B., Karl, T., and Gochis, D.: Contribution of leaf and needle litter to whole ecosystem BVOC fluxes, Atmos. Environ., 59, 302–311, https://doi.org/10.1016/j.atmosenv.2012.04.038, 2012.
Guenther, A. B., Jiang, X., Heald, C. L., Sakulyanontvittaya, T., Duhl, T., Emmons, L. K., and Wang, X.: The Model of Emissions of Gases and Aerosols from Nature version 2.1 (MEGAN2.1): an extended and updated framework for modeling biogenic emissions, Geosci. Model Dev., 5, 1471–1492, https://doi.org/10.5194/gmd-5-1471-2012, 2012.
Hair, J. F., Black, W. C., Babin, B. J., and Anderson, R. E.: Multivariate data analysis, 7th edn., Pearson, Upper Saddle River, ISBN 978-0-13-813263-7, 2009.
Harrell, F. E.: Hmisc: Harrell Miscellaneous, R package version 4.8-0, https://CRAN.R-project.org/package=Hmisc (last access: 30 March 2026), 2018.
Hebbali, A.: olsrr: Tools for building OLS regression models, R package version 0.5.3, CRAN [code], https://cran.r-project.org/package=olsrr (last access: 31 March 2026), 2024.
Hernandez-Arranz, S., Perez-Gil, J., Marshall-Sabey, D., and Rodriguez-Concepcion, M.: Engineering Pseudomonas putida for isoprenoid production by manipulating endogenous and shunt pathways supplying precursors, Microb. Cell Fact., 18, 1–14, https://doi.org/10.1186/s12934-019-1204-z, 2019.
Hernandez, L. K., Pugliese, G., Ingrisch, J., Fudyma, J., Gil-Loaiza, J., Carpenter, E., Singer, E., Hildebrand, G., Shi, L., Hoyt, D. W., Chu, R. K., Toyoda, J., Krechmer, J. E., Claflin, M. S., Ayala-Ortiz, C., Freire-Zapata, V., Pfannerstill, E. Y., Daber, L. E., Meeran, K., Dippold, M. A., Kreuzwieser, J., Williams, J., Ladd, S. N., Werner, C., Tfaily, M. M., and Meredith, L. K.: Drought re-routes soil microbial carbon metabolism towards emission of volatile metabolites in an artificial tropical rainforest, Nat. Microbiol., 8, 1480–1494, https://doi.org/10.1038/s41564-023-01432-9, 2023.
Hofmann, K., Pauli, H., Praeg, N., Wagner, A. O., and Illmer, P.: Methane-cycling microorganisms in soils of a high-alpine altitudinal gradient, FEMS Microbiol. Ecol., 92, fiw009, https://doi.org/10.1093/femsec/fiw009, 2016.
Huangfu, Y., Yuan, B., Wang, S., Wu, C., He, X., Qi, J., de Gouw, J., Warneke, C., Gilman, J. B., Wisthaler, A., Karl, T., Graus, M., Jobson, B. T., and Shao, M.:Revisiting acetonitrile as tracer of biomass burning in anthropogenic-influenced environments, Geophys. Res. Lett., 48, e2020GL092322, https://doi.org/10.1029/2020GL092322, 2021.
Jardine, K., Yáñez-Serrano, A. M., Williams, J., Kunert, N., Jardine, A., Taylor, T., Abrell, L., Artaxo, P., Guenther, A., Hewitt, C. N., House, E., Florentino, A. P., Manzi, A., Higuchi, N., Kesselmeier, J., Behrendt, T., Veres, P. R., Derstroff, B., Fuentes, J. D., Martin, S. T., and Andreae, M. O.: Dimethyl sulfide in the Amazon rainforest, Global Biogeochem. Cy., 29, 19–32, https://doi.org/10.1002/2014GB004969, 2015.
Jdanova, M. and Isidorov, V.: Volatile organic compounds from leaves litter, Chemosphere, 48, 2058–2072, https://doi.org/10.1016/S0045-6535(02)00074-7, 2002.
Jenkinson, D. S., Brookes, P. C., and Powlson, D. S.: Measuring soil microbial biomass, Soil Biol. Biochem., 36, 5–7, https://doi.org/10.1016/j.soilbio.2003.10.002, 2004.
Jiao, Y., Kramshøj, M., Davie-Martin, C. L., Albers, C. N., and Rinnan, R.: Soil uptake of VOCs exceeds production when VOCs are readily available, Soil Biol. Biochem., 185, 109153, https://doi.org/10.1016/j.soilbio.2023.109153, 2023.
Kesselmeier, J. and Hubert, A.: Exchange of reduced volatile sulfur compounds between leaf litter and the atmosphere, Atmos. Environ., 36, 4679–4686, https://doi.org/10.1016/S1352-2310(02)00413-2, 2002.
Kuzma, J., Nemecek-Marshall, M., Pollock, W. H., and Fall, R.: Bacteria produce the volatile hydrocarbon isoprene, Curr. Microbiol., 30, 97–103, https://doi.org/10.1007/BF00294190, 1995.
Lange, D. F., Schröter, S. A., da Luz, F. M., Pires, E., Santos, Y. R., da Silva, J. S., Hildmann, S., Hoffmann, T., Ferreira, S. J. F., Schäfer, T., Quesada, C. A., Simon, C., and Gleixner, G.: Cycling of dissolved organic nutrients and indications for nutrient limitations in contrasting Amazon rainforest ecosystems, Biogeochemistry, 167, 1567–1588, https://doi.org/10.1007/s10533-024-01187-3, 2024.
Lee, J., Oh, Y., Lee, S. T., Seo, Y. O., Yun, J., Yang, Y., Kim, J., Zhuang, Q., and Kang, H.: Soil organic carbon is a key determinant of CH4 sink in global forest soils, Nat. Commun., 14, 6–13, https://doi.org/10.1038/s41467-023-38905-8, 2023.
Leff, J. W. and Fierer, N.: Volatile organic compound (VOC) emissions from soil and litter samples, Soil Biol. Biochem., 40, 1629–1636, https://doi.org/10.1016/j.soilbio.2008.01.018, 2008.
Lehnert, A. S., Cooper, R. E., Ignatz, R., Ruecker, A., Gomes-Alves, E., Küsel, K., Pohnert, G., and Trumbore, S. E.: Dimethyl sulfide emissions from a peatland result more from organic matter degradation than sulfate reduction, J. Geophys. Res. Biogeosci., 129, e2023JG007449, https://doi.org/10.1029/2023JG007449, 2024.
Li, Q., Hu, W., Li, L., and Li, Y.: Interactions between organic matter and Fe oxides at soil micro-interfaces: Quantification, associations, and influencing factors, Sci. Total Environ., 855, 158710, https://doi.org/10.1016/j.scitotenv.2022.158710, 2023.
Lin, C., Owen, S. M., and Peñuelas, J.: Volatile organic compounds in the roots and rhizosphere of Pinus spp., Soil Biol. Biochem., 39, 951–960, https://doi.org/10.1016/j.soilbio.2006.11.007, 2007.
Lindinger, W., Hansel, A., and Jordan, A.: On-line monitoring of volatile organic compounds at pptv levels by means of proton-transfer-reaction mass spectrometry (PTR-MS) medical applications, food control and environmental research, Int. J. Mass Spectrom. Ion Process., 173, 191–241, https://doi.org/10.1016/s0168-1176(97)00281-4, 1998.
Liu, M. and Matsui, H.: Secondary organic aerosol formation regulates cloud condensation nuclei in the global remote troposphere, Geophys. Res. Lett., 49, e2022GL100543, https://doi.org/10.1029/2022GL100543, 2022.
Liu, Y., Ciuraru, R., Abis, L., Amelynck, C., Buysse, P., Guenther, A., Heinesch, B., Lafouge, F., Levavasseur, F., Loubet, B., Voyard, A., and Massad, R.-S.: Emissions of biogenic volatile organic compounds from agricultural lands and the impact of land-use and other management practices: A review, EGUsphere [preprint], https://doi.org/10.5194/egusphere-2024-530, 2024.
Llusià, J., Asensio, D., Sardans, J., Filella, I., Peguero, G., Grau, O., Ogaya, R., Gargallo-Garriga, A., Verryckt, L. T., Van Langenhove, L., Brechet, L. M., Courtois, E., Stahl, C., Janssens, I. A., and Peñuelas, J.: Contrasting nitrogen and phosphorus fertilization effects on soil terpene exchanges in a tropical forest, Sci. Total Environ., 802, 149769, https://doi.org/10.1016/j.scitotenv.2021.149769, 2022.
Luize, B. G., Magalhães, J. L. L., Queiroz, H., Lopes, M. A., Venticinque, E. M., de Moraes Novo, E. M. L., and Silva, T. S. F.: The tree species pool of Amazonian wetland forests: which species can assemble in periodically waterlogged habitats?, PLoS ONE, 13, e0198130, https://doi.org/10.1371/journal.pone.0198130, 2018.
Mäki, M., Heinonsalo, J., Hellén, H., and Bäck, J.: Contribution of understorey vegetation and soil processes to boreal forest isoprenoid exchange, Biogeosciences, 14, 1055–1073, https://doi.org/10.5194/bg-14-1055-2017, 2017.
Malavolta, E., Vitti, G. C., and Oliveira, S. A.: Avaliação do estadonutricional das plantas: Princípios e aplicações [Evaluation of the Nutritional Status of Plants: Principles and Applications], Piracicaba, Potafos, 321 pp., https://repositorio.usp.br/item/000789082 (last access: 31 March 2026), 1989.
Mancuso, S., Taiti, C., Bazihizina, N., Costa, C., Menesatti, P., Giagnoni, L., Arenella, M., Nannipieri, P., and Renella, G.: Soil volatile analysis by proton transfer reaction-time of flight mass spectrometry (PTR-TOF-MS), Appl. Soil Ecol., 86, 182–191, https://doi.org/10.1016/j.apsoil.2014.10.018, 2015.
Mazahar, S. and Umar, S.: Soil potassium availability and role of microorganisms in influencing potassium availability to plants, in: Role of potassium in abiotic stress, 77–87, https://doi.org/10.1007/978-981-16-4461-0_4, 2022.
McGenity, T. J., Crombie, A. T., and Murrell, J. C.: Microbial cycling of isoprene, the most abundantly produced biological volatile organic compound on Earth, ISME J., 12, 931–941, https://doi.org/10.1038/s41396-018-0072-6, 2018.
Miyama, T., Morishita, T., Kominami, Y., Noguchi, H., Yasuda, Y., Yoshifuji, N., Okano, M., Yamanoi, K., Mizoguchi, Y., Takanashi, S., Kitamura, K., and Matsumoto, K.: Increases in biogenic volatile organic compound concentrations observed after rains at six forest sites in non-summer periods, Atmosphere, 11, 13181, https://doi.org/10.3390/atmos11121381, 2020.
Monard, C., Caudal, J. P., Cluzeau, D., Le Garrec, J. L., Hellequin, E., Hoeffner, K., Humbert, G., Jung, V., Le Lann, C., and Nicolai, A.: Short-term temporal dynamics of VOC emissions by soil systems in different biotopes, Front. Environ. Sci., 9, 650701, https://doi.org/10.3389/fenvs.2021.650701, 2021.
Mosquera, Q. H., Torres-Torres, J. J., and Pérez-Abadía, D.: Influence of Mining on Nutrient Cycling in the Tropical Rain Forests of the Colombian Pacific, Forests, 15, 1222, https://doi.org/10.3390/f15071222, 2024.
Murphy, J. and Riley, J. P.: A modified single solution method for the determination of phosphate in natural waters, Anal. Chim. Acta, 27, 31–36, https://doi.org/10.1016/S0003-2670(00)88444-5, 1962.
Ndah, F., Valolahti, H., Schollert, M., Michelsen, A., and Kivimäenpää, M.: Influence of increased nutrient availability on biogenic volatile organic compound (BVOC) emissions and leaf anatomy of subarctic dwarf shrubs under climate warming and increased cloudiness, Ann. Bot., 129, 443–455, https://doi.org/10.1093/aob/mcac004, 2022.
Oliveira-Filho, A. T., Dexter, K. G., Pennington, R. T., Simon, M. F., Bueno, M. L., and Neves, D. M.: On the floristic identity of Amazonian vegetation types, Biotropica, 53, 767–777, https://doi.org/10.1111/btp.12932, 2021.
Olsen, S. R. and Sommers, L. E.: Phosphorus, in: Methods of Soil Analysis Part 2 Chemical and Microbiological Properties, edited by: Page, A. L., American Society of Agronomy, Soil Science Society of America, Madison, 403–430, ISBN 978-0-89118-072-2, 1982.
Peñuelas, J., Asensio, D., Tholl, D., Wenke, K., Rosenkranz, M., Piechulla, B., and Schnitzler, J. P.: Biogenic volatile emissions from the soil, Plant Cell Environ., 37, 1866–1891, https://doi.org/10.1111/pce.12340, 2014.
Pinheiro de Oliveira, D., van Asperen, H., Garcia Caetano, M., Robin, M., Edtbauer, A., Zannoni, N., Byron, J., Williams, J., Demarchi, L. O., Piedade, M. T. F., Schongart, J., Wittmann, F., Júnior, S. D., Estefani Batista, C., de Souza, R. A. F., and Alves, E. G.: Biogenic Volatile Organic Compounds (BVOC) and methane fluxes, microbial biomass, physical and chemical properties of the soil-litter compartment across three forest types in central Amazonia (2021–2022) Max Planck Institute for Biogeochemistry, Jena, Germany [data set], https://doi.org/10.17871/ATTO.651.6.2645, 2026.
Pohlman, J. W., Casso, M., Magen, C., and Bergeron, E.: Discrete Sample Introduction Module for Quantitative and Isotopic Analysis of Methane and Other Gases by Cavity Ring-Down Spectroscopy, Environ. Sci. Technol., 55, 12066–12074, https://doi.org/10.1021/acs.est.1c01386, 2021.
Pugliese, G., Ingrisch, J., Meredith, L. K., Pfannerstill, E. Y., Klüpfel, T., Meeran, K., Byron, J., Purser, G., Gil-Loaiza, J., van Haren, J., Dontsova, K., Kreuzwieser, J., Ladd, S. N., Werner, C., and Williams, J.: Effects of drought and recovery on soil volatile organic compound fluxes in an experimental rainforest, Nat. Commun., 14, 40661, https://doi.org/10.1038/s41467-023-40661-8, 2023.
Pulido, P., Perello, C., and Rodriguez-Concepcion, M.: New insights into plant isoprenoid metabolism, Mol. Plant, 5, 964–967, https://doi.org/10.1093/mp/sss088, 2012.
Quesada, C. A., Lloyd, J., Anderson, L. O., Fyllas, N. M., Schwarz, M., and Czimczik, C. I.: Soils of Amazonia with particular reference to the RAINFOR sites, Biogeosciences, 8, 1415–1440, https://doi.org/10.5194/bg-8-1415-2011, 2011.
Quesada, C. A., Phillips, O. L., Schwarz, M., Czimczik, C. I., Baker, T. R., Patiño, S., Fyllas, N. M., Hodnett, M. G., Herrera, R., Almeida, S., Alvarez Dávila, E., Arneth, A., Arroyo, L., Chao, K. J., Dezzeo, N., Erwin, T., di Fiore, A., Higuchi, N., Honorio Coronado, E., Jimenez, E. M., Killeen, T., Lezama, A. T., Lloyd, G., López-González, G., Luizão, F. J., Malhi, Y., Monteagudo, A., Neill, D. A., Núñez Vargas, P., Paiva, R., Peacock, J., Peñuela, M. C., Peña Cruz, A., Pitman, N., Priante Filho, N., Prieto, A., Ramírez, H., Rudas, A., Salomão, R., Santos, A. J. B., Schmerler, J., Silva, N., Silveira, M., Vásquez, R., Vieira, I., Terborgh, J., and Lloyd, J.: Basin-wide variations in Amazon forest structure and function are mediated by both soils and climate, Biogeosciences, 9, 2203–2246, https://doi.org/10.5194/bg-9-2203-2012, 2012.
Raio, A., Brilli, F., Baraldi, R., Neri, L., and Puopolo, G.: Impact of spontaneous mutations on physiological traits and biocontrol activity of Pseudomonas chlororaphis M71, Microbiol. Res., 239, 126517, https://doi.org/10.1016/j.micres.2020.126517, 2020.
Rasheed, M. U., Kivimäenpää, M., and Kasurinen, A.: Emissions of biogenic volatile organic compounds (BVOCs) from the rhizosphere of Scots pine (Pinus sylvestris) seedlings exposed to warming, moderate N addition and bark herbivory by large pine weevil (Hylobius abietis), Plant Soil, 463, 379–394, https://doi.org/10.1007/s11104-021-04888-y, 2021.
Raza, W., Mei, X., Wei, Z., Ling, N., Yuan, J., Wang, J., Huang, Q., and Shen, Q.: Profiling of soil volatile organic compounds after long-term application of inorganic, organic and organic-inorganic mixed fertilizers and their effect on plant growth, Sci. Total Environ., 607–608, 326–338, https://doi.org/10.1016/j.scitotenv.2017.07.023, 2017.
R Core Team: R: A language and environment for statistical computing, R Foundation for Statistical Computing, Vienna, Austria, https://www.R-project.org/ (last access: 30 March 2026), 2023.
Rodrigues, J., Martins, W., Oliveira, V., Wanzerley, M., Pacheco, H., Menezes, F., and Oliveira, F.: Litter stock, litterfall and nutrients in Amazonia: defining patterns from the last 40 years of scientific research, Scientia Plena, 19, 077301, https://doi.org/10.14808/sci.plena.2023.077301, 2023.
Rossetti, D. F., Moulatlet, G. M., Tuomisto, H., Gribel, R., Toledo, P. M., Valeriano, M. M., Ruokolainen, K., Cohen, M. C. L., Cordeiro, C. L. O., Rennó, C. D., Coelho, L. S., and Ferreira, C. A. C.: White sand vegetation in an Amazonian lowland under the perspective of a young geological history, An. Acad. Bras. Cienc., 91, e20181337, https://doi.org/10.1590/0001-3765201920181337, 2019.
Saggar, S., Jha, N., Deslippe, J., Bolan, N., Luo, J., Giltrap, D., Kim, D., Zaman, M., and Tillman, R.: Denitrification and N2O:N2 production in temperate grasslands: Processes, measurements, modelling and mitigating negative impacts, Sci. Total Environ., 465, 173–195, https://doi.org/10.1016/j.scitotenv.2012.11.050, 2013.
Saunier, A., Mpamah, P., Biasi, C., and Blande, J. D.: Microorganisms in the phylloplane modulate the BVOC emissions of Brassica nigra leaves, Plant Signal. Behav., 15, 1728468, https://doi.org/10.1080/15592324.2020.1728468, 2020.
Sillo, F., Neri, L., Calvo, A., Zampieri, E., Petruzzelli, G., Ferraris, I., Delledonne, M., Zaldei, A., Gioli, B., Baraldi, R., and Balestrini, R.: Correlation between microbial communities and volatile organic compounds in an urban soil provides clues on soil quality towards sustainability of city flowerbeds, Heliyon, 10, e23594, https://doi.org/10.1016/j.heliyon.2023.e23594, 2024.
Simon, C., Pimentel, T. P., Monteiro, M. T. F., Candido, L. A., Gastmans, D., Geilmann, H., da Costa Oliveira, R., Rocha, J. B., Pires, E., Quesada, C. A., Forsberg, B. R., Ferreira, S. J. F., da Cunha, H. B., and Gleixner, G.: Molecular links between whitesand ecosystems and blackwater formation in the Rio Negro watershed, Geochim. Cosmochim. Ac., 311, 274–291, https://doi.org/10.1016/j.gca.2021.06.036, 2021.
Sindelarova, K., Granier, C., Bouarar, I., Guenther, A., Tilmes, S., Stavrakou, T., Müller, J.-F., Kuhn, U., Stefani, P., and Knorr, W.: Global data set of biogenic VOC emissions calculated by the MEGAN model over the last 30 years, Atmos. Chem. Phys., 14, 9317–9341, https://doi.org/10.5194/acp-14-9317-2014, 2014.
Snyder, C. S., Bruulsema, T. W., Jensen, T. L., and Fixen, P. E.: Review of greenhouse gas emissions from crop production systems and fertilizer management effects, Agric. Ecosyst. Environ., 133, 247–266, https://doi.org/10.1016/j.agee.2009.04.021, 2009.
Steeghs, M., Bais, H. P., de Gouw, J., Goldan, P., Kuster, W., Northway, M., Fall, R., and Vivanco, J. M.: Proton-transfer-reaction mass spectrometry as a new tool for real time analysis of root-secreted volatile organic compounds in Arabidopsis, Plant Physiol., 135, 47–58, https://doi.org/10.1104/pp.104.038703, 2004.
Stotzky, G., Schenck, S., and Papavizas, G. C.: Volatile organic compounds and microorganisms, Crit. Rev. Microbiol., 4, 333–382, https://doi.org/10.3109/10408417609102303, 1976.
Tang, J., Schurgers, G., and Rinnan, R.: Process understanding of soil BVOC fluxes in natural ecosystems: a review, Rev. Geophys., 57, 966–986, https://doi.org/10.1029/2018RG000634, 2019.
ter Steege, H., Pitman, N. C. A., Sabatier, D., Baraloto, C., Salomão, R. P., Guevara, J. E., Phillips, O. L., Castilho, C. V., Magnusson, W. E., Molino, J. F., Monteagudo, A., Vargas, P. N., Montero, J. C., Feldpausch, T. R., Coronado, E. N. H., Killeen, T. J., Mostacedo, B., Vasquez, R., Assis, R. L., and Silman, M. R.: Hyperdominance in the Amazonian tree flora, Science, 342, 1243092, https://doi.org/10.1126/science.1243092, 2013.
Thulasiram, H. V., Erickson, H. K., and Poulter, C. D.: Chimeras of two isoprenoid synthases catalyze all four coupling reactions in isoprenoid biosynthesis, Science, 316, 73–76, https://doi.org/10.1126/science.1137786, 2007.
Tripathi, N., Krumm, B. E., Edtbauer, A., Spracklen, D. V., and Kanzow, T.: Impacts of convection, chemistry, and forest clearing on biogenic volatile organic compounds over the Amazon, Nat. Commun., 16, 4692, https://doi.org/10.1038/s41467-025-59953-2, 2025.
Trowbridge, A. M., Stoy, P. C., and Phillips, R. P.: Soil biogenic volatile organic compound flux in a mixed hardwood forest: net uptake at warmer temperatures and the importance of mycorrhizal associations, J. Geophys. Res.-Biogeosci., 125, e2019JG005479, https://doi.org/10.1029/2019JG005479, 2020.
van Asperen, H., Warneke, T., Carioca de Araújo, A., Forsberg, B., José Filgueiras Ferreira, S., Röckmann, T., van der Veen, C., Bulthuis, S., Ramos de Oliveira, L., de Lima Xavier, T., da Mata, J., de Oliveira Sá, M., Ricardo Teixeira, P., Andrews de França e Silva, J., Trumbore, S., and Notholt, J.: The emission of CO from tropical rainforest soils, Biogeosciences, 21, 3183–3199, https://doi.org/10.5194/bg-21-3183-2024, 2024.
van Asperen, H., Warneke, T., Carioca de Araújo, A., Rider Forsberg, B., Ramos de Oliveira, L., de Lima Xavier, T., de Oliveira Sá, M., Ricardo Teixeira, P., Azevedo de Oliveira, R., Sousa de Moura, V., do Socorro Monteiro Leal, L., Botia, S., Lavrič, J., Komiya, S., Frumau, A., Hensen, A., van den Bulk, P., van Dinther, D., and Notholt, J.: Tropical forest CH4: from flux chambers to micrometeorological tower measurements, EGU General Assembly 2020, Online, 4–8 May 2020, EGU2020-6139, https://doi.org/10.5194/egusphere-egu2020-6139, 2020.
Vella, R., Forrest, M., Pozzer, A., Tsimpidi, A. P., Hickler, T., Lelieveld, J., and Tost, H.: Influence of land cover change on atmospheric organic gases, aerosols, and radiative effects, Atmos. Chem. Phys., 25, 243–262, https://doi.org/10.5194/acp-25-243-2025, 2025.
Venturini, A. M., Gontijo, J. B., Mandro, J. A., Berenguer, E., Peay, K. G., Tsai, S. M., and Bohannan, B. J. M.: Soil microbes under threat in the Amazon rainforest, Trends Ecol. Evol., 38, 693–696, https://doi.org/10.1016/j.tree.2023.04.014, 2023.
Wang, H., Liu, X., Wu, C., and Lin, G.: Regional to global distributions, trends, and drivers of biogenic volatile organic compound emission from 2001 to 2020, Atmos. Chem. Phys., 24, 3309–3328, https://doi.org/10.5194/acp-24-3309-2024, 2024.
Wang, M., Zheng, Q., Shen, Q., and Guo, S.: The critical role of potassium in plant stress response, Int. J. Mol. Sci., 14, 7370–7390, https://doi.org/10.3390/ijms14047370, 2013.
Warneke, C., Veres, P., Murphy, S. M., Soltis, J., Field, R. A., Graus, M. G., Koss, A., Li, S.-M., Li, R., Yuan, B., Roberts, J. M., and de Gouw, J. A.: PTR-QMS versus PTR-TOF comparison in a region with oil and natural gas extraction industry in the Uintah Basin in 2013, Atmos. Meas. Tech., 8, 411–420, https://doi.org/10.5194/amt-8-411-2015, 2015.
Wells, K. C., Millet, D. B., Payne, V. H., Vigouroux, C., Aquino, C. A. B., De Mazière, M., de Gouw, J. A., Graus, M., Kurosu, T., Warneke, C., and Wisthaler, A.: Next-generation isoprene measurements from space: detecting daily variability at high resolution, J. Geophys. Res.-Atmos., 127, e2021JD036181, https://doi.org/10.1029/2021JD036181, 2022.
Yáñez-Serrano, A. M., Nölscher, A. C., Bourtsoukidis, E., Gomes Alves, E., Ganzeveld, L., Bonn, B., Wolff, S., Sa, M., Yamasoe, M., Williams, J., Andreae, M. O., and Kesselmeier, J.: Monoterpene chemical speciation in a tropical rainforest:variation with season, height, and time of dayat the Amazon Tall Tower Observatory (ATTO), Atmos. Chem. Phys., 18, 3403–3418, https://doi.org/10.5194/acp-18-3403-2018, 2018.
Yáñez-Serrano, A. M., Bourtsoukidis, E., Alves, E. G., Bauwens, M., Stavrakou, T., Llusià, J., Filella, I., Guenther, A., Williams, J., Artaxo, P., Sindelarova, K., Doubalova, J., Kesselmeier, J., and Peñuelas, J. Amazonian biogenic volatile organic compounds under global change, Glob. Change Biol., 26, 4722–4751, https://doi.org/10.1111/gcb.15185, 2020.
Yáñez-Serrano, A. M., Filella, I., Llusià, J., Gargallo-Garriga, A., Granda, V., Bourtsoukidis, E., Williams, J., Seco, R., Cappellin, L., Werner, C., de Gouw, J., and Peñuelas, J.: GLOVOCS-master compound assignment guide for proton transfer reaction mass spectrometry users, Atmos. Environ., 244, 117929, https://doi.org/10.1016/j.atmosenv.2020.117929, 2021.
Zannoni, N., Leppla, D., Lembo Silveira de Assis, P. I., Hoffmann, T., Sá, M., Araújo, A., and Williams, J.: Surprising chiral composition changes over the Amazon rainforest with height, time and season, Commun. Earth Environ., 1, 4, https://doi.org/10.1038/s43247-020-0007-9, 2020.
Zannoni, N., Wikelski, M., Gagliardo, A., Raza, A., Kramer, S., Seghetti, C., Wang, N., Edtbauer, A., and Williams, J.: Identifying volatile organic compounds used for olfactory navigation by homing pigeons, Sci. Rep., 10, 15879, https://doi.org/10.1038/s41598-020-72525-2, 2020.