the Creative Commons Attribution 4.0 License.
the Creative Commons Attribution 4.0 License.
 | 21 Apr 2026
Soil moisture-induced changes in land carbon sink projections in CMIP6
Laibao Liu
Sonia I. Seneviratne
The terrestrial biosphere absorbs about one third of anthropogenic CO2 emissions, thereby significantly slowing human-induced climate change. Its capacity to act as a carbon sink strongly depends on climate conditions, particularly soil moisture (SM), which can constrain plant growth and amplify land–atmosphere feedbacks. Therefore, accurately capturing these effects in Earth System Models (ESMs) is critical.
Using dedicated experiments of the Land Feedback Intercomparison Project (LFMIP, an experiment within the Land Surface, Snow, and Soil Moisture Model Intercomparison Project, LS3MIP) from the latest generation of ESMs from the Coupled Model Intercomparison Project Phase 6 (CMIP6), we show that projected SM changes substantially reduce the land carbon sink by the end of the century (2070–2099). This reduction is mainly driven by SM variability, highlighting the importance of SM extremes, which are projected to become more frequent and intense under climate change. Our results confirm those of the previous model generation based on the Global Land–Atmosphere Climate Experiment-Coupled Model Intercomparison Project phase 5 (GLACE-CMIP5). The results show that the strong negative impact of SM changes on the land carbon sink shown for GLACE-CMIP5 is less severe in LFMIP. A more in-depth analysis reveals that this is due at least in part to the specific ESM sampling of the respective experiments, with participating ESMs from CMIP5 generally showing a stronger drying trend. Despite agreement on the negative impact of SM on the land carbon sink in most tropical and mid-latitude ecosystems in both sets of multi-model experiments, there are large intermodel differences in the projected magnitudes.
As SM can influence land carbon uptake both directly and indirectly via land–atmosphere coupling, we conduct a contribution analysis on the impact of direct and indirect SM effects on carbon uptake, which reveals that SM–atmosphere interaction dominate SM-induced changes globally. However, models show disagreement on the magnitude of these effects. Intermodel differences arise mainly from varying sensitivities of GPP to SM-related direct and indirect effects, suggesting that differences likely stem from varying representations of water-stress related processes across ESMs.
Our findings highlight SM–atmosphere coupling as a critical factor for future land carbon uptake. Improving the representation of water stress processes, plant hydraulics, and vegetation characteristics in ESMs is essential for reducing uncertainty in projections. Maintaining and possibly extending the experimental setup to a larger set of models in future CMIP generations will be key to advancing our understanding of SM-carbon interactions and consequently of the evolution of the land carbon sink under human-induced climate change.
- Article
(8424 KB) - Full-text XML
-
Supplement
(35405 KB) - BibTeX
- EndNote


The terrestrial biosphere plays a crucial role in Earth's climate system by acting as a net carbon sink. The land carbon sink is determined by the balance of carbon uptake through photosynthesis (Gross Primary Production, GPP) and losses via ecosystem respiration and disturbances such as wildfires and land-use change (Keenan and Williams, 2018). On large spatial and temporal scales, this net carbon balance is referred to as Net Biome Production (NBP), where positive values indicate a net flux of carbon from atmosphere to land (sink) and negative values indicate a net flux of carbon from land to atmosphere (source). In the recent past, the global land carbon sink has increased with increasing atmospheric CO2 concentration and has absorbed about one third of anthropogenic CO2 emissions (Friedlingstein et al., 2025). This underscores the important role of the land carbon sink in dampening the atmospheric CO2 growth rate, thus slowing down human-induced climate change (Friedlingstein et al., 2006).
The capacity of terrestrial ecosystems to remove and store carbon is strongly influenced by climate conditions. Temperature-induced increases in respiration by plants and soil microbials, thawing permafrost, decreasing water availability, and the impact of more intense and frequent extreme events on ecosystems weaken the carbon sink and amplify climate change (Arora et al., 2020; Natali et al., 2021; Reichstein et al., 2013; Williams et al., 2019). Evidence on the importance of water-carbon coupling in modulating the evolution of the land carbon sink has grown (Gentine et al., 2019; Green et al., 2019; Huang et al., 2016; Humphrey et al., 2018; Liu et al., 2020, 2023; Stocker et al., 2018; Sun et al., 2025). The effect of water availability on NBP is particularly evident in regions where land carbon uptake is restricted by moisture availability (water limitation) rather than by net radiation (energy limitation) (Green et al., 2019; Marcolla et al., 2020; Seneviratne et al., 2010).
Recent studies have shown that decreased soil moisture (SM) availability plays a crucial role in weakening the land carbon sink. It has been identified as the dominant cause of interannual carbon flux anomalies (Humphrey et al., 2021; Liu et al., 2024a), but also affects long-term changes in the land carbon sink because the negative effect of water stress on ecosystems is not offset by subsequent equivalent wet anomalies (Green et al., 2019). As the frequency and intensity of extreme events is projected to increase with climate change (Seneviratne et al., 2023), this could substantially weaken the land carbon sink in the future. Prolonged (SM) droughts weaken ecosystem resilience, raising susceptibility to pathogens, insect outbreaks, and plant mortality, and increasing the risk of fire events (Allen et al., 2015; Seidl et al., 2017; Sippel et al., 2018; Williams and Abatzoglou, 2016). This impairs drought recovery and can lead to lower carbon storage capacity (Green et al., 2019; Reichstein et al., 2013; Zheng et al., 2021). Consequently, water scarcity can have immediate, delayed, and potentially long-lasting effects on the land carbon sink (Anderegg et al., 2015; Kannenberg et al., 2020; Schwalm et al., 2017).
SM limitation affects both major carbon sink components, GPP and ecosystem respiration. Decreased SM can cause water stress in vegetation due to direct physiological effects of water limitation on GPP and indirect effects via land–atmosphere feedbacks (Green et al., 2019; Humphrey et al., 2021; Liu et al., 2025; Zhou et al., 2019). Direct SM effects arise from photosynthetic activity being constrained by soil water availability. Under dry conditions, plants partially close their stomata to limit water losses through transpiration, which in turn reduces CO2 uptake and thus limits GPP (Sippel et al., 2018). Indirect SM effects arise from interactions between the land surface and the atmosphere. Low SM suppresses the latent heat flux trough evapotranspiration, causing a shift towards the sensible heat flux that increases near-surface air temperature and vapour pressure deficit (VPD). Elevated temperatures and increased VPD enhance atmospheric evaporative demand and promote further stomatal closure, thereby reinforcing the the negative effect of low SM on GPP (Berg et al., 2016; Seneviratne et al., 2010). Low SM can also increase incoming radiation by reducing cloud formation and atmospheric humidity, which enhances photosynthetic activity (Seneviratne et al., 2010; Zscheischler et al., 2015). In many ecosystems globally, dryness stress has a more pronounced negative impact on NBP through GPP than respiration (Gu et al., 2017; Li et al., 2023; von Buttlar et al., 2018). Nevertheless, ecosystem respiration is also sensitive to water scarcity. Low SM can suppress soil respiration by reducing the availability of soluble carbon substrates to soil microbes, while elevated temperatures can lead to higher soil respiration (Gentine et al., 2019).
To assess the representation of SM–atmosphere coupling and its long-term effect in climate projections, the Global Land–Atmosphere Coupling Experiment of the Coupled Model Intercomparison Project Phase 5 (GLACE-CMIP5) was introduced (Seneviratne et al., 2013). Using the GLACE-CMIP5 experiment, Green et al. (2019) demonstrated that SM changes have a significant long-term impact on NBP under a high-emission scenario, with changes in SM reducing the carbon sink by half its potential magnitude by the end of the 21st century (Green et al., 2019). However, SM-induced changes in the land carbon sink show large intermodel differences and the origins of these differences remain elusive.
In this study, we assess the impact of SM on the land carbon sink in the latest generation of Earth System Models (ESMs) from the Coupled Model Intercomparison Project Phase 6 (CMIP6) using dedicated experiments of the Land Feedback Intercomparison Project (LFMIP) and compare it with results from GLACE-CMIP5. Furthermore, we conduct a contribution analysis to quantify the extent to which SM-induced changes in land-carbon dynamics emerge through direct linear effects of water limitation on photosynthesis, versus indirect effects mediated by land–atmosphere feedbacks and investigate the origins of intermodel differences. Therefore, our analysis consists of two parts addressing the following research questions:
-
Is the SM-induced impact on NBP according to LFMIP different from that according to GLACE-CMIP5 with regard to the effect of SM trend and variability (see Sect. 3.1)?
-
Within LFMIP, what are the origins of (i) SM-induced changes in GPP (see Sect. 3.2.1) and (ii) related intermodel differences (see Sect. 3.2.2)?
Our analysis aims to further improve the understanding of SM-carbon coupling in state-of-the-art ESMs and its implications for long-term carbon cycle projections. Gaining a deeper understanding of the moderating processes within the land carbon cycle is essential for enhancing projections of atmospheric CO2 growth rates, which in turn is crucial for accurately estimating the magnitude of future climate change (Arora et al., 2020; Friedlingstein et al., 2025).
2.1 Model experiments and data
To assess SM-induced changes in the land carbon sink, ESM output data of LFMIP are used, which is part of the Land Surface, Snow, and Soil Moisture Model Intercomparison Project (LS3MIP, van Den Hurk et al., 2016) under CMIP6. LFMIP follows the GLACE-CMIP5 blueprint (Seneviratne et al., 2013) and is designed to diagnose changes in land–atmosphere coupling related to SM.
LFMIP consists of three experiments, a reference run (CTL) based on the historical and the Shared Socioeconomic Pathway 5-8.5 (SSP5-8.5) scenarios of CMIP6 and two experiments where SM is prescribed as (i) the mean seasonal cycle of 1980–2014 (pdLC) and (ii) the 30-year running mean (rmLC) of CTL (see Supplement Fig. S1 for an illustration of the experiments). LFMIP outputs are available from the four ESMs of CMIP6, CESM2, IPSL-CM6A-LR, MPI-ESM1-2-LR, and CMCC-ESM2 (for detailed information see Supplement Table S1). LFMIP covers the period 1981–2099 at monthly resolution.
It is important to note that for the experiment simulations pdLC and rmLC, the hydrological cycle is not closed because by prescribing SM externally, hydrological feedbacks from the atmosphere to SM are suppressed. Consequently, water can artificially be added or lost. However, as our focus lies on the SM-induced impact on the carbon cycle and not on the hydrological cycle itself, all relevant processes, including changes in surface energy partitioning, near-surface air temperature, VPD, and physiological controls on photosynthesis remain physically consistent. Therefore, differences between experiment simulations can be robustly attributed to SM-induced effects on NBP and GPP despite the lack of water budget closure.
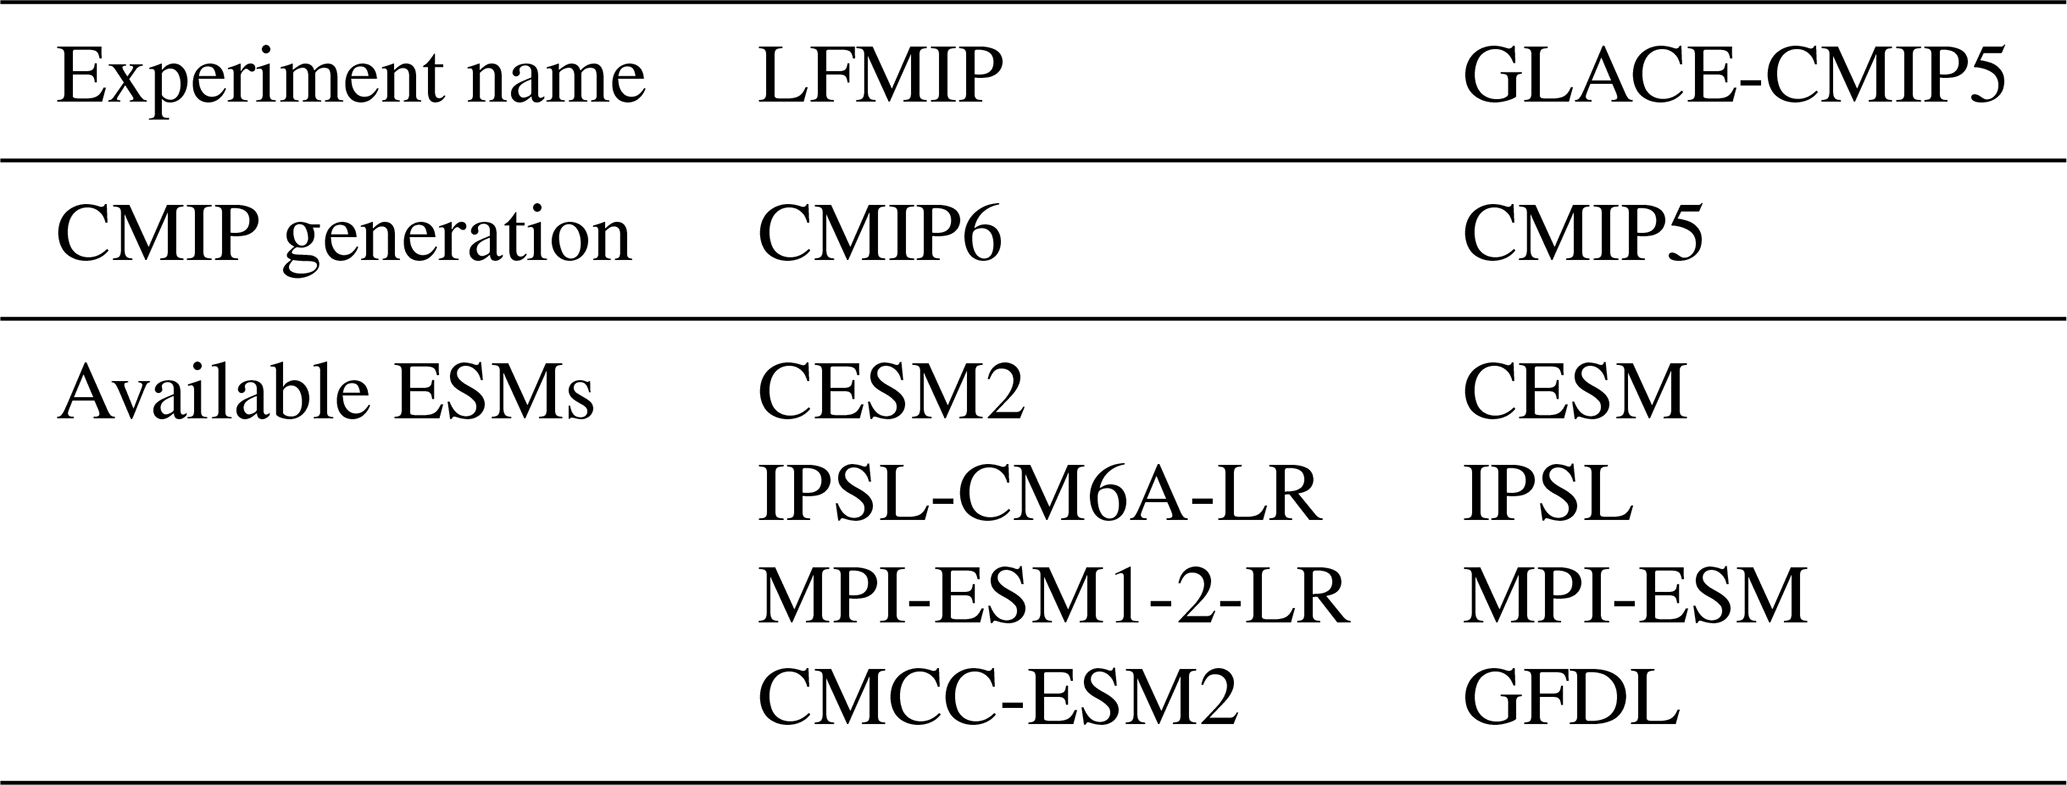
The SM-induced changes in NBP derived from LFMIP are compared with those of the previous generation, GLACE-CMIP5 (Table 1). For this purpose, we partially reproduce and build on the analysis of Green et al. (2019) to compare SM-induced changes in NBP between model generations for the period 1981–2099. Available for the analysis of GLACE-CMIP5 are outputs from four models, CESM, GFDL, IPSL, and MPI-ESM (see Seneviratne et al. (2013) Table 1 for detailed information). Among the available ESMs for each model generation, three of four model are from the same modelling group. The GLACE-CMIP5 experiment follows the same protocol as LFMIP for the previous model generation, CMIP5. To compare recent and projected future conditions across models, our analysis focuses on a baseline period (1981–2010) and an end-of-century future period (2070–2099). We note that the period for the SM prescription in GLACE-CMIP5 (1971–2000) is roughly one decade earlier than in LFMIP. This impedes the direct comparison for the impact of SM on NBP across model generations for the baseline period, but our focus lies on the evolution of SM-induced impacts on NBP by the end of the century, which are not affected.
Table 1Overview on the model experiments LFMIP and GLACE-CMIP5 used in this analysis, including the respective CMIP generation and the available Earth System Models that provide the required output for the experiment simulations.
To assess if the available four models of LFMIP and GLACE-CMIP5, respectively, are representative of their respective CMIP generation, larger sets of CMIP6 (Eyring et al., 2016) and CMIP5 (Taylor et al., 2012) models are used. Ten ESMs of CMIP5 (i.e., BNU-ESM, CESM1-BGC, CanESM2, CanESM2, GFDL-ESM2G, HadGEM2-CC, HadGEM2-CC, IPSL-CM5A-LR, MPI-ESM-LR, and NorESM1-M) and nine ESMs of CMIP6 (i.e., ACCESS-ESM1-5, CESM2, CMCC-ESM2, EC-Earth3-Veg-LR, GFDL-ESM4, IPSL-CM6A-LR, MPI-ESM1-2-LR, MRI-ESM2-0, NorESM2-LM) were used for this comparison, selecting one ensemble member from each modelling group.
ESMs are physically based, prognostic models that include a land component with an interactive carbon cycle described by numerical representations of real−world biogeochemical processes. GPP is simulated as leaf level photosynthesis and constrained by temperature, radiation, atmospheric CO2 concentration, water and nutrient availability. ESMs also represent soil biogeochemistry, including litter and soil organic matter decomposition that drive microbial respiration. NBP is provided as the net land–atmosphere carbon exchange (i.e., NBP = GPP − ecosystem respiration − disturbances).
We use ESM output for NBP to assess the land carbon sink, GPP to assess land carbon uptake, and total column soil moisture to quantify changes in projected SM. Since ESMs account for different numbers of soil layers and also vary in soil layer depth, output data for SM varies substantially in magnitude. Therefore, we standardise SM output to z-score values, using
where each data point X is standardised by the mean of the reference period μref and its standard deviation σref. As reference period we use the baseline period (1981–2010) to emphasize changes in SM compared to the baseline period from which SM is prescribed in the experiments.
For the contribution analysis of direct and indirect SM effects (see Sect. 2.3) we further use LFMIP model output at monthly resolution for the variables near-surface air temperature (T, in °C), surface downwelling short-wave radiation (R, in W m−2) and vapour pressure deficit (VPD, in kPa). VPD is calculated as the difference between the saturated water vapour pressure (es, in kPa) and the actual water vapour pressure (ea, in kPa), where es is determined by T using the Clausius–Clapeyron relation, such that
and ea is calculated from relative humidity (RH, in %) as
For spatially resolved comparisons across models, the data is regridded to 1° resolution using bilinear interpolation.
2.2 Isolating the effects of soil moisture
To isolate the effects of SM on NBP (and similarly, on GPP), a method commonly used in experiments following the GLACE blueprint is employed (see (Green et al., 2019; Seneviratne et al., 2013). Changes in NBP (ΔNBPCTL) can be described as
where ΔNBPSMtrend is the effect of changes in mean SM conditions on NBP and ΔNBPSMvar the effect of SM variability on NBP. ΔNBPother summarises changes in NBP due to the fertilisation effect of CO2, temperature changes, and other influencing factors. The experiments of LFMIP allow isolating the effect of SM trend and variability, where
and
as well as the combined effects of SM expressed as
2.3 Separating the contributions of direct and indirect soil moisture effects
To assess the impact of direct and indirect SM effects, we focus on GPP which is more strongly influenced by SM changes than respiration, particularly in regions that strongly contribute to global NBP (see Supplement Figs. S2 and S5). SM-induced changes in GPP (ΔGPP) can occur as direct effect through changes in water availability for photosynthesis and as indirect SM effect via SM–atmosphere coupling. To assess the contribution of direct and indirect effects, we conduct a contribution analysis (see Sect. 3.2.1). Following the approach of Humphrey et al. (2021), a multiple linear regression is performed to capture the local direct and indirect effects of SM on GPP for monthly time steps on grid cell level, using
where ΔGPP* describes the estimated SM-induced change in GPP due to ΔSM, which represents the change in SM; ΔT denotes the SM-induced change in near-surface air temperature, ΔVPD that in vapour pressure deficit, and ΔR that in downward solar radiation, respectively, and β are the corresponding regression coefficients. The regression is performed over 30 years and the resulting impacts of the individual drivers SM, T, VPD, and R are referred to as , , , and , respectively. Following the reasoning of Humphrey et al. (2021), the impact of indirect SM effects via T and VPD ( and ) are reported as their sum (), since the calculation of VPD depends on T, limiting the ability to disentangle their impact on GPP. Their individual effects are reported in Supplement Figs. S12 and S13 for completeness.
We note that for this part of the analysis we focus only on the total SM effect (and not on the individual effects of SM trend and variability), thus, ΔGPP is equivalent to GPPCTL − GPPpdLC and consequently the regression estimates also refer to the total SM effect on GPP. For better readability we omitted the subscript “SMall” for this part of the analysis.
2.4 Measures of intermodel differences
To assess whether differences in projected direct and indirect SM effects or in the sensitivity of GPP to those SM effects dominate intermodel spread, we apply a variance decomposition based on an analysis of variance (ANOVA) framework to the SM effects derived by regression, i.e., , , and (see Sect. 2.3). We neglect due to its small impact on global ΔGPP* (see Sect. 3.2.1). We construct a full factorial ensemble of ΔGPP* by systematically combining the projected SM effects and sensitivities of GPP across LFMIP models. At each grid cell, the SM-induced change in GPP for a given combination of factor levels is expressed as
where ΔSM, ΔT, and ΔVPD denote the direct and indirect SM effects and βSM, βT, and βVPD are the sensitivities of GPP to the respective SM effect. The indices denote the levels for each of the six factors (i.e., the individual ESMs) from which the SM effects and sensitivities are drawn. ε represents the residual change in GPP which is not captured by the linear contributions of direct and indirect SM effects, including non-linear, non-local, lagged, and interaction effects. The ANOVA-based variance decomposition then attributes the variance in ΔGPP* across factor combinations to (i) the sensitivity of GPP to SM, T, and VPD and (ii) the projected changes in SM, T, and VPD. This decomposition allows us to quantify the relative contributions of differences in projected SM effects and in the associated sensitivities of GPP to the intermodel spread of SM-induced impacts on GPP.
3.1 Comparison of SM-induced impacts in GLACE-CMIP5 and LFMIP
We assess the impact of SM on NBP for the latest CMIP generation using the available LFMIP models, and compare the results with those from GLACE-CMIP5 (Fig. 1, Supplement Figs. S3, and S4). The LFMIP model mean projects the global land carbon sink (global NBPCTL) to increase from 1.07 ± 0.11 PgC yr−1 (model mean ± standard deviation across models) during the baseline period (1981–2010) to 2.91 ± 1.38 PgC yr−1 by the end of the century (2070–2099, Fig. 1a and c). The GLACE-CMIP5 mean for global NBPCTL is of similar magnitude as that of LFMIP for the baseline period (1.23 ± 1.38 PgC yr−1). However, GLACE-CMIP5 projects a decline in global NBPCTL after 2070, resulting in only a small increase in the land carbon sink by the end of the century (1.51 ± 1.69 PgC yr−1 (Fig. 1b and c)), whereas LFMIP projects the global NBPCTL to almost triple. Thus, the LFMIP mean projects a stronger land carbon sink by the end of the century compared to the GLACE-CMIP5 mean. However, the significantly smaller global NBPCTL in GLACE-CMIP5 is influenced by the CESM model, which projects NBP to be a consistent net carbon source over the 21st century (Supplement Fig. S3a).
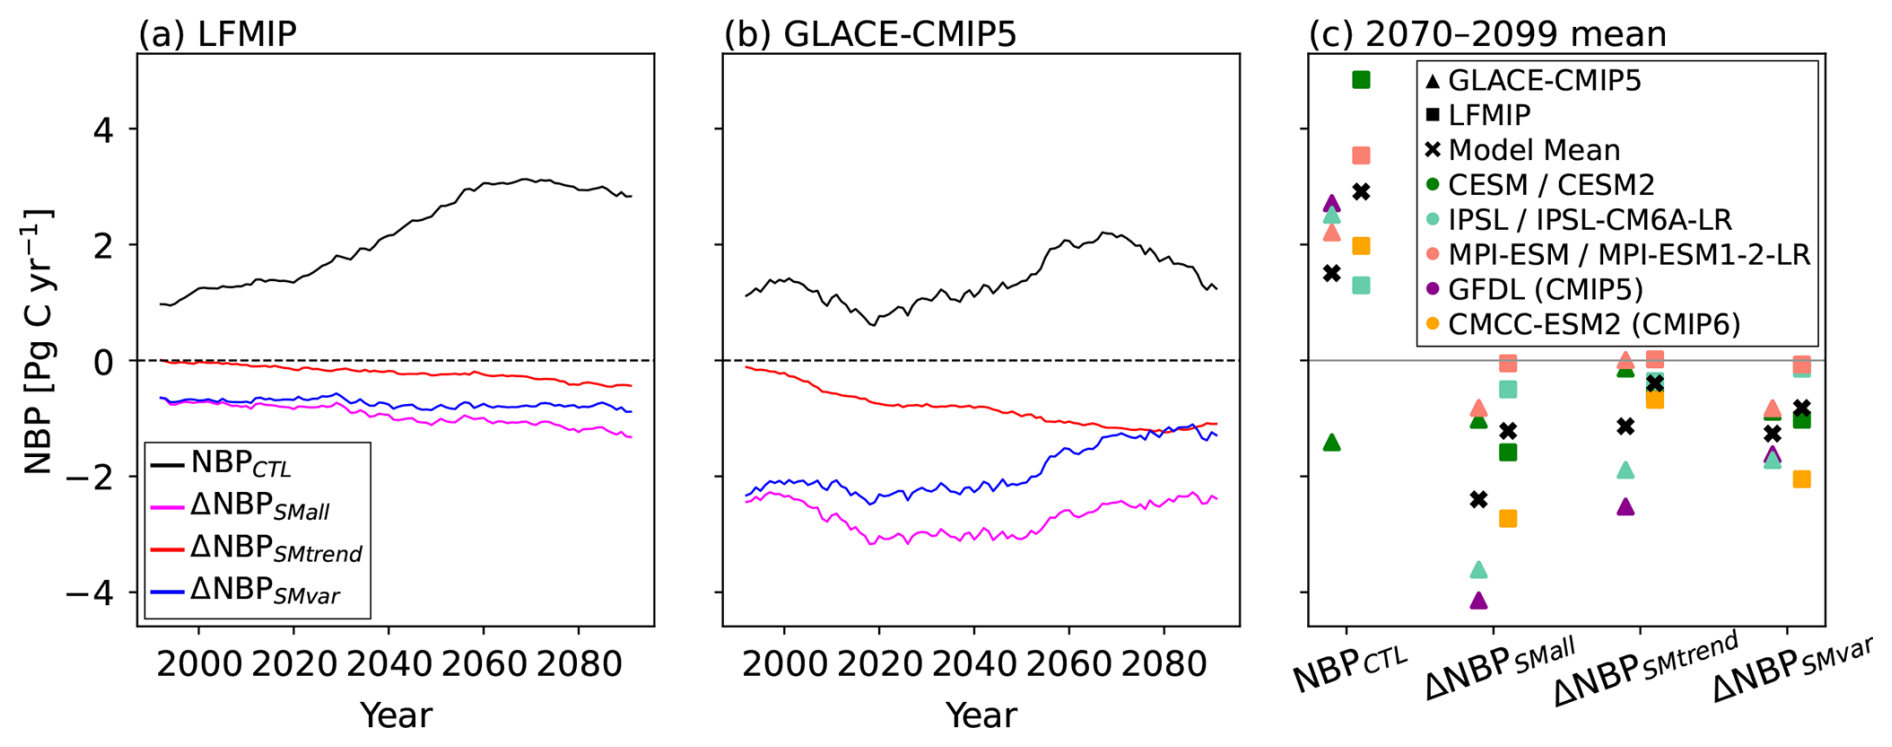
Figure 1Comparison of the global evolution of NBP in (a) GLACE-CMIP5 and (b) LFMIP from 1991 to 2089 (smoothed with a 20 year centred rolling mean), including total NBP (NBPCTL, black), as well as the changes in NBP due to SM trend (ΔNBPSM trend, red), SM variability (ΔNBPSM var, blue) and the total SM effect (ΔNBPSM all, pink), and (c) individual model projections of global mean NBP and the respective SM-induced changes for the future period (2070–2099) for GLACE-CMIP5 (triangles) and LFMIP (squares). For panels (a) and (b) the figure design was adopted from Green et al. (2019).
In both model generations, projected SM changes negatively affect global NBPCTL (Fig. 1). For the LFMIP mean, the projected negative effect of SM on NBP is overall less severe compared to GLACE-CMIP5 (Fig. 1a and b). GLACE-CMIP5 models project the global land carbon sink to be reduced by about twice its absolute magnitude during the baseline period (2.44 ± 1.77 PgC yr−1), as previously shown by (Green et al., 2019) (Fig. 1b). This is primarily due to the negative impact of SM variability (−2.21 ± 1.67 PgC yr−1). While the impact of the SM trend leads to a growing reduction over the 21st century (to −1.14 ± 1.09 PgC yr−1 by the end of the century), the negative effect of SM variability is projected to decline (to −1.26 ± 0.41 PgC yr−1 by the end of the century, Fig. 1c). The total impact of SM on NBP at the end of the century reduces the global land carbon sink to half (i.e., the land carbon sink would be twice as strong without the negative impact of SM). In LFMIP, the projected negative effect of SM on NBP is overall less severe (Fig. 1a). In the baseline period, SM changes reduce the global land carbon sink by −0.69 ± 0.15 PgC yr−1. In the future period, the negative impact of SM changes increases in absolute magnitude to −1.22 ± 1.04 PgC yr−1 (Fig. 1c). The effect of SM variability remains relatively unchanged throughout the century, reducing NBP by −0.66 ± 0.22 PgC yr−1 in the baseline period and −0.82 ± 0.80 PgC yr−1 in the future period. The impact of SM trend becomes increasingly negative, resulting in a reduction of −0.40 ± 0.27 PgC yr−1 by the end of the century. Nevertheless, in relative terms the negative impact of SM reduces global NBPCTL by 64 % for the baseline period and only by 42 % during the future period, because global NBPCTL of LFMIP is projected to increase over time.
Assessing spatial patterns of the effect of SM on NBP shows a reduction of NBP due to SM in most areas for both model generations, mainly due to the effect of SM variability (Fig. 2, Supplement Fig. S6). The reduction is strongest in tropical regions of South America and in the mid-latitudes of the northern hemisphere, where NBPCTL is generally high (Fig. 4, Supplement Fig. S5). This SM-induced reduction in large parts of the globe is already apparent during the baseline period due to the negative impact of SM variability (Supplement Figs. S8 and S9). While LFMIP projects the negative effect of SM on NBP to intensify further over the century, especially in tropical regions and mid-latitudes of the northern hemisphere (Fig. 1a, Supplement Fig. S9), this is not the case in GLACE-CMIP5, where several regions show a substantial reduction in the negative effect of SM, especially in the mid and high latitudes of the northern hemisphere (Fig. 1b, Supplement Fig. S8). However, in both CMIP generations, models show high disagreement on the sign of change of the SM-induced impact on NBP for the future period relative to the baseline period in several regions, including regions where models agree on the projected change in SM (Fig. 3). For both CMIP generations, intermodel differences in SM-induced changes in NBP are mainly located in tropical regions and the northern mid-latitudes.
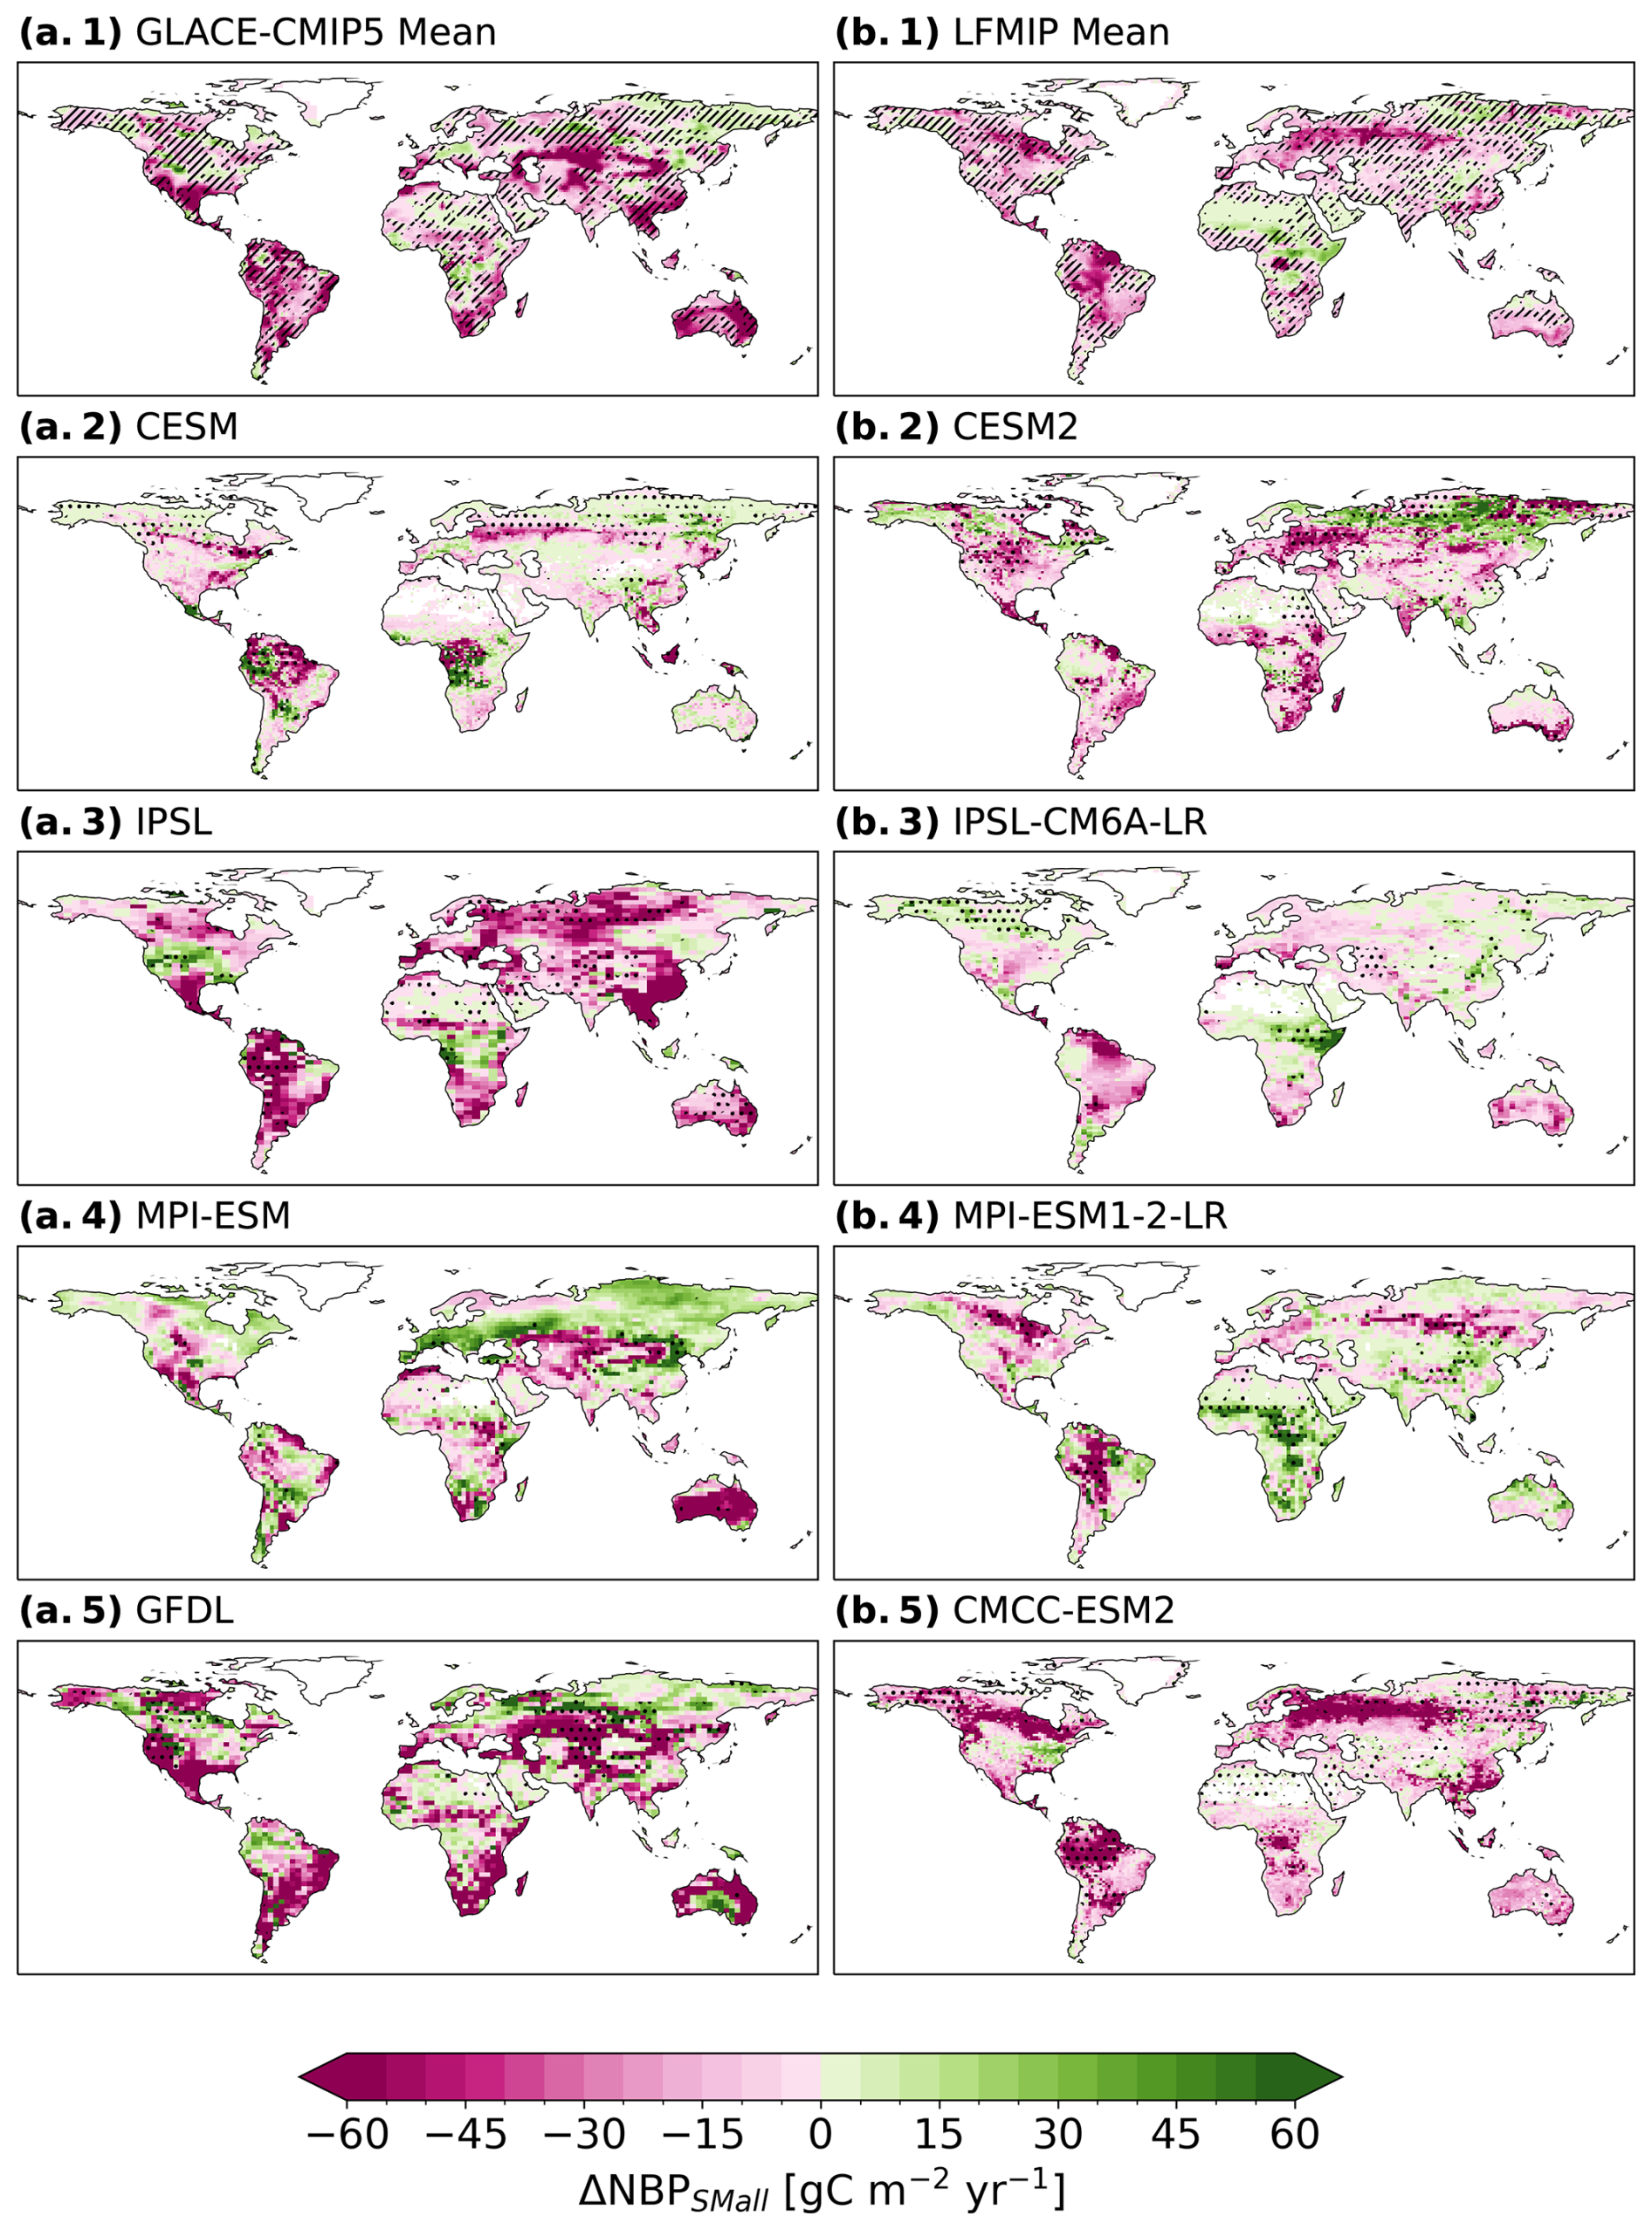
Figure 2Changes in NBP due to the total SM effect (ΔNBPSMall) for the future period (2070–2099) for (a.1) the GLACE-CMIP5 mean, (b.1) the LFMIP mean, (a.2–5) individual model projections of GLACE-CMIP5, and (b.2–5) individual model projections of LFMIP. Pink indicates a reduction and green an increase of NBP due to SM. White indicates no data. In (a.1) and (b.1) hatching indicates less than 75 % agreement in the sign of change across models for the future period relative to the baseline period. In (a.2–5) and (b.2–5) stippling indicates areas where ΔNBPSMall for the future period differs significantly from the baseline period at the 5 % level (two-sided Welch's t-test).
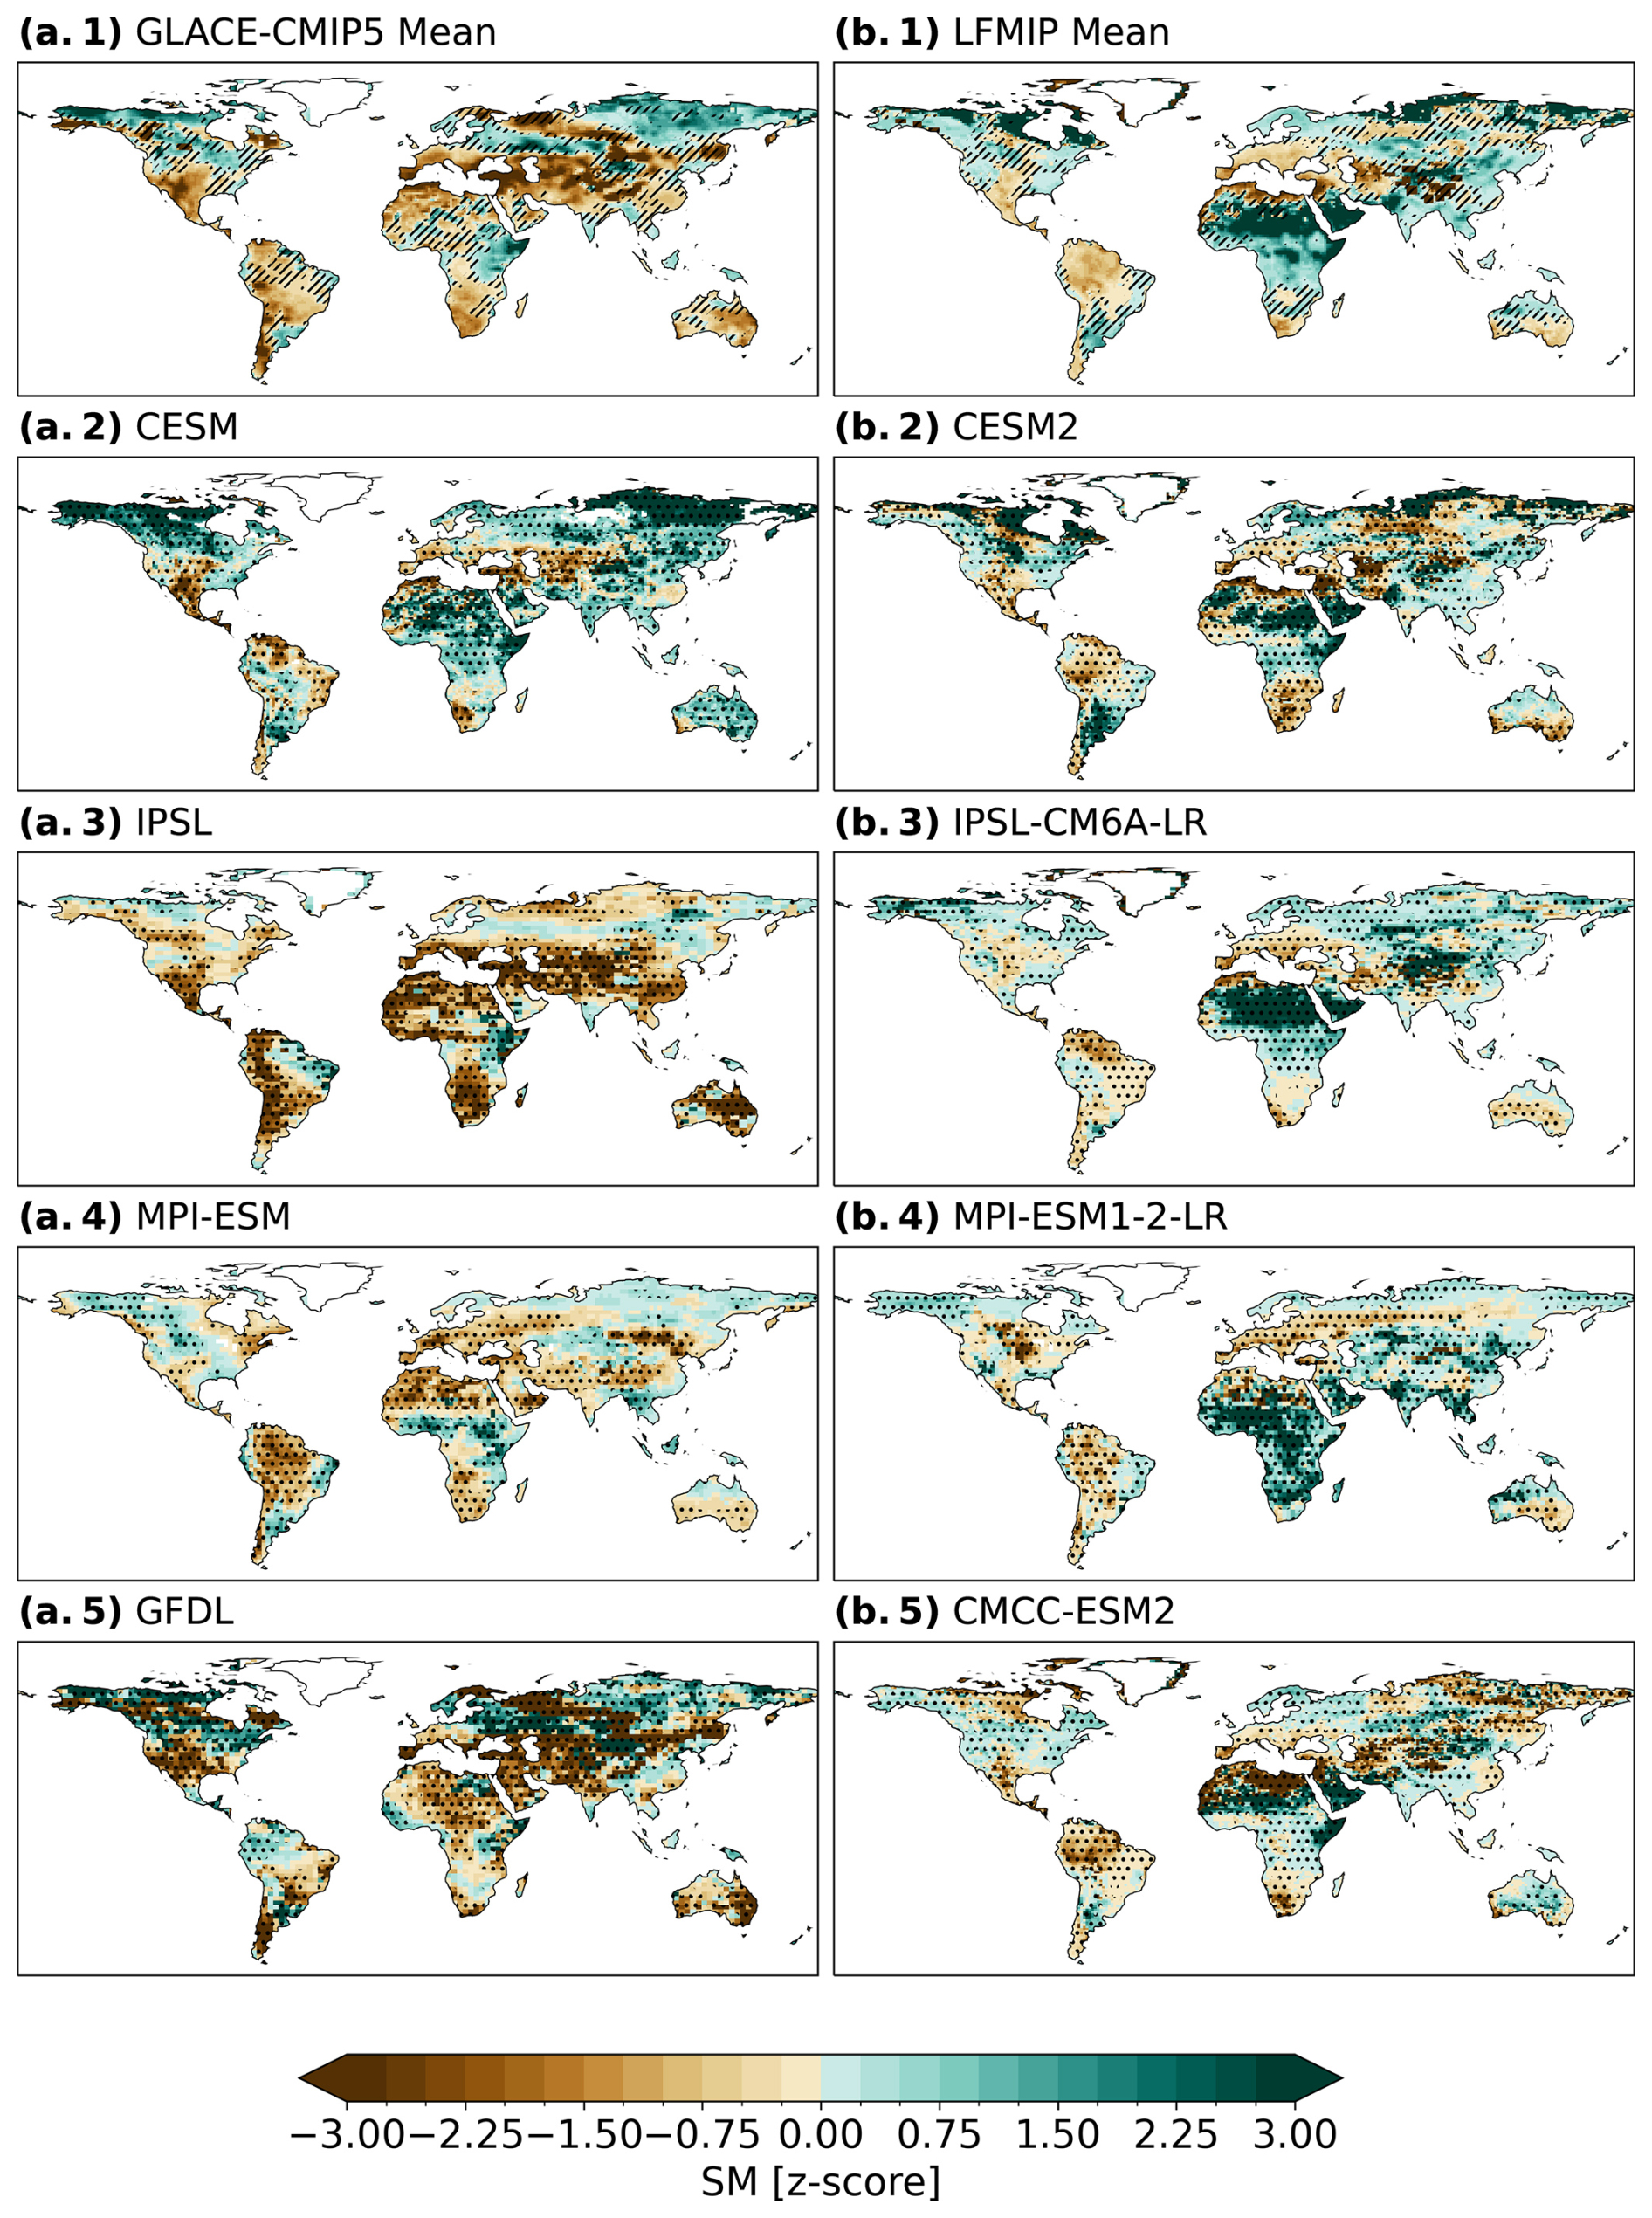
Figure 3SM changes in standard deviations (z-score) from the control simulation for the future period (2070–2099) relative to the baseline period (1981–2010) for (a.1) the GLACE-CMIP5 mean, (b.1) the LFMIP mean, (a.2–5) individual model projections of GLACE-CMIP5, and (b.2–5) individual model projections of LFMIP. Brown indicates drying and green wetting relative to the pre-industrial period. White indicates no data. In (a.1) and (b.1) hatching indicates less than 75 % agreement in the sign of change across models for the future period relative to the baseline period. In (a.2–5) and (b.2–5) stippling indicates areas where changes in SM for the future period differ significantly from the baseline period at the 5 % level (two-sided Welch's t-test).
Comparing the SM evolution in GLACE-CMIP5 and LFMIP reveals substantial differences in the magnitude and spatial extent of the projected SM drying (Fig. 3). The GLACE-CMIP5 mean shows widespread SM drying across the globe (Fig. 3a.1), which is less pronounced in LFMIP (Fig. 3b.1). The GLACE-CMIP5 models IPSL and GFDL (Fig. 3a.3 and a.5) project severe SM drying in several areas, especially in the northern mid-latitudes by the end of the century, resulting in a strong negative impact of SM on NBP. The CMIP6 version of IPSL included in LFMIP, IPSL-CM6A-LR (Fig. 3b.3), shows less SM drying in most areas than IPSL and even a reversed trend (i.e., SM wetting) in several regions, including vast areas of Central and Southeast Asia, Northern Europe, Central Africa, and North America. Similarly, MPI-ESM1-2-LR (LFMIP, Fig. 3b.4) shows less pronounced SM drying than MPI-ESM (GLACE-CMIP5, Fig. 3a.4) and a reversed SM trend in large parts of Central and Southern Africa, as well as in Western and Southeast Asia, leading to a less negative SM-induced impact on NBP. CESM2 (LFMIP, Fig. 3b.2) and CESM (GLACE-CMIP5, Fig. 3a.2) generally show less pronounced differences in their SM projections.
We assess the representativeness of the four available models in GLACE-CMIP5 and LFMIP for the respective CMIP generation by comparing them with multi-model means (MMMs) of CMIP5 and CMIP6, respectively. The comparison was performed for NBP and SM for each latitude zone (Fig. 4). LFMIP and GLACE-CMIP5 have a similar mean and spread (95 % confidence interval) as the respective full ensemble in most latitude zones. However, GLACE-CMIP5 shows stronger SM drying in the mid-latitudes of the northern hemisphere than the CMIP5 MMM, primarily due to GFDL and IPSL (Fig. 4b.1, Supplement Fig. S10b.2). As the northern mid-latitudes are the main contributors to global NBP (accounting for 41 % (45 %) of global NBP in LFMIP (CMIP6 MMM) and 70 % (85 %) in GLACE-CMIP5 (CMIP5 MMM)), this must be considered when interpreting the strong negative impact of SM on NBP projected by these models in GLACE-CMIP5.
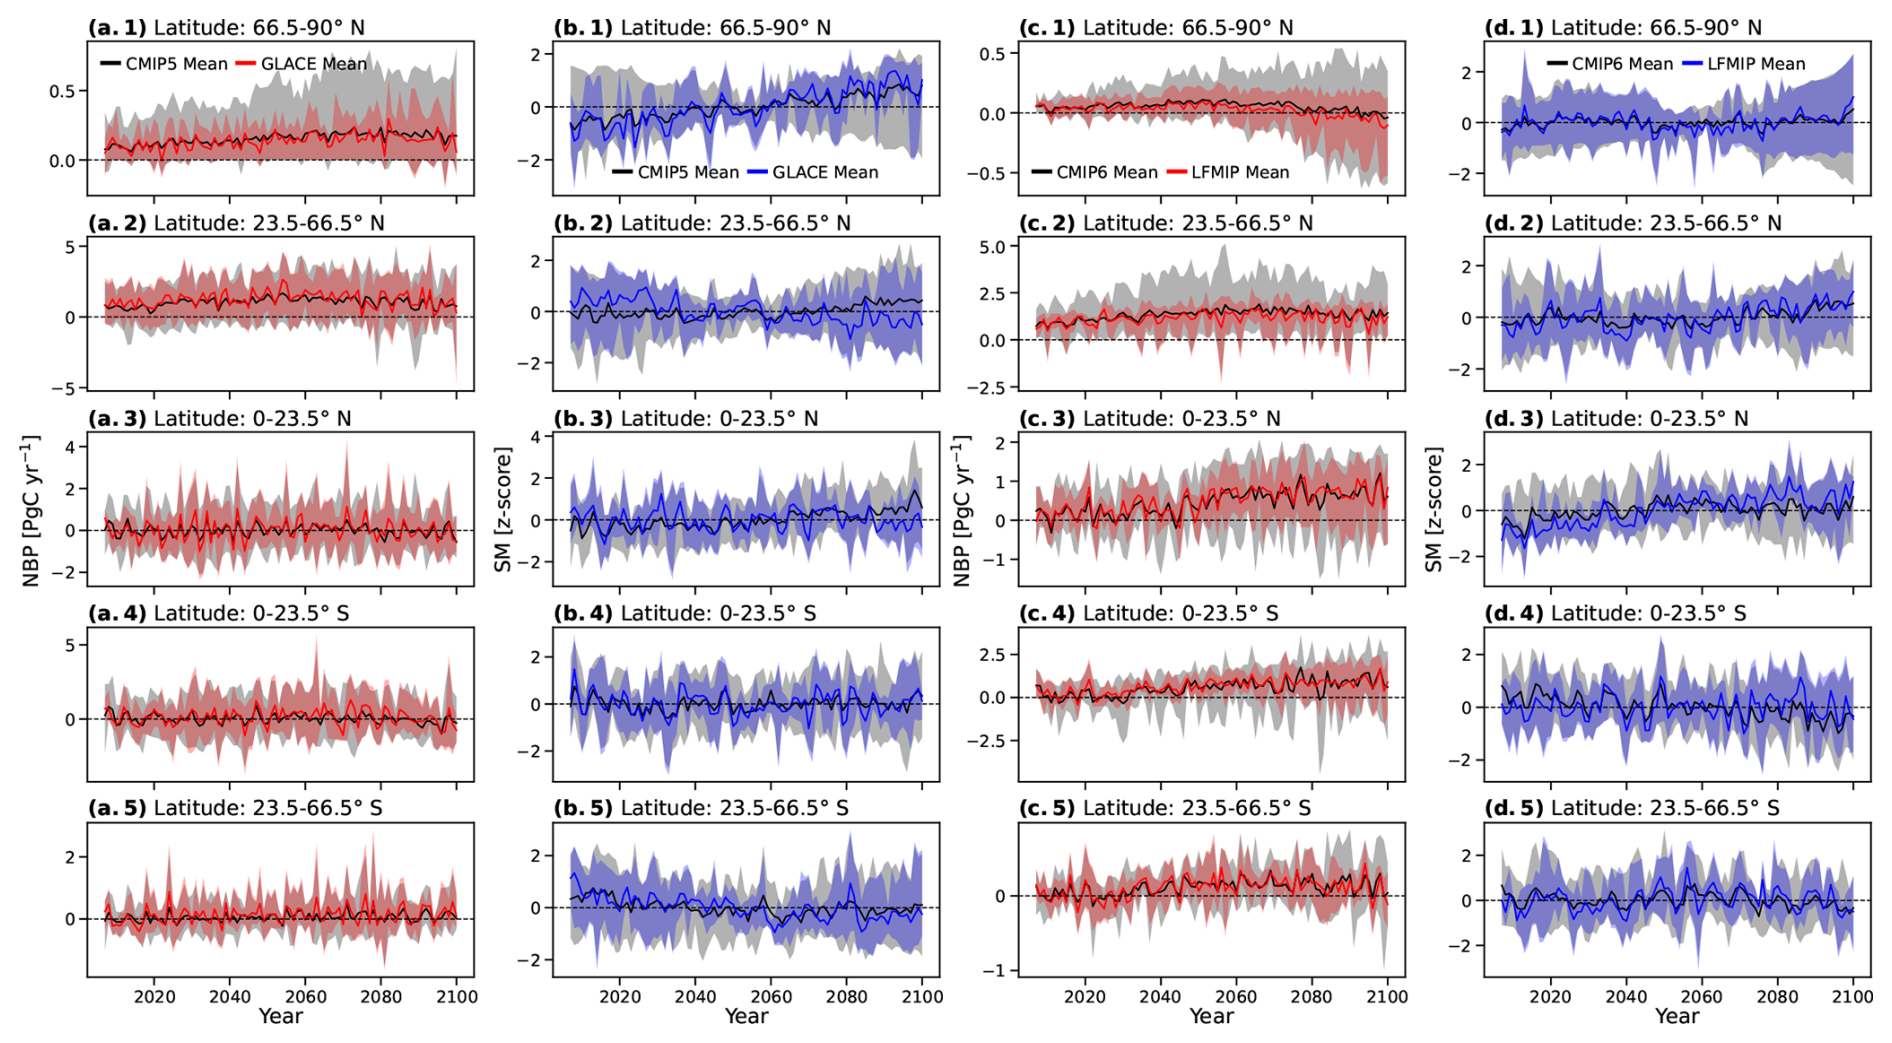
Figure 4Comparison of NBP and SM of (a, b) GLACE-CMIP5 to the CMIP5 multi-model mean (MMM) and (c, d) LFMIP to the CMIP6 MMM within latitude zones from north (1) to south (5). In columns (a) and (c), red lines show NBP by latitude zone and red shading the 95 % confidence interval for GLACE-CMIP5 and LFMIP, respectively. In Columns (b) and (d), blue lines show SM by latitude zone and blue shadings the 95 % confidence interval. Black lines indicate the full ensemble MMM and grey shadings the 95 % confidence interval.
3.2 Origins of SM-induced changes in land carbon uptake
With focus on LFMIP, we further analyse the origins of SM-induced changes in land carbon uptake by (i) conducting a contribution analysis to assess the impact of direct and indirect SM effects on GPP (Sect. 3.2.1) and (ii) investigating causes of intermodel differences in SM-induced changes in GPP from direct and indirect SM effects and their respective sensitivities (Sect. 3.2.2). To assess the impact of SM on land carbon uptake under future climate change, we focus on the future period (2070–2099) when impacts of both SM variability and SM trend come into play. The results for GLACE-CMIP5 are displayed in Supplement Figs. S15 to S17.
3.2.1 Contribution of direct and indirect effects
To isolate the contributions of the direct SM effect and indirect effects via SM–atmosphere coupling, we adapt the approach from Humphrey et al. (2021) and perform a multiple linear regression of the local response of GPP to the total impact of SM (ΔGPP) on the predictors ΔSM (as direct effect), ΔT, ΔVPD, and ΔR (as indirect SM effects) as described in Sect. 2.3. The estimated ΔGPP* shows high spatial agreement with the modelled ΔGPP (spearman r=0.93), capturing 83 % of the global ΔGPP for the LFMIP mean for the future period, confirming the validity of the approach (Fig. 5, Supplement Fig. S11).
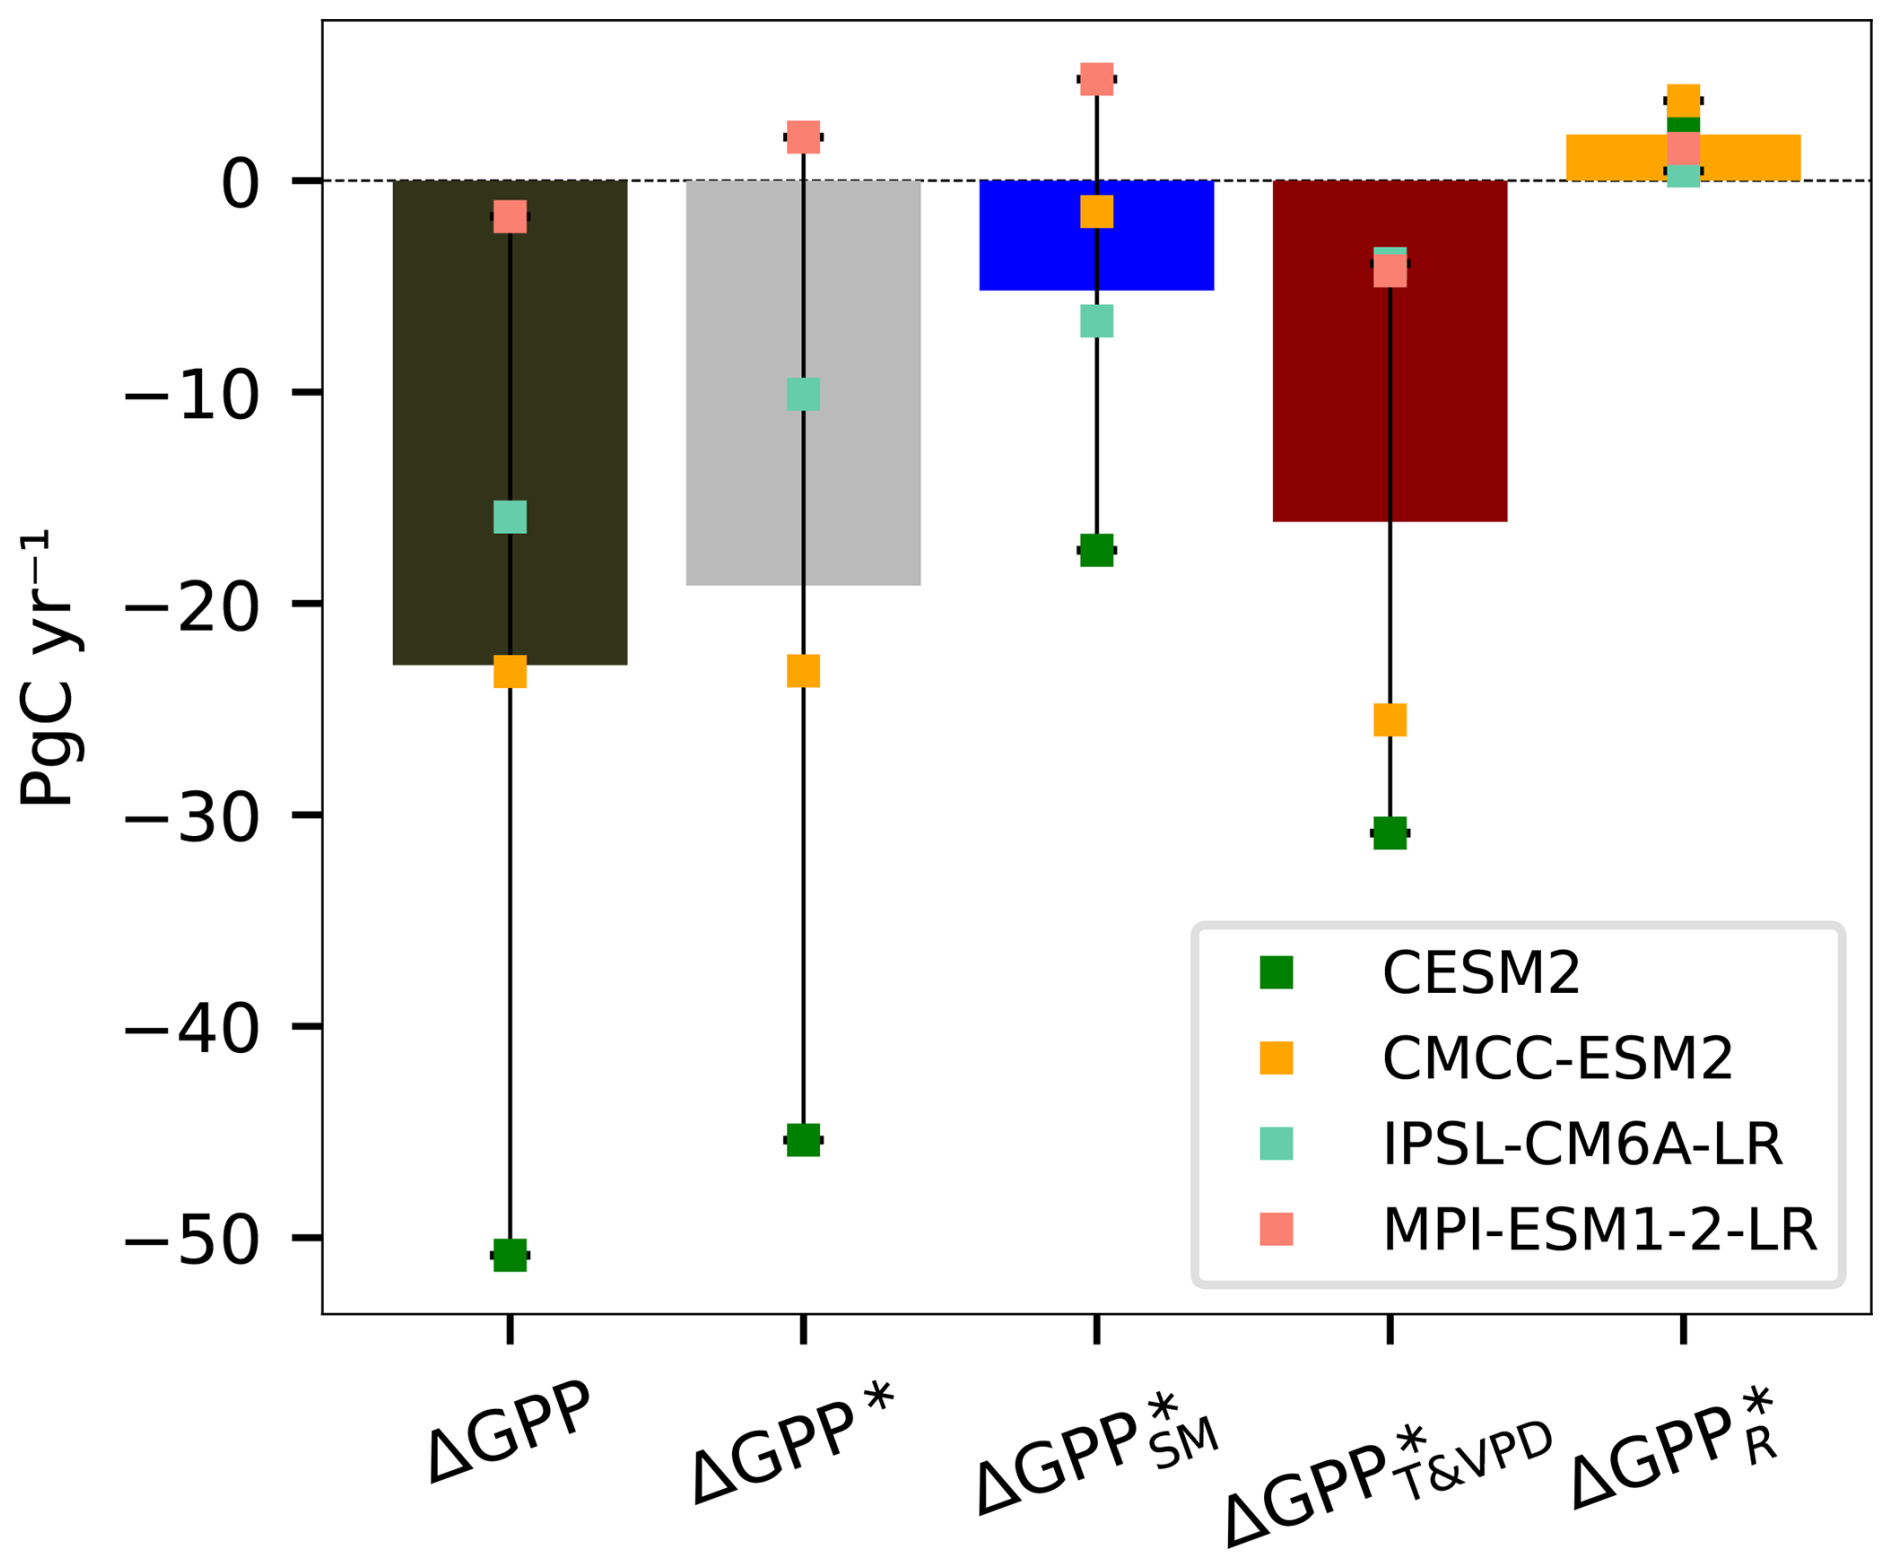
Figure 5Global changes in GPP due to the total SM effect modelled in LFMIP (ΔGPP, black bar). Contribution analysis estimates for LFMIP of the total global changes in GPP due to SM (ΔGPP*, grey bar) and individual contributions from the direct SM effect (, blue bar) and indirect SM effects via vapour pressure deficit and temperature (, red bar) and radiation (, yellow bar) for the future period (2070–2099). Bars show the LFMIP mean and coloured dots the individual models.
Globally, indirect effects via T and VPD () dominate ΔGPP*, accounting for 84 % of the negative SM-induced effect on the LFMIP mean, while the direct SM effect () accounts for 27 % (Fig. 5) . In contrast, the indirect effect on GPP via R () leads to a slight increase in GPP, but the impact is comparably small. For the LFMIP mean, the spatial results of the contribution analysis show that most areas that are projected to experience severe SM-induced reduction in GPP are dominated by (Fig. 6). However, this is not reflected in all LFMIP models, as they disagree on whether direct or indirect effects dominate ΔGPP*.
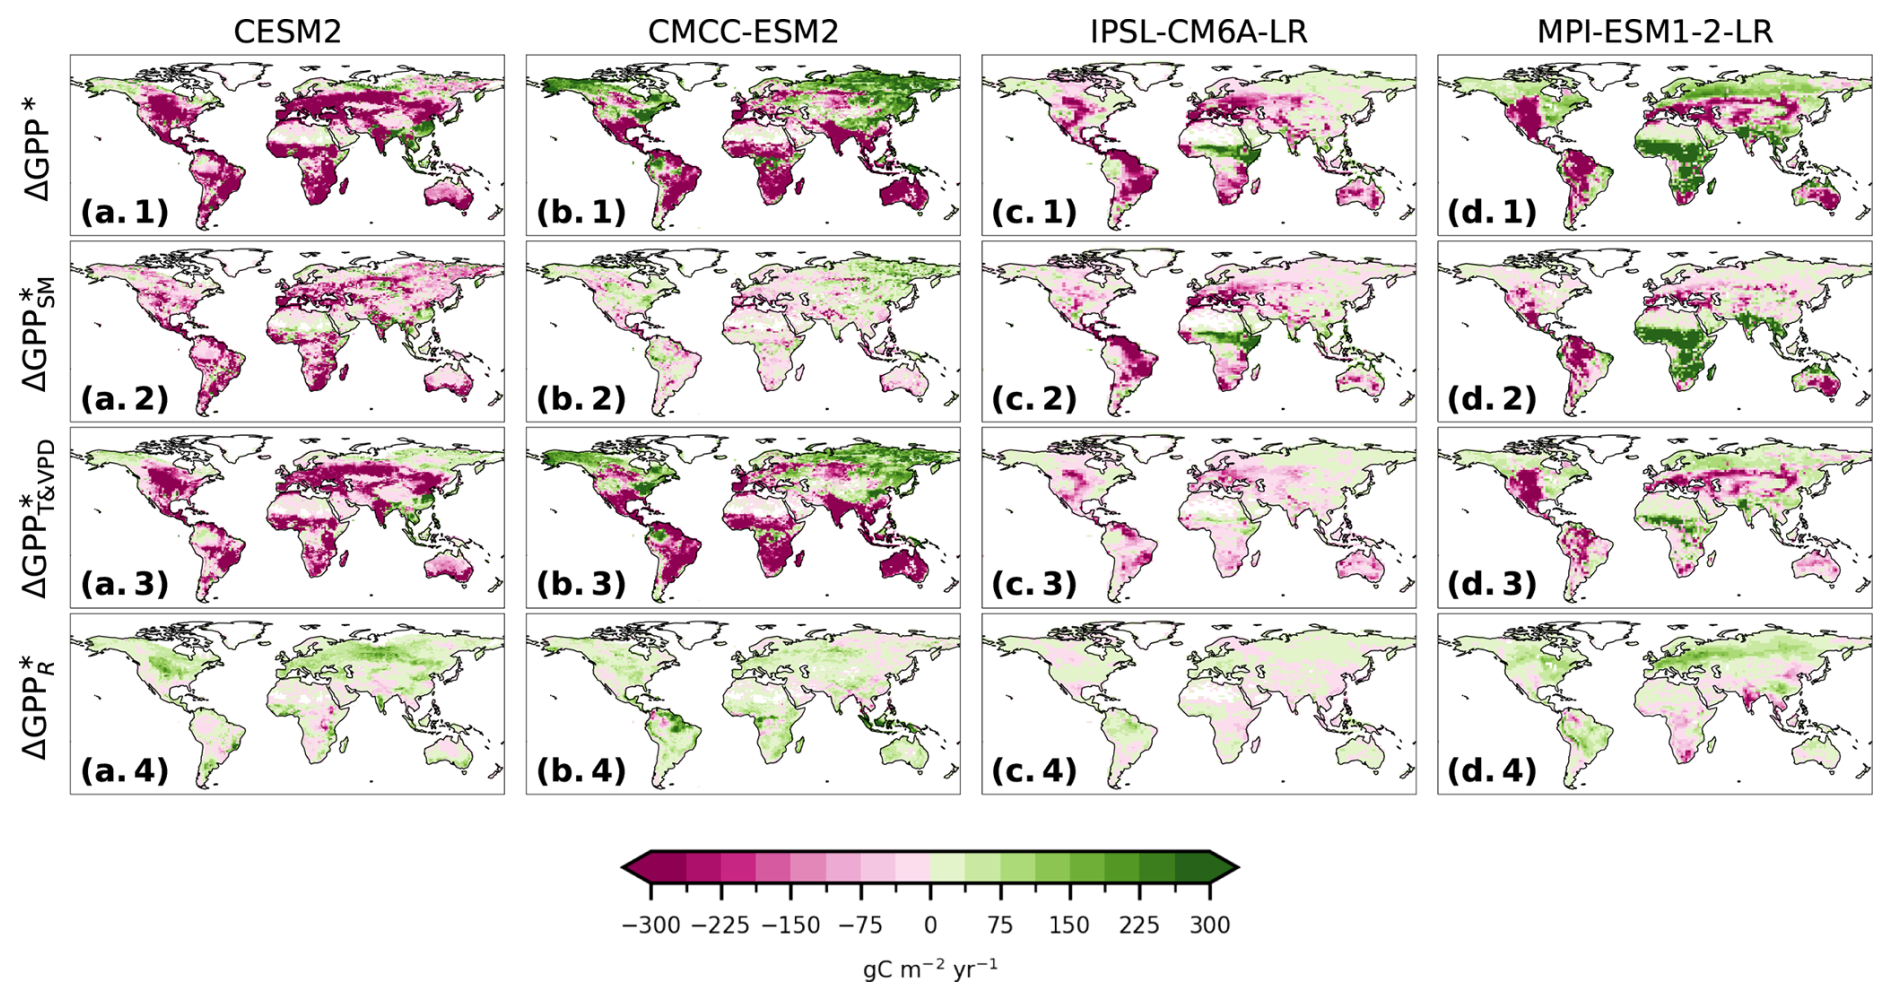
Figure 6Contribution analysis estimate for LFMIP of the total changes in GPP due to SM (ΔGPP*) and the individual contributions from the direct SM effect (), the indirect SM effects via VPD and T (), and via R () for the future period (2070–2099). Pink indicates a reduction and green an increase of NBP due to SM. White indicates no data.
The results for CMCC-ESM2 and CESM2 exhibit substantially larger contributions of (Fig. 6a and b), while IPSL-CM6A-LR and MPI-ESM1-2-LR show a larger relative contribution from the direct effect (Fig. 6c and d). For CMCC-ESM2, 109 % of the total negative contribution is attributed to (offset by a slightly positive , with the total indirect effects accounting for 93 % of the reduction in global GPP), making it the dominant impact in all regions affected by SM-induced changes in GPP. The results for CESM2 also suggest that is the main contribution to ΔGPP* (accounting for 68 % of the reduction in GPP), with some regions in the tropics and mid-latitudes also showing a strong negative impact caused by the direct SM effect. For IPSL-CM6A-LR and MPI-ESM1-2-LR, the direct SM effect are generally of great importance, especially in tropical and lower mid-latitudinal regions that show SM drying. For IPSL-CM6A-LR that is primarily northern South America, Central America, the Mediterranean, and South Africa. Similarly, MPI-ESM1-2-LR experiences a strong negative impact of the direct SM effect due to SM drying in northern South America and Central America, however, SM enhances GPP directly in large parts of Central Africa, where MPI-ESM1-2-LR is projected to experience strong SM wetting.
3.2.2 Contributions to intermodel differences
The results presented in Sect. 3.1 and 3.2.1 show substantial intermodel differences in LFMIP, revealing that even in regions where models agree on SM drying, they still disagree on the magnitude of the resulting impact on GPP (and consequently NBP). This raises the question to what extent differences in SM-induced changes of land carbon uptake arise from differences in the sensitivity of carbon uptake to SM or deviations in SM projections itself.
We perform an ANOVA-based variance decomposition to spatially assess contributions of direct and indirect SM effects, as well as of the sensitivity of GPP to those drivers as described in Sect. 2.4. Overall our results show that in areas that experience a strong reduction in GPP due to SM, the linear approach captures 70 %–90 % of intermodel differences, which relate to either differences in the evolution of direct and indirect SM effects or the sensitivity of GPP to these drivers (Supplement Fig. S14). The remaining 10 %–30 % include non-linear effects, lagged effects (e.g., slow-onset effects after drought), and non-local influences (e.g., due to atmospheric transport).
Disagreement in the sensitivity of GPP to SM contributes most strongly to intermodel differences across large parts of the globe, especially in regions with large contributions to global ΔGPP like northern South America, North America and Europe, where models largely agree on SM drying (Fig. 7a.3). While disagreement in the sensitivity to the direct SM effect dominates in the tropics (Fig. 7a.1), disagreement in the sensitivity to T and VPD dominates in mid and high latitudes (Fig. 7a.2). A similar but less pronounced spatial pattern can be seen for the contributions of changes in the direct and indirect SM effects themselves (Fig. 7b).
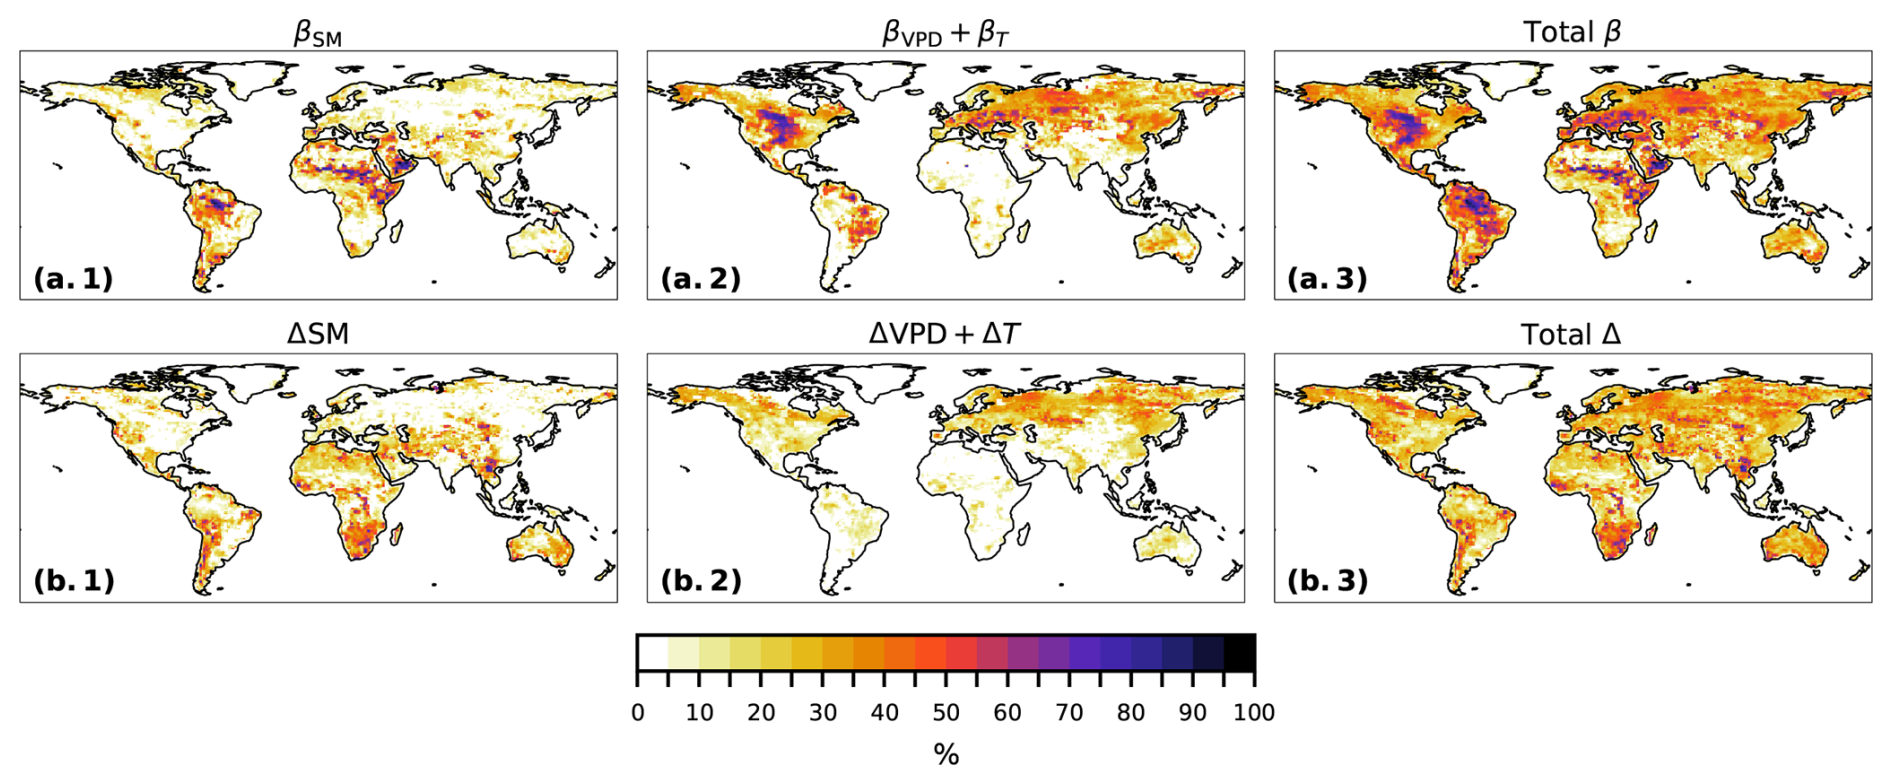
Figure 7Contribution to intermodel differences (in %) in LFMIP from disagreement in the sensitivity of GPP to (a.1) the direct SM effect (βSM), (a.2) indirect SM effects via T and VPD (βVPD+βT) and (a.3) direct and indirect SM effects (Total β), as well as contribution from (b.1) the change in SM (ΔSM), (b.2) the change in T and VPD due to SM (ΔVPD+ΔT), and (b.3) the total contribution of change in SM (Total Δ).
In this study we investigate (i) the comparison of the SM-induced impact on NBP simulated by LFMIP to the previous experiment generation, GLACE-CMIP5, with regard to the effect of SM trend and variability (Sect. 4.1) and (ii) origins of SM-induced changes in GPP (Sect. 4.2.1) and related intermodel differences focusing on LFMIP (Sect. 4.2.2). In view of our results, we discuss potential causes of the observed intermodel differences and limitations of our analysis (Sect. 4.3).
4.1 Negative SM-induced impacts on the land carbon sink in LFMIP and GLACE-CMIP5
Our results show that projected SM changes negatively impact global NBP according to the LFMIP mean, which is consistent with previous findings based on GLACE-CMIP5 (Green et al., 2019). The negative effect is dominated by SM variability, highlighting the strong negative impact of dry SM extremes on NBP. This finding aligns with observational evidence of the severe negative impact of extreme drought and heat events that lead to large carbon losses of terrestrial ecosystems (Ciais et al., 2005; Li et al., 2025; van der Woude et al., 2023). However, the negative SM effect on NBP is much stronger in the GLACE-CMIP5 mean, which is substantially influenced by two models, IPSL and GFDL, which also project particularly severe SM drying. Comparing SM projections of GLACE-CMIP5 to the full CMIP5 ensemble shows that this drying signal is not representative of the model generation, as both models exhibit a strong drying in the mid-latitudes of the Northern Hemisphere not reflected in the CMIP5 MMM. The NBP in the northern mid-latitudes makes up for about 85 % of the total global NBP for the CMIP5 MMM. Consequently, the stronger SM-induced reduction of NBP in GLACE-CMIP5 may be partly due to the model subset's bias toward stronger drying in these latitudes, suggesting that differences in the projected SM impact on NBP between GLACE-CMIP5 and LFMIP might thus be partly attributable to model selection rather than a systematic differences between model generations.
Nevertheless, this does not imply that the overall conclusions of prior studies are overstated, because structural model limitations may lead to an overall underestimation of the severity of SM-induced reductions of NBP in ESMs of both generations. Previous studies highlighted that SM drought can strongly reduce carbon uptake, often followed by declining tree growth rates and increased tree mortality and potentially leading to lasting reductions in carbon uptake capacities of affected ecosystems (Guo et al., 2025; Kannenberg et al., 2024; Kolus et al., 2019). This is often not well captured in ESMs because limitations in the representation of fundamental plant hydraulics can lead to shorter and weaker simulated drought impacts on GPP than observations indicate (Anderegg et al., 2015; Kannenberg et al., 2024; Kolus et al., 2019). For example, some CMIP5 models (including CESM and GFDL, which participated in the GLACE-CMIP5 experiment) do not sufficiently capture the lagged effects of SM on NBP compared to observational data, although GFDL was shown to capture these effects best of all the CMIP5 models assessed (Anderegg et al., 2015). In addition to the projected strong SM drying, this may further explain the strong negative impact of SM on NBP our study reveals for GFDL, but further research would be needed to confirm this. In addition, declining moisture availability has also been linked to increased risk of fire (Byrne et al., 2024; Jones et al., 2024), but ESMs have been found to misrepresent the observed magnitude of carbon losses during fire events (Sanderson and Fisher, 2020). With compound fire weather and drought events increasing under climate change (Richardson et al., 2022), this may lead to carbon losses not captured by ESMs.
As the occurrence of negative SM extremes is projected to increase under climate change (Seneviratne et al., 2023), the inability of models to accurately capture these processes could lead to a growing underestimation of the severity of the negative SM-induced impacts on the future land carbon sink. Furthermore, Liu et al. (2023) demonstrate that the increased water-carbon coupling observed in the tropics (which implies increased carbon loss with declining water availability) is not well captured in state-of-the-art ESMs. Since ecosystems are projected to experience widespread shifts from energy to water limitation throughout the 21st century (Denissen et al., 2022), this may further contribute to an underestimation of the simulated carbon loss under water stress.
4.2 Evaluation of LFMIP
4.2.1 SM-induced effects are dominated by atmospheric feedbacks
Isolating the contribution of direct and indirect SM effects demonstrates the importance of SM–atmosphere coupling in regulating ecosystem carbon fluxes, with the combined effect of T and VPD dominating the negative impact on global land carbon uptake in LFMIP. However, models diverge substantially in the contribution of direct and indirect effects, with only MPI-ESM1-2-LR and IPSL-CM6A-LR showing higher contribution from direct SM effects, especially in tropical regions.
The debate on the main factor constraining land carbon uptake is ongoing, with conflicting results on whether the direct SM effect or effects of T and VPD via SM–atmosphere coupling dominate: On the one hand, direct SM limitation plays a key role in limiting carbon uptake (Kannenberg et al., 2024; Liu et al., 2020). This could imply that LFMIP models underestimate the direct impact of soil water stress on photosynthesis, especially CESM2 and CMCC-ESM2. On the other hand, VPD has been identified as the dominant driver of drought-induced reductions in GPP, because increased VPD consistently limits photosynthesis, whereas SM only limits GPP below a certain threshold (Fu et al., 2022; Novick et al., 2016). Consequently, VPD exerts a more pervasive influence on GPP than the direct SM effect, which supports our assessment showing SM–atmosphere coupling as the key control on GPP globally.
Nevertheless, previous findings demonstrate that in moisture-limited regions the direct SM effect (i.e., SM availability limiting photosynthesis) becomes more important for constraining carbon uptake (Fu et al., 2022; Kannenberg et al., 2024; Liu et al., 2025). Our analysis demonstrates that LFMIP models fail to capture this consequence for regions that are known to be moisture-limited, which may partially be explained by how water stress is implemented in their land surface models. Stomatal conductance plays a central role in translating water limitation into reduced carbon uptake. In state-of-the-art land surface models, the stomatal conductance formulation is often directly linked to VPD (Franks et al., 2018). Because of this formulation, the effect of increased T and VPD on stomatal behaviour may be projected to be more prominent in regulating GPP under SM drying, even if SM decline initiates the water stress response.
Among LFMIP models, CESM2 projects the strongest negative SM-induced impact on GPP. Its land surface model, CLM5, explicitly represents plant hydraulics, including leaf water potential, xylem water flow, and vulnerability to hydraulic failure, which are important for regulating the GPP response to dryness stress (Kennedy et al., 2019; Lawrence et al., 2019). In contrast, the land surface models of the other LFMIP models (i.e., CLM4.5, ORCHIDEE v2.0, and JSBACH3.2, see Table S1), rely on empirical water stress functions for stomatal conductance and photosynthesis (Lawrence et al., 2019; MacBean et al., 2020; Reick et al., 2021). According to the International Land Model Benchmarking (ILAMB) broad scores, CESM2 performs well in benchmarks for Global Net Ecosystem Carbon Balance (benchmark related to NBP) compared to other CMIP6 models (Hassler et al., 2026), which might partially reflect the advanced process formulation of CLM5. This suggests that the lack of explicit hydraulic constraints in the land surface models of most LFMIP models may limit their ability to accurately capture the impact of SM on GPP, and that further development of plant hydraulics might improve predictions of GPP responses, especially under conditions of increased moisture limitation. However, despite ongoing efforts, the complex mechanisms regulating ecosystems' response to drought are still not fully understood (Kannenberg et al., 2020), and the observed non-linear and species-specific responses of GPP to dryness stress make it challenging to develop accurate implementations (Green, 2024; Grossiord et al., 2020).
We note that our approach to isolate the contributions of the direct and indirect SM effects only captures the linear relationship of the local monthly response to SM changes and does not account for other factors potentially influencing the SM-induced effect on GPP (e.g., non-linear, non-local, or lagged effects). Nevertheless, the contribution analysis explains about 83 % (94 %) of global reduction in GPP due to SM changes for the LFMIP (GLACE-CMIP5) mean and is thus useful as an estimate of first-order processes influencing land carbon uptake (i.e., direct and indirect effects of SM).
4.2.2 Intermodel differences are dominated by the sensitivity of land carbon uptake to SM
The ANOVA-based variance decomposition suggests that the sensitivity of GPP to direct and indirect SM effects is the main source of intermodel differences for LFMIP, especially in regions with agreement on SM drying (i.e., large parts of the Amazon, Central North America, and Central Europe). Differences in sensitivity to the direct SM effect contribute more to intermodel differences in the tropics, whereas that to indirect SM effects contributes strongly at mid to high latitudes.
The dominant role of sensitivity may partly result from differences in the implementation of water-stress related processes across LFMIP models (as mentioned in Sect. 4.2.1). However, the reasons underlying the intermodel differences are likely complex. In regions showing high agreement on SM drying across LFMIP for the future period, apparent divergence in the projected SM regimes (i.e., moisture-limited versus energy-limited regimes) may be a prominent cause of intermodel difference in the sensitivity of GPP to SM. It has been shown that water-carbon coupling is particularly strong in moisture-limited ecosystems, leading to an increased sensitivity of GPP to changes in SM (Gentine et al., 2019; Seneviratne et al., 2010). Hsu and Dirmeyer (2023) found substantial uncertainty in the simulated SM regimes of CMIP6 models. These uncertainties likely propagate to uncertainties in the sensitivity response of GPP.
In addition, differences in the representation of vegetation cover has important implications for carbon uptake. CMIP6 models exhibit substantial disagreement in vegetation cover, the simulation of disturbances and ultimately the handling of water stress (Song et al., 2021). This is further amplified by inconsistencies in the translation of land-use forcing data and the lack of explicit representation of forest management in ESMs (Egerer et al., 2025). Although the ability to represent vegetation structure has improved since CMIP5, limitations remain in the representation of disturbances, nutrient constraints, and forest demographics (Egerer et al., 2025; Gier et al., 2024). Therefore, vegetation cover and the degree to which ecosystems are or will become moisture-limited could be a critical source of uncertainty in projections of SM-induced changes in land carbon uptake.
4.3 Limitations and outlook
Experiments with prescribed SM, liked those performed under GLACE-CMIP5 and LFMIP, offer a unique opportunity to isolate and assess the impact of SM changes on the evolution of the land carbon sink. Such information cannot be derived from observations because SM changes co-vary with other factors influencing the land carbon sink, thus isolating SM effects would require large-scale controls to fully capture SM–atmosphere interactions. However, we note that the validity of our results is limited by the small number of ESMs participating in LFMIP (and GLACE-CMIP5).
Conducting GLACE-like experiments with a larger set of models would enhance the robustness and validity of the results and provide further insights into the effects of SM on the land carbon sink and associated uncertainties under future climate change. We therefore recommend continuing GLACE-like experiments in future CMIP generations with more models to generate a larger ensemble. Furthermore, it has been shown that SM evolutions differ substantially across ESMs, due to differences in model process implementation (Berg et al., 2017; Liu et al., 2024b), which complicates intermodel comparison. We therefore propose to extend the experimental setup by an experiment with identically prescribed SM evolution (e.g., prescribed trend and variability based on the CMIP MMM). This would enable isolating the effects of identical SM trend and variability on NBP (while the existing GLACE-like experimental setups allow isolating only the model-specific effect of SM trend and variability), by explicitly disentangling the contributions of differences in model sensitivity of GPP to SM from intermodel deviations in the simulated SM itself. Since our results from the ANOVA-based variance decomposition indicate that differences in the sensitivity of GPP to SM are the main origin of intermodel uncertainty, this approach would allow for a more direct comparison of the representation of water-carbon coupling across ESMs.
Using benchmarking frameworks such as ILAMB (Collier et al., 2018) helps to assess model performance by systematically comparing model output to observational datasets. Overall, CMIP6 models show improved skill relative to CMIP5 in representing key components of the carbon and hydrological cycles, indicating that model accuracy has been improved (Hassler et al., 2026). However, water-carbon coupling emerges from tightly interacting processes across soil, vegetation, and atmosphere. As land surface models have grown in structural complexity (Fisher and Koven, 2020), evaluating individual variables in isolation may not reflect how well models capture underlying process interactions. Indeed, even when models perform well for SM and GPP individually according to the ILAMB broad scores, the coupling between SM and GPP may still be misrepresented (Massoud et al., 2025). Expanding benchmarking approaches to explicitly target soil moisture-carbon interactions, dryness stress responses, and regime shifts between energy- and moisture-limited conditions would provide valuable constraints to assess model performance regarding SM-induced effects on NBP.
However, benchmarking simulated SM and its impact on the land carbon sink against past observations can only provide limited insights about satisfactory model performance under climate change in the future, particularly since the effects strongly depend on the forcing scenario and human perturbations of the water and carbon cycles (Gier et al., 2024; Zaitchik et al., 2023). Assessing and improving the representation of water-carbon interactions under emerging climate states therefore remains a key challenge for the next generation of ESMs.
This study assesses the SM-induced impact on the land carbon sink using dedicated experiments that enable the isolation of SM effects from other drivers. We find that projected SM changes negatively impact global NBP in both CMIP5 and CMIP6 models, leading to a substantial reduction of the land carbon sink capacity by the end of the century. For both model generations, SM variability dominates the negative impact, underscoring the key role of SM extremes in mediating the land carbon sink. The stronger impact in GLACE-CMIP5 is largely driven by a subset of models projecting severe SM drying.
Our analysis shows that indirect SM effects via T and VPD dominate global GPP losses, suggesting that SM–atmosphere coupling dominates the SM-induced reduction in global land carbon uptake. However, the contribution of direct and indirect effects varies strongly across models and regions. LFMIP models generally fail to capture the importance of the direct SM effect in moisture-limited regions, which might be explained by their representation of water-stress related processes in ESMs. Differences in stomatal conductance schemes and the lack of hydraulic constraints could contribute to differences in the models' response of GPP to SM. This strong divergence in sensitivity across LFMIP models might be further amplified by uncertainties in projected SM regimes and vegetation characteristics, as well as misrepresentation of disturbance processes. Given that state-of-the-art ESMs lack accurate representation of processes from plant to ecosystem level, the true severity of SM extremes on the land carbon sink is likely underestimated in LFMIP.
Our results highlight that SM–atmosphere coupling is a key constraint for the future land carbon sink. Multi-model intercomparison projects such as GLACE-CMIP5 and LFMIP (LS3MIP) constitute valuable tools to assess SM-induced changes in carbon uptake and related intermodel differences, by isolating the impact of SM from other drivers. We therefore urge to introduce again an experiment based on the GLACE-CMIP5/LFMIP set-up in the coming CMIP generations. Expanding the number of participating models would further improve confidence in projections of SM-induced changes in the land carbon sink. Combined with systematic benchmarking efforts, this would help to evaluate how well models represent the underlying processes regulating water-carbon coupling.
CMIP6 (including LFMIP) and CMIP5 data used in this study are publicly available from the Earth System Grid Federation (ESGF) at https://esgf-node.llnl.gov/search/ (last access: 20 August 2024). GLACE-CMIP5 data are hosted by ETH Zürich and can be obtained from Sonia I. Seneviratne (sonia.seneviratne@ethz.ch) for all participating models (see https://iac.ethz.ch/group/land-climate-dynamics/research/glace-cmip.html, last access: 28 August 2025) or from the individual climate modelling groups for individual models.
The supplement related to this article is available online at https://doi.org/10.5194/bg-23-2729-2026-supplement.
L.L. conceived the original idea. L.M.G., L.L., P.S., and S.I.S designed the study. L.M.G. carried out analyses under supervision of P.S., L.L., and S.I.S. L.M.G. wrote the first draft with contributions from P.S., and discussions with L.L. and S.I.S. All authors reviewed the manuscript and contributed to its final form.
The contact author has declared that none of the authors has any competing interests.
Publisher's note: Copernicus Publications remains neutral with regard to jurisdictional claims made in the text, published maps, institutional affiliations, or any other geographical representation in this paper. The authors bear the ultimate responsibility for providing appropriate place names. Views expressed in the text are those of the authors and do not necessarily reflect the views of the publisher.
We acknowledge the World Climate Research Programme and its Working Group on Coupled Modelling for coordinating and promoting the Coupled Model Intercomparison Project (CMIP), and the climate modelling groups for their contributions. We specifically thank all contributors to the LFMIP and GLACE-CMIP5 experiments.
This work received funding from the EU Project RESCUE (Response of the Earth System to overshoot, Climate neUtrality and negative Emissions) under the European Union's Horizon Europe research and innovation programme, grant agreement no. 101056939.
We also thank Mathias Hauser for downloading and preprocessing the data used for this analysis and for his technical support, and Martin Hirschi for discussions about the analysis.
This research has been supported by the HORIZON EUROPE Climate, Energy and Mobility (grant no. 101056939).
This paper was edited by Sara Vicca and reviewed by two anonymous referees.
Allen, C. D., Breshears, D. D., and McDowell, N. G.: On underestimation of global vulnerability to tree mortality and forest die-off from hotter drought in the Anthropocene, Ecosphere, 6, https://doi.org/10.1890/ES15-00203.1, 2015. a
Anderegg, W. R. L., Schwalm, C., Biondi, F., Camarero, J. J., Koch, G., Litvak, M., Ogle, K., Shaw, J. D., Shevliakova, E., Williams, A. P., Wolf, A., Ziaco, E., and Pacala, S.: Pervasive drought legacies in forest ecosystems and their implications for carbon cycle models, Science, 349, 528–532, https://doi.org/10.1126/science.aab1833, 2015. a, b, c
Arora, V. K., Katavouta, A., Williams, R. G., Jones, C. D., Brovkin, V., Friedlingstein, P., Schwinger, J., Bopp, L., Boucher, O., Cadule, P., Chamberlain, M. A., Christian, J. R., Delire, C., Fisher, R. A., Hajima, T., Ilyina, T., Joetzjer, E., Kawamiya, M., Koven, C. D., Krasting, J. P., Law, R. M., Lawrence, D. M., Lenton, A., Lindsay, K., Pongratz, J., Raddatz, T., Séférian, R., Tachiiri, K., Tjiputra, J. F., Wiltshire, A., Wu, T., and Ziehn, T.: Carbon–concentration and carbon–climate feedbacks in CMIP6 models and their comparison to CMIP5 models, Biogeosciences, 17, 4173–4222, https://doi.org/10.5194/bg-17-4173-2020, 2020. a, b
Berg, A., Findell, K., Lintner, B., Giannini, A., Seneviratne, S. I., Van Den Hurk, B., Lorenz, R., Pitman, A., Hagemann, S., Meier, A., Cheruy, F., Ducharne, A., Malyshev, S., and Milly, P. C.: Land-atmosphere feedbacks amplify aridity increase over land under global warming, Nat. Clim. Change, 6, 869–874, https://doi.org/10.1038/nclimate3029, 2016. a
Berg, A., Sheffield, J., and Milly, P. C. D.: Divergent surface and total soil moisture projections under global warming, Geophys. Res. Lett., 44, 236–244, https://doi.org/10.1002/2016GL071921, 2017. a
Byrne, B., Liu, J., Bowman, K. W., Pascolini-Campbell, M., Chatterjee, A., Pandey, S., Miyazaki, K., van der Werf, G. R., Wunch, D., Wennberg, P. O., Roehl, C. M., and Sinha, S.: Carbon emissions from the 2023 Canadian wildfires, Nature, 633, 835–839, https://doi.org/10.1038/s41586-024-07878-z, 2024. a
Ciais, P., Reichstein, M., Viovy, N., Granier, A., Ogée, J., Allard, V., Aubinet, M., Buchmann, N., Bernhofer, C., Carrara, A., Chevallier, F., De Noblet, N., Friend, A. D., Friedlingstein, P., Grünwald, T., Heinesch, B., Keronen, P., Knohl, A., Krinner, G., Loustau, D., Manca, G., Matteucci, G., Miglietta, F., Ourcival, J. M., Papale, D., Pilegaard, K., Rambal, S., Seufert, G., Soussana, J. F., Sanz, M. J., Schulze, E. D., Vesala, T., and Valentini, R.: Europe-wide reduction in primary productivity caused by the heat and drought in 2003, Nature, 437, 529–533, https://doi.org/10.1038/nature03972, 2005. a
Collier, N., Hoffman, F. M., Lawrence, D. M., Keppel-Aleks, G., Koven, C. D., Riley, W. J., Mu, M., and Randerson, J. T.: The International Land Model Benchmarking (ILAMB) System: Design, Theory, and Implementation, J. Adv. Model. Earth Sy., 10, 2731–2754, https://doi.org/10.1029/2018MS001354, 2018. a
Denissen, J. M. C., Teuling, A. J., Pitman, A. J., Koirala, S., Migliavacca, M., Li, W., Reichstein, M., Winkler, A. J., Zhan, C., and Orth, R.: Widespread shift from ecosystem energy to water limitation with climate change, Nat. Clim. Change, 12, 677–684, https://doi.org/10.1038/s41558-022-01403-8, 2022. a
Egerer, S., Lawrence, D. M., Lawrence, P. J., Argles, A., Arora, V., Barbu, A. L., Harman, I. N., Miller, P. A., Raddatz, T., Vuichard, N., Wårlind, D., Ziehn, T., and Pongratz, J.: Forestation in CMIP6: wide model spread in tree cover and land carbon uptake, Environ. Res. Lett., 20, 054033, https://doi.org/10.1088/1748-9326/adc93e, 2025. a, b
Eyring, V., Bony, S., Meehl, G. A., Senior, C. A., Stevens, B., Stouffer, R. J., and Taylor, K. E.: Overview of the Coupled Model Intercomparison Project Phase 6 (CMIP6) experimental design and organization, Geosci. Model Dev., 9, 1937–1958, https://doi.org/10.5194/gmd-9-1937-2016, 2016. a
Fisher, R. A. and Koven, C. D.: Perspectives on the Future of Land Surface Models and the Challenges of Representing Complex Terrestrial Systems, J. Adv. Model. Earth Sy., 12, e2018MS001453, https://doi.org/10.1029/2018MS001453, 2020. a
Franks, P. J., Bonan, G. B., Berry, J. A., Lombardozzi, D. L., Holbrook, N. M., Herold, N., and Oleson, K. W.: Comparing optimal and empirical stomatal conductance models for application in Earth system models, Glob. Change Biol., 24, 5708–5723, https://doi.org/10.1111/gcb.14445, 2018. a
Friedlingstein, P., Cox, P., Betts, R., Bopp, L., von Bloh, W., Brovkin, V., Cadule, P., Doney, S., Eby, M., Fung, I., Bala, G., John, J., Jones, C., Joos, F., Kato, T., Kawamiya, M., Knorr, W., Lindsay, K., Matthews, H. D., Raddatz, T., Rayner, P., Reick, C., Roeckner, E., Schnitzler, K. G., Schnur, R., Strassmann, K., Weaver, A. J., Yoshikawa, C., and Zeng, N.: Climate–Carbon Cycle Feedback Analysis: Results from the C4MIP Model Intercomparison, J. Climate, 19, 3337–3353, https://doi.org/10.1175/JCLI3800.1, 2006. a
Friedlingstein, P., O'Sullivan, M., Jones, M. W., Andrew, R. M., Hauck, J., Landschützer, P., Le Quéré, C., Li, H., Luijkx, I. T., Olsen, A., Peters, G. P., Peters, W., Pongratz, J., Schwingshackl, C., Sitch, S., Canadell, J. G., Ciais, P., Jackson, R. B., Alin, S. R., Arneth, A., Arora, V., Bates, N. R., Becker, M., Bellouin, N., Berghoff, C. F., Bittig, H. C., Bopp, L., Cadule, P., Campbell, K., Chamberlain, M. A., Chandra, N., Chevallier, F., Chini, L. P., Colligan, T., Decayeux, J., Djeutchouang, L. M., Dou, X., Duran Rojas, C., Enyo, K., Evans, W., Fay, A. R., Feely, R. A., Ford, D. J., Foster, A., Gasser, T., Gehlen, M., Gkritzalis, T., Grassi, G., Gregor, L., Gruber, N., Gürses, Ö., Harris, I., Hefner, M., Heinke, J., Hurtt, G. C., Iida, Y., Ilyina, T., Jacobson, A. R., Jain, A. K., Jarníková, T., Jersild, A., Jiang, F., Jin, Z., Kato, E., Keeling, R. F., Klein Goldewijk, K., Knauer, J., Korsbakken, J. I., Lan, X., Lauvset, S. K., Lefèvre, N., Liu, Z., Liu, J., Ma, L., Maksyutov, S., Marland, G., Mayot, N., McGuire, P. C., Metzl, N., Monacci, N. M., Morgan, E. J., Nakaoka, S.-I., Neill, C., Niwa, Y., Nützel, T., Olivier, L., Ono, T., Palmer, P. I., Pierrot, D., Qin, Z., Resplandy, L., Roobaert, A., Rosan, T. M., Rödenbeck, C., Schwinger, J., Smallman, T. L., Smith, S. M., Sospedra-Alfonso, R., Steinhoff, T., Sun, Q., Sutton, A. J., Séférian, R., Takao, S., Tatebe, H., Tian, H., Tilbrook, B., Torres, O., Tourigny, E., Tsujino, H., Tubiello, F., van der Werf, G., Wanninkhof, R., Wang, X., Yang, D., Yang, X., Yu, Z., Yuan, W., Yue, X., Zaehle, S., Zeng, N., and Zeng, J.: Global Carbon Budget 2024, Earth Syst. Sci. Data, 17, 965–1039, https://doi.org/10.5194/essd-17-965-2025, 2025. a, b
Fu, Z., Ciais, P., Prentice, I. C., Gentine, P., Makowski, D., Bastos, A., Luo, X., Green, J. K., Stoy, P. C., Yang, H., and Hajima, T.: Atmospheric dryness reduces photosynthesis along a large range of soil water deficits, Nat. Commun., 13, 989, https://doi.org/10.1038/s41467-022-28652-7, 2022. a, b
Gentine, P., Green, J. K., Guérin, M., Humphrey, V., Seneviratne, S. I., Zhang, Y., and Zhou, S.: Coupling between the terrestrial carbon and water cycles – a review, Environ. Res. Lett., 14, 083003, https://doi.org/10.1088/1748-9326/ab22d6, 2019. a, b, c
Gier, B. K., Schlund, M., Friedlingstein, P., Jones, C. D., Jones, C., Zaehle, S., and Eyring, V.: Representation of the terrestrial carbon cycle in CMIP6, Biogeosciences, 21, 5321–5360, https://doi.org/10.5194/bg-21-5321-2024, 2024. a, b
Green, J. K.: The intricacies of vegetation responses to changing moisture conditions, New Phytol., 244, 2156–2162, https://doi.org/10.1111/nph.20182, 2024. a
Green, J. K., Seneviratne, S. I., Berg, A. M., Findell, K. L., Hagemann, S., Lawrence, D. M., and Gentine, P.: Large influence of soil moisture on long-term terrestrial carbon uptake, Nature, 565, 476–479, https://doi.org/10.1038/s41586-018-0848-x, 2019. a, b, c, d, e, f, g, h, i, j, k, l
Grossiord, C., Buckley, T. N., Cernusak, L. A., Novick, K. A., Poulter, B., Siegwolf, R. T. W., Sperry, J. S., and McDowell, N. G.: Plant responses to rising vapor pressure deficit, New Phytol., 226, 1550–1566, https://doi.org/10.1111/nph.16485, 2020. a
Gu, D., Otieno, D., Huang, Y., and Wang, Q.: Higher assimilation than respiration sensitivity to drought for a desert ecosystem in Central Asia, Sci. Total Environ., 609, 1200–1207, https://doi.org/10.1016/j.scitotenv.2017.07.254, 2017. a
Guo, W., Huang, S., Liu, L., Leng, G., Huang, Q., Chen, D., Li, J., Li, P., Wang, Y., Zhu, X., and Peng, J.: Global Critical Drought Thresholds of Terrestrial Carbon Sink–Source Transition, Glob. Change Biol., 31, e70129, https://doi.org/10.1111/gcb.70129, 2025. a
Hassler, B., Hoffman, F. M., Beadling, R., Blockley, E., Huang, B., Lee, J., Lembo, V., Lewis, J., Lu, J., Madaus, L., Malinina, E., Medeiros, B., Pokam, W., Scoccimarro, E., and Swaminathan, R.: Systematic Benchmarking of Climate Models: Methodologies, Applications, and New Directions, Rev. Geophys., 64, e2025RG000891, https://doi.org/10.1029/2025RG000891, 2026. a, b
Hsu, H. and Dirmeyer, P. A.: Uncertainty in Projected Critical Soil Moisture Values in CMIP6 Affects the Interpretation of a More Moisture-Limited World, Earth's Future, 11, e2023EF003511, https://doi.org/10.1029/2023EF003511, 2023. a
Huang, Y., Gerber, S., Huang, T., and Lichstein, J. W.: Evaluating the drought response of CMIP5 models using global gross primary productivity, leaf area, precipitation, and soil moisture data, Global Biogeochem. Cy., 30, 1827–1846, https://doi.org/10.1002/2016GB005480, 2016. a
Humphrey, V., Zscheischler, J., Ciais, P., Gudmundsson, L., Sitch, S., and Seneviratne, S. I.: Sensitivity of atmospheric CO2 growth rate to observed changes in terrestrial water storage, Nature, 560, 628–631, https://doi.org/10.1038/s41586-018-0424-4, 2018. a
Humphrey, V., Berg, A., Ciais, P., Gentine, P., Jung, M., Reichstein, M., Seneviratne, S. I., and Frankenberg, C.: Soil moisture – atmosphere feedback dominates land carbon uptake variability, Nature, 592, 65–69, https://doi.org/10.1038/s41586-021-03325-5, 2021. a, b, c, d, e
Jones, M. W., Veraverbeke, S., Andela, N., Doerr, S. H., Kolden, C., Mataveli, G., Pettinari, M. L., Le Quéré, C., Rosan, T. M., van der Werf, G. R., van Wees, D., and Abatzoglou, J. T.: Global rise in forest fire emissions linked to climate change in the extratropics, Science, 386, eadl5889, https://doi.org/10.1126/science.adl5889, 2024. a
Kannenberg, S. A., Schwalm, C. R., and Anderegg, W. R. L.: Ghosts of the past: how drought legacy effects shape forest functioning and carbon cycling, Ecol. Lett., 23, 891–901, https://doi.org/10.1111/ele.13485, 2020. a, b
Kannenberg, S. A., Anderegg, W. R. L., Barnes, M. L., Dannenberg, M. P., and Knapp, A. K.: Dominant role of soil moisture in mediating carbon and water fluxes in dryland ecosystems, Nat. Geosci., 17, 38–43, https://doi.org/10.1038/s41561-023-01351-8, 2024. a, b, c, d
Keenan, T. F. and Williams, C. A.: The terrestrial carbon sink, Annu. Rev. Env. Resour., 43, 219–243, https://doi.org/10.1146/annurev-environ-102017-030204, 2018. a
Kennedy, D., Swenson, S., Oleson, K. W., Lawrence, D. M., Fisher, R., Costa, A. C. L. d., and Gentine, P.: Implementing Plant Hydraulics in the Community Land Model, Version 5, J. Adv. Model. Earth Sy., 11, 485–513, https://doi.org/10.1029/2018MS001500, 2019. a
Kolus, H. R., Huntzinger, D. N., Schwalm, C. R., Fisher, J. B., McKay, N., Fang, Y., Michalak, A. M., Schaefer, K., Wei, Y., Poulter, B., Mao, J., Parazoo, N. C., and Shi, X.: Land carbon models underestimate the severity and duration of drought’s impact on plant productivity, Scientific Reports, 9, https://doi.org/10.1038/s41598-019-39373-1, 2019. a, b
Lawrence, D. M., Fisher, R. A., Koven, C. D., Oleson, K. W., Swenson, S. C., Bonan, G., Collier, N., Ghimire, B., van Kampenhout, L., Kennedy, D., Kluzek, E., Lawrence, P. J., Li, F., Li, H., Lombardozzi, D., Riley, W. J., Sacks, W. J., Shi, M., Vertenstein, M., Wieder, W. R., Xu, C., Ali, A. A., Badger, A. M., Bisht, G., van den Broeke, M., Brunke, M. A., Burns, S. P., Buzan, J., Clark, M., Craig, A., Dahlin, K., Drewniak, B., Fisher, J. B., Flanner, M., Fox, A. M., Gentine, P., Hoffman, F., Keppel-Aleks, G., Knox, R., Kumar, S., Lenaerts, J., Leung, L. R., Lipscomb, W. H., Lu, Y., Pandey, A., Pelletier, J. D., Perket, J., Randerson, J. T., Ricciuto, D. M., Sanderson, B. M., Slater, A., Subin, Z. M., Tang, J., Thomas, R. Q., Val Martin, M., and Zeng, X.: The Community Land Model Version 5: Description of New Features, Benchmarking, and Impact of Forcing Uncertainty, J. Adv. Model. Earth Sy., 11, 4245–4287, https://doi.org/10.1029/2018MS001583, 2019. a, b
Li, Q., Tietema, A., Reinsch, S., Schmidt, I. K., de Dato, G., Guidolotti, G., Lellei-Kovács, E., Kopittke, G., and Larsen, K. S.: Higher sensitivity of gross primary productivity than ecosystem respiration to experimental drought and warming across six European shrubland ecosystems, Sci. Total Environ., 900, 165627, https://doi.org/10.1016/j.scitotenv.2023.165627, 2023. a
Li, X., Ciais, P., Fensholt, R., Chave, J., Sitch, S., Canadell, J. G., Brandt, M., Fan, L., Xiao, X., Tao, S., Wang, H., Albergel, C., Yang, H., Frappart, F., Wang, M., Bastos, A., Maisongrande, P., Qin, Y., Xing, Z., Cui, T., Yu, L., He, L., Zheng, Y., Liu, X., Liu, Y., De Truchis, A., and Wigneron, J.-P.: Large live biomass carbon losses from droughts in the northern temperate ecosystems during 2016–2022, Nat. Commun., 16, 4980, https://doi.org/10.1038/s41467-025-59999-2, 2025. a
Liu, J., Wang, Q., Zhan, W., Lian, X., and Gentine, P.: When and where soil dryness matters to ecosystem photosynthesis, Nature Plants, 11, https://doi.org/10.1038/s41477-025-02024-7, 2025. a, b
Liu, L., Gudmundsson, L., Hauser, M., Qin, D., Li, S., and Seneviratne, S. I.: Soil moisture dominates dryness stress on ecosystem production globally, Nat. Commun., 11, https://doi.org/10.1038/s41467-020-18631-1, 2020. a, b
Liu, L., Ciais, P., Wu, M., Padrón, R. S., Friedlingstein, P., Schwaab, J., Gudmundsson, L., and Seneviratne, S. I.: Increasingly negative tropical water–interannual CO2 growth rate coupling, Nature, 618, 755–760, https://doi.org/10.1038/s41586-023-06056-x, 2023. a, b
Liu, L., Fisher, R. A., Douville, H., Padrón, R. S., Berg, A., Mao, J., Alessandri, A., Kim, H., and Seneviratne, S. I.: No constraint on long-term tropical land carbon-climate feedback uncertainties from interannual variability, Communications Earth & Environment, 5, 1–8, https://doi.org/10.1038/s43247-024-01504-6, 2024a. a
Liu, Y., Chen, X., Bai, Y., and Zeng, J.: Evaluation of 22 CMIP6 model-derived global soil moisture products of different shared socioeconomic pathways, J. Hydrol., 636, 131241, https://doi.org/10.1016/j.jhydrol.2024.131241, 2024b. a
MacBean, N., Scott, R. L., Biederman, J. A., Ottlé, C., Vuichard, N., Ducharne, A., Kolb, T., Dore, S., Litvak, M., and Moore, D. J. P.: Testing water fluxes and storage from two hydrology configurations within the ORCHIDEE land surface model across US semi-arid sites, Hydrol. Earth Syst. Sci., 24, 5203–5230, https://doi.org/10.5194/hess-24-5203-2020, 2020. a
Marcolla, B., Migliavacca, M., Rödenbeck, C., and Cescatti, A.: Patterns and trends of the dominant environmental controls of net biome productivity, Biogeosciences, 17, 2365–2379, https://doi.org/10.5194/bg-17-2365-2020, 2020. a
Massoud, E. C., Collier, N., Wang, Y., Mao, J., Harpold, A., Kannenberg, S. A., Koren, G., Kumar, M., Raghav, P., Ray, P., Shi, M., Tao, J., Vasu, S. P., Wang, H., Zhu, Q., and Hoffman, F. M.: Benchmarking soil moisture and its relationship to ecohydrologic variables in Earth System Models, EGUsphere [preprint], https://doi.org/10.5194/egusphere-2025-3517, 2025. a
Natali, S., Holdren, J., Rogers, B., Treharne, R., Duffy, P., Pomerance, R., and MacDonald, E.: Permafrost carbon feedbacks threaten global climate goals, P. Natl. Acad. Sci. USA, 118, e2100163118, https://doi.org/10.1073/pnas.2100163118, 2021. a
Novick, K. A., Ficklin, D. L., Stoy, P. C., Williams, C. A., Bohrer, G., Oishi, A. C., Papuga, S. A., Blanken, P. D., Noormets, A., Sulman, B. N., Scott, R. L., Wang, L., and Phillips, R. P.: The increasing importance of atmospheric demand for ecosystem water and carbon fluxes, Nat. Clim. Change, 6, 1023–1027, https://doi.org/10.1038/nclimate3114, 2016. a
Reichstein, M., Bahn, M., Ciais, P., Frank, D., Mahecha, M. D., Seneviratne, S. I., Zscheischler, J., Beer, C., Buchmann, N., Frank, D. C., Papale, D., Rammig, A., Smith, P., Thonicke, K., Van Der Velde, M., Vicca, S., Walz, A., and Wattenbach, M.: Climate extremes and the carbon cycle, Nature, 500, 287–295, https://doi.org/10.1038/nature12350, 2013. a, b
Reick, C. H., Gayler, V., Goll, D., Hagemann, S., Heidkamp, M., Nabel, J. E. M. S., Raddatz, T., Roeckner, E., Schnur, R., and Wilkenskjeld, S.: JSBACH 3 – The land component of the MPI Earth System Model: documentation of version 3.2, https://doi.org/10.17617/2.3279802, 2021. a
Richardson, D., Black, A. S., Irving, D., Matear, R. J., Monselesan, D. P., Risbey, J. S., Squire, D. T., and Tozer, C. R.: Global increase in wildfire potential from compound fire weather and drought, npj Climate and Atmospheric Science, 5, 23, https://doi.org/10.1038/s41612-022-00248-4, 2022. a
Sanderson, B. M. and Fisher, R. A.: A fiery wake-up call for climate science, Nat. Clim. Change, 10, 175–177, https://doi.org/10.1038/s41558-020-0707-2, 2020. a
Schwalm, C. R., Anderegg, W. R., Michalak, A. M., Fisher, J. B., Biondi, F., Koch, G., Litvak, M., Ogle, K., Shaw, J. D., Wolf, A., Huntzinger, D. N., Schaefer, K., Cook, R., Wei, Y., Fang, Y., Hayes, D., Huang, M., Jain, A., and Tian, H.: Global patterns of drought recovery, Nature, 548, 202–205, https://doi.org/10.1038/nature23021, 2017. a
Seidl, R., Thom, D., Kautz, M., Martin-Benito, D., Peltoniemi, M., Vacchiano, G., Wild, J., Ascoli, D., Petr, M., Honkaniemi, J., Lexer, M. J., Trotsiuk, V., Mairota, P., Svoboda, M., Fabrika, M., Nagel, T. A., and Reyer, C. P. O.: Forest disturbances under climate change, Nat. Clim. Change, 7, 395–402, https://doi.org/10.1038/nclimate3303, 2017. a
Seneviratne, S. I., Corti, T., Davin, E. L., Hirschi, M., Jaeger, E. B., Lehner, I., Orlowsky, B., and Teuling, A. J.: Investigating soil moisture-climate interactions in a changing climate: A review, Earth-Sci. Rev., 99, 125–161, https://doi.org/10.1016/j.earscirev.2010.02.004, 2010. a, b, c, d
Seneviratne, S. I., Wilhelm, M., Stanelle, T., Van Den Hurk, B., Hagemann, S., Berg, A., Cheruy, F., Higgins, M. E., Meier, A., Brovkin, V., Claussen, M., Ducharne, A., Dufresne, J. L., Findell, K. L., Ghattas, J., Lawrence, D. M., Malyshev, S., Rummukainen, M., and Smith, B.: Impact of soil moisture-climate feedbacks on CMIP5 projections: First results from the GLACE-CMIP5 experiment, Geophys. Res. Lett., 40, 5212–5217, https://doi.org/10.1002/grl.50956, 2013. a, b, c, d
Seneviratne, S. I., Zhang, X., Adnan, M., Badi, W., Dereczynski, C., Di Luca, A., Ghosh, S., Iskandar, I., Kossin, J., Lewis, S., Otto, F., Pinto, I., Satoh, M., Vicente-Serrano, S. M., Wehner, M., and Zhou, B.: Weather and Climate Extreme Events in a Changing Climate, in: Climate Change 2021 – The Physical Science Basis: Working Group I Contribution to the Sixth Assessment Report of the Intergovernmental Panel on Climate Change, edited by: Masson-Delmotte, V., Zhai, P., Pirani, A., Connors, S. L., Péan, C., Berger, S., Caud, N., Chen, Y., Goldfarb, L., Gomis, M. I., Huang, M., Leitzell, K., Lonnoy, E., Matthews, J. B. R., Maycock, T. K., Waterfield, T., Yelekçi, O., Yu, R., and Zhou, B., Cambridge University Press, Cambridge, 1513–1766, https://doi.org/10.1017/9781009157896.013, 2023. a, b
Sippel, S., Reichstein, M., Ma, X., Mahecha, M. D., Lange, H., Flach, M., and Frank, D.: Drought, Heat, and the Carbon Cycle: a Review, Current Climate Change Reports, 4, 266–286, https://doi.org/10.1007/s40641-018-0103-4, 2018. a, b
Song, X., Wang, D.-Y., Li, F., and Zeng, X.-D.: Evaluating the performance of CMIP6 Earth system models in simulating global vegetation structure and distribution, Advances in Climate Change Research, 12, 584–595, https://doi.org/10.1016/j.accre.2021.06.008, 2021. a
Stocker, B. D., Zscheischler, J., Keenan, T. F., Prentice, I. C., Peñuelas, J., and Seneviratne, S. I.: Quantifying soil moisture impacts on light use efficiency across biomes, New Phytol., 218, 1430–1449, https://doi.org/10.1111/nph.15123, 2018. a
Sun, W., Zhou, S., Yu, B., Zhang, Y., Keenan, T., and Fu, B.: Soil moisture-atmosphere interactions drive terrestrial carbon-water trade-offs, Communications Earth & Environment, 6, 1–10, https://doi.org/10.1038/s43247-025-02145-z, 2025. a
Taylor, K. E., Stouffer, R. J., and Meehl, G. A.: An Overview of CMIP5 and the Experiment Design, B. Am. Meteorol. Soc., 93, 485–498, https://doi.org/10.1175/BAMS-D-11-00094.1, 2012. a
van den Hurk, B., Kim, H., Krinner, G., Seneviratne, S. I., Derksen, C., Oki, T., Douville, H., Colin, J., Ducharne, A., Cheruy, F., Viovy, N., Puma, M. J., Wada, Y., Li, W., Jia, B., Alessandri, A., Lawrence, D. M., Weedon, G. P., Ellis, R., Hagemann, S., Mao, J., Flanner, M. G., Zampieri, M., Materia, S., Law, R. M., and Sheffield, J.: LS3MIP (v1.0) contribution to CMIP6: the Land Surface, Snow and Soil moisture Model Intercomparison Project – aims, setup and expected outcome, Geosci. Model Dev., 9, 2809–2832, https://doi.org/10.5194/gmd-9-2809-2016, 2016. a
van der Woude, A. M., Peters, W., Joetzjer, E., Lafont, S., Koren, G., Ciais, P., Ramonet, M., Xu, Y., Bastos, A., Botía, S., Sitch, S., de Kok, R., Kneuer, T., Kubistin, D., Jacotot, A., Loubet, B., Herig-Coimbra, P.-H., Loustau, D., and Luijkx, I. T.: Temperature extremes of 2022 reduced carbon uptake by forests in Europe, Nat. Commun., 14, 6218, https://doi.org/10.1038/s41467-023-41851-0, 2023. a
von Buttlar, J., Zscheischler, J., Rammig, A., Sippel, S., Reichstein, M., Knohl, A., Jung, M., Menzer, O., Arain, M. A., Buchmann, N., Cescatti, A., Gianelle, D., Kiely, G., Law, B. E., Magliulo, V., Margolis, H., McCaughey, H., Merbold, L., Migliavacca, M., Montagnani, L., Oechel, W., Pavelka, M., Peichl, M., Rambal, S., Raschi, A., Scott, R. L., Vaccari, F. P., van Gorsel, E., Varlagin, A., Wohlfahrt, G., and Mahecha, M. D.: Impacts of droughts and extreme-temperature events on gross primary production and ecosystem respiration: a systematic assessment across ecosystems and climate zones, Biogeosciences, 15, 1293–1318, https://doi.org/10.5194/bg-15-1293-2018, 2018. a
Williams, A. P. and Abatzoglou, J. T.: Recent Advances and Remaining Uncertainties in Resolving Past and Future Climate Effects on Global Fire Activity, Current Climate Change Reports, 2, 1–14, https://doi.org/10.1007/s40641-016-0031-0, 2016. a
Williams, R. G., Katavouta, A., and Goodwin, P.: Carbon-Cycle Feedbacks Operating in the Climate System, Current Climate Change Reports, 5, 282–295, https://doi.org/10.1007/s40641-019-00144-9, 2019. a
Zaitchik, B. F., Rodell, M., Biasutti, M., and Seneviratne, S. I.: Wetting and drying trends under climate change, Nature Water, 1, 502–513, https://doi.org/10.1038/s44221-023-00073-w, 2023. a
Zheng, B., Ciais, P., Chevallier, F., Chuvieco, E., Chen, Y., and Yang, H.: Increasing forest fire emissions despite the decline in global burned area, Science Advances, 7, eabh2646, https://doi.org/10.1126/sciadv.abh2646, 2021. a
Zhou, S., Zhang, Y., Park Williams, A., and Gentine, P.: Projected increases in intensity, frequency, and terrestrial carbon costs of compound drought and aridity events, Science Advances, 5, eaau5740, https://doi.org/10.1126/sciadv.aau5740, 2019. a
Zscheischler, J., Orth, R., and Seneviratne, S. I.: A submonthly database for detecting changes in vegetation-atmosphere coupling, Geophys. Res. Lett., 42, 9816–9824, https://doi.org/10.1002/2015GL066563, 2015. a