the Creative Commons Attribution 4.0 License.
the Creative Commons Attribution 4.0 License.
 | 05 May 2026
Drivers of drought-induced canopy mortality in conifer and broadleaf forests across Luxembourg
Selina Schwarz
Fabian Ewald Fassnacht
Lisa Hülsmann
Nadine K. Ruehr
Climate change-induced weather extremes are increasing the intensity and frequency of disturbance events, posing a major threat to forests globally. In Central Europe, hotter and drier summers, such as those during the 2018–2020 drought period, have led to widespread forest damage. To adapt forests to a hotter and drier future it is important to identify sites more vulnerable to canopy mortality during drought, but high-resolution tree mortality data across continuous landscapes are still sparse.
This study addresses this research gap by utilising a high-resolution (single-tree-level), spatially continuous dataset covering the entire Central European country of Luxembourg. We used generalized additive models (GAMs) to explore the contribution of biotic and abiotic drivers to the observed canopy mortality of conifer and broadleaf forests during the 2018–2020 summer droughts. Specifically, we assessed drivers related to forest structure, mortality clustering and spread, and topographic conditions to understand how they relate to spatial variability in canopy mortality.
In total, the model explained 44.7 % of spatial variation in canopy mortality in conifers and 25.3 % in broadleaf forests. Environmental drivers related to clustered mortality, showed the strongest influence on canopy mortality in conifer forests, indicating that bark beetle infestation shaped spatial mortality patterns under drought. Forest height also emerged as an important driver associated with increased canopy mortality in both forest types. In contrast, topography- and soil-related drivers showed only limited influence on canopy mortality. Our study highlights the potential of using high-resolution canopy mortality data across a national-scale landscape to unravel how abiotic and biotic processes shape spatial variation in forest mortality under severe drought conditions.
- Article
(4655 KB) - Full-text XML
-
Supplement
(1101 KB) - BibTeX
- EndNote


The increasing frequency and intensity of disturbances due to climate change-induced weather extremes are affecting forests globally (Altman et al., 2024; Anderegg et al., 2020; Petritan and Schwenke, 2023). Particularly prolonged drought periods alongside high temperatures have emerged as one of the primary disturbance agents of forests in recent decades, and drought-related tree mortality has been observed in all forested biomes (Allen et al., 2010; Gazol et al., 2025; Hammond et al., 2022; Hartmann et al., 2022). For instance, recent summer droughts alongside high temperatures have triggered widespread tree mortality during 2018–2020 in Central European forests (Schiefer et al., 2025; Schwarz et al., 2024). While some trees die directly during droughts, others only die months to years later often due to pest and pathogen outbreaks. This can lead to a highly heterogeneous patterns of tree mortality, making it challenging to quantify and attribute mortality causes (Hartmann et al., 2018). Beyond drought as the primary stressor, spatial variation in tree mortality is further shaped by interacting abiotic conditions (e.g., topography, soil properties) and biotic processes (e.g., forest structure, insect outbreaks), which act as environmental drivers of tree vulnerability and mortality. The complex interplay of these elements makes projections of future forest dynamics challenging.
Tree mortality due to drought has been studied across a wide range of ecosystems worldwide (Hammond et al., 2022). Many studies have focused on the ecophysiological processes underlying tree mortality and the question why some tree species are more resilient to drought than others (Choat et al., 2012; Hajek et al., 2022; Trugman et al., 2018). Meanwhile, other research has taken a broader perspective, examining drought related tree mortality at the scale of forest plots and even across entire landscapes (Senf and Seidl, 2021; Sturm et al., 2022). In these studies, the focus was less on tree species and individual tree related information and more on the effect of environmental characteristics, such as topography and stand structure, along with the interactions between various disturbance agents (Breshears et al., 2005). However, individual trees within a forest do not uniformly respond to water shortage, causing a heterogeneous response depending on a variety of abiotic and biotic drivers (Hartmann et al., 2018; Trugman et al., 2021; Zhai et al., 2022). Part of the variability in trees' responses to water shortage is assumed to relate to site level-differences in water supply, which are partially determined by soil type, topography and competition.
Topographical variables are important drivers of tree mortality during drought, yet their large-scale effects and interactions remain under-explored. Tree mortality typically increases at lower elevations, but how elevation patterns interact with other factors is not completely understood (Cailleret et al., 2014; Paz-Kagan et al., 2017; Rita et al., 2020; Sturm et al., 2022). Slope steepness, while often linked to higher drought vulnerability due to increased runoff (Bennett et al., 2015; Meddens et al., 2015) could, as some studies suggest, improve resilience of trees through formation of adaptive traits (Paz-Kagan et al., 2017). The impact of slope orientation on drought-related tree mortality remains not fully understood. While most studies report higher mortality on south- and west-facing slopes (Cailleret et al., 2014; Dorman et al., 2015; Paz-Kagan et al., 2017; Socha et al., 2023; Sturm et al., 2022), stakeholders in Luxembourg reported higher mortality on east-facing slopes. Low Topographic Wetness Index (TWI) values correlate with increased drought mortality (Allen and Breshears, 1998; Breshears et al., 2018), but the influence of confounding factors like stand structure and microclimate heterogeneity remains insufficiently studied.
Stand structure and age are additional key drivers influencing forest mortality during drought (Bennett et al., 2015; McDowell and Allen, 2015). Taller or older forest stands are often more prone to die during droughts (Dorman et al., 2015; Floyd et al., 2009; Guarín and Taylor, 2005; Paz-Kagan et al., 2017; Socha et al., 2023), likely due to higher vulnerability to hydraulic failure (McDowell and Allen, 2015). There is however evidence that younger forests are more prone to die during climatic extremes, especially under hot and dry conditions (König et al., 2025; Luo and Chen, 2013). Higher canopy mortality has also been observed at forest edges (Mann et al., 2023; Sturm et al., 2022), likely caused by a higher evaporative demand resulting in a faster depletion of water reserves (Brun et al., 2020; Buras et al., 2018). Additionally, forest roads create edges inside the forests that can alter the microclimate, providing pathways for wind and pests such as the European spruce bark beetle (Ips typographus), and influencing vegetation type and age (Lugo and Gucinski, 2000). The influence of forest roads on tree mortality during drought remains an open question that is greatly underexplored in Europe (Feleha et al., 2025).
Drought-induced stress can also increase the vulnerability of trees to subsequent disturbance agents (Kärvemo et al., 2023). The hot and dry conditions during droughts weaken the tree's defence mechanisms as well as facilitate the proliferation of bark beetles, which was documented at numerous sites across Central Europe (Gilles et al., 2023; Knutzen et al., 2025; Pirtskhalava-Karpova et al., 2024) and other parts of the world (Cervantes-Martínez et al., 2019; Robbins et al., 2022). A key question remains whether the effects of bark beetle infestations can be disentangled from the influence of other site-specific characteristics, as this distinction is crucial for accurately assessing ecosystem responses and management strategies.
These knowledge gaps highlight the need for a more integrated understanding of how environmental drivers shape drought-induced tree mortality. Addressing these drivers requires high-resolution canopy mortality and environmental data (≤ 50 cm) with broad spatial coverage. Lower-resolution products, such as Landsat (30 m) or Sentinel-2 (10 m), represent multiple tree crowns per pixel and diverse micro-topographic conditions that cannot be disentangled. As such these lower-resolution products cannot adequately address smaller-scale, site-specific responses, let alone depict tree mortality with high certainty (Hansen et al., 2013; Senf and Seidl, 2021). While research on smaller forest plots provides valuable insights into the conditions of individual trees (Hülsmann et al., 2016), it may fail to capture broader, landscape-scale mortality patterns (Dorman et al., 2015; McDowell et al., 2013). Very high-resolution datasets of canopy mortality (≤ 50 cm) can help identify sites more vulnerable to drought, thereby facilitating targeted monitoring and forest management strategies (Anderegg et al., 2013; Brouwers et al., 2013; Clifford and Booth, 2015; Príncipe et al., 2022). This is further supported for example by the recent “deadtrees.earth” initiative, which highlights the importance of high-resolution canopy deadwood information for capturing mortality trends (Kattenborn et al., 2025; Mosig et al., 2026). Recent advances in big data science, including increased computational power and the rise of artificial intelligence, now make it possible to address these data gaps by facilitating the acquisition of high-resolution canopy-level mortality data across landscapes (Cheng et al., 2024; Junttila et al., 2024; Schwarz et al., 2024). Such detailed canopy mortality data provide the basis for a better understanding of mortality drivers at the landscape scale.
In this study, we used a previously published high-resolution dataset capturing canopy mortality across the entire country of Luxembourg in Central Europe (Schwarz et al., 2024) to explore fine-scale spatial patterns of canopy mortality and identify key drivers of mortality dynamics. The dataset covers the summers 2017–2020, three of which were characterised by severe drought (Rakovec et al., 2022). The very high spatial resolution of the mortality dataset (20 cm px−1) and the environmental drivers (50 cm px−1) enables us to investigate whether fine-scale mortality drivers aggregate into consistent landscape-scale patterns across Luxembourg. Given this fine-scale focus, the 2018–2020 drought is treated as a background condition, and the analysis focuses on identifying spatial drivers that modulate canopy mortality under severe drought conditions.
We hypothesised that drought-induced canopy mortality patterns across Luxembourg are primarily related to three driver groups: (1) topography, with higher mortality expected on steeper and south-facing slopes, (2) forest structure, with higher vulnerability in taller stands and near forest edges, and (3) biotic interactions, where conifer mortality shows patterns consistent with bark beetle spread, unlike broadleaf mortality.
2.1 Study site
This study covers all forests of Luxembourg with predominantly temperate coniferous and broadleaf stands, the extent of which are defined by the LIS-L land cover data set (Korzeniowska, 2020). Luxembourg is located in Central Europe (between 49 and 51° latitude and 5 and 7° longitude) and has a forest area of approximately 900 km2 representing about ∼35 % of the country's total area. Forests comprise approximately 71 % broadleaf, 23 % coniferous and 5 % mixed forests. Despite being one of the smallest countries in Europe, it is characterised by a diverse landscape, ranging from relatively flat, urban environments in the south (∼250 m a.s.l), which are dominated by broadleaf forests to a more hilly, forested, conifer-dominated landscape in the north, reaching elevations of 560 m a.s.l. (Fig. 1).
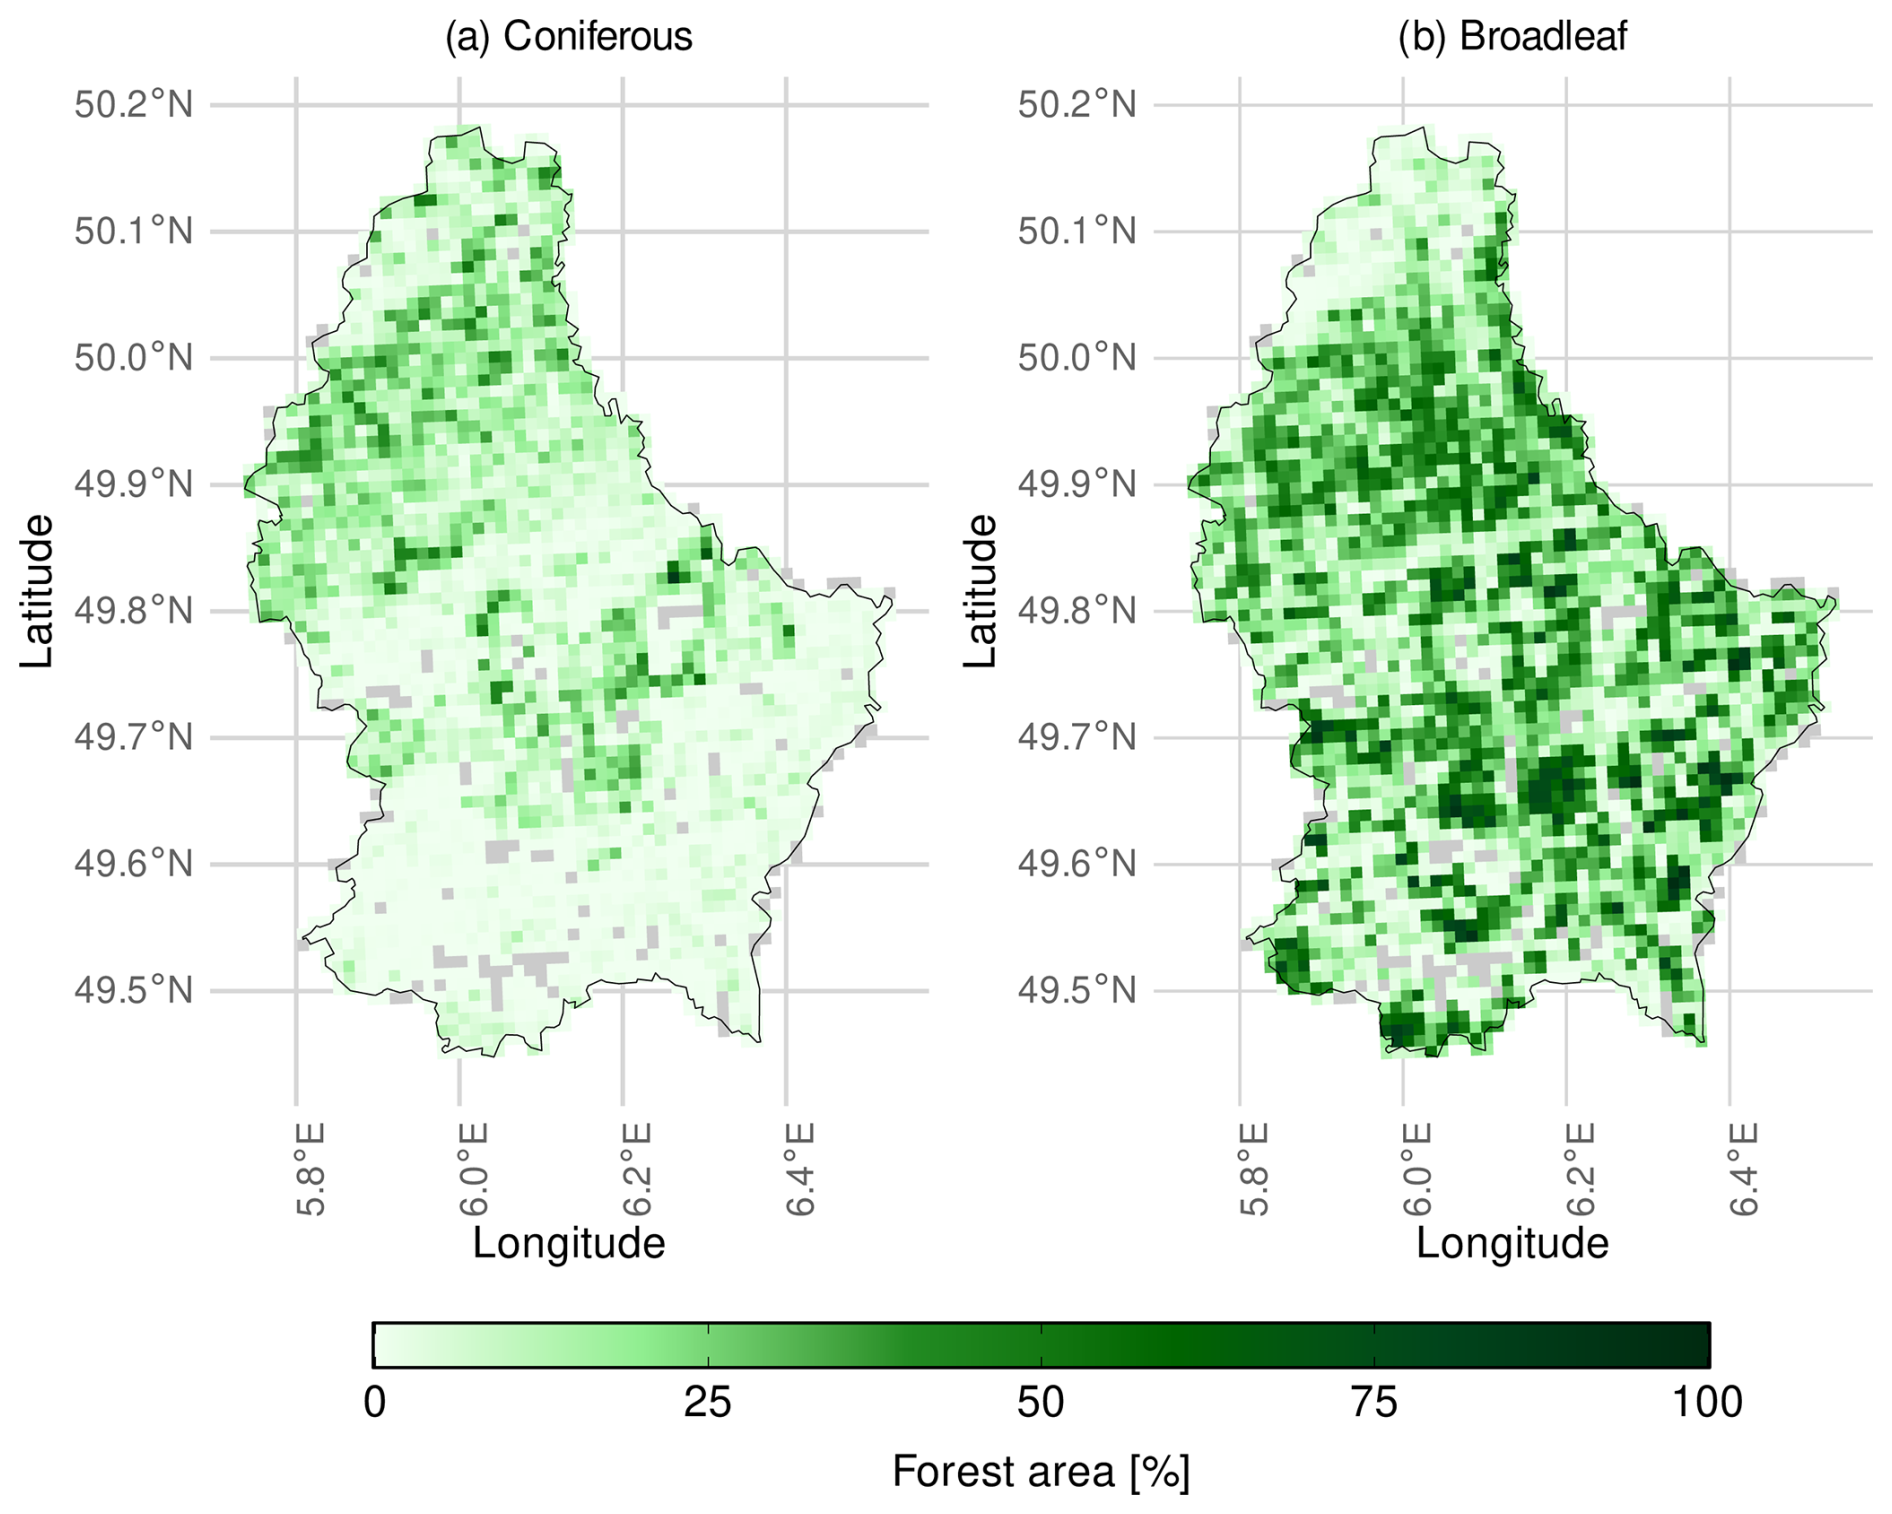
Figure 1Map of Luxembourg showing the percentage of forested area. Forest area of (a) coniferous and (b) broadleaf forests in a 1 km2 grid. Non-forested grid cells are shown in grey. Although only homogeneous forest stands with > 75 % coniferous or > 75 % broadleaf cover were analysed in this study, aggregated grid cells of 1 km2 may contain both coniferous and broadleaf forests. Consequently, some grid cells show mixed forest composition at the map scale, even though predominantly single-type stands were included in the underlying analysis. Coniferous forests are more prevalent in the north and center of Luxembourg, while broadleaf forests make up the majority of most forests throughout the rest of the country.
2.2 Canopy mortality data
We used a high-resolution dataset of conifer and broadleaf canopy mortality covering the entirety of Luxembourg, which was first presented in Schwarz et al. (2024). The dataset covers the drought period between 2018 and 2020 as well as the pre-drought year 2017 and has a ground resolution of 20 cm. It is based on annually collected RGB orthophotos freely available on the open data platform https://data.public.lu (last access: 14 April 2026) of Luxembourg (see Table S1 in the Supplement). Canopy mortality of coniferous and broadleaf trees was mapped using a Convolutional Neural Network, a deep learning algorithm for image segmentation and classification. The very high spatial resolution of 20 cm enabled differentiation between coniferous and broadleaf tree canopies based on fine structural features that cannot be resolved by coarser-resolution sensors such as Sentinel-2 or Landsat. The use of high resolution imagery allowed precise detection of dead canopies, while reducing background noise (e.g. browning of understory vegetation). Because a semantic segmentation model was used instead of an instance segmentation model to derive the mortality data, the resulting canopy mortality polygons include both individual dead trees and groups of dead trees.
To identify the drivers of canopy mortality per forest type for the year 2020 (i.e., conifer, broadleaf) we used a Generalized Additive Model (GAM; for explanation see below) (Hastie and Tibshirani, 1986). The analysis focused on homogeneous forest stands with > 75 % coniferous or > 75 % broadleaf cover, as defined by the Lis-L land cover data set (Korzeniowska, 2020). Forest types of both dead and alive canopies were determined by the land cover data. For 2020, the dataset contains 211 461 polygons of dead coniferous canopy and 84 698 polygons of dead broadleaf canopy. As shown in Fig. 2a, a binary data set of dead and alive canopy data points was generated as follows: First, the centroid of each dead canopy polygon was calculated using the polygons barycenter. Centroids that initially fell outside their respective polygons due to irregular shapes (e.g., L-shaped units) were identified and manually repositioned to a central location within the polygon. Next, the dead canopy polygons were subtracted from the land cover polygons, resulting in areas containing only living forest. An equal number of random points were then distributed across living forests for each forest type, and both living and dead canopy points were combined into a single dataset (Fig. 2a).
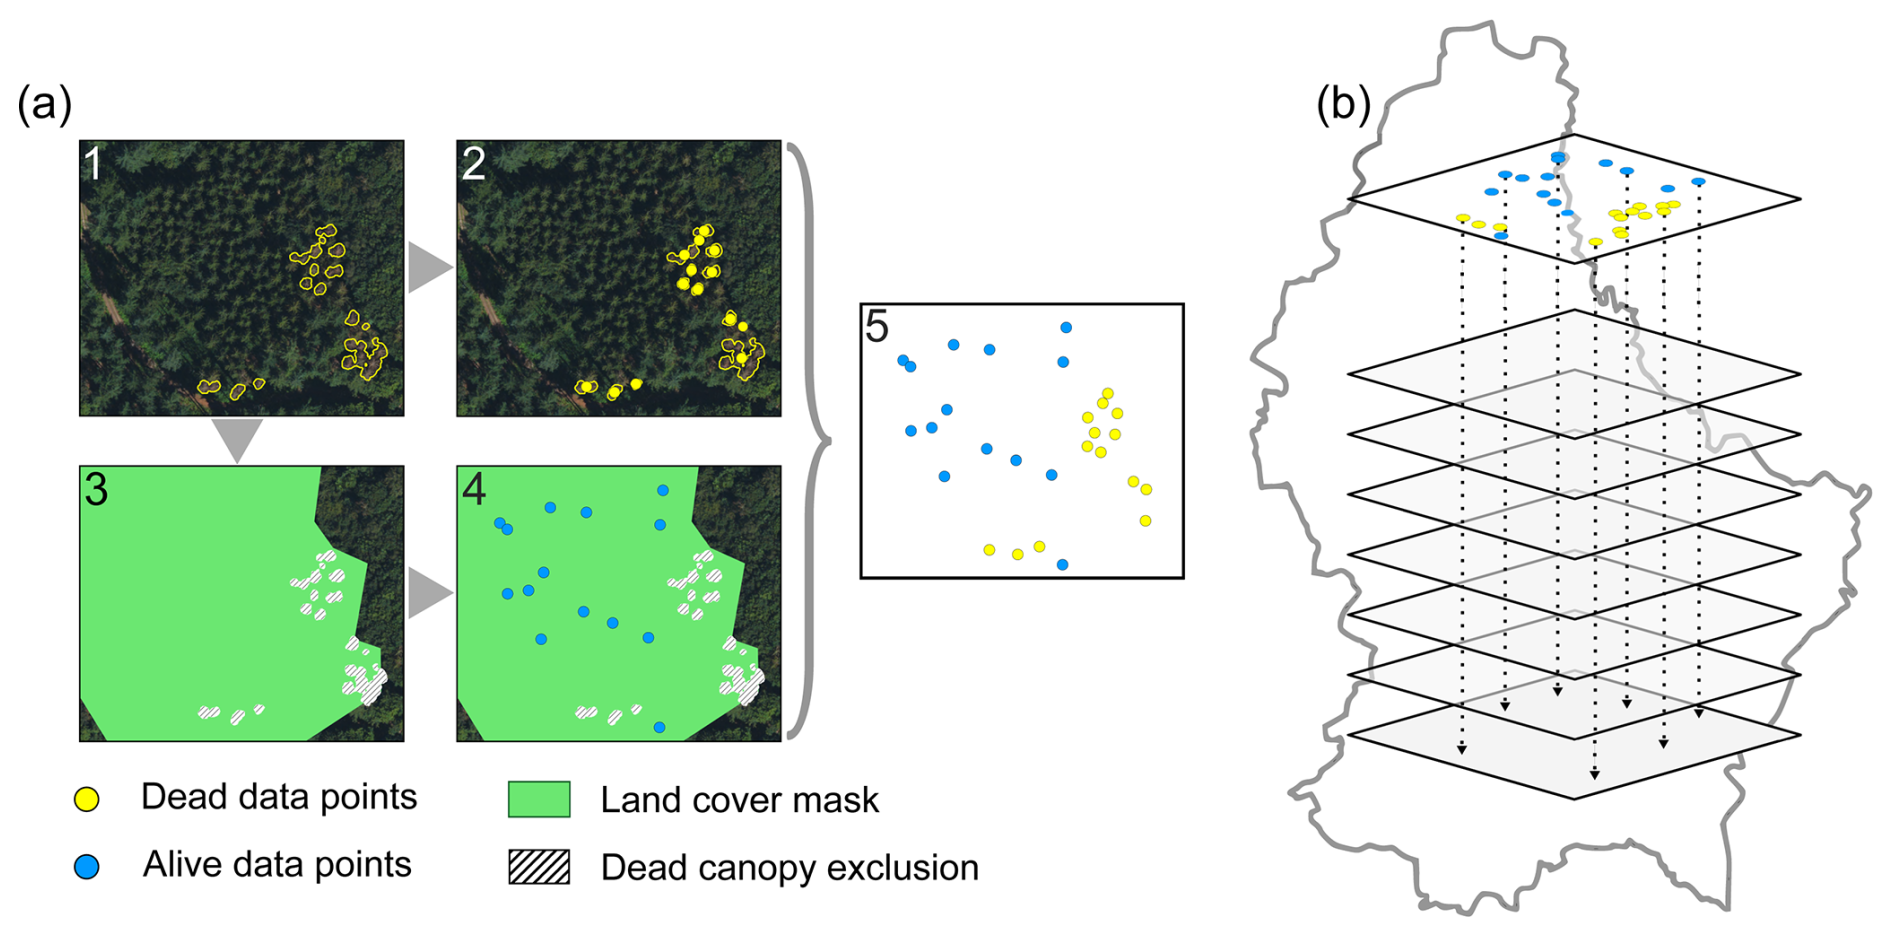
Figure 2Stepwise data preparation procedures to derive a balanced binary dataset of dead versus alive data points. (a) Steps 1–2: Dead canopy points (yellow) were derived from a data set of dead canopy area in 2020 (Schwarz et al., 2024). Steps 3–4: Alive canopy data points (blue) were obtained by excluding the dead canopies from a land cover dataset (Lis-L) and randomly distributing data points throughout. Step 5: Dead and alive data points were merged and (b) corresponding values of the environmental variables were extracted to be used in the Generalized Additive Model (GAM).
2.3 Environmental drivers of canopy mortality
In this study, environmental drivers are defined as biotic or abiotic factors that influence whether and where canopy mortality occurs under severe, multi-year drought conditions. Drought represents the overarching environmental setting and primary cause of mortality, while additional factors such as soil properties, topography, forest structure, and biotic interactions (e.g., bark beetle activity) modulate tree vulnerability and shape the spatial patterns of mortality. To assess the influence of these drivers on observed canopy mortality, we considered 14 biotic and abiotic variables available at high spatial resolution. A more detailed overview of the geospatial datasets used in this study is provided in Table S1. All data used for the GAM calculations were resampled to a resolution of 50 cm, which is highly detailed for such a large spatial data set. The availability of canopy mortality data at this fine spatial scale allowed us to explicitly investigate fine-scale processes, such as stand structure, bark beetle occurrence and spread, and local topographic context, that are unlikely to be detectable with coarser (10–30 m) satellite imagery. The use of very high-resolution data enables a direct link between individual canopy or small-patch mortality and corresponding high-resolution drivers, and allows us to assess whether these fine-scale mechanisms aggregate into consistent landscape-scale patterns.
2.3.1 Mortality clustering and spread
Bark beetle dynamics act as environmental drivers that influence where canopy mortality occurs under drought by shaping the spatial spread and clustering of mortality. In this study we characterised this driver using three groups of proxy variables defined as follows: (i) “Distance to previously dead canopies in 2017 and 2019”, (ii) “Distance to closest (other) dead canopy in 2020”, and (iii) “Change in dead canopy area”.
- i.
“Distance to previously dead canopies” was chosen as an indicator to assess a potential influence of bark beetle (Ips typographus) spread on tree mortality. We derived the distance to previously dead polygons by calculating the minimum distance from the closest edge of a dead polygon in 2019 (distance_2019) to the data points (centroids) in 2020 using the “Join attributes by location” tool in QGIS. We repeated this procedure for 2017 (distance_2017) to evaluate whether the location of dead polygons prior to the drought influenced mortality during the drought.
- ii.
“distance to closest (other) dead canopy in 2020 (distance_2020)” was calculated using the NN_join tool in QGIS. It represents the distance of the data points to the closest dead polygon in 2020. We selected this variable as a proxy for dead polygon clustering, as bark beetle infestations typically spread between trees in close proximity (Raffa et al., 2008).
- iii.
“Change in dead canopy area (Δarea)” was assessed by measuring the extent of dead canopy within a 50 m radius around each data point in 2019 and 2020, and subtracting the 2019 values from those of 2020. This metric captures changes in mortality beyond the presence of existing dead-canopy patches by explicitly accounting for the expansion or contraction of dead-canopy area over time. Positive values indicate an increase in canopy mortality due to spreading dieback, negative values reflect a decrease caused by extraction or recovery, and zero values denote no change, either because dead trees remained standing or because no dead canopy was present in the area.
2.3.2 Forest structure
Forest structural characteristics and fragmentation function as environmental drivers that influence where canopy mortality occurs under drought by modifying competition, exposure, and stand microclimate. Forest fragmentation can further alter microclimate and exposure, as previously proposed (Dutta and Dutta, 2016). Although forest fragmentation has been extensively studied in the rainforests of South America, comparable studies in Europe remain rare (Feleha et al., 2025). In this study, forest structure was represented by canopy height and metrics of forest fragmentation, quantified as distance to forest edges and roads, as described below.
Forest height – A canopy height model was calculated by subtracting the digital terrain model (DTM) from a digital surface model (DSM), derived from a LiDAR data and available though the open data platform of Luxembourg. The DSM model includes above ground structures, such as the forest canopy, whereas the DTM represents the ground.
distance to forest edges was calculated as the minimum distance to the nearest forest edge as defined by the Lis-L forest dataset as a continuous heat map using the GDAL proximity tool in QGIS (GDAL/OGR contributors, 2020). We tested two variables (1) distance_edge which does not account for forest fragmentation by roads and measures only the distance to the outer forests boundaries; and (2) distance_road which includes forest edges created by fragmentation due to roads. While the LIS-L dataset captures official road networks and larger forest roads, small forest tracks and agricultural access roads are not represented. This limitation should be considered when interpreting the results.
2.3.3 Topography
Topographic and soil conditions act as environmental drivers by influencing water availability, energy balance, and microclimatic stress, thereby shaping where canopy mortality might occur under drought.
Elevation data were derived from the Digital Terrain Model (DTM), provided through the open data platform of Luxembourg. The DTM describes the height above sea level in meters [m] at a resolution of 20 cm and ranges from 129 to 559 m a.s.l. We resampled the resolution to 50 cm to make the data comparable to the DSM data used to create the canopy height model. Elevation may influence canopy mortality through changes in temperature and precipitation as well as exposure to solar radiation and wind.
Slope was calculated from the DTM using the GDAL slope function in QGIS (GDAL/OGR contributors, 2020). The data describe the incline of the terrain as the change in elevation between adjacent DTM cells in degrees. Slope can influence water run-off, soil depth and radiation exposure.
Northness and eastness were calculated from the slope. They represent the components of the aspect variable and describe the direction of a slope on a north-south and west-east axis. Values range from −1 to 1 with negative numbers pointing to south or west facing slopes and positive numbers to north or east facing slopes respectively. We used northness and eastness rather than aspect, which is a circular variable (0–360°). Splitting aspect into linear components avoids this circularity and improves interpretability in regression-based models. The slope direction affects exposure to solar radiation and microclimate. South-facing slopes usually experience more solar radiation, which can lead to higher drought stress, but tree species growing on north-facing slopes may be less adapted to dry conditions and hence more drought prone (Stovall et al., 2019). We chose to also include eastness, because discussion with local stakeholders indicated that eastern facing slopes were more affected by canopy mortality between 2018 and 2020 than slopes facing other directions.
Topographic Wetness Index (TWI) was calculated using slope and contributing upslope area using the “calculate TWI” tool in SAGA GIS (Conrad et al., 2015). TWI reflects the topographical aspect of water availability (Beven and Kirkby, 1979; Sørensen et al., 2006).
Soil type (soil) – We used a soil type map with a scale of 1:100 000 provided by the Luxembourg open data platform. The data consist of 27 different soil types, categorised by characteristics such as the parent material and drainage conditions (e.g., “Loamy-stony soils with schist-sandstone material, non-gleyed, with a structural B horizon.”, ASTA, 2020; Table S2). Soil type can have a large influence on vegetation and tree mortality as the grain size determines water retention and availability as well as soil nutrient availability.
2.4 Statistical analysis
We used Generalized Additive Models (GAMs) to assess the contribution of the aforementioned environmental covariates to broadleaf and conifer canopy mortality in 2020 as a result of three consecutive drought summers. GAMs are non-parametric linear models used to model non-linear relationships as a sum of linear basis functions (Hastie and Tibshirani, 1986; James et al., 2013). As such they are able to represent more complex relationships between drivers and responses that exist in natural environments. Generally, a GAM consists of a response variable and a number of covariates, expressed as smoothed (non-linear) terms and linear functions.
In this study, we fitted the models using the function bam() provided by the mgcv package (Wood, 2011) in R (V4.2.1, R Core Team, 2022) which is more suitable for very large datasets.
We fitted one model per forest type, i.e. coniferous and broadleaf forest. Due to the binary form of the response variable, referring to dead or alive canopies, we used a binomial distribution and a “logit” link function. A combined smooth of longitude and latitude was added to model spatially structured variation in the data that cannot be attributed to any of the environmental variables. All continuous covariates were added as smooths and soil type was added as a categorical term. We used the REML (Restricted Maximum Likelihood) method to automatically adjust the smoothing parameter λ, which controls the wigglyness of the smooth and therefore the flexibility of the model. We kept the parameter k= 10, which determines the number of basis functions for the smooth and is reasonably small to achieve interpretable relationships expected for environmental variables.
2.5 Model evaluation
Prior to modelling, variable independence was checked by calculating Pearson's Correlation Coefficient for linear correlations and Spearman's Correlation Coefficient for monotonic relationships, including non-linear trends for each covariate pair (Supplement Fig. S1). The degree of correlation between the covariates was low to moderate for almost all variables. The highest correlation was found between the two forest edge variables (∼0.8). Due to the large size of the dataset, we consider the statistical power to be large enough to keep both variables in the model and distinguish between different effects of forest fragmentation on canopy mortality. Model assumptions were checked with simulated residuals using the package DHARMa (Hartig, 2022) and revealed no major violations. We report the explained deviance of the model.
To determine the contribution of each variable to the deviance explained per GAM model we calculated partial McFadden's Pseudo-R2 , along the lines of the implementation in the R-package rsq (McFadden, 1974; Zhang, 2022). Additionally, we quantified the contribution of groups of variables by calculating partial McFadden's Pseudo-R2 for topography (elevation, slope, TWI, northness, eastness), forest structure (forest height, distance_edge, distance_road), and indicators of spreading mortality (distance_2017, distance_2019, distance_2020 and Δarea). For each group, a reduced model was fitted excluding all variables in that group, and the resulting McFadden's Pseudo-R2 was compared to the full model using Eq. (1).
where and represent McFadden's Pseudo-R2 for the full and reduced model, respectively, and n the number of total observations. pR and pF denote the number of parameters in the reduced and full models, respectively. The formula adjusts for the difference in degrees of freedom between the two models.
3.1 Canopy mortality distribution in Luxembourg
Canopy mortality in Luxembourg increased from a total of 64 ha in 2017 to 590 ha in 2020. In 2020, about 420 ha of dead canopies were coniferous and 170 ha were broadleaf. As broadleaf forests dominate in Luxembourg, the disproportionate conifer loss indicates a notably higher conifer mortality rate. Hotspots of conifer mortality were observed in the north-east but appeared more scattered across the south (Fig. 3a). In some locations canopy mortality reached almost 90 %, although most areas experienced mortality rates between 0 % and 10 %. In broadleaf forests, the mortality rate was generally much lower, particularly in the north of Luxembourg. Isolated areas of higher mortality occurred in the south and south-east but did not exceed 5 % (Fig. 3b).
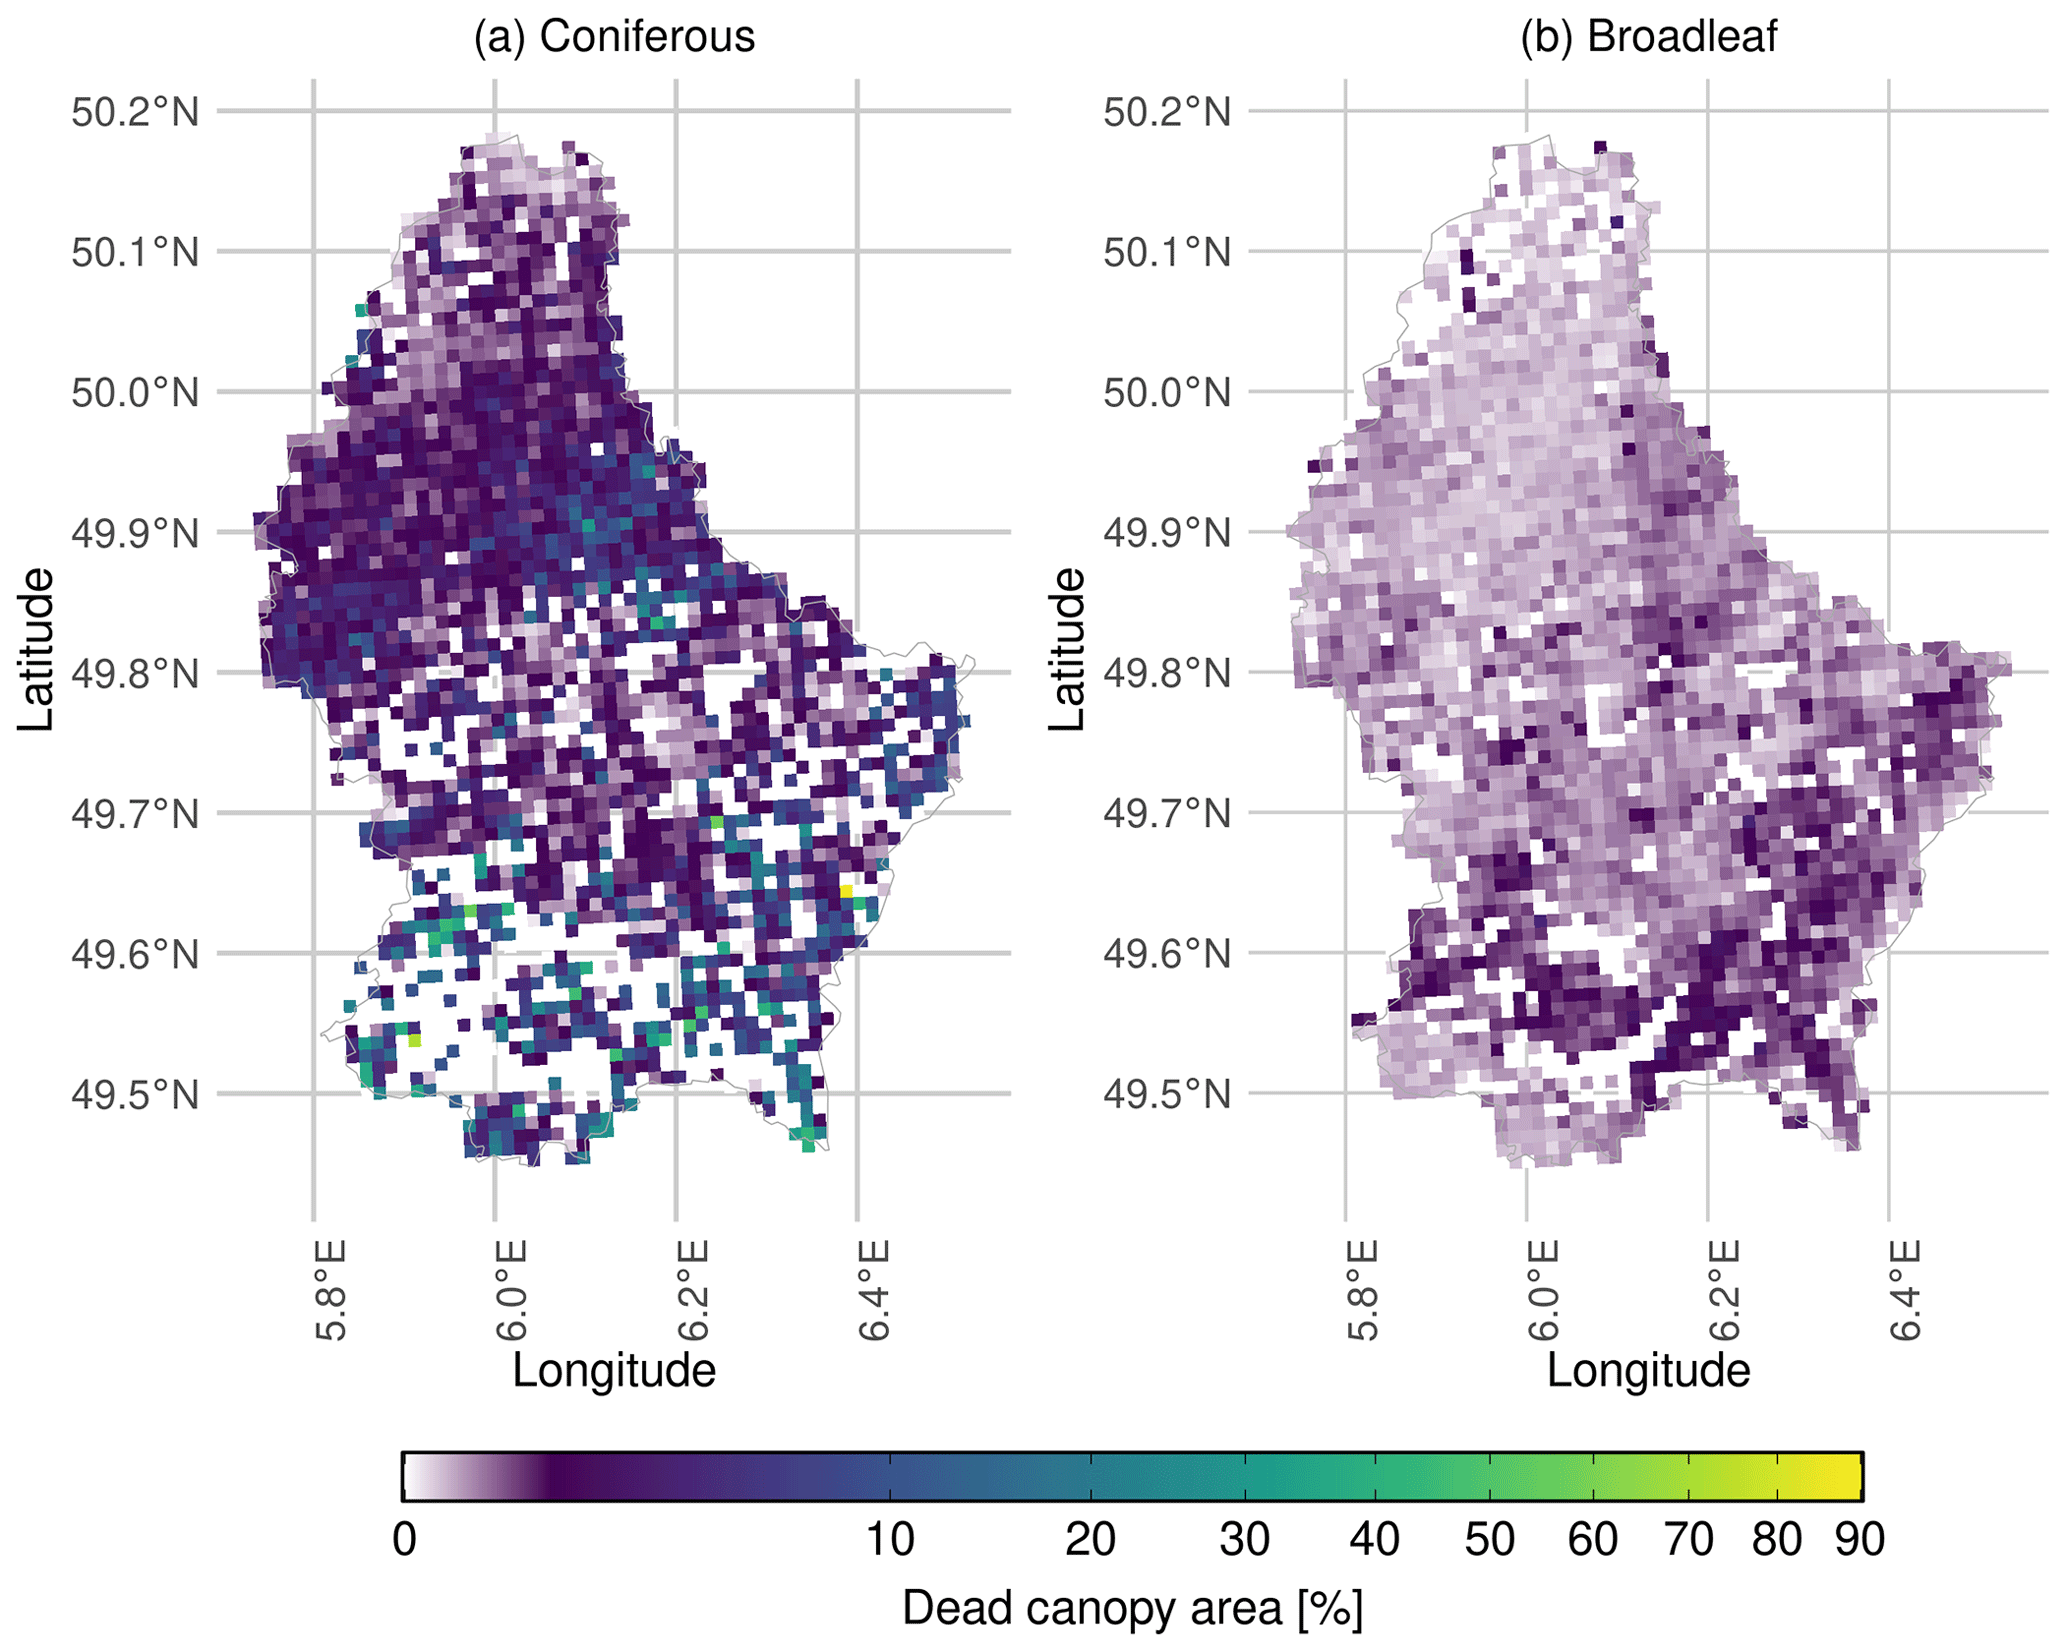
Figure 3Map of canopy mortality in Luxembourg in 2020. Percentage canopy mortality is shown for (a) coniferous and (b) broadleaf forest stands. Canopy mortality was derived using a convolutional neural network (Schwarz et al., 2024). Forest type (coniferous vs. broadleaf) was assigned based on LIS-L land-cover data, and percentage canopy mortality was calculated relative to the forested area (within a 1 km2 grid cell). The colour-bar was square-root transformed to better represent the skewed distribution of canopy mortality values and to enhance the visibility of low mortality levels, particularly in broadleaf forest stands.
3.2 Relative contribution of environmental variables to canopy mortality
Regional gradients in canopy mortality were evident, including bands of elevated mortality in coniferous forests and a north-south gradient in broadleaf forests (Fig. 3). However, these broad-scale patterns alone do not fully explain mortality dynamics at the local scale. We therefore conducted a more detailed analysis of site-specific characteristics contributing to canopy mortality at a much finer resolution (50 cm). The relative contributions of the 14 environmental variables to the fit of the broadleaf- and conifer-specific GAM models are summarised in Fig. 4.
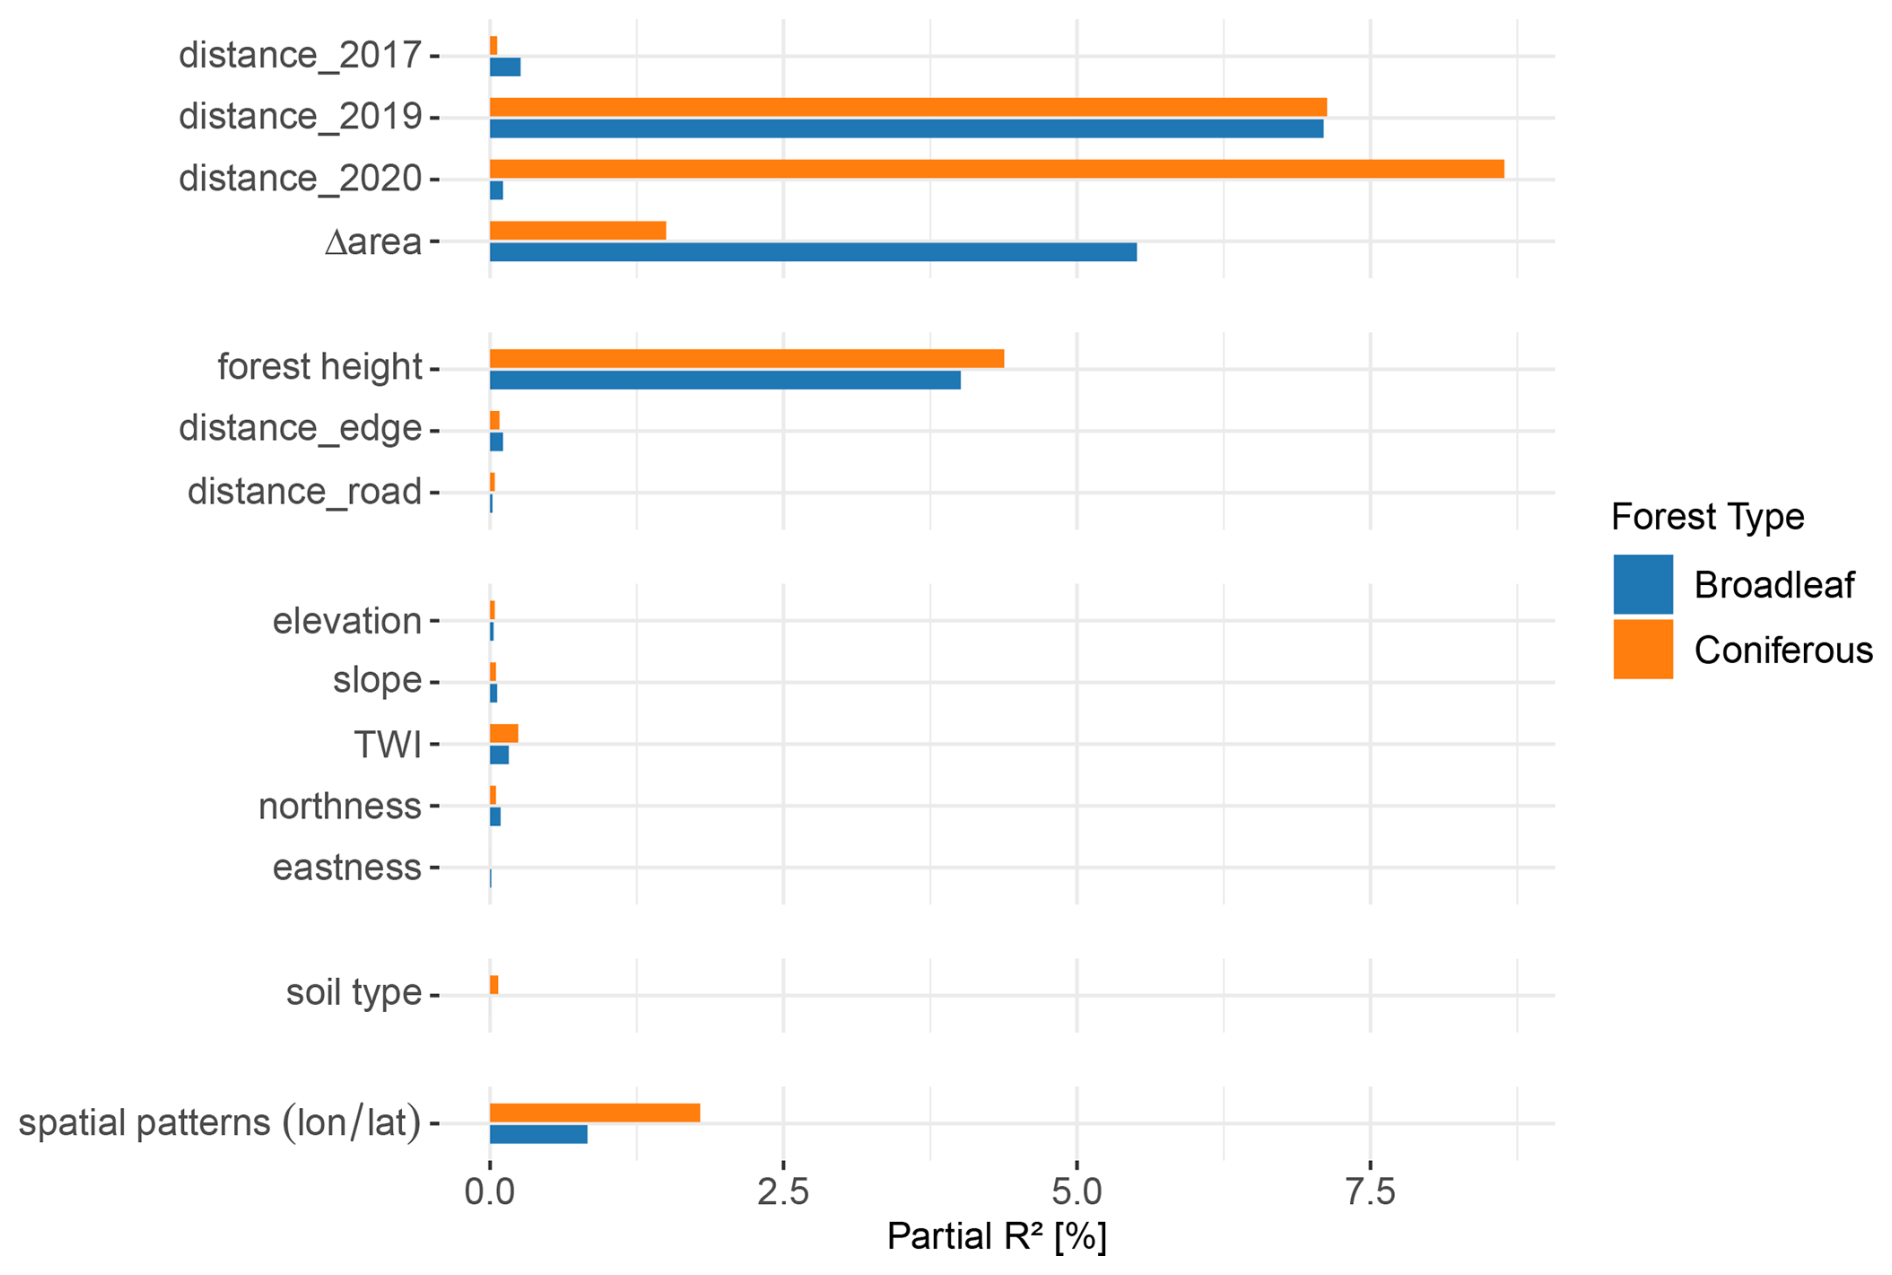
Figure 4GAM model results presented as partial R2 values for all environmental drivers for the 2020 canopy mortality in Luxembourg. Partial R2 was calculated along the lines of (Zhang, 2022) for broadleaf (blue) and coniferous (orange) forests separately. The values indicate the contribution of each variable in the model's explanation of the observed canopy mortality patterns. The “distance_year” variables refer to the distance of the closest dead canopy from the previous years 2017 or 2019 and the distance to other dead canopies within the same year 2020. distance_edge and distance_road represent the distance to forest edges with and without roads. Δarea describes the change in dead canopy area between 2019 and 2020 within a 50 m radius around each data point.
Thematic groups of environmental drivers differed in their contribution to model performance. Combined, the variables explained a substantial proportion of the fine-scale spatial distribution of canopy mortality in 2020. Overall, the GAM models accounted for 44.7 % of observed mortality in coniferous forests and 25.3 % in broadleaf forests. Variables related to the clustering and spread of mortality were most important in both forest types (Fig. 4), contributing partial R2 values of 29.43 % in conifers and 14.29 % in broadleaf forests (Fig. 5). Distance to dead canopies in the previous years had a similar effect in both types, but conifers were more likely to die in 2020 when dead canopies occurred close by. In broadleaf forests, mortality was strongly associated with a marked increase in dead canopy area between 2019 and 2020 (Δarea). Forest height was an important predictor of mortality in both forest types (Fig. 4). In contrast, spatial coordinates (longitude and latitude), included to capture unexplained spatial patterns, contributed little according to partial R2 values, and topographic variables as well as soil type had minimal influence (Figs. 4, 5).
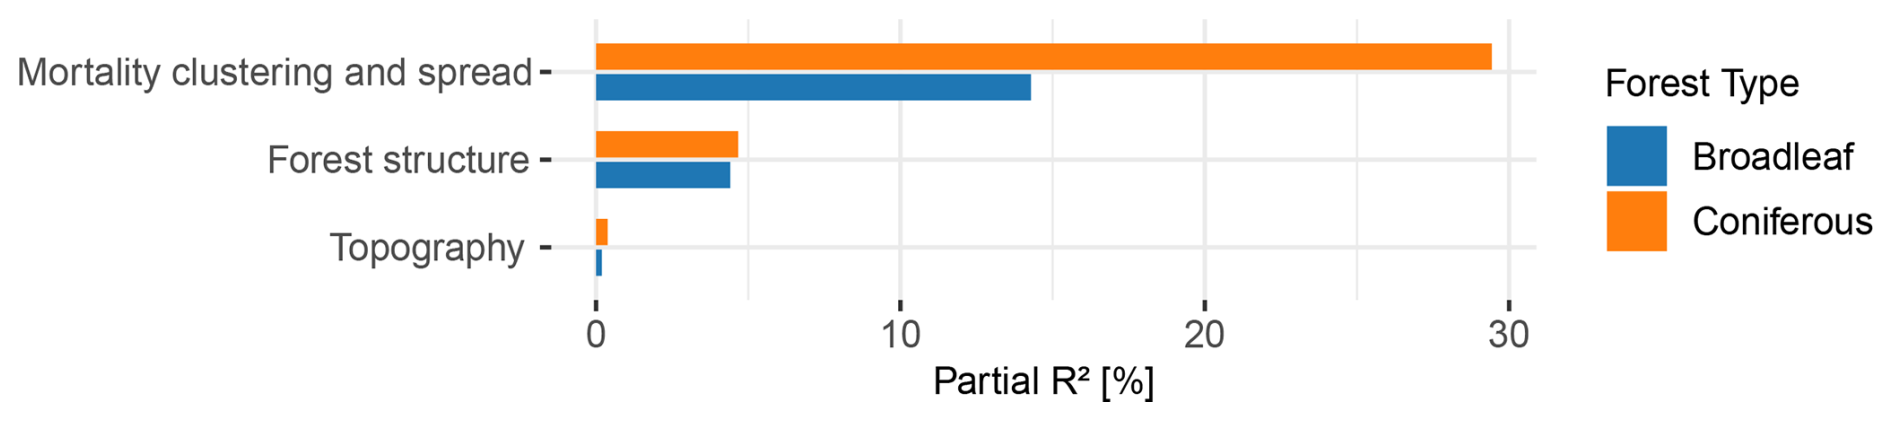
Figure 5Partial R2 values for the three groups of environmental drivers. Partial R2 was calculated along the lines of (Zhang, 2022) for broadleaf (blue) and coniferous (orange) forests separately. The values indicate the contribution of each variable in the model's explanation of the observed canopy mortality patterns.
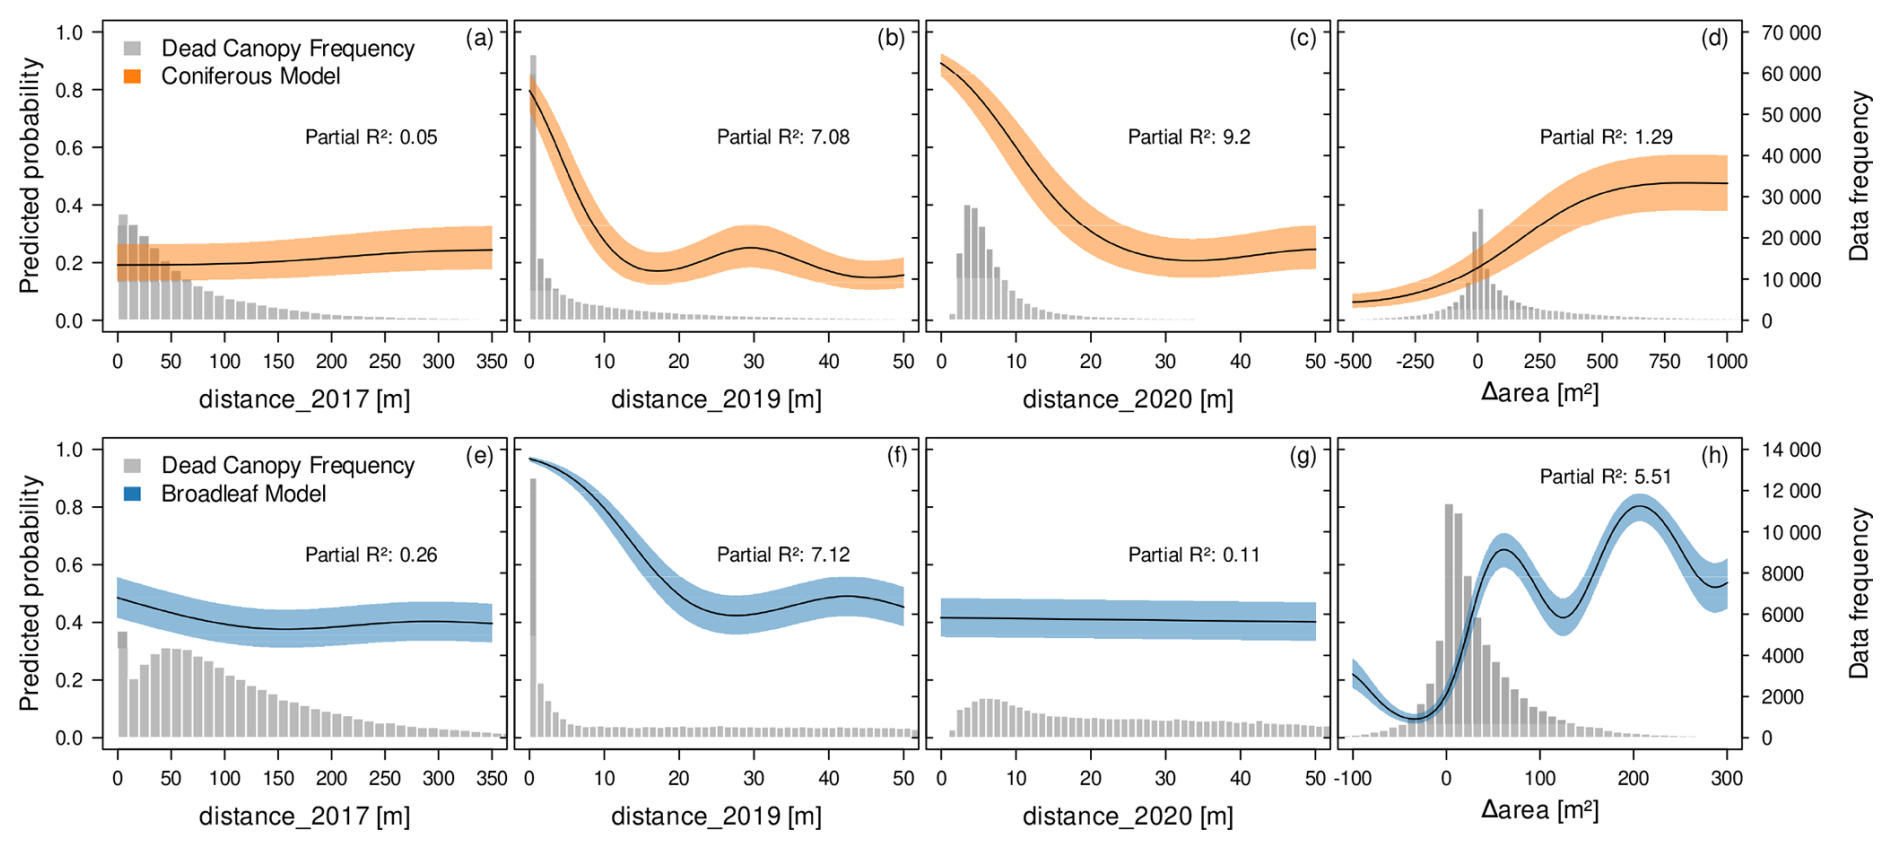
Figure 6Contribution of environmental variables to the fine-grained spatial distribution and spread of canopy mortality in Luxembourg in 2020. Shown are partial effect plots derived from GAM models for the conifer mortality (upper panels, orange) and broadleaf mortality (lower panels, blue). The “distance_year” variables describe the distance to the closest dead canopy in the previous years 2017 and 2019 and the distance to other dead canopies in the same year 2020. Δarea represents the change in dead canopy area between 2019 and 2020 within a 50 m radius around each data point. The fitted curves describe a smoothed, non-linear relationship between the predictor variable and the response variable, while all other variables in the model are kept at their mean value. The shaded area around the curves represents a 95 % confidence interval. The left y-axis represents the predicted probability of the response in relation to the predictor variable. While we might expect average predicted probabilities to be around 0.5 in a balanced binary dataset, the observational and unbalanced nature of our data leads to deviations from this baseline. The histograms (grey) and right-side y-axis indicate the frequency of dead canopy observations.
In order to more closely examine the influence of individual environmental variables on canopy mortality, we used partial effect plots that account for other predictors in the GAMs (Fig. 6). The following subsections explain these effects per group of environmental variables in more detail.
3.3 Self-reinforcing and spreading effects of canopy mortality
In coniferous stands, distance_2017 had no effect on the mortality distribution of conifers, this is not surprising given the small partial R2 (Fig. 6a). By contrast, proximity to dead canopies in 2019 (distance_2019) was a more influential predictor (Fig. 6b), indicating higher 2020 mortality near trees that had already died in 2019. This pattern was consistent with the observed increase in dead canopy area between 2019 and 2020 (Δarea), within a 50 m radius (Fig. 6d). The distance_2020 variable was the most important predictor. This indicates that mortality in conifers showed strong spatial clustering, with dead canopies tending to occur in patches within ∼20 m of each other (Fig. 6c).
In broadleaf stands, self-reinforcing patterns were also evident. Similar to conifers, 2017 mortality showed no influence on 2020 patterns (Fig. 6e), but 2019 mortality was the most important predictor (Fig. 6f). The increase in dead canopy area (Δarea) was also strongly associated with mortality patterns, with local maxima (Fig. 6h). However, unlike conifers, distance_2020 did not explain mortality distribution (Fig. 6g).
3.4 Effects of forest structure on canopy mortality
We found conifer canopy mortality to increase steeply with forest height > 10 m and remained high in tall stands (Fig. 7a). In contrast, variables related to forest fragmentation, both outer forest edges (Fig. 7b) and inner edges from roads (Fig. 7c) had only minor influence.
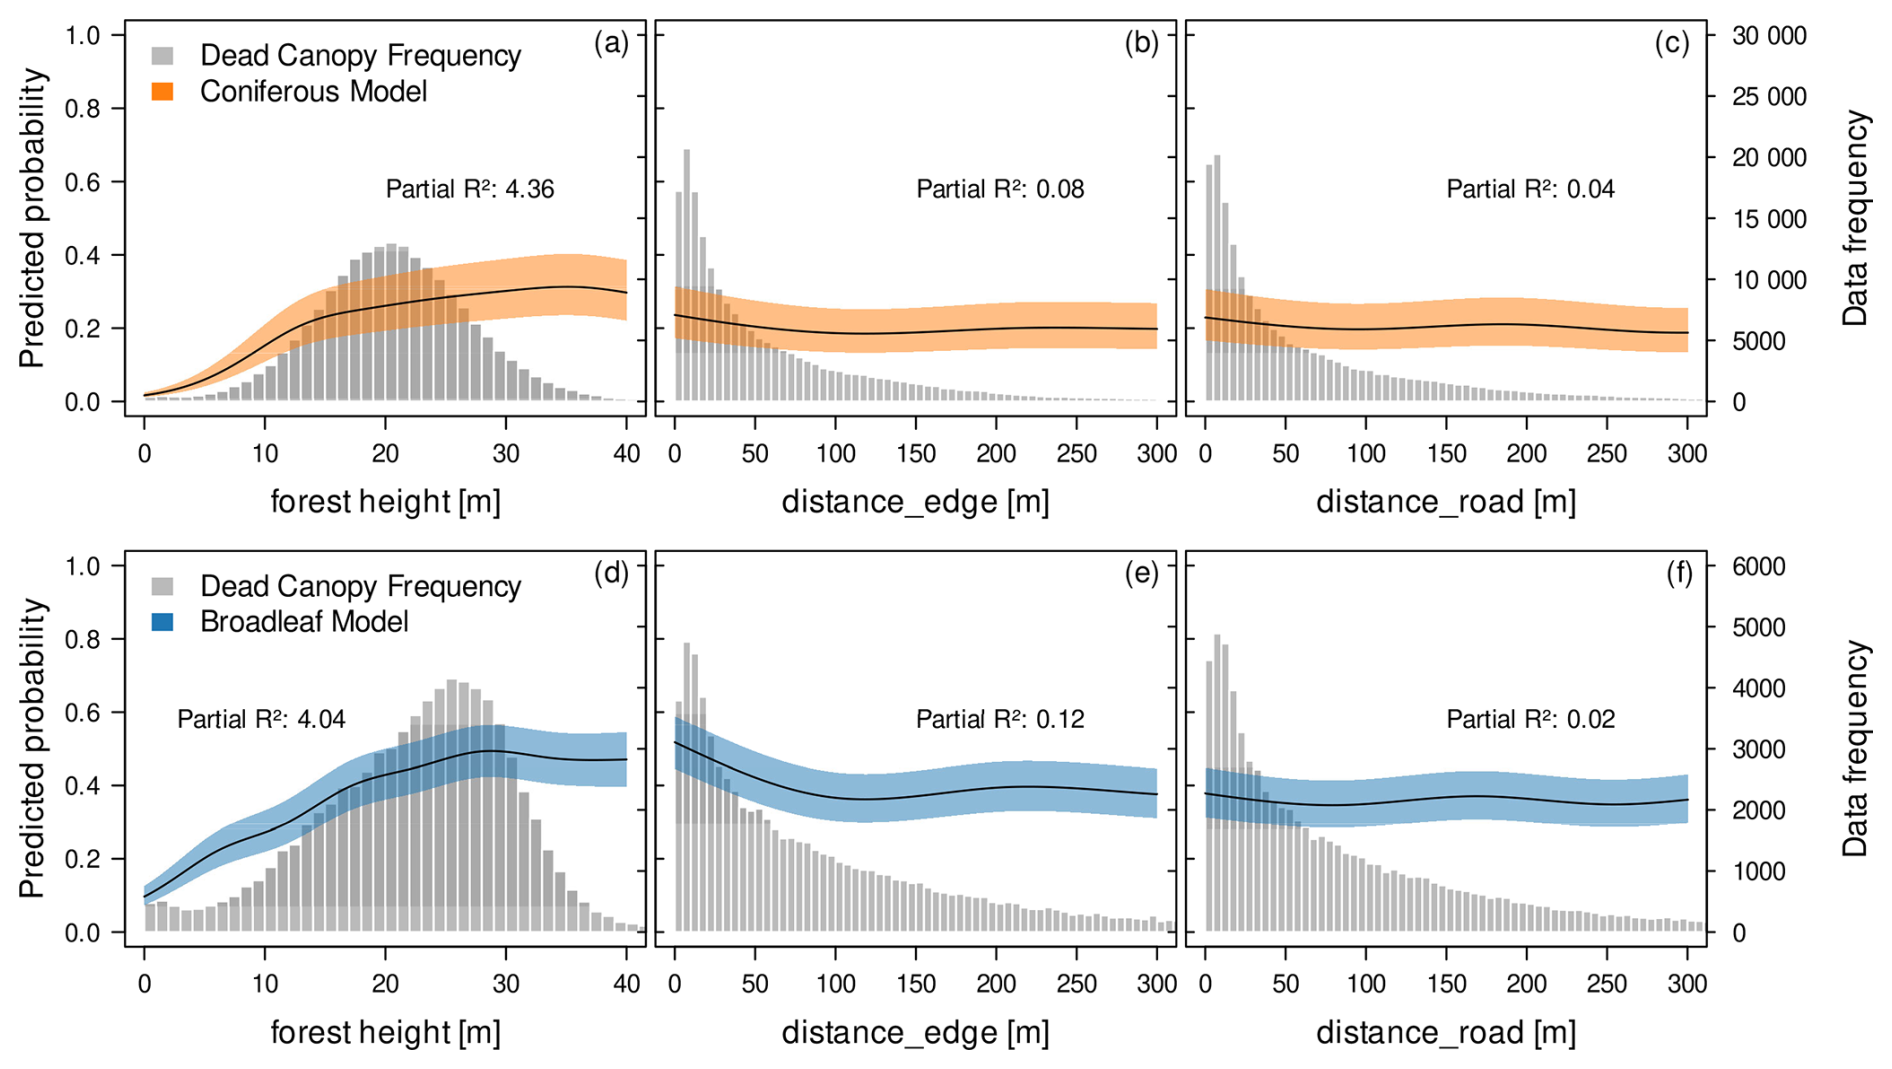
Figure 7Contribution of environmental variables to the fine-grained spatial distribution and spread of canopy mortality. Shown are partial effect plots derived from GAM models for the conifer mortality (upper panels, orange) and broadleaf mortality (lower panels, blue). distance_edge describes the distance to the outer edge of each forest, while distance_road describe the distance to the closest edge inside forests, created by fragmentation. The fitted curves describe a smoothed, non-linear relationship between the predictor variable and the response variable while all other variables in the model are kept at their mean value. The shaded area around the curves represents a 95 % confidence interval. The left y-axis represents the predicted probability of the response in relation to the predictor variable. While we might expect average predicted probabilities to be around 0.5 in a balanced binary dataset, the observational and unbalanced nature of our data leads to deviations from this baseline. The histograms (grey) and right-side y-axis indicate the frequency of dead canopy observations.
In broadleaf stands, the probability of canopy mortality rose steadily with height, levelling off at around 30 m (Fig. 7d). Unlike conifers, broadleaf mortality showed a clearer effect of forest edges, with higher mortality near the forest edge (Fig. 7e), albeit with a low partial R2 (Fig. 4). This effect is absent for forest roads (Fig. 7f).
3.5 Effects of topography and site conditions on canopy mortality
As shown before, topography played a minor role in explaining canopy mortality patterns for both coniferous and broadleaf stands, with similar responses between forest types (Figs. 4 and 5). Of the tested variables, TWI appeared as the most relevant, indicating higher mortality at low TWI values (< 6) for both conifers (Fig. 8c) and broadleaf forests (Fig. 8h).
In conifers, there was no clear effect of elevation (Fig. 8a) or slope (Fig. 8b). Broadleaf mortality increased slightly at elevations above ∼250 m (Fig. 8f) and on gentle slopes or plains (Fig. 8g), though these patterns are highly uncertain, reflected in the low partial R2 values. Other topographic drivers, such as northness and eastness, showed no discernible trends (Fig. 8e, k).
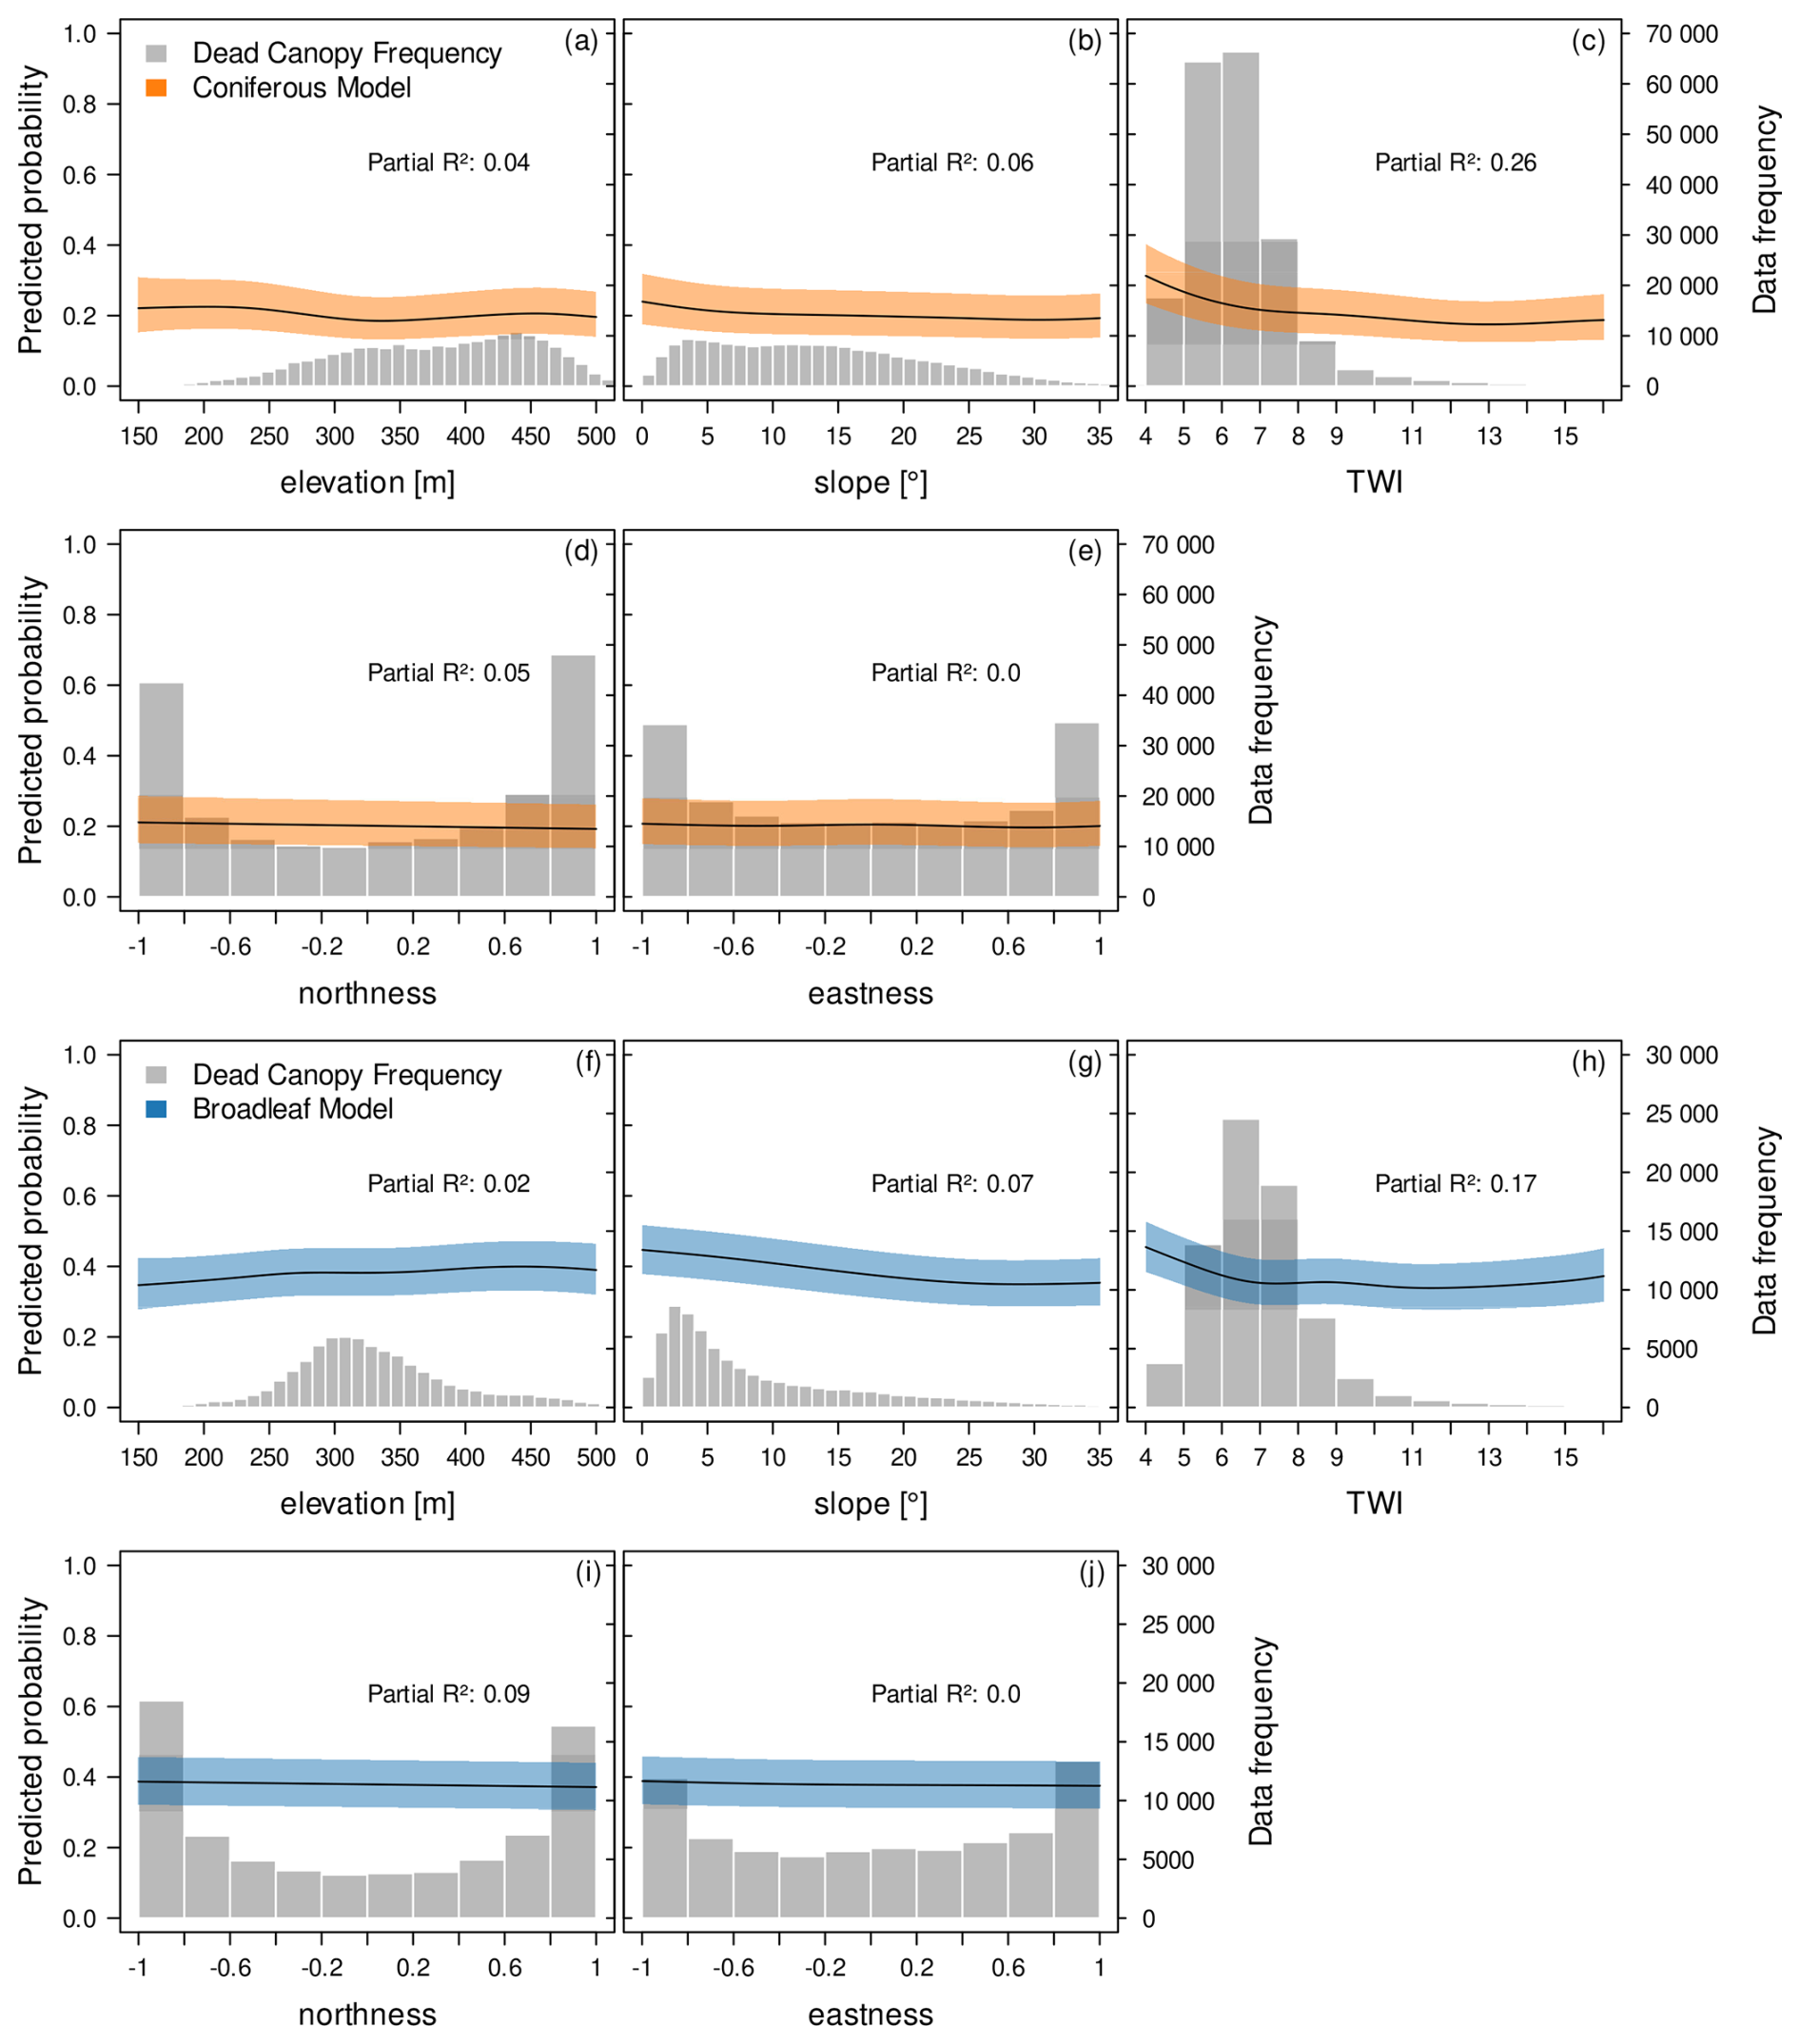
Figure 8Contribution of topographic variables to the fine-grained spatial distribution and spread of canopy mortality. Shown are partial effect plots derived from GAM models for the conifer mortality (upper panels, orange) and broadleaf mortality (lower panels, blue). The Topographic Wetness Index (TWI) describes the potential for water accumulation in a landscape based on terrain characteristics. The fitted curves describe a smoothed, non-linear relationship between the predictor variable and the response variable while all other variables in the model are kept at their mean value. The shaded area around the curves represents a 95 % confidence interval. The left y-axis represents the predicted probability of the response in relation to the predictor variable. While we might expect average predicted probabilities to be around 0.5 in a balanced binary dataset, the observational and unbalanced nature of our data leads to deviations from this baseline. The histograms (grey) and right-side y-axis indicate the frequency of dead canopy observations.
4.1 Small impact of topography and soil type on canopy mortality
Our findings indicate that topographic and soil-related environmental drivers explained little of the observed canopy mortality in both coniferous and broadleaf forests. Of the six tested drivers, the Topographic Wetness Index emerged as the most important. In contrast, other environmental drivers such as slope, elevation, northness, eastness, and soil type had little to no effect on the observed mortality patterns. Luxembourg's relatively low elevation range (150–600 m a.s.l.) may have reduced the effectiveness of elevation as driver of spatial mortality patterns. Previous studies that found elevation-related differences in canopy mortality were conducted in regions with significantly higher elevations exceeding 1500 m a.s.l. (Cailleret et al., 2014; Paz-Kagan et al., 2017; Rita et al., 2020; Sturm et al., 2022). In such situations, climatic differences along the elevation gradients may have more pronounced impacts on potential pest activities as well as precipitation patterns, both of which are likely to influence tree mortality. We suggest that in our study, the small elevational gradient together with the strong country-wide drought effects likely overrode any differences in elevation or slope orientation.
Although high-resolution data are generally advantageous for capturing fine-scale variability (Lannuzel et al., 2021; Pellegrino et al., 2024), they may introduce noise to topographic drivers such as slope, northness, and eastness. This small-scale terrain variability, which may be ecologically irrelevant, could obscure broader topographic patterns (Guillaume et al., 2021; Šilhán et al., 2022). This might explain why variables like TWI, which aggregate over broader spatial extents by accounting for upslope contributing area, were less influenced by small-scale terrain features and therefore more effective at capturing relevant hydrological gradients.
Meanwhile, the soil type data, comprising 27 classes, also showed minimal explanatory value. Although soil moisture is a known driver of drought-induced tree mortality (Belmonte et al., 2022; McDowell et al., 2022), the categorical nature and relatively coarse spatial resolution of the data most likely did not capture the specific soil water holding capacities relevant at the examined individual tree level.
Overall, topographic effects may have also been obscured by biotic drivers such as bark beetle infestation in conifers and by the overall severe drought conditions. The lack of influence in broadleaf forests, where bark beetles are not a disturbance agent, supports the notion that unaccounted variables, like fine-scaled soil properties and corresponding or soil water holding capacities played a more important role. At the same time, we explicitly tested whether spatial clustering effects, represented by the group “Mortality clustering and spread”, overshadowed the explanatory power of the other groups of drivers. To address this, we calculated partial R2 values after excluding this group of drivers. The explanatory value of topographic and soil-related drivers did not increase when mortality clustering and spread were omitted, indicating that their limited contribution was not simply masked by spatial autocorrelation or local spread processes. Thus, even when accounting for potential clustering effects, topographic drivers remained weak predictors of canopy mortality patterns. However, given the severity and spatial extent of the drought conditions in recent years, it seems plausible that topography played only a minor role across all forest types. This poses a concern for forests in future climate change conditions, as the severity of these hotter drought summers might severely affect even areas thought to be more resilient due to their topographic situations causing even greater forest loss than anticipated (Knutzen et al., 2025).
Our findings largely refute hypothesis (1): topographic and soil-related drivers provided only limited value for explaining the spatial patterns of drought-induced canopy mortality, likely due to low regional variability, data limitations, and overriding effects of severe drought and biotic disturbances.
4.2 Canopy mortality is higher in tall stands
We found that canopy mortality was related to forest structure and increased in taller stands in both coniferous and broadleaf forests. Taller stands experienced significantly higher mortality rates, consistent with findings from other studies linking forest height to increased vulnerability during drought events (Anderegg et al., 2016; Arend et al., 2021; Stovall et al., 2019; Trugman et al., 2018). Physiologically, tall trees can be more susceptible to hydraulic failure under drought conditions due to longer water transport pathways and higher evaporative demand (Anderegg et al., 2016; Arend et al., 2021; Bennett et al., 2015; Trugman et al., 2018). While trees might not die immediately, the cumulative effects of consecutive drought summers can weaken them over time (McDowell et al., 2022) as for instance reported for beech trees in Switzerland following the 2018 drought (Frei et al., 2022). Additionally, in conifers, increased mortality among taller trees is very likely linked to bark beetles preference for mature hosts with sufficiently thick bark as they are more suitable for the development of bark beetle larvae (Pirtskhalava-Karpova et al., 2024; Raffa et al., 2016).
By contrast, forest edges had negligible effect on observed canopy mortality, suggesting that the severity of the climatic drought conditions extended deep into the forests. While previous research indicates that edge effects can amplify drought stress (Buras et al., 2018; Sturm et al., 2022), our findings show only a minor influence in broadleaf forests and no significant effect in conifers. These findings suggest that the severity of the drought conditions of 2018–2020 might have led to unfavourable conditions even in the forest interior. Similarly, forest fragmentation due to roads had no discernible impact on mortality patterns, consistent with the weak role of edge effects in this study. It is important to note that the Lis-L dataset (Korzeniowska, 2020) does not represent small forest tracks or agricultural access roads, meaning fine-scale forest fragmentation could not be resolved. This may partially explain correlations between road and forest edge proximity.
In summary, our results partially support hypothesis (2): forest height was a strong driver of spatial canopy mortality patterns, whereas forest edge effects were minimal, likely due to the pervasive severity of drought across forest interiors.
4.3 Bark beetle infestations is a primary driver of conifer canopy mortality
Our results indicate that bark beetles were a key driver of canopy mortality in conifers, as evidenced by the significant roles of mortality clustering and spread. Both distance_2019 and distance_2020 were strong indicators of spatial mortality clustering, consistent with the clustered spread characteristic of bark beetle infestations (Zhao et al., 2025). The Δarea variable, which captured changes in the dead canopy area surrounding our data points, was also important and positive Δarea further supports the interpretation of spreading bark beetle activity as the infestation grows from single trees to large patches of dead trees (Potterf et al., 2019; Stereńczak et al., 2019). Negative Δarea may reflect vegetation recovery or canopy closure. Forest height was the only other strong driver, in line with bark beetle's preference for larger trees that have a sufficiently thick bark for tunnelling (Raffa et al., 2016). Taken together, this clearly reflects bark beetle-driven mortality dynamics in conifers.
It is important to note that the model identifies the proximity to existing mortality as a strong predictor of new mortality. While proximity is not a primary mechanistic cause, it reflects bark beetle-mediated propagation of drought-weakened trees. Bark beetle impact appears strongly modulated by drought, consistent with previous research (Hlásny et al., 2021). Our data show limited impact of spreading mortality prior to 2019, suggesting that high bark beetle activity only started following the onset of severe drought conditions. This aligns with evidence that drought weakens tree defence mechanisms (Rouault et al., 2006), while simultaneously accelerating beetle development, enabling multiple reproductive cycles per year (Fleischer et al., 2016; Lindman et al., 2023; Robbins et al., 2022; Webb et al., 2025). At the physiological level, we suggest that trees exposed to drought suffered from both hydraulic failure due to low water availability and rising vapour pressure deficit (Adams et al., 2017), and carbon starvation as stomata closed to conserve water (Ziegler et al., 2024). Reduced water availability likely also impaired resin flow (Kolb et al., 2019; Malone et al., 2024), weakening tree defence mechanisms. Carbon starvation during drought might also have decreased the allocation of nonstructural carbohydrates (NSC) to defensive metabolites in tree resin (Huang et al., 2020). These interacting stresses created ideal conditions for bark beetle outbreaks and explain the mortality patterns observed in our study.
Another layer of complexity lies in the interaction between bark beetle infestations and topography. Previous studies have shown that bark beetle infestations are often more severe on south- and east-facing slopes, at lower elevations, and on steeper terrain (Akkuzu et al., 2009; Blomqvist et al., 2018; Jakoby et al., 2019). Blomqvist et al. (2018) also reported more severe bark beetle infestations on shallow soils with low water storage capabilities. While such topographic patterns were not dominant in our mortality models, this does not imply these relationships were absent. Rather, they may have been masked by the overriding biotic effect of infestation.
Canopy mortality in broadleaf trees also showed an apparent influence of two variables associated with the spread of bark beetle infestation. These were distance_2019 and Δarea, while distance_2020 had little explanatory power. This suggests that although the loss of large-crowned individuals strongly increased the mortality area, mortality did not propagate in a spatially contagious manner (Fig. 9). The apparent importance of proximity to dead canopies in 2019 (distance_2019) should therefore be interpreted cautiously, as it largely reflects the persistence of already-dead trees rather than true neighbourhood-driven mortality processes. In other words, these variables capture changes in mortality extent rather than contagious spread. Taken together, these patterns suggest that in conifers, canopy mortality is shaped by contagious bark beetle outbreaks, whereas in broadleaves it reflects the loss of structurally dominant individuals under stress.
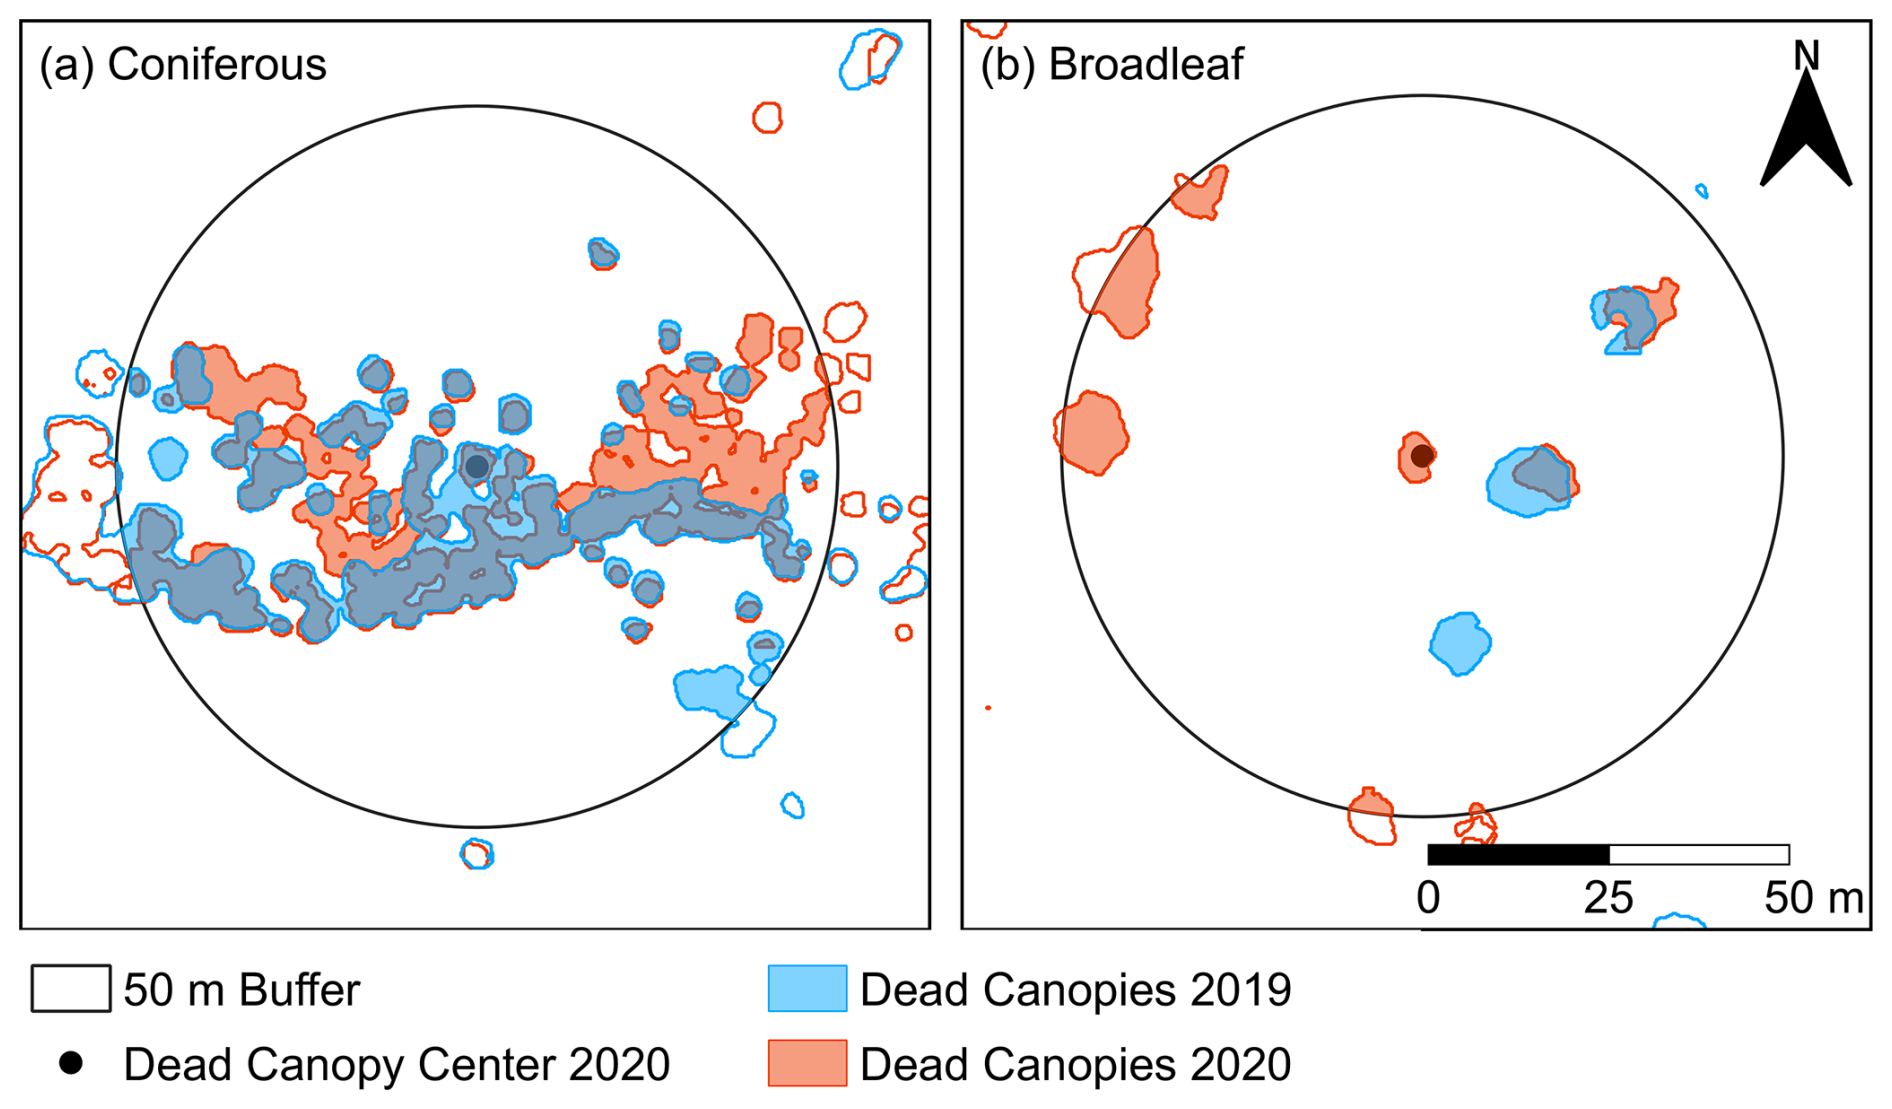
Figure 9Example of dead canopy area within a 50 m radius around a dead canopy core in (a) coniferous and (b) broadleaf forest. Blue areas indicate canopy mortality detected in 2019, and red areas indicate mortality in 2020. The figure highlights contrasting mortality patterns between the two forest types: in broadleaf forests, individual dead trees tend to cover larger areas, so additional mortality in 2020 substantially expands the affected area, comparable in relative magnitude to the clustered expansion observed in coniferous stands. The figure also illustrates how proximity to dead canopies from 2019 may contribute to high correlation in the GAM model, as trees already dead in 2019 generally remain dead in 2020.
Our findings strongly support hypothesis (3): conifer canopy mortality was closely linked to the spatial and temporal dynamics of bark beetle spread. At the same time, the contrasting patterns in broadleaf forests emphasise that identical drivers can reflect very different underlying processes depending on forest type.
4.4 Study limitations
A primary source of uncertainty of this study arises from differences in model performance between forest types in the mortality dataset. Schwarz et al. (2024) reported lower F1-scores for broadleaf forests (46 %–52 %) compared to coniferous forests (72 %–75 %), indicating lower agreement between the CNN-based mortality detection and user-delineated reference data in broadleaf stands. These F1-scores represent a conservative estimate of accuracy and reflect overall spatial agreement of mapped pixels. They are therefore sensitive to small position mismatches, fuzzy boundaries or differences in patch shape, which can lower the F1-score even though the general location of the mortality patch was captured correctly (Maxwell and Warner, 2020). Lower performance in broadleaf stands may have resulted in under-detection of small or diffuse mortality patches (lower recall) and/or higher false positives in heterogeneous canopies (lower precision). Given that broadleaf forests account for approximately 71 % of the study area, this disparity in detection accuracy may have influenced the relative strength of detected relationships between drivers and mortality patterns. However, we stress that as demonstrated in Schwarz et al. (2024) the overall quality of the classification was very good with a reliable detection of the vast majority of dead trees which we consider to be adequate as data base for the study conducted.
Climatic drivers such as temperature and precipitation are well-established drivers of drought-induced tree mortality. In the present study, we focused on fine-scale spatial drivers of canopy mortality, using very high-resolution mortality and environmental datasets (≤ 50 cm). While these data allow detailed analysis of individual tree and small-patch mortality patterns, they are limited in temporal resolution because observations were available only at annual time steps. In contrast, measurements and estimations of climatic drivers typically operate at broader spatial scales and higher temporal frequencies, making it challenging to directly link local climate variability to fine-scale mortality patterns in the current dataset. Consequently, although the observed large-scale spatial patterns in canopy mortality may partly reflect underlying gradients in drought intensity or other meteorological conditions, these effects are not apparent using the available fine-scale, but temporally limited dataset. While moderate-resolution satellite data (e.g. Sentinel-2 at 10 m or Landsat at 30 m) could be used to analyse canopy mortality at finer temporal scales, such approaches are associated with higher uncertainty due to mixed pixels and the limited ability to detect small or early-stage mortality patches (see Schiefer et al., 2025), and would require additional calibration and validation. As a result, these data are less suitable for capturing site-specific mortality responses at the scale addressed in this study. Accordingly, drought was treated as an overarching environmental context and the study period (2018–2020) was assumed to represent sufficiently widespread and severe water stress to trigger mortality processes across Luxembourg.
Despite these methodological and scale-related limitations, the consistent spatial patterns observed across forest types and driver groups indicate that the main conclusions regarding the relative importance of forest structure and bark beetle dynamics are reliable.
This study shows that drought-driven canopy mortality in Luxembourg is strongly shaped by forest structure and bark beetle dynamics, whereas topography and soil type played a comparatively limited role. Using a high-resolution mortality dataset, we captured fine-scale patterns of mortality across the landscape, underscoring the value of detailed large-scale datasets for understanding forest responses to extreme drought. As new data collecting platforms emerge (e.g., “deadtrees.earth”) there is growing need to develop analytical methodologies capable of analysing these high-resolution mortality datasets. Addressing current limitations, such as potential noise in micro-topographic variables and under-representation of soil characteristics or young and understory vegetation, through improved analytical approaches will further enhance our ability to understand and predict which forest and tree characteristics increase forest vulnerability under changing climate conditions.
The model data is openly available at https://doi.org/10.5281/zenodo.17333429 (Schwarz, 2025).
The supplement related to this article is available online at https://doi.org/10.5194/bg-23-2985-2026-supplement.
SS, FEF, and NKR conceptualised the study and developed the methodology. SS curated, analysed, and visualised the data. LH contributed to the statistical approach and supported model code development. SS prepared the original draft, and all authors contributed to and edited the manuscript.
The contact author has declared that none of the authors has any competing interests.
Publisher's note: Copernicus Publications remains neutral with regard to jurisdictional claims made in the text, published maps, institutional affiliations, or any other geographical representation in this paper. The authors bear the ultimate responsibility for providing appropriate place names. Views expressed in the text are those of the authors and do not necessarily reflect the views of the publisher.
The study was inspired by and contributes to the International Tree Mortality Network (https://tree-mortality.net/, last access: 14 April 2026). We greatly appreciate the open data policy of Luxembourg which made this work possible (https://data.public.lu/en/, last access: 14 April 2026), and are very thankful to Mathis Giese for his help in data preparation.
This research has been supported by the Deutsche Forschungsgemeinschaft (grant nos. RU 1657/2-1 and RU 1657/2-2) and the Helmholtz Initiative and Networking fund (W2/W3-156).
The article processing charges for this open-access publication were covered by the Karlsruhe Institute of Technology (KIT).
This paper was edited by Lucia Fuchslueger and reviewed by two anonymous referees.
Adams, H. D., Zeppel, M. J. B., Anderegg, W. R. L., Hartmann, H., Landhäusser, S. M., Tissue, D. T., Huxman, T. E., Hudson, P. J., Franz, T. E., Allen, C. D., Anderegg, L. D. L., Barron-Gafford, G. A., Beerling, D. J., Breshears, D. D., Brodribb, T. J., Bugmann, H., Cobb, R. C., Collins, A. D., Dickman, L. T., Duan, H., Ewers, B. E., Galiano, L., Galvez, D. A., Garcia-Forner, N., Gaylord, M. L., Germino, M. J., Gessler, A., Hacke, U. G., Hakamada, R., Hector, A., Jenkins, M. W., Kane, J. M., Kolb, T. E., Law, D. J., Lewis, J. D., Limousin, J.-M., Love, D. M., Macalady, A. K., Martínez-Vilalta, J., Mencuccini, M., Mitchell, P. J., Muss, J. D., O'Brien, M. J., O'Grady, A. P., Pangle, R. E., Pinkard, E. A., Piper, F. I., Plaut, J. A., Pockman, W. T., Quirk, J., Reinhardt, K., Ripullone, F., Ryan, M. G., Sala, A., Sevanto, S., Sperry, J. S., Vargas, R., Vennetier, M., Way, D. A., Xu, C., Yepez, E. A., and McDowell, N. G.: A multi-species synthesis of physiological mechanisms in drought-induced tree mortality, Nat. Ecol. Evol., 1, 1285–1291, https://doi.org/10.1038/s41559-017-0248-x, 2017.
Administration des services techniques de l’agriculture (ASTA): Luxembourg: 50 ans cartographie des sols, Ministère de l’Agriculture, de la Viticulture et du Développement rural, Luxembourg, 2020, https://agriculture.public.lu/dam-assets/veroeffentlichungen/broschueren/pflanzen-und-boeden/2019-50ans-cartographie-des-sols.pdf (last access: 14 April 2026).
Akkuzu, E., Eroğlu, H., Sonmez, T., Yolasığmaz, H., and Sariyildiz, T.: Effects of forest roads on foliage discoloration of oriental spruce by Ips typographus (L.), Afr. J. Agr. Res., 4, 468–473, 2009.
Allen, C. D. and Breshears, D. D.: Drought-induced shift of a forest–woodland ecotone: Rapid landscape response to climate variation, P. Natl. Acad. Sci. USA, 95, 14839–14842, https://doi.org/10.1073/pnas.95.25.14839, 1998.
Allen, C. D., Macalady, A. K., Chenchouni, H., Bachelet, D., McDowell, N., Vennetier, M., Kitzberger, T., Rigling, A., Breshears, D. D., Hogg, E. H. (Ted), Gonzalez, P., Fensham, R., Zhang, Z., Castro, J., Demidova, N., Lim, J.-H., Allard, G., Running, S. W., Semerci, A., and Cobb, N.: A global overview of drought and heat-induced tree mortality reveals emerging climate change risks for forests, Forest Ecol. Manag., 259, 660–684, https://doi.org/10.1016/j.foreco.2009.09.001, 2010.
Altman, J., Fibich, P., Trotsiuk, V., and Altmanova, N.: Global pattern of forest disturbances and its shift under climate change, Sci. Total Environ., 915, 170117, https://doi.org/10.1016/j.scitotenv.2024.170117, 2024.
Anderegg, W. R. L., Kane, J. M., and Anderegg, L. D. L.: Consequences of widespread tree mortality triggered by drought and temperature stress, Nat. Clim. Change, 3, 30–36, https://doi.org/10.1038/nclimate1635, 2013.
Anderegg, W. R. L., Martinez-Vilalta, J., Cailleret, M., Camarero, J. J., Ewers, B. E., Galbraith, D., Gessler, A., Grote, R., Huang, C., Levick, S. R., Powell, T. L., Rowland, L., Sánchez-Salguero, R., and Trotsiuk, V.: When a Tree Dies in the Forest: Scaling Climate-Driven Tree Mortality to Ecosystem Water and Carbon Fluxes, Ecosystems, 19, 1133–1147, https://doi.org/10.1007/s10021-016-9982-1, 2016.
Anderegg, W. R. L., Trugman, A. T., Badgley, G., Anderson, C. M., Bartuska, A., Ciais, P., Cullenward, D., Field, C. B., Freeman, J., Goetz, S. J., Hicke, J. A., Huntzinger, D., Jackson, R. B., Nickerson, J., Pacala, S., and Randerson, J. T.: Climate-driven risks to the climate mitigation potential of forests, Science, 368, eaaz7005, https://doi.org/10.1126/science.aaz7005, 2020.
Arend, M., Link, R. M., Patthey, R., Hoch, G., Schuldt, B., and Kahmen, A.: Rapid hydraulic collapse as cause of drought-induced mortality in conifers, P. Natl. Acad. Sci. USA, 118, e2025251118, https://doi.org/10.1073/pnas.2025251118, 2021.
Belmonte, A., Ts. Sankey, T., Biederman, J., Bradford, J. B., and Kolb, T.: Soil moisture response to seasonal drought conditions and post-thinning forest structure, Ecohydrology, 15, e2406, https://doi.org/10.1002/eco.2406, 2022.
Bennett, A. C., McDowell, N. G., Allen, C. D., and Anderson-Teixeira, K. J.: Larger trees suffer most during drought in forests worldwide, Nat. Plants, 1, 1–5, https://doi.org/10.1038/nplants.2015.139, 2015.
Beven, K. J. and Kirkby, M. J.: A physically based, variable contributing area model of basin hydrology/Un modèle à base physique de zone d'appel variable de l'hydrologie du bassin versant, Hydrol. Sci. B., 24, 43–69, https://doi.org/10.1080/02626667909491834, 1979.
Blomqvist, M., Kosunen, M., Starr, M., Kantola, T., Holopainen, M., and Lyytikäinen-Saarenmaa, P.: Modelling the predisposition of Norway spruce to Ips typographus L. infestation by means of environmental factors in southern Finland, Eur. J. Forest Res., 137, 675–691, https://doi.org/10.1007/s10342-018-1133-0, 2018.
Breshears, D. D., Cobb, N. S., Rich, P. M., Price, K. P., Allen, C. D., Balice, R. G., Romme, W. H., Kastens, J. H., Floyd, M. L., Belnap, J., Anderson, J. J., Myers, O. B., and Meyer, C. W.: Regional vegetation die-off in response to global-change-type drought, P. Natl. Acad. Sci. USA, 102, 15144–15148, https://doi.org/10.1073/pnas.0505734102, 2005.
Breshears, D. D., Carroll, C. J. W., Redmond, M. D., Wion, A. P., Allen, C. D., Cobb, N. S., Meneses, N., Field, J. P., Wilson, L. A., Law, D. J., McCabe, L. M., and Newell-Bauer, O.: A Dirty Dozen Ways to Die: Metrics and Modifiers of Mortality Driven by Drought and Warming for a Tree Species, Front. For. Glob. Change, 1, https://doi.org/10.3389/ffgc.2018.00004, 2018.
Brouwers, N., Matusick, G., Ruthrof, K., Lyons, T., and Hardy, G.: Landscape-scale assessment of tree crown dieback following extreme drought and heat in a Mediterranean eucalypt forest ecosystem, Landscape Ecol., 28, 69–80, https://doi.org/10.1007/s10980-012-9815-3, 2013.
Brun, P., Psomas, A., Ginzler, C., Thuiller, W., Zappa, M., and Zimmermann, N. E.: Large-scale early-wilting response of Central European forests to the 2018 extreme drought, Glob. Change Biol., 26, 7021–7035, https://doi.org/10.1111/gcb.15360, 2020.
Buras, A., Schunk, C., Zeiträg, C., Herrmann, C., Kaiser, L., Lemme, H., Straub, C., Taeger, S., Gößwein, S., Klemmt, H.-J., and Menzel, A.: Are Scots pine forest edges particularly prone to drought-induced mortality?, Environ. Res. Lett., 13, 025001, https://doi.org/10.1088/1748-9326/aaa0b4, 2018.
Cailleret, M., Nourtier, M., Amm, A., Durand-Gillmann, M., and Davi, H.: Drought-induced decline and mortality of silver fir differ among three sites in Southern France, Ann. For. Sci., 71, 643–657, https://doi.org/10.1007/s13595-013-0265-0, 2014.
Cervantes-Martínez, R., Cerano-Paredes, J., Sánchez-Martínez, G., Villanueva-Díaz, J., Esquivel-Arriaga, G., Cambrón-Sandoval, V. H., Méndez-González, J., and Castruita-Esparza, L. U.: Brotes históricos de descortezadores en México, Guatemala y Honduras (1895-2015) y su relación con las sequías, Rev. Cha. Se. Cie. For. y del Amb., 25, 269–290, https://doi.org/10.5154/r.rchscfa.2019.01.006, 2019.
Cheng, Y., Oehmcke, S., Brandt, M., Rosenthal, L., Das, A., Vrieling, A., Saatchi, S., Wagner, F., Mugabowindekwe, M., Verbruggen, W., Beier, C., and Horion, S.: Scattered tree death contributes to substantial forest loss in California, Nat. Commun., 15, 641, https://doi.org/10.1038/s41467-024-44991-z, 2024.
Choat, B., Jansen, S., Brodribb, T. J., Cochard, H., Delzon, S., Bhaskar, R., Bucci, S. J., Feild, T. S., Gleason, S. M., Hacke, U. G., Jacobsen, A. L., Lens, F., Maherali, H., Martínez-Vilalta, J., Mayr, S., Mencuccini, M., Mitchell, P. J., Nardini, A., Pittermann, J., Pratt, R. B., Sperry, J. S., Westoby, M., Wright, I. J., and Zanne, A. E.: Global convergence in the vulnerability of forests to drought, Nature, 491, 752–755, https://doi.org/10.1038/nature11688, 2012.
Clifford, M. J. and Booth, R. K.: Late-Holocene drought and fire drove a widespread change in forest community composition in eastern North America, Holocene, 25, 1102–1110, https://doi.org/10.1177/0959683615580182, 2015.
Conrad, O., Bechtel, B., Bock, M., Dietrich, H., Fischer, E., Gerlitz, L., Wehberg, J., Wichmann, V., and Böhner, J.: System for Automated Geoscientific Analyses (SAGA) v. 2.1.4, Geosci. Model Dev., 8, 1991–2007, https://doi.org/10.5194/gmd-8-1991-2015, 2015.
Dorman, M., Svoray, T., Perevolotsky, A., Moshe, Y., and Sarris, D.: What determines tree mortality in dry environments? a multi-perspective approach, Ecol. Appl., 25, 1054–1071, https://doi.org/10.1890/14-0698.1, 2015.
Dutta, A. and Dutta, H.: The Biotic Implications of Forest Fragmentation, International Research Journal of Environmental Sciences, 5, 58–62, 2016.
Feleha, D. D., Tymińska-Czabańska, L., and Netzel, P.: Forest Fragmentation and Forest Mortality – An In-Depth Systematic Review, Forests, 16, 565, https://doi.org/10.3390/f16040565, 2025.
Fleischer Jr., P., Fleischer, P., Ferenčík, J., Hlaváč, P., and Kozánek, M.: Elevated bark temperature in unremoved stumps after disturbances facilitates multi-voltinism in Ips typographus population in a mountainous forest, Forestry Journal, 62, 15–22, https://doi.org/10.1515/forj-2016-0002, 2016.
Floyd, M. L., Clifford, M., Cobb, N. S., Hanna, D., Delph, R., Ford, P., and Turner, D.: Relationship of stand characteristics to drought-induced mortality in three Southwestern piñon–juniper woodlands, Ecol. Appl., 19, 1223–1230, https://doi.org/10.1890/08-1265.1, 2009.
Frei, E. R., Gossner, M. M., Vitasse, Y., Queloz, V., Dubach, V., Gessler, A., Ginzler, C., Hagedorn, F., Meusburger, K., Moor, M., Samblás Vives, E., Rigling, A., Uitentuis, I., von Arx, G., and Wohlgemuth, T.: European beech dieback after premature leaf senescence during the 2018 drought in northern Switzerland, Plant Biol., 24, 1132–1145, https://doi.org/10.1111/plb.13467, 2022.
Gazol, A., Pizarro, M., Hammond, W. M., Allen, C. D., and Camarero, J. J.: Droughts preceding tree mortality events have increased in duration and intensity, especially in dry biomes, Nat. Commun., 16, 5779, https://doi.org/10.1038/s41467-025-60856-5, 2025.
Gilles, A., Lisein, J., Cansell, J., Latte, N., Piedallu, C., and Claessens, H.: Evolution of the bark beetle crisis in spruce (Picea abies) forests: A spatial and temporal remote sensing analysis in Belgium and North-eastern France, Research Square [preprint], https://doi.org/10.21203/rs.3.rs-3051830/v1, 2023.
Guarín, A. and Taylor, A. H.: Drought triggered tree mortality in mixed conifer forests in Yosemite National Park, California, USA, Forest Ecol. Manag., 218, 229–244, https://doi.org/10.1016/j.foreco.2005.07.014, 2005.
Guillaume, A. S., Leempoel, K., Rochat, E., Rogivue, A., Kasser, M., Gugerli, F., Parisod, C., and Joost, S.: Multiscale Very High Resolution Topographic Models in Alpine Ecology: Pros and Cons of Airborne LiDAR and Drone-Based Stereo-Photogrammetry Technologies, Remote Sens., 13, 1588, https://doi.org/10.3390/rs13081588, 2021.
Hajek, P., Link, R. M., Nock, C. A., Bauhus, J., Gebauer, T., Gessler, A., Kovach, K., Messier, C., Paquette, A., Saurer, M., Scherer-Lorenzen, M., Rose, L., and Schuldt, B.: Mutually inclusive mechanisms of drought-induced tree mortality, Glob. Change Biol., 28, 3365–3378, https://doi.org/10.1111/gcb.16146, 2022.
Hammond, W. M., Williams, A. P., Abatzoglou, J. T., Adams, H. D., Klein, T., López, R., Sáenz-Romero, C., Hartmann, H., Breshears, D. D., and Allen, C. D.: Global field observations of tree die-off reveal hotter-drought fingerprint for Earth's forests, Nat. Commun., 13, 1761, https://doi.org/10.1038/s41467-022-29289-2, 2022.
Hansen, M. C., Potapov, P. V., Moore, R., Hancher, M., Turubanova, S. A., Tyukavina, A., Thau, D., Stehman, S. V., Goetz, S. J., Loveland, T. R., Kommareddy, A., Egorov, A., Chini, L., Justice, C. O., and Townshend, J. R. G.: High-Resolution Global Maps of 21st-Century Forest Cover Change, Science, https://doi.org/10.1126/science.1244693, 2013.
Hartig, F.: DHARMa: Residual diagnostics for hierarchical (multi-level/mixed) regression models, R package version 0.4.6, https://CRAN.R-project.org/package=DHARMa (last access: 14 April 2026), 2022.
Hartmann, H., Moura, C. F., Anderegg, W. R. L., Ruehr, N. K., Salmon, Y., Allen, C. D., Arndt, S. K., Breshears, D. D., Davi, H., Galbraith, D., Ruthrof, K. X., Wunder, J., Adams, H. D., Bloemen, J., Cailleret, M., Cobb, R., Gessler, A., Grams, T. E. E., Jansen, S., Kautz, M., Lloret, F., and O'Brien, M.: Research frontiers for improving our understanding of drought-induced tree and forest mortality, New Phytol., 218, 15–28, https://doi.org/10.1111/nph.15048, 2018.
Hartmann, H., Bastos, A., Das, A. J., Esquivel-Muelbert, A., Hammond, W. M., Martínez-Vilalta, J., McDowell, N. G., Powers, J. S., Pugh, T. A. M., Ruthrof, K. X., and Allen, C. D.: Climate Change Risks to Global Forest Health: Emergence of Unexpected Events of Elevated Tree Mortality Worldwide, Annu. Rev. Plant Biol., 73, 673–702, https://doi.org/10.1146/annurev-arplant-102820-012804, 2022.
Hastie, T. and Tibshirani, R.: Generalized Additive Models, Stat. Sci., 1, 297–310, 1986.
Hlásny, T., König, L., Krokene, P., Lindner, M., Montagné-Huck, C., Müller, J., Qin, H., Raffa, K., Schelhaas, M.-J., Svoboda, M., Viiri, H., and Seidl, R.: Bark Beetle Outbreaks in Europe: State of Knowledge and Ways Forward for Management, Current Forestry Reports, 7, 1–28, https://doi.org/10.1007/s40725-021-00142-x, 2021.
Huang, J., Kautz, M., Trowbridge, A. M., Hammerbacher, A., Raffa, K. F., Adams, H. D., Goodsman, D. W., Xu, C., Meddens, A. J. H., Kandasamy, D., Gershenzon, J., Seidl, R., and Hartmann, H.: Tree defence and bark beetles in a drying world: carbon partitioning, functioning and modelling, New Phytol., 225, 26–36, https://doi.org/10.1111/nph.16173, 2020.
Hülsmann, L., Bugmann, H. K. M., Commarmot, B., Meyer, P., Zimmermann, S., and Brang, P.: Does one model fit all? Patterns of beech mortality in natural forests of three European regions, Ecol. Appl., 26, 2465–2479, https://doi.org/10.1002/eap.1388, 2016.
Jakoby, O., Lischke, H., and Wermelinger, B.: Climate change alters elevational phenology patterns of the European spruce bark beetle (Ips typographus), Glob. Change Biol., 25, 4048–4063, https://doi.org/10.1111/gcb.14766, 2019.
James, G., Witten, D., Hastie, T., and Tibshirani, R.: An introduction to statistical learning: with applications in R, Springer, New York, ISBN 978-1-0716-1420-4, 2013.
Junttila, S., Blomqvist, M., Laukkanen, V., Heinaro, E., Polvivaara, A., O'Sullivan, H., Yrttimaa, T., Vastaranta, M., and Peltola, H.: Significant increase in forest canopy mortality in boreal forests in Southeast Finland, Forest Ecol. Manag., 565, 122020, https://doi.org/10.1016/j.foreco.2024.122020, 2024.
Kärvemo, S., Huo, L., Öhrn, P., Lindberg, E., and Persson, H. J.: Different triggers, different stories: Bark-beetle infestation patterns after storm and drought-induced outbreaks, Forest Ecol. Manag., 545, 121255, https://doi.org/10.1016/j.foreco.2023.121255, 2023.
Kattenborn, T., Mosig, C., Vajna-Jehle, J., Cheng, Y., Hartmann, H., Montero, D., Juntilla, S., Horion, S., Beloiu Schwenke, M., and Mahecha, M.: deadtrees.earth: tree mortality monitoring from local to global scales with AI and remote sensing, EGU General Assembly 2025, Vienna, Austria, 27 Apr–2 May 2025, EGU25-19718, https://doi.org/10.5194/egusphere-egu25-19718, 2025.
Knutzen, F., Averbeck, P., Barrasso, C., Bouwer, L. M., Gardiner, B., Grünzweig, J. M., Hänel, S., Haustein, K., Johannessen, M. R., Kollet, S., Müller, M. M., Pietikäinen, J.-P., Pietras-Couffignal, K., Pinto, J. G., Rechid, D., Rousi, E., Russo, A., Suarez-Gutierrez, L., Veit, S., Wendler, J., Xoplaki, E., and Gliksman, D.: Impacts on and damage to European forests from the 2018–2022 heat and drought events, Nat. Hazards Earth Syst. Sci., 25, 77–117, https://doi.org/10.5194/nhess-25-77-2025, 2025.
Kolb, T., Keefover-Ring, K., Burr, S. J., Hofstetter, R., Gaylord, M., and Raffa, K. F.: Drought-Mediated Changes in Tree Physiological Processes Weaken Tree Defenses to Bark Beetle Attack, J. Chem. Ecol., 45, 888–900, https://doi.org/10.1007/s10886-019-01105-0, 2019.
König, L. A., Mohren, F., Schelhaas, M.-J., Astigarraga, J., Cienciala, E., Flury, R., Fridman, J., Govaere, L., Lehtonen, A., Muelbert, A. E., Pugh, T. A. M., Rohner, B., Ruiz-Benito, P., Suvanto, S., Talarczyk, A., Zavala, M. A., Vega, J. M., Staritsky, I., Hengeveld, G., and Nabuurs, G.-J.: Combining national forest inventories reveals distinct role of climate on tree recruitment in European forests, Ecol. Model., 505, 111112, https://doi.org/10.1016/j.ecolmodel.2025.111112, 2025.
Korzeniowska, K.: Mapping land use 2018 in Luxembourg: an approach based on aerial images, LiDAR and ancillary GIS data, Government of the Grand Duchy of Luxembourg, https://download.data.public.lu/resources/lis-l-land-use-2007-2015-2018/20210308-145903/lisl-landuse-2018-documentation.pdf (last access: 14 April 2026), 2021.
Lannuzel, G., Balmot, J., Dubos, N., Thibault, M., and Fogliani, B.: High-resolution topographic variables accurately predict the distribution of rare plant species for conservation area selection in a narrow-endemism hotspot in New Caledonia, Biodivers. Conserv., 30, 963–990, https://doi.org/10.1007/s10531-021-02126-6, 2021.
Lindman, L., Ranius, T., and Schroeder, M.: Regional climate affects habitat preferences and thermal sums required for development of the Eurasian spruce bark beetle, Ips typographus, Forest Ecol. Manag., 544, 121216, https://doi.org/10.1016/j.foreco.2023.121216, 2023.
Lugo, A. E. and Gucinski, H.: Function, effects, and management of forest roads, Forest Ecol. Manag., 133, 249–262, https://doi.org/10.1016/S0378-1127(99)00237-6, 2000.
Luo, Y. and Chen, H. Y. H.: Observations from old forests underestimate climate change effects on tree mortality, Nat. Commun., 4, 1655, https://doi.org/10.1038/ncomms2681, 2013.
Malone, S., Thompson, R. A., Chow, P. S., De Oliveira Jr., C. R., Landhäusser, S. M., Six, D. L., McCulloh, K. A., Adams, H. D., and Trowbridge, A. M.: Water, not carbon, drives drought-constraints on stem terpene defense against simulated bark beetle attack in Pinus edulis, New Phytologist, 245, 318–331, https://doi.org/10.1111/nph.20218, 2024.
Mann, D., Gohr, C., Blumröder, J. S., and Ibisch, P. L.: Does fragmentation contribute to the forest crisis in Germany?, Front. For. Glob. Change, 6, https://doi.org/10.3389/ffgc.2023.1099460, 2023.
Maxwell, A. E. and Warner, T. A.: Thematic Classification Accuracy Assessment with Inherently Uncertain Boundaries: An Argument for Center-Weighted Accuracy Assessment Metrics, Remote Sens., 12, 1905, https://doi.org/10.3390/rs12121905, 2020.
McDowell, N. G. and Allen, C. D.: Darcy's law predicts widespread forest mortality under climate warming, Nat. Clim. Change, 5, 669–672, https://doi.org/10.1038/nclimate2641, 2015.
McDowell, N. G., Fisher, R. A., Xu, C., Domec, J. C., Hölttä, T., Mackay, D. S., Sperry, J. S., Boutz, A., Dickman, L., Gehres, N., Limousin, J. M., Macalady, A., Martínez-Vilalta, J., Mencuccini, M., Plaut, J. A., Ogée, J., Pangle, R. E., Rasse, D. P., Ryan, M. G., Sevanto, S., Waring, R. H., Williams, A. P., Yepez, E. A., and Pockman, W. T.: Evaluating theories of drought-induced vegetation mortality using a multimodel–experiment framework, New Phytol., 200, 304–321, https://doi.org/10.1111/nph.12465, 2013.
McDowell, N. G., Sapes, G., Pivovaroff, A., Adams, H. D., Allen, C. D., Anderegg, W. R. L., Arend, M., Breshears, D. D., Brodribb, T., Choat, B., Cochard, H., De Cáceres, M., De Kauwe, M. G., Grossiord, C., Hammond, W. M., Hartmann, H., Hoch, G., Kahmen, A., Klein, T., Mackay, D. S., Mantova, M., Martínez-Vilalta, J., Medlyn, B. E., Mencuccini, M., Nardini, A., Oliveira, R. S., Sala, A., Tissue, D. T., Torres-Ruiz, J. M., Trowbridge, A. M., Trugman, A. T., Wiley, E., and Xu, C.: Mechanisms of woody-plant mortality under rising drought, CO2 and vapour pressure deficit, Nature Reviews Earth & Environment, 3, https://doi.org/10.1038/s43017-022-00272-1, 2022.
McFadden, D.: Conditional logit analysis of qualitative choice behavior, in: Frontiers in Econometrics, edited by: Zarembka, P., Academic Press, New York, 105–142, ISBN 0-12-776150-0, 1974.
Meddens, A. J. H., Hicke, J. A., Macalady, A. K., Buotte, P. C., Cowles, T. R., and Allen, C. D.: Patterns and causes of observed piñon pine mortality in the southwestern United States, New Phytol., 206, 91–97, https://doi.org/10.1111/nph.13193, 2015.
Mosig, C., Vajna-Jehle, J., Mahecha, M. D., Cheng, Y., Hartmann, H., Montero, D., Junttila, S., Horion, S., Beloiu Schwenke, M., Koontz, M. J., Abdul Maulud, K. N., Adu-Bredu, S., Al-Halbouni, D., Ali, M., Allen, M., Altman, J., Amorós, L., Angiolini, C., Astrup, R., Awada, H., Barrasso, C., Bartholomeus, H., Beck, P. S. A., Bozzini, A., Braun-Wimmer, J., Brede, B., Breunig, F. M., Brugnaro, S., Buras, A., Burchard-Levine, V., Camarero, J. J., Candotti, A., Capuder, L., Carrieri, E., Centritto, M., Chirici, G., Cloutier, M., Conciani, D., Cushman, K. C., Dalling, J. W., Dao, P. D., Dempewolf, J., Denter, M., Dogotari, M., Díaz-Delgado, R., Ecke, S., Eichel, J., Eltner, A., Fabbri, A., Fabi, M., Fassnacht, F., Ferreira, M. P., Fischer, F. J., Frey, J., Frick, A., Fuentes, J., Ganz, S., Garbarino, M., García, M., Gassilloud, M., Gazol, A., Gea-Izquierdo, G., Gerberding, K., Ghasemi, M., Giannetti, F., Gillan, J., Gonzalez, R., Gosper, C., Greene, T., Greinwald, K., Grieve, S., Große-Stoltenberg, A., Aguirre Gutierrez, J., Göritz, A., Hajek, P., Hedding, D., Hempel, J., Heremans, S., Hernández, M., Heurich, M., Honkavaara, E., Höfle, B., Jackisch, R., Jucker, T., Kalwij, J. M., Kepfer-Rojas, S., Khatri-Chhetri, P., Kleinebecker, T., Klemmt, H.-J., Klouček, T., Koivumäki, N., Kolagani, N., Komárek, J., Korznikov, K., Kraszewski, B., Kruse, S., Krüger, R., Kuechly, H., Kwong, I. H. Y., Laliberté, E., Langan, L., Latifi, H., Leal-Medina, C., Lehmann, J. R. K., Li, L., Lines, E., Lisiewicz, M., Lopatin, J., Lucieer, A., Ludwig, A., Ludwig, M., Lyytikäinen-Saarenmaa, P., Ma, Q., Mansuy, N., Peña, J. M., Marino, G., Maroschek, M., Martín, M. P., Martín-Benito, D., Matham, P., Mazzoni, S., Meloni, F., Menzel, A., Meyer, H., Miraki, M., Moreno, G., Moreno-Fernández, D., Muller-Landau, H. C., Mälicke, M., Möhring, J., Müllerová, J., Naidu, S. S., Nardi, D., Neumeier, P., Nita, M. D., Näsi, R., Oppgenoorth, L., Orunbaev, S., Palmer, M., Paul, T., Pfenning, M., Potts, A., Prasanna, G. L., Prober, S., Puliti, S., Pérez-Luque, A. J., Pérez-Priego, O., Reudenbach, C., Revuelto, J., Rivas-Torres, G., Roberge, P., Roggero, P. P., Rossi, C., Ruehr, N. K., Ruiz-Benito, P., Runge, C. M., Satta, G. G. A., Scanu, B., Scherer-Lorenzen, M., Schiefer, F., Schiller, C., Schladebach, J., Schmehl, M.-T., Schmid, J., Schmidt, T. A., Schwarz, S., Seidl, R., Seifert, T., Seifert Barba, A., Shafeian, E., Shapiro, A., de Simone, L., Sohrabi, H., Soltani, S., Sotomayor, L., Sparrow, B., Steer, B. S. C., Stenson, M., Stöckigt, B., Su, Y., Suomalainen, J., Tamudo, E., Tognetti Barbieri, M. J., Tomelleri, E., Torresani, M., Trepekli, K., Ullah, S., Ullah, S., Umlauft, J., Vargas-Ramírez, N., Vatandaslar, C., Visacki, V., Volpi, M., Vásquez, V., Wallis, C., Weinstein, B., Weiser, H., Wich, S., Casapia, T., Zarco-Tejada, P. J., Zdunic, K., Zielewska-Büttner, K., Alves de Oliveira, R., van Wagtendonk, L., von Dosky, V., and Kattenborn, T.: A global dataset of forest mortality from drone, airborne, and spaceborne imagery, Remote Sens. Environ., 332, 115027, https://doi.org/10.1016/j.rse.2025.115027, 2026.
Paz-Kagan, T., Brodrick, P. G., Vaughn, N. R., Das, A. J., Stephenson, N. L., Nydick, K. R., and Asner, G. P.: What mediates tree mortality during drought in the southern Sierra Nevada?, Ecol. Appl., 27, 2443–2457, https://doi.org/10.1002/eap.1620, 2017.
Pellegrino, V., Godard, V., and Fleury, J.: Investigation of the use of topographic data derived from Pléiades imagery for high-resolution hillslope-scale morphometry, Geomorphology, 454, 109162, https://doi.org/10.1016/j.geomorph.2024.109162, 2024.
Petritan, M. and Schwenke, M. B.: Forest Functioning under Climate Warming and Future Perspectives on Forest Disturbances, Forests, 14, 2302, https://doi.org/10.3390/f14122302, 2023.
Pirtskhalava-Karpova, N., Trubin, A., Karpov, A., and Jakuš, R.: Drought initialised bark beetle outbreak in Central Europe: Meteorological factors and infestation dynamic, Forest Ecol. Manag., 554, 121666, https://doi.org/10.1016/j.foreco.2023.121666, 2024.
Potterf, M., Nikolov, C., Kočická, E., Ferenčík, J., Mezei, P., and Jakuš, R.: Landscape-level spread of beetle infestations from windthrown- and beetle-killed trees in the non-intervention zone of the Tatra National Park, Slovakia (Central Europe), Forest Ecol. Manag., 432, 489–500, https://doi.org/10.1016/j.foreco.2018.09.050, 2019.
Príncipe, A., Nunes, A., Pinho, P., Aleixo, C., Neves, N., and Branquinho, C.: Local-scale factors matter for tree cover modelling in Mediterranean drylands, Sci. Total Environ., 831, 154877, https://doi.org/10.1016/j.scitotenv.2022.154877, 2022.
Raffa, K. F., Aukema, B. H., Bentz, B. J., Carroll, A. L., Hicke, J. A., Turner, M. G., and Romme, W. H.: Cross-scale Drivers of Natural Disturbances Prone to Anthropogenic Amplification: The Dynamics of Bark Beetle Eruptions, BioScience, 58, 501–517, https://doi.org/10.1641/B580607, 2008.
Raffa, K. F., Andersson, M. N., and Schlyter, F.: Chapter One - Host Selection by Bark Beetles: Playing the Odds in a High-Stakes Game, in: Advances in Insect Physiology, vol. 50, edited by: Tittiger, C. and Blomquist, G. J., Academic Press, 1–74, https://doi.org/10.1016/bs.aiip.2016.02.001, 2016.
Rakovec, O., Samaniego, L., Hari, V., Markonis, Y., Moravec, V., Thober, S., Hanel, M., and Kumar, R.: The 2018–2020 Multi-Year Drought Sets a New Benchmark in Europe, Earth's Future, 10, https://doi.org/10.1029/2021EF002394, 2022.
R Core Team: R: A language and environment for statistical computing, R Foundation for Statistical Computing, Vienna, Austria, 2022, https://www.R-project.org/ (last access: 14 April 2026).
Rita, A., Camarero, J. J., Nolè, A., Borghetti, M., Brunetti, M., Pergola, N., Serio, C., Vicente-Serrano, S. M., Tramutoli, V., and Ripullone, F.: The impact of drought spells on forests depends on site conditions: The case of 2017 summer heat wave in southern Europe, Glob. Change Biol., 26, 851–863, https://doi.org/10.1111/gcb.14825, 2020.
Robbins, Z. J., Xu, C., Aukema, B. H., Buotte, P. C., Chitra-Tarak, R., Fettig, C. J., Goulden, M. L., Goodsman, D. W., Hall, A. D., Koven, C. D., Kueppers, L. M., Madakumbura, G. D., Mortenson, L. A., Powell, J. A., and Scheller, R. M.: Warming increased bark beetle-induced tree mortality by 30 % during an extreme drought in California, Glob. Change Biol., 28, 509–523, https://doi.org/10.1111/gcb.15927, 2022.
Rouault, G., Candau, J.-N., Lieutier, F., Nageleisen, L.-M., Martin, J.-C., and Warzée, N.: Effects of drought and heat on forest insect populations in relation to the 2003 drought in Western Europe, Ann. For. Sci., 63, 613–624, https://doi.org/10.1051/forest:2006044, 2006.
Schiefer, F., Schmidtlein, S., Hartmann, H., Schnabel, F., and Kattenborn, T.: Large-scale remote sensing reveals that tree mortality in Germany appears to be greater than previously expected, Forestry, 98, 535, https://doi.org/10.1093/forestry/cpae062, 2025.
Schwarz, S.: Drivers of canopy mortality in Luxembourg – extracted values and model, Zenodo [data set], https://doi.org/10.5281/zenodo.17333429, 2025.
Schwarz, S., Werner, C., Fassnacht, F. E., and Ruehr, N. K.: Forest canopy mortality during the 2018–2020 summer drought years in Central Europe: The application of a deep learning approach on aerial images across Luxembourg, Forestry, 97, 376–387, https://doi.org/10.1093/forestry/cpad049, 2024.
Senf, C. and Seidl, R.: Mapping the forest disturbance regimes of Europe, Nat. Sustain., 4, 63–70, https://doi.org/10.1038/s41893-020-00609-y, 2021.
Šilhán, K., Pánek, T., and Škarpich, V.: Diversification of landslide areas as a means for reducing noise in dendrogeomorphic dating, Quat. Geochronol., 72, 101362, https://doi.org/10.1016/j.quageo.2022.101362, 2022.
Socha, J., Hawryło, P., Tymińska-Czabańska, L., Reineking, B., Lindner, M., Netzel, P., Grabska-Szwagrzyk, E., Vallejos, R., and Reyer, C. P. O.: Higher site productivity and stand age enhance forest susceptibility to drought-induced mortality, Agr. Forest Meteorol., 341, 109680, https://doi.org/10.1016/j.agrformet.2023.109680, 2023.
Sørensen, R., Zinko, U., and Seibert, J.: On the calculation of the topographic wetness index: evaluation of different methods based on field observations, Hydrol. Earth Syst. Sci., 10, 101–112, https://doi.org/10.5194/hess-10-101-2006, 2006.
Stereńczak, K., Mielcarek, M., Modzelewska, A., Kraszewski, B., Fassnacht, F. E., and Hilszczański, J.: Intra-annual Ips typographus outbreak monitoring using a multi-temporal GIS analysis based on hyperspectral and ALS data in the Białowieża Forests, Forest Ecol. Manag., 442, 105–116, https://doi.org/10.1016/j.foreco.2019.03.064, 2019.
Stovall, A. E. L., Shugart, H., and Yang, X.: Tree height explains mortality risk during an intense drought, Nat. Commun., 10, 4385, https://doi.org/10.1038/s41467-019-12380-6, 2019.
Sturm, J., Santos, M. J., Schmid, B., and Damm, A.: Satellite data reveal differential responses of Swiss forests to unprecedented 2018 drought, Glob. Change Biol., 28, 2956–2978, https://doi.org/10.1111/gcb.16136, 2022.
Trugman, A. T., Detto, M., Bartlett, M. K., Medvigy, D., Anderegg, W. R. L., Schwalm, C., Schaffer, B., and Pacala, S. W.: Tree carbon allocation explains forest drought-kill and recovery patterns, Ecol. Lett., 21, 1552–1560, https://doi.org/10.1111/ele.13136, 2018.
Trugman, A. T., Anderegg, L. D. L., Anderegg, W. R. L., Das, A. J., and Stephenson, N. L.: Why is Tree Drought Mortality so Hard to Predict?, Trends Ecol. Evol., 36, 520–532, https://doi.org/10.1016/j.tree.2021.02.001, 2021.
Webb, C. R., Blake, M., and Gilligan, C. A.: Phenology of the spruce bark beetle Ips typographus in the UK under past, current and future climate conditions, Plants, People, Planet, 7, 284–300, https://doi.org/10.1002/ppp3.10583, 2025.
Wood, S. N.: Fast stable restricted maximum likelihood and marginal likelihood estimation of semiparametric generalized linear models, J. Roy. Stat. Soc. B, 73, 3–36, https://doi.org/10.1111/j.1467-9868.2010.00749.x, 2011.
Zhai, L., Coyle, D. R., Li, D., and Jonko, A.: Fire, insect and disease-caused tree mortalities increased in forests of greater structural diversity during drought, J. Ecol., 110, 673–685, https://doi.org/10.1111/1365-2745.13830, 2022.
Zhang, D.: rsq: R-squared and related measures, R package version 2.5, 2022, https://CRAN.R-project.org/package=rsq (last access: 14 April 2026).
Zhao, P., Olsson, P.-O., Øhrman Wellendorf, A., Müller, M., and Mansourian, A.: Exploring the spatial heterogeneity of bark beetle infestation risk factors with geographically weighted regression and random forest, Scand. J. Forest Res., 40, 188–204, https://doi.org/10.1080/02827581.2025.2503807, 2025.
Ziegler, Y., Grote, R., Alongi, F., Knüver, T., and Ruehr, N. K.: Capturing drought stress signals: the potential of dendrometers for monitoring tree water status, Tree Physiol., 44, tpae140, https://doi.org/10.1093/treephys/tpae140, 2024.